Embed Size (px)
Citation preview
230
URINARY BLADDER CANCER
231
RREEPPOORRTT OONN CCAANNCCEERR IINN NNEEVVAADDAA 22000000--22000044
URINARY BLADDER CANCER
GENERAL PROFILE4
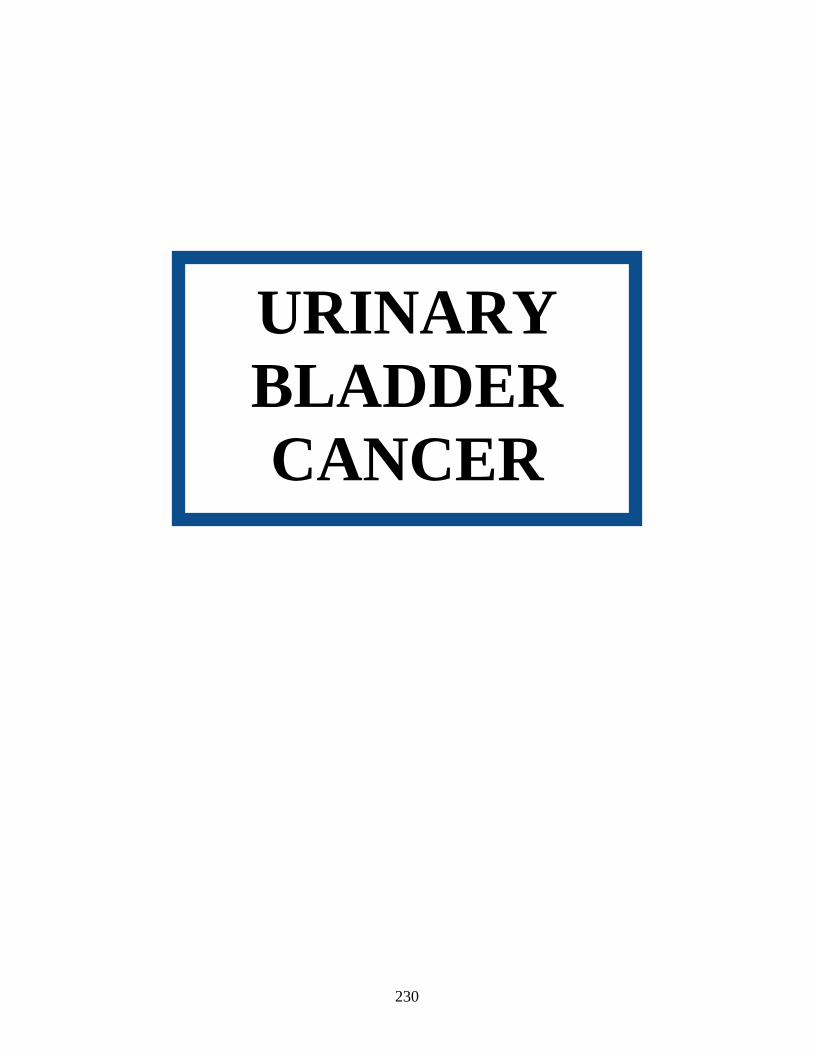
Figure 88. Anatomy of the Urinary System5
General Anatomy: The bladder is a hollow organ in the lower abdomen. It stores urine, the liquid waste produced by the kidneys. Urine passes from each kidney into the bladder through a tube called a ureter. An outer layer of muscle surrounds the inner lining of the bladder. When the bladder is full, the muscles in the bladder wall can tighten to allow urination. Urine leaves the bladder through another tube, the urethra. Risk Factors: Age, tobacco use, occupation (due to amount of carcinogens in the workplace), infection, treatment with cyclophosphamide or arsenic, race, being a man, family history, and personal history with Bladder Cancer. Signs and Symptoms: Blood in the urine (making the urine slightly rusty to deep red), pain during urination, and frequent urination, or feeling the need to urinate without results. Diagnosing the Cancer: Physical exams, urine tests, intravenous pyelogram, and cystoscopy. Treatment: Treatment options include: surgery (Transurethral resection, Radical cystectomy, and Segmental cystectomy), radiation therapy (internal or external), chemotherapy, and biological therapy.
232
RREEPPOORRTT OONN CCAANNCCEERR IINN NNEEVVAADDAA 22000000--22000044
HIGHLIGHTS
From 2000 to 2004, Nevadan males had a higher ratio than females when the incidence and mortality age-adjusted rates for Urinary Bladder Cancer were compared. Males had a ratio of 5.10 while the ratio for females was 4.17. This means that for every 100 deaths due to Urinary Bladder Cancer there would be 510 male cases and 417 female cases.
The median age at diagnosis of Urinary Bladder Cancer for Nevadans was 71 years of
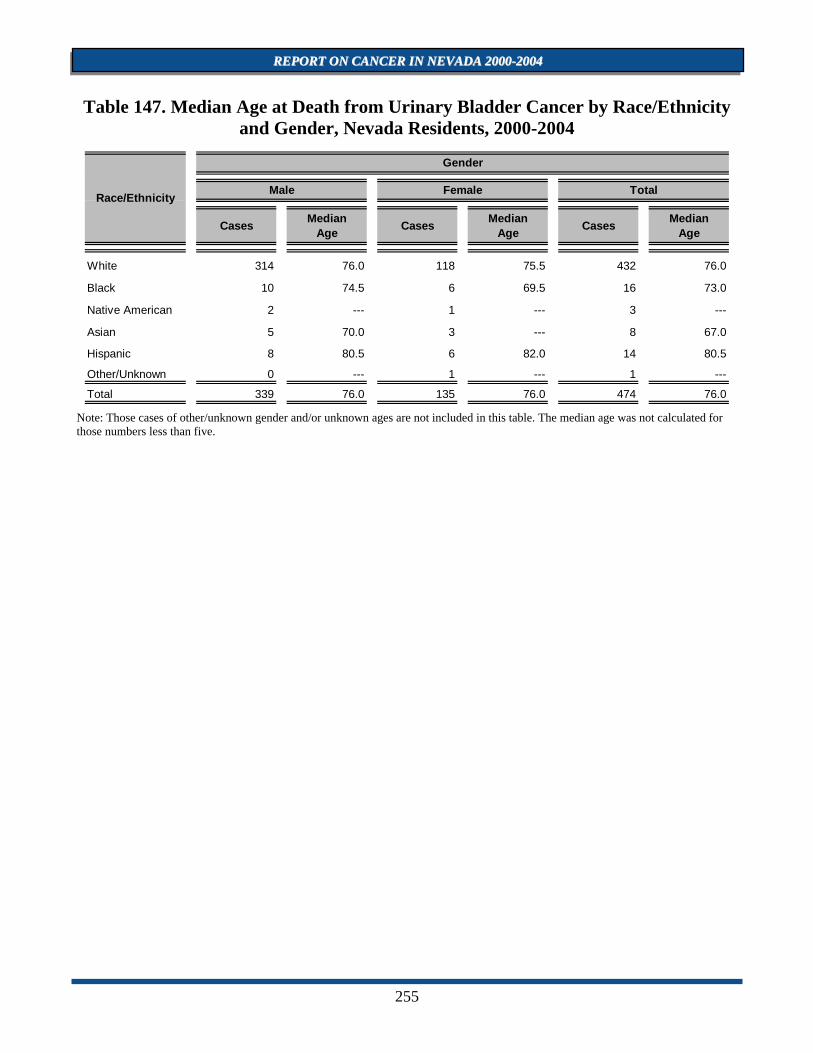
age from 2000 to 2004. The median age at time of death due to Urinary Bladder Cancer during this period was 76 years.
INCIDENCE
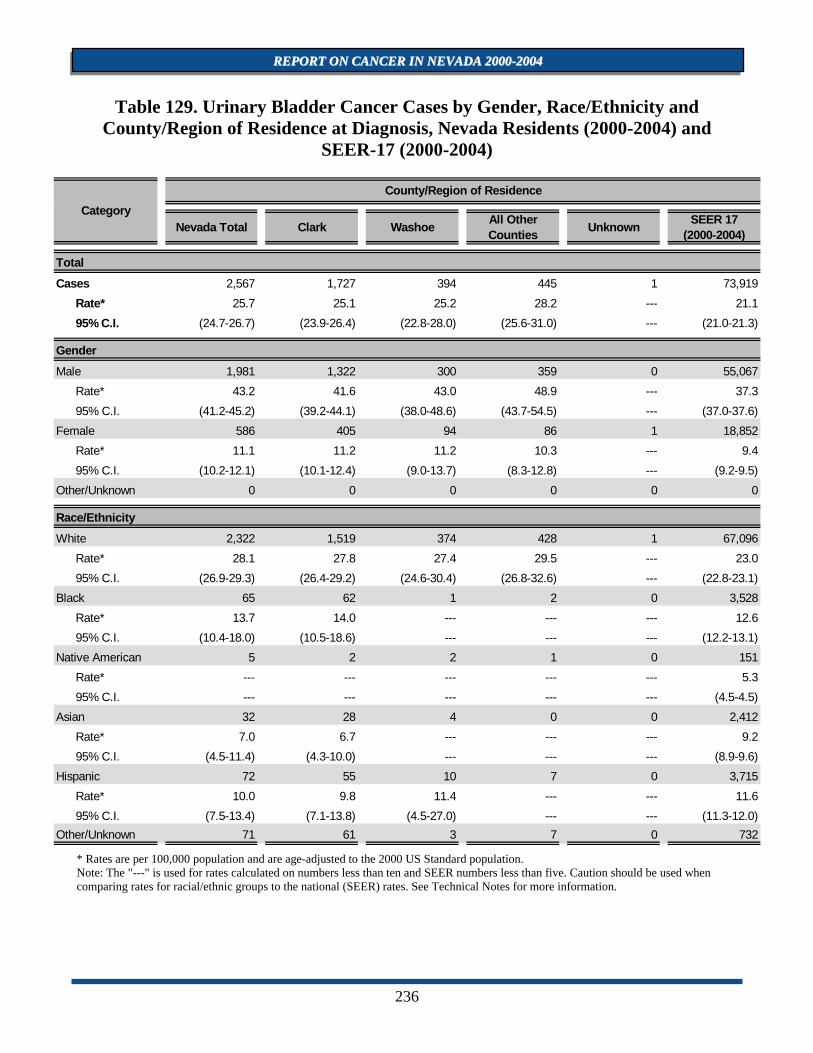
There were 2,567 cases of Urinary Bladder Cancer reported in Nevada from 2000 to 2004. Nevada's age-adjusted incidence rate, 25.7 (24.7-26.7), for Urinary Bladder Cancer showed statistical significance over the national rate of 21.13 (21.0-21.3, per 100,000 – 2000 US Standard population).
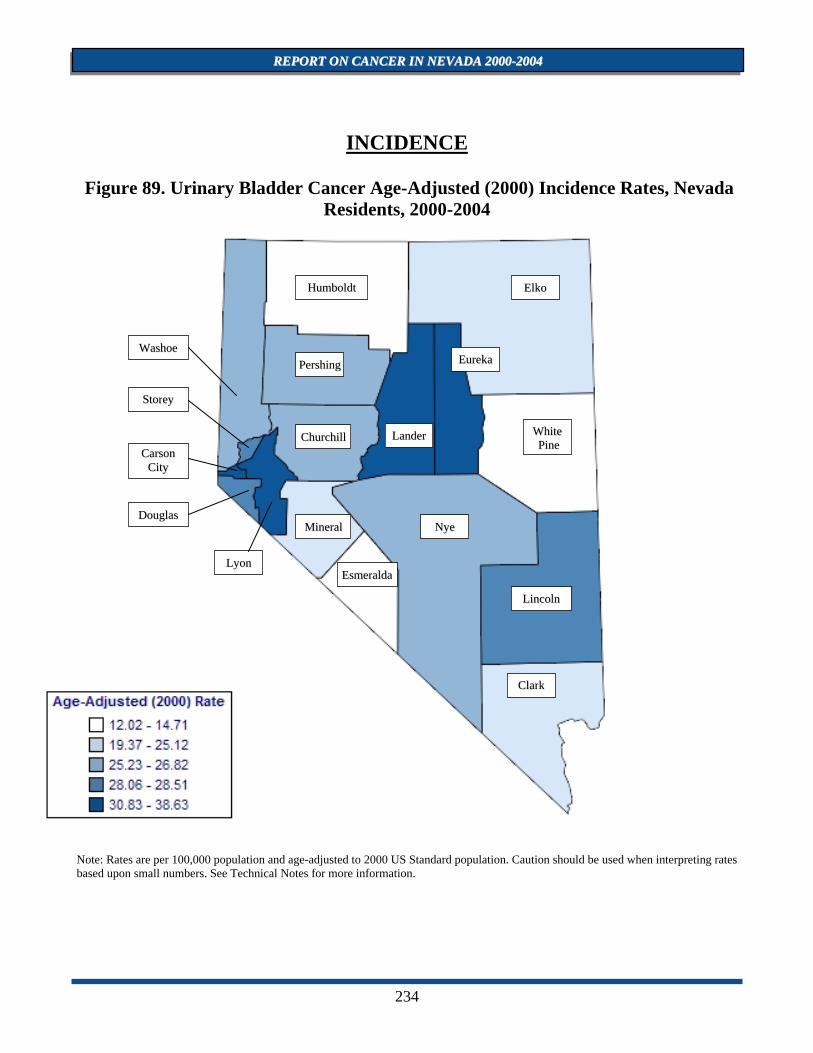
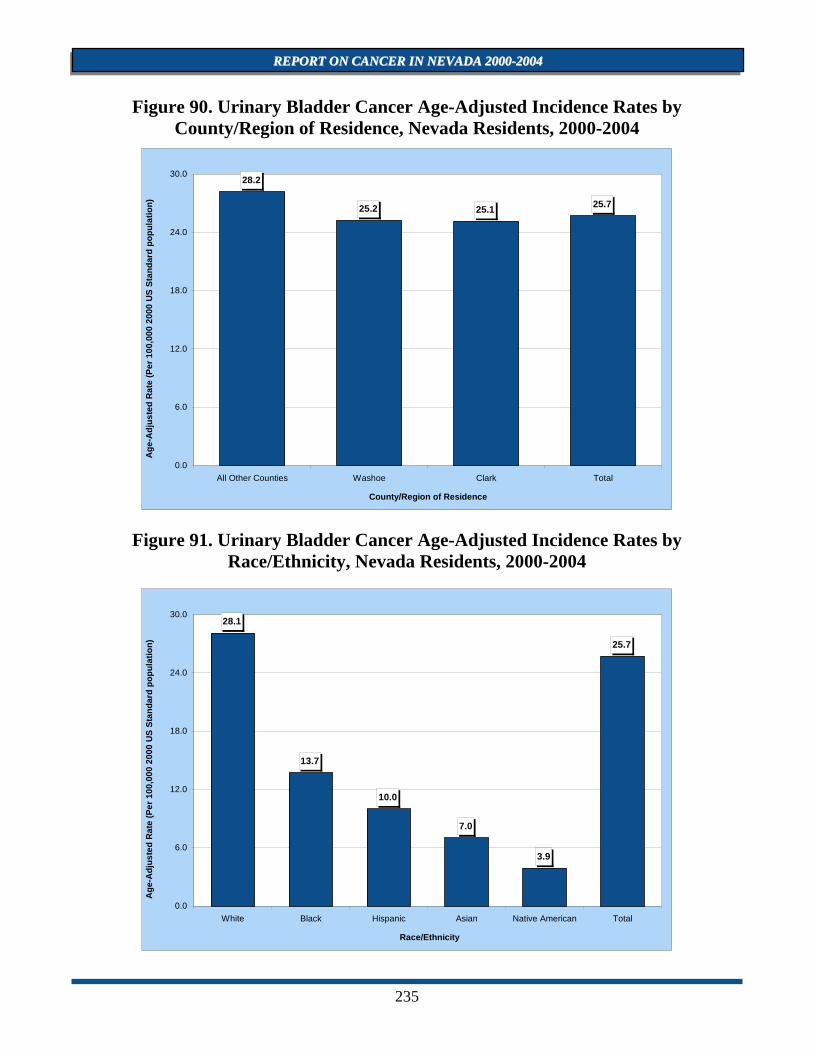
While there was little regional variation between All Other Counties (28.2), Washoe
County (25.2), and Clark County (25.1) in the age-adjusted incidence rate for Urinary Bladder Cancer, the rate for males, 43.2, was 3.9 times as the rate for Nevada females, 11.1, (per 100,000 – 2000 US Standard population) for the 2000 to 2004 period.
INPATIENT HOSPITAL DISCHARGES
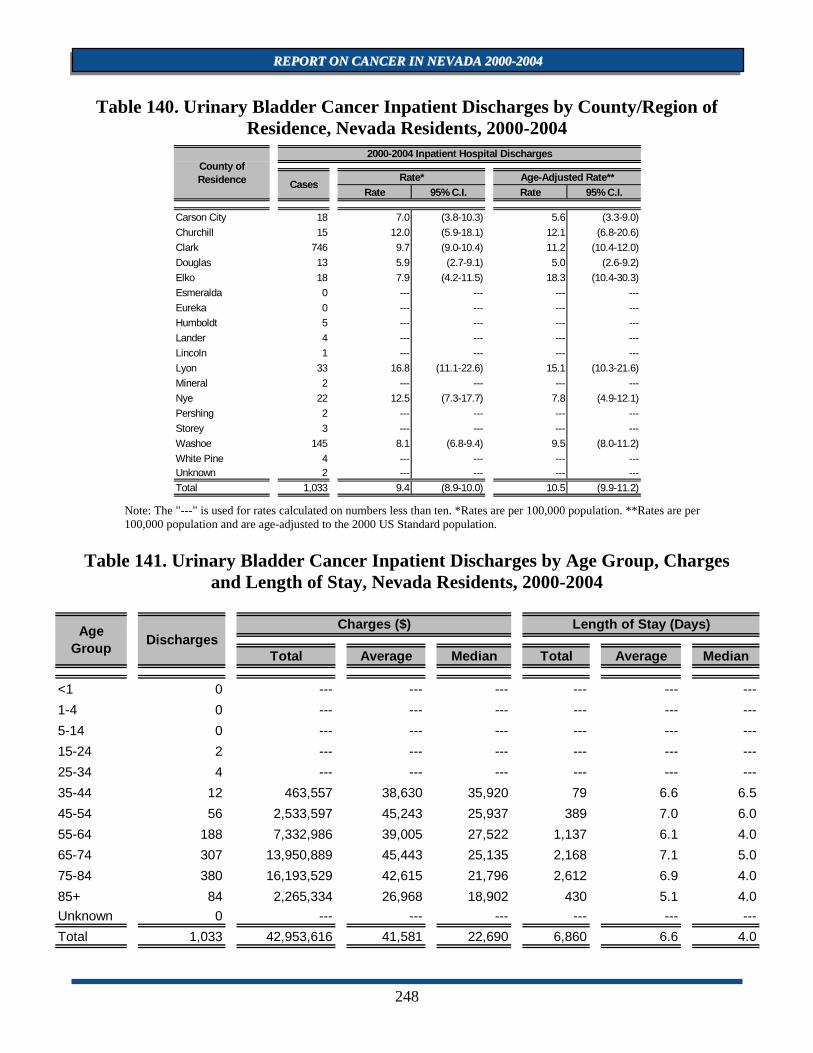
Billed charges from Urinary Bladder Cancer inpatient hospital discharges accounted for approximately 43.0 million dollars from 2000 to 2004. Nevadans in the 65-74 and 75-84 age groups accounted for 66.5% of the total inpatient discharges and 70.1% of the total billed charges during this period. The overall daily billed amount for these discharges was approximately $6,261 in Nevada during this period.
There were 1,033 Inpatient Discharges for Urinary Bladder Cancer to Nevada residents
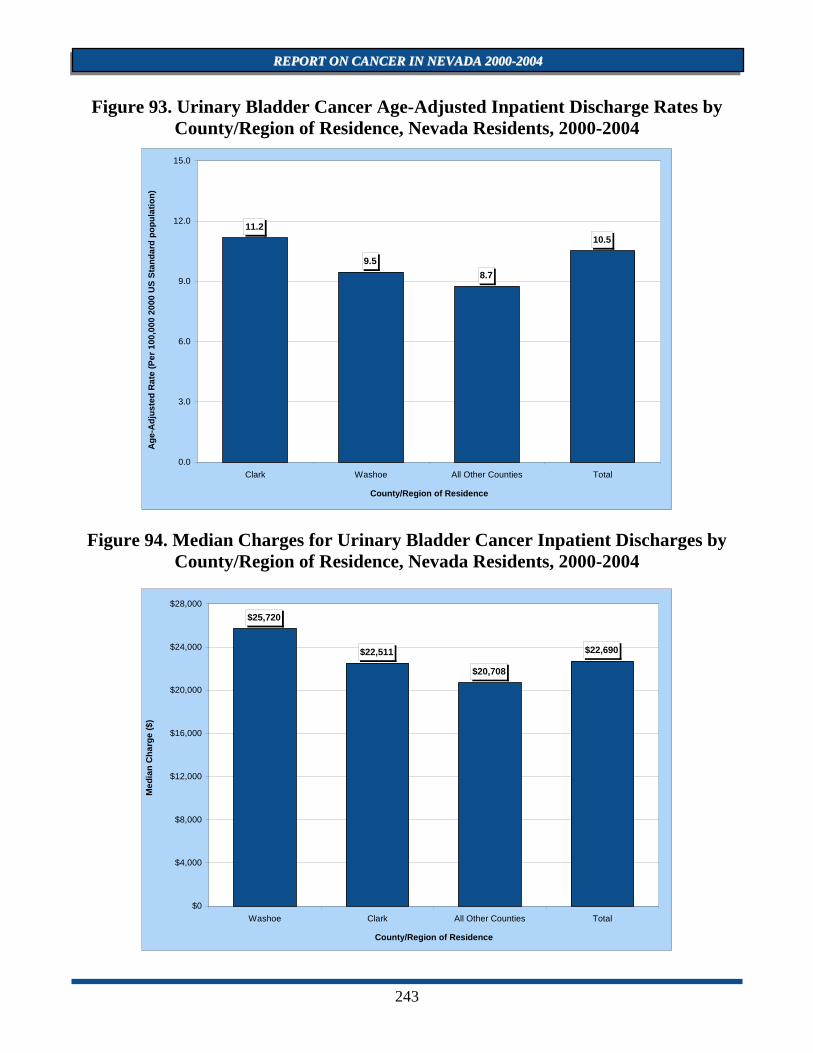
in Nevada from 2000 to 2004. Clark County (11.2) had the highest age-adjusted inpatient discharge rate for Urinary Bladder Cancer in Nevada, followed by Nevada overall, Washoe County, and All Other Counties who had rates of 10.5, 9.5 and 8.7 (per 100,000 – 2000 US Standard population), respectively.
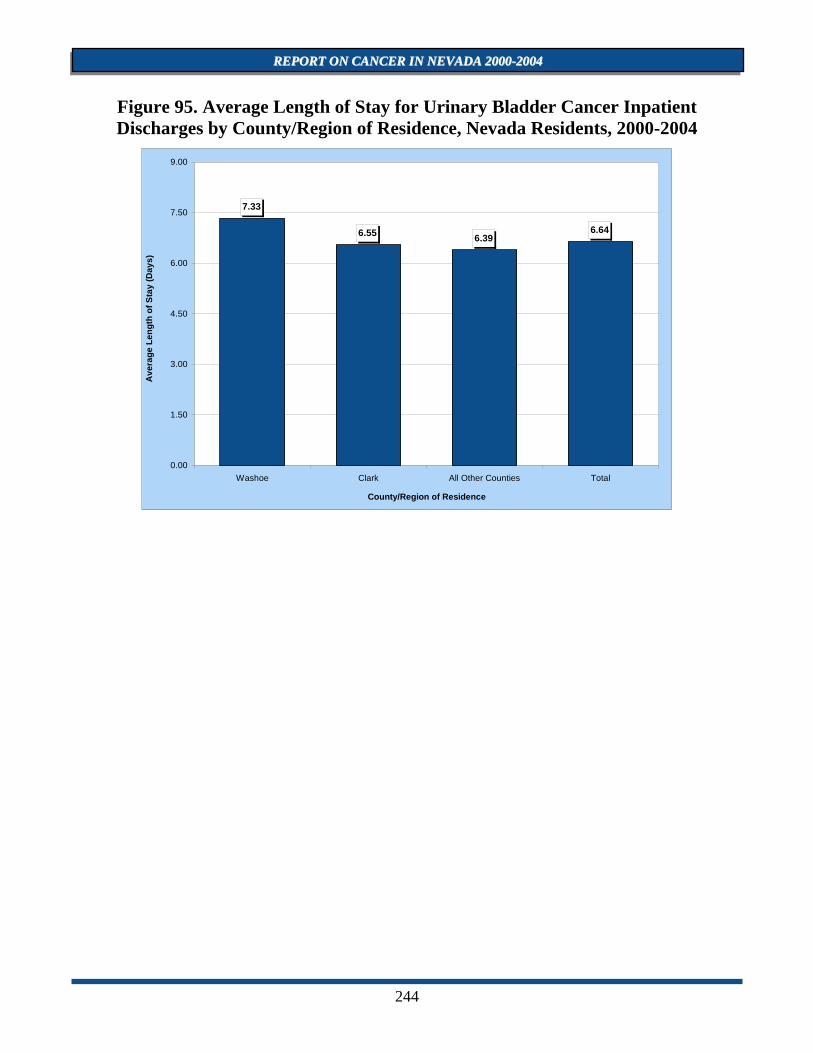
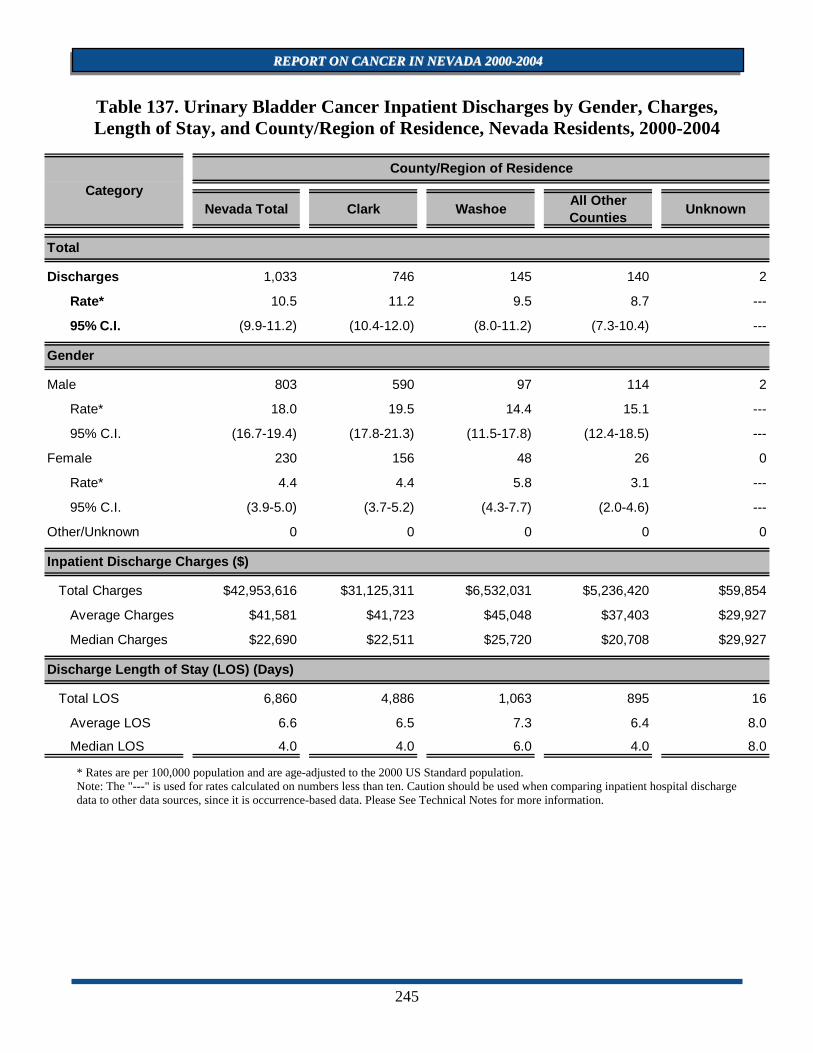
Washoe County had the highest median total billed amount ($25,720) and average length
of stay (7.3 days) during the 2000 to 2004 period for Urinary Bladder Cancer inpatient hospital discharges, once regional comparisons were made.
MORTALITY
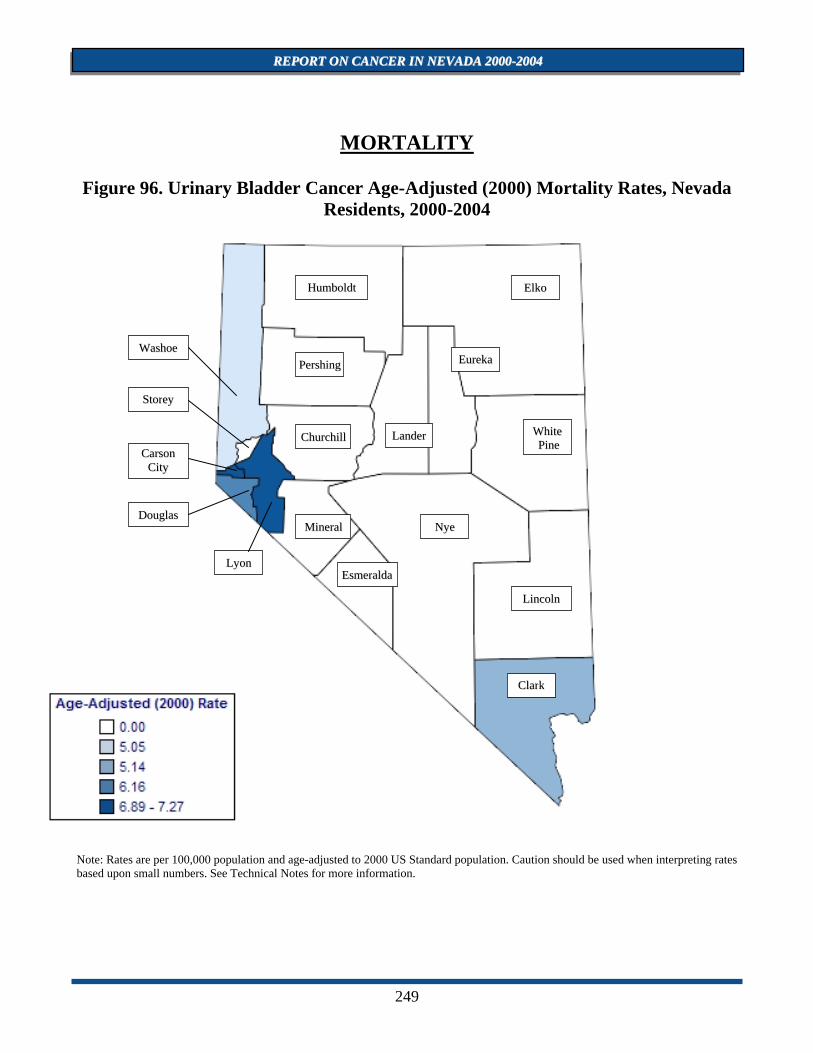
There were 474 resident deaths due to Urinary Bladder Cancer from 2000 to 2004. Regional comparisons were fairly similar between All Other Counties, as a region, Clark
233
RREEPPOORRTT OONN CCAANNCCEERR IINN NNEEVVAADDAA 22000000--22000044
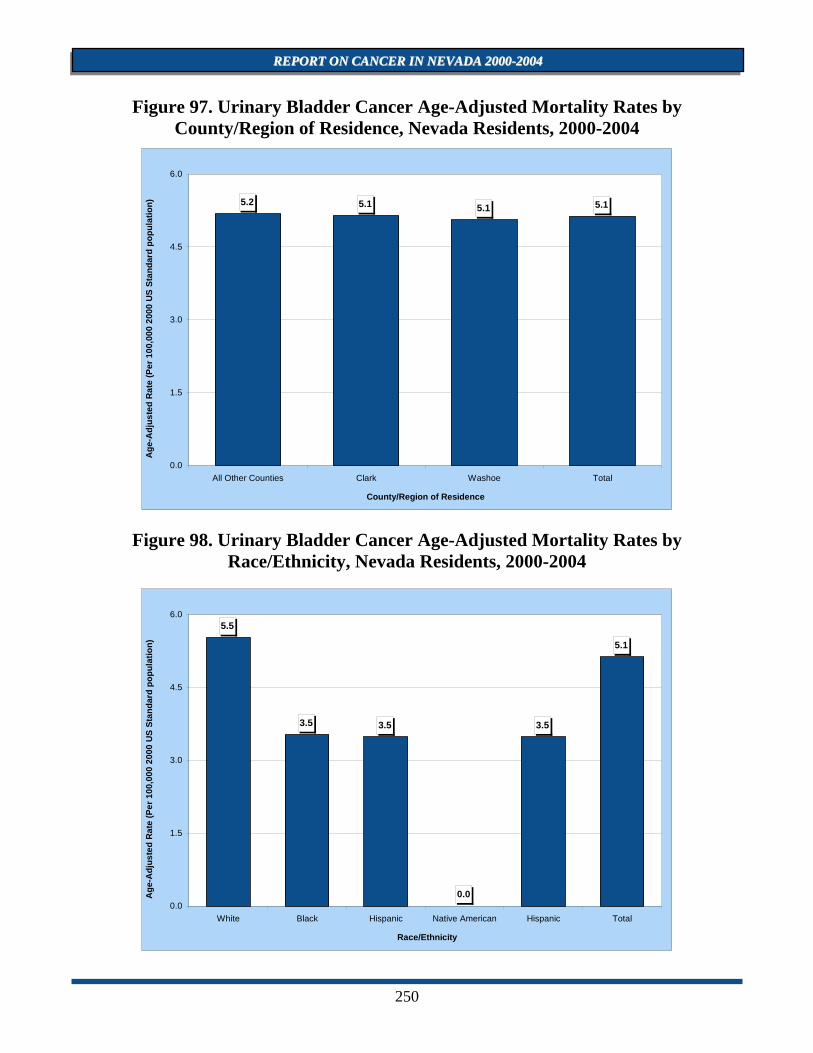
County and Washoe County with rates of 5.2, 5.1 and 5.1 (per 100,000 – 2000 US Standard population), respectively.
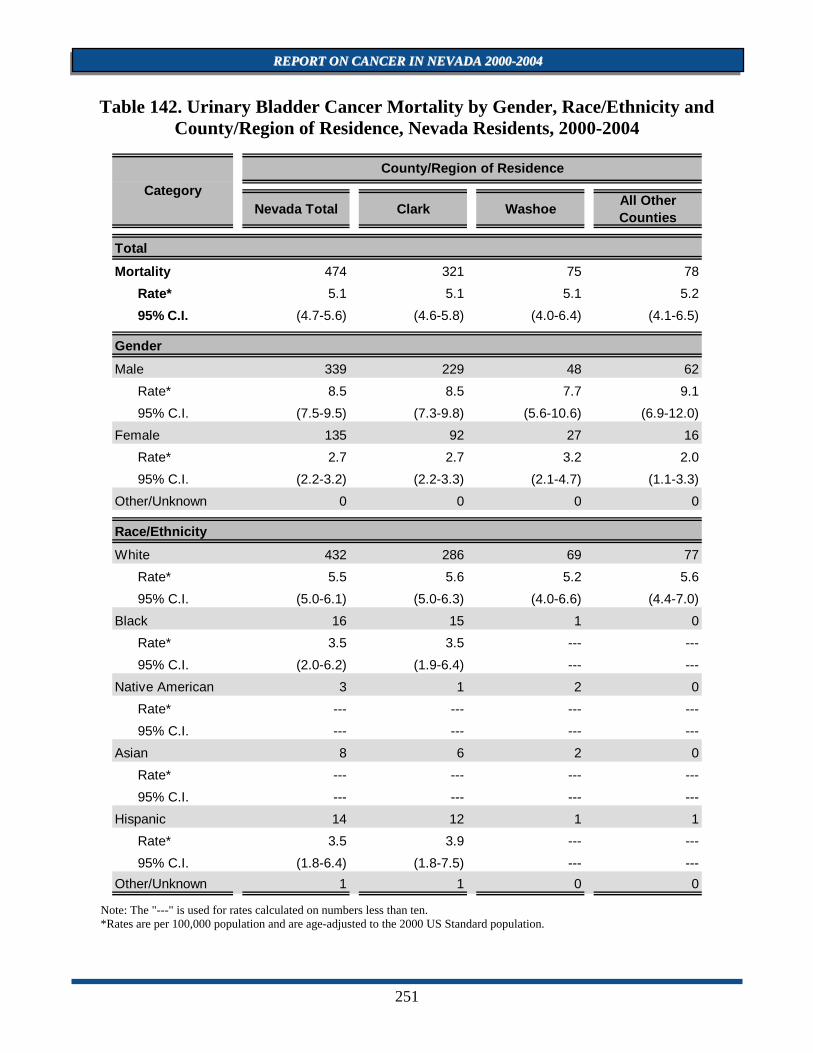
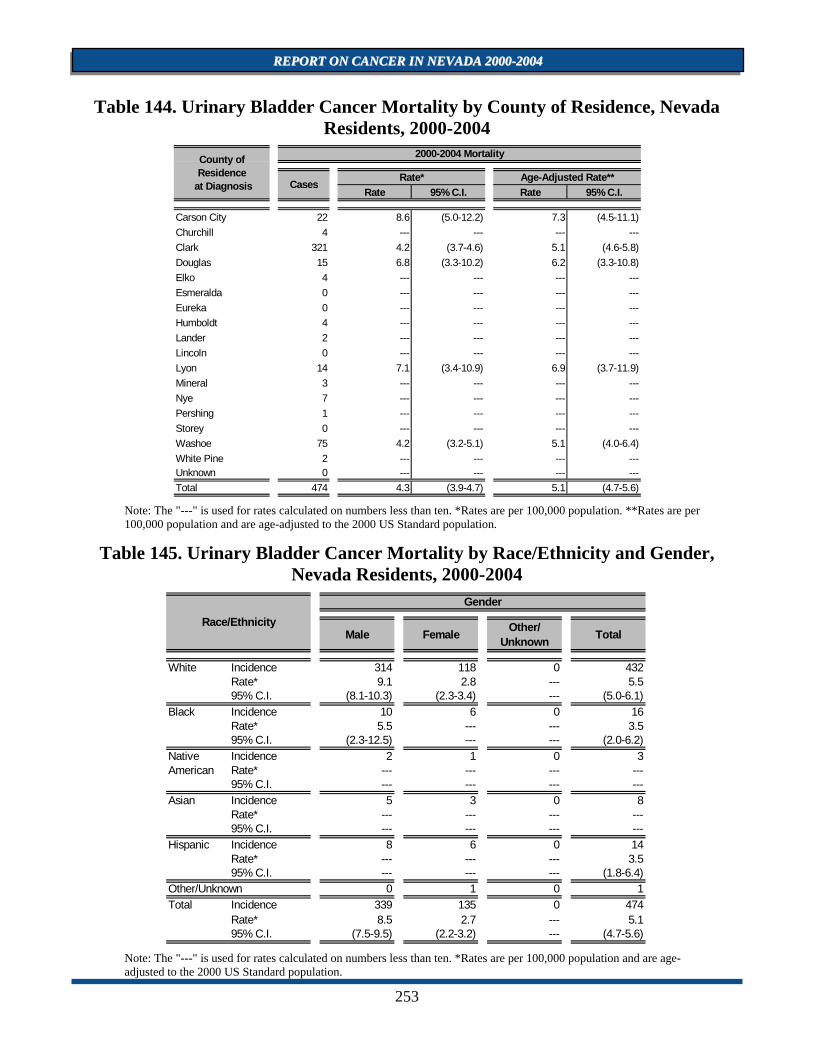
Nevadan males had a statistically significant higher age-adjusted mortality rate, 8.5 (7.5-
9.5), for Urinary Bladder Cancer that was more than 3.1 times the female mortality rate of 2.7 (2.2-3.2) (per 100,000 – 2000 US Standard population) for the 2000 to 2004 period.
SURVIVAL RATE
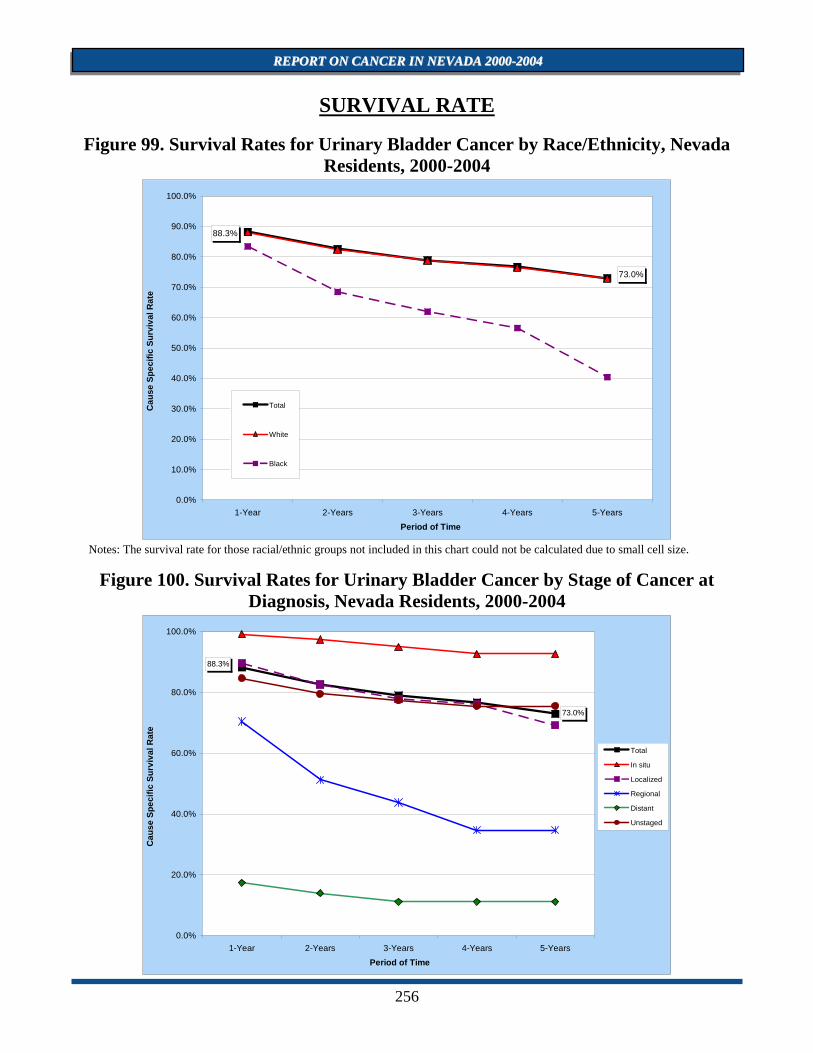
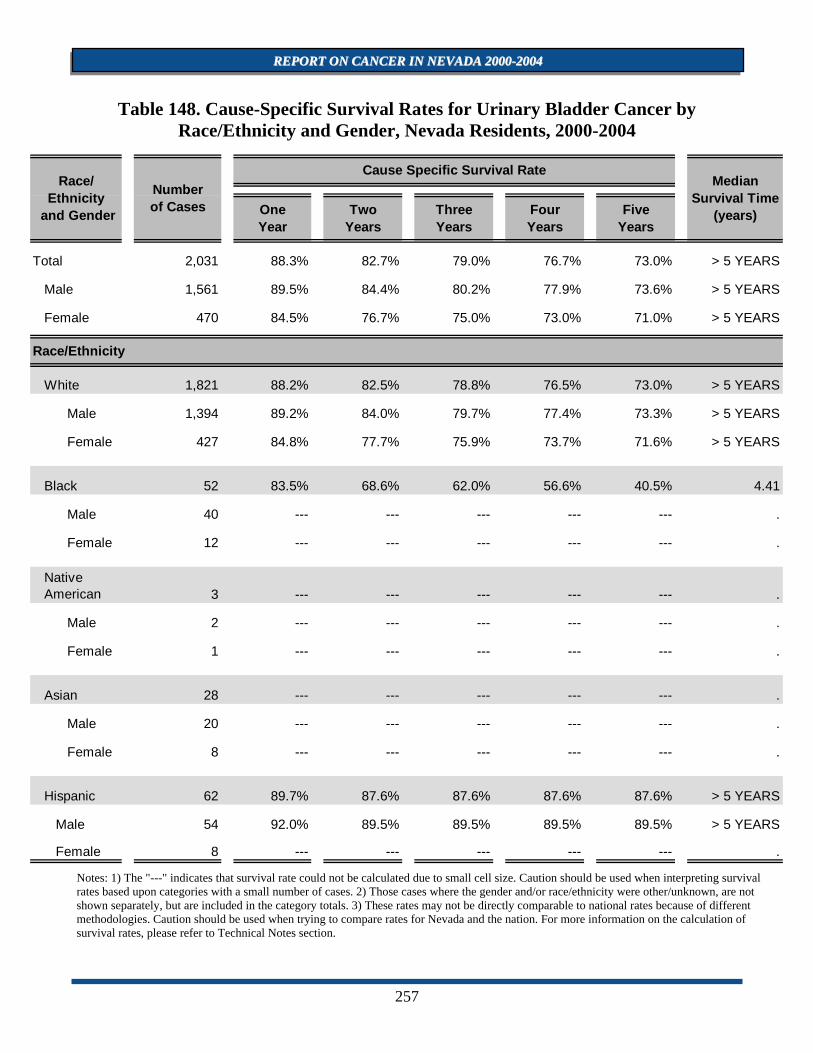
Nevada’s one-year survival rate for males with Urinary Bladder Cancer was higher than the rate for females during the 2000 to 2004 period, with rates of 89.5% and 84.5%, respectively, and remained at approximately the same ratio at the five-year rate where males had a rate of 73.6% and females had a rate of 71.0%.
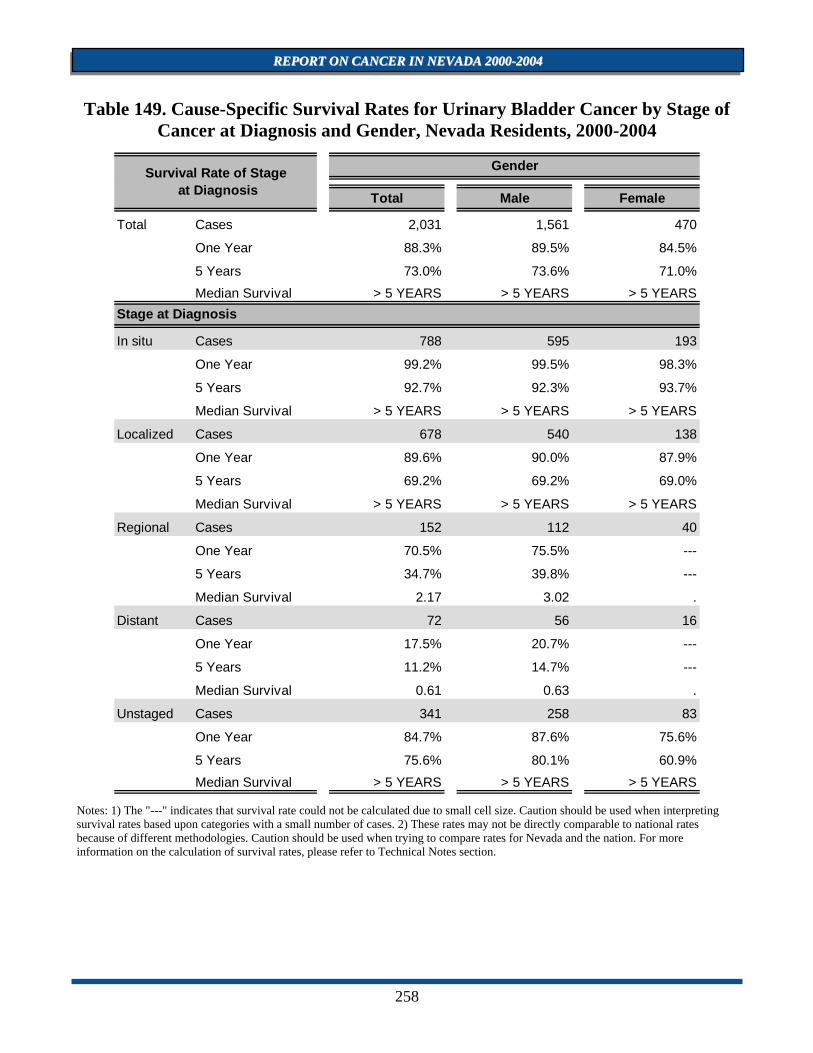
The one-year survival rate for those diagnosed with Urinary Bladder Cancer at the in situ
stage was 100.0% for Nevada from 2000 to 2004. The rate for those at the localized stage was 99.0%, while those recorded at the regional, distant and unstaged stages had rates of 97.7%, 57.5% and 85.4%, respectively.
The Median Survival time for those diagnosed at the in situ, localized, regional, and
unstaged stages was over five years, while those diagnosed at the distant level had a median survival time of 1.56 years, respectively, during the 2000 to 2004 period.
234
RREEPPOORRTT OONN CCAANNCCEERR IINN NNEEVVAADDAA 22000000--22000044
INCIDENCE Figure 89. Urinary Bladder Cancer Age-Adjusted (2000) Incidence Rates, Nevada
Residents, 2000-2004 Note: Rates are per 100,000 population and age-adjusted to 2000 US Standard population. Caution should be used when interpreting rates based upon small numbers. See Technical Notes for more information.
CChhuurrcchhiillll
HHuummbboollddtt EEllkkoo
WWaasshhooee
SSttoorreeyy
CCaarrssoonn CCiittyy
DDoouuggllaass
WWhhiittee PPiinnee
LLiinnccoollnn
CCllaarrkk
NNyyee
PPeerrsshhiinngg
MMiinneerraall
EEssmmeerraallddaaLLyyoonn
LLaannddeerr
EEuurreekkaa
235
RREEPPOORRTT OONN CCAANNCCEERR IINN NNEEVVAADDAA 22000000--22000044
Figure 90. Urinary Bladder Cancer Age-Adjusted Incidence Rates by County/Region of Residence, Nevada Residents, 2000-2004
Figure 91. Urinary Bladder Cancer Age-Adjusted Incidence Rates by
Race/Ethnicity, Nevada Residents, 2000-2004
28.2
25.2 25.1 25.7
0.0
6.0
12.0
18.0
24.0
30.0
All Other Counties Washoe Clark Total
County/Region of Residence
Age
-Adj
uste
d R
ate
(Per
100
,000
200
0 U
S St
anda
rd p
opul
atio
n)
28.1
13.7
10.0
7.0
3.9
25.7
0.0
6.0
12.0
18.0
24.0
30.0
White Black Hispanic Asian Native American Total
Race/Ethnicity
Age
-Adj
uste
d R
ate
(Per
100
,000
200
0 U
S St
anda
rd p
opul
atio
n)
236
RREEPPOORRTT OONN CCAANNCCEERR IINN NNEEVVAADDAA 22000000--22000044
Table 129. Urinary Bladder Cancer Cases by Gender, Race/Ethnicity and County/Region of Residence at Diagnosis, Nevada Residents (2000-2004) and
SEER-17 (2000-2004)
* Rates are per 100,000 population and are age-adjusted to the 2000 US Standard population. Note: The "---" is used for rates calculated on numbers less than ten and SEER numbers less than five. Caution should be used when comparing rates for racial/ethnic groups to the national (SEER) rates. See Technical Notes for more information.
Nevada Total Clark Washoe All Other Counties Unknown SEER 17
(2000-2004)
Cases 2,567 1,727 394 445 1 73,919Rate* 25.7 25.1 25.2 28.2 --- 21.195% C.I. (24.7-26.7) (23.9-26.4) (22.8-28.0) (25.6-31.0) --- (21.0-21.3)
Male 1,981 1,322 300 359 0 55,067Rate* 43.2 41.6 43.0 48.9 --- 37.395% C.I. (41.2-45.2) (39.2-44.1) (38.0-48.6) (43.7-54.5) --- (37.0-37.6)
Female 586 405 94 86 1 18,852Rate* 11.1 11.2 11.2 10.3 --- 9.495% C.I. (10.2-12.1) (10.1-12.4) (9.0-13.7) (8.3-12.8) --- (9.2-9.5)
Other/Unknown 0 0 0 0 0 0
White 2,322 1,519 374 428 1 67,096Rate* 28.1 27.8 27.4 29.5 --- 23.095% C.I. (26.9-29.3) (26.4-29.2) (24.6-30.4) (26.8-32.6) --- (22.8-23.1)
Black 65 62 1 2 0 3,528Rate* 13.7 14.0 --- --- --- 12.695% C.I. (10.4-18.0) (10.5-18.6) --- --- --- (12.2-13.1)
Native American 5 2 2 1 0 151Rate* --- --- --- --- --- 5.395% C.I. --- --- --- --- --- (4.5-4.5)
Asian 32 28 4 0 0 2,412Rate* 7.0 6.7 --- --- --- 9.295% C.I. (4.5-11.4) (4.3-10.0) --- --- --- (8.9-9.6)
Hispanic 72 55 10 7 0 3,715Rate* 10.0 9.8 11.4 --- --- 11.695% C.I. (7.5-13.4) (7.1-13.8) (4.5-27.0) --- --- (11.3-12.0)
Other/Unknown 71 61 3 7 0 732
Race/Ethnicity
CategoryCounty/Region of Residence
Total
Gender
237
RREEPPOORRTT OONN CCAANNCCEERR IINN NNEEVVAADDAA 22000000--22000044
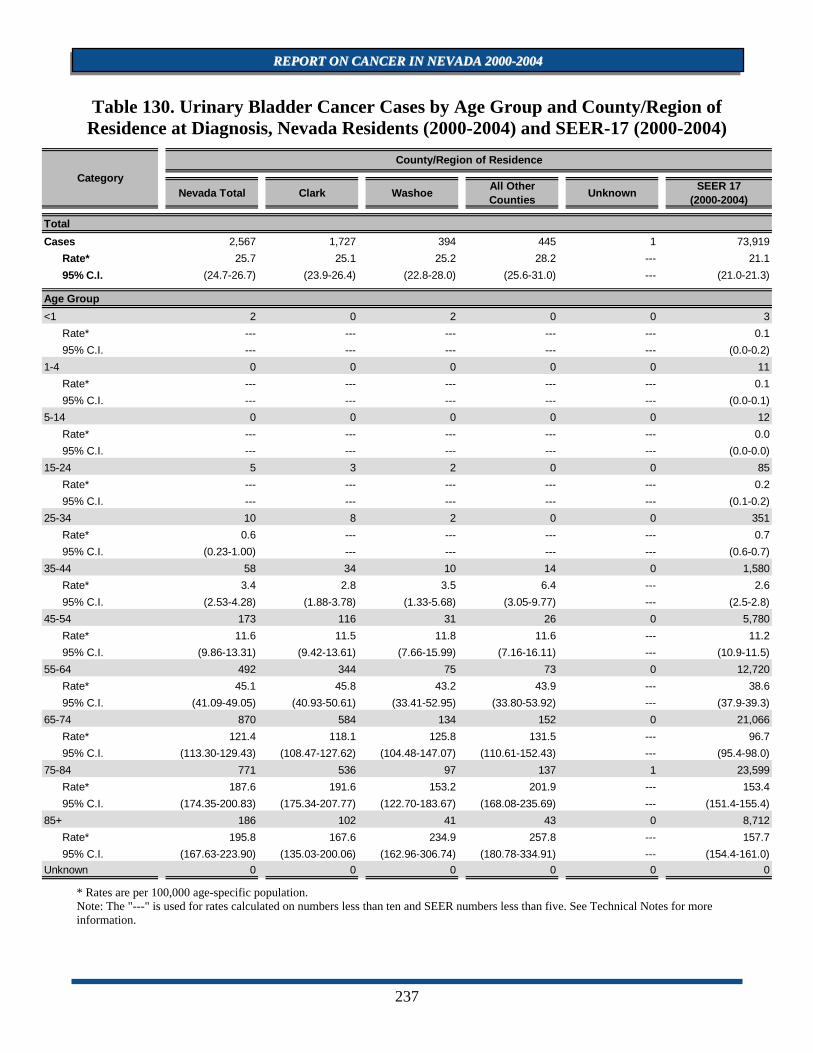
Table 130. Urinary Bladder Cancer Cases by Age Group and County/Region of Residence at Diagnosis, Nevada Residents (2000-2004) and SEER-17 (2000-2004)
* Rates are per 100,000 age-specific population. Note: The "---" is used for rates calculated on numbers less than ten and SEER numbers less than five. See Technical Notes for more information.
Nevada Total Clark Washoe All Other Counties Unknown SEER 17
(2000-2004)
Cases 2,567 1,727 394 445 1 73,919Rate* 25.7 25.1 25.2 28.2 --- 21.195% C.I. (24.7-26.7) (23.9-26.4) (22.8-28.0) (25.6-31.0) --- (21.0-21.3)
<1 2 0 2 0 0 3Rate* --- --- --- --- --- 0.195% C.I. --- --- --- --- --- (0.0-0.2)
1-4 0 0 0 0 0 11Rate* --- --- --- --- --- 0.195% C.I. --- --- --- --- --- (0.0-0.1)
5-14 0 0 0 0 0 12Rate* --- --- --- --- --- 0.095% C.I. --- --- --- --- --- (0.0-0.0)
15-24 5 3 2 0 0 85Rate* --- --- --- --- --- 0.295% C.I. --- --- --- --- --- (0.1-0.2)
25-34 10 8 2 0 0 351Rate* 0.6 --- --- --- --- 0.795% C.I. (0.23-1.00) --- --- --- --- (0.6-0.7)
35-44 58 34 10 14 0 1,580Rate* 3.4 2.8 3.5 6.4 --- 2.695% C.I. (2.53-4.28) (1.88-3.78) (1.33-5.68) (3.05-9.77) --- (2.5-2.8)
45-54 173 116 31 26 0 5,780Rate* 11.6 11.5 11.8 11.6 --- 11.295% C.I. (9.86-13.31) (9.42-13.61) (7.66-15.99) (7.16-16.11) --- (10.9-11.5)
55-64 492 344 75 73 0 12,720Rate* 45.1 45.8 43.2 43.9 --- 38.695% C.I. (41.09-49.05) (40.93-50.61) (33.41-52.95) (33.80-53.92) --- (37.9-39.3)
65-74 870 584 134 152 0 21,066Rate* 121.4 118.1 125.8 131.5 --- 96.795% C.I. (113.30-129.43) (108.47-127.62) (104.48-147.07) (110.61-152.43) --- (95.4-98.0)
75-84 771 536 97 137 1 23,599Rate* 187.6 191.6 153.2 201.9 --- 153.495% C.I. (174.35-200.83) (175.34-207.77) (122.70-183.67) (168.08-235.69) --- (151.4-155.4)
85+ 186 102 41 43 0 8,712Rate* 195.8 167.6 234.9 257.8 --- 157.795% C.I. (167.63-223.90) (135.03-200.06) (162.96-306.74) (180.78-334.91) --- (154.4-161.0)
Unknown 0 0 0 0 0 0
CategoryCounty/Region of Residence
Total
Age Group
238
RREEPPOORRTT OONN CCAANNCCEERR IINN NNEEVVAADDAA 22000000--22000044
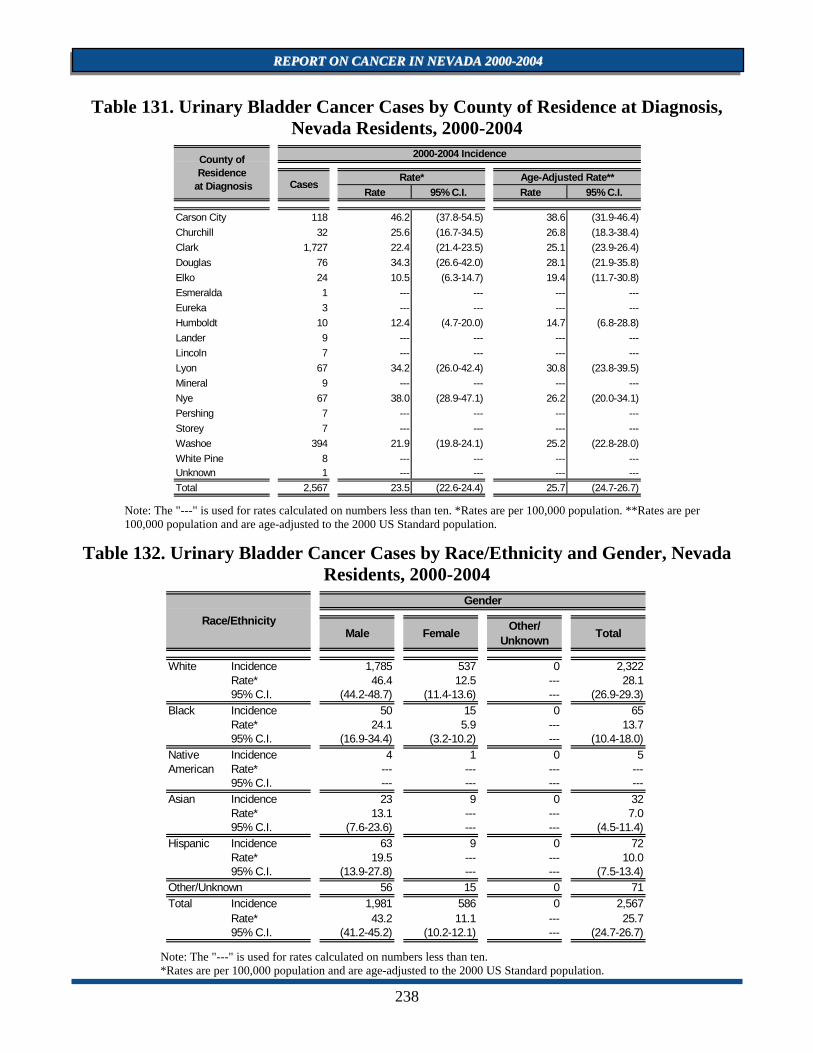
Table 131. Urinary Bladder Cancer Cases by County of Residence at Diagnosis, Nevada Residents, 2000-2004
Note: The "---" is used for rates calculated on numbers less than ten. *Rates are per 100,000 population. **Rates are per 100,000 population and are age-adjusted to the 2000 US Standard population.
Table 132. Urinary Bladder Cancer Cases by Race/Ethnicity and Gender, Nevada Residents, 2000-2004
Note: The "---" is used for rates calculated on numbers less than ten. *Rates are per 100,000 population and are age-adjusted to the 2000 US Standard population.
Rate 95% C.I. Rate 95% C.I.
Carson City 118 46.2 (37.8-54.5) 38.6 (31.9-46.4)Churchill 32 25.6 (16.7-34.5) 26.8 (18.3-38.4)Clark 1,727 22.4 (21.4-23.5) 25.1 (23.9-26.4)Douglas 76 34.3 (26.6-42.0) 28.1 (21.9-35.8)Elko 24 10.5 (6.3-14.7) 19.4 (11.7-30.8)Esmeralda 1 --- --- --- ---Eureka 3 --- --- --- ---Humboldt 10 12.4 (4.7-20.0) 14.7 (6.8-28.8)Lander 9 --- --- --- ---Lincoln 7 --- --- --- ---Lyon 67 34.2 (26.0-42.4) 30.8 (23.8-39.5)Mineral 9 --- --- --- ---Nye 67 38.0 (28.9-47.1) 26.2 (20.0-34.1)Pershing 7 --- --- --- ---Storey 7 --- --- --- ---Washoe 394 21.9 (19.8-24.1) 25.2 (22.8-28.0)White Pine 8 --- --- --- ---Unknown 1 --- --- --- ---Total 2,567 23.5 (22.6-24.4) 25.7 (24.7-26.7)
County of Residence
at Diagnosis
2000-2004 Incidence
Cases Rate* Age-Adjusted Rate**
Male Female Other/Unknown Total
White Incidence 1,785 537 0 2,322Rate* 46.4 12.5 --- 28.195% C.I. (44.2-48.7) (11.4-13.6) --- (26.9-29.3)
Black Incidence 50 15 0 65Rate* 24.1 5.9 --- 13.795% C.I. (16.9-34.4) (3.2-10.2) --- (10.4-18.0)Incidence 4 1 0 5Rate* --- --- --- ---95% C.I. --- --- --- ---
Asian Incidence 23 9 0 32Rate* 13.1 --- --- 7.095% C.I. (7.6-23.6) --- --- (4.5-11.4)
Hispanic Incidence 63 9 0 72Rate* 19.5 --- --- 10.095% C.I. (13.9-27.8) --- --- (7.5-13.4)
Other/Unknown 56 15 0 71Total Incidence 1,981 586 0 2,567
Rate* 43.2 11.1 --- 25.795% C.I. (41.2-45.2) (10.2-12.1) --- (24.7-26.7)
Native American
Race/Ethnicity
Gender
239
RREEPPOORRTT OONN CCAANNCCEERR IINN NNEEVVAADDAA 22000000--22000044
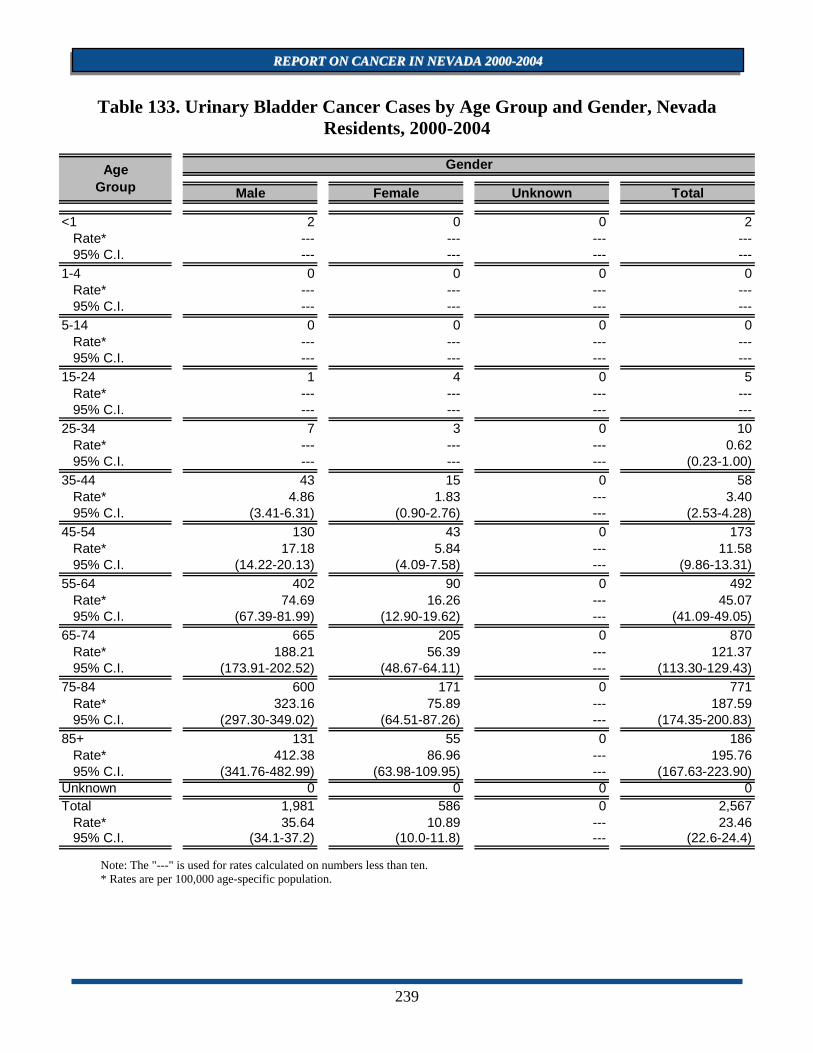
Table 133. Urinary Bladder Cancer Cases by Age Group and Gender, Nevada Residents, 2000-2004
Note: The "---" is used for rates calculated on numbers less than ten. * Rates are per 100,000 age-specific population.
Male Female Unknown Total
<1 2 0 0 2Rate* --- --- --- ---95% C.I. --- --- --- ---
1-4 0 0 0 0Rate* --- --- --- ---95% C.I. --- --- --- ---
5-14 0 0 0 0Rate* --- --- --- ---95% C.I. --- --- --- ---
15-24 1 4 0 5Rate* --- --- --- ---95% C.I. --- --- --- ---
25-34 7 3 0 10Rate* --- --- --- 0.6295% C.I. --- --- --- (0.23-1.00)
35-44 43 15 0 58Rate* 4.86 1.83 --- 3.4095% C.I. (3.41-6.31) (0.90-2.76) --- (2.53-4.28)
45-54 130 43 0 173Rate* 17.18 5.84 --- 11.5895% C.I. (14.22-20.13) (4.09-7.58) --- (9.86-13.31)
55-64 402 90 0 492Rate* 74.69 16.26 --- 45.0795% C.I. (67.39-81.99) (12.90-19.62) --- (41.09-49.05)
65-74 665 205 0 870Rate* 188.21 56.39 --- 121.3795% C.I. (173.91-202.52) (48.67-64.11) --- (113.30-129.43)
75-84 600 171 0 771Rate* 323.16 75.89 --- 187.5995% C.I. (297.30-349.02) (64.51-87.26) --- (174.35-200.83)
85+ 131 55 0 186Rate* 412.38 86.96 --- 195.7695% C.I. (341.76-482.99) (63.98-109.95) --- (167.63-223.90)
Unknown 0 0 0 0Total 1,981 586 0 2,567
Rate* 35.64 10.89 --- 23.4695% C.I. (34.1-37.2) (10.0-11.8) --- (22.6-24.4)
AgeGroup
Gender
240
RREEPPOORRTT OONN CCAANNCCEERR IINN NNEEVVAADDAA 22000000--22000044
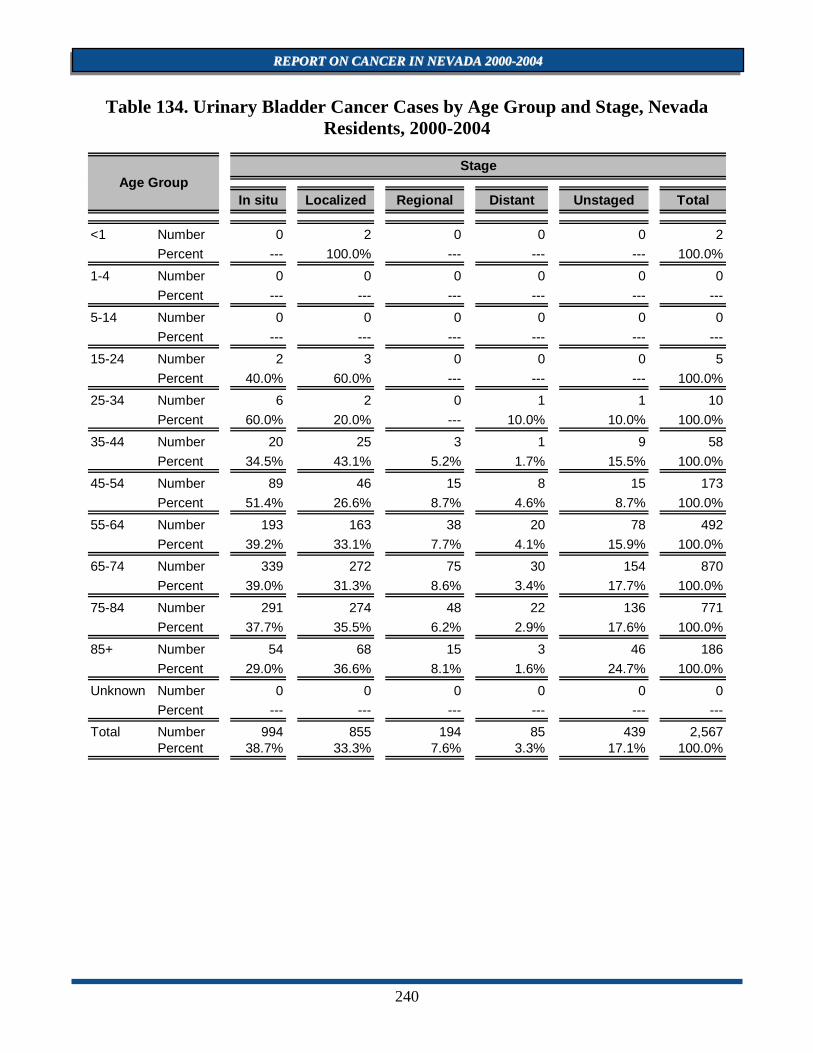
Table 134. Urinary Bladder Cancer Cases by Age Group and Stage, Nevada Residents, 2000-2004
In situ Localized Regional Distant Unstaged Total
<1 Number 0 2 0 0 0 2Percent --- 100.0% --- --- --- 100.0%
1-4 Number 0 0 0 0 0 0Percent --- --- --- --- --- ---
5-14 Number 0 0 0 0 0 0Percent --- --- --- --- --- ---
15-24 Number 2 3 0 0 0 5Percent 40.0% 60.0% --- --- --- 100.0%
25-34 Number 6 2 0 1 1 10Percent 60.0% 20.0% --- 10.0% 10.0% 100.0%
35-44 Number 20 25 3 1 9 58Percent 34.5% 43.1% 5.2% 1.7% 15.5% 100.0%
45-54 Number 89 46 15 8 15 173Percent 51.4% 26.6% 8.7% 4.6% 8.7% 100.0%
55-64 Number 193 163 38 20 78 492Percent 39.2% 33.1% 7.7% 4.1% 15.9% 100.0%
65-74 Number 339 272 75 30 154 870Percent 39.0% 31.3% 8.6% 3.4% 17.7% 100.0%
75-84 Number 291 274 48 22 136 771Percent 37.7% 35.5% 6.2% 2.9% 17.6% 100.0%
85+ Number 54 68 15 3 46 186Percent 29.0% 36.6% 8.1% 1.6% 24.7% 100.0%
Unknown Number 0 0 0 0 0 0Percent --- --- --- --- --- ---
Total Number 994 855 194 85 439 2,567Percent 38.7% 33.3% 7.6% 3.3% 17.1% 100.0%
Age GroupStage
241
RREEPPOORRTT OONN CCAANNCCEERR IINN NNEEVVAADDAA 22000000--22000044
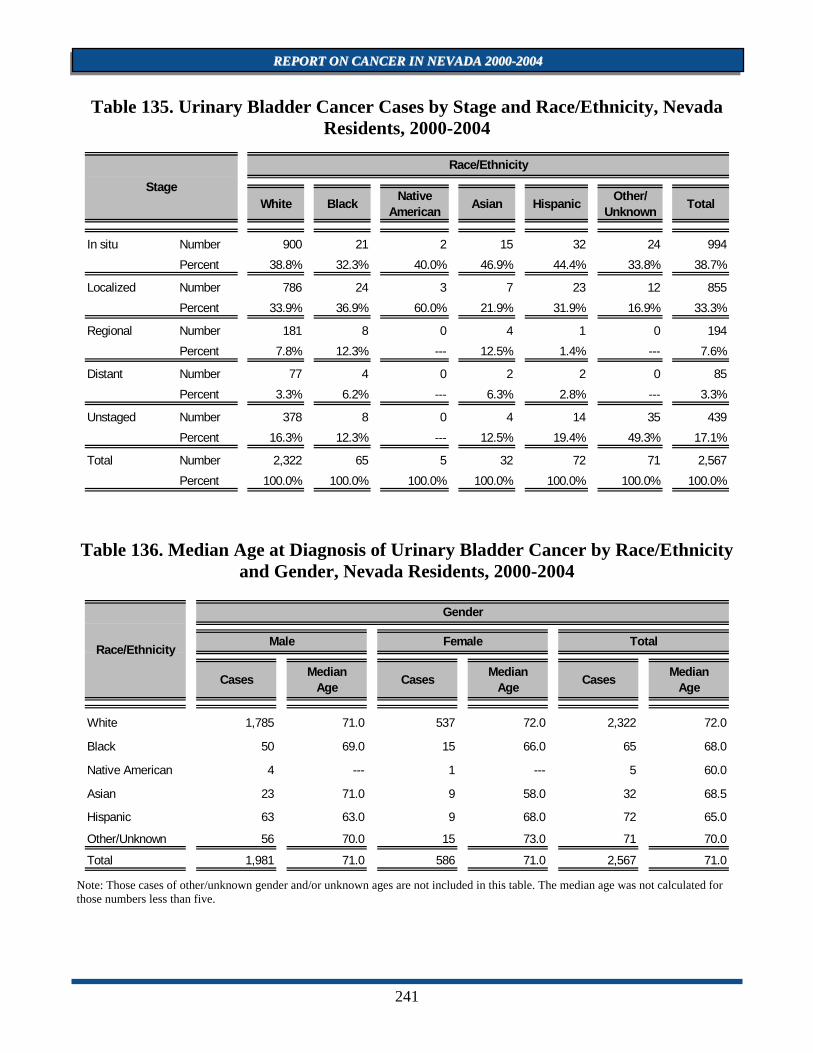
Table 135. Urinary Bladder Cancer Cases by Stage and Race/Ethnicity, Nevada Residents, 2000-2004
Table 136. Median Age at Diagnosis of Urinary Bladder Cancer by Race/Ethnicity and Gender, Nevada Residents, 2000-2004
Note: Those cases of other/unknown gender and/or unknown ages are not included in this table. The median age was not calculated for those numbers less than five.
White Black Native American Asian Hispanic Other/
Unknown Total
In situ Number 900 21 2 15 32 24 994Percent 38.8% 32.3% 40.0% 46.9% 44.4% 33.8% 38.7%
Localized Number 786 24 3 7 23 12 855Percent 33.9% 36.9% 60.0% 21.9% 31.9% 16.9% 33.3%
Regional Number 181 8 0 4 1 0 194Percent 7.8% 12.3% --- 12.5% 1.4% --- 7.6%
Distant Number 77 4 0 2 2 0 85Percent 3.3% 6.2% --- 6.3% 2.8% --- 3.3%
Unstaged Number 378 8 0 4 14 35 439Percent 16.3% 12.3% --- 12.5% 19.4% 49.3% 17.1%
Total Number 2,322 65 5 32 72 71 2,567Percent 100.0% 100.0% 100.0% 100.0% 100.0% 100.0% 100.0%
Stage
Race/Ethnicity
Cases Median Age Cases Median
Age Cases Median Age
White 1,785 71.0 537 72.0 2,322 72.0
Black 50 69.0 15 66.0 65 68.0
Native American 4 --- 1 --- 5 60.0
Asian 23 71.0 9 58.0 32 68.5
Hispanic 63 63.0 9 68.0 72 65.0
Other/Unknown 56 70.0 15 73.0 71 70.0
Total 1,981 71.0 586 71.0 2,567 71.0
Race/Ethnicity
Gender
Male Female Total
242
RREEPPOORRTT OONN CCAANNCCEERR IINN NNEEVVAADDAA 22000000--22000044
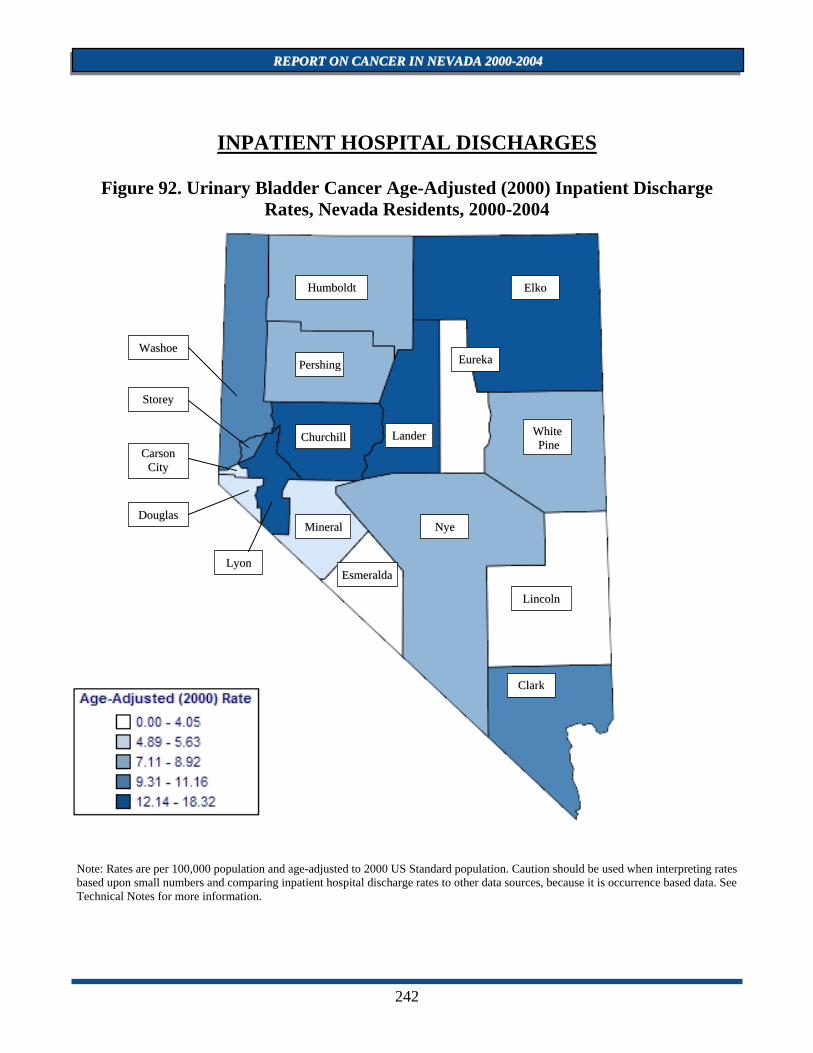
INPATIENT HOSPITAL DISCHARGES
Figure 92. Urinary Bladder Cancer Age-Adjusted (2000) Inpatient Discharge Rates, Nevada Residents, 2000-2004
Note: Rates are per 100,000 population and age-adjusted to 2000 US Standard population. Caution should be used when interpreting rates based upon small numbers and comparing inpatient hospital discharge rates to other data sources, because it is occurrence based data. See Technical Notes for more information.
CChhuurrcchhiillll
HHuummbboollddtt EEllkkoo
WWaasshhooee
SSttoorreeyy
CCaarrssoonn CCiittyy
DDoouuggllaass
WWhhiittee PPiinnee
LLiinnccoollnn
CCllaarrkk
NNyyee
PPeerrsshhiinngg
MMiinneerraall
EEssmmeerraallddaaLLyyoonn
LLaannddeerr
EEuurreekkaa
243
RREEPPOORRTT OONN CCAANNCCEERR IINN NNEEVVAADDAA 22000000--22000044
Figure 93. Urinary Bladder Cancer Age-Adjusted Inpatient Discharge Rates by County/Region of Residence, Nevada Residents, 2000-2004
Figure 94. Median Charges for Urinary Bladder Cancer Inpatient Discharges by
County/Region of Residence, Nevada Residents, 2000-2004
11.2
9.58.7
10.5
0.0
3.0
6.0
9.0
12.0
15.0
Clark Washoe All Other Counties Total
County/Region of Residence
Age
-Adj
uste
d R
ate
(Per
100
,000
200
0 U
S St
anda
rd p
opul
atio
n)
$25,720
$22,511
$20,708
$22,690
$0
$4,000
$8,000
$12,000
$16,000
$20,000
$24,000
$28,000
Washoe Clark All Other Counties Total
County/Region of Residence
Med
ian
Cha
rge
($)
244
RREEPPOORRTT OONN CCAANNCCEERR IINN NNEEVVAADDAA 22000000--22000044
Figure 95. Average Length of Stay for Urinary Bladder Cancer Inpatient Discharges by County/Region of Residence, Nevada Residents, 2000-2004
7.33
6.55 6.396.64
0.00
1.50
3.00
4.50
6.00
7.50
9.00
Washoe Clark All Other Counties Total
County/Region of Residence
Ave
rage
Len
gth
of S
tay
(Day
s)
245
RREEPPOORRTT OONN CCAANNCCEERR IINN NNEEVVAADDAA 22000000--22000044
Table 137. Urinary Bladder Cancer Inpatient Discharges by Gender, Charges, Length of Stay, and County/Region of Residence, Nevada Residents, 2000-2004
* Rates are per 100,000 population and are age-adjusted to the 2000 US Standard population. Note: The "---" is used for rates calculated on numbers less than ten. Caution should be used when comparing inpatient hospital discharge data to other data sources, since it is occurrence-based data. Please See Technical Notes for more information.
Nevada Total Clark Washoe All Other Counties Unknown
Discharges 1,033 746 145 140 2
Rate* 10.5 11.2 9.5 8.7 ---
95% C.I. (9.9-11.2) (10.4-12.0) (8.0-11.2) (7.3-10.4) ---
Male 803 590 97 114 2
Rate* 18.0 19.5 14.4 15.1 ---
95% C.I. (16.7-19.4) (17.8-21.3) (11.5-17.8) (12.4-18.5) ---
Female 230 156 48 26 0
Rate* 4.4 4.4 5.8 3.1 ---
95% C.I. (3.9-5.0) (3.7-5.2) (4.3-7.7) (2.0-4.6) ---
Other/Unknown 0 0 0 0 0
Total Charges $42,953,616 $31,125,311 $6,532,031 $5,236,420 $59,854
Average Charges $41,581 $41,723 $45,048 $37,403 $29,927
Median Charges $22,690 $22,511 $25,720 $20,708 $29,927
Total LOS 6,860 4,886 1,063 895 16
Average LOS 6.6 6.5 7.3 6.4 8.0
Median LOS 4.0 4.0 6.0 4.0 8.0
Gender
Inpatient Discharge Charges ($)
CategoryCounty/Region of Residence
Total
Discharge Length of Stay (LOS) (Days)
246
RREEPPOORRTT OONN CCAANNCCEERR IINN NNEEVVAADDAA 22000000--22000044
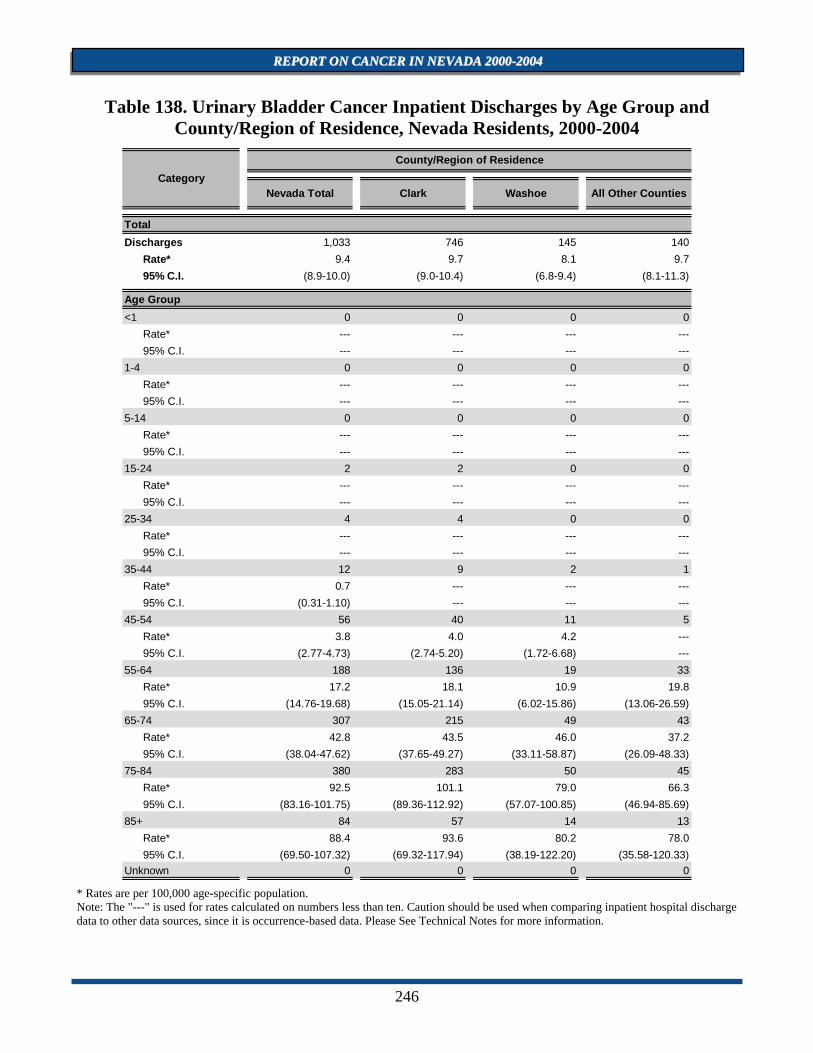
Table 138. Urinary Bladder Cancer Inpatient Discharges by Age Group and County/Region of Residence, Nevada Residents, 2000-2004
* Rates are per 100,000 age-specific population. Note: The "---" is used for rates calculated on numbers less than ten. Caution should be used when comparing inpatient hospital discharge data to other data sources, since it is occurrence-based data. Please See Technical Notes for more information.
Nevada Total Clark Washoe All Other Counties
Discharges 1,033 746 145 140Rate* 9.4 9.7 8.1 9.795% C.I. (8.9-10.0) (9.0-10.4) (6.8-9.4) (8.1-11.3)
<1 0 0 0 0Rate* --- --- --- ---95% C.I. --- --- --- ---
1-4 0 0 0 0Rate* --- --- --- ---95% C.I. --- --- --- ---
5-14 0 0 0 0Rate* --- --- --- ---95% C.I. --- --- --- ---
15-24 2 2 0 0Rate* --- --- --- ---95% C.I. --- --- --- ---
25-34 4 4 0 0Rate* --- --- --- ---95% C.I. --- --- --- ---
35-44 12 9 2 1Rate* 0.7 --- --- ---95% C.I. (0.31-1.10) --- --- ---
45-54 56 40 11 5Rate* 3.8 4.0 4.2 ---95% C.I. (2.77-4.73) (2.74-5.20) (1.72-6.68) ---
55-64 188 136 19 33Rate* 17.2 18.1 10.9 19.895% C.I. (14.76-19.68) (15.05-21.14) (6.02-15.86) (13.06-26.59)
65-74 307 215 49 43Rate* 42.8 43.5 46.0 37.295% C.I. (38.04-47.62) (37.65-49.27) (33.11-58.87) (26.09-48.33)
75-84 380 283 50 45Rate* 92.5 101.1 79.0 66.395% C.I. (83.16-101.75) (89.36-112.92) (57.07-100.85) (46.94-85.69)
85+ 84 57 14 13Rate* 88.4 93.6 80.2 78.095% C.I. (69.50-107.32) (69.32-117.94) (38.19-122.20) (35.58-120.33)
Unknown 0 0 0 0
CategoryCounty/Region of Residence
Total
Age Group
247
RREEPPOORRTT OONN CCAANNCCEERR IINN NNEEVVAADDAA 22000000--22000044
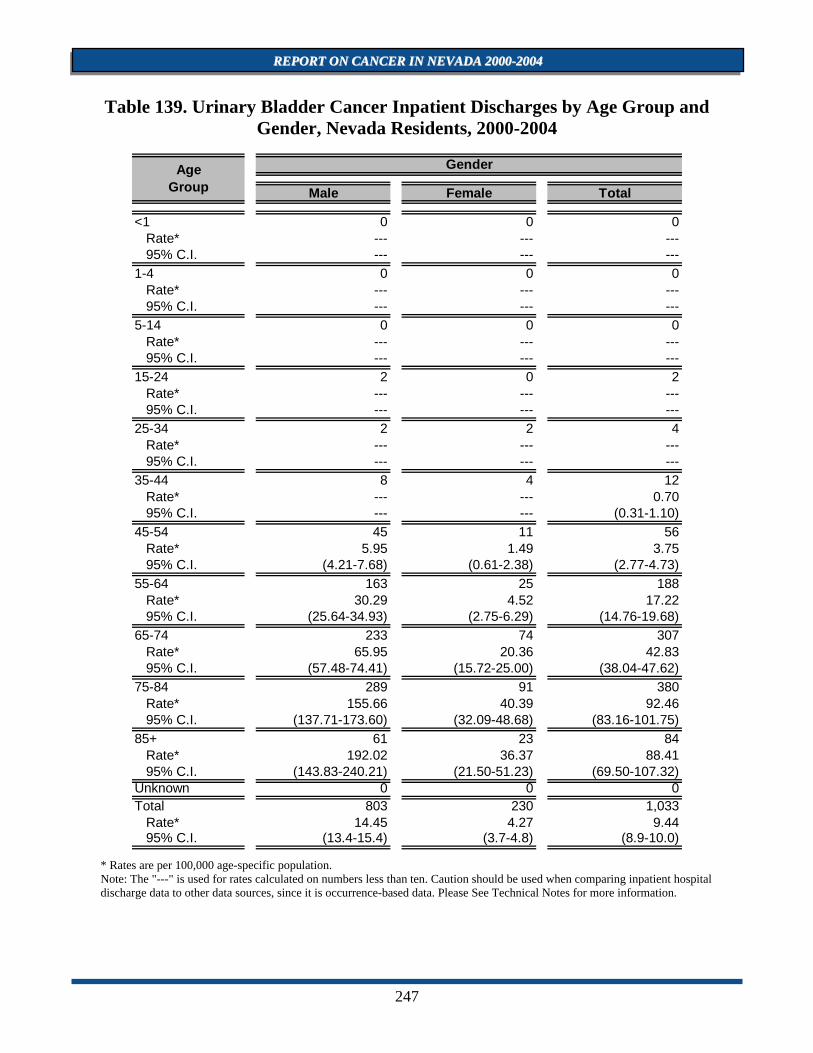
Table 139. Urinary Bladder Cancer Inpatient Discharges by Age Group and Gender, Nevada Residents, 2000-2004
* Rates are per 100,000 age-specific population. Note: The "---" is used for rates calculated on numbers less than ten. Caution should be used when comparing inpatient hospital discharge data to other data sources, since it is occurrence-based data. Please See Technical Notes for more information.
Male Female Total
<1 0 0 0Rate* --- --- ---95% C.I. --- --- ---
1-4 0 0 0Rate* --- --- ---95% C.I. --- --- ---
5-14 0 0 0Rate* --- --- ---95% C.I. --- --- ---
15-24 2 0 2Rate* --- --- ---95% C.I. --- --- ---
25-34 2 2 4Rate* --- --- ---95% C.I. --- --- ---
35-44 8 4 12Rate* --- --- 0.7095% C.I. --- --- (0.31-1.10)
45-54 45 11 56Rate* 5.95 1.49 3.7595% C.I. (4.21-7.68) (0.61-2.38) (2.77-4.73)
55-64 163 25 188Rate* 30.29 4.52 17.2295% C.I. (25.64-34.93) (2.75-6.29) (14.76-19.68)
65-74 233 74 307Rate* 65.95 20.36 42.8395% C.I. (57.48-74.41) (15.72-25.00) (38.04-47.62)
75-84 289 91 380Rate* 155.66 40.39 92.4695% C.I. (137.71-173.60) (32.09-48.68) (83.16-101.75)
85+ 61 23 84Rate* 192.02 36.37 88.4195% C.I. (143.83-240.21) (21.50-51.23) (69.50-107.32)
Unknown 0 0 0Total 803 230 1,033
Rate* 14.45 4.27 9.4495% C.I. (13.4-15.4) (3.7-4.8) (8.9-10.0)
AgeGroup
Gender
248
RREEPPOORRTT OONN CCAANNCCEERR IINN NNEEVVAADDAA 22000000--22000044
Table 140. Urinary Bladder Cancer Inpatient Discharges by County/Region of Residence, Nevada Residents, 2000-2004
Note: The "---" is used for rates calculated on numbers less than ten. *Rates are per 100,000 population. **Rates are per 100,000 population and are age-adjusted to the 2000 US Standard population.
Table 141. Urinary Bladder Cancer Inpatient Discharges by Age Group, Charges
and Length of Stay, Nevada Residents, 2000-2004
Rate 95% C.I. Rate 95% C.I.
Carson City 18 7.0 (3.8-10.3) 5.6 (3.3-9.0)Churchill 15 12.0 (5.9-18.1) 12.1 (6.8-20.6)Clark 746 9.7 (9.0-10.4) 11.2 (10.4-12.0)Douglas 13 5.9 (2.7-9.1) 5.0 (2.6-9.2)Elko 18 7.9 (4.2-11.5) 18.3 (10.4-30.3)Esmeralda 0 --- --- --- ---Eureka 0 --- --- --- ---Humboldt 5 --- --- --- ---Lander 4 --- --- --- ---Lincoln 1 --- --- --- ---Lyon 33 16.8 (11.1-22.6) 15.1 (10.3-21.6)Mineral 2 --- --- --- ---Nye 22 12.5 (7.3-17.7) 7.8 (4.9-12.1)Pershing 2 --- --- --- ---Storey 3 --- --- --- ---Washoe 145 8.1 (6.8-9.4) 9.5 (8.0-11.2)White Pine 4 --- --- --- ---Unknown 2 --- --- --- ---Total 1,033 9.4 (8.9-10.0) 10.5 (9.9-11.2)
County of Residence
2000-2004 Inpatient Hospital Discharges
Cases Rate* Age-Adjusted Rate**
Total Average Median Total Average Median
<1 0 --- --- --- --- --- ---1-4 0 --- --- --- --- --- ---5-14 0 --- --- --- --- --- ---15-24 2 --- --- --- --- --- ---25-34 4 --- --- --- --- --- ---35-44 12 463,557 38,630 35,920 79 6.6 6.545-54 56 2,533,597 45,243 25,937 389 7.0 6.055-64 188 7,332,986 39,005 27,522 1,137 6.1 4.065-74 307 13,950,889 45,443 25,135 2,168 7.1 5.075-84 380 16,193,529 42,615 21,796 2,612 6.9 4.085+ 84 2,265,334 26,968 18,902 430 5.1 4.0Unknown 0 --- --- --- --- --- ---Total 1,033 42,953,616 41,581 22,690 6,860 6.6 4.0
AgeGroup Discharges
Charges ($) Length of Stay (Days)
249
RREEPPOORRTT OONN CCAANNCCEERR IINN NNEEVVAADDAA 22000000--22000044
MORTALITY Figure 96. Urinary Bladder Cancer Age-Adjusted (2000) Mortality Rates, Nevada
Residents, 2000-2004 Note: Rates are per 100,000 population and age-adjusted to 2000 US Standard population. Caution should be used when interpreting rates based upon small numbers. See Technical Notes for more information.
CChhuurrcchhiillll
HHuummbboollddtt EEllkkoo
WWaasshhooee
SSttoorreeyy
CCaarrssoonn CCiittyy
DDoouuggllaass
WWhhiittee PPiinnee
LLiinnccoollnn
CCllaarrkk
NNyyee
PPeerrsshhiinngg
MMiinneerraall
EEssmmeerraallddaaLLyyoonn
LLaannddeerr
EEuurreekkaa
250
RREEPPOORRTT OONN CCAANNCCEERR IINN NNEEVVAADDAA 22000000--22000044
Figure 97. Urinary Bladder Cancer Age-Adjusted Mortality Rates by County/Region of Residence, Nevada Residents, 2000-2004
Figure 98. Urinary Bladder Cancer Age-Adjusted Mortality Rates by
Race/Ethnicity, Nevada Residents, 2000-2004
5.2 5.1 5.1 5.1
0.0
1.5
3.0
4.5
6.0
All Other Counties Clark Washoe Total
County/Region of Residence
Age
-Adj
uste
d R
ate
(Per
100
,000
200
0 U
S St
anda
rd p
opul
atio
n)
5.5
3.5 3.5
0.0
3.5
5.1
0.0
1.5
3.0
4.5
6.0
White Black Hispanic Native American Hispanic Total
Race/Ethnicity
Age
-Adj
uste
d R
ate
(Per
100
,000
200
0 U
S St
anda
rd p
opul
atio
n)
251
RREEPPOORRTT OONN CCAANNCCEERR IINN NNEEVVAADDAA 22000000--22000044
Table 142. Urinary Bladder Cancer Mortality by Gender, Race/Ethnicity and County/Region of Residence, Nevada Residents, 2000-2004
Note: The "---" is used for rates calculated on numbers less than ten. *Rates are per 100,000 population and are age-adjusted to the 2000 US Standard population.
Nevada Total Clark Washoe All Other Counties
Mortality 474 321 75 78Rate* 5.1 5.1 5.1 5.295% C.I. (4.7-5.6) (4.6-5.8) (4.0-6.4) (4.1-6.5)
Male 339 229 48 62Rate* 8.5 8.5 7.7 9.195% C.I. (7.5-9.5) (7.3-9.8) (5.6-10.6) (6.9-12.0)
Female 135 92 27 16Rate* 2.7 2.7 3.2 2.095% C.I. (2.2-3.2) (2.2-3.3) (2.1-4.7) (1.1-3.3)
Other/Unknown 0 0 0 0
White 432 286 69 77Rate* 5.5 5.6 5.2 5.695% C.I. (5.0-6.1) (5.0-6.3) (4.0-6.6) (4.4-7.0)
Black 16 15 1 0Rate* 3.5 3.5 --- ---95% C.I. (2.0-6.2) (1.9-6.4) --- ---
Native American 3 1 2 0Rate* --- --- --- ---95% C.I. --- --- --- ---
Asian 8 6 2 0Rate* --- --- --- ---95% C.I. --- --- --- ---
Hispanic 14 12 1 1Rate* 3.5 3.9 --- ---95% C.I. (1.8-6.4) (1.8-7.5) --- ---
Other/Unknown 1 1 0 0
County/Region of ResidenceCategory
Total
Gender
Race/Ethnicity
252
RREEPPOORRTT OONN CCAANNCCEERR IINN NNEEVVAADDAA 22000000--22000044
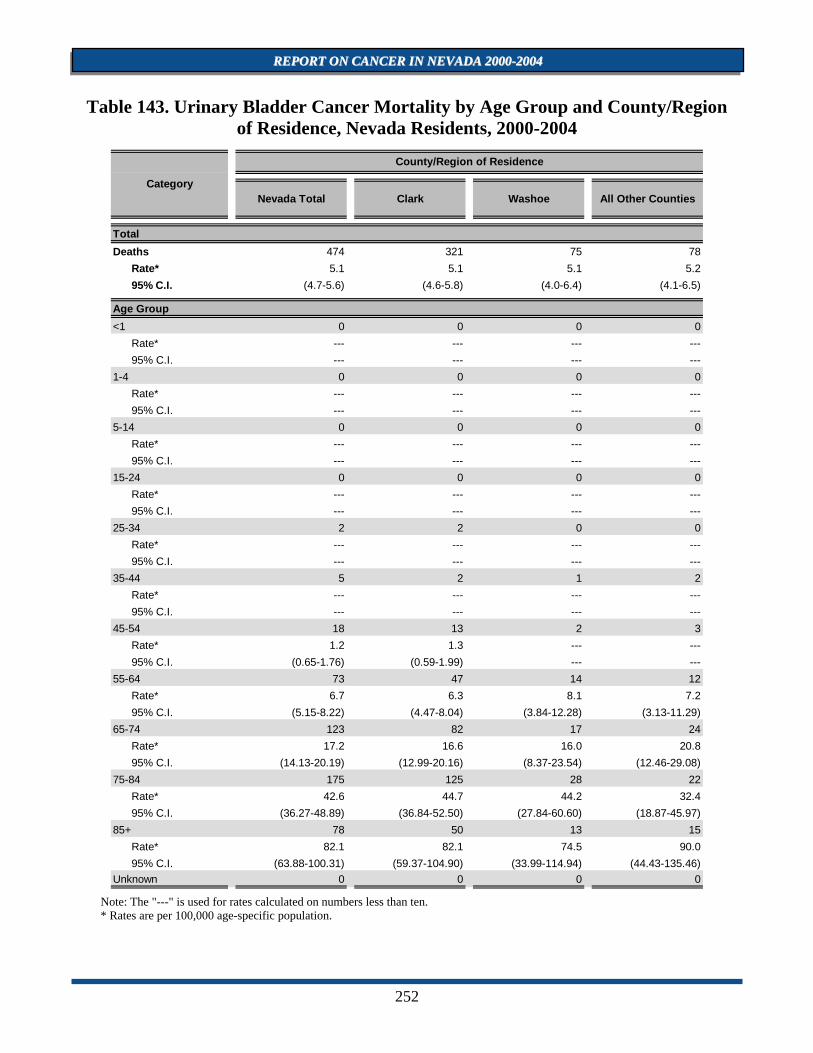
Table 143. Urinary Bladder Cancer Mortality by Age Group and County/Region of Residence, Nevada Residents, 2000-2004
Note: The "---" is used for rates calculated on numbers less than ten. * Rates are per 100,000 age-specific population.
Nevada Total Clark Washoe All Other Counties
Deaths 474 321 75 78Rate* 5.1 5.1 5.1 5.295% C.I. (4.7-5.6) (4.6-5.8) (4.0-6.4) (4.1-6.5)
<1 0 0 0 0Rate* --- --- --- ---95% C.I. --- --- --- ---
1-4 0 0 0 0Rate* --- --- --- ---95% C.I. --- --- --- ---
5-14 0 0 0 0Rate* --- --- --- ---95% C.I. --- --- --- ---
15-24 0 0 0 0Rate* --- --- --- ---95% C.I. --- --- --- ---
25-34 2 2 0 0Rate* --- --- --- ---95% C.I. --- --- --- ---
35-44 5 2 1 2Rate* --- --- --- ---95% C.I. --- --- --- ---
45-54 18 13 2 3Rate* 1.2 1.3 --- ---95% C.I. (0.65-1.76) (0.59-1.99) --- ---
55-64 73 47 14 12Rate* 6.7 6.3 8.1 7.295% C.I. (5.15-8.22) (4.47-8.04) (3.84-12.28) (3.13-11.29)
65-74 123 82 17 24Rate* 17.2 16.6 16.0 20.895% C.I. (14.13-20.19) (12.99-20.16) (8.37-23.54) (12.46-29.08)
75-84 175 125 28 22Rate* 42.6 44.7 44.2 32.495% C.I. (36.27-48.89) (36.84-52.50) (27.84-60.60) (18.87-45.97)
85+ 78 50 13 15Rate* 82.1 82.1 74.5 90.095% C.I. (63.88-100.31) (59.37-104.90) (33.99-114.94) (44.43-135.46)
Unknown 0 0 0 0
Category
County/Region of Residence
Total
Age Group
253
RREEPPOORRTT OONN CCAANNCCEERR IINN NNEEVVAADDAA 22000000--22000044
Table 144. Urinary Bladder Cancer Mortality by County of Residence, Nevada Residents, 2000-2004
Note: The "---" is used for rates calculated on numbers less than ten. *Rates are per 100,000 population. **Rates are per 100,000 population and are age-adjusted to the 2000 US Standard population.
Table 145. Urinary Bladder Cancer Mortality by Race/Ethnicity and Gender, Nevada Residents, 2000-2004
Note: The "---" is used for rates calculated on numbers less than ten. *Rates are per 100,000 population and are age-adjusted to the 2000 US Standard population.
Rate 95% C.I. Rate 95% C.I.
Carson City 22 8.6 (5.0-12.2) 7.3 (4.5-11.1)Churchill 4 --- --- --- ---Clark 321 4.2 (3.7-4.6) 5.1 (4.6-5.8)Douglas 15 6.8 (3.3-10.2) 6.2 (3.3-10.8)Elko 4 --- --- --- ---Esmeralda 0 --- --- --- ---Eureka 0 --- --- --- ---Humboldt 4 --- --- --- ---Lander 2 --- --- --- ---Lincoln 0 --- --- --- ---Lyon 14 7.1 (3.4-10.9) 6.9 (3.7-11.9)Mineral 3 --- --- --- ---Nye 7 --- --- --- ---Pershing 1 --- --- --- ---Storey 0 --- --- --- ---Washoe 75 4.2 (3.2-5.1) 5.1 (4.0-6.4)White Pine 2 --- --- --- ---Unknown 0 --- --- --- ---Total 474 4.3 (3.9-4.7) 5.1 (4.7-5.6)
County of Residence
at Diagnosis
2000-2004 Mortality
Cases Rate* Age-Adjusted Rate**
Male Female Other/Unknown Total
White Incidence 314 118 0 432Rate* 9.1 2.8 --- 5.595% C.I. (8.1-10.3) (2.3-3.4) --- (5.0-6.1)
Black Incidence 10 6 0 16Rate* 5.5 --- --- 3.595% C.I. (2.3-12.5) --- --- (2.0-6.2)Incidence 2 1 0 3Rate* --- --- --- ---95% C.I. --- --- --- ---
Asian Incidence 5 3 0 8Rate* --- --- --- ---95% C.I. --- --- --- ---
Hispanic Incidence 8 6 0 14Rate* --- --- --- 3.595% C.I. --- --- --- (1.8-6.4)
Other/Unknown 0 1 0 1Total Incidence 339 135 0 474
Rate* 8.5 2.7 --- 5.195% C.I. (7.5-9.5) (2.2-3.2) --- (4.7-5.6)
Gender
Native American
Race/Ethnicity
254
RREEPPOORRTT OONN CCAANNCCEERR IINN NNEEVVAADDAA 22000000--22000044
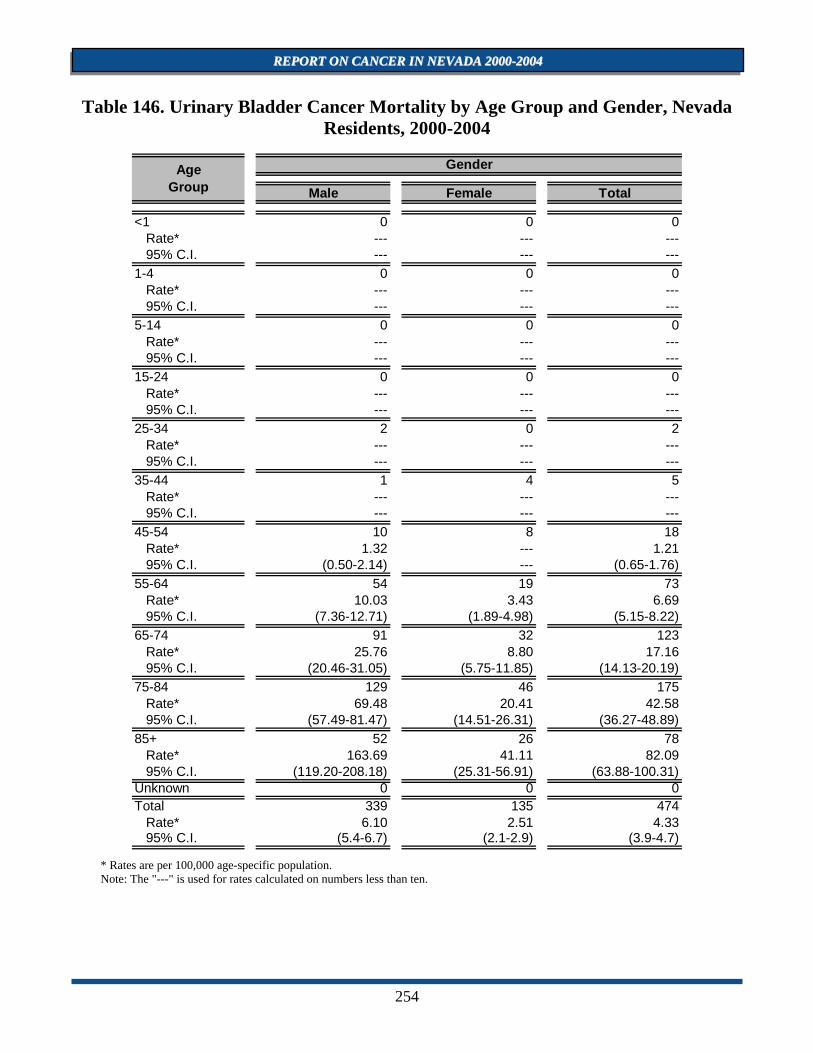
Table 146. Urinary Bladder Cancer Mortality by Age Group and Gender, Nevada Residents, 2000-2004
* Rates are per 100,000 age-specific population. Note: The "---" is used for rates calculated on numbers less than ten.
Male Female Total
<1 0 0 0Rate* --- --- ---95% C.I. --- --- ---
1-4 0 0 0Rate* --- --- ---95% C.I. --- --- ---
5-14 0 0 0Rate* --- --- ---95% C.I. --- --- ---
15-24 0 0 0Rate* --- --- ---95% C.I. --- --- ---
25-34 2 0 2Rate* --- --- ---95% C.I. --- --- ---
35-44 1 4 5Rate* --- --- ---95% C.I. --- --- ---
45-54 10 8 18Rate* 1.32 --- 1.2195% C.I. (0.50-2.14) --- (0.65-1.76)
55-64 54 19 73Rate* 10.03 3.43 6.6995% C.I. (7.36-12.71) (1.89-4.98) (5.15-8.22)
65-74 91 32 123Rate* 25.76 8.80 17.1695% C.I. (20.46-31.05) (5.75-11.85) (14.13-20.19)
75-84 129 46 175Rate* 69.48 20.41 42.5895% C.I. (57.49-81.47) (14.51-26.31) (36.27-48.89)
85+ 52 26 78Rate* 163.69 41.11 82.0995% C.I. (119.20-208.18) (25.31-56.91) (63.88-100.31)
Unknown 0 0 0Total 339 135 474
Rate* 6.10 2.51 4.3395% C.I. (5.4-6.7) (2.1-2.9) (3.9-4.7)
AgeGroup
Gender
255
RREEPPOORRTT OONN CCAANNCCEERR IINN NNEEVVAADDAA 22000000--22000044
Table 147. Median Age at Death from Urinary Bladder Cancer by Race/Ethnicity and Gender, Nevada Residents, 2000-2004
Note: Those cases of other/unknown gender and/or unknown ages are not included in this table. The median age was not calculated for those numbers less than five.
Cases Median Age Cases Median
Age Cases Median Age
White 314 76.0 118 75.5 432 76.0
Black 10 74.5 6 69.5 16 73.0
Native American 2 --- 1 --- 3 ---
Asian 5 70.0 3 --- 8 67.0
Hispanic 8 80.5 6 82.0 14 80.5
Other/Unknown 0 --- 1 --- 1 ---
Total 339 76.0 135 76.0 474 76.0
Race/Ethnicity
Gender
Male Female Total
256
RREEPPOORRTT OONN CCAANNCCEERR IINN NNEEVVAADDAA 22000000--22000044
SURVIVAL RATE
Figure 99. Survival Rates for Urinary Bladder Cancer by Race/Ethnicity, Nevada Residents, 2000-2004
Notes: The survival rate for those racial/ethnic groups not included in this chart could not be calculated due to small cell size.
Figure 100. Survival Rates for Urinary Bladder Cancer by Stage of Cancer at Diagnosis, Nevada Residents, 2000-2004
88.3%
73.0%
0.0%
10.0%
20.0%
30.0%
40.0%
50.0%
60.0%
70.0%
80.0%
90.0%
100.0%
1-Year 2-Years 3-Years 4-Years 5-YearsPeriod of Time
Cau
se S
peci
fic S
urvi
val R
ate
Total
White
Black
73.0%
88.3%
0.0%
20.0%
40.0%
60.0%
80.0%
100.0%
1-Year 2-Years 3-Years 4-Years 5-YearsPeriod of Time
Cau
se S
peci
fic S
urvi
val R
ate
Total
In situ
Localized
Regional
Distant
Unstaged
257
RREEPPOORRTT OONN CCAANNCCEERR IINN NNEEVVAADDAA 22000000--22000044
Table 148. Cause-Specific Survival Rates for Urinary Bladder Cancer by
Race/Ethnicity and Gender, Nevada Residents, 2000-2004
Notes: 1) The "---" indicates that survival rate could not be calculated due to small cell size. Caution should be used when interpreting survival rates based upon categories with a small number of cases. 2) Those cases where the gender and/or race/ethnicity were other/unknown, are not shown separately, but are included in the category totals. 3) These rates may not be directly comparable to national rates because of different methodologies. Caution should be used when trying to compare rates for Nevada and the nation. For more information on the calculation of survival rates, please refer to Technical Notes section.
One Year
Two Years
ThreeYears
FourYears
FiveYears
Total 2,031 88.3% 82.7% 79.0% 76.7% 73.0% > 5 YEARS
Male 1,561 89.5% 84.4% 80.2% 77.9% 73.6% > 5 YEARS
Female 470 84.5% 76.7% 75.0% 73.0% 71.0% > 5 YEARS
Race/Ethnicity
White 1,821 88.2% 82.5% 78.8% 76.5% 73.0% > 5 YEARS
Male 1,394 89.2% 84.0% 79.7% 77.4% 73.3% > 5 YEARS
Female 427 84.8% 77.7% 75.9% 73.7% 71.6% > 5 YEARS
Black 52 83.5% 68.6% 62.0% 56.6% 40.5% 4.41
Male 40 --- --- --- --- --- .
Female 12 --- --- --- --- --- .
Native American 3 --- --- --- --- --- .
Male 2 --- --- --- --- --- .
Female 1 --- --- --- --- --- .
Asian 28 --- --- --- --- --- .
Male 20 --- --- --- --- --- .
Female 8 --- --- --- --- --- .
Hispanic 62 89.7% 87.6% 87.6% 87.6% 87.6% > 5 YEARS
Male 54 92.0% 89.5% 89.5% 89.5% 89.5% > 5 YEARS
Female 8 --- --- --- --- --- .
Race/Ethnicity
and Gender
Number of Cases
Cause Specific Survival RateMedian
Survival Time (years)
258
RREEPPOORRTT OONN CCAANNCCEERR IINN NNEEVVAADDAA 22000000--22000044
Table 149. Cause-Specific Survival Rates for Urinary Bladder Cancer by Stage of
Cancer at Diagnosis and Gender, Nevada Residents, 2000-2004
Notes: 1) The "---" indicates that survival rate could not be calculated due to small cell size. Caution should be used when interpreting survival rates based upon categories with a small number of cases. 2) These rates may not be directly comparable to national rates because of different methodologies. Caution should be used when trying to compare rates for Nevada and the nation. For more information on the calculation of survival rates, please refer to Technical Notes section.
Total Male Female
Total Cases 2,031 1,561 470
One Year 88.3% 89.5% 84.5%
5 Years 73.0% 73.6% 71.0%Median Survival > 5 YEARS > 5 YEARS > 5 YEARS
In situ Cases 788 595 193
One Year 99.2% 99.5% 98.3%
5 Years 92.7% 92.3% 93.7%
Median Survival > 5 YEARS > 5 YEARS > 5 YEARS
Localized Cases 678 540 138
One Year 89.6% 90.0% 87.9%
5 Years 69.2% 69.2% 69.0%
Median Survival > 5 YEARS > 5 YEARS > 5 YEARS
Regional Cases 152 112 40
One Year 70.5% 75.5% ---
5 Years 34.7% 39.8% ---
Median Survival 2.17 3.02 .
Distant Cases 72 56 16
One Year 17.5% 20.7% ---
5 Years 11.2% 14.7% ---
Median Survival 0.61 0.63 .
Unstaged Cases 341 258 83
One Year 84.7% 87.6% 75.6%
5 Years 75.6% 80.1% 60.9%Median Survival > 5 YEARS > 5 YEARS > 5 YEARS
Stage at Diagnosis
Survival Rate of Stage at Diagnosis
Gender