Embed Size (px)
DESCRIPTION
UPS 2014 Corporate Sustainability Report
Citation preview
Committed to More™
UPS 2014 Corporate Sustainability Report
UPS55 Glenlake Parkway, NEAtlanta, GA 30328
ups.com/sustainability
© 2015 United Parcel Service of America, Inc. UPS, the UPS brandmark and the color brown are registered trademarks of United Parcel Service of America, Inc. All rights reserved.
UPS 2014 CORPO
RATE SUSTAINABILITY REPO
RT
P
RINTED USIN
G
100%
WIND ENERG
Y
Supplied by Community Energy

UPS is a global leader in logistics, offering a broad range of supply chain solutions including transporting packages and freight, facilitating international trade, and deploying advanced technology to more efficiently manage the world of business.
In every aspect of our business, we are Committed to More™ — helping customers pioneer more sustainable solutions, delivering packages more efficiently, creating more connections around the world, and finding more ways to take action and give back.
Our Business G4-3
Table of Contents1 Introduction
1.1 CEO Statement 31.2 2014 Headlines 61.3 Goals & Progress 81.4 Corporate Profile 10
2 Materiality & Stakeholder Engagement2.1 Materiality 142.2 Ongoing Stakeholder Engagement 21
3 Global Prosperity3.1 Economic Performance 263.2 Customer Privacy 313.3 Digital & Physical Asset Security 343.4 Disaster Relief & Resilience 363.5 Sustainable Shipping & Supply Chain Offerings 423.6 Contextual Trends 46
4 Environmental Responsibility4.1 Material Aspects 504.2 Shared Management Approach 524.3 Energy & Emissions 544.4 UPS Corporate Climate Change Statement 634.5 Fuel Supply 64
5 Empowered People5.1 The People of UPS 725.2 Shared Management Approach 745.3 Labor Relations 765.4 Workforce Diversity 805.5 Employee Health, Safety & Well-Being 845.6 Recruitment, Training & Development 89
6 Ethical Conduct6.1 Corporate Governance 966.2 Ethical Conduct 1006.3 Management of Third-Party Representatives 103
A AppendixA About this Report 106B Statement of Greenhouse Gas Emissions 108C SGS Independent Verification Statement 119D Initiatives to Reduce Greenhouse Gases 121E Enterprise Energy Performance 122F GRI G4 Content Index 125
2
Always Committed to More™
David AbneyCHIEF EXECUTIVE OFFICER
The first connections in the UPS network were made in the early
20th century, when few automobiles traveled the roads, before
the world’s first airline took flight, and decades before computers
introduced us to bits and bytes. This was also long before anyone
gave serious attention to sustainability in any shape or form.
G4-1
TODAY, THE WORLD OF TRANSPORTATION AND LOGISTICS looks vastly different. As part of a $3.2 trillion global supply chain marketplace, UPS connects people and goods to markets, enabling progress and possibility in more than 220 countries and territories around the world. Our global network includes more than 424,000 people, 100,000 vehicles, one of the world’s largest airlines, and innovative analytic and optimization capabilities. But among the most important changes in our business over the years has been a conscientious approach to sustainability.
I am proud to say that UPS is at the forefront of companies in our industry working to address sustainability challenges in the most efficient and responsible ways possible. As we expand our global reach, we also expand our environmental and social impacts. Through the unmatched power of our people and network, we are addressing the sustainability impacts throughout our own business and customers’ supply chains, as well as the big challenges facing the planet and our communities.
3
1.1 | CEO Statement
The evidence is clear that global trade is a powerful force for good, promoting economic growth, creating jobs, and lifting people out of poverty. Among our largest challenges is balancing the benefits of global trade and growth with the reality of increasingly constrained resources. Through our focus on innovation, we bring efficiencies and solutions to every aspect of our business. In 2014, we continued to transform our network, once again increasing the number of packages delivered for our customers while emitting fewer greenhouse gases per package. We also made significant advances in our alternative fuel and advanced technology fleet, logging 154 million more miles and surpassing 500 million miles since 2000. With ongoing investments, I’m confident we will reach our goal of driving 1 billion miles in our specialized fleet by the end of 2017.
Rapid urbanization is also presenting challenges for business models and supply chains. Today, half of the world’s population is concentrated in urban areas and, by some estimates, two-thirds of all people will live in cities by 2050. This growth will usher an influx of middle-class consumers, especially in emerging markets. A surge in demand for goods and services will create logistical
and environmental challenges that will necessitate economically feasible and sustainable solutions.
To support this growth in a more sustainable way, we’re expanding innovative solutions such as UPS Access Point™ locations and UPS My Choice™ so we can deliver packages when, where, and how consumers want them, while also minimizing our environmental impacts. We also collaborate with customers, governments, and other stakeholders to develop smarter transportation systems and mobility options and to push for more agile city infrastructure to handle this growth.
Communities around the world continue to be affected by natural and human-caused disasters. During these times of need, we leverage our global logistics network and expertise of our people to deliver help through our humanitarian relief efforts. In addition to providing immediate relief, we also focus on building resiliency in communities so they can withstand and recover more quickly from future disasters. In 2014, we coordinated 263 shipments across 43 countries impacted by the Ebola epidemic, the Syrian refugee crisis, and severe weather events in the Philippines and U.S.
None of this would be possible without the contributions of the many UPSers who support our sustainability commitment on a daily basis. Building on our legacy of giving back, we announced an ambitious goal in 2014 to volunteer 20 million hours in our communities by the end of 2020. These efforts of UPS employees and retirees is expected to translate into nearly a half-billion dollars in economic impact.
At UPS, we view challenges as hurdles to overcome and opportunities to seize. Sustainability is both a challenge and an opportunity. I am proud of the advancements we made in 2014, which you will read more about in this report. I am also ever mindful that, to create value, we must continue to adapt and innovate as we invest in the future of our business, our planet and our communities.
David AbneyCHIEF EXECUTIVE OFFICER
Dow Jones Sustainability Indices | World and North AmericaUPS was selected as a constituent of the Dow Jones Sustainability World Index for the second consecutive year and was included on the North America Index for the 10th consecutive year.
Global Reporting Initiative | G4 ComprehensiveUPS was among the first major corporations in the U.S. to report at the “Comprehensive” level of the recently introduced G4 and continues to improve reporting transparency.
Recognition for Responsibility & Reporting U.S. Environmental Protection Agency | Climate Leadership AwardThe award acknowledges the voluntary work UPS did in 2014 to reduce GHG emissions and build resilience to climate change.
CR Magazine | “100 Best Corporate Citizens”UPS was named one of CR Magazine’s “100 Best Corporate Citizens” for the fifth consecutive year.
Interbrand | “Best Global Green Brands,” “Best Global Brands”Interbrand ranked UPS among its “Best Global Green Brands” for the fourth consecutive year, and we were also included on the list of Interbrand’s “Best Global Brands” for the 10th consecutive year.
Ethisphere Institute | “World’s Most Ethical Companies”For the eighth consecutive year, UPS was one of the “World’s Most Ethical Companies,” recognized by Ethisphere Institute for the quality of ethics and compliance programs.
FORTUNE Magazine | “World’s Most Admired Companies”UPS was again voted by businesspeople as one of the “World’s Most Admired Companies” according to FORTUNE Magazine. UPS has been on this list for more than 20 years.
The Civic 50 | Most Community-Minded CompaniesThe Civic 50 recognized UPS as the top community-minded company in the industrial category.
1.1 | CEO Statement
4
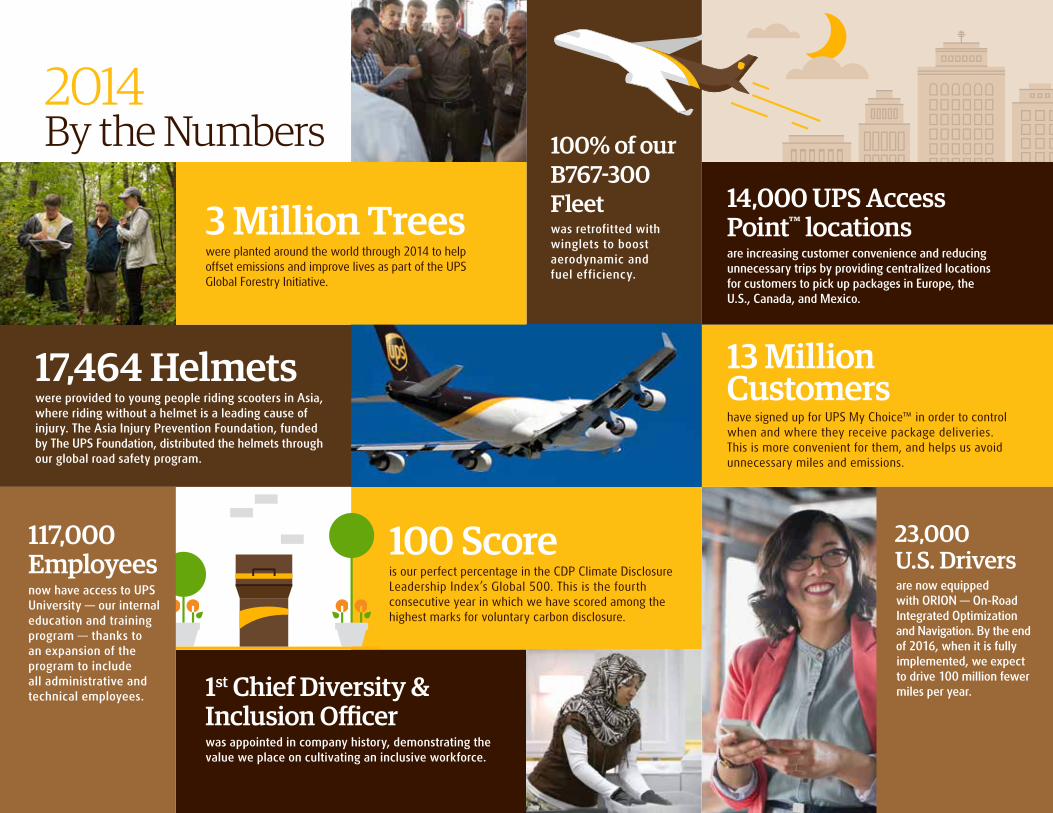
2014 By the Numbers
100 Scoreis our perfect percentage in the CDP Climate Disclosure Leadership Index’s Global 500. This is the fourth consecutive year in which we have scored among the highest marks for voluntary carbon disclosure.
3 Million Treeswere planted around the world through 2014 to help offset emissions and improve lives as part of the UPS Global Forestry Initiative.
17,464 Helmetswere provided to young people riding scooters in Asia, where riding without a helmet is a leading cause of injury. The Asia Injury Prevention Foundation, funded by The UPS Foundation, distributed the helmets through our global road safety program.
13 Million Customershave signed up for UPS My Choice™ in order to control when and where they receive package deliveries. This is more convenient for them, and helps us avoid unnecessary miles and emissions.
117,000 Employees now have access to UPS University — our internal education and training program — thanks to an expansion of the program to include all administrative and technical employees. 1st Chief Diversity &
Inclusion Officerwas appointed in company history, demonstrating the value we place on cultivating an inclusive workforce.
100% of our B767-300 Fleetwas retrofitted with winglets to boost aerodynamic and fuel efficiency.
23,000 U.S. Driversare now equipped with ORION — On-Road Integrated Optimization and Navigation. By the end of 2016, when it is fully implemented, we expect to drive 100 million fewer miles per year.
14,000 UPS Access Point™ locationsare increasing customer convenience and reducing unnecessary trips by providing centralized locations for customers to pick up packages in Europe, the U.S., Canada, and Mexico.
Our most significant areas of progress during the past year2014 Headlines
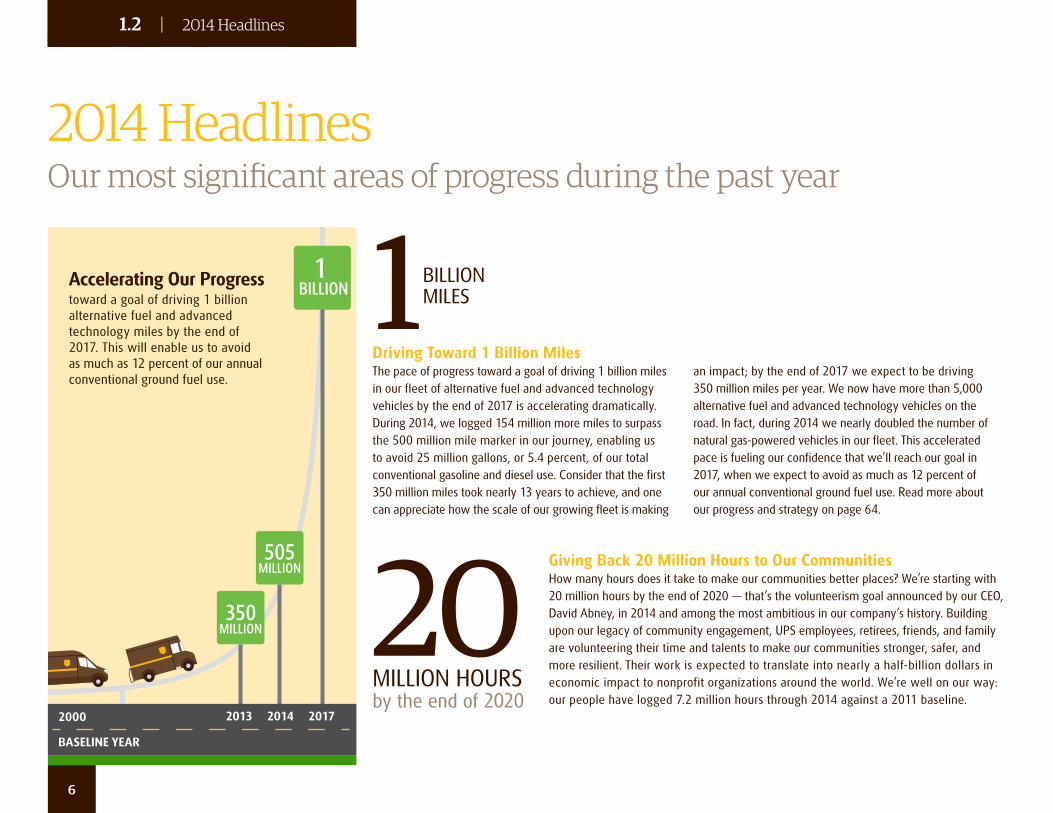
Giving Back 20 Million Hours to Our CommunitiesHow many hours does it take to make our communities better places? We’re starting with 20 million hours by the end of 2020 — that’s the volunteerism goal announced by our CEO, David Abney, in 2014 and among the most ambitious in our company’s history. Building upon our legacy of community engagement, UPS employees, retirees, friends, and family are volunteering their time and talents to make our communities stronger, safer, and more resilient. Their work is expected to translate into nearly a half-billion dollars in economic impact to nonprofit organizations around the world. We’re well on our way: our people have logged 7.2 million hours through 2014 against a 2011 baseline.
20MILLION HOURSby the end of 2020
1BILLION MILES
Driving Toward 1 Billion MilesThe pace of progress toward a goal of driving 1 billion miles in our fleet of alternative fuel and advanced technology vehicles by the end of 2017 is accelerating dramatically. During 2014, we logged 154 million more miles to surpass the 500 million mile marker in our journey, enabling us to avoid 25 million gallons, or 5.4 percent, of our total conventional gasoline and diesel use. Consider that the first 350 million miles took nearly 13 years to achieve, and one can appreciate how the scale of our growing fleet is making
an impact; by the end of 2017 we expect to be driving 350 million miles per year. We now have more than 5,000 alternative fuel and advanced technology vehicles on the road. In fact, during 2014 we nearly doubled the number of natural gas-powered vehicles in our fleet. This accelerated pace is fueling our confidence that we’ll reach our goal in 2017, when we expect to avoid as much as 12 percent of our annual conventional ground fuel use. Read more about our progress and strategy on page 64.
Accelerating Our Progresstoward a goal of driving 1 billion alternative fuel and advanced technology miles by the end of 2017. This will enable us to avoid as much as 12 percent of our annual conventional ground fuel use.
350MILLION
1 BILLION
505MILLION
2017 2013 2014 2000
BASELINE YEAR
1.2 | 2014 Headlines
6
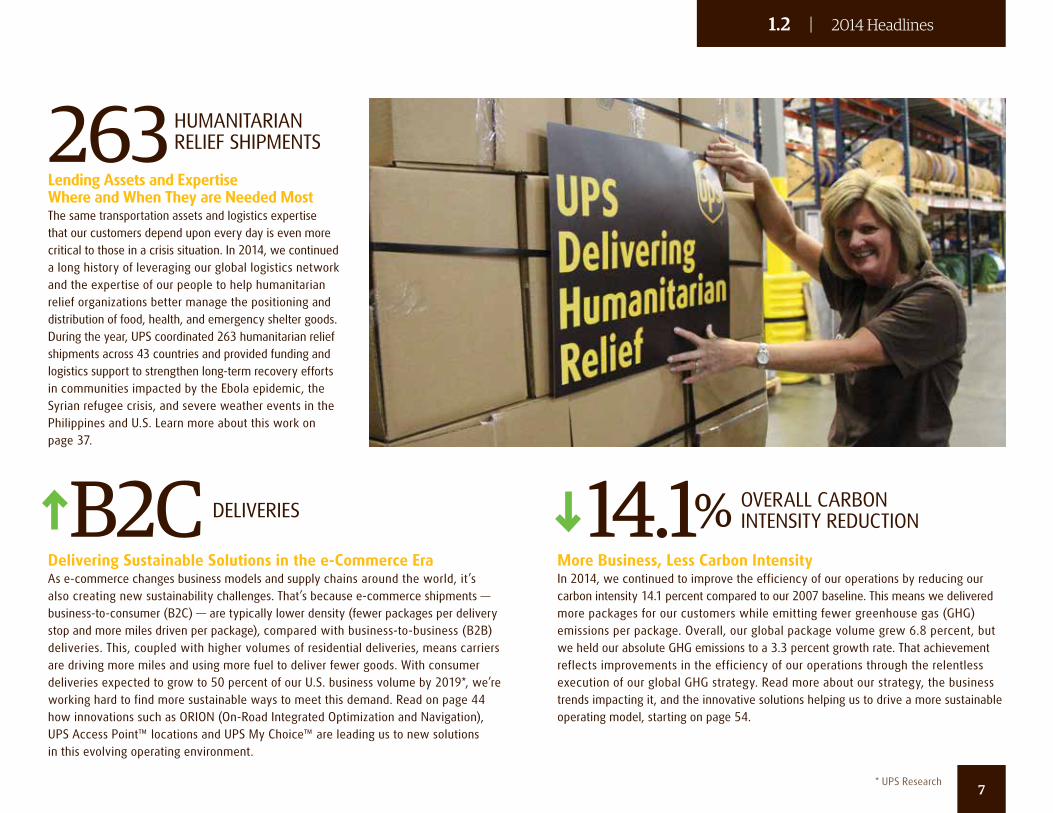
Lending Assets and Expertise Where and When They are Needed Most The same transportation assets and logistics expertise that our customers depend upon every day is even more critical to those in a crisis situation. In 2014, we continued a long history of leveraging our global logistics network and the expertise of our people to help humanitarian relief organizations better manage the positioning and distribution of food, health, and emergency shelter goods. During the year, UPS coordinated 263 humanitarian relief shipments across 43 countries and provided funding and logistics support to strengthen long-term recovery efforts in communities impacted by the Ebola epidemic, the Syrian refugee crisis, and severe weather events in the Philippines and U.S. Learn more about this work on page 37.
263 HUMANITARIAN RELIEF SHIPMENTS
Delivering Sustainable Solutions in the e-Commerce EraAs e-commerce changes business models and supply chains around the world, it’s also creating new sustainability challenges. That’s because e-commerce shipments — business-to-consumer (B2C) — are typically lower density (fewer packages per delivery stop and more miles driven per package), compared with business-to-business (B2B) deliveries. This, coupled with higher volumes of residential deliveries, means carriers are driving more miles and using more fuel to deliver fewer goods. With consumer deliveries expected to grow to 50 percent of our U.S. business volume by 2019*, we’re working hard to find more sustainable ways to meet this demand. Read on page 44 how innovations such as ORION (On-Road Integrated Optimization and Navigation), UPS Access Point™ locations and UPS My Choice™ are leading us to new solutions in this evolving operating environment.
More Business, Less Carbon IntensityIn 2014, we continued to improve the efficiency of our operations by reducing our carbon intensity 14.1 percent compared to our 2007 baseline. This means we delivered more packages for our customers while emitting fewer greenhouse gas (GHG) emissions per package. Overall, our global package volume grew 6.8 percent, but we held our absolute GHG emissions to a 3.3 percent growth rate. That achievement reflects improvements in the efficiency of our operations through the relentless execution of our global GHG strategy. Read more about our strategy, the business trends impacting it, and the innovative solutions helping us to drive a more sustainable operating model, starting on page 54.
14.1% OVERALL CARBON INTENSITY REDUCTIONB2C DELIVERIES
* UPS Research
1.2 | 2014 Headlines
7
9.26
2011
8.89
2012
9.19
2013
9.96
2014
9.00
9.00
2016GOAL Similar to Lost-Time Injury Frequency,
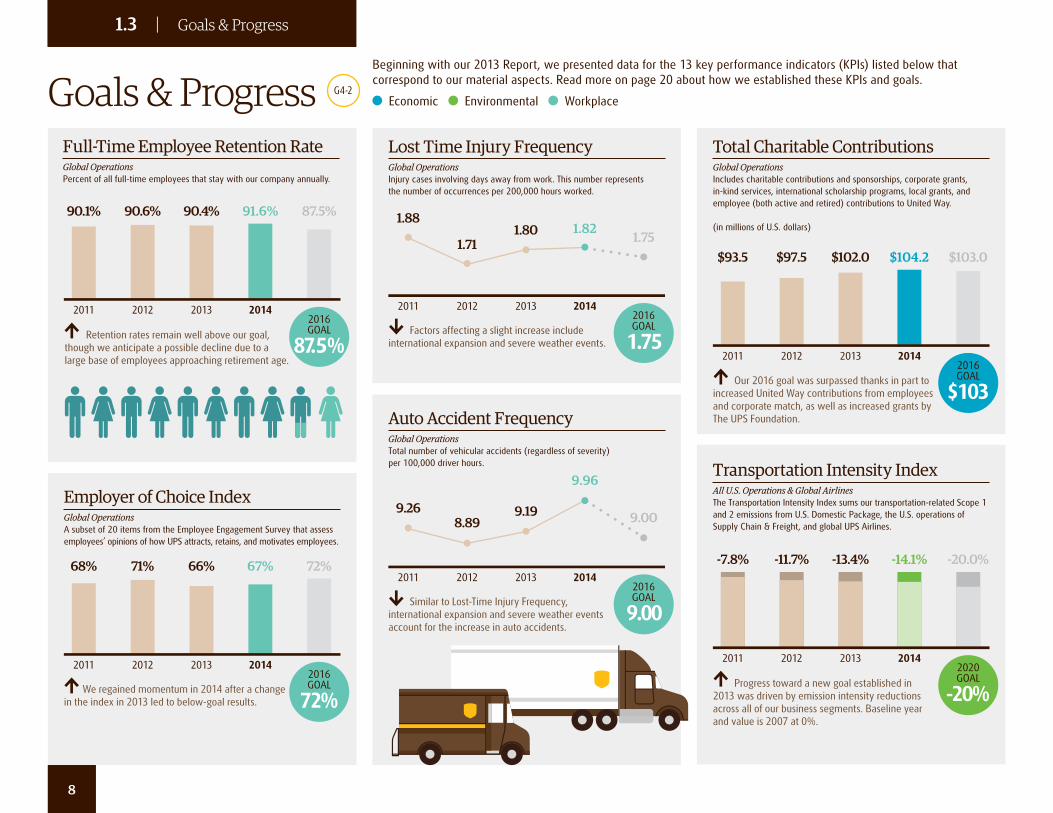
international expansion and severe weather events account for the increase in auto accidents.
90.1%
2011
90.6%
2012
90.4%
2013
91.6%
2014
87.5%
87.5%
2016GOAL Retention rates remain well above our goal,
though we anticipate a possible decline due to a large base of employees approaching retirement age.
1.88
2011
1.71
2012
1.80
2013
1.82
2014 2016
GOAL
1.75
1.75
Factors affecting a slight increase include international expansion and severe weather events.
$93.5
2011
$97.5
2012
$102.0
2013
$104.2
2014 2016
GOAL
$103
$103.0
Our 2016 goal was surpassed thanks in part to increased United Way contributions from employees and corporate match, as well as increased grants by The UPS Foundation.
-7.8%
2011
-11.7%
2012
-13.4%
2013
-14.1%
2014 2020
GOAL
-20%
-20.0%
Progress toward a new goal established in 2013 was driven by emission intensity reductions across all of our business segments. Baseline year and value is 2007 at 0%.
68%
2011
71%
2012
66%
2013
67%
2014
72%
72%
2016GOAL We regained momentum in 2014 after a change
in the index in 2013 led to below-goal results.
Lost Time Injury FrequencyGlobal OperationsInjury cases involving days away from work. This number represents the number of occurrences per 200,000 hours worked.
Auto Accident FrequencyGlobal OperationsTotal number of vehicular accidents (regardless of severity) per 100,000 driver hours. Transportation Intensity Index
All U.S. Operations & Global AirlinesThe Transportation Intensity Index sums our transportation-related Scope 1 and 2 emissions from U.S. Domestic Package, the U.S. operations of Supply Chain & Freight, and global UPS Airlines.
Full-Time Employee Retention Rate Global Operations Percent of all full-time employees that stay with our company annually.
Employer of Choice IndexGlobal OperationsA subset of 20 items from the Employee Engagement Survey that assess employees’ opinions of how UPS attracts, retains, and motivates employees.
Goals & ProgressTotal Charitable ContributionsGlobal OperationsIncludes charitable contributions and sponsorships, corporate grants, in-kind services, international scholarship programs, local grants, and employee (both active and retired) contributions to United Way. (in millions of U.S. dollars)
G4-2
Beginning with our 2013 Report, we presented data for the 13 key performance indicators (KPIs) listed below that correspond to our material aspects. Read more on page 20 about how we established these KPIs and goals.
Economic Environmental Workplace
8
1.3 | Goals & Progress
28.78
2011
27.60
2012
27.28
2013
26.79
2014
3.092.94 2.91 2.90
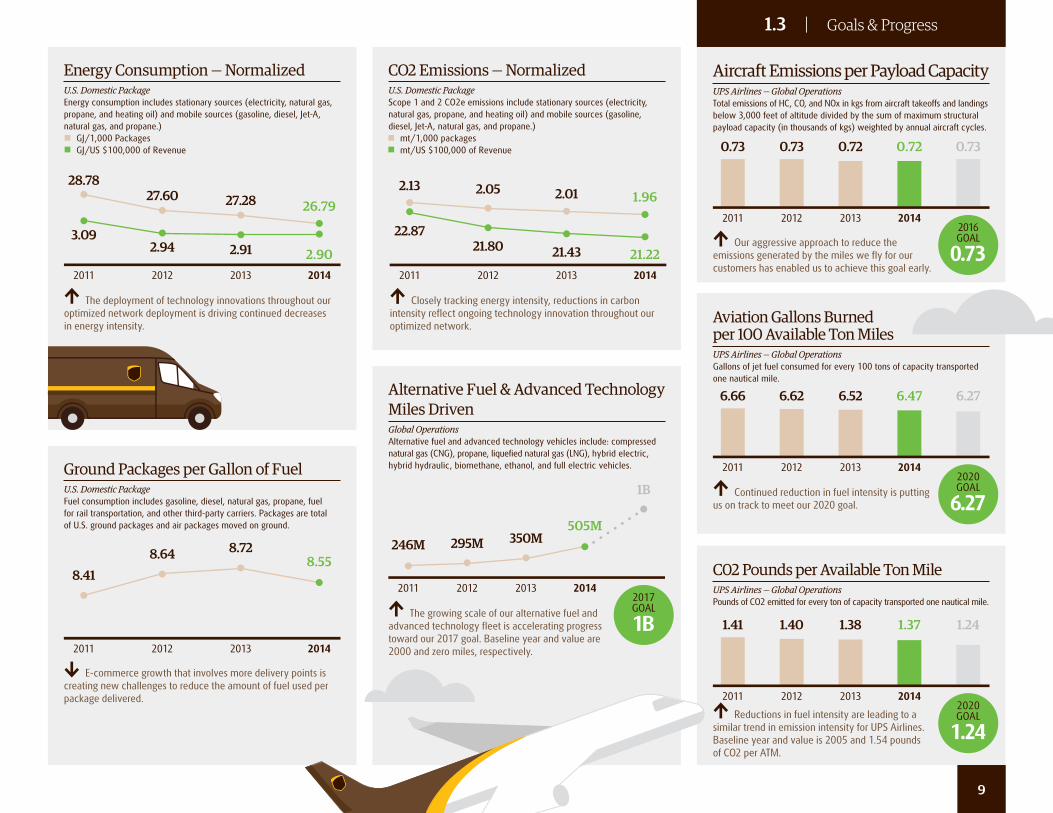
The deployment of technology innovations throughout our optimized network deployment is driving continued decreases in energy intensity.
246M
2011
295M
2012
350M
2013
505M
2014 2017
GOAL
1B
1B
The growing scale of our alternative fuel and advanced technology fleet is accelerating progress toward our 2017 goal. Baseline year and value are 2000 and zero miles, respectively.
Alternative Fuel & Advanced Technology Miles DrivenGlobal OperationsAlternative fuel and advanced technology vehicles include: compressed natural gas (CNG), propane, liquefied natural gas (LNG), hybrid electric, hybrid hydraulic, biomethane, ethanol, and full electric vehicles.
0.73
2011
0.73
2012
0.72
2013
0.72
2014 2016
GOAL
0.73
0.73
Our aggressive approach to reduce the emissions generated by the miles we fly for our customers has enabled us to achieve this goal early.
Aircraft Emissions per Payload CapacityUPS Airlines — Global OperationsTotal emissions of HC, CO, and NOx in kgs from aircraft takeoffs and landings below 3,000 feet of altitude divided by the sum of maximum structural payload capacity (in thousands of kgs) weighted by annual aircraft cycles.
6.66
2011
6.62
2012
6.52
2013
6.47
2014 2020
GOAL
6.27
6.27
Continued reduction in fuel intensity is putting us on track to meet our 2020 goal.
Aviation Gallons Burned per 100 Available Ton MilesUPS Airlines — Global Operations Gallons of jet fuel consumed for every 100 tons of capacity transported one nautical mile.
1.41
2011
1.40
2012
1.38
2013
1.37
2014 2020
GOAL
1.24
1.24
Reductions in fuel intensity are leading to a similar trend in emission intensity for UPS Airlines. Baseline year and value is 2005 and 1.54 pounds of CO2 per ATM.
C02 Pounds per Available Ton MileUPS Airlines — Global OperationsPounds of CO2 emitted for every ton of capacity transported one nautical mile.
2.13
2011
2.05
2012
2.01
2013
1.96
22.8721.80 21.43 21.22
2014
Closely tracking energy intensity, reductions in carbon intensity reflect ongoing technology innovation throughout our optimized network.
CO2 Emissions — NormalizedU.S. Domestic Package Scope 1 and 2 CO2e emissions include stationary sources (electricity, natural gas, propane, and heating oil) and mobile sources (gasoline, diesel, Jet-A, natural gas, and propane.)
mt/1,000 packagesmt/US $100,000 of Revenue
Energy Consumption — NormalizedU.S. Domestic Package Energy consumption includes stationary sources (electricity, natural gas, propane, and heating oil) and mobile sources (gasoline, diesel, Jet-A, natural gas, and propane.)
GJ/1,000 PackagesGJ/US $100,000 of Revenue
2011 2012 2013
8.418.64 8.72
8.55
2014
E-commerce growth that involves more delivery points is creating new challenges to reduce the amount of fuel used per package delivered.
Ground Packages per Gallon of FuelU.S. Domestic Package Fuel consumption includes gasoline, diesel, natural gas, propane, fuel for rail transportation, and other third-party carriers. Packages are total of U.S. ground packages and air packages moved on ground.
9
1.3 | Goals & Progress
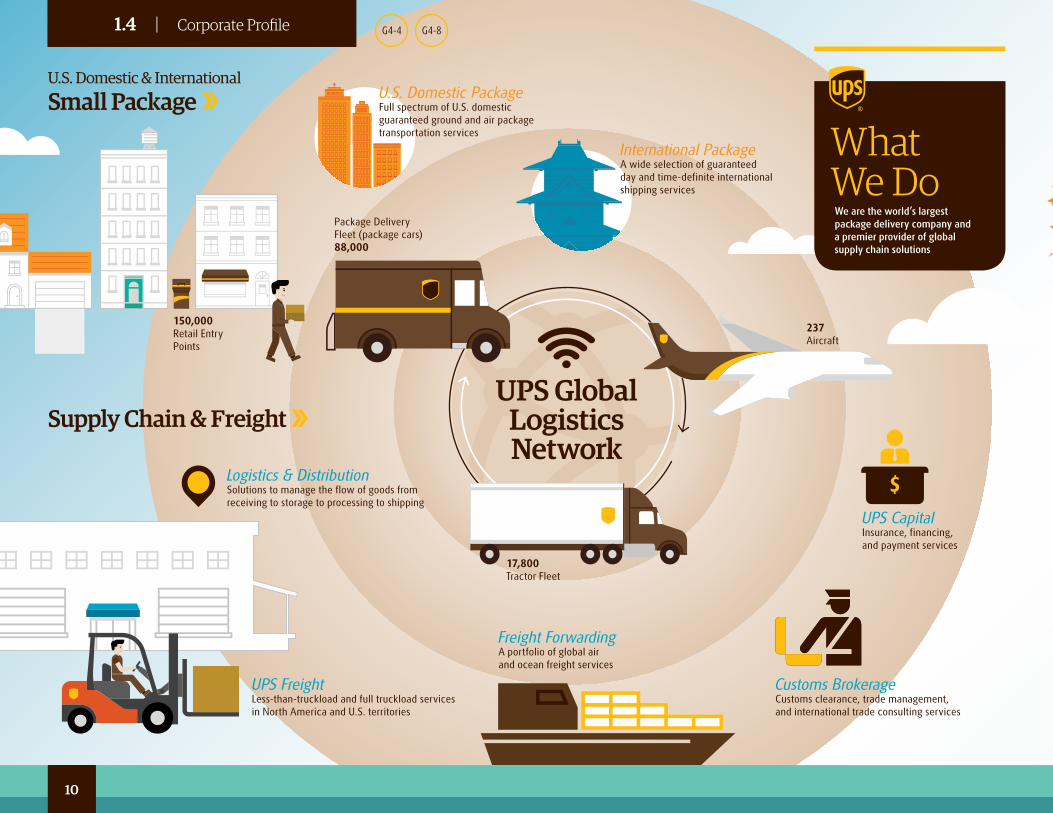
U.S. Domestic & International
Small Package
237 Aircraft
17,800 Tractor Fleet
Package Delivery Fleet (package cars)88,000
150,000 Retail Entry Points
Freight ForwardingA portfolio of global air and ocean freight services
Customs BrokerageCustoms clearance, trade management, and international trade consulting services
UPS FreightLess-than-truckload and full truckload services in North America and U.S. territories
UPS CapitalInsurance, financing, and payment services
Supply Chain & Freight
Logistics & DistributionSolutions to manage the flow of goods from receiving to storage to processing to shipping
$
U.S. Domestic PackageFull spectrum of U.S. domestic guaranteed ground and air package transportation services
UPS Global Logistics Network
International PackageA wide selection of guaranteed day and time-definite international shipping services
G4-4 G4-8
10
What We DoWe are the world’s largest package delivery company and a premier provider of global supply chain solutions
1.4 | Corporate Profile
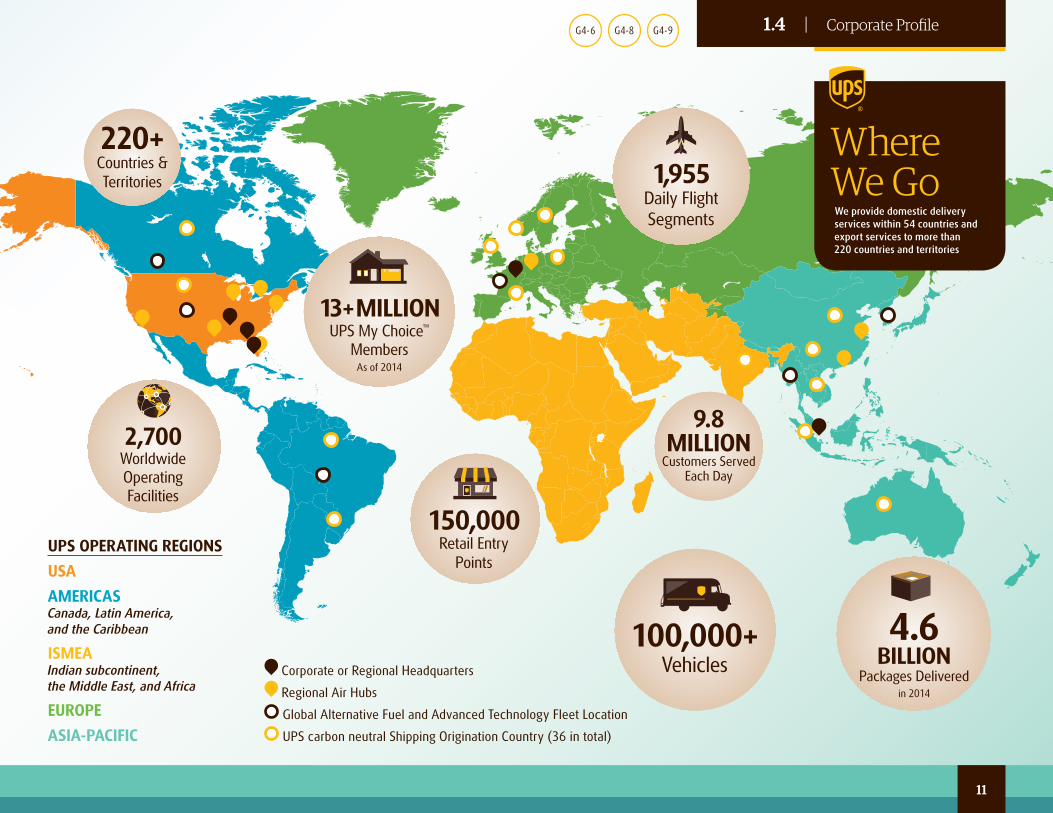
Corporate or Regional Headquarters
Regional Air Hubs
Global Alternative Fuel and Advanced Technology Fleet Location
UPS carbon neutral Shipping Origination Country (36 in total)
UPS OPERATING REGIONS
USA
AMERICASCanada, Latin America, and the Caribbean
ISMEAIndian subcontinent, the Middle East, and Africa
EUROPE
ASIA-PACIFIC
220+ Countries & Territories
9.8MILLION
Customers Served Each Day
13+ MILLIONUPS My Choice™
Members As of 2014
150,000Retail Entry
Points
2,700 Worldwide Operating Facilities
100,000+ Vehicles
1,955 Daily Flight Segments
4.6 BILLION
Packages Delivered in 2014
Where We GoWe provide domestic delivery services within 54 countries and export services to more than 220 countries and territories
G4-6 G4-8 G4-9
11
1.4 | Corporate Profile

02Committed to More™
Materiality & Stakeholder Engagement
12
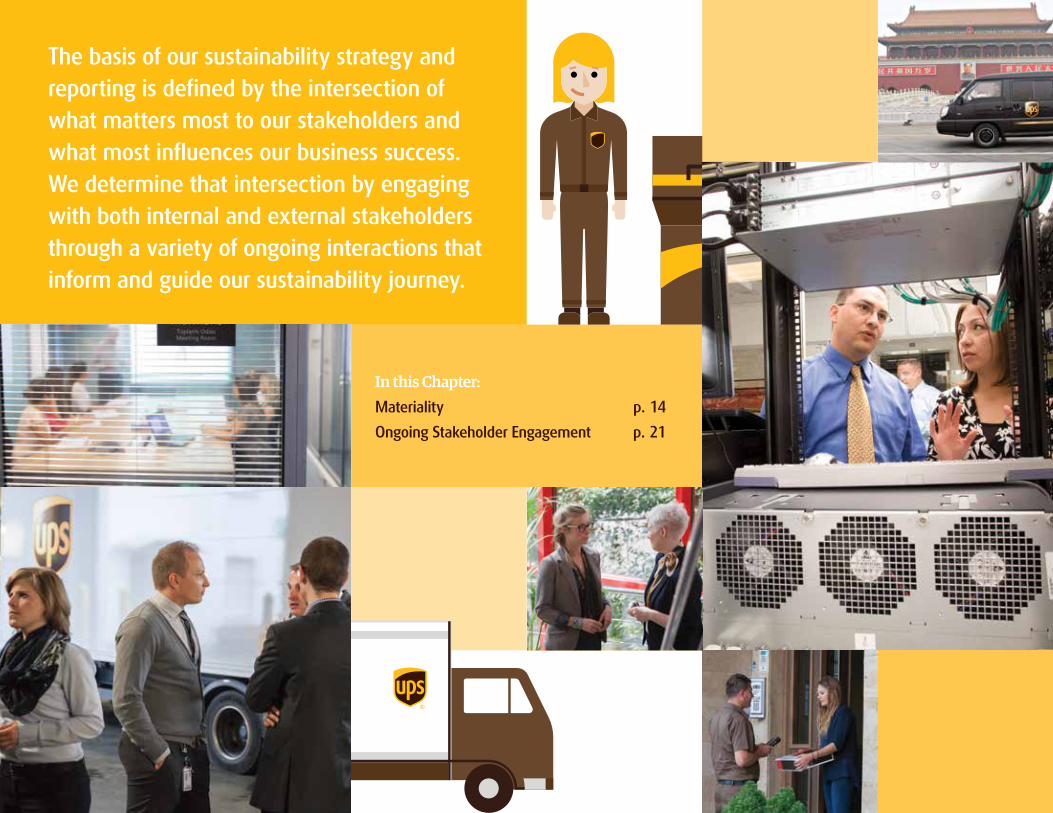
In this Chapter:Materiality p. 14
Ongoing Stakeholder Engagement p. 21
The basis of our sustainability strategy and reporting is defined by the intersection of what matters most to our stakeholders and what most influences our business success. We determine that intersection by engaging with both internal and external stakeholders through a variety of ongoing interactions that inform and guide our sustainability journey.

FROM DRIVING A PACKAGE CAR THROUGH rural Tennessee to setting environmental strategies for UPS Airlines, I’ve had the privilege of looking at the UPS network from many different angles during the past 25 years. As a career UPSer, I’ve seen first-hand how advancements in technology and trends in global commerce have helped shape our network.
Now, as part of the global sustainability team, I have yet another lens through which to view the UPS network. From this vantage point, our team has the opportunity to help evolve the network even further by creating a sustainability vision for the future that supports UPS’s business strategy.
For UPS, sustainability begins with efficiency — one of the primary levers of our business model. When we’re more efficient, we’re more sustainable and we’re more profitable. It’s hard to think of many businesses where these two goals are more compatible. The challenge, however, is to find ways to improve efficiencies as we continue to grow our business.
We’ve been successful over the past decade, primarily by leveraging our expertise in engineering, logistics, and technology. This success has led to innovating big data solutions such as our ORION software (On-Road Integrated Optimization and Navigation) that helps us plan more efficient routes; enhancing our air fleet through more fuel-efficient equipment; and building a diversified fleet of alternative fuel and advanced technology vehicles. Using this rolling laboratory, we collaborate with our suppliers to test fuel and technology solutions in real environments, then scale up the solutions that work best.
These initiatives will continue to enable us to progress toward reducing our environmental impacts. But looking ahead, I believe it’s clear that we will need to rely as
heavily on social drivers of progress as we have on scientific ones in the past. Simply put, we have to start putting the power of our people to work as well.
We must take a more global approach, so employees in every region around the world understand the levers of sustainability. It also must encompass more organizational depth so that employees have a clear understanding of how their function contributes to our progress. And, we have to leverage the social networks within UPS, such as Business Resource Groups and The UPS Foundation, to connect the great work everyone is doing.
We’re implementing a number of initiatives to put this approach into action. Currently, we’re developing a 2020 sustainability vision and roadmap to guide our efforts over the next five years. We’re also finding ways to better connect our sustainability strategy with our workforce through programs such as the UPS Sustainability Ambassadors and local Green Teams at UPS Airlines’ headquarters in Louisville.
By engaging and empowering our internal networks, as well as continuing to leverage our logistics expertise in innovative ways, we’re betting that the same dynamics that deliver big wins for our customers every day can do the same for our vision of sustainability in the future.
Executive Statement Rhonda Clark
CHIEF SUSTAINABILITY OFFICER & VICE PRESIDENT OF ENVIRONMENTAL AFFAIRS
“When we’re more efficient, we’re more
sustainable and we’re more profitable. It’s
hard to think of many businesses where
these two goals are more compatible.”
14
2.1 | Materiality
Materiality Assessment
Process
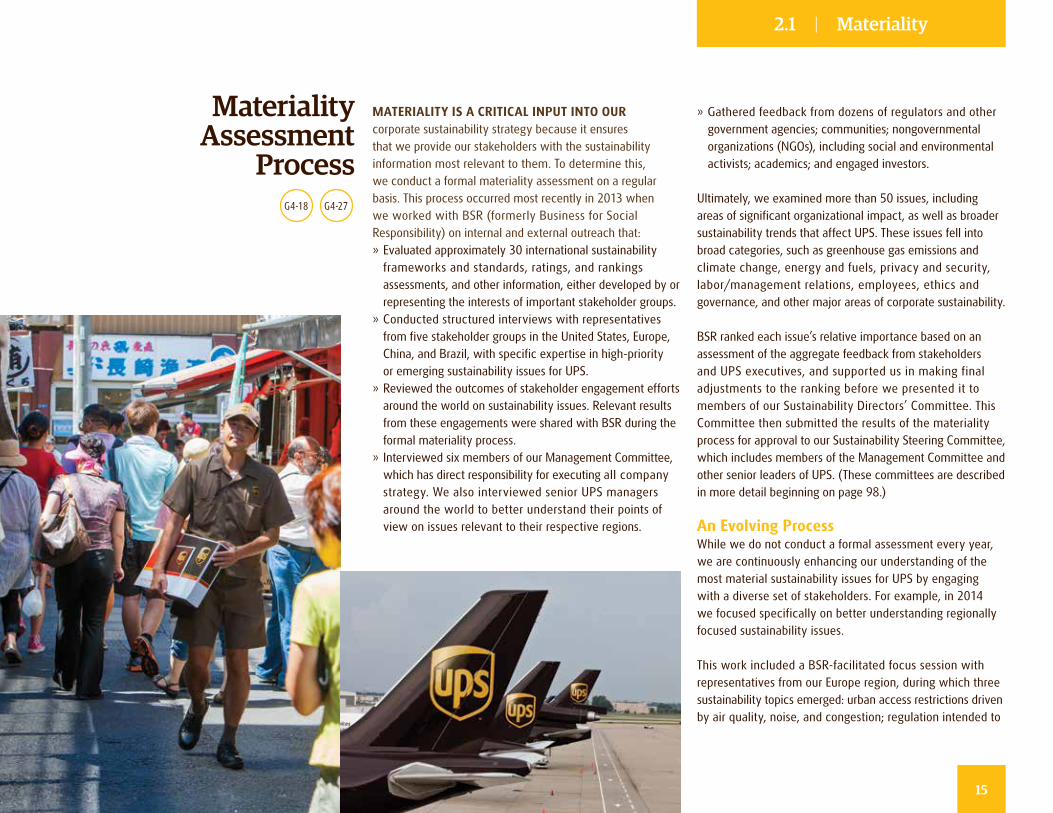
» Gathered feedback from dozens of regulators and other government agencies; communities; nongovernmental organizations (NGOs), including social and environmental activists; academics; and engaged investors.
Ultimately, we examined more than 50 issues, including areas of significant organizational impact, as well as broader sustainability trends that affect UPS. These issues fell into broad categories, such as greenhouse gas emissions and climate change, energy and fuels, privacy and security, labor/management relations, employees, ethics and governance, and other major areas of corporate sustainability.
BSR ranked each issue’s relative importance based on an assessment of the aggregate feedback from stakeholders and UPS executives, and supported us in making final adjustments to the ranking before we presented it to members of our Sustainability Directors’ Committee. This Committee then submitted the results of the materiality process for approval to our Sustainability Steering Committee, which includes members of the Management Committee and other senior leaders of UPS. (These committees are described in more detail beginning on page 98.)
An Evolving ProcessWhile we do not conduct a formal assessment every year, we are continuously enhancing our understanding of the most material sustainability issues for UPS by engaging with a diverse set of stakeholders. For example, in 2014 we focused specifically on better understanding regionally focused sustainability issues.
This work included a BSR-facilitated focus session with representatives from our Europe region, during which three sustainability topics emerged: urban access restrictions driven by air quality, noise, and congestion; regulation intended to
MATERIALITY IS A CRITICAL INPUT INTO OUR corporate sustainability strategy because it ensures that we provide our stakeholders with the sustainability information most relevant to them. To determine this, we conduct a formal materiality assessment on a regular basis. This process occurred most recently in 2013 when we worked with BSR (formerly Business for Social Responsibility) on internal and external outreach that: » Evaluated approximately 30 international sustainability frameworks and standards, ratings, and rankings assessments, and other information, either developed by or representing the interests of important stakeholder groups.
» Conducted structured interviews with representatives from five stakeholder groups in the United States, Europe, China, and Brazil, with specific expertise in high-priority or emerging sustainability issues for UPS.
» Reviewed the outcomes of stakeholder engagement efforts around the world on sustainability issues. Relevant results from these engagements were shared with BSR during the formal materiality process.
» Interviewed six members of our Management Committee, which has direct responsibility for executing all company strategy. We also interviewed senior UPS managers around the world to better understand their points of view on issues relevant to their respective regions.
G4-18 G4-27
15
2.1 | Materiality
curb or mitigate the impact of greenhouse gas emissions from transportation; and flight restrictions due to aircraft noise issues. The first two topics were consistent with the findings of our 2013 assessment, while flight restriction emerged as a matter of particular importance to stakeholders in Europe. During 2015, we plan to further enhance our understanding of regionally focused sustainability issues through a facilitated stakeholder engagement project in our Asia-Pacific region.
In 2014, we also focused on developing more formal processes to understand the sustainability priorities of shippers. This included conducting a quantitative survey about sustainable shipping and supply chain solutions for business customers and consumers in the U.S., the U.K., and Germany, which represent three of our largest markets. One insight to emerge from this exercise is how the sustainability priorities of business customers vary by market. For example, German businesses tend to look at
sustainability through a broader lens that includes social issues, in contrast to U.S. businesses, which generally focus more on the environmental aspects of sustainability.
Another insight is that, while a number of business customers and consumers currently incorporate sustainability into their shipping and supply chain decisions, many believe that it will become a more important factor over the next five years. In addition, we included a set of sustainability questions in our annual “Change in the Chain” survey, which solicits input on the supply chain challenges and priorities of companies in the high-tech sector.
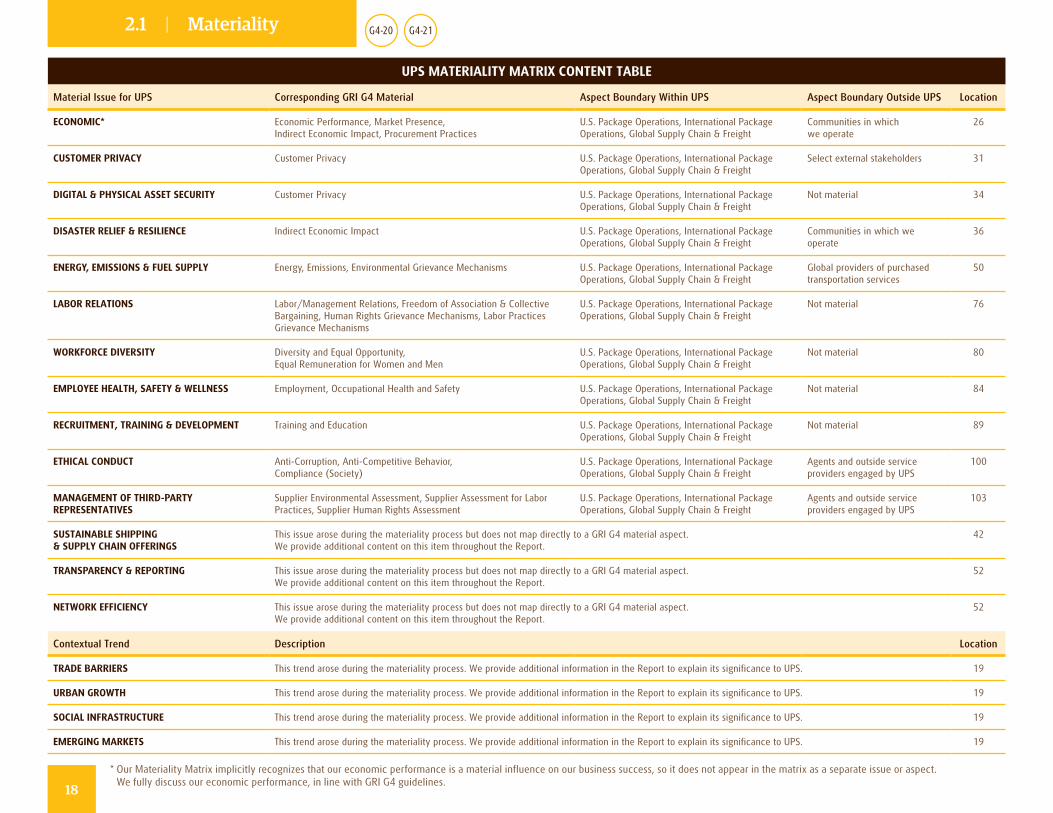
G4-19 G4-20 G4-21
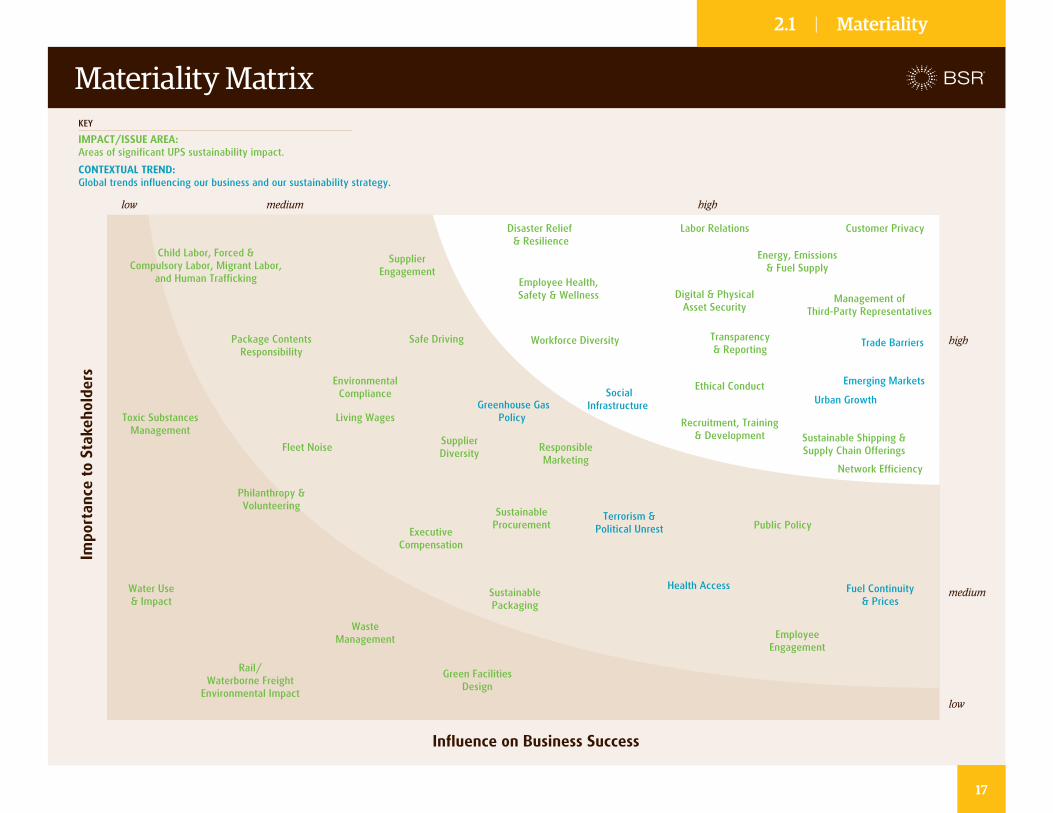
Materiality AspectsThe primary result of our materiality assessment process was a set of “material aspects” of sustainability for UPS. We have mapped these material aspects on a “materiality matrix”
(see diagram on page 17). The vertical axis of the matrix is “Importance to Stakeholders,” and the horizontal axis is “Influence on Business Success.” These are the same axis definitions we used for our original materiality matrix in 2011.
The GRI G4 guidelines recommend that reporters define the vertical axis as “Influence on Stakeholder Assessments and Decisions.” We believe this represents little or no change in meaning from “Importance to Stakeholders.” GRI also recommends that reporters define the horizontal axis as “Significant Economic, Environmental, and Social Impacts.”
After careful consideration, we chose to retain our definition of the horizontal axis (Influence on Business Success) in order to focus the materiality matrix on our overall sustainability strategy, rather than on simply identifying impacts. Our approach also maintains consistency with our original materiality assessment and ensures UPS-specific material aspects stand out clearly for our management and stakeholders. The relevant scope and aspect boundaries are consistent with previous reporting periods as well.
Note “Influence on Business Success” implicitly takes into account the material aspect of economic performance. In the body of this Report, we fully discuss our economic performance, in line with GRI G4 guidelines. We also clearly state how our material aspects (those that appear in the upper right portion) correspond to the material aspect disclosures recommended by GRI. We do this both in the table on page 18 and as part of the discussion of each individual aspect.
16
2.1 | Materiality
Influence on Business Success
Customer PrivacyLabor Relations
SocialInfrastructure
Terrorism &Political Unrest
Health Access Fuel Continuity& Prices
Greenhouse GasPolicy
Impo
rtan
ce t
o St
akeh
olde
rs
IMPACT/ISSUE AREA:Areas of significant UPS sustainability impact.
CONTEXTUAL TREND:Global trends influencing our business and our sustainability strategy.
KEY
highmediumlow
high
medium
low
Disaster Relief & Resilience
Employee Health,Safety & Wellness
Energy, Emissions& Fuel Supply
Digital & PhysicalAsset Security
Transparency& Reporting
Workforce Diversity
Network Efficiency
Trade Barriers
Emerging Markets
Urban Growth
Recruitment, Training& Development
Ethical Conduct
ResponsibleMarketing
Public Policy
EmployeeEngagement
SustainablePackaging
Green FacilitiesDesign
WasteManagement
Rail/Waterborne Freight
Environmental Impact
Philanthropy &Volunteering
Toxic SubstancesManagement
ExecutiveCompensation
SustainableProcurement
SupplierDiversity
Living Wages
EnvironmentalCompliance
Package ContentsResponsibility
SupplierEngagement
Child Labor, Forced &Compulsory Labor, Migrant Labor,
and Human Trafficking
Safe Driving
Fleet Noise
Water Use& Impact
Sustainable Shipping &Supply Chain Offerings
Management ofThird-Party Representatives
Materiality Matrix
17
2.1 | Materiality
UPS MATERIALITY MATRIX CONTENT TABLE
Material Issue for UPS Corresponding GRI G4 Material Aspect Boundary Within UPS Aspect Boundary Outside UPS Location
ECONOMIC* Economic Performance, Market Presence, Indirect Economic Impact, Procurement Practices
U.S. Package Operations, International Package Operations, Global Supply Chain & Freight
Communities in which we operate
26
CUSTOMER PRIVACY Customer Privacy U.S. Package Operations, International Package Operations, Global Supply Chain & Freight
Select external stakeholders 31
DIGITAL & PHYSICAL ASSET SECURITY Customer Privacy U.S. Package Operations, International Package Operations, Global Supply Chain & Freight
Not material 34
DISASTER RELIEF & RESILIENCE Indirect Economic Impact U.S. Package Operations, International Package Operations, Global Supply Chain & Freight
Communities in which we operate
36
ENERGY, EMISSIONS & FUEL SUPPLY Energy, Emissions, Environmental Grievance Mechanisms U.S. Package Operations, International Package Operations, Global Supply Chain & Freight
Global providers of purchased transportation services
50
LABOR RELATIONS Labor/Management Relations, Freedom of Association & Collective Bargaining, Human Rights Grievance Mechanisms, Labor Practices Grievance Mechanisms
U.S. Package Operations, International Package Operations, Global Supply Chain & Freight
Not material 76
WORKFORCE DIVERSITY Diversity and Equal Opportunity, Equal Remuneration for Women and Men
U.S. Package Operations, International Package Operations, Global Supply Chain & Freight
Not material 80
EMPLOYEE HEALTH, SAFETY & WELLNESS Employment, Occupational Health and Safety U.S. Package Operations, International Package Operations, Global Supply Chain & Freight
Not material 84
RECRUITMENT, TRAINING & DEVELOPMENT Training and Education U.S. Package Operations, International Package Operations, Global Supply Chain & Freight
Not material 89
ETHICAL CONDUCT Anti-Corruption, Anti-Competitive Behavior, Compliance (Society)
U.S. Package Operations, International Package Operations, Global Supply Chain & Freight
Agents and outside service providers engaged by UPS
100
MANAGEMENT OF THIRD-PARTY REPRESENTATIVES
Supplier Environmental Assessment, Supplier Assessment for Labor Practices, Supplier Human Rights Assessment
U.S. Package Operations, International Package Operations, Global Supply Chain & Freight
Agents and outside service providers engaged by UPS
103
SUSTAINABLE SHIPPING & SUPPLY CHAIN OFFERINGS
This issue arose during the materiality process but does not map directly to a GRI G4 material aspect. We provide additional content on this item throughout the Report.
42
TRANSPARENCY & REPORTING This issue arose during the materiality process but does not map directly to a GRI G4 material aspect. We provide additional content on this item throughout the Report.
52
NETWORK EFFICIENCY This issue arose during the materiality process but does not map directly to a GRI G4 material aspect. We provide additional content on this item throughout the Report.
52
Contextual Trend Description Location
TRADE BARRIERS This trend arose during the materiality process. We provide additional information in the Report to explain its significance to UPS. 19
URBAN GROWTH This trend arose during the materiality process. We provide additional information in the Report to explain its significance to UPS. 19
SOCIAL INFRASTRUCTURE This trend arose during the materiality process. We provide additional information in the Report to explain its significance to UPS. 19
EMERGING MARKETS This trend arose during the materiality process. We provide additional information in the Report to explain its significance to UPS. 19
G4-20 G4-21
* Our Materiality Matrix implicitly recognizes that our economic performance is a material influence on our business success, so it does not appear in the matrix as a separate issue or aspect. We fully discuss our economic performance, in line with GRI G4 guidelines.
18
2.1 | Materiality
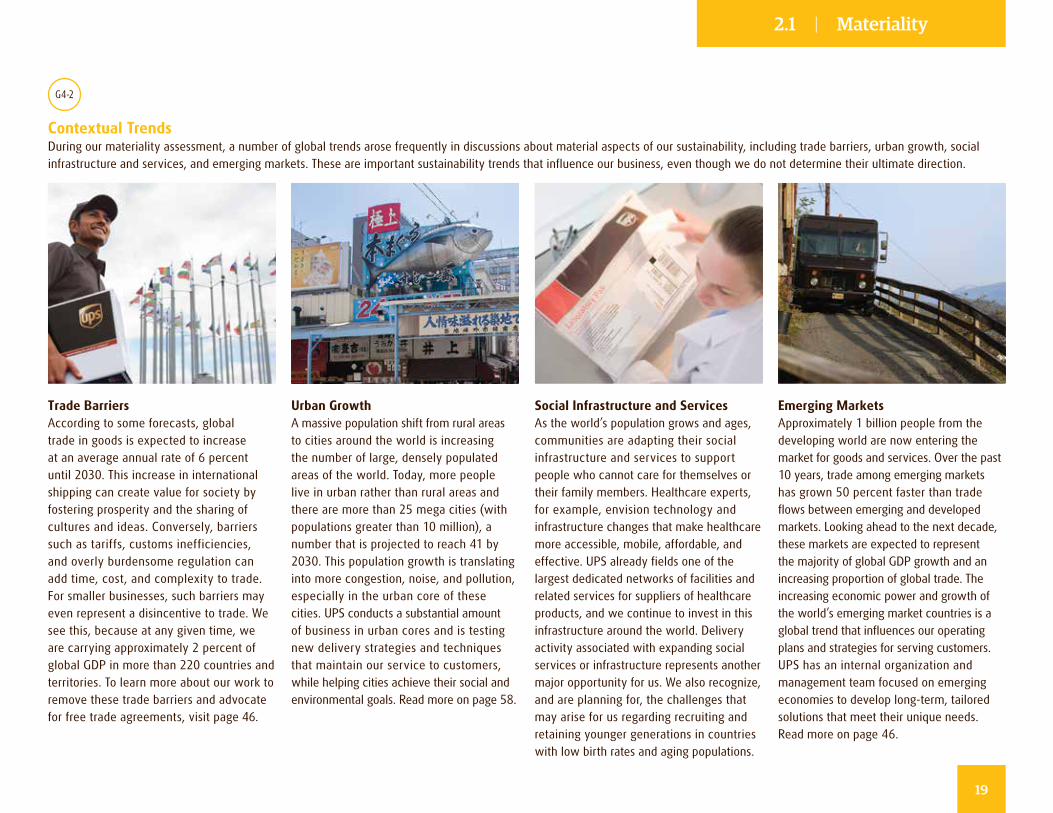
Contextual TrendsDuring our materiality assessment, a number of global trends arose frequently in discussions about material aspects of our sustainability, including trade barriers, urban growth, social infrastructure and services, and emerging markets. These are important sustainability trends that influence our business, even though we do not determine their ultimate direction.
Trade Barriers According to some forecasts, global trade in goods is expected to increase at an average annual rate of 6 percent until 2030. This increase in international shipping can create value for society by fostering prosperity and the sharing of cultures and ideas. Conversely, barriers such as tariffs, customs inefficiencies, and overly burdensome regulation can add time, cost, and complexity to trade. For smaller businesses, such barriers may even represent a disincentive to trade. We see this, because at any given time, we are carrying approximately 2 percent of global GDP in more than 220 countries and territories. To learn more about our work to remove these trade barriers and advocate for free trade agreements, visit page 46.
Urban Growth A massive population shift from rural areas to cities around the world is increasing the number of large, densely populated areas of the world. Today, more people live in urban rather than rural areas and there are more than 25 mega cities (with populations greater than 10 million), a number that is projected to reach 41 by 2030. This population growth is translating into more congestion, noise, and pollution, especially in the urban core of these cities. UPS conducts a substantial amount of business in urban cores and is testing new delivery strategies and techniques that maintain our service to customers, while helping cities achieve their social and environmental goals. Read more on page 58.
Social Infrastructure and ServicesAs the world’s population grows and ages, communities are adapting their social infrastructure and services to support people who cannot care for themselves or their family members. Healthcare experts, for example, envision technology and infrastructure changes that make healthcare more accessible, mobile, affordable, and effective. UPS already fields one of the largest dedicated networks of facilities and related services for suppliers of healthcare products, and we continue to invest in this infrastructure around the world. Delivery activity associated with expanding social services or infrastructure represents another major opportunity for us. We also recognize, and are planning for, the challenges that may arise for us regarding recruiting and retaining younger generations in countries with low birth rates and aging populations.
Emerging MarketsApproximately 1 billion people from the developing world are now entering the market for goods and services. Over the past 10 years, trade among emerging markets has grown 50 percent faster than trade flows between emerging and developed markets. Looking ahead to the next decade, these markets are expected to represent the majority of global GDP growth and an increasing proportion of global trade. The increasing economic power and growth of the world’s emerging market countries is a global trend that influences our operating plans and strategies for serving customers. UPS has an internal organization and management team focused on emerging economies to develop long-term, tailored solutions that meet their unique needs. Read more on page 46.
G4-2
19
2.1 | Materiality
G4-22
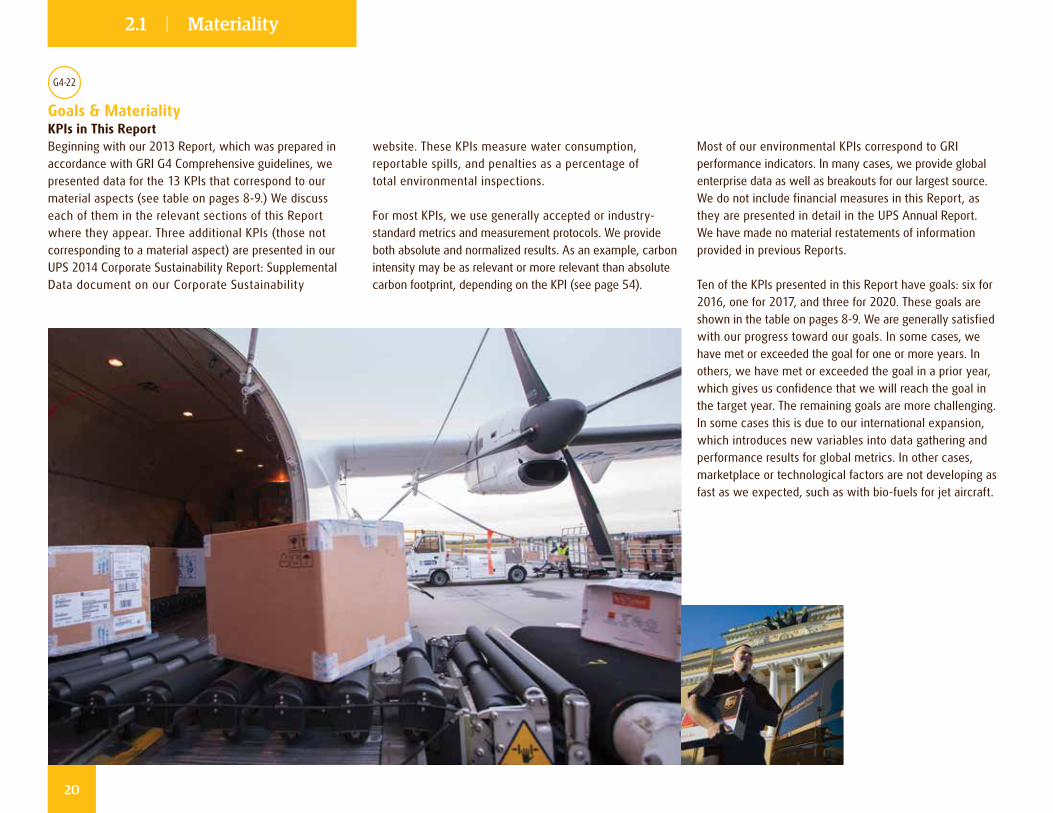
Goals & Materiality KPIs in This Report Beginning with our 2013 Report, which was prepared in accordance with GRI G4 Comprehensive guidelines, we presented data for the 13 KPIs that correspond to our material aspects (see table on pages 8-9.) We discuss each of them in the relevant sections of this Report where they appear. Three additional KPIs (those not corresponding to a material aspect) are presented in our UPS 2014 Corporate Sustainability Report: Supplemental Data document on our Corporate Sustainability
website. These KPIs measure water consumption, reportable spills, and penalties as a percentage of total environmental inspections.
For most KPIs, we use generally accepted or industry-standard metrics and measurement protocols. We provide both absolute and normalized results. As an example, carbon intensity may be as relevant or more relevant than absolute carbon footprint, depending on the KPI (see page 54).
Most of our environmental KPIs correspond to GRI performance indicators. In many cases, we provide global enterprise data as well as breakouts for our largest source. We do not include financial measures in this Report, as they are presented in detail in the UPS Annual Report. We have made no material restatements of information provided in previous Reports.
Ten of the KPIs presented in this Report have goals: six for 2016, one for 2017, and three for 2020. These goals are shown in the table on pages 8-9. We are generally satisfied with our progress toward our goals. In some cases, we have met or exceeded the goal for one or more years. In others, we have met or exceeded the goal in a prior year, which gives us confidence that we will reach the goal in the target year. The remaining goals are more challenging. In some cases this is due to our international expansion, which introduces new variables into data gathering and performance results for global metrics. In other cases, marketplace or technological factors are not developing as fast as we expected, such as with bio-fuels for jet aircraft.
20
2.1 | Materiality
Ongoing Stakeholder Engagement
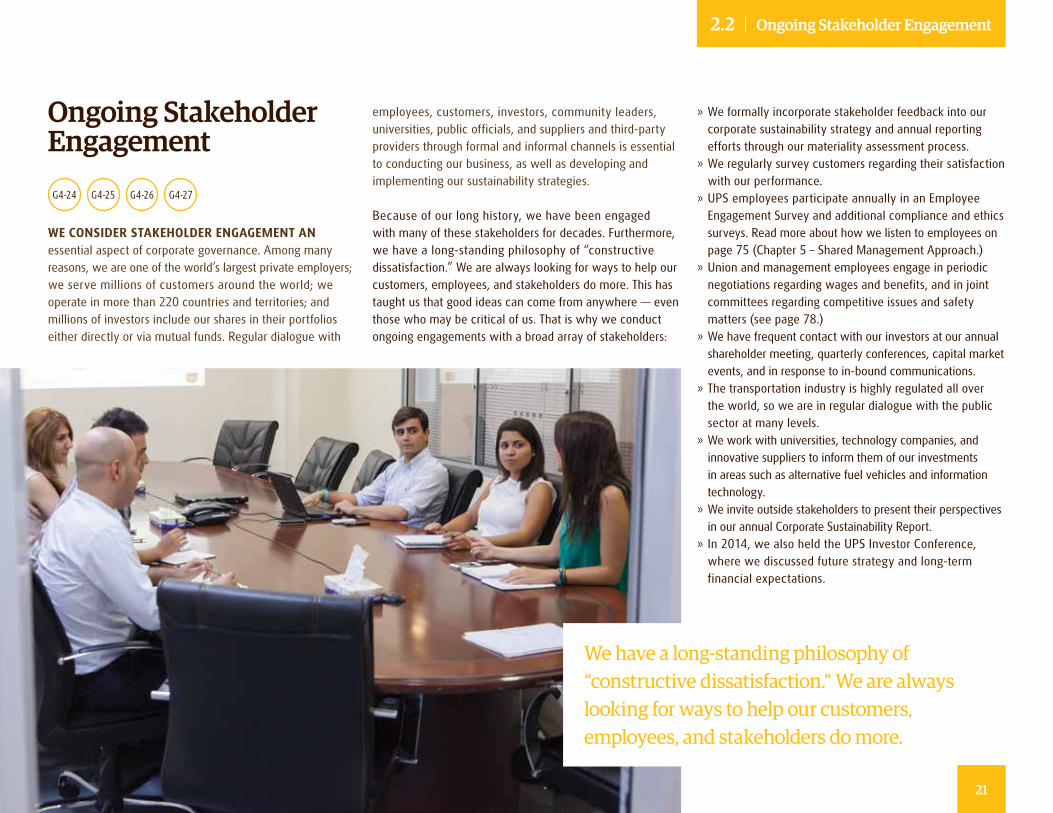
employees, customers, investors, community leaders, universities, public officials, and suppliers and third-party providers through formal and informal channels is essential to conducting our business, as well as developing and implementing our sustainability strategies.
Because of our long history, we have been engaged with many of these stakeholders for decades. Furthermore, we have a long-standing philosophy of “constructive dissatisfaction.” We are always looking for ways to help our customers, employees, and stakeholders do more. This has taught us that good ideas can come from anywhere — even those who may be critical of us. That is why we conduct ongoing engagements with a broad array of stakeholders:
» We formally incorporate stakeholder feedback into our corporate sustainability strategy and annual reporting efforts through our materiality assessment process.
» We regularly survey customers regarding their satisfaction with our performance.
» UPS employees participate annually in an Employee Engagement Survey and additional compliance and ethics surveys. Read more about how we listen to employees on page 75 (Chapter 5 – Shared Management Approach.)
» Union and management employees engage in periodic negotiations regarding wages and benefits, and in joint committees regarding competitive issues and safety matters (see page 78.)
» We have frequent contact with our investors at our annual shareholder meeting, quarterly conferences, capital market events, and in response to in-bound communications.
» The transportation industry is highly regulated all over the world, so we are in regular dialogue with the public sector at many levels.
» We work with universities, technology companies, and innovative suppliers to inform them of our investments in areas such as alternative fuel vehicles and information technology.
» We invite outside stakeholders to present their perspectives in our annual Corporate Sustainability Report.
» In 2014, we also held the UPS Investor Conference, where we discussed future strategy and long-term financial expectations.
We have a long-standing philosophy of “constructive dissatisfaction.” We are always looking for ways to help our customers, employees, and stakeholders do more.
G4-24 G4-26G4-25 G4-27
WE CONSIDER STAKEHOLDER ENGAGEMENT AN essential aspect of corporate governance. Among many reasons, we are one of the world’s largest private employers; we serve millions of customers around the world; we operate in more than 220 countries and territories; and millions of investors include our shares in their portfolios either directly or via mutual funds. Regular dialogue with
21
2.2 | Ongoing Stakeholder Engagement
2014 Global Engagement HighlightsIn addition to our ongoing engagements, we are regularly in contact with outside stakeholders on emerging sustainability issues and trends. We periodically receive sustainability-related inquiries and requests for engagement from outside stakeholder groups. We also are open to initiating new stakeholder engagement activities to help inform our strategy.
The following table summarizes the highlights of our stakeholder engagement on sustainability issues during 2014. Find more in-depth discussions about these topics and many more throughout the Report. For example, we discuss many of our employee and labor engagement activities and updates starting on page 76.
SUMMARY OF 2014 STAKEHOLDER DIALOGUE AND OUTCOMES
Recommendation Stakeholder(s) UPS Action/Response
Focus reporting on material sustainability issues
Socially Responsible Investors, NGOs
» Completed transition to GRI G4 reporting framework » Reported at G4 comprehensive level » Held a facilitated session to discuss material issues relevant in our Europe region
Engage in both internal and external discussions on climate change, especially ahead of the Paris COP 21 meeting scheduled for December 2015
Socially Responsible Investors, NGOs, Government Officials
» Held an internal series of strategic discussions focused on climate change and UPS, which resulted in updating UPS’s climate change statement (see page 63)
» Continued regular engagement with organizations such as World Business Council for Sustainable Development (WBCSD) and World Economic Forum (WEF) where UPS leaders discussed business issues related to climate change
Contribute to the development of long-term solutions for congestion and emissions in urban areas
City Officials, Especially in Europe
» Ongoing engagement with city officials to discuss and propose solutions
» Development and testing of urban access solutions in selected European cities (page 58)
Enhance sustainability engagement opportunities in the Asia-Pacific region
Employees, Customers, and Suppliers
» Formalized a regional sustainability governance structure » Participated in the development of Green Freight Asia (page 53) » Engaged with the The United States Association for Southeast Asian Nations (US-ASEAN) program to empower small and medium-sized enterprises to access global markets (page 46)
Better understand customer sustainability concerns
Customers
» Developed relevant questions to include in internal market research projects and segment-focused external research
» Included sustainability-focused questions in annual “Change in the Chain” survey focused on the high-tech industry
Implement ideas to improve peak holiday season performance
Employees
» Solicited employee feedback that generated more than 1,700 ideas and resulted in the implementation of initiatives such as adding modular buildings to handle increased package volume and automating package status updates to improve tracking
22
2.2 | Ongoing Stakeholder Engagement
G4-15 G4-16
Commitments to External InitiativesBecause of the size of our company, our global scale, and our commitment to sustainability, we are able to identify numerous opportunities to participate in external initiatives. Our approach has been to choose initiatives associated with our business, and with credible organizations capable of mounting and sustaining successful programs. We then devote considerable resources, energy, and attention to advancing them. As a way to supplement these global engagements, The UPS Foundation also funds the work of thousands of local grassroots nonprofits in communities around the world.
The major external initiatives we engage in include the following:Economic » The President’s Export Council, a nonpartisan body that serves as the United States’ principal national advisory committee on international trade, on which our CEO, David Abney, serves
» The Business Roundtable, an association of chief executive officers, including our CEO, David Abney, of leading companies in the United States that promote public policy in support of a thriving economy
» The World Economic Forum’s Global Agenda Council on Catastrophic Risks, chaired by The UPS Foundation President Eduardo Martinez
» The US-Association of Southeast Asian Nations Business Alliance for Competitive Small and Medium Sized Enterprises (SMEs), in conjunction with the US-ASEAN Business Council and the U.S. Agency for International Development to educate SMEs on best practices in business expansion and global market access (more on page 47)
Social » UNICEF programs to feed, clothe, shelter, and educate children affected by natural and human-caused disasters
» U.N. World Food Programme initiatives to feed populations affected by natural and human-caused disasters (more on page 39)
» The U.S. Federal Aviation Administration (FAA) program to establish next-generation air traffic control systems
» The UPS-IPA Safety Task Force formed to identify and implement advanced solutions for cockpit and cargo safety
» The White House’s Joining Forces initiative works with the public and private sector to support returning U.S. veterans (more on page 91)
Environmental » The World Resources Institute (WRI) program for the advancement and implementation of the Greenhouse Gas Protocol for supply chain reporting
» The Interstate Clean Transportation Corridor (ICTC) program, a public/private partnership to establish natural gas infrastructure for transportation
» The “Future of Fuels” project at BSR, aimed at promoting the development of lower-emission fuels for transportation (more on page 67)
» The SmartWay® program of the U.S. Environmental Protection Agency (EPA), aimed at improving the fuel efficiency and environmental performance of the transportation component of business supply chains
» The National Clean Fleets Partnership, through which the U.S. Department of Energy’s Clean Cities program works with large private fleets to cut the use of petroleum-based fuels
» The North American Council for Freight Efficiency (NACFE), an industry association committed to doubling the efficiency of North American goods movement
» Green Freight Europe and Green Freight Asia, transportation associations that are developing methodologies to address the climate impact of shipping in their respective regions (more on page 53)
» The International Air Transport Association (IATA), Air Cargo Carbon Footprint initiative
» The Nature Conservancy, Arbor Day Foundation, The World Wildlife Fund, Earth Day Network and support for other global NGOs on behalf of our Global Forestry Initiative (more on page 62)
General Sustainability » The World Business Council for Sustainable Development (WBCSD), of which our Chief Commercial Officer, Alan Gershenhorn, is a member, focuses on a long-term global action plan for sustainability
» The Global Initiative for Sustainability Ratings (GISR), which aims to develop global ratings standards for sustainability performance
» The Sustainability Accounting Standards Board (SASB), which is working to advance the integration of financial and nonfinancial reporting by corporations
In addition, our leadership is active in numerous industry, civic, and philanthropic initiatives. For example, Teri Plummer McClure, Chief Legal Officer and Senior Vice President, Human Resources, serves on the boards of Heart for Africa and the Task Force for Global Health.
23
2.2 | Ongoing Stakeholder Engagement
03Committed to More™
Global Prosperity
24
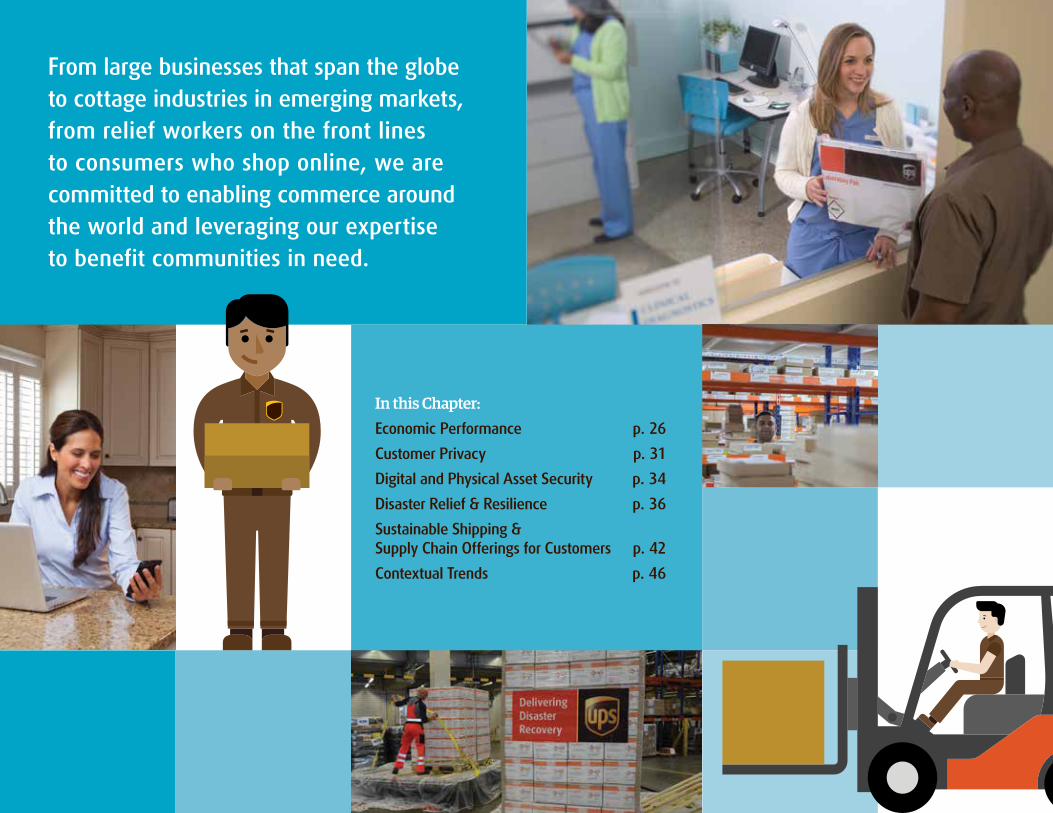
From large businesses that span the globe to cottage industries in emerging markets, from relief workers on the front lines to consumers who shop online, we are committed to enabling commerce around the world and leveraging our expertise to benefit communities in need.
In this Chapter:Economic Performance p. 26
Customer Privacy p. 31
Digital and Physical Asset Security p. 34
Disaster Relief & Resilience p. 36
Sustainable Shipping & Supply Chain Offerings for Customers p. 42
Contextual Trends p. 46
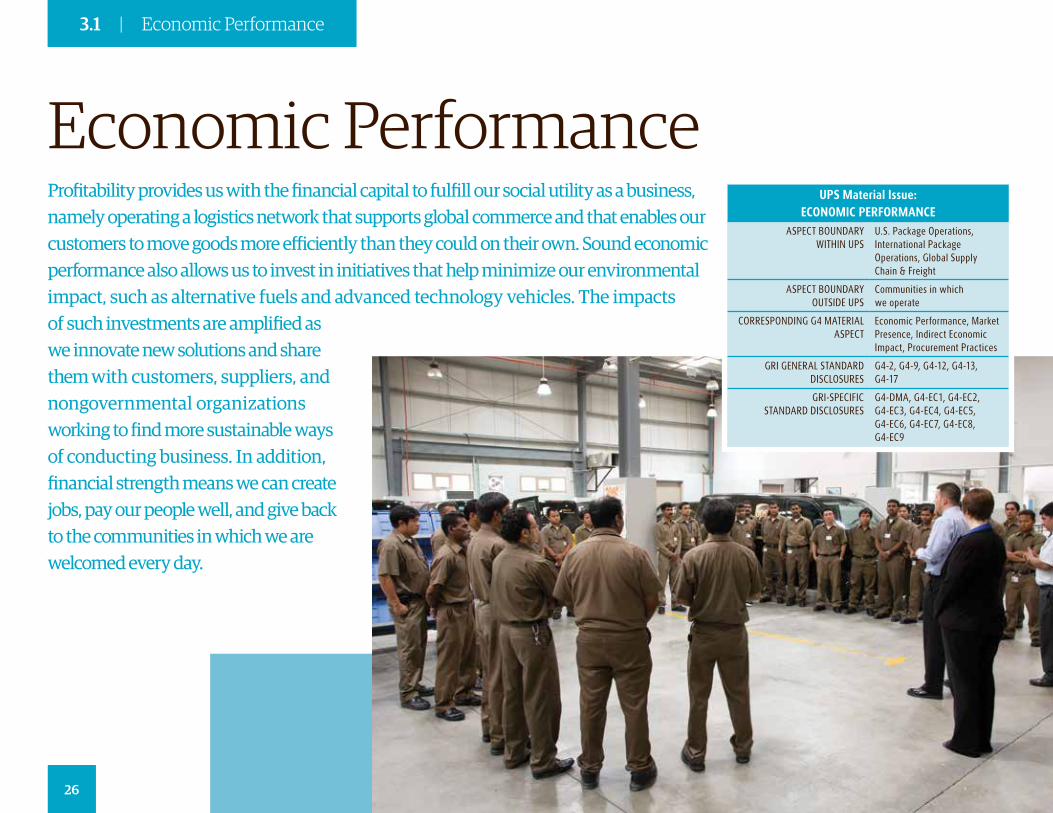
Economic PerformanceUPS Material Issue:
ECONOMIC PERFORMANCEASPECT BOUNDARY
WITHIN UPSU.S. Package Operations, International Package Operations, Global Supply Chain & Freight
ASPECT BOUNDARY OUTSIDE UPS
Communities in which we operate
CORRESPONDING G4 MATERIAL ASPECT
Economic Performance, Market Presence, Indirect Economic Impact, Procurement Practices
GRI GENERAL STANDARD DISCLOSURES
G4-2, G4-9, G4-12, G4-13, G4-17
GRI-SPECIFIC STANDARD DISCLOSURES
G4-DMA, G4-EC1, G4-EC2, G4-EC3, G4-EC4, G4-EC5, G4-EC6, G4-EC7, G4-EC8, G4-EC9
Profitability provides us with the financial capital to fulfill our social utility as a business, namely operating a logistics network that supports global commerce and that enables our customers to move goods more efficiently than they could on their own. Sound economic performance also allows us to invest in initiatives that help minimize our environmental impact, such as alternative fuels and advanced technology vehicles. The impacts of such investments are amplified as we innovate new solutions and share them with customers, suppliers, and nongovernmental organizations working to find more sustainable ways of conducting business. In addition, financial strength means we can create jobs, pay our people well, and give back to the communities in which we are welcomed every day.
26
3.1 | Economic Performance
WE UNDERSCORE THE IMPORTANCE OF ECONOMIC performance by using it as one of two foundational reference points by which we define all other material issues. Economic performance is defined as our most material aspect because, like most companies, our economic success enables the execution of our sustainability strategies.
G4-2 G4-EC1G4-9 G4-EC2 G4-DMA
Management Approach to Economic PerformanceOur primary role in society is to enable commerce by connecting individuals and organizations in more than 220 countries and territories. Customers utilize our broad logistics capabilities, global presence, industry-leading technologies, and solutions expertise to build competitive advantages in their respective markets. We have a long history of producing strong financial results, maintaining a solid balance sheet and high credit rating, distributing dividends, cultivating brand and customer loyalty, and positioning our business to capitalize on growth trends. Today, these trends include the expansion of global trade, emerging market growth, increased segment expertise in the integrated carrier space, logistics outsourcing, and e-commerce growth in the retail sector.
Our business contributes to sustainability by making logistics as resource-efficient as possible — and far more efficient than our customers could accomplish on their own. To do so, we: » Meet customer needs by utilizing a broad range of transportation modes — airplanes, trains, ships, trucks, cars, carts, bicycles, and more — to reduce our impact on the environment.
» Achieve optimal efficiency by equipping, loading, and routing every vehicle and airplane we own to maximize shipments on board and minimize the miles traveled.
» Operate a single, integrated transportation network rather than multiple, redundant networks for similar types of services.
» Help test the potential of new reduced-emission technologies through our rolling laboratory that encompasses a large and diverse fleet of alternative fuel and advanced technology vehicles.
» Minimize energy, water, and material use in our facilities through design, maintenance, and multiclient use.
» Reduce unnecessary visits to customer locations and the associated environmental impact through services such as UPS Smart Pickup™ and UPS Access Point™.
» Help customers make their supply chains more efficient and manage their carbon footprint more successfully by offering logistics consulting services.
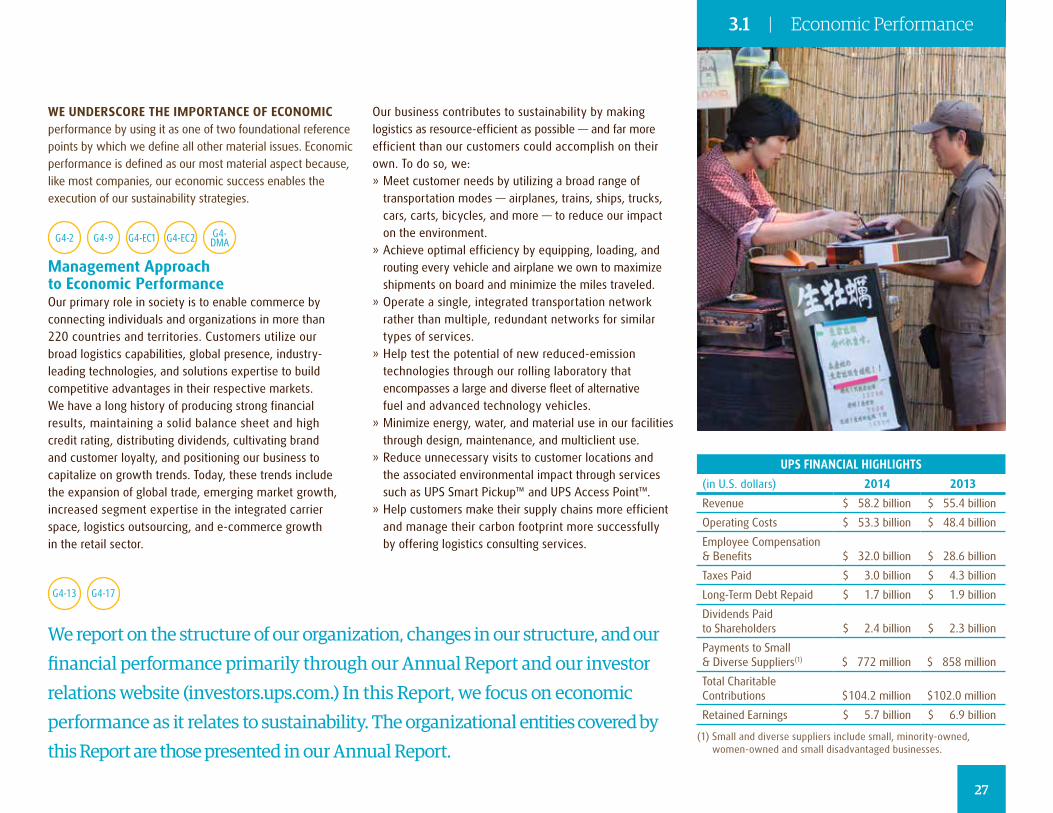
UPS FINANCIAL HIGHLIGHTS
(in U.S. dollars) 2014 2013
Revenue $ 58.2 billion $ 55.4 billion
Operating Costs $ 53.3 billion $ 48.4 billion
Employee Compensation & Benefits
$ 32.0 billion
$ 28.6 billion
Taxes Paid $ 3.0 billion $ 4.3 billion
Long-Term Debt Repaid $ 1.7 billion $ 1.9 billion
Dividends Paid to Shareholders
$ 2.4 billion
$ 2.3 billion
Payments to Small & Diverse Suppliers(1)
$ 772 million
$ 858 million
Total Charitable Contributions
$104.2 million
$102.0 million
Retained Earnings $ 5.7 billion $ 6.9 billion
We report on the structure of our organization, changes in our structure, and our
financial performance primarily through our Annual Report and our investor
relations website (investors.ups.com.) In this Report, we focus on economic
performance as it relates to sustainability. The organizational entities covered by
this Report are those presented in our Annual Report.
G4-13 G4-17
(1) Small and diverse suppliers include small, minority-owned, women-owned and small disadvantaged businesses.
27
3.1 | Economic Performance
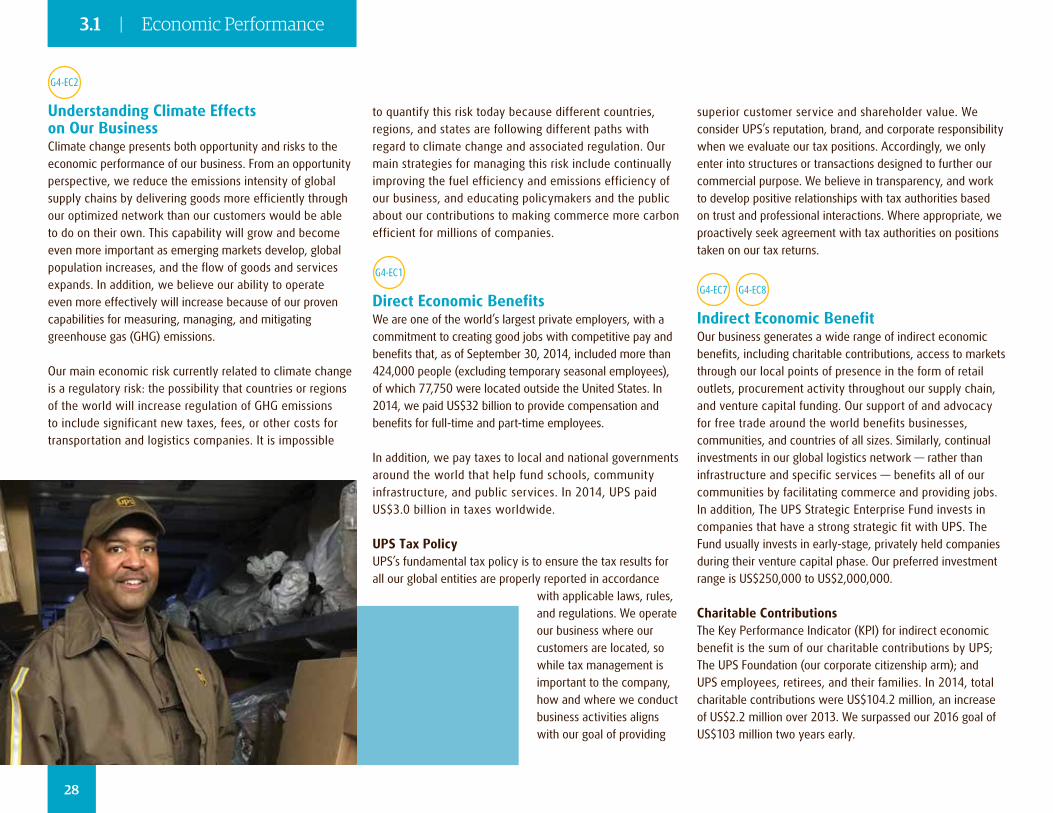
G4-EC2
Understanding Climate Effects on Our BusinessClimate change presents both opportunity and risks to the economic performance of our business. From an opportunity perspective, we reduce the emissions intensity of global supply chains by delivering goods more efficiently through our optimized network than our customers would be able to do on their own. This capability will grow and become even more important as emerging markets develop, global population increases, and the flow of goods and services expands. In addition, we believe our ability to operate even more effectively will increase because of our proven capabilities for measuring, managing, and mitigating greenhouse gas (GHG) emissions.
Our main economic risk currently related to climate change is a regulatory risk: the possibility that countries or regions of the world will increase regulation of GHG emissions to include significant new taxes, fees, or other costs for transportation and logistics companies. It is impossible
to quantify this risk today because different countries, regions, and states are following different paths with regard to climate change and associated regulation. Our main strategies for managing this risk include continually improving the fuel efficiency and emissions efficiency of our business, and educating policymakers and the public about our contributions to making commerce more carbon efficient for millions of companies.
G4-EC1
Direct Economic Benefits We are one of the world’s largest private employers, with a commitment to creating good jobs with competitive pay and benefits that, as of September 30, 2014, included more than 424,000 people (excluding temporary seasonal employees), of which 77,750 were located outside the United States. In 2014, we paid US$32 billion to provide compensation and benefits for full-time and part-time employees.
In addition, we pay taxes to local and national governments around the world that help fund schools, community infrastructure, and public services. In 2014, UPS paid US$3.0 billion in taxes worldwide.
UPS Tax Policy UPS’s fundamental tax policy is to ensure the tax results for all our global entities are properly reported in accordance
with applicable laws, rules, and regulations. We operate our business where our customers are located, so while tax management is important to the company, how and where we conduct business activities aligns with our goal of providing
superior customer service and shareholder value. We consider UPS’s reputation, brand, and corporate responsibility when we evaluate our tax positions. Accordingly, we only enter into structures or transactions designed to further our commercial purpose. We believe in transparency, and work to develop positive relationships with tax authorities based on trust and professional interactions. Where appropriate, we proactively seek agreement with tax authorities on positions taken on our tax returns.
G4-EC7 G4-EC8
Indirect Economic BenefitOur business generates a wide range of indirect economic benefits, including charitable contributions, access to markets through our local points of presence in the form of retail outlets, procurement activity throughout our supply chain, and venture capital funding. Our support of and advocacy for free trade around the world benefits businesses, communities, and countries of all sizes. Similarly, continual investments in our global logistics network — rather than infrastructure and specific services — benefits all of our communities by facilitating commerce and providing jobs. In addition, The UPS Strategic Enterprise Fund invests in companies that have a strong strategic fit with UPS. The Fund usually invests in early-stage, privately held companies during their venture capital phase. Our preferred investment range is US$250,000 to US$2,000,000.
Charitable ContributionsThe Key Performance Indicator (KPI) for indirect economic benefit is the sum of our charitable contributions by UPS; The UPS Foundation (our corporate citizenship arm); and UPS employees, retirees, and their families. In 2014, total charitable contributions were US$104.2 million, an increase of US$2.2 million over 2013. We surpassed our 2016 goal of US$103 million two years early.
28
3.1 | Economic Performance
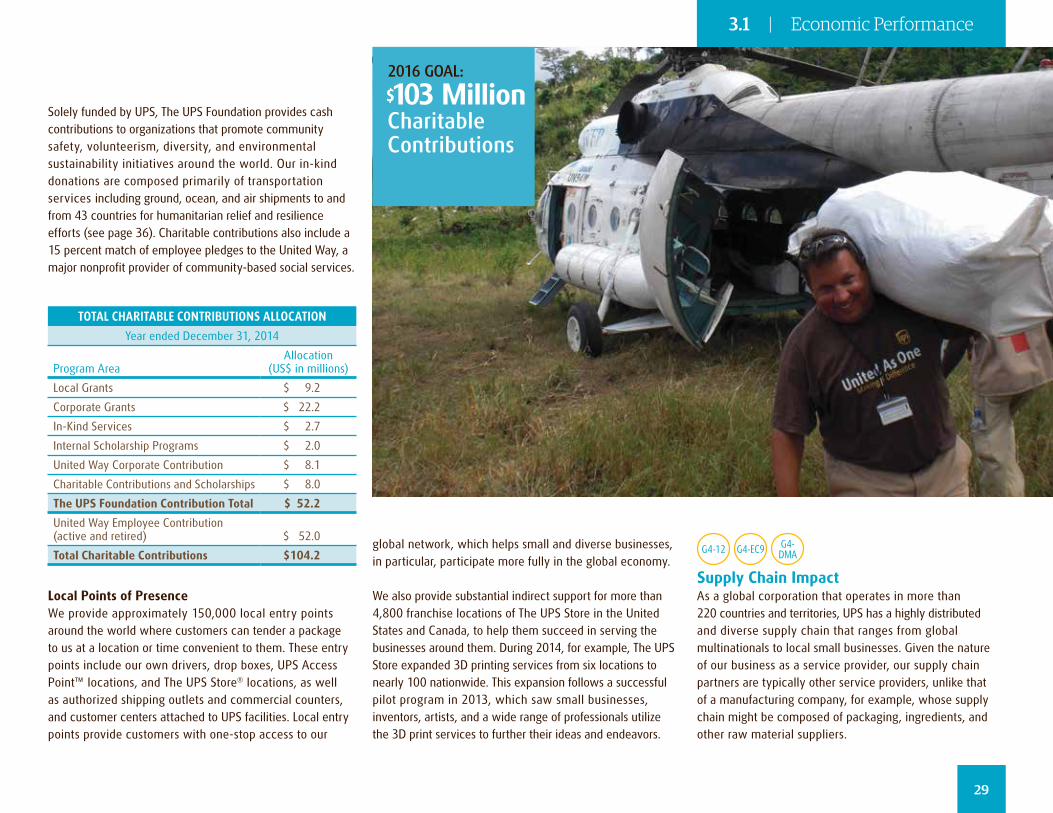
Solely funded by UPS, The UPS Foundation provides cash contributions to organizations that promote community safety, volunteerism, diversity, and environmental sustainability initiatives around the world. Our in-kind donations are composed primarily of transportation services including ground, ocean, and air shipments to and from 43 countries for humanitarian relief and resilience efforts (see page 36). Charitable contributions also include a 15 percent match of employee pledges to the United Way, a major nonprofit provider of community-based social services.
TOTAL CHARITABLE CONTRIBUTIONS ALLOCATION
Year ended December 31, 2014
Program Area Allocation
(US$ in millions)
Local Grants $ 9.2
Corporate Grants $ 22.2
In-Kind Services $ 2.7
Internal Scholarship Programs $ 2.0
United Way Corporate Contribution $ 8.1
Charitable Contributions and Scholarships $ 8.0
The UPS Foundation Contribution Total $ 52.2
United Way Employee Contribution (active and retired) $ 52.0
Total Charitable Contributions $104.2
Local Points of PresenceWe provide approximately 150,000 local entry points around the world where customers can tender a package to us at a location or time convenient to them. These entry points include our own drivers, drop boxes, UPS Access Point™ locations, and The UPS Store® locations, as well as authorized shipping outlets and commercial counters, and customer centers attached to UPS facilities. Local entry points provide customers with one-stop access to our
global network, which helps small and diverse businesses, in particular, participate more fully in the global economy.
We also provide substantial indirect support for more than 4,800 franchise locations of The UPS Store in the United States and Canada, to help them succeed in serving the businesses around them. During 2014, for example, The UPS Store expanded 3D printing services from six locations to nearly 100 nationwide. This expansion follows a successful pilot program in 2013, which saw small businesses, inventors, artists, and a wide range of professionals utilize the 3D print services to further their ideas and endeavors.
G4-12 G4-EC9 G4-DMA
Supply Chain ImpactAs a global corporation that operates in more than 220 countries and territories, UPS has a highly distributed and diverse supply chain that ranges from global multinationals to local small businesses. Given the nature of our business as a service provider, our supply chain partners are typically other service providers, unlike that of a manufacturing company, for example, whose supply chain might be composed of packaging, ingredients, and other raw material suppliers.
2016 GOAL:
$103 Million Charitable Contributions
29
3.1 | Economic Performance
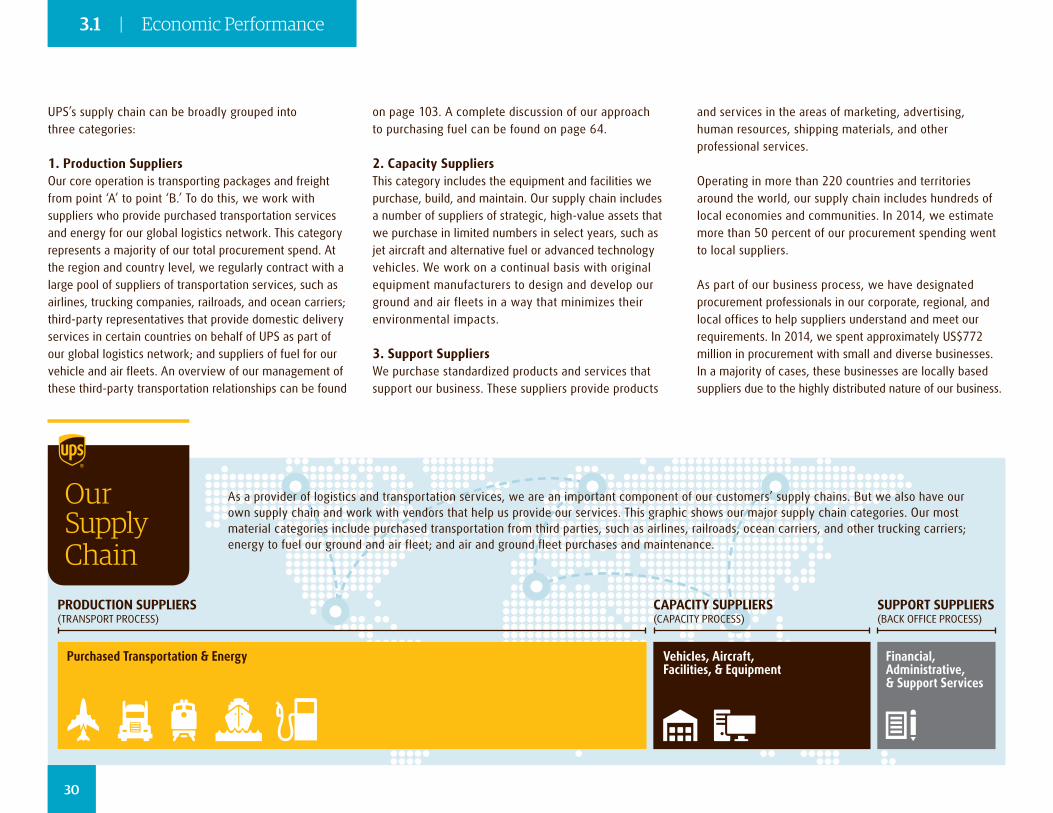
UPS’s supply chain can be broadly grouped into three categories:
1. Production SuppliersOur core operation is transporting packages and freight from point ‘A’ to point ‘B.’ To do this, we work with suppliers who provide purchased transportation services and energy for our global logistics network. This category represents a majority of our total procurement spend. At the region and country level, we regularly contract with a large pool of suppliers of transportation services, such as airlines, trucking companies, railroads, and ocean carriers; third-party representatives that provide domestic delivery services in certain countries on behalf of UPS as part of our global logistics network; and suppliers of fuel for our vehicle and air fleets. An overview of our management of these third-party transportation relationships can be found
on page 103. A complete discussion of our approach to purchasing fuel can be found on page 64.
2. Capacity SuppliersThis category includes the equipment and facilities we purchase, build, and maintain. Our supply chain includes a number of suppliers of strategic, high-value assets that we purchase in limited numbers in select years, such as jet aircraft and alternative fuel or advanced technology vehicles. We work on a continual basis with original equipment manufacturers to design and develop our ground and air fleets in a way that minimizes their environmental impacts.
3. Support SuppliersWe purchase standardized products and services that support our business. These suppliers provide products
As a provider of logistics and transportation services, we are an important component of our customers’ supply chains. But we also have our own supply chain and work with vendors that help us provide our services. This graphic shows our major supply chain categories. Our most material categories include purchased transportation from third parties, such as airlines, railroads, ocean carriers, and other trucking carriers; energy to fuel our ground and air fleet; and air and ground fleet purchases and maintenance.
and services in the areas of marketing, advertising, human resources, shipping materials, and other professional services.
Operating in more than 220 countries and territories around the world, our supply chain includes hundreds of local economies and communities. In 2014, we estimate more than 50 percent of our procurement spending went to local suppliers.
As part of our business process, we have designated procurement professionals in our corporate, regional, and local offices to help suppliers understand and meet our requirements. In 2014, we spent approximately US$772 million in procurement with small and diverse businesses. In a majority of cases, these businesses are locally based suppliers due to the highly distributed nature of our business.
PRODUCTION SUPPLIERS (TRANSPORT PROCESS)
CAPACITY SUPPLIERS (CAPACITY PROCESS)
SUPPORT SUPPLIERS (BACK OFFICE PROCESS)
Purchased Transportation & Energy Vehicles, Aircraft, Facilities, & Equipment
Financial, Administrative, & Support Services
30
3.1 | Economic Performance
Our Supply Chain
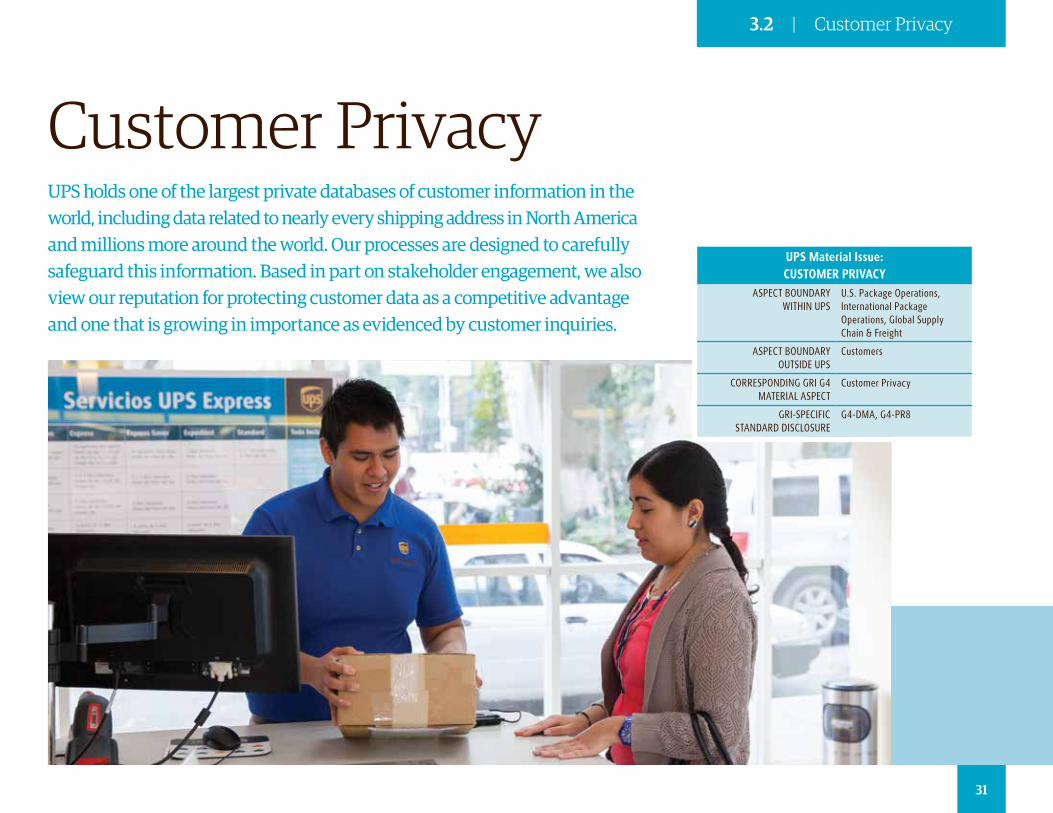
Customer Privacy
UPS Material Issue: CUSTOMER PRIVACY
ASPECT BOUNDARY WITHIN UPS
U.S. Package Operations, International Package Operations, Global Supply Chain & Freight
ASPECT BOUNDARY OUTSIDE UPS
Customers
CORRESPONDING GRI G4 MATERIAL ASPECT
Customer Privacy
GRI-SPECIFIC STANDARD DISCLOSURE
G4-DMA, G4-PR8
UPS holds one of the largest private databases of customer information in the world, including data related to nearly every shipping address in North America and millions more around the world. Our processes are designed to carefully safeguard this information. Based in part on stakeholder engagement, we also view our reputation for protecting customer data as a competitive advantage and one that is growing in importance as evidenced by customer inquiries.
31
3.2 | Customer Privacy
OUR MANAGEMENT APPROACH TO INFORMATION: At UPS, data privacy is a key consideration whenever we develop a new service, program, or strategy that involves the use of personal information. We incorporate privacy protections into the early stages of design. As we evaluate global opportunities, compliance with data privacy laws is critically important. Data privacy laws often differ from those in the United States, but we consider these differences in building and managing our global compliance program for the regions in which we operate around the world.
Interaction with CustomersWe inform our stakeholders about our privacy practices in the UPS Privacy Notice, available on the home page of our website. The Privacy Notice describes the personal data that we collect, how we use it, and with whom we
share it. We also provide consumers with a contact for questions about our privacy practices. We offer an easy-to-use Privacy Preferences Center that enables our consumers to make meaningful choices about how we use their personal information. Behind the scenes, we are continually improving our IT systems, business operations, training, and monitoring to strengthen our privacy practices. This challenge is particularly complex because the network connectivity that enables global commerce also increases the risk of theft or misuse of personal data.
GovernanceGovernance also is a priority for UPS. We utilize a cross-functional Information Security Council (ISC), composed of more than 20 senior managers, that reports to our Management Committee and was formed more than 10 years ago. The ISC meets on a quarterly basis and has established a working committee led by our Global Privacy Officer and the head of our Information Security Group. This working team convenes representatives from our information technology, privacy, legal, and security teams and business representatives on a weekly basis. An ISC steering committee comprised of senior managers also focuses on policy, standards, and compliance at a quarterly meeting.
Management Approach to
Customer PrivacyG4- PR8
G4-DMA
32
3.2 | Customer Privacy
During 2014, the ISC oversaw our response to a malware intrusion that had targeted retailers throughout the U.S. The malware was discovered and subsequently eradicated at approximately 1 percent of The UPS Store® franchisees’ locations. Customers who used a payment card at the affected locations during the time period in which systems were infected by the malware were offered a year of free credit monitoring. This experience helped us to demonstrate the effectiveness of our incident response plan.
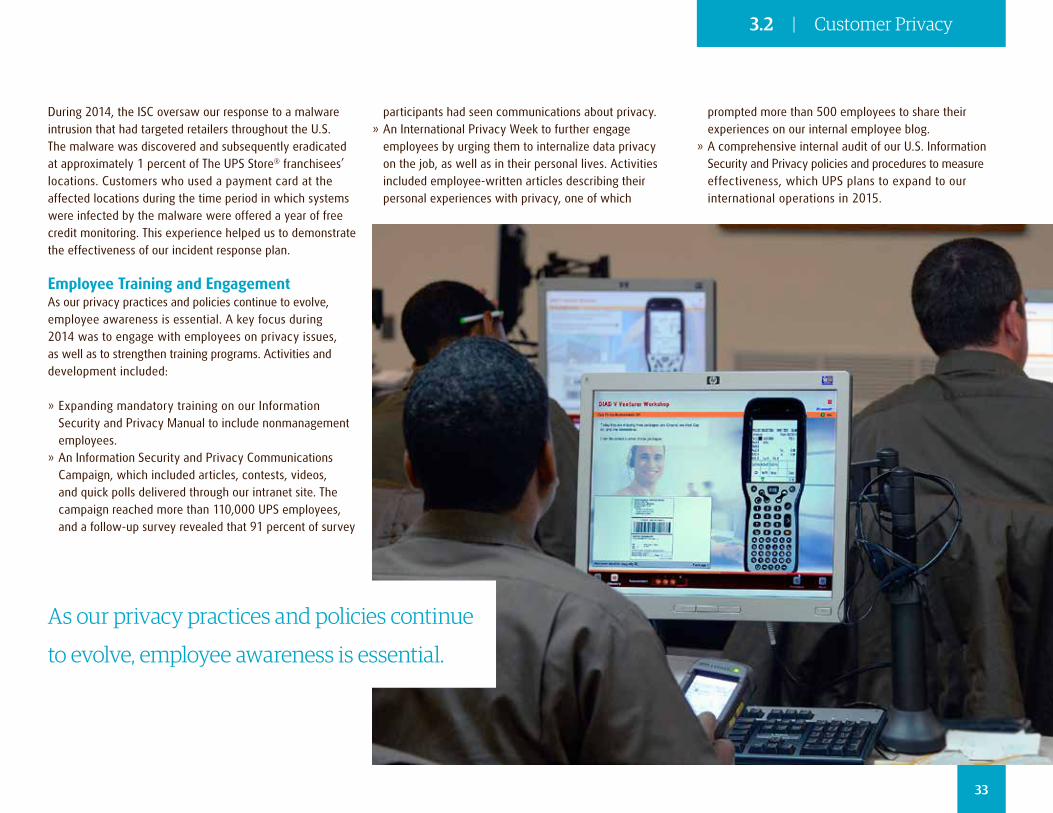
Employee Training and EngagementAs our privacy practices and policies continue to evolve, employee awareness is essential. A key focus during 2014 was to engage with employees on privacy issues, as well as to strengthen training programs. Activities and development included:
» Expanding mandatory training on our Information Security and Privacy Manual to include nonmanagement employees.
» An Information Security and Privacy Communications Campaign, which included articles, contests, videos, and quick polls delivered through our intranet site. The campaign reached more than 110,000 UPS employees, and a follow-up survey revealed that 91 percent of survey
As our privacy practices and policies continue
to evolve, employee awareness is essential.
participants had seen communications about privacy. » An International Privacy Week to further engage employees by urging them to internalize data privacy on the job, as well as in their personal lives. Activities included employee-written articles describing their personal experiences with privacy, one of which
prompted more than 500 employees to share their experiences on our internal employee blog.
» A comprehensive internal audit of our U.S. Information Security and Privacy policies and procedures to measure effectiveness, which UPS plans to expand to our international operations in 2015.
33
3.2 | Customer Privacy
Digital & Physical Asset Security
UPS Material Issue: DIGITAL & PHYSICAL ASSET SECURITY
ASPECT BOUNDARY WITHIN UPS
U.S. Package Operations, International Package Operations, Global Supply Chain & Freight
ASPECT BOUNDARY OUTSIDE UPS
Not material
CORRESPONDING GRI G4 MATERIAL ASPECT
Customer Privacy
GRI-SPECIFIC STANDARD DISCLOSURE
G4-DMA, G4-PR8
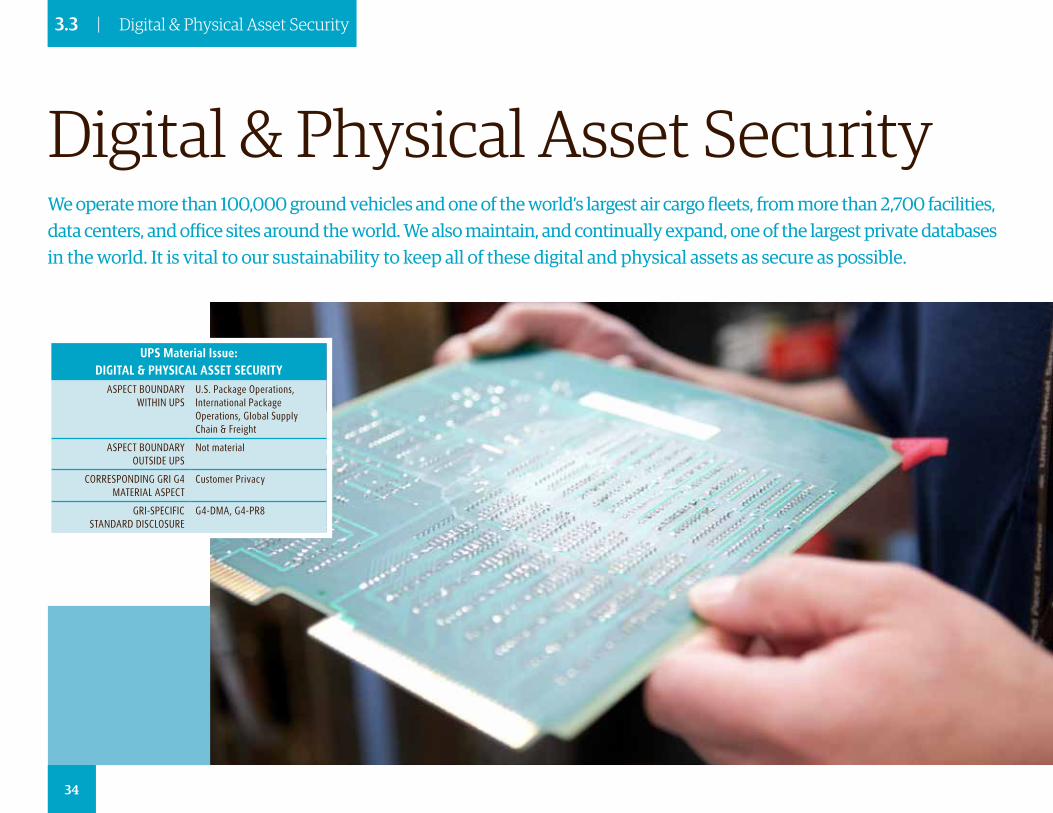
We operate more than 100,000 ground vehicles and one of the world’s largest air cargo fleets, from more than 2,700 facilities, data centers, and office sites around the world. We also maintain, and continually expand, one of the largest private databases in the world. It is vital to our sustainability to keep all of these digital and physical assets as secure as possible.
34
3.3 | Digital & Physical Asset Security
Management Approach to Digital & Physical
Asset Security
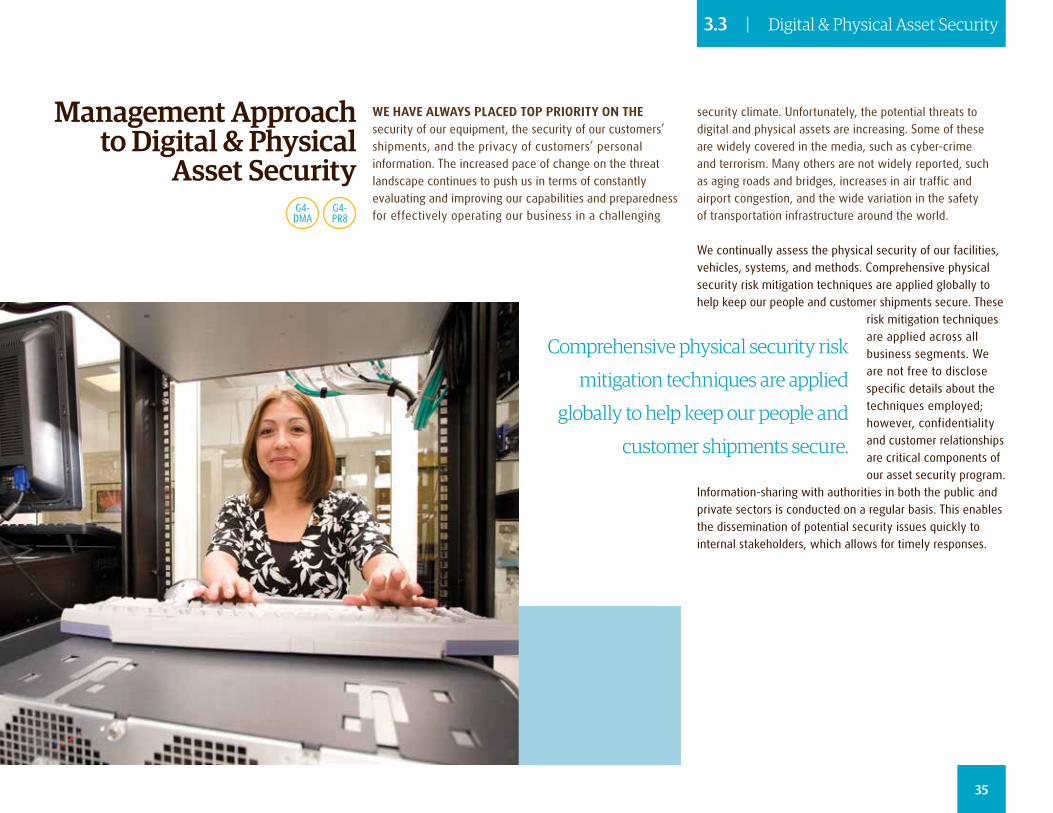
security climate. Unfortunately, the potential threats to digital and physical assets are increasing. Some of these are widely covered in the media, such as cyber-crime and terrorism. Many others are not widely reported, such as aging roads and bridges, increases in air traffic and airport congestion, and the wide variation in the safety of transportation infrastructure around the world.
We continually assess the physical security of our facilities, vehicles, systems, and methods. Comprehensive physical security risk mitigation techniques are applied globally to help keep our people and customer shipments secure. These
risk mitigation techniques are applied across all business segments. We are not free to disclose specific details about the techniques employed; however, confidentiality and customer relationships are critical components of our asset security program.
Information-sharing with authorities in both the public and private sectors is conducted on a regular basis. This enables the dissemination of potential security issues quickly to internal stakeholders, which allows for timely responses.
Comprehensive physical security risk
mitigation techniques are applied
globally to help keep our people and
customer shipments secure.
WE HAVE ALWAYS PLACED TOP PRIORITY ON THE security of our equipment, the security of our customers’ shipments, and the privacy of customers’ personal information. The increased pace of change on the threat landscape continues to push us in terms of constantly evaluating and improving our capabilities and preparedness for effectively operating our business in a challenging
G4- PR8
G4-DMA
35
3.3 | Digital & Physical Asset Security
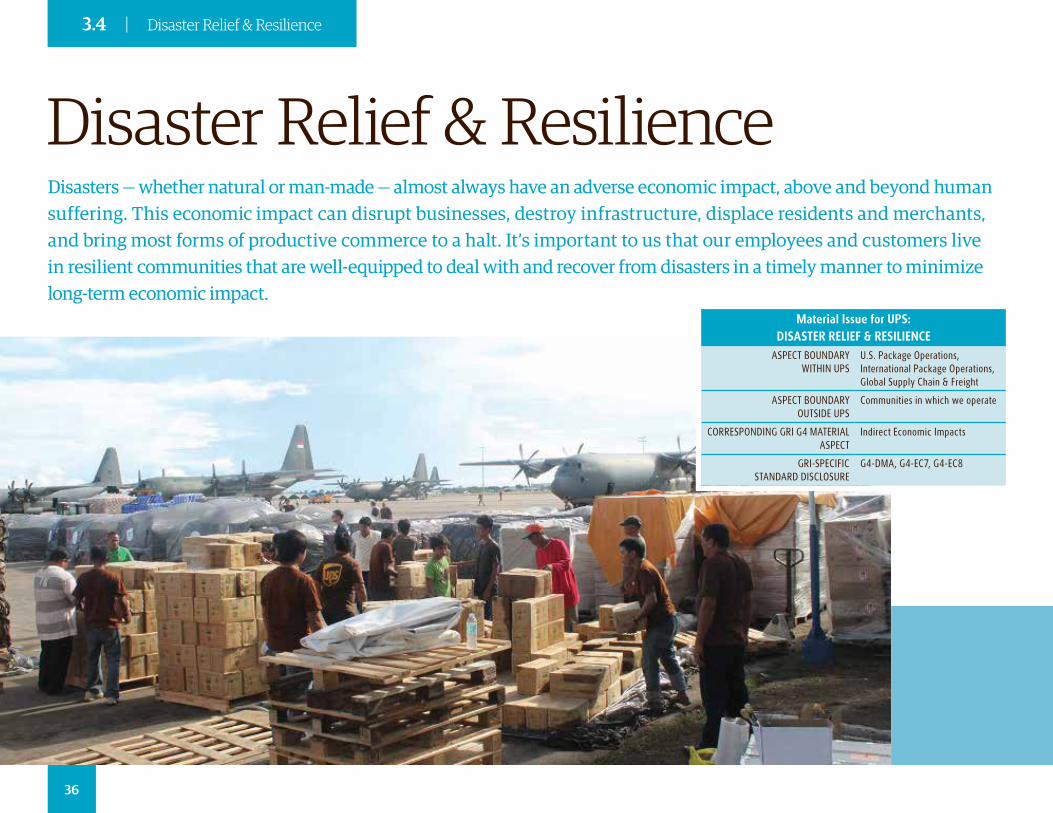
Material Issue for UPS: DISASTER RELIEF & RESILIENCE
ASPECT BOUNDARY WITHIN UPS
U.S. Package Operations, International Package Operations, Global Supply Chain & Freight
ASPECT BOUNDARY OUTSIDE UPS
Communities in which we operate
CORRESPONDING GRI G4 MATERIAL ASPECT
Indirect Economic Impacts
GRI-SPECIFIC STANDARD DISCLOSURE
G4-DMA, G4-EC7, G4-EC8
Disaster Relief & ResilienceDisasters — whether natural or man-made — almost always have an adverse economic impact, above and beyond human suffering. This economic impact can disrupt businesses, destroy infrastructure, displace residents and merchants, and bring most forms of productive commerce to a halt. It’s important to us that our employees and customers live in resilient communities that are well-equipped to deal with and recover from disasters in a timely manner to minimize long-term economic impact.
36
3.4 | Disaster Relief & Resilience
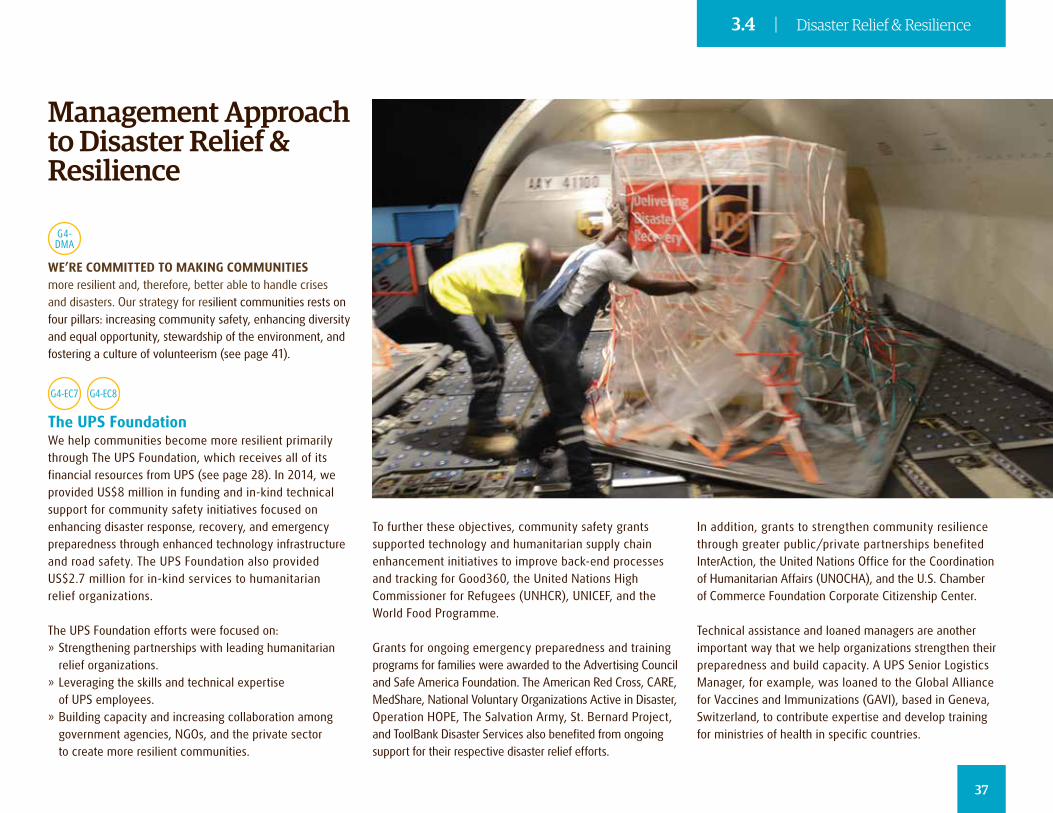
G4- DMA
WE’RE COMMITTED TO MAKING COMMUNITIES more resilient and, therefore, better able to handle crises and disasters. Our strategy for resilient communities rests on four pillars: increasing community safety, enhancing diversity and equal opportunity, stewardship of the environment, and fostering a culture of volunteerism (see page 41).
G4-EC7 G4-EC8
The UPS FoundationWe help communities become more resilient primarily through The UPS Foundation, which receives all of its financial resources from UPS (see page 28). In 2014, we provided US$8 million in funding and in-kind technical support for community safety initiatives focused on enhancing disaster response, recovery, and emergency preparedness through enhanced technology infrastructure and road safety. The UPS Foundation also provided US$2.7 million for in-kind services to humanitarian relief organizations.
The UPS Foundation efforts were focused on: » Strengthening partnerships with leading humanitarian relief organizations.
» Leveraging the skills and technical expertise of UPS employees.
» Building capacity and increasing collaboration among government agencies, NGOs, and the private sector to create more resilient communities.
To further these objectives, community safety grants supported technology and humanitarian supply chain enhancement initiatives to improve back-end processes and tracking for Good360, the United Nations High Commissioner for Refugees (UNHCR), UNICEF, and the World Food Programme.
Grants for ongoing emergency preparedness and training programs for families were awarded to the Advertising Council and Safe America Foundation. The American Red Cross, CARE, MedShare, National Voluntary Organizations Active in Disaster, Operation HOPE, The Salvation Army, St. Bernard Project, and ToolBank Disaster Services also benefited from ongoing support for their respective disaster relief efforts.
Management Approach to Disaster Relief & Resilience
In addition, grants to strengthen community resilience through greater public/private partnerships benefited InterAction, the United Nations Office for the Coordination of Humanitarian Affairs (UNOCHA), and the U.S. Chamber of Commerce Foundation Corporate Citizenship Center.
Technical assistance and loaned managers are another important way that we help organizations strengthen their preparedness and build capacity. A UPS Senior Logistics Manager, for example, was loaned to the Global Alliance for Vaccines and Immunizations (GAVI), based in Geneva, Switzerland, to contribute expertise and develop training for ministries of health in specific countries.
37
3.4 | Disaster Relief & Resilience
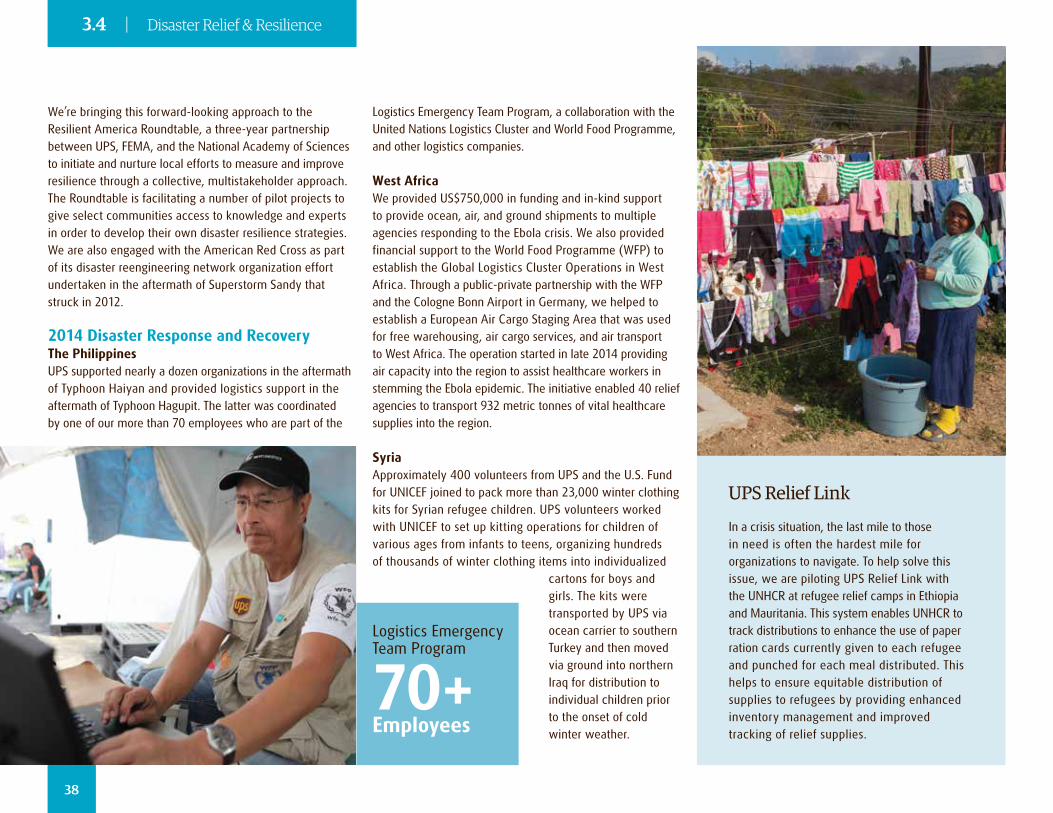
We’re bringing this forward-looking approach to the Resilient America Roundtable, a three-year partnership between UPS, FEMA, and the National Academy of Sciences to initiate and nurture local efforts to measure and improve resilience through a collective, multistakeholder approach. The Roundtable is facilitating a number of pilot projects to give select communities access to knowledge and experts in order to develop their own disaster resilience strategies. We are also engaged with the American Red Cross as part of its disaster reengineering network organization effort undertaken in the aftermath of Superstorm Sandy that struck in 2012.
2014 Disaster Response and RecoveryThe PhilippinesUPS supported nearly a dozen organizations in the aftermath of Typhoon Haiyan and provided logistics support in the aftermath of Typhoon Hagupit. The latter was coordinated by one of our more than 70 employees who are part of the
UPS Relief Link
In a crisis situation, the last mile to those in need is often the hardest mile for organizations to navigate. To help solve this issue, we are piloting UPS Relief Link with the UNHCR at refugee relief camps in Ethiopia and Mauritania. This system enables UNHCR to track distributions to enhance the use of paper ration cards currently given to each refugee and punched for each meal distributed. This helps to ensure equitable distribution of supplies to refugees by providing enhanced inventory management and improved tracking of relief supplies.
Logistics Emergency Team Program, a collaboration with the United Nations Logistics Cluster and World Food Programme, and other logistics companies.
West AfricaWe provided US$750,000 in funding and in-kind support to provide ocean, air, and ground shipments to multiple agencies responding to the Ebola crisis. We also provided financial support to the World Food Programme (WFP) to establish the Global Logistics Cluster Operations in West Africa. Through a public-private partnership with the WFP and the Cologne Bonn Airport in Germany, we helped to establish a European Air Cargo Staging Area that was used for free warehousing, air cargo services, and air transport to West Africa. The operation started in late 2014 providing air capacity into the region to assist healthcare workers in stemming the Ebola epidemic. The initiative enabled 40 relief agencies to transport 932 metric tonnes of vital healthcare supplies into the region.
SyriaApproximately 400 volunteers from UPS and the U.S. Fund for UNICEF joined to pack more than 23,000 winter clothing kits for Syrian refugee children. UPS volunteers worked with UNICEF to set up kitting operations for children of various ages from infants to teens, organizing hundreds of thousands of winter clothing items into individualized
cartons for boys and girls. The kits were transported by UPS via ocean carrier to southern Turkey and then moved via ground into northern Iraq for distribution to individual children prior to the onset of cold winter weather.
Logistics Emergency Team Program
70+Employees
38
3.4 | Disaster Relief & Resilience
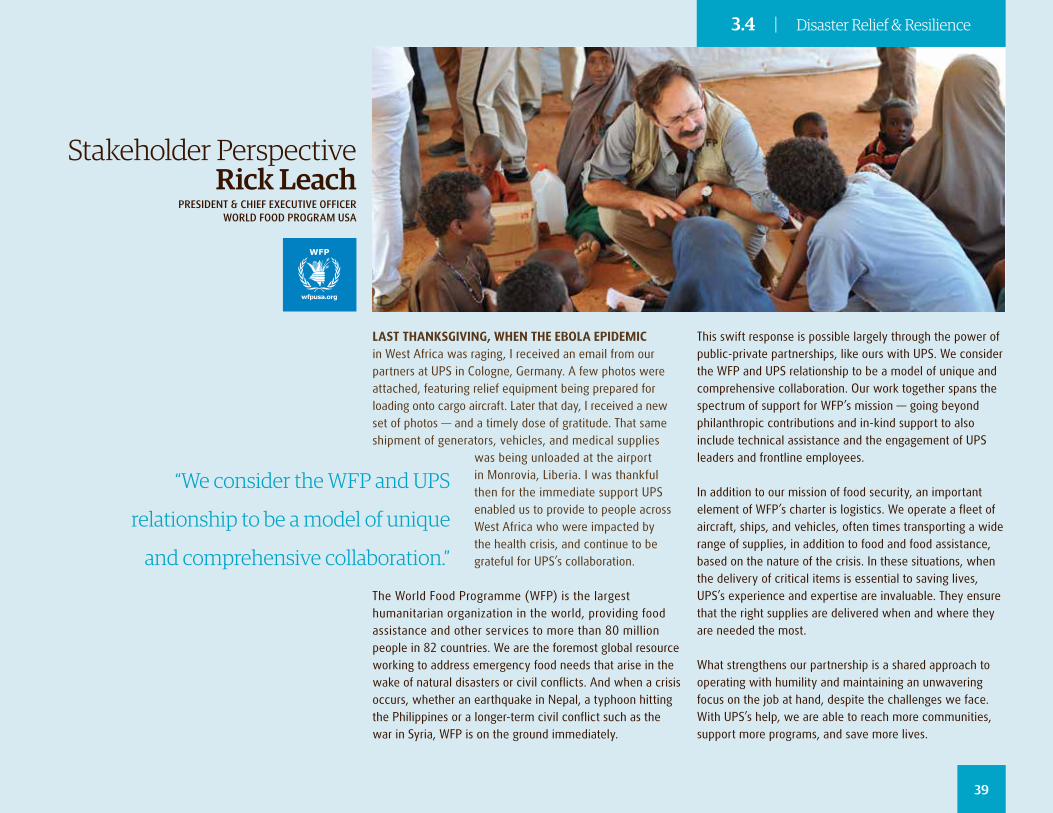
LAST THANKSGIVING, WHEN THE EBOLA EPIDEMIC in West Africa was raging, I received an email from our partners at UPS in Cologne, Germany. A few photos were attached, featuring relief equipment being prepared for loading onto cargo aircraft. Later that day, I received a new set of photos — and a timely dose of gratitude. That same shipment of generators, vehicles, and medical supplies
was being unloaded at the airport in Monrovia, Liberia. I was thankful then for the immediate support UPS enabled us to provide to people across West Africa who were impacted by the health crisis, and continue to be grateful for UPS’s collaboration.
The World Food Programme (WFP) is the largest humanitarian organization in the world, providing food assistance and other services to more than 80 million people in 82 countries. We are the foremost global resource working to address emergency food needs that arise in the wake of natural disasters or civil conflicts. And when a crisis occurs, whether an earthquake in Nepal, a typhoon hitting the Philippines or a longer-term civil conflict such as the war in Syria, WFP is on the ground immediately.
This swift response is possible largely through the power of public-private partnerships, like ours with UPS. We consider the WFP and UPS relationship to be a model of unique and comprehensive collaboration. Our work together spans the spectrum of support for WFP’s mission — going beyond philanthropic contributions and in-kind support to also include technical assistance and the engagement of UPS leaders and frontline employees.
In addition to our mission of food security, an important element of WFP’s charter is logistics. We operate a fleet of aircraft, ships, and vehicles, often times transporting a wide range of supplies, in addition to food and food assistance, based on the nature of the crisis. In these situations, when the delivery of critical items is essential to saving lives, UPS’s experience and expertise are invaluable. They ensure that the right supplies are delivered when and where they are needed the most.
What strengthens our partnership is a shared approach to operating with humility and maintaining an unwavering focus on the job at hand, despite the challenges we face. With UPS’s help, we are able to reach more communities, support more programs, and save more lives.
“We consider the WFP and UPS
relationship to be a model of unique
and comprehensive collaboration.”
Stakeholder PerspectiveRick Leach
PRESIDENT & CHIEF EXECUTIVE OFFICERWORLD FOOD PROGRAM USA
39
3.4 | Disaster Relief & Resilience
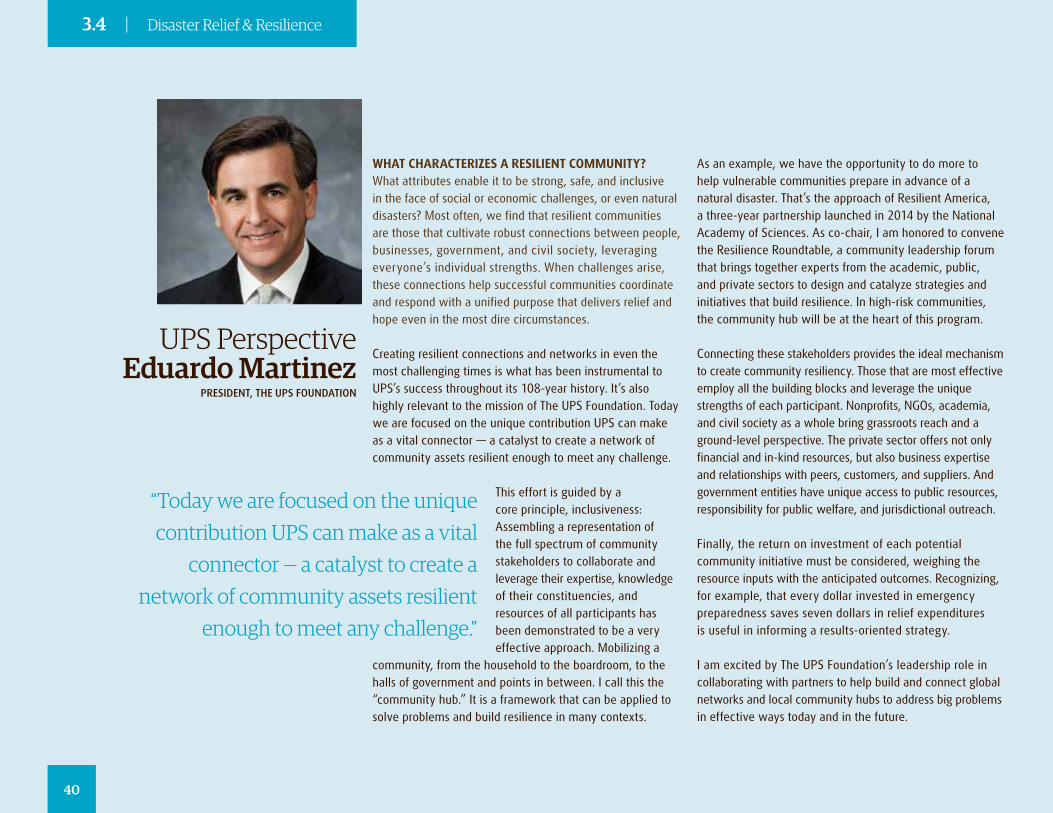
WHAT CHARACTERIZES A RESILIENT COMMUNITY? What attributes enable it to be strong, safe, and inclusive in the face of social or economic challenges, or even natural disasters? Most often, we find that resilient communities are those that cultivate robust connections between people, businesses, government, and civil society, leveraging everyone’s individual strengths. When challenges arise, these connections help successful communities coordinate and respond with a unified purpose that delivers relief and hope even in the most dire circumstances.
Creating resilient connections and networks in even the most challenging times is what has been instrumental to UPS’s success throughout its 108-year history. It’s also highly relevant to the mission of The UPS Foundation. Today we are focused on the unique contribution UPS can make as a vital connector — a catalyst to create a network of community assets resilient enough to meet any challenge.
This effort is guided by a core principle, inclusiveness: Assembling a representation of the full spectrum of community stakeholders to collaborate and leverage their expertise, knowledge of their constituencies, and resources of all participants has been demonstrated to be a very effective approach. Mobilizing a
community, from the household to the boardroom, to the halls of government and points in between. I call this the “community hub.” It is a framework that can be applied to solve problems and build resilience in many contexts.
As an example, we have the opportunity to do more to help vulnerable communities prepare in advance of a natural disaster. That’s the approach of Resilient America, a three-year partnership launched in 2014 by the National Academy of Sciences. As co-chair, I am honored to convene the Resilience Roundtable, a community leadership forum that brings together experts from the academic, public, and private sectors to design and catalyze strategies and initiatives that build resilience. In high-risk communities, the community hub will be at the heart of this program.
Connecting these stakeholders provides the ideal mechanism to create community resiliency. Those that are most effective employ all the building blocks and leverage the unique strengths of each participant. Nonprofits, NGOs, academia, and civil society as a whole bring grassroots reach and a ground-level perspective. The private sector offers not only financial and in-kind resources, but also business expertise and relationships with peers, customers, and suppliers. And government entities have unique access to public resources, responsibility for public welfare, and jurisdictional outreach.
Finally, the return on investment of each potential community initiative must be considered, weighing the resource inputs with the anticipated outcomes. Recognizing, for example, that every dollar invested in emergency preparedness saves seven dollars in relief expenditures is useful in informing a results-oriented strategy.
I am excited by The UPS Foundation’s leadership role in collaborating with partners to help build and connect global networks and local community hubs to address big problems in effective ways today and in the future.
“Today we are focused on the unique contribution UPS can make as a vital
connector — a catalyst to create a network of community assets resilient
enough to meet any challenge.”
UPS PerspectiveEduardo Martinez
PRESIDENT, THE UPS FOUNDATION
40
3.4 | Disaster Relief & Resilience
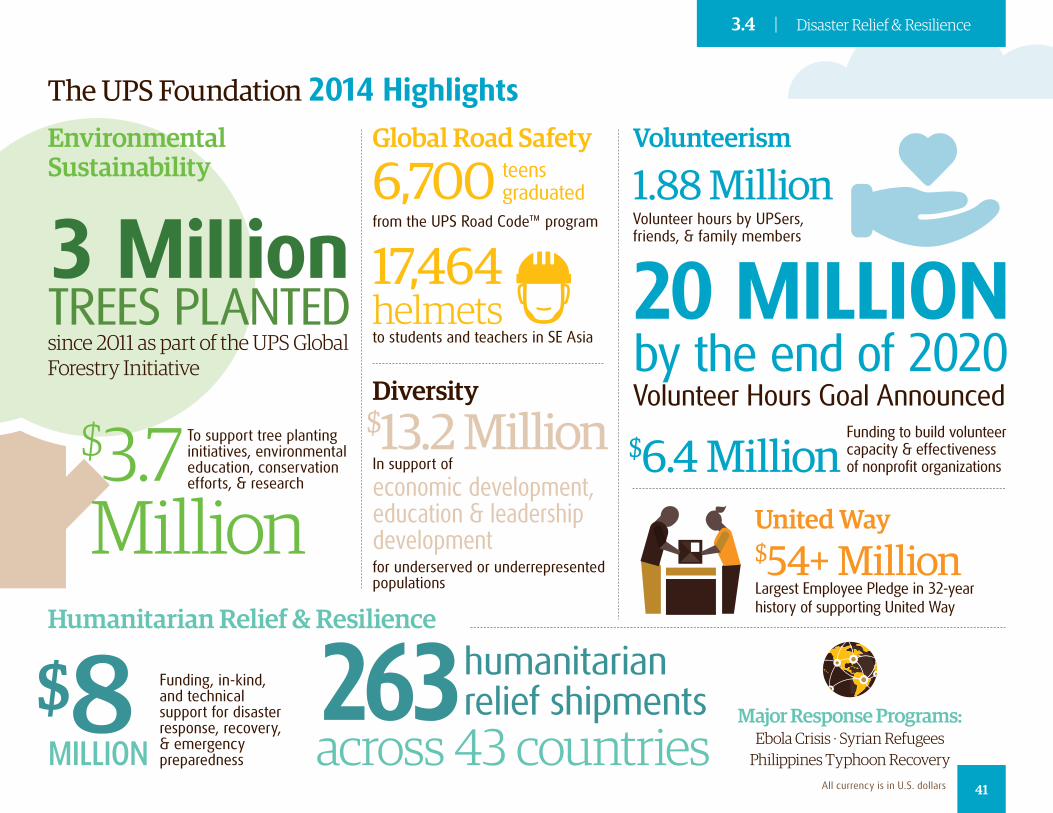
Global Road Safety
6,700 teens graduated
from the UPS Road Code™ program
17,464 helmets to students and teachers in SE Asia
The UPS Foundation 2014 Highlights
$8MILLION
$6.4 Million Funding to build volunteer capacity & effectiveness of nonprofit organizations
$13.2 Million
Environmental Sustainability
Funding, in-kind, and technical support for disaster response, recovery, & emergency preparedness
Humanitarian Relief & Resilience
263humanitarian relief shipments
across 43 countries
United Way$54+ MillionLargest Employee Pledge in 32-year history of supporting United Way
3 MillionTREES PLANTEDsince 2011 as part of the UPS Global Forestry Initiative
$3.7 Million
To support tree planting initiatives, environmental education, conservation efforts, & research
In support of
economic development, education & leadership developmentfor underserved or underrepresented populations
Diversity
1.88 MillionVolunteer hours by UPSers, friends, & family members
Volunteerism
20 MILLIONby the end of 2020 Volunteer Hours Goal Announced
Major Response Programs:Ebola Crisis · Syrian Refugees
Philippines Typhoon RecoveryAll currency is in U.S. dollars 41
3.4 | Disaster Relief & Resilience
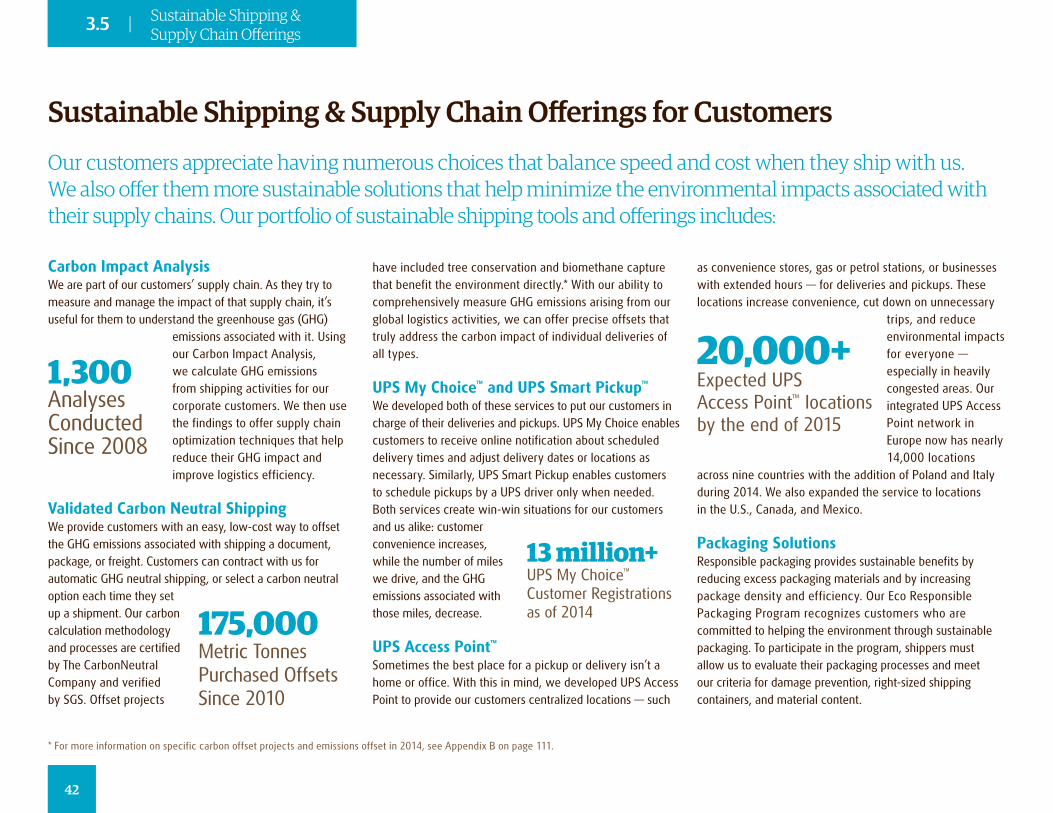
Our customers appreciate having numerous choices that balance speed and cost when they ship with us. We also offer them more sustainable solutions that help minimize the environmental impacts associated with their supply chains. Our portfolio of sustainable shipping tools and offerings includes:
Sustainable Shipping & Supply Chain Offerings for Customers
* For more information on specific carbon offset projects and emissions offset in 2014, see Appendix B on page 111.
Carbon Impact Analysis We are part of our customers’ supply chain. As they try to measure and manage the impact of that supply chain, it’s useful for them to understand the greenhouse gas (GHG)
emissions associated with it. Using our Carbon Impact Analysis, we calculate GHG emissions from shipping activities for our corporate customers. We then use the findings to offer supply chain optimization techniques that help reduce their GHG impact and improve logistics efficiency.
Validated Carbon Neutral ShippingWe provide customers with an easy, low-cost way to offset the GHG emissions associated with shipping a document, package, or freight. Customers can contract with us for automatic GHG neutral shipping, or select a carbon neutral option each time they set up a shipment. Our carbon calculation methodology and processes are certified by The CarbonNeutral Company and verified by SGS. Offset projects
have included tree conservation and biomethane capture that benefit the environment directly.* With our ability to comprehensively measure GHG emissions arising from our global logistics activities, we can offer precise offsets that truly address the carbon impact of individual deliveries of all types.
UPS My Choice™ and UPS Smart Pickup™
We developed both of these services to put our customers in charge of their deliveries and pickups. UPS My Choice enables customers to receive online notification about scheduled delivery times and adjust delivery dates or locations as necessary. Similarly, UPS Smart Pickup enables customers to schedule pickups by a UPS driver only when needed. Both services create win-win situations for our customers and us alike: customer convenience increases, while the number of miles we drive, and the GHG emissions associated with those miles, decrease.
UPS Access Point™ Sometimes the best place for a pickup or delivery isn’t a home or office. With this in mind, we developed UPS Access Point to provide our customers centralized locations — such
as convenience stores, gas or petrol stations, or businesses with extended hours — for deliveries and pickups. These locations increase convenience, cut down on unnecessary
trips, and reduce environmental impacts for everyone — especially in heavily congested areas. Our integrated UPS Access Point network in Europe now has nearly 14,000 locations
across nine countries with the addition of Poland and Italy during 2014. We also expanded the service to locations in the U.S., Canada, and Mexico.
Packaging SolutionsResponsible packaging provides sustainable benefits by reducing excess packaging materials and by increasing package density and efficiency. Our Eco Responsible Packaging Program recognizes customers who are committed to helping the environment through sustainable packaging. To participate in the program, shippers must allow us to evaluate their packaging processes and meet our criteria for damage prevention, right-sized shipping containers, and material content.
1,300 Analyses Conducted Since 2008
13 million+UPS My Choice™ Customer Registrations as of 2014175,000
Metric TonnesPurchased Offsets Since 2010
20,000+Expected UPS Access Point™ locationsby the end of 2015
42
3.5 | Sustainable Shipping & Supply Chain Offerings
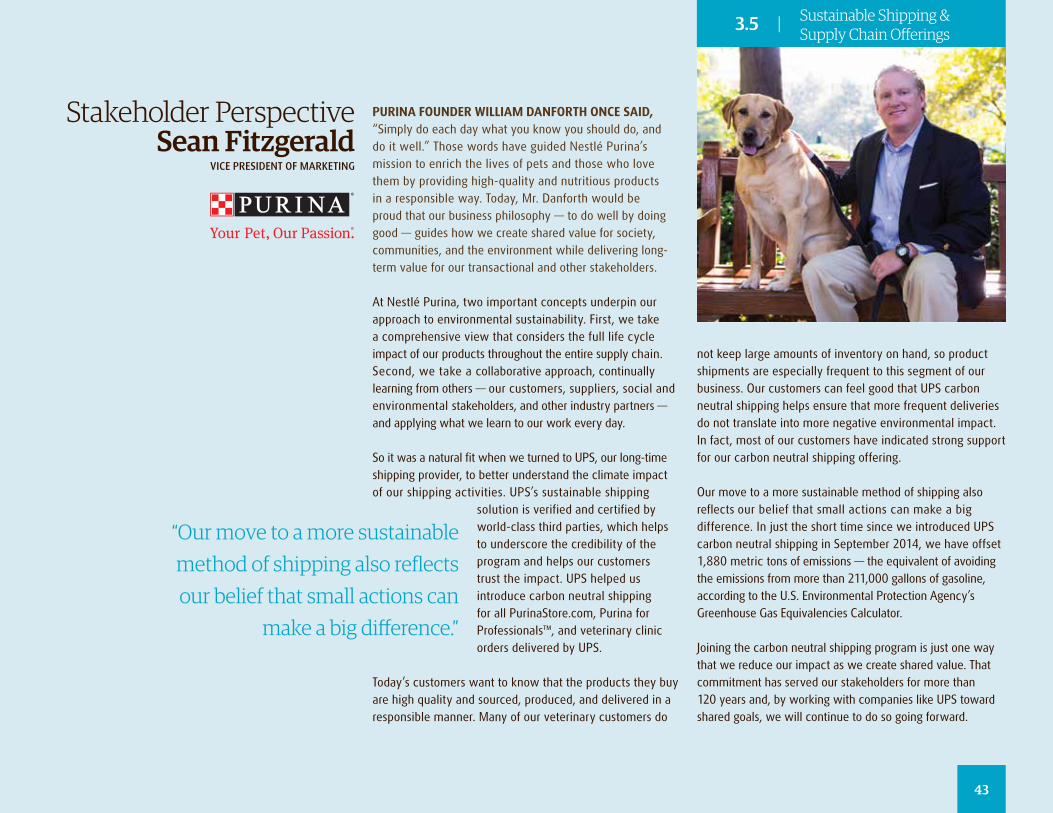
PURINA FOUNDER WILLIAM DANFORTH ONCE SAID, “Simply do each day what you know you should do, and do it well.” Those words have guided Nestlé Purina’s mission to enrich the lives of pets and those who love them by providing high-quality and nutritious products in a responsible way. Today, Mr. Danforth would be proud that our business philosophy — to do well by doing good — guides how we create shared value for society, communities, and the environment while delivering long-term value for our transactional and other stakeholders.
At Nestlé Purina, two important concepts underpin our approach to environmental sustainability. First, we take a comprehensive view that considers the full life cycle impact of our products throughout the entire supply chain. Second, we take a collaborative approach, continually learning from others — our customers, suppliers, social and environmental stakeholders, and other industry partners — and applying what we learn to our work every day.
So it was a natural fit when we turned to UPS, our long-time shipping provider, to better understand the climate impact of our shipping activities. UPS’s sustainable shipping
solution is verified and certified by world-class third parties, which helps to underscore the credibility of the program and helps our customers trust the impact. UPS helped us introduce carbon neutral shipping for all PurinaStore.com, Purina for Professionals™, and veterinary clinic orders delivered by UPS.
Today’s customers want to know that the products they buy are high quality and sourced, produced, and delivered in a responsible manner. Many of our veterinary customers do
not keep large amounts of inventory on hand, so product shipments are especially frequent to this segment of our business. Our customers can feel good that UPS carbon neutral shipping helps ensure that more frequent deliveries do not translate into more negative environmental impact. In fact, most of our customers have indicated strong support for our carbon neutral shipping offering.
Our move to a more sustainable method of shipping also reflects our belief that small actions can make a big difference. In just the short time since we introduced UPS carbon neutral shipping in September 2014, we have offset 1,880 metric tons of emissions — the equivalent of avoiding the emissions from more than 211,000 gallons of gasoline, according to the U.S. Environmental Protection Agency’s Greenhouse Gas Equivalencies Calculator.
Joining the carbon neutral shipping program is just one way that we reduce our impact as we create shared value. That commitment has served our stakeholders for more than 120 years and, by working with companies like UPS toward shared goals, we will continue to do so going forward.
“Our move to a more sustainable method of shipping also reflects our belief that small actions can
make a big difference.”
Stakeholder PerspectiveSean Fitzgerald
VICE PRESIDENT OF MARKETING
43
3.5 | Sustainable Shipping & Supply Chain Offerings
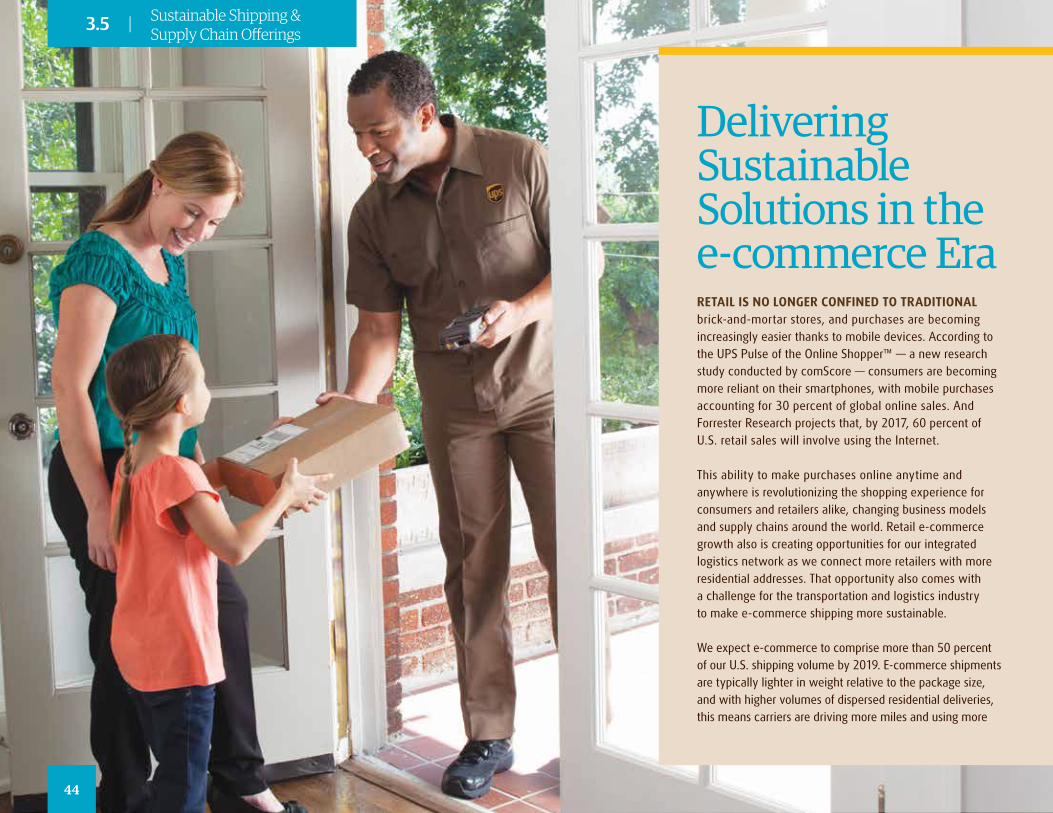
Delivering Sustainable Solutions in the e-commerce EraRETAIL IS NO LONGER CONFINED TO TRADITIONAL brick-and-mortar stores, and purchases are becoming increasingly easier thanks to mobile devices. According to the UPS Pulse of the Online Shopper™ — a new research study conducted by comScore — consumers are becoming more reliant on their smartphones, with mobile purchases accounting for 30 percent of global online sales. And Forrester Research projects that, by 2017, 60 percent of U.S. retail sales will involve using the Internet.
This ability to make purchases online anytime and anywhere is revolutionizing the shopping experience for consumers and retailers alike, changing business models and supply chains around the world. Retail e-commerce growth also is creating opportunities for our integrated logistics network as we connect more retailers with more residential addresses. That opportunity also comes with a challenge for the transportation and logistics industry to make e-commerce shipping more sustainable.
We expect e-commerce to comprise more than 50 percent of our U.S. shipping volume by 2019. E-commerce shipments are typically lighter in weight relative to the package size, and with higher volumes of dispersed residential deliveries, this means carriers are driving more miles and using more
44
3.5 | Sustainable Shipping & Supply Chain Offerings
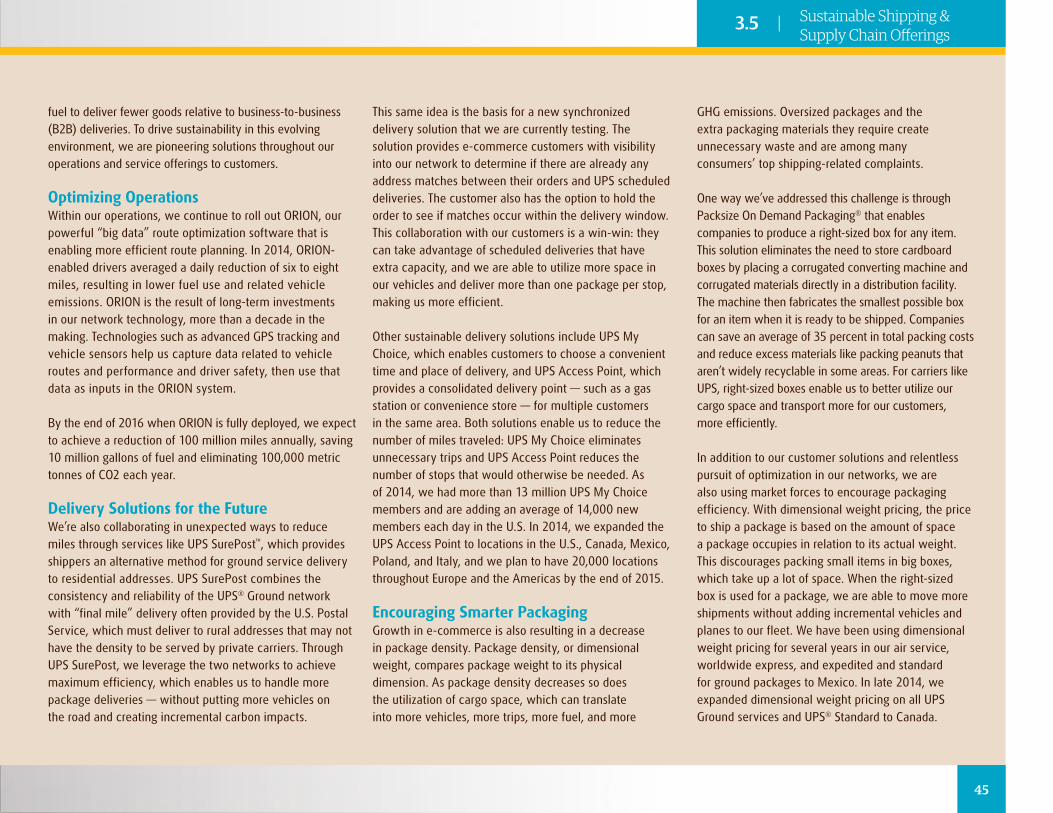
fuel to deliver fewer goods relative to business-to-business (B2B) deliveries. To drive sustainability in this evolving environment, we are pioneering solutions throughout our operations and service offerings to customers.
Optimizing OperationsWithin our operations, we continue to roll out ORION, our powerful “big data” route optimization software that is enabling more efficient route planning. In 2014, ORION-enabled drivers averaged a daily reduction of six to eight miles, resulting in lower fuel use and related vehicle emissions. ORION is the result of long-term investments in our network technology, more than a decade in the making. Technologies such as advanced GPS tracking and vehicle sensors help us capture data related to vehicle routes and performance and driver safety, then use that data as inputs in the ORION system.
By the end of 2016 when ORION is fully deployed, we expect to achieve a reduction of 100 million miles annually, saving 10 million gallons of fuel and eliminating 100,000 metric tonnes of CO2 each year.
Delivery Solutions for the FutureWe’re also collaborating in unexpected ways to reduce miles through services like UPS SurePost™, which provides shippers an alternative method for ground service delivery to residential addresses. UPS SurePost combines the consistency and reliability of the UPS® Ground network with “final mile” delivery often provided by the U.S. Postal Service, which must deliver to rural addresses that may not have the density to be served by private carriers. Through UPS SurePost, we leverage the two networks to achieve maximum efficiency, which enables us to handle more package deliveries — without putting more vehicles on the road and creating incremental carbon impacts.
This same idea is the basis for a new synchronized delivery solution that we are currently testing. The solution provides e-commerce customers with visibility into our network to determine if there are already any address matches between their orders and UPS scheduled deliveries. The customer also has the option to hold the order to see if matches occur within the delivery window. This collaboration with our customers is a win-win: they can take advantage of scheduled deliveries that have extra capacity, and we are able to utilize more space in our vehicles and deliver more than one package per stop, making us more efficient.
Other sustainable delivery solutions include UPS My Choice, which enables customers to choose a convenient time and place of delivery, and UPS Access Point, which provides a consolidated delivery point — such as a gas station or convenience store — for multiple customers in the same area. Both solutions enable us to reduce the number of miles traveled: UPS My Choice eliminates unnecessary trips and UPS Access Point reduces the number of stops that would otherwise be needed. As of 2014, we had more than 13 million UPS My Choice members and are adding an average of 14,000 new members each day in the U.S. In 2014, we expanded the UPS Access Point to locations in the U.S., Canada, Mexico, Poland, and Italy, and we plan to have 20,000 locations throughout Europe and the Americas by the end of 2015.
Encouraging Smarter PackagingGrowth in e-commerce is also resulting in a decrease in package density. Package density, or dimensional weight, compares package weight to its physical dimension. As package density decreases so does the utilization of cargo space, which can translate into more vehicles, more trips, more fuel, and more
GHG emissions. Oversized packages and the extra packaging materials they require create unnecessary waste and are among many consumers’ top shipping-related complaints.
One way we’ve addressed this challenge is through Packsize On Demand Packaging® that enables companies to produce a right-sized box for any item. This solution eliminates the need to store cardboard boxes by placing a corrugated converting machine and corrugated materials directly in a distribution facility. The machine then fabricates the smallest possible box for an item when it is ready to be shipped. Companies can save an average of 35 percent in total packing costs and reduce excess materials like packing peanuts that aren’t widely recyclable in some areas. For carriers like UPS, right-sized boxes enable us to better utilize our cargo space and transport more for our customers, more efficiently.
In addition to our customer solutions and relentless pursuit of optimization in our networks, we are also using market forces to encourage packaging efficiency. With dimensional weight pricing, the price to ship a package is based on the amount of space a package occupies in relation to its actual weight. This discourages packing small items in big boxes, which take up a lot of space. When the right-sized box is used for a package, we are able to move more shipments without adding incremental vehicles and planes to our fleet. We have been using dimensional weight pricing for several years in our air service, worldwide express, and expedited and standard for ground packages to Mexico. In late 2014, we expanded dimensional weight pricing on all UPS Ground services and UPS® Standard to Canada.
45
3.5 | Sustainable Shipping & Supply Chain Offerings
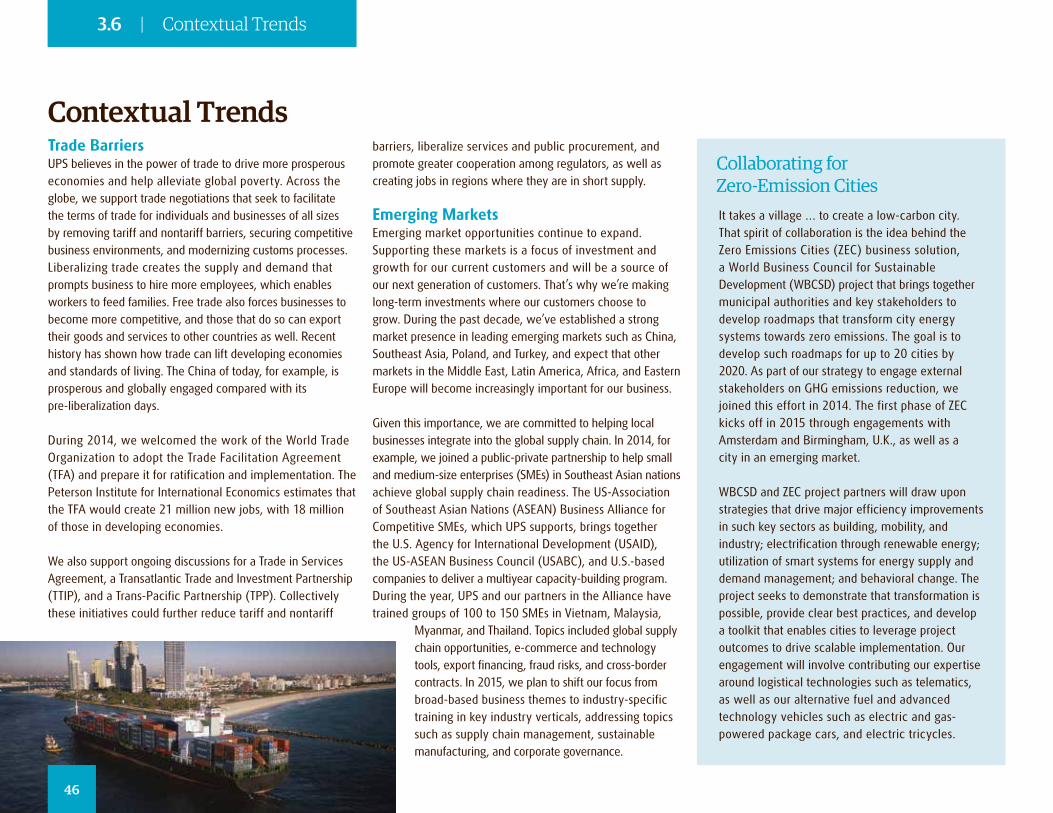
Contextual TrendsTrade BarriersUPS believes in the power of trade to drive more prosperous economies and help alleviate global poverty. Across the globe, we support trade negotiations that seek to facilitate the terms of trade for individuals and businesses of all sizes by removing tariff and nontariff barriers, securing competitive business environments, and modernizing customs processes. Liberalizing trade creates the supply and demand that prompts business to hire more employees, which enables workers to feed families. Free trade also forces businesses to become more competitive, and those that do so can export their goods and services to other countries as well. Recent history has shown how trade can lift developing economies and standards of living. The China of today, for example, is prosperous and globally engaged compared with its pre-liberalization days.
During 2014, we welcomed the work of the World Trade Organization to adopt the Trade Facilitation Agreement (TFA) and prepare it for ratification and implementation. The Peterson Institute for International Economics estimates that the TFA would create 21 million new jobs, with 18 million of those in developing economies.
We also support ongoing discussions for a Trade in Services Agreement, a Transatlantic Trade and Investment Partnership (TTIP), and a Trans-Pacific Partnership (TPP). Collectively these initiatives could further reduce tariff and nontariff
barriers, liberalize services and public procurement, and promote greater cooperation among regulators, as well as creating jobs in regions where they are in short supply.
Emerging MarketsEmerging market opportunities continue to expand. Supporting these markets is a focus of investment and growth for our current customers and will be a source of our next generation of customers. That’s why we’re making long-term investments where our customers choose to grow. During the past decade, we’ve established a strong market presence in leading emerging markets such as China, Southeast Asia, Poland, and Turkey, and expect that other markets in the Middle East, Latin America, Africa, and Eastern Europe will become increasingly important for our business.
Given this importance, we are committed to helping local businesses integrate into the global supply chain. In 2014, for example, we joined a public-private partnership to help small and medium-size enterprises (SMEs) in Southeast Asian nations achieve global supply chain readiness. The US-Association of Southeast Asian Nations (ASEAN) Business Alliance for Competitive SMEs, which UPS supports, brings together the U.S. Agency for International Development (USAID), the US-ASEAN Business Council (USABC), and U.S.-based companies to deliver a multiyear capacity-building program. During the year, UPS and our partners in the Alliance have trained groups of 100 to 150 SMEs in Vietnam, Malaysia,
Myanmar, and Thailand. Topics included global supply chain opportunities, e-commerce and technology tools, export financing, fraud risks, and cross-border contracts. In 2015, we plan to shift our focus from broad-based business themes to industry-specific training in key industry verticals, addressing topics such as supply chain management, sustainable manufacturing, and corporate governance.
It takes a village … to create a low-carbon city. That spirit of collaboration is the idea behind the Zero Emissions Cities (ZEC) business solution, a World Business Council for Sustainable Development (WBCSD) project that brings together municipal authorities and key stakeholders to develop roadmaps that transform city energy systems towards zero emissions. The goal is to develop such roadmaps for up to 20 cities by 2020. As part of our strategy to engage external stakeholders on GHG emissions reduction, we joined this effort in 2014. The first phase of ZEC kicks off in 2015 through engagements with Amsterdam and Birmingham, U.K., as well as a city in an emerging market.
WBCSD and ZEC project partners will draw upon strategies that drive major efficiency improvements in such key sectors as building, mobility, and industry; electrification through renewable energy; utilization of smart systems for energy supply and demand management; and behavioral change. The project seeks to demonstrate that transformation is possible, provide clear best practices, and develop a toolkit that enables cities to leverage project outcomes to drive scalable implementation. Our engagement will involve contributing our expertise around logistical technologies such as telematics, as well as our alternative fuel and advanced technology vehicles such as electric and gas-powered package cars, and electric tricycles.
Collaborating for Zero-Emission Cities
46
3.6 | Contextual Trends
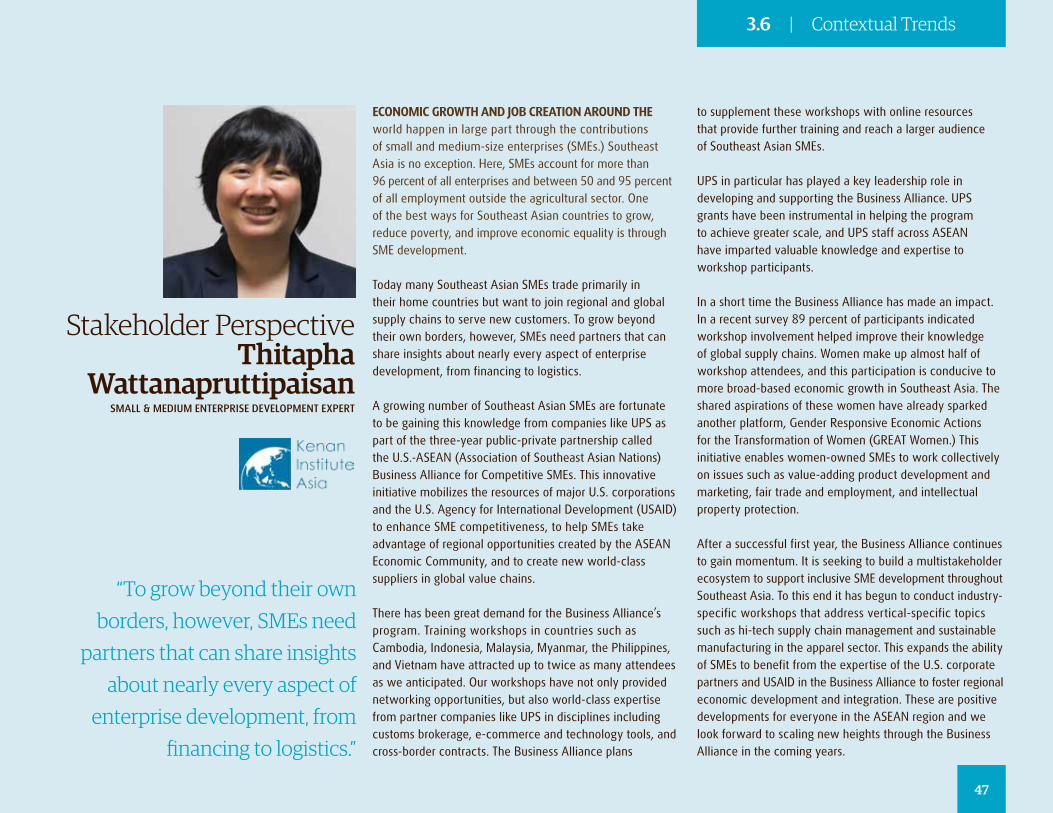
ECONOMIC GROWTH AND JOB CREATION AROUND THE world happen in large part through the contributions of small and medium-size enterprises (SMEs.) Southeast Asia is no exception. Here, SMEs account for more than 96 percent of all enterprises and between 50 and 95 percent of all employment outside the agricultural sector. One of the best ways for Southeast Asian countries to grow, reduce poverty, and improve economic equality is through SME development.
Today many Southeast Asian SMEs trade primarily in their home countries but want to join regional and global supply chains to serve new customers. To grow beyond their own borders, however, SMEs need partners that can share insights about nearly every aspect of enterprise development, from financing to logistics.
A growing number of Southeast Asian SMEs are fortunate to be gaining this knowledge from companies like UPS as part of the three-year public-private partnership called the U.S.-ASEAN (Association of Southeast Asian Nations) Business Alliance for Competitive SMEs. This innovative initiative mobilizes the resources of major U.S. corporations and the U.S. Agency for International Development (USAID) to enhance SME competitiveness, to help SMEs take advantage of regional opportunities created by the ASEAN Economic Community, and to create new world-class suppliers in global value chains.
There has been great demand for the Business Alliance’s program. Training workshops in countries such as Cambodia, Indonesia, Malaysia, Myanmar, the Philippines, and Vietnam have attracted up to twice as many attendees as we anticipated. Our workshops have not only provided networking opportunities, but also world-class expertise from partner companies like UPS in disciplines including customs brokerage, e-commerce and technology tools, and cross-border contracts. The Business Alliance plans
to supplement these workshops with online resources that provide further training and reach a larger audience of Southeast Asian SMEs.
UPS in particular has played a key leadership role in developing and supporting the Business Alliance. UPS grants have been instrumental in helping the program to achieve greater scale, and UPS staff across ASEAN have imparted valuable knowledge and expertise to workshop participants.
In a short time the Business Alliance has made an impact. In a recent survey 89 percent of participants indicated workshop involvement helped improve their knowledge of global supply chains. Women make up almost half of workshop attendees, and this participation is conducive to more broad-based economic growth in Southeast Asia. The shared aspirations of these women have already sparked another platform, Gender Responsive Economic Actions for the Transformation of Women (GREAT Women.) This initiative enables women-owned SMEs to work collectively on issues such as value-adding product development and marketing, fair trade and employment, and intellectual property protection.
After a successful first year, the Business Alliance continues to gain momentum. It is seeking to build a multistakeholder ecosystem to support inclusive SME development throughout Southeast Asia. To this end it has begun to conduct industry- specific workshops that address vertical-specific topics such as hi-tech supply chain management and sustainable manufacturing in the apparel sector. This expands the ability of SMEs to benefit from the expertise of the U.S. corporate partners and USAID in the Business Alliance to foster regional economic development and integration. These are positive developments for everyone in the ASEAN region and we look forward to scaling new heights through the Business Alliance in the coming years.
“To grow beyond their own borders, however, SMEs need
partners that can share insights about nearly every aspect of
enterprise development, from financing to logistics.”
Stakeholder PerspectiveThitapha
WattanapruttipaisanSMALL & MEDIUM ENTERPRISE DEVELOPMENT EXPERT
47
3.6 | Contextual Trends
04Committed to More™
Environmental Responsibility
48
As our business continues to grow, we’re working relentlessly to meet heightened demand in ways that consume less energy and produce fewer emissions. Our approach is collaborative and leaves “no stone unturned” as we bring together state-of-the-art technologies, big data, innovative thinking, and engaged people to find solutions that meet our business needs, support our customers, and benefit the environment.
In this Chapter:Material Aspects p. 50
Shared Management Approach p. 52
Energy & Emissions p. 54
UPS Corporate Climate Change Statement p. 63
Fuel Supply p. 64
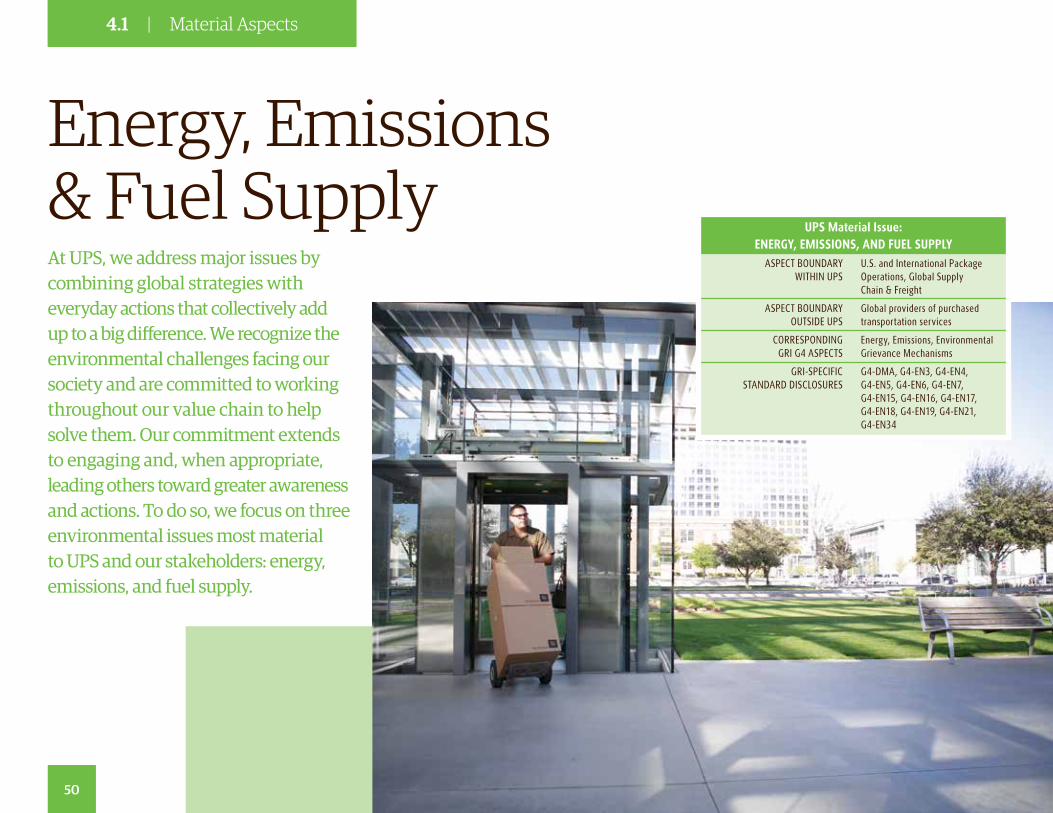
Energy, Emissions & Fuel Supply
UPS Material Issue: ENERGY, EMISSIONS, AND FUEL SUPPLY
ASPECT BOUNDARY WITHIN UPS
U.S. and International Package Operations, Global Supply Chain & Freight
ASPECT BOUNDARY OUTSIDE UPS
Global providers of purchased transportation services
CORRESPONDING GRI G4 ASPECTS
Energy, Emissions, Environmental Grievance Mechanisms
GRI-SPECIFIC STANDARD DISCLOSURES
G4-DMA, G4-EN3, G4-EN4, G4-EN5, G4-EN6, G4-EN7, G4-EN15, G4-EN16, G4-EN17, G4-EN18, G4-EN19, G4-EN21, G4-EN34
At UPS, we address major issues by combining global strategies with everyday actions that collectively add up to a big difference. We recognize the environmental challenges facing our society and are committed to working throughout our value chain to help solve them. Our commitment extends to engaging and, when appropriate, leading others toward greater awareness and actions. To do so, we focus on three environmental issues most material to UPS and our stakeholders: energy, emissions, and fuel supply.
50
4.1 | Material Aspects
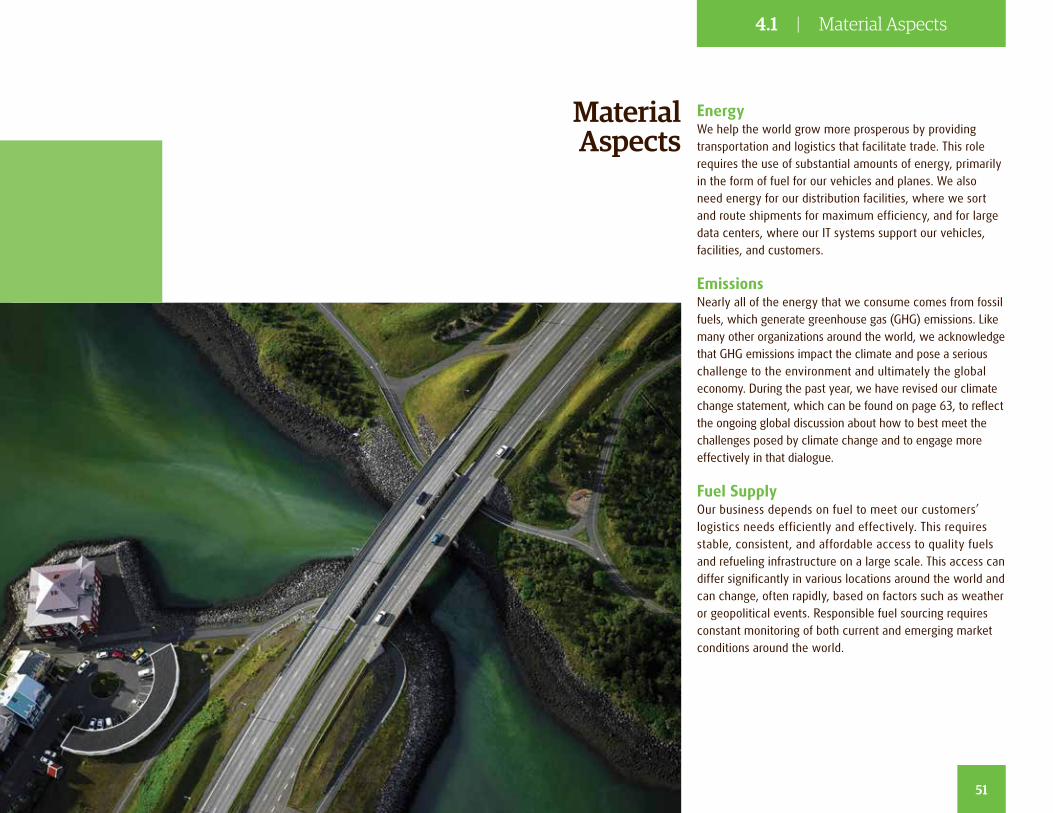
Material Aspects
EnergyWe help the world grow more prosperous by providing transportation and logistics that facilitate trade. This role requires the use of substantial amounts of energy, primarily in the form of fuel for our vehicles and planes. We also need energy for our distribution facilities, where we sort and route shipments for maximum efficiency, and for large data centers, where our IT systems support our vehicles, facilities, and customers.
Emissions Nearly all of the energy that we consume comes from fossil fuels, which generate greenhouse gas (GHG) emissions. Like many other organizations around the world, we acknowledge that GHG emissions impact the climate and pose a serious challenge to the environment and ultimately the global economy. During the past year, we have revised our climate change statement, which can be found on page 63, to reflect the ongoing global discussion about how to best meet the challenges posed by climate change and to engage more effectively in that dialogue.
Fuel Supply Our business depends on fuel to meet our customers’ logistics needs efficiently and effectively. This requires stable, consistent, and affordable access to quality fuels and refueling infrastructure on a large scale. This access can differ significantly in various locations around the world and can change, often rapidly, based on factors such as weather or geopolitical events. Responsible fuel sourcing requires constant monitoring of both current and emerging market conditions around the world.
51
4.1 | Material Aspects
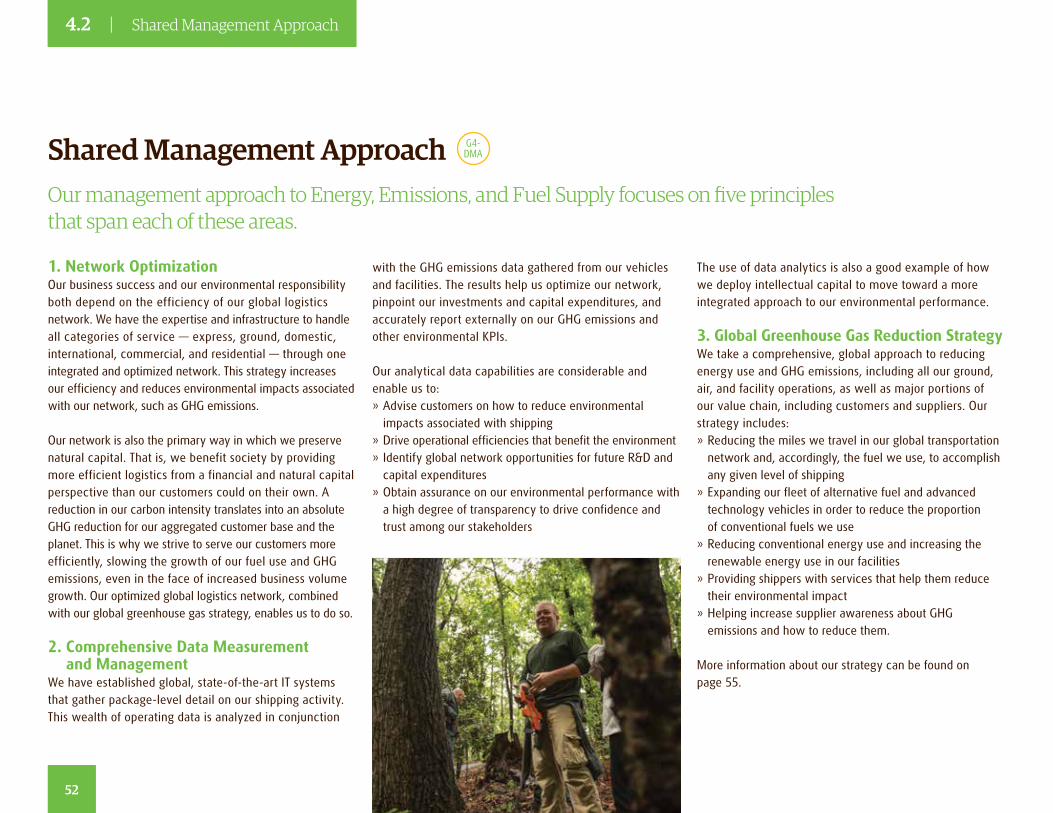
Our management approach to Energy, Emissions, and Fuel Supply focuses on five principles that span each of these areas.
1. Network OptimizationOur business success and our environmental responsibility both depend on the efficiency of our global logistics network. We have the expertise and infrastructure to handle all categories of service — express, ground, domestic, international, commercial, and residential — through one integrated and optimized network. This strategy increases our efficiency and reduces environmental impacts associated with our network, such as GHG emissions.
Our network is also the primary way in which we preserve natural capital. That is, we benefit society by providing more efficient logistics from a financial and natural capital perspective than our customers could on their own. A reduction in our carbon intensity translates into an absolute GHG reduction for our aggregated customer base and the planet. This is why we strive to serve our customers more efficiently, slowing the growth of our fuel use and GHG emissions, even in the face of increased business volume growth. Our optimized global logistics network, combined with our global greenhouse gas strategy, enables us to do so.
2. Comprehensive Data Measurement and Management
We have established global, state-of-the-art IT systems that gather package-level detail on our shipping activity. This wealth of operating data is analyzed in conjunction
with the GHG emissions data gathered from our vehicles and facilities. The results help us optimize our network, pinpoint our investments and capital expenditures, and accurately report externally on our GHG emissions and other environmental KPIs.
Our analytical data capabilities are considerable and enable us to: » Advise customers on how to reduce environmental impacts associated with shipping
» Drive operational efficiencies that benefit the environment » Identify global network opportunities for future R&D and capital expenditures
» Obtain assurance on our environmental performance with a high degree of transparency to drive confidence and trust among our stakeholders
The use of data analytics is also a good example of how we deploy intellectual capital to move toward a more integrated approach to our environmental performance.
3. Global Greenhouse Gas Reduction StrategyWe take a comprehensive, global approach to reducing energy use and GHG emissions, including all our ground, air, and facility operations, as well as major portions of our value chain, including customers and suppliers. Our strategy includes: » Reducing the miles we travel in our global transportation network and, accordingly, the fuel we use, to accomplish any given level of shipping
» Expanding our fleet of alternative fuel and advanced technology vehicles in order to reduce the proportion of conventional fuels we use
» Reducing conventional energy use and increasing the renewable energy use in our facilities
» Providing shippers with services that help them reduce their environmental impact
» Helping increase supplier awareness about GHG emissions and how to reduce them.
More information about our strategy can be found on page 55.
Shared Management Approach G4-DMA
52
4.2 | Shared Management Approach
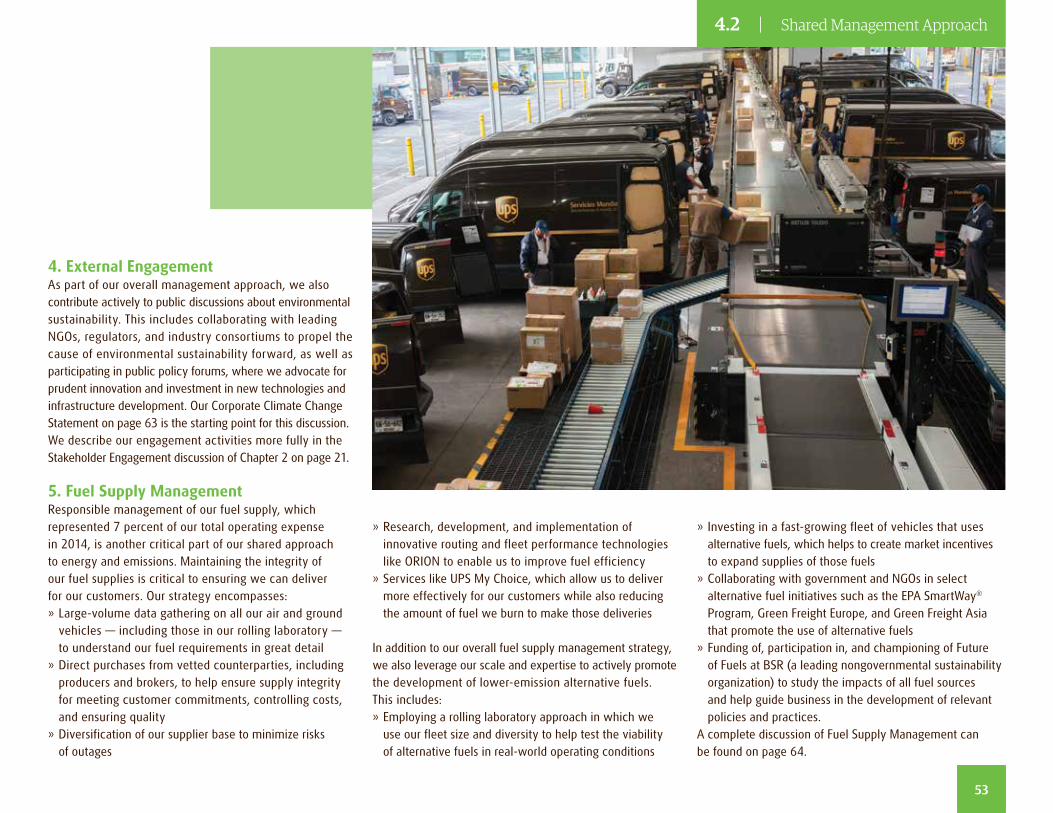
69
4. External EngagementAs part of our overall management approach, we also contribute actively to public discussions about environmental sustainability. This includes collaborating with leading NGOs, regulators, and industry consortiums to propel the cause of environmental sustainability forward, as well as participating in public policy forums, where we advocate for prudent innovation and investment in new technologies and infrastructure development. Our Corporate Climate Change Statement on page 63 is the starting point for this discussion. We describe our engagement activities more fully in the Stakeholder Engagement discussion of Chapter 2 on page 21.
5. Fuel Supply Management Responsible management of our fuel supply, which represented 7 percent of our total operating expense in 2014, is another critical part of our shared approach to energy and emissions. Maintaining the integrity of our fuel supplies is critical to ensuring we can deliver for our customers. Our strategy encompasses: » Large-volume data gathering on all our air and ground vehicles — including those in our rolling laboratory — to understand our fuel requirements in great detail
» Direct purchases from vetted counterparties, including producers and brokers, to help ensure supply integrity for meeting customer commitments, controlling costs, and ensuring quality
» Diversification of our supplier base to minimize risks of outages
» Research, development, and implementation of innovative routing and fleet performance technologies like ORION to enable us to improve fuel efficiency
» Services like UPS My Choice, which allow us to deliver more effectively for our customers while also reducing the amount of fuel we burn to make those deliveries
In addition to our overall fuel supply management strategy, we also leverage our scale and expertise to actively promote the development of lower-emission alternative fuels. This includes: » Employing a rolling laboratory approach in which we use our fleet size and diversity to help test the viability of alternative fuels in real-world operating conditions
» Investing in a fast-growing fleet of vehicles that uses alternative fuels, which helps to create market incentives to expand supplies of those fuels
» Collaborating with government and NGOs in select alternative fuel initiatives such as the EPA SmartWay® Program, Green Freight Europe, and Green Freight Asia that promote the use of alternative fuels
» Funding of, participation in, and championing of Future of Fuels at BSR (a leading nongovernmental sustainability organization) to study the impacts of all fuel sources and help guide business in the development of relevant policies and practices.
A complete discussion of Fuel Supply Management can be found on page 64.
53
4.2 | Shared Management Approach
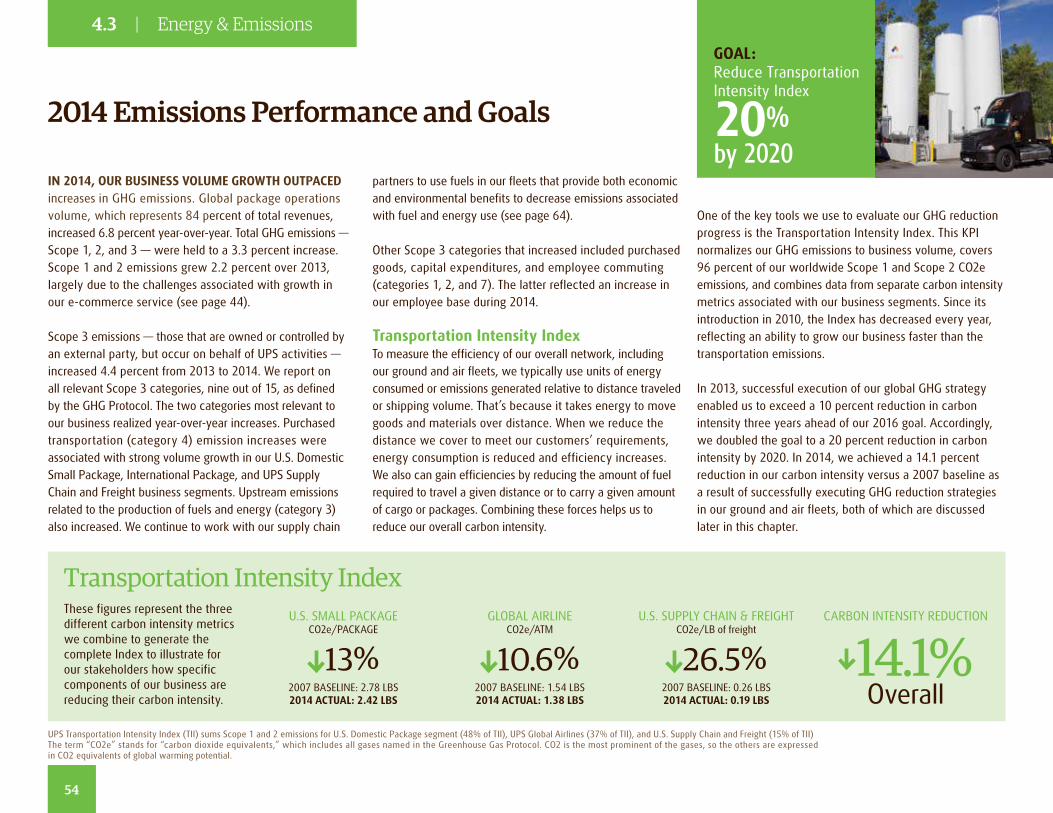
IN 2014, OUR BUSINESS VOLUME GROWTH OUTPACED increases in GHG emissions. Global package operations volume, which represents 84 percent of total revenues, increased 6.8 percent year-over-year. Total GHG emissions — Scope 1, 2, and 3 — were held to a 3.3 percent increase. Scope 1 and 2 emissions grew 2.2 percent over 2013, largely due to the challenges associated with growth in our e-commerce service (see page 44).
Scope 3 emissions — those that are owned or controlled by an external party, but occur on behalf of UPS activities — increased 4.4 percent from 2013 to 2014. We report on all relevant Scope 3 categories, nine out of 15, as defined by the GHG Protocol. The two categories most relevant to our business realized year-over-year increases. Purchased transportation (category 4) emission increases were associated with strong volume growth in our U.S. Domestic Small Package, International Package, and UPS Supply Chain and Freight business segments. Upstream emissions related to the production of fuels and energy (category 3) also increased. We continue to work with our supply chain
2014 Emissions Performance and Goals
UPS Transportation Intensity Index (TII) sums Scope 1 and 2 emissions for U.S. Domestic Package segment (48% of TII), UPS Global Airlines (37% of TII), and U.S. Supply Chain and Freight (15% of TII) The term “CO2e” stands for “carbon dioxide equivalents,” which includes all gases named in the Greenhouse Gas Protocol. CO2 is the most prominent of the gases, so the others are expressed in CO2 equivalents of global warming potential.
GOAL: Reduce Transportation Intensity Index
20% by 2020
partners to use fuels in our fleets that provide both economic and environmental benefits to decrease emissions associated with fuel and energy use (see page 64).
Other Scope 3 categories that increased included purchased goods, capital expenditures, and employee commuting (categories 1, 2, and 7). The latter reflected an increase in our employee base during 2014.
Transportation Intensity IndexTo measure the efficiency of our overall network, including our ground and air fleets, we typically use units of energy consumed or emissions generated relative to distance traveled or shipping volume. That’s because it takes energy to move goods and materials over distance. When we reduce the distance we cover to meet our customers’ requirements, energy consumption is reduced and efficiency increases. We also can gain efficiencies by reducing the amount of fuel required to travel a given distance or to carry a given amount of cargo or packages. Combining these forces helps us to reduce our overall carbon intensity.
One of the key tools we use to evaluate our GHG reduction progress is the Transportation Intensity Index. This KPI normalizes our GHG emissions to business volume, covers 96 percent of our worldwide Scope 1 and Scope 2 CO2e emissions, and combines data from separate carbon intensity metrics associated with our business segments. Since its introduction in 2010, the Index has decreased every year, reflecting an ability to grow our business faster than the transportation emissions.
In 2013, successful execution of our global GHG strategy enabled us to exceed a 10 percent reduction in carbon intensity three years ahead of our 2016 goal. Accordingly, we doubled the goal to a 20 percent reduction in carbon intensity by 2020. In 2014, we achieved a 14.1 percent reduction in our carbon intensity versus a 2007 baseline as a result of successfully executing GHG reduction strategies in our ground and air fleets, both of which are discussed later in this chapter.
26.5%2007 BASELINE: 0.26 LBS 2014 ACTUAL: 0.19 LBS
13%2007 BASELINE: 2.78 LBS2014 ACTUAL: 2.42 LBS
U.S. SMALL PACKAGECO2e/PACKAGE
10.6%2007 BASELINE: 1.54 LBS2014 ACTUAL: 1.38 LBS
GLOBAL AIRLINECO2e/ATM
U.S. SUPPLY CHAIN & FREIGHTCO2e/LB of freight
Transportation Intensity Index
14.1%Overall
CARBON INTENSITY REDUCTIONThese figures represent the three different carbon intensity metrics we combine to generate the complete Index to illustrate for our stakeholders how specific components of our business are reducing their carbon intensity.
54
4.3 | Energy & Emissions
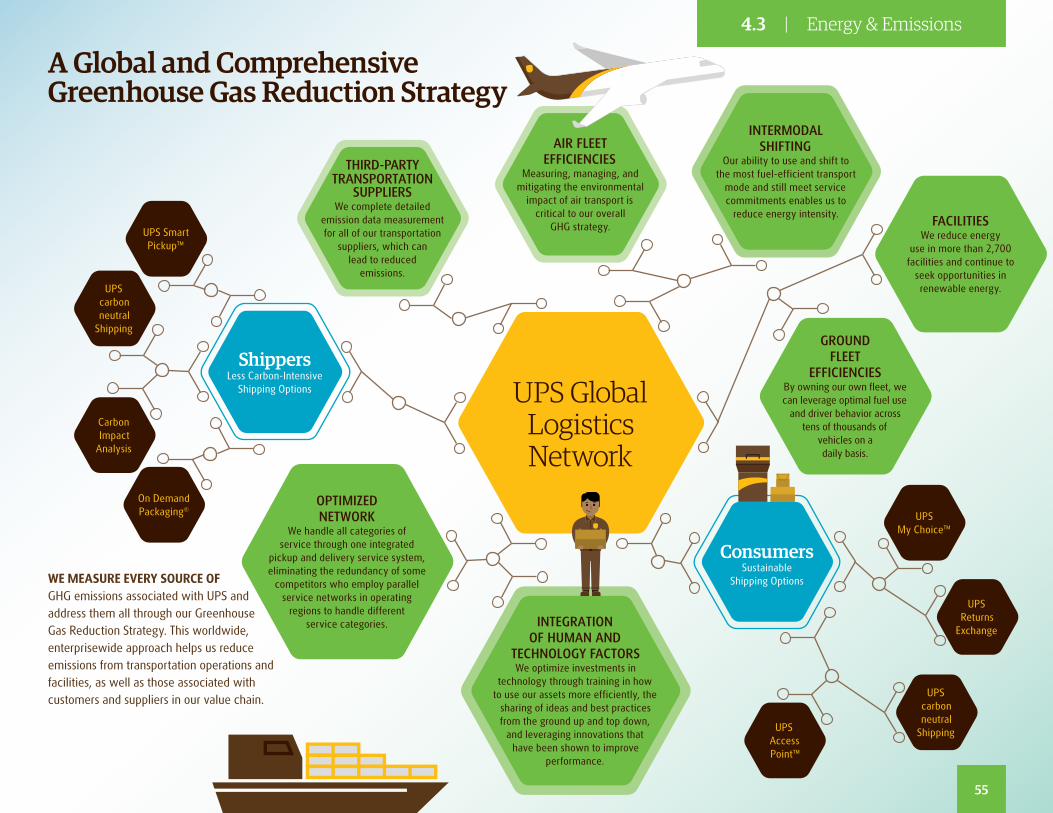
A Global and Comprehensive Greenhouse Gas Reduction Strategy
GROUND FLEET
EFFICIENCIESBy owning our own fleet, we can leverage optimal fuel use
and driver behavior across tens of thousands of
vehicles on a daily basis.
FACILITIESWe reduce energy
use in more than 2,700 facilities and continue to
seek opportunities in renewable energy.
INTERMODAL SHIFTING
Our ability to use and shift to the most fuel-efficient transport
mode and still meet service commitments enables us to
reduce energy intensity.
UPS carbon neutral
Shipping
Carbon Impact
Analysis
OPTIMIZED NETWORK
We handle all categories of service through one integrated
pickup and delivery service system, eliminating the redundancy of some
competitors who employ parallel service networks in operating
regions to handle different service categories. INTEGRATION
OF HUMAN AND TECHNOLOGY FACTORS We optimize investments in
technology through training in how to use our assets more efficiently, the
sharing of ideas and best practices from the ground up and top down,
and leveraging innovations that have been shown to improve
performance.
ConsumersSustainable
Shipping Options
UPS Access Point™
UPS carbon neutral
Shipping
UPS Smart Pickup™
On Demand Packaging®
UPS My Choice™
UPS Returns
Exchange
AIR FLEET EFFICIENCIES
Measuring, managing, and mitigating the environmental
impact of air transport is critical to our overall
GHG strategy.
THIRD-PARTY TRANSPORTATION
SUPPLIERSWe complete detailed
emission data measurement for all of our transportation
suppliers, which can lead to reduced
emissions.
UPS Global Logistics Network
ShippersLess Carbon-Intensive
Shipping Options
WE MEASURE EVERY SOURCE OF GHG emissions associated with UPS and address them all through our Greenhouse Gas Reduction Strategy. This worldwide, enterprisewide approach helps us reduce emissions from transportation operations and facilities, as well as those associated with customers and suppliers in our value chain.
55
4.3 | Energy & Emissions
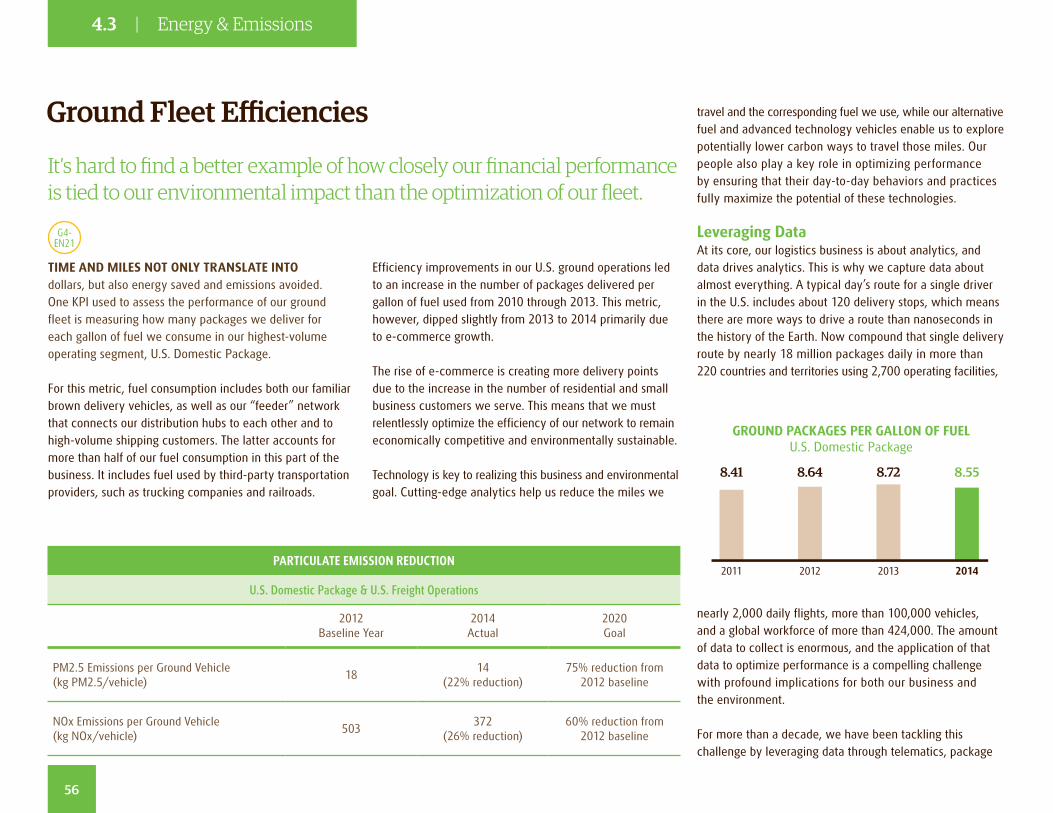
Ground Fleet Efficiencies
G4-EN21
TIME AND MILES NOT ONLY TRANSLATE INTO dollars, but also energy saved and emissions avoided. One KPI used to assess the performance of our ground fleet is measuring how many packages we deliver for each gallon of fuel we consume in our highest-volume operating segment, U.S. Domestic Package.
For this metric, fuel consumption includes both our familiar brown delivery vehicles, as well as our “feeder” network that connects our distribution hubs to each other and to high-volume shipping customers. The latter accounts for more than half of our fuel consumption in this part of the business. It includes fuel used by third-party transportation providers, such as trucking companies and railroads.
It’s hard to find a better example of how closely our financial performance is tied to our environmental impact than the optimization of our fleet.
travel and the corresponding fuel we use, while our alternative fuel and advanced technology vehicles enable us to explore potentially lower carbon ways to travel those miles. Our people also play a key role in optimizing performance by ensuring that their day-to-day behaviors and practices fully maximize the potential of these technologies.
Leveraging DataAt its core, our logistics business is about analytics, and data drives analytics. This is why we capture data about almost everything. A typical day’s route for a single driver in the U.S. includes about 120 delivery stops, which means there are more ways to drive a route than nanoseconds in the history of the Earth. Now compound that single delivery route by nearly 18 million packages daily in more than 220 countries and territories using 2,700 operating facilities,
nearly 2,000 daily flights, more than 100,000 vehicles, and a global workforce of more than 424,000. The amount of data to collect is enormous, and the application of that data to optimize performance is a compelling challenge with profound implications for both our business and the environment.
For more than a decade, we have been tackling this challenge by leveraging data through telematics, package
Efficiency improvements in our U.S. ground operations led to an increase in the number of packages delivered per gallon of fuel used from 2010 through 2013. This metric, however, dipped slightly from 2013 to 2014 primarily due to e-commerce growth.
The rise of e-commerce is creating more delivery points due to the increase in the number of residential and small business customers we serve. This means that we must relentlessly optimize the efficiency of our network to remain economically competitive and environmentally sustainable.
Technology is key to realizing this business and environmental goal. Cutting-edge analytics help us reduce the miles we
8.41
2011
8.64
2012
8.72
2013
8.55
2014
GROUND PACKAGES PER GALLON OF FUEL U.S. Domestic Package
PARTICULATE EMISSION REDUCTION
U.S. Domestic Package & U.S. Freight Operations
2012 Baseline Year
2014 Actual
2020 Goal
PM2.5 Emissions per Ground Vehicle (kg PM2.5/vehicle)
1814
(22% reduction)75% reduction from
2012 baseline
NOx Emissions per Ground Vehicle (kg NOx/vehicle)
503372
(26% reduction)60% reduction from
2012 baseline
56
4.3 | Energy & Emissions
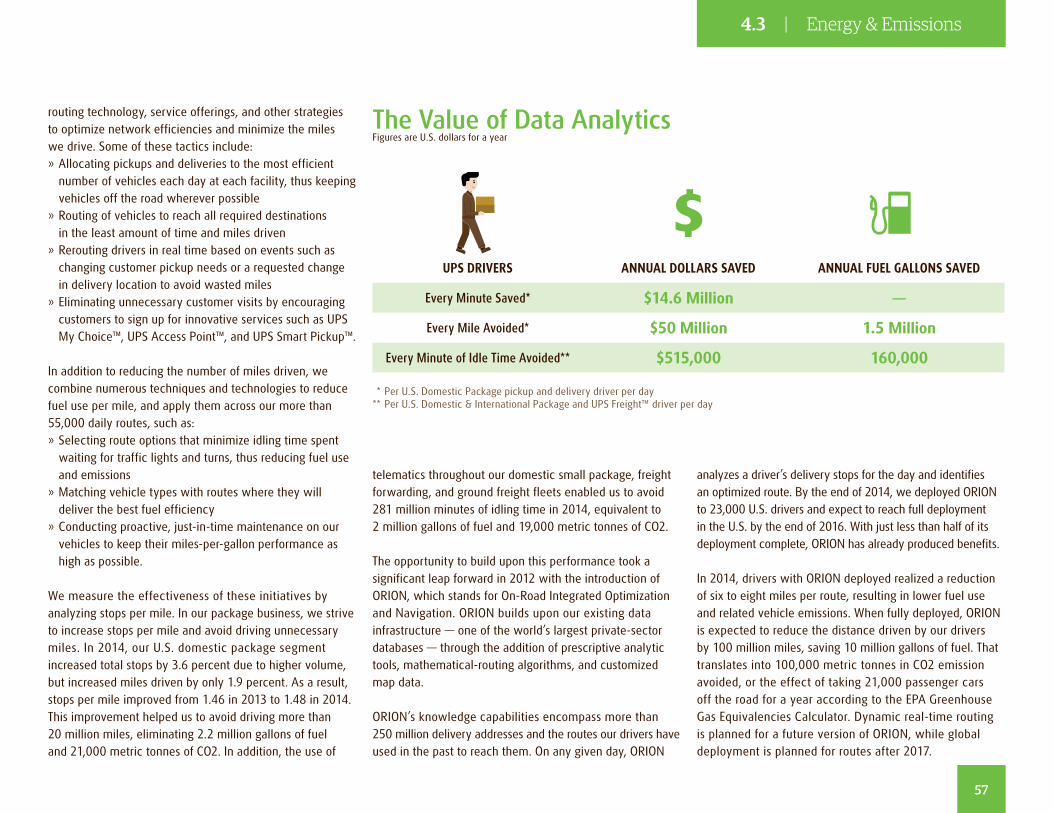
routing technology, service offerings, and other strategies to optimize network efficiencies and minimize the miles we drive. Some of these tactics include: » Allocating pickups and deliveries to the most efficient number of vehicles each day at each facility, thus keeping vehicles off the road wherever possible
» Routing of vehicles to reach all required destinations in the least amount of time and miles driven
» Rerouting drivers in real time based on events such as changing customer pickup needs or a requested change in delivery location to avoid wasted miles
» Eliminating unnecessary customer visits by encouraging customers to sign up for innovative services such as UPS My Choice™, UPS Access Point™, and UPS Smart Pickup™.
In addition to reducing the number of miles driven, we combine numerous techniques and technologies to reduce fuel use per mile, and apply them across our more than 55,000 daily routes, such as: » Selecting route options that minimize idling time spent waiting for traffic lights and turns, thus reducing fuel use and emissions
» Matching vehicle types with routes where they will deliver the best fuel efficiency
» Conducting proactive, just-in-time maintenance on our vehicles to keep their miles-per-gallon performance as high as possible.
We measure the effectiveness of these initiatives by analyzing stops per mile. In our package business, we strive to increase stops per mile and avoid driving unnecessary miles. In 2014, our U.S. domestic package segment increased total stops by 3.6 percent due to higher volume, but increased miles driven by only 1.9 percent. As a result, stops per mile improved from 1.46 in 2013 to 1.48 in 2014. This improvement helped us to avoid driving more than 20 million miles, eliminating 2.2 million gallons of fuel and 21,000 metric tonnes of CO2. In addition, the use of
telematics throughout our domestic small package, freight forwarding, and ground freight fleets enabled us to avoid 281 million minutes of idling time in 2014, equivalent to 2 million gallons of fuel and 19,000 metric tonnes of CO2.
The opportunity to build upon this performance took a significant leap forward in 2012 with the introduction of ORION, which stands for On-Road Integrated Optimization and Navigation. ORION builds upon our existing data infrastructure — one of the world’s largest private-sector databases — through the addition of prescriptive analytic tools, mathematical-routing algorithms, and customized map data.
ORION’s knowledge capabilities encompass more than 250 million delivery addresses and the routes our drivers have used in the past to reach them. On any given day, ORION
analyzes a driver’s delivery stops for the day and identifies an optimized route. By the end of 2014, we deployed ORION to 23,000 U.S. drivers and expect to reach full deployment in the U.S. by the end of 2016. With just less than half of its deployment complete, ORION has already produced benefits.
In 2014, drivers with ORION deployed realized a reduction of six to eight miles per route, resulting in lower fuel use and related vehicle emissions. When fully deployed, ORION is expected to reduce the distance driven by our drivers by 100 million miles, saving 10 million gallons of fuel. That translates into 100,000 metric tonnes in CO2 emission avoided, or the effect of taking 21,000 passenger cars off the road for a year according to the EPA Greenhouse Gas Equivalencies Calculator. Dynamic real-time routing is planned for a future version of ORION, while global deployment is planned for routes after 2017.
* Per U.S. Domestic Package pickup and delivery driver per day ** Per U.S. Domestic & International Package and UPS Freight™ driver per day
The Value of Data AnalyticsFigures are U.S. dollars for a year
UPS DRIVERS ANNUAL DOLLARS SAVED ANNUAL FUEL GALLONS SAVED
Every Minute Saved* $14.6 Million —
Every Mile Avoided* $50 Million 1.5 Million
Every Minute of Idle Time Avoided** $515,000 160,000
57
4.3 | Energy & Emissions
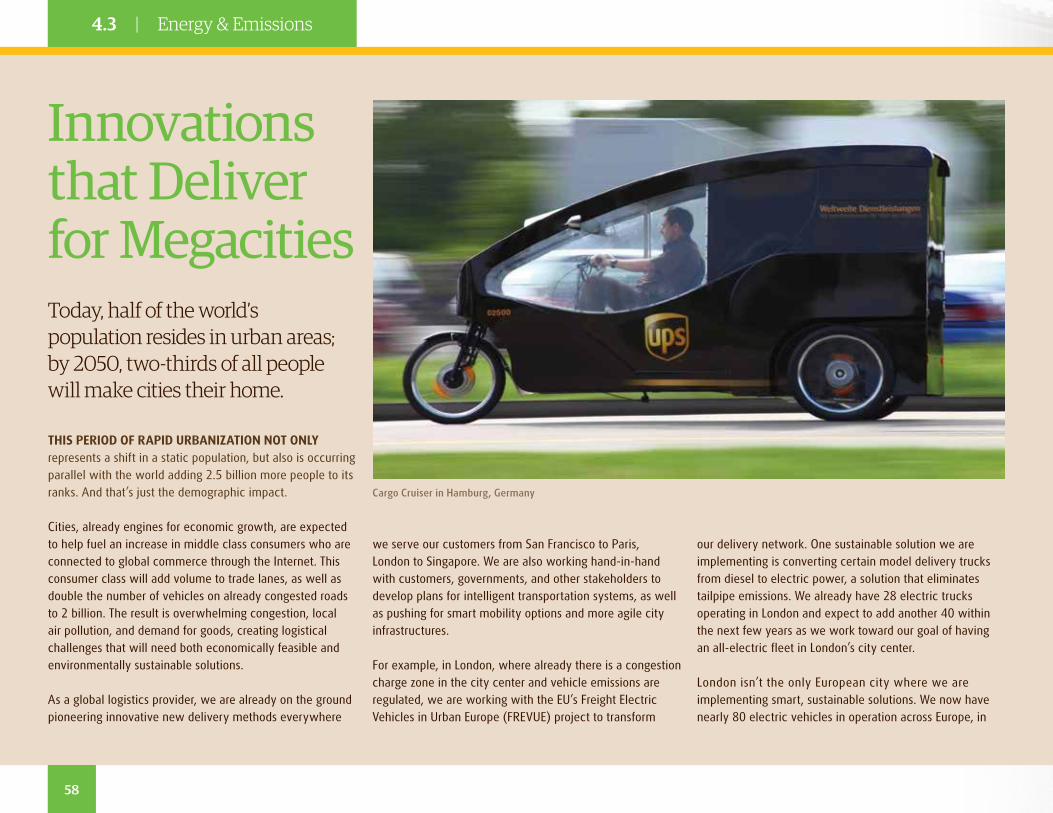
our delivery network. One sustainable solution we are implementing is converting certain model delivery trucks from diesel to electric power, a solution that eliminates tailpipe emissions. We already have 28 electric trucks operating in London and expect to add another 40 within the next few years as we work toward our goal of having an all-electric fleet in London’s city center.
London isn’t the only European city where we are implementing smart, sustainable solutions. We now have nearly 80 electric vehicles in operation across Europe, in
Innovations that Deliver for Megacities
we serve our customers from San Francisco to Paris, London to Singapore. We are also working hand-in-hand with customers, governments, and other stakeholders to develop plans for intelligent transportation systems, as well as pushing for smart mobility options and more agile city infrastructures.
For example, in London, where already there is a congestion charge zone in the city center and vehicle emissions are regulated, we are working with the EU’s Freight Electric Vehicles in Urban Europe (FREVUE) project to transform
Today, half of the world’s population resides in urban areas; by 2050, two-thirds of all people will make cities their home.
THIS PERIOD OF RAPID URBANIZATION NOT ONLY represents a shift in a static population, but also is occurring parallel with the world adding 2.5 billion more people to its ranks. And that’s just the demographic impact.
Cities, already engines for economic growth, are expected to help fuel an increase in middle class consumers who are connected to global commerce through the Internet. This consumer class will add volume to trade lanes, as well as double the number of vehicles on already congested roads to 2 billion. The result is overwhelming congestion, local air pollution, and demand for goods, creating logistical challenges that will need both economically feasible and environmentally sustainable solutions.
As a global logistics provider, we are already on the ground pioneering innovative new delivery methods everywhere
Cargo Cruiser in Hamburg, Germany
58
4.3 | Energy & Emissions
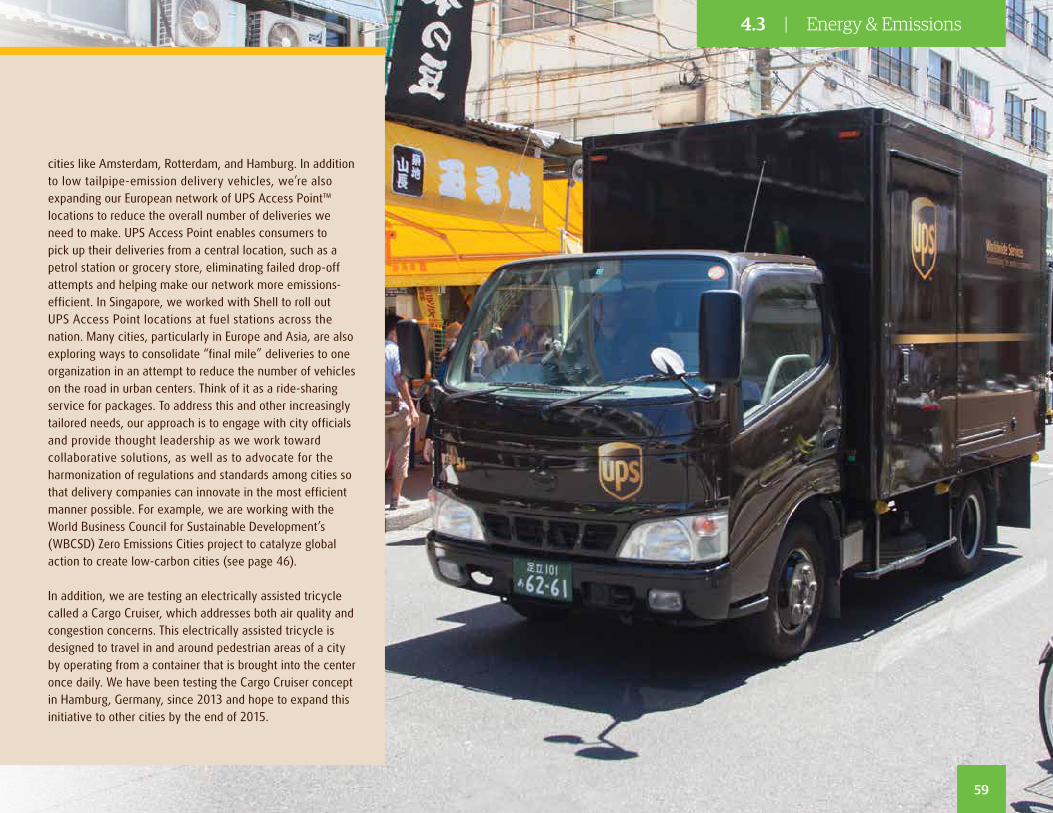
69
cities like Amsterdam, Rotterdam, and Hamburg. In addition to low tailpipe-emission delivery vehicles, we’re also expanding our European network of UPS Access Point™ locations to reduce the overall number of deliveries we need to make. UPS Access Point enables consumers to pick up their deliveries from a central location, such as a petrol station or grocery store, eliminating failed drop-off attempts and helping make our network more emissions-efficient. In Singapore, we worked with Shell to roll out UPS Access Point locations at fuel stations across the nation. Many cities, particularly in Europe and Asia, are also exploring ways to consolidate “final mile” deliveries to one organization in an attempt to reduce the number of vehicles on the road in urban centers. Think of it as a ride-sharing service for packages. To address this and other increasingly tailored needs, our approach is to engage with city officials and provide thought leadership as we work toward collaborative solutions, as well as to advocate for the harmonization of regulations and standards among cities so that delivery companies can innovate in the most efficient manner possible. For example, we are working with the World Business Council for Sustainable Development’s (WBCSD) Zero Emissions Cities project to catalyze global action to create low-carbon cities (see page 46).
In addition, we are testing an electrically assisted tricycle called a Cargo Cruiser, which addresses both air quality and congestion concerns. This electrically assisted tricycle is designed to travel in and around pedestrian areas of a city by operating from a container that is brought into the center once daily. We have been testing the Cargo Cruiser concept in Hamburg, Germany, since 2013 and hope to expand this initiative to other cities by the end of 2015.
59
4.3 | Energy & Emissions
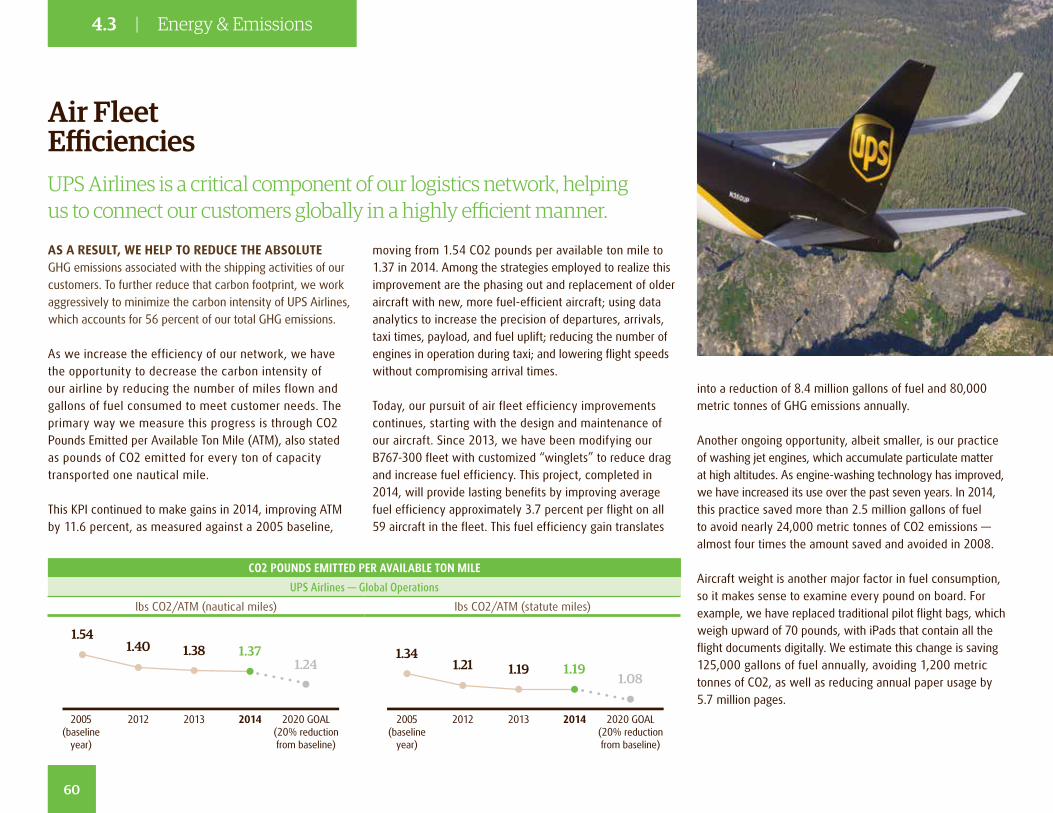
moving from 1.54 CO2 pounds per available ton mile to 1.37 in 2014. Among the strategies employed to realize this improvement are the phasing out and replacement of older aircraft with new, more fuel-efficient aircraft; using data analytics to increase the precision of departures, arrivals, taxi times, payload, and fuel uplift; reducing the number of engines in operation during taxi; and lowering flight speeds without compromising arrival times.
Today, our pursuit of air fleet efficiency improvements continues, starting with the design and maintenance of our aircraft. Since 2013, we have been modifying our B767-300 fleet with customized “winglets” to reduce drag and increase fuel efficiency. This project, completed in 2014, will provide lasting benefits by improving average fuel efficiency approximately 3.7 percent per flight on all 59 aircraft in the fleet. This fuel efficiency gain translates
Air Fleet Efficiencies
into a reduction of 8.4 million gallons of fuel and 80,000 metric tonnes of GHG emissions annually.
Another ongoing opportunity, albeit smaller, is our practice of washing jet engines, which accumulate particulate matter at high altitudes. As engine-washing technology has improved, we have increased its use over the past seven years. In 2014, this practice saved more than 2.5 million gallons of fuel to avoid nearly 24,000 metric tonnes of CO2 emissions — almost four times the amount saved and avoided in 2008.
Aircraft weight is another major factor in fuel consumption, so it makes sense to examine every pound on board. For example, we have replaced traditional pilot flight bags, which weigh upward of 70 pounds, with iPads that contain all the flight documents digitally. We estimate this change is saving 125,000 gallons of fuel annually, avoiding 1,200 metric tonnes of CO2, as well as reducing annual paper usage by 5.7 million pages.
AS A RESULT, WE HELP TO REDUCE THE ABSOLUTE GHG emissions associated with the shipping activities of our customers. To further reduce that carbon footprint, we work aggressively to minimize the carbon intensity of UPS Airlines, which accounts for 56 percent of our total GHG emissions.
As we increase the efficiency of our network, we have the opportunity to decrease the carbon intensity of our airline by reducing the number of miles flown and gallons of fuel consumed to meet customer needs. The primary way we measure this progress is through CO2 Pounds Emitted per Available Ton Mile (ATM), also stated as pounds of CO2 emitted for every ton of capacity transported one nautical mile.
This KPI continued to make gains in 2014, improving ATM by 11.6 percent, as measured against a 2005 baseline,
UPS Airlines is a critical component of our logistics network, helping us to connect our customers globally in a highly efficient manner.
1.54
2005(baseline
year)
1.40
2012
1.38
2013
1.37
2014
2020 GOAL(20% reductionfrom baseline)
1.241.34
2005(baseline
year)
1.21
2012
1.19
2013
1.19
2014
2020 GOAL(20% reductionfrom baseline)
1.08
CO2 POUNDS EMITTED PER AVAILABLE TON MILE
UPS Airlines — Global Operations
lbs CO2/ATM (nautical miles) lbs CO2/ATM (statute miles)
60
4.3 | Energy & Emissions
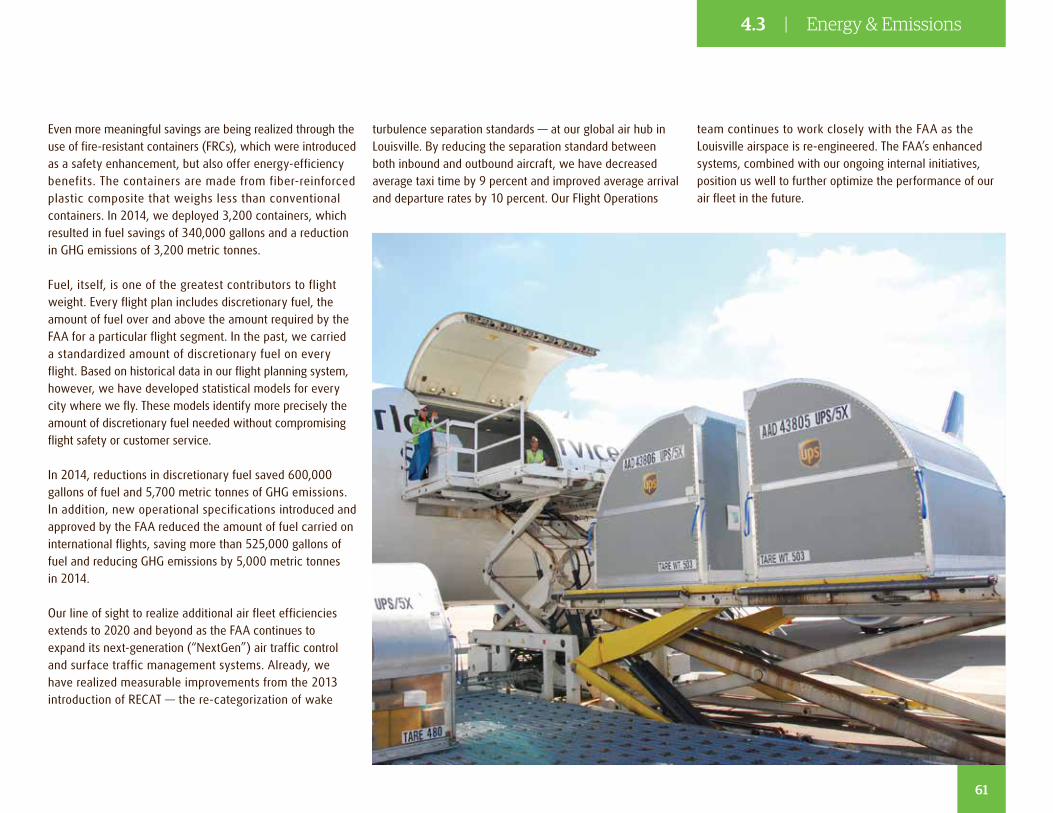
Even more meaningful savings are being realized through the use of fire-resistant containers (FRCs), which were introduced as a safety enhancement, but also offer energy-efficiency benefits. The containers are made from fiber-reinforced plastic composite that weighs less than conventional containers. In 2014, we deployed 3,200 containers, which resulted in fuel savings of 340,000 gallons and a reduction in GHG emissions of 3,200 metric tonnes.
Fuel, itself, is one of the greatest contributors to flight weight. Every flight plan includes discretionary fuel, the amount of fuel over and above the amount required by the FAA for a particular flight segment. In the past, we carried a standardized amount of discretionary fuel on every flight. Based on historical data in our flight planning system, however, we have developed statistical models for every city where we fly. These models identify more precisely the amount of discretionary fuel needed without compromising flight safety or customer service.
In 2014, reductions in discretionary fuel saved 600,000 gallons of fuel and 5,700 metric tonnes of GHG emissions. In addition, new operational specifications introduced and approved by the FAA reduced the amount of fuel carried on international flights, saving more than 525,000 gallons of fuel and reducing GHG emissions by 5,000 metric tonnes in 2014.
Our line of sight to realize additional air fleet efficiencies extends to 2020 and beyond as the FAA continues to expand its next-generation (“NextGen”) air traffic control and surface traffic management systems. Already, we have realized measurable improvements from the 2013 introduction of RECAT — the re-categorization of wake
team continues to work closely with the FAA as the Louisville airspace is re-engineered. The FAA’s enhanced systems, combined with our ongoing internal initiatives, position us well to further optimize the performance of our air fleet in the future.
turbulence separation standards — at our global air hub in Louisville. By reducing the separation standard between both inbound and outbound aircraft, we have decreased average taxi time by 9 percent and improved average arrival and departure rates by 10 percent. Our Flight Operations
61
4.3 | Energy & Emissions
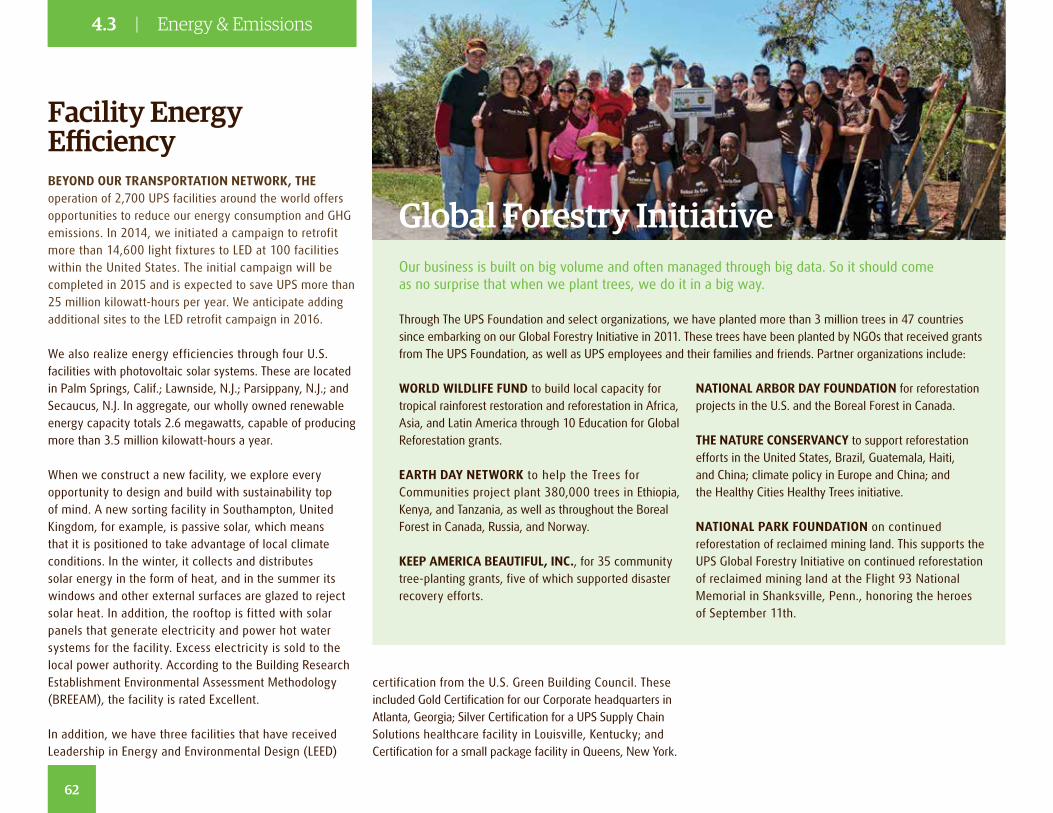
BEYOND OUR TRANSPORTATION NETWORK, THE operation of 2,700 UPS facilities around the world offers opportunities to reduce our energy consumption and GHG emissions. In 2014, we initiated a campaign to retrofit more than 14,600 light fixtures to LED at 100 facilities within the United States. The initial campaign will be completed in 2015 and is expected to save UPS more than 25 million kilowatt-hours per year. We anticipate adding additional sites to the LED retrofit campaign in 2016.
We also realize energy efficiencies through four U.S. facilities with photovoltaic solar systems. These are located in Palm Springs, Calif.; Lawnside, N.J.; Parsippany, N.J.; and Secaucus, N.J. In aggregate, our wholly owned renewable energy capacity totals 2.6 megawatts, capable of producing more than 3.5 million kilowatt-hours a year.
When we construct a new facility, we explore every opportunity to design and build with sustainability top of mind. A new sorting facility in Southampton, United Kingdom, for example, is passive solar, which means that it is positioned to take advantage of local climate conditions. In the winter, it collects and distributes solar energy in the form of heat, and in the summer its windows and other external surfaces are glazed to reject solar heat. In addition, the rooftop is fitted with solar panels that generate electricity and power hot water systems for the facility. Excess electricity is sold to the local power authority. According to the Building Research Establishment Environmental Assessment Methodology (BREEAM), the facility is rated Excellent.
In addition, we have three facilities that have received Leadership in Energy and Environmental Design (LEED)
Facility Energy Efficiency
Our business is built on big volume and often managed through big data. So it should come as no surprise that when we plant trees, we do it in a big way.
Through The UPS Foundation and select organizations, we have planted more than 3 million trees in 47 countries since embarking on our Global Forestry Initiative in 2011. These trees have been planted by NGOs that received grants from The UPS Foundation, as well as UPS employees and their families and friends. Partner organizations include:
WORLD WILDLIFE FUND to build local capacity for tropical rainforest restoration and reforestation in Africa, Asia, and Latin America through 10 Education for Global Reforestation grants.
EARTH DAY NETWORK to help the Trees for Communities project plant 380,000 trees in Ethiopia, Kenya, and Tanzania, as well as throughout the Boreal Forest in Canada, Russia, and Norway.
KEEP AMERICA BEAUTIFUL, INC., for 35 community tree-planting grants, five of which supported disaster recovery efforts.
NATIONAL ARBOR DAY FOUNDATION for reforestation projects in the U.S. and the Boreal Forest in Canada.
THE NATURE CONSERVANCY to support reforestation efforts in the United States, Brazil, Guatemala, Haiti, and China; climate policy in Europe and China; and the Healthy Cities Healthy Trees initiative.
NATIONAL PARK FOUNDATION on continued reforestation of reclaimed mining land. This supports the UPS Global Forestry Initiative on continued reforestation of reclaimed mining land at the Flight 93 National Memorial in Shanksville, Penn., honoring the heroes of September 11th.
Global Forestry Initiative
certification from the U.S. Green Building Council. These included Gold Certification for our Corporate headquarters in Atlanta, Georgia; Silver Certification for a UPS Supply Chain Solutions healthcare facility in Louisville, Kentucky; and Certification for a small package facility in Queens, New York.
62
4.3 | Energy & Emissions
enables the private sector to invest accordingly, and that minimizes the market imbalances that can result from policies applied unequally within or among nations.
5. We believe that any policy to regulate greenhouse gas emissions should fairly account for companies that have already taken voluntary steps to reduce their greenhouse gas emissions.
UPS is a responsible corporate citizen across more than 220 countries and territories around the world. Our business success and our environmental stewardship both depend on the efficiency of our global logistics network. Our long-term greenhouse gas reduction strategy is to optimize the processes that consume non-renewable resources within this network. We also recognize that, as a critical component of our customers’ supply chains, UPS plays an important role in helping them operate in a more environmentally sustainable way.
We continually review all aspects of our business with sustainability in mind, including: systems, procedures, equipment, and operating processes. These efforts are developed in tandem with our plans for growth and profitability. Our plan includes: » Network and mode optimization to minimize the miles traveled and energy consumed.
» Investments in fuel-saving technologies to reduce our dependency on petroleum-based fuels.
» Investments in alternative fuel vehicles to help offset the use of conventional petroleum fuels.
» Energy conservation through facility design, operational practices, renewable energy, and retrofitting.
» Accurate, verified disclosure of global greenhouse gas emissions data per recognized standards.
All these measures include both ongoing and new initiatives throughout our entire enterprise. We utilize technology-enabled, behavior-based, and engineering-based approaches to minimize our environmental footprint. We will continue to improve our operating efficiency, which is one of the significant ways we reduce our energy and fuel use.
We also consider stakeholder engagement an essential aspect of corporate governance and consult regularly with a diverse and global set of stakeholders focused on climate change and emissions issues. We report on these engagements and on our energy consumption and emissions goals in our annual corporate sustainability report, which can be found at ups.com/sustainability.
Ultimately, we believe it will take collaboration among governments, industry, academia, consumers, and communities to develop solutions to climate change. UPS is committed to helping develop these solutions in an environmentally sound and economically sustainable way.
David AbneyCHIEF EXECUTIVE OFFICER
UPS Corporate Climate Change Statement
AS A GLOBAL TRANSPORTATION AND LOGISTICS company, UPS recognizes that greenhouse gas emissions (GHG) affect our climate and pose a serious challenge to the environment — and ultimately to the global economy. We believe that everyone shares responsibility to improve energy efficiency and to reduce GHG emissions in the atmosphere. UPS supports global and national efforts to mitigate the impact of climate change. Beyond complying with all applicable laws and regulations that help reduce greenhouse gas emissions and encouraging market adoption of low greenhouse gas emission technologies, our position on climate change policy is guided by five principles:
1. We believe that any global or national strategy to address climate change must be environmentally sustainable and economically viable.
2. We believe that any climate change policy should be technology-neutral and designed to encourage private sector innovation and investment so that emissions reductions can be achieved in the most efficient manner possible.
3. We believe that any global or national strategy to address climate change must be developed with input from stakeholder communities, including the public and private sectors, nongovernmental organizations, academia, and investors.
4. We believe that any policy to regulate greenhouse gas emissions should provide a clear, stable framework that
Our business success and our environmental stewardship both depend on the efficiency of our global logistics network.
63
4.4 | Climate Change Statement
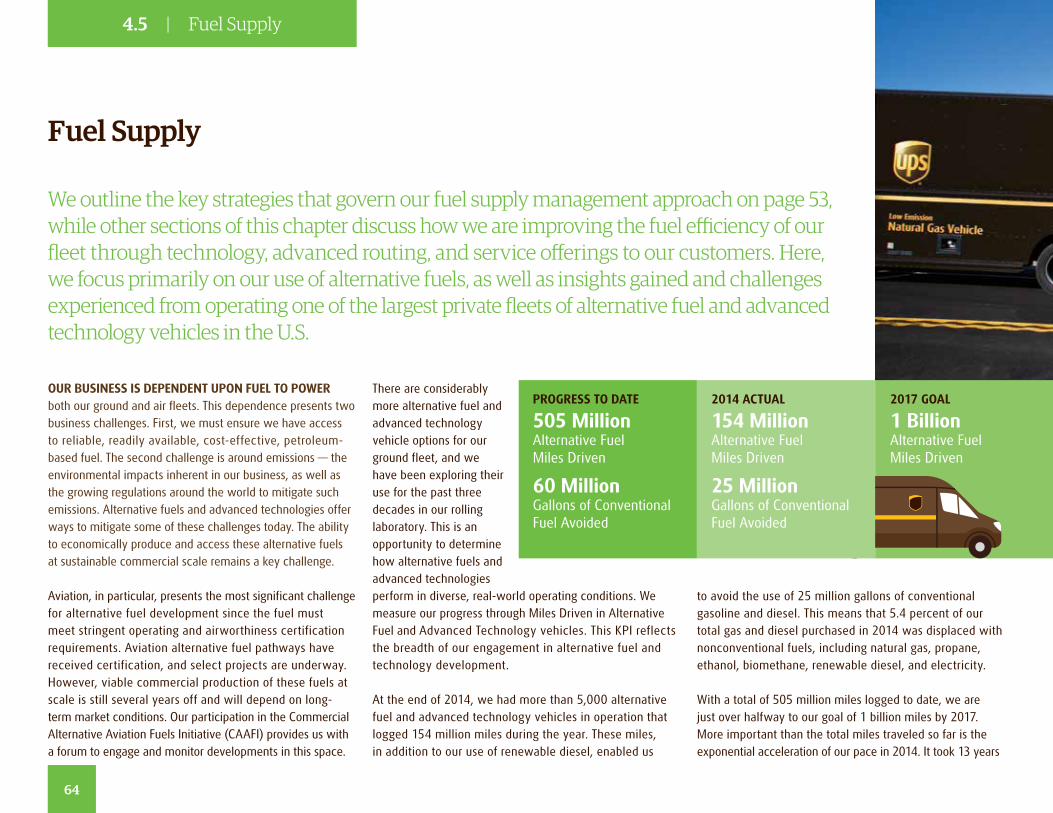
OUR BUSINESS IS DEPENDENT UPON FUEL TO POWER both our ground and air fleets. This dependence presents two business challenges. First, we must ensure we have access to reliable, readily available, cost-effective, petroleum-based fuel. The second challenge is around emissions — the environmental impacts inherent in our business, as well as the growing regulations around the world to mitigate such emissions. Alternative fuels and advanced technologies offer ways to mitigate some of these challenges today. The ability to economically produce and access these alternative fuels at sustainable commercial scale remains a key challenge.
Aviation, in particular, presents the most significant challenge for alternative fuel development since the fuel must meet stringent operating and airworthiness certification requirements. Aviation alternative fuel pathways have received certification, and select projects are underway. However, viable commercial production of these fuels at scale is still several years off and will depend on long-term market conditions. Our participation in the Commercial Alternative Aviation Fuels Initiative (CAAFI) provides us with a forum to engage and monitor developments in this space.
Fuel Supply
There are considerably more alternative fuel and advanced technology vehicle options for our ground fleet, and we have been exploring their use for the past three decades in our rolling laboratory. This is an opportunity to determine how alternative fuels and advanced technologies perform in diverse, real-world operating conditions. We measure our progress through Miles Driven in Alternative Fuel and Advanced Technology vehicles. This KPI reflects the breadth of our engagement in alternative fuel and technology development.
At the end of 2014, we had more than 5,000 alternative fuel and advanced technology vehicles in operation that logged 154 million miles during the year. These miles, in addition to our use of renewable diesel, enabled us
2017 GOAL
1 Billion Alternative Fuel Miles Driven
PROGRESS TO DATE
505 Million Alternative Fuel Miles Driven
60 Million Gallons of Conventional Fuel Avoided
2014 ACTUAL
154 Million Alternative Fuel Miles Driven
25 Million Gallons of Conventional Fuel Avoided
to avoid the use of 25 million gallons of conventional gasoline and diesel. This means that 5.4 percent of our total gas and diesel purchased in 2014 was displaced with nonconventional fuels, including natural gas, propane, ethanol, biomethane, renewable diesel, and electricity.
With a total of 505 million miles logged to date, we are just over halfway to our goal of 1 billion miles by 2017. More important than the total miles traveled so far is the exponential acceleration of our pace in 2014. It took 13 years
We outline the key strategies that govern our fuel supply management approach on page 53, while other sections of this chapter discuss how we are improving the fuel efficiency of our fleet through technology, advanced routing, and service offerings to our customers. Here, we focus primarily on our use of alternative fuels, as well as insights gained and challenges experienced from operating one of the largest private fleets of alternative fuel and advanced technology vehicles in the U.S.
64
4.5 | Fuel Supply

for us to travel the first 350 million miles, and by the end of 2017 we expect to be driving more than 350 million miles per year. This is due to our ongoing investment in our fast-growing fleet of vehicles that use alternative fuels and our support of a market for these fuels.
Alternative FuelsOur search for alternative fuels involves many considerations — including performance, cost, availability, and refueling infrastructure — and has resulted in one of the most diversified fleets in private industry today. As we have assembled this fleet, we’ve used it to test alternative fuels and advanced vehicle technologies in our rolling laboratory. This laboratory is key to our success and is enabled by our scope and scale. The rolling laboratory provides us with the opportunity to determine how alternative fuels and technologies perform in diverse, real-world operating conditions. Most importantly, the laboratory allows us to
quickly deploy viable alternative fuel equipment at scale based on market and operating conditions.
The insights we glean are used to plan investments, as well as to develop future strategies. We also share these insights with vehicle manufacturers and energy suppliers to enhance their understanding of how products can help make transportation more sustainable. When a particular fuel or technology demonstrates sustainable benefits in the laboratory, we take it to commercial scale through large purchases or infrastructure development if required.
Natural Gas AdvantagesThrough this strategic approach, natural gas has emerged as a viable alternative fuel that meets our diverse needs, especially the demands of the heavy-duty, over-the-road trucks that connect our regional bases. These big rigs travel an average of 400 to 600 miles per day and require
strong pulling power. Liquefied natural gas (LNG), and more recently, compressed natural gas (CNG), have proven to be the best alternatives to diesel for these trucks, meeting their required range and performance criteria, while burning cleaner than diesel or gasoline. CNG also performs well in our package cars on more local routes averaging more than 100 miles daily.
Natural gas works in large part because of its environmental benefits and cost efficiency. Higher-priced alternative fuel vehicles and investment in alternative fueling infrastructure requires an environment that supports fuel savings. The payback on these investments typically requires deployment in areas served by high mileage shipments and availability of lower-cost alternative fuels. The enormous expansion in U.S. natural gas production and natural gas reserves provides confidence that natural gas prices will remain attractive as compared with diesel prices for the foreseeable future.
Our investments in natural gas accelerated in 2014 when all new tractors that we purchased for our domestic, small package delivery business were those that ran on natural gas. In one year, these purchases nearly doubled the number of our natural gas vehicles in the U.S. By year’s end, we counted just over 1,000 CNG medium “package cars” operating on natural gas and 1,297 heavy tractors operating on LNG or CNG. To support this growing natural gas fleet, which is among the largest in the world, we have invested in 23 LNG and CNG fueling operations across 10 states.
65
4.5 | Fuel Supply
AT Blu., WE ARE EXCITED ABOUT THE POSSIBILITIES THAT RENEWABLE natural gas (RNG) brings to the alternative fueling landscape. Natural gas is the cleanest-burning fossil fuel available, and each vehicle converted to run on natural gas means a reduction in emissions. Our solutions enable high-horsepower industries the opportunity to switch to a cleaner-burning diesel alternative. As the technology around capturing, upgrading, and distributing RNG continues to improve, Blu. is working to increase the utilization of this recaptured energy and to drive the industry toward a cleaner, more responsible transportation sector.
RNG will play an important role in decarbonizing the gas sector and is an integral part of addressing climate change. The lifecycle GHG emissions produced from burning RNG result in a reduction
of 88 percent compared with conventional fuels, and with certain types of RNG can even result in net negative GHG emissions. Increasing the conversion rate of diesel use to natural gas will help ensure that we meet the United States goal of 20 percent GHG reductions by 2020. Increased access to RNG will be critical to achieving the goal of 80 percent reduction by 2050.
Since 2011, we have provided natural gas for UPS fleets at Blu. stations across the United States — resulting in avoided emissions, reduced fueling costs, and the creation of local jobs. These efforts have resulted in displacing more than 1.5 million gallons of diesel fuel over the last two years. Together we have led the way toward a cleaner environment — and we’re just getting started.
AS ENGINEERS, WE DO OUR BEST WORK WHEN WE HAVE A clear picture of what’s possible, a blank slate, and no constraints — other than the basic rules of nature and physics. With that approach in mind, let’s consider what an optimal design would be for a solution to commercial transportation fuels in a carbon-constrained world. What would an engineer do to create an optimal fuel pathway to the future?
Energy consumption is anticipated to dramatically increase over the next few decades, as global population grows to more than 9 billion by 2050. To address the carbon impact associated with this growth, an optimal fuel source would power trains, trucks, and ships at a competitive cost, including the infrastructure to deliver the fuel universally. Ideally, both mature and emerging economies could benefit from this fuel evolution, and innovations in policy, technology, and environmental stewardship could be shared by everyone around the world. The perfect solution would also leverage as much existing infrastructure as possible.
In this case, our task at hand is to design and build a global, readily available and nearly unlimited supply of low-carbon fuel that can scale as the global population — and its demand for energy — continues to increase. Using methane as renewable natural gas (RNG) could be the solution to our engineering challenge. Methane is among the most abundant forms of fuel on the planet — nearly every landfill, agriculture operation, and manufacturing and waste plant generates methane. In most cases, methane is released into the atmosphere, emitting more than 21 times the GHG emissions compared with CO2 and doing harm when it could create a benefit.
The question I pose is this: what if we collected, transformed, and utilized methane as a commercial fuel for transportation? Explore more about the investments UPS is making in RNG at ups.com/sustainability.
UPS PerspectiveSteve Leffin DIRECTOR, GLOBAL SUSTAINABILITY
Stakeholder PerspectiveJames Burns CHIEF EXECUTIVE OFFICER, Blu.
The Potential of Renewable Natural Gas
66
4.5 | Fuel Supply
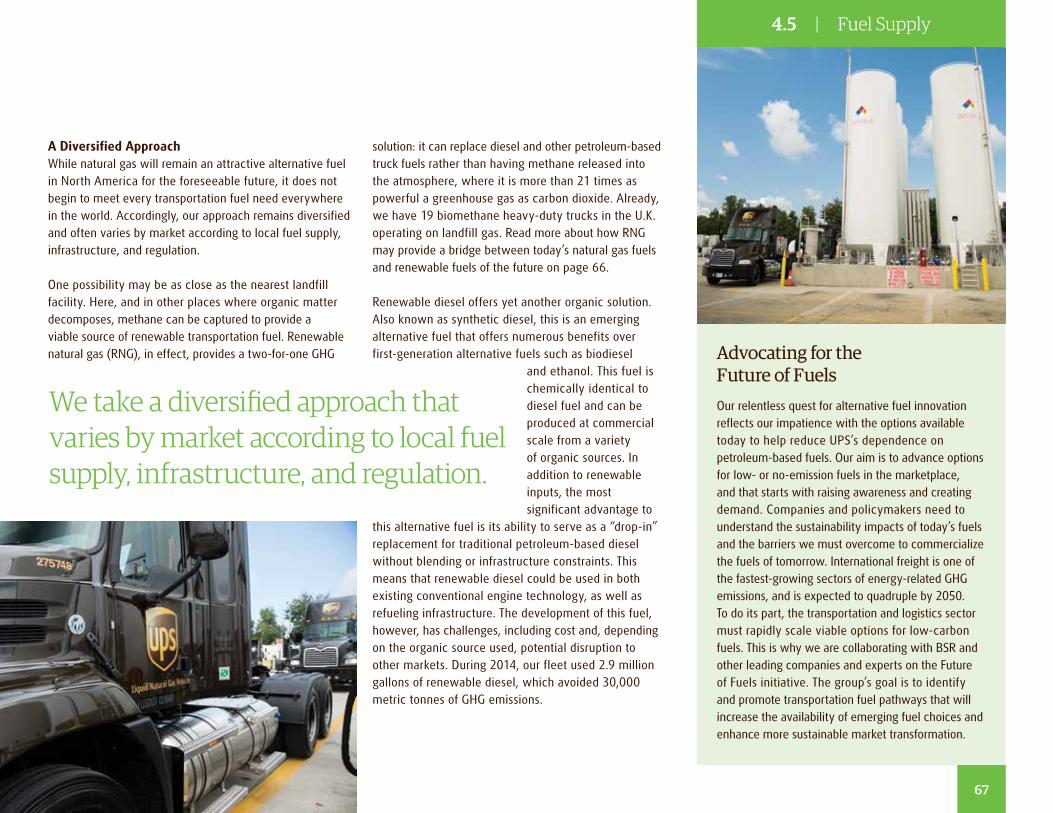
A Diversified ApproachWhile natural gas will remain an attractive alternative fuel in North America for the foreseeable future, it does not begin to meet every transportation fuel need everywhere in the world. Accordingly, our approach remains diversified and often varies by market according to local fuel supply, infrastructure, and regulation.
One possibility may be as close as the nearest landfill facility. Here, and in other places where organic matter decomposes, methane can be captured to provide a viable source of renewable transportation fuel. Renewable natural gas (RNG), in effect, provides a two-for-one GHG
solution: it can replace diesel and other petroleum-based truck fuels rather than having methane released into the atmosphere, where it is more than 21 times as powerful a greenhouse gas as carbon dioxide. Already, we have 19 biomethane heavy-duty trucks in the U.K. operating on landfill gas. Read more about how RNG may provide a bridge between today’s natural gas fuels and renewable fuels of the future on page 66.
Renewable diesel offers yet another organic solution. Also known as synthetic diesel, this is an emerging alternative fuel that offers numerous benefits over first-generation alternative fuels such as biodiesel
and ethanol. This fuel is chemically identical to diesel fuel and can be produced at commercial scale from a variety of organic sources. In addition to renewable inputs, the most significant advantage to
this alternative fuel is its ability to serve as a “drop-in” replacement for traditional petroleum-based diesel without blending or infrastructure constraints. This means that renewable diesel could be used in both existing conventional engine technology, as well as refueling infrastructure. The development of this fuel, however, has challenges, including cost and, depending on the organic source used, potential disruption to other markets. During 2014, our fleet used 2.9 million gallons of renewable diesel, which avoided 30,000 metric tonnes of GHG emissions.
Advocating for the Future of FuelsOur relentless quest for alternative fuel innovation reflects our impatience with the options available today to help reduce UPS’s dependence on petroleum-based fuels. Our aim is to advance options for low- or no-emission fuels in the marketplace, and that starts with raising awareness and creating demand. Companies and policymakers need to understand the sustainability impacts of today’s fuels and the barriers we must overcome to commercialize the fuels of tomorrow. International freight is one of the fastest-growing sectors of energy-related GHG emissions, and is expected to quadruple by 2050. To do its part, the transportation and logistics sector must rapidly scale viable options for low-carbon fuels. This is why we are collaborating with BSR and other leading companies and experts on the Future of Fuels initiative. The group’s goal is to identify and promote transportation fuel pathways that will increase the availability of emerging fuel choices and enhance more sustainable market transformation.
We take a diversified approach that varies by market according to local fuel supply, infrastructure, and regulation.
67
4.5 | Fuel Supply
WHAT IF ONE OF THE WORLD’S SMALLEST ORGANISMS could help solve one of the world’s biggest challenges? At Solazyme, we’ve been working for more than a decade to accomplish this.
Our business is focused on the development of renewable oils made from microalgae, the earth’s original oil producer and a highly efficient one at that. Using a dark enclosed fermentation process, microalgae can produce oil in a matter of days by consuming different types of inputs, from basic plant sugars today to cellulosic biomass sugars in the near future. The resulting oils can be used for many things, including food and industrial and personal care products. The oils can also be used for the reason we founded Solazyme — to produce clean and renewable drop-in replacement low-carbon fuels.
Beyond their excellent sustainability attributes, these fuels, including both diesel and jet, deliver many advantages over
conventional fuels. Because the fermentation process can take place in a facility located anywhere, supply chains can be relatively short and geopolitics are less of a consideration. It’s on the road and in the sky, however, where the case for renewable diesel and jet fuels becomes truly compelling.
Compared with conventional diesel, renewable diesel blends are far less carbon intense, perform better and burn
cleaner, resulting in lower tailpipe emissions. Solazyme’s blends are complete drop-in replacement fuels, meaning they can be easily integrated with existing infrastructure, require no engine modification, and can be used at 100 percent or at any blend with other diesel fuels. Currently, Solazyme is providing fuel blends made from renewable oils that meet the standard ASTM D975 diesel fuel specifications, and which achieve at-or-near cost parity with conventional fuels, depending on petroleum prices.
With these clear advantages, the main impediment to broader adoption of clean renewable drop-in fuels is simply scale. Like most new technologies, it takes time to build demand, expand production capacity and realize the economies of scale necessary for broad commercialization. It also takes early adopters who bring credibility to the process.
That’s why Solazyme’s relationship with UPS is so important. When one of the largest transportation companies in the world with one of the largest alternative fuel programs in the industry begins purchasing a new fuel, people take notice. By purchasing 3 million gallons of Soladiesel™ fuel blends in 2014, and continuing the program into 2015, UPS has become our first major commercial private sector partner in the transportation arena and has begun paving the way for broad market adoption.
Solving today’s biggest challenges requires forward-thinking, mission-driven companies. UPS clearly fits this description, and we are excited to be partners on this journey.
“Solving today’s biggest challenges requires
forward-thinking, mission-driven companies.
UPS clearly fits this description, and we are
excited to be partners on this journey.”
Stakeholder PerspectiveJonathan S. Wolfson
CHIEF EXECUTIVE OFFICER, SOLAZYME
68
4.5 | Fuel Supply
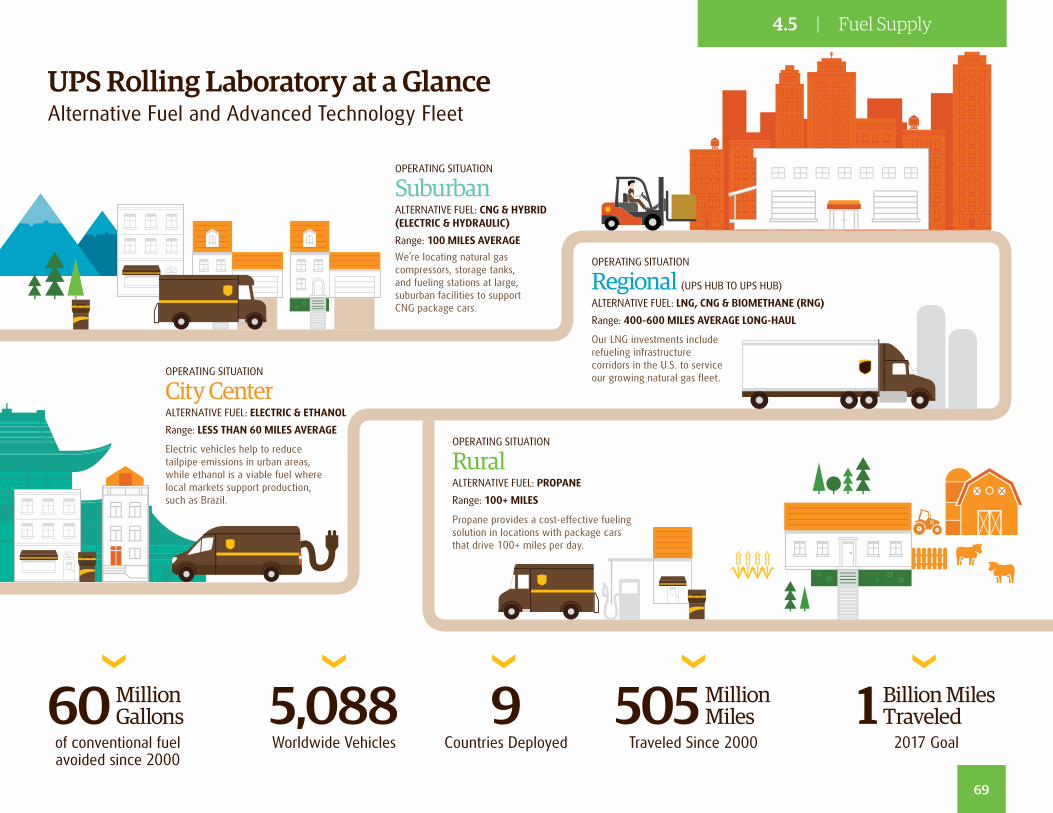
UPS Rolling Laboratory at a Glance Alternative Fuel and Advanced Technology Fleet
OPERATING SITUATION
City Center ALTERNATIVE FUEL: ELECTRIC & ETHANOL
Range: LESS THAN 60 MILES AVERAGE OPERATING SITUATION
Rural ALTERNATIVE FUEL: PROPANE
Range: 100+ MILES
OPERATING SITUATION
Suburban ALTERNATIVE FUEL: CNG & HYBRID (ELECTRIC & HYDRAULIC)
Range: 100 MILES AVERAGE
We’re locating natural gas compressors, storage tanks, and fueling stations at large, suburban facilities to support CNG package cars.
Electric vehicles help to reduce tailpipe emissions in urban areas, while ethanol is a viable fuel where local markets support production, such as Brazil.
Propane provides a cost-effective fueling solution in locations with package cars that drive 100+ miles per day.
OPERATING SITUATION
Regional (UPS HUB TO UPS HUB)
ALTERNATIVE FUEL: LNG, CNG & BIOMETHANE (RNG)
Range: 400-600 MILES AVERAGE LONG-HAUL
Our LNG investments include refueling infrastructure corridors in the U.S. to service our growing natural gas fleet.
505 Million Miles
Traveled Since 2000
60 Million Gallons
of conventional fuel avoided since 2000
1 Billion Miles Traveled
2017 Goal
9 Countries Deployed
5,088 Worldwide Vehicles
69
4.5 | Fuel Supply
05Committed to More™
Empowered People
70
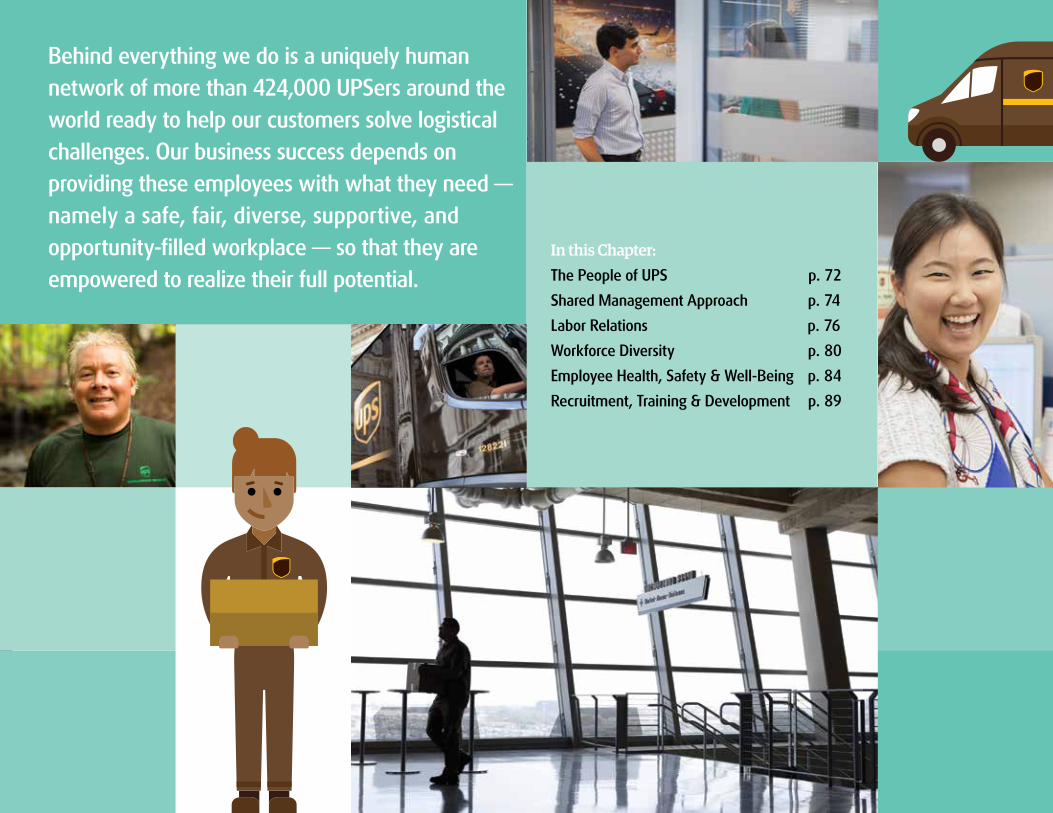
Behind everything we do is a uniquely human network of more than 424,000 UPSers around the world ready to help our customers solve logistical challenges. Our business success depends on providing these employees with what they need — namely a safe, fair, diverse, supportive, and opportunity-filled workplace — so that they are empowered to realize their full potential.
In this Chapter:The People of UPS p. 72
Shared Management Approach p. 74
Labor Relations p. 76
Workforce Diversity p. 80
Employee Health, Safety & Well-Being p. 84
Recruitment, Training & Development p. 89
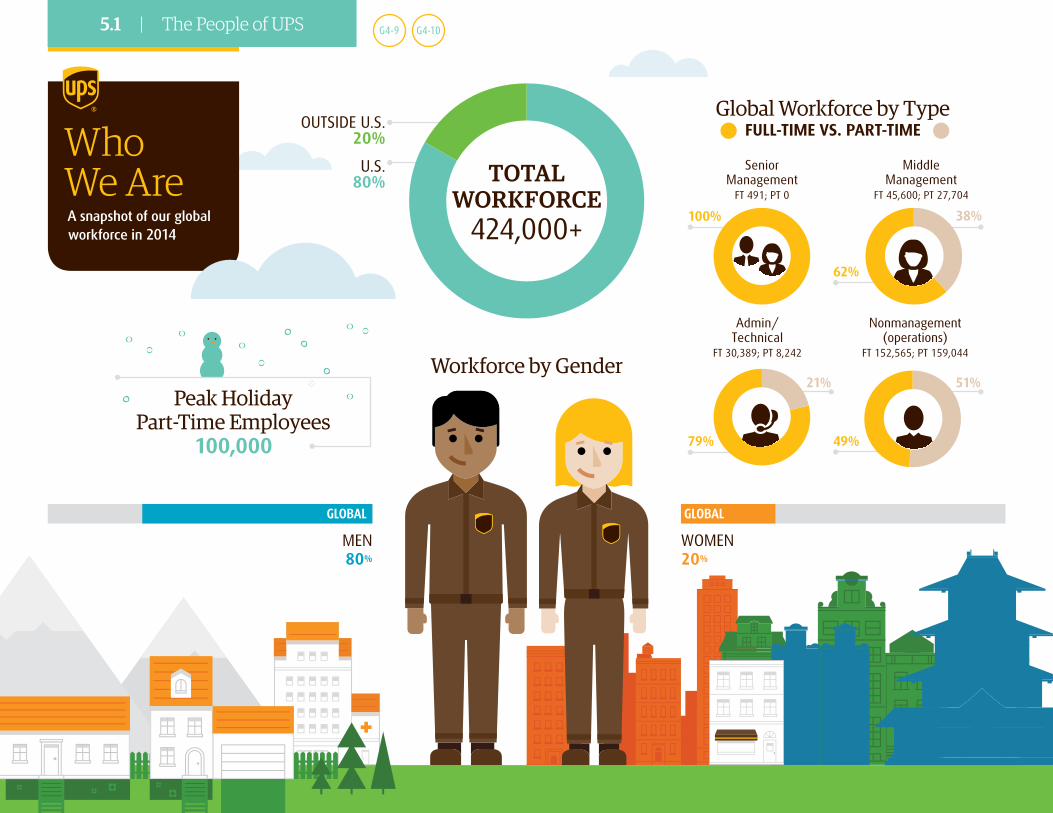
Global Workforce by Type FULL-TIME VS. PART-TIME
Workforce by Gender
OUTSIDE U.S. 20%
U.S. 80%
WOMEN 20%
TOTAL WORKFORCE
424,000+
Peak Holiday Part-Time Employees
100,000
Senior Management
FT 491; PT 0
MEN 80%
GLOBALGLOBAL
Middle Management
FT 45,600; PT 27,704
Nonmanagement (operations)
FT 152,565; PT 159,044
Admin/ Technical
FT 30,389; PT 8,242
G4-9 G4-10
Who We AreA snapshot of our global workforce in 2014
100%
62%
79% 49%
38%
21% 51%
5.1 | The People of UPS
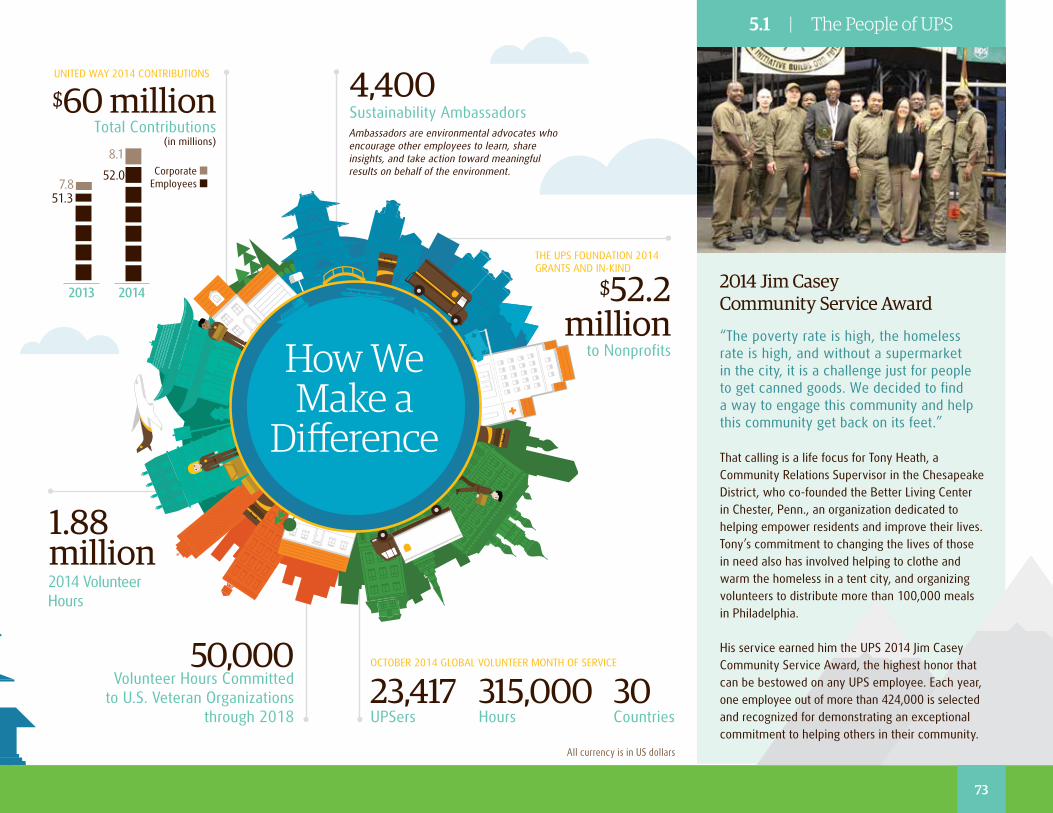
2014 Jim Casey Community Service Award
“The poverty rate is high, the homeless rate is high, and without a supermarket in the city, it is a challenge just for people to get canned goods. We decided to find a way to engage this community and help this community get back on its feet.”
How WeMake a
Difference
Sustainability Ambassadors4,400Ambassadors are environmental advocates who encourage other employees to learn, share insights, and take action toward meaningful results on behalf of the environment.
2014 Volunteer Hours
1.88million
50,000Volunteer Hours Committed
to U.S. Veteran Organizations through 2018
23,417UPSers
30 Countries
OCTOBER 2014 GLOBAL VOLUNTEER MONTH OF SERVICE
$52.2million
to Nonprofits
THE UPS FOUNDATION 2014 GRANTS AND IN-KIND
UNITED WAY 2014 CONTRIBUTIONS
Total Contributions(in millions)
$60 million
2013 2014
51.3
52.0
8.1
7.8
That calling is a life focus for Tony Heath, a Community Relations Supervisor in the Chesapeake District, who co-founded the Better Living Center in Chester, Penn., an organization dedicated to helping empower residents and improve their lives. Tony’s commitment to changing the lives of those in need also has involved helping to clothe and warm the homeless in a tent city, and organizing volunteers to distribute more than 100,000 meals in Philadelphia.
His service earned him the UPS 2014 Jim Casey Community Service Award, the highest honor that can be bestowed on any UPS employee. Each year, one employee out of more than 424,000 is selected and recognized for demonstrating an exceptional commitment to helping others in their community.
Corporate Employees
315,000Hours
All currency is in US dollars
5.1 | The People of UPS
73
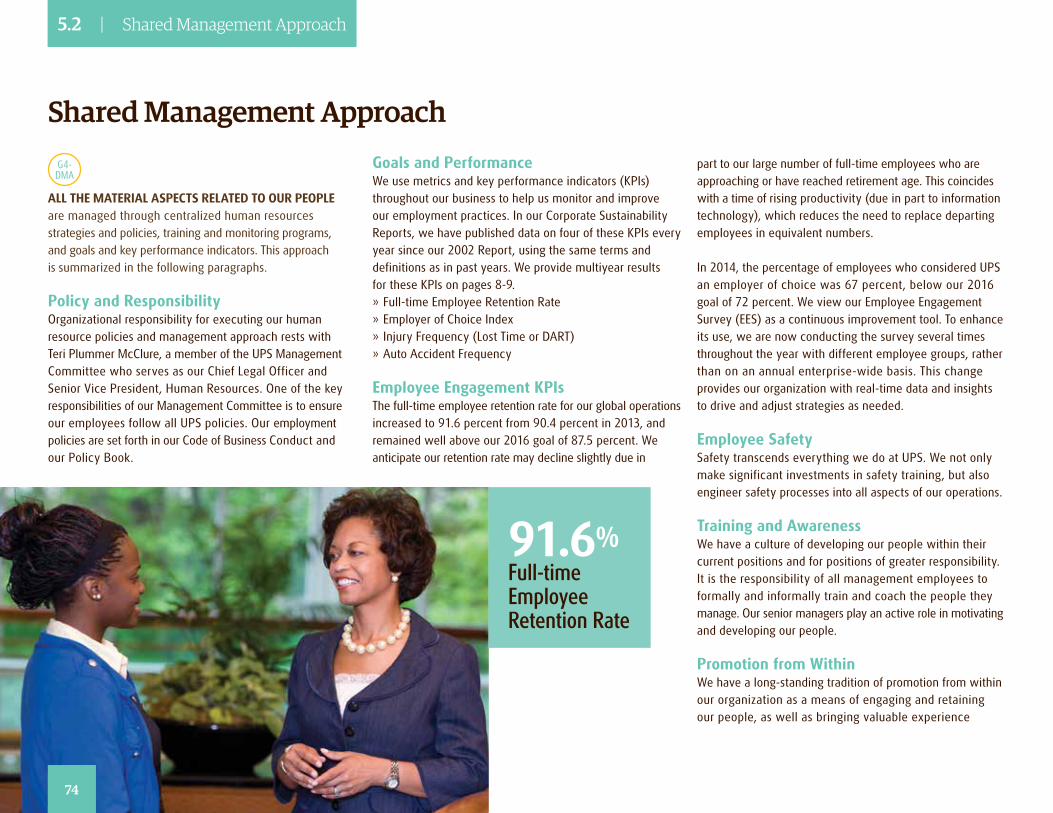
Shared Management ApproachG4-DMA
ALL THE MATERIAL ASPECTS RELATED TO OUR PEOPLE are managed through centralized human resources strategies and policies, training and monitoring programs, and goals and key performance indicators. This approach is summarized in the following paragraphs.
Policy and ResponsibilityOrganizational responsibility for executing our human resource policies and management approach rests with Teri Plummer McClure, a member of the UPS Management Committee who serves as our Chief Legal Officer and Senior Vice President, Human Resources. One of the key responsibilities of our Management Committee is to ensure our employees follow all UPS policies. Our employment policies are set forth in our Code of Business Conduct and our Policy Book.
Goals and PerformanceWe use metrics and key performance indicators (KPIs) throughout our business to help us monitor and improve our employment practices. In our Corporate Sustainability Reports, we have published data on four of these KPIs every year since our 2002 Report, using the same terms and definitions as in past years. We provide multiyear results for these KPIs on pages 8-9. » Full-time Employee Retention Rate » Employer of Choice Index » Injury Frequency (Lost Time or DART) » Auto Accident Frequency
Employee Engagement KPIs The full-time employee retention rate for our global operations increased to 91.6 percent from 90.4 percent in 2013, and remained well above our 2016 goal of 87.5 percent. We anticipate our retention rate may decline slightly due in
part to our large number of full-time employees who are approaching or have reached retirement age. This coincides with a time of rising productivity (due in part to information technology), which reduces the need to replace departing employees in equivalent numbers.
In 2014, the percentage of employees who considered UPS an employer of choice was 67 percent, below our 2016 goal of 72 percent. We view our Employee Engagement Survey (EES) as a continuous improvement tool. To enhance its use, we are now conducting the survey several times throughout the year with different employee groups, rather than on an annual enterprise-wide basis. This change provides our organization with real-time data and insights to drive and adjust strategies as needed.
Employee Safety Safety transcends everything we do at UPS. We not only make significant investments in safety training, but also engineer safety processes into all aspects of our operations.
Training and AwarenessWe have a culture of developing our people within their current positions and for positions of greater responsibility. It is the responsibility of all management employees to formally and informally train and coach the people they manage. Our senior managers play an active role in motivating and developing our people.
Promotion from Within We have a long-standing tradition of promotion from within our organization as a means of engaging and retaining our people, as well as bringing valuable experience
91.6%Full-time Employee Retention Rate
74
5.2 | Shared Management Approach
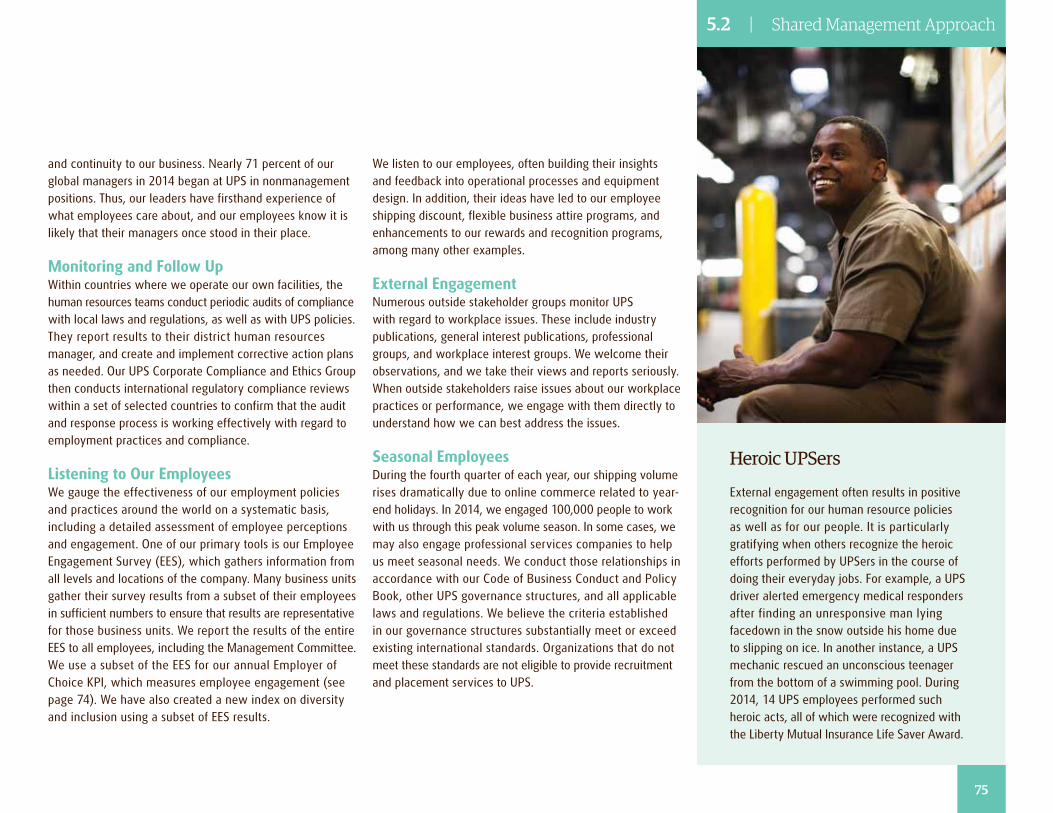
and continuity to our business. Nearly 71 percent of our global managers in 2014 began at UPS in nonmanagement positions. Thus, our leaders have firsthand experience of what employees care about, and our employees know it is likely that their managers once stood in their place.
Monitoring and Follow UpWithin countries where we operate our own facilities, the human resources teams conduct periodic audits of compliance with local laws and regulations, as well as with UPS policies. They report results to their district human resources manager, and create and implement corrective action plans as needed. Our UPS Corporate Compliance and Ethics Group then conducts international regulatory compliance reviews within a set of selected countries to confirm that the audit and response process is working effectively with regard to employment practices and compliance.
Listening to Our Employees We gauge the effectiveness of our employment policies and practices around the world on a systematic basis, including a detailed assessment of employee perceptions and engagement. One of our primary tools is our Employee Engagement Survey (EES), which gathers information from all levels and locations of the company. Many business units gather their survey results from a subset of their employees in sufficient numbers to ensure that results are representative for those business units. We report the results of the entire EES to all employees, including the Management Committee. We use a subset of the EES for our annual Employer of Choice KPI, which measures employee engagement (see page 74). We have also created a new index on diversity and inclusion using a subset of EES results.
Heroic UPSers
External engagement often results in positive recognition for our human resource policies as well as for our people. It is particularly gratifying when others recognize the heroic efforts performed by UPSers in the course of doing their everyday jobs. For example, a UPS driver alerted emergency medical responders after finding an unresponsive man lying facedown in the snow outside his home due to slipping on ice. In another instance, a UPS mechanic rescued an unconscious teenager from the bottom of a swimming pool. During 2014, 14 UPS employees performed such heroic acts, all of which were recognized with the Liberty Mutual Insurance Life Saver Award.
We listen to our employees, often building their insights and feedback into operational processes and equipment design. In addition, their ideas have led to our employee shipping discount, flexible business attire programs, and enhancements to our rewards and recognition programs, among many other examples.
External EngagementNumerous outside stakeholder groups monitor UPS with regard to workplace issues. These include industry publications, general interest publications, professional groups, and workplace interest groups. We welcome their observations, and we take their views and reports seriously. When outside stakeholders raise issues about our workplace practices or performance, we engage with them directly to understand how we can best address the issues.
Seasonal EmployeesDuring the fourth quarter of each year, our shipping volume rises dramatically due to online commerce related to year-end holidays. In 2014, we engaged 100,000 people to work with us through this peak volume season. In some cases, we may also engage professional services companies to help us meet seasonal needs. We conduct those relationships in accordance with our Code of Business Conduct and Policy Book, other UPS governance structures, and all applicable laws and regulations. We believe the criteria established in our governance structures substantially meet or exceed existing international standards. Organizations that do not meet these standards are not eligible to provide recruitment and placement services to UPS.
5.2 | Shared Management Approach
75
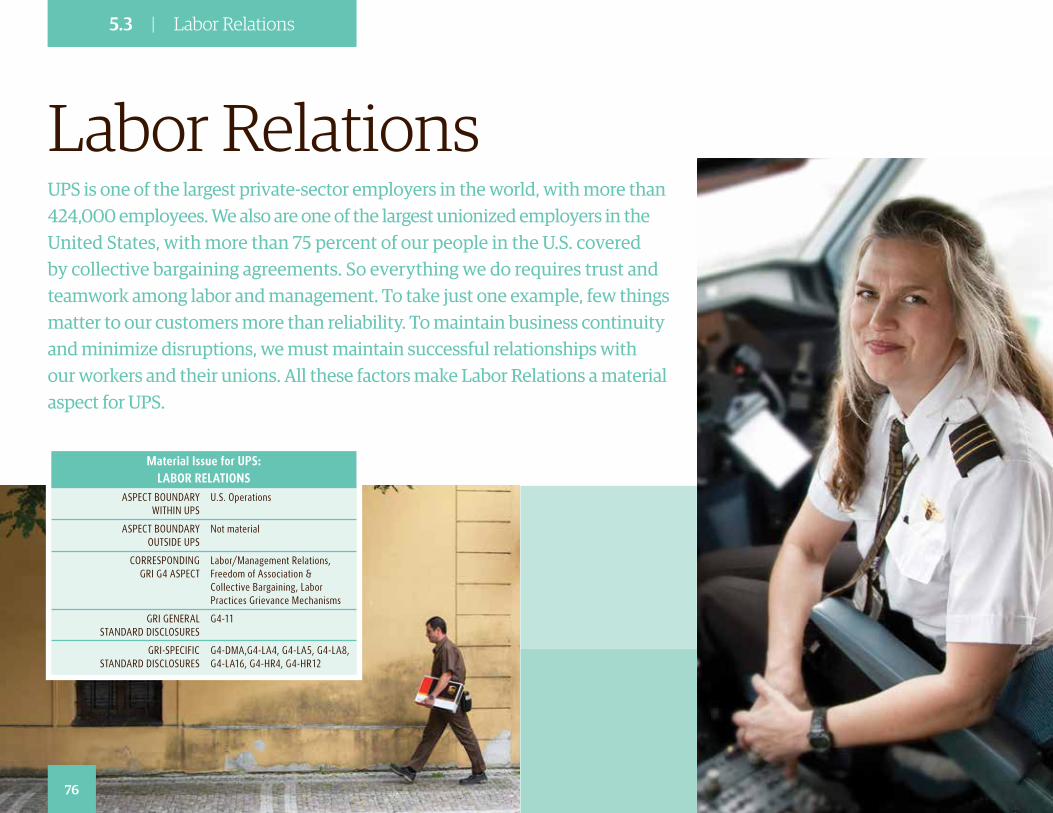
UPS is one of the largest private-sector employers in the world, with more than 424,000 employees. We also are one of the largest unionized employers in the United States, with more than 75 percent of our people in the U.S. covered by collective bargaining agreements. So everything we do requires trust and teamwork among labor and management. To take just one example, few things matter to our customers more than reliability. To maintain business continuity and minimize disruptions, we must maintain successful relationships with our workers and their unions. All these factors make Labor Relations a material aspect for UPS.
Labor Relations
Material Issue for UPS: LABOR RELATIONS
ASPECT BOUNDARY WITHIN UPS
U.S. Operations
ASPECT BOUNDARY OUTSIDE UPS
Not material
CORRESPONDING GRI G4 ASPECT
Labor/Management Relations, Freedom of Association & Collective Bargaining, Labor Practices Grievance Mechanisms
GRI GENERAL STANDARD DISCLOSURES
G4-11
GRI-SPECIFIC STANDARD DISCLOSURES
G4-DMA,G4-LA4, G4-LA5, G4-LA8, G4-LA16, G4-HR4, G4-HR12
5.3 | Labor Relations
76
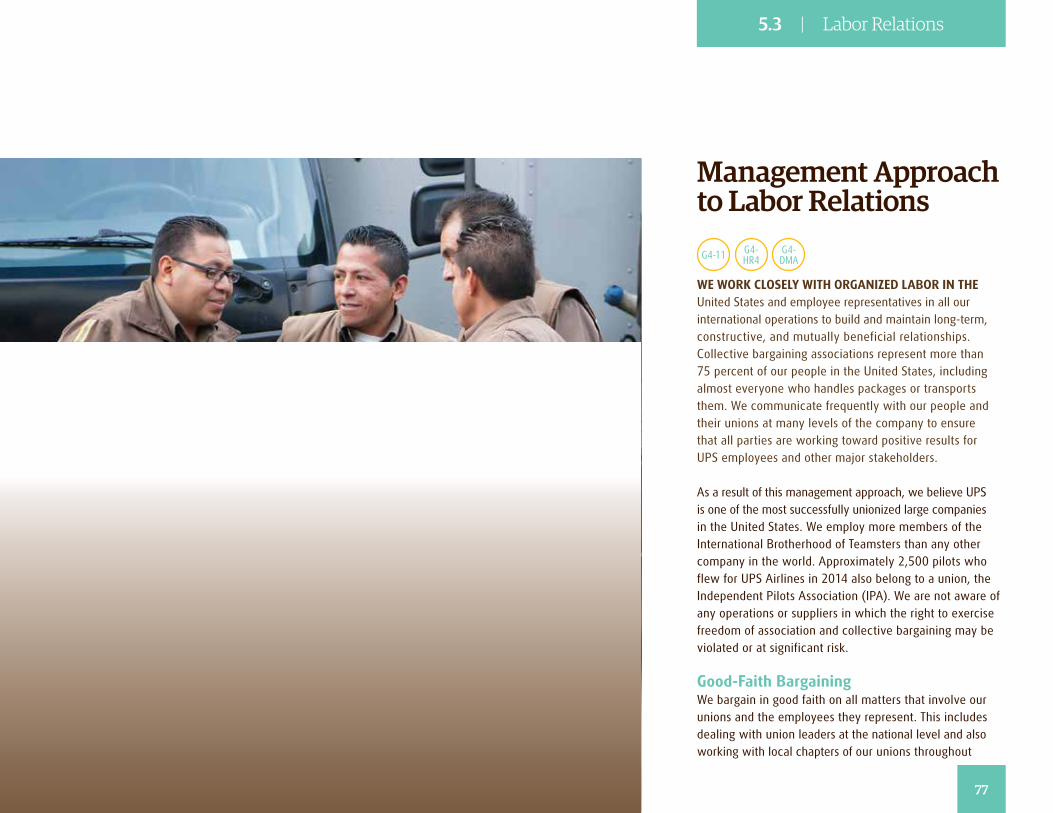
Management Approach to Labor Relations
G4-11 G4- HR4
G4-DMA
WE WORK CLOSELY WITH ORGANIZED LABOR IN THE United States and employee representatives in all our international operations to build and maintain long-term, constructive, and mutually beneficial relationships. Collective bargaining associations represent more than 75 percent of our people in the United States, including almost everyone who handles packages or transports them. We communicate frequently with our people and their unions at many levels of the company to ensure that all parties are working toward positive results for UPS employees and other major stakeholders.
As a result of this management approach, we believe UPS is one of the most successfully unionized large companies in the United States. We employ more members of the International Brotherhood of Teamsters than any other company in the world. Approximately 2,500 pilots who flew for UPS Airlines in 2014 also belong to a union, the Independent Pilots Association (IPA). We are not aware of any operations or suppliers in which the right to exercise freedom of association and collective bargaining may be violated or at significant risk.
Good-Faith BargainingWe bargain in good faith on all matters that involve our unions and the employees they represent. This includes dealing with union leaders at the national level and also working with local chapters of our unions throughout
5.3 | Labor Relations
77
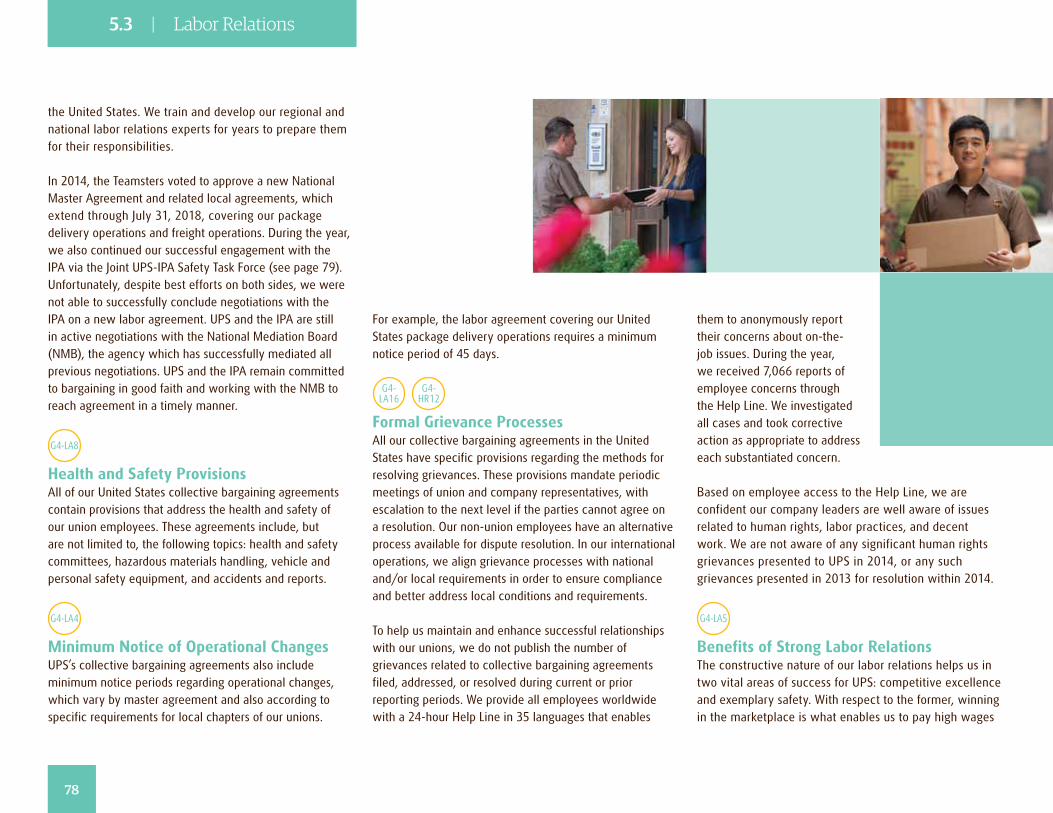
the United States. We train and develop our regional and national labor relations experts for years to prepare them for their responsibilities.
In 2014, the Teamsters voted to approve a new National Master Agreement and related local agreements, which extend through July 31, 2018, covering our package delivery operations and freight operations. During the year, we also continued our successful engagement with the IPA via the Joint UPS-IPA Safety Task Force (see page 79). Unfortunately, despite best efforts on both sides, we were not able to successfully conclude negotiations with the IPA on a new labor agreement. UPS and the IPA are still in active negotiations with the National Mediation Board (NMB), the agency which has successfully mediated all previous negotiations. UPS and the IPA remain committed to bargaining in good faith and working with the NMB to reach agreement in a timely manner.
G4-LA8
Health and Safety ProvisionsAll of our United States collective bargaining agreements contain provisions that address the health and safety of our union employees. These agreements include, but are not limited to, the following topics: health and safety committees, hazardous materials handling, vehicle and personal safety equipment, and accidents and reports.
G4-LA4
Minimum Notice of Operational ChangesUPS’s collective bargaining agreements also include minimum notice periods regarding operational changes, which vary by master agreement and also according to specific requirements for local chapters of our unions.
For example, the labor agreement covering our United States package delivery operations requires a minimum notice period of 45 days.
G4-LA16
G4-HR12
Formal Grievance ProcessesAll our collective bargaining agreements in the United States have specific provisions regarding the methods for resolving grievances. These provisions mandate periodic meetings of union and company representatives, with escalation to the next level if the parties cannot agree on a resolution. Our non-union employees have an alternative process available for dispute resolution. In our international operations, we align grievance processes with national and/or local requirements in order to ensure compliance and better address local conditions and requirements.
To help us maintain and enhance successful relationships with our unions, we do not publish the number of grievances related to collective bargaining agreements filed, addressed, or resolved during current or prior reporting periods. We provide all employees worldwide with a 24-hour Help Line in 35 languages that enables
them to anonymously report their concerns about on-the-job issues. During the year, we received 7,066 reports of employee concerns through the Help Line. We investigated all cases and took corrective action as appropriate to address each substantiated concern.
Based on employee access to the Help Line, we are confident our company leaders are well aware of issues related to human rights, labor practices, and decent work. We are not aware of any significant human rights grievances presented to UPS in 2014, or any such grievances presented in 2013 for resolution within 2014.
G4-LA5
Benefits of Strong Labor RelationsThe constructive nature of our labor relations helps us in two vital areas of success for UPS: competitive excellence and exemplary safety. With respect to the former, winning in the marketplace is what enables us to pay high wages
78
5.3 | Labor Relations
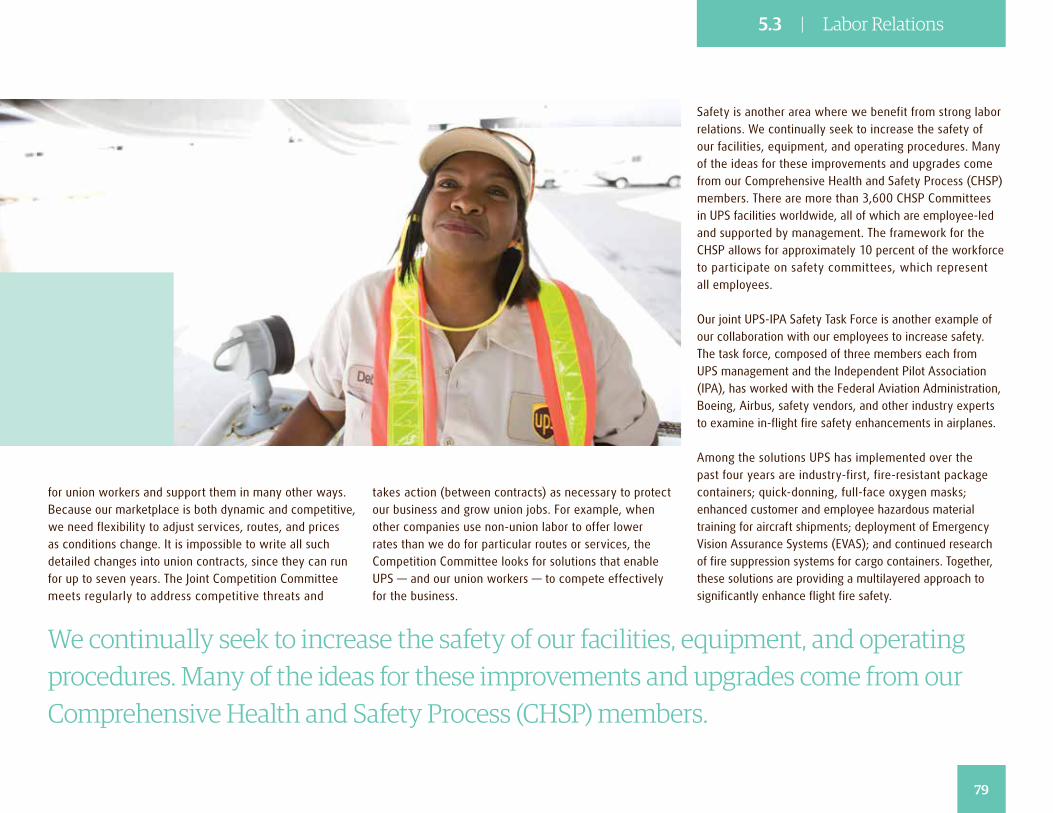
for union workers and support them in many other ways. Because our marketplace is both dynamic and competitive, we need flexibility to adjust services, routes, and prices as conditions change. It is impossible to write all such detailed changes into union contracts, since they can run for up to seven years. The Joint Competition Committee meets regularly to address competitive threats and
We continually seek to increase the safety of our facilities, equipment, and operating procedures. Many of the ideas for these improvements and upgrades come from our Comprehensive Health and Safety Process (CHSP) members.
79
takes action (between contracts) as necessary to protect our business and grow union jobs. For example, when other companies use non-union labor to offer lower rates than we do for particular routes or services, the Competition Committee looks for solutions that enable UPS — and our union workers — to compete effectively for the business.
Safety is another area where we benefit from strong labor relations. We continually seek to increase the safety of our facilities, equipment, and operating procedures. Many of the ideas for these improvements and upgrades come from our Comprehensive Health and Safety Process (CHSP) members. There are more than 3,600 CHSP Committees in UPS facilities worldwide, all of which are employee-led and supported by management. The framework for the CHSP allows for approximately 10 percent of the workforce to participate on safety committees, which represent all employees.
Our joint UPS-IPA Safety Task Force is another example of our collaboration with our employees to increase safety. The task force, composed of three members each from UPS management and the Independent Pilot Association (IPA), has worked with the Federal Aviation Administration, Boeing, Airbus, safety vendors, and other industry experts to examine in-flight fire safety enhancements in airplanes.
Among the solutions UPS has implemented over the past four years are industry-first, fire-resistant package containers; quick-donning, full-face oxygen masks; enhanced customer and employee hazardous material training for aircraft shipments; deployment of Emergency Vision Assurance Systems (EVAS); and continued research of fire suppression systems for cargo containers. Together, these solutions are providing a multilayered approach to significantly enhance flight fire safety.
5.3 | Labor Relations
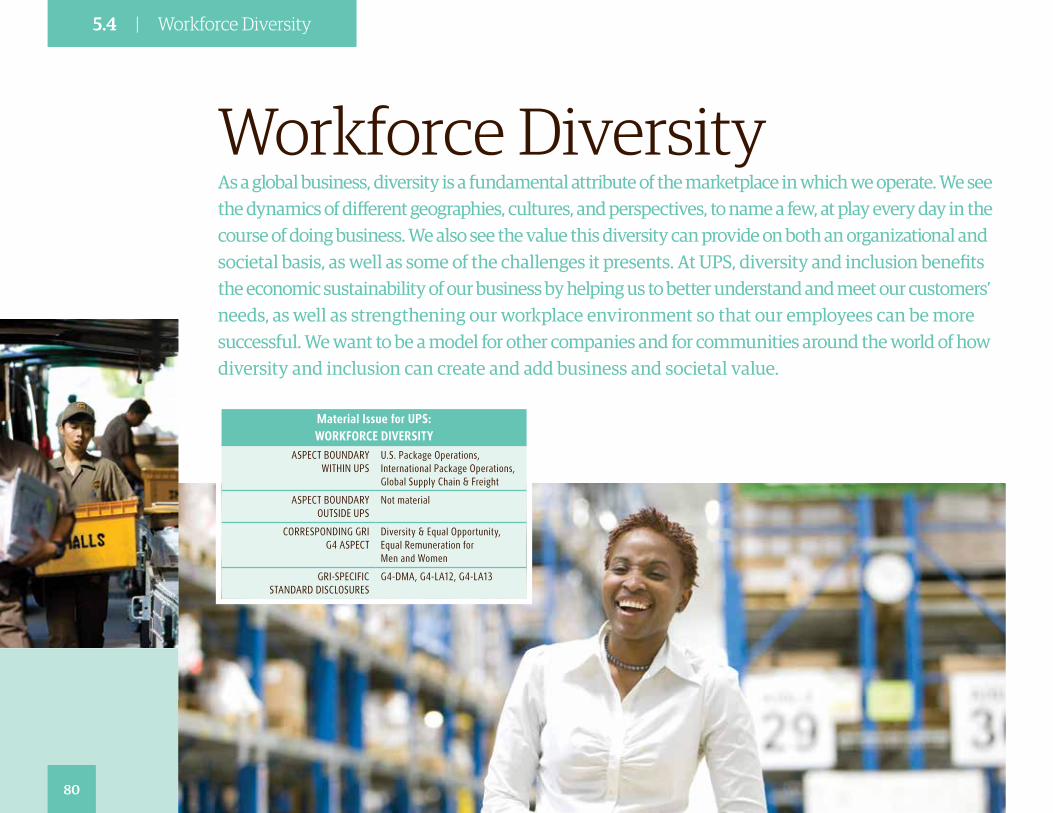
As a global business, diversity is a fundamental attribute of the marketplace in which we operate. We see the dynamics of different geographies, cultures, and perspectives, to name a few, at play every day in the course of doing business. We also see the value this diversity can provide on both an organizational and societal basis, as well as some of the challenges it presents. At UPS, diversity and inclusion benefits the economic sustainability of our business by helping us to better understand and meet our customers’ needs, as well as strengthening our workplace environment so that our employees can be more successful. We want to be a model for other companies and for communities around the world of how diversity and inclusion can create and add business and societal value.
Workforce Diversity
Material Issue for UPS: WORKFORCE DIVERSITY
ASPECT BOUNDARY WITHIN UPS
U.S. Package Operations, International Package Operations, Global Supply Chain & Freight
ASPECT BOUNDARY OUTSIDE UPS
Not material
CORRESPONDING GRIG4 ASPECT
Diversity & Equal Opportunity, Equal Remuneration for Men and Women
GRI-SPECIFIC STANDARD DISCLOSURES
G4-DMA, G4-LA12, G4-LA13
80
5.4 | Workforce Diversity
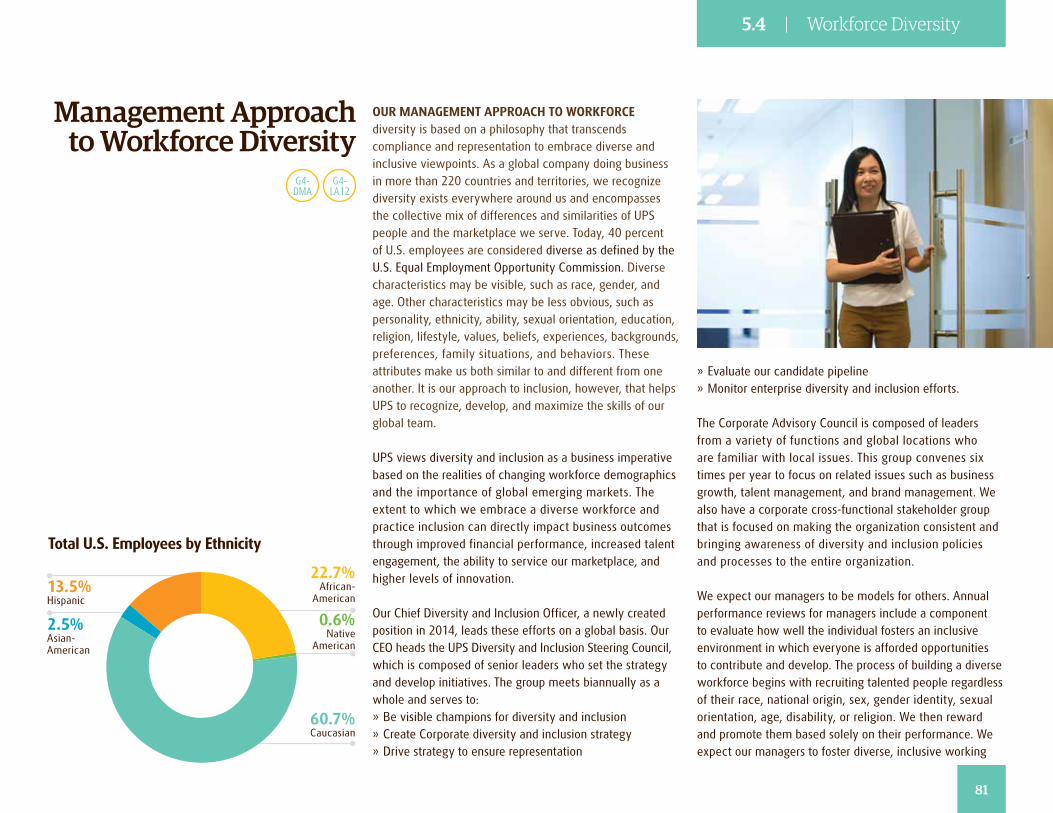
OUR MANAGEMENT APPROACH TO WORKFORCE diversity is based on a philosophy that transcends compliance and representation to embrace diverse and inclusive viewpoints. As a global company doing business in more than 220 countries and territories, we recognize diversity exists everywhere around us and encompasses the collective mix of differences and similarities of UPS people and the marketplace we serve. Today, 40 percent of U.S. employees are considered diverse as defined by the U.S. Equal Employment Opportunity Commission. Diverse characteristics may be visible, such as race, gender, and age. Other characteristics may be less obvious, such as personality, ethnicity, ability, sexual orientation, education, religion, lifestyle, values, beliefs, experiences, backgrounds, preferences, family situations, and behaviors. These attributes make us both similar to and different from one another. It is our approach to inclusion, however, that helps UPS to recognize, develop, and maximize the skills of our global team.
UPS views diversity and inclusion as a business imperative based on the realities of changing workforce demographics and the importance of global emerging markets. The extent to which we embrace a diverse workforce and practice inclusion can directly impact business outcomes through improved financial performance, increased talent engagement, the ability to service our marketplace, and higher levels of innovation.
Our Chief Diversity and Inclusion Officer, a newly created position in 2014, leads these efforts on a global basis. Our CEO heads the UPS Diversity and Inclusion Steering Council, which is composed of senior leaders who set the strategy and develop initiatives. The group meets biannually as a whole and serves to: » Be visible champions for diversity and inclusion » Create Corporate diversity and inclusion strategy » Drive strategy to ensure representation
Management Approach to Workforce Diversity
Total U.S. Employees by Ethnicity
22.7% African-
American
0.6% Native
American
60.7% Caucasian
13.5% Hispanic
2.5% Asian-American
» Evaluate our candidate pipeline » Monitor enterprise diversity and inclusion efforts.
The Corporate Advisory Council is composed of leaders from a variety of functions and global locations who are familiar with local issues. This group convenes six times per year to focus on related issues such as business growth, talent management, and brand management. We also have a corporate cross-functional stakeholder group that is focused on making the organization consistent and bringing awareness of diversity and inclusion policies and processes to the entire organization.
We expect our managers to be models for others. Annual performance reviews for managers include a component to evaluate how well the individual fosters an inclusive environment in which everyone is afforded opportunities to contribute and develop. The process of building a diverse workforce begins with recruiting talented people regardless of their race, national origin, sex, gender identity, sexual orientation, age, disability, or religion. We then reward and promote them based solely on their performance. We expect our managers to foster diverse, inclusive working
81
G4-LA12
G4-DMA
5.4 | Workforce Diversity
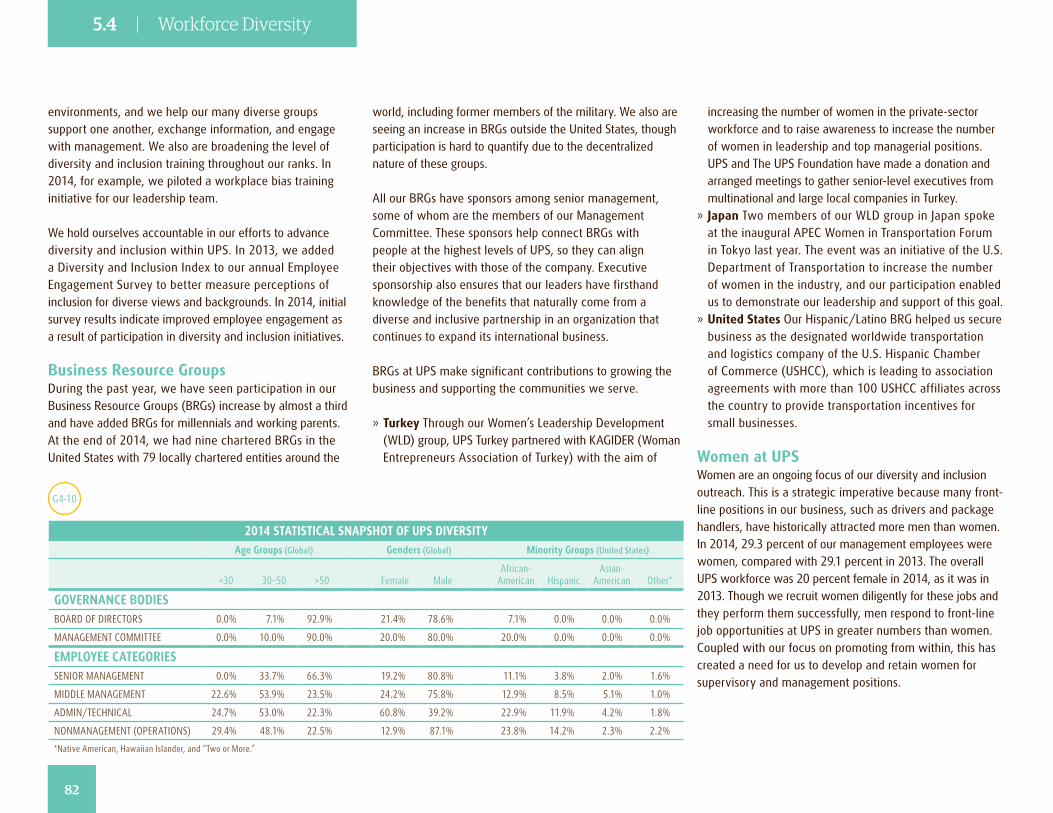
2014 STATISTICAL SNAPSHOT OF UPS DIVERSITYAge Groups (Global) Genders (Global) Minority Groups (United States)
<30 30–50 >50 Female MaleAfrican-
American Hispanic Asian-
American Other*
GOVERNANCE BODIESBOARD OF DIRECTORS 0.0% 7.1% 92.9% 21.4% 78.6% 7.1% 0.0% 0.0% 0.0%
MANAGEMENT COMMITTEE 0.0% 10.0% 90.0% 20.0% 80.0% 20.0% 0.0% 0.0% 0.0%
EMPLOYEE CATEGORIESSENIOR MANAGEMENT 0.0% 33.7% 66.3% 19.2% 80.8% 11.1% 3.8% 2.0% 1.6%
MIDDLE MANAGEMENT 22.6% 53.9% 23.5% 24.2% 75.8% 12.9% 8.5% 5.1% 1.0%
ADMIN/TECHNICAL 24.7% 53.0% 22.3% 60.8% 39.2% 22.9% 11.9% 4.2% 1.8%
NONMANAGEMENT (OPERATIONS) 29.4% 48.1% 22.5% 12.9% 87.1% 23.8% 14.2% 2.3% 2.2%
*Native American, Hawaiian Islander, and “Two or More.”
environments, and we help our many diverse groups support one another, exchange information, and engage with management. We also are broadening the level of diversity and inclusion training throughout our ranks. In 2014, for example, we piloted a workplace bias training initiative for our leadership team.
We hold ourselves accountable in our efforts to advance diversity and inclusion within UPS. In 2013, we added a Diversity and Inclusion Index to our annual Employee Engagement Survey to better measure perceptions of inclusion for diverse views and backgrounds. In 2014, initial survey results indicate improved employee engagement as a result of participation in diversity and inclusion initiatives.
Business Resource GroupsDuring the past year, we have seen participation in our Business Resource Groups (BRGs) increase by almost a third and have added BRGs for millennials and working parents. At the end of 2014, we had nine chartered BRGs in the United States with 79 locally chartered entities around the
world, including former members of the military. We also are seeing an increase in BRGs outside the United States, though participation is hard to quantify due to the decentralized nature of these groups.
All our BRGs have sponsors among senior management, some of whom are the members of our Management Committee. These sponsors help connect BRGs with people at the highest levels of UPS, so they can align their objectives with those of the company. Executive sponsorship also ensures that our leaders have firsthand knowledge of the benefits that naturally come from a diverse and inclusive partnership in an organization that continues to expand its international business.
BRGs at UPS make significant contributions to growing the business and supporting the communities we serve.
» Turkey Through our Women’s Leadership Development (WLD) group, UPS Turkey partnered with KAGIDER (Woman Entrepreneurs Association of Turkey) with the aim of
increasing the number of women in the private-sector workforce and to raise awareness to increase the number of women in leadership and top managerial positions. UPS and The UPS Foundation have made a donation and arranged meetings to gather senior-level executives from multinational and large local companies in Turkey.
» Japan Two members of our WLD group in Japan spoke at the inaugural APEC Women in Transportation Forum in Tokyo last year. The event was an initiative of the U.S. Department of Transportation to increase the number of women in the industry, and our participation enabled us to demonstrate our leadership and support of this goal.
» United States Our Hispanic/Latino BRG helped us secure business as the designated worldwide transportation and logistics company of the U.S. Hispanic Chamber of Commerce (USHCC), which is leading to association agreements with more than 100 USHCC affiliates across the country to provide transportation incentives for small businesses.
Women at UPSWomen are an ongoing focus of our diversity and inclusion outreach. This is a strategic imperative because many front-line positions in our business, such as drivers and package handlers, have historically attracted more men than women. In 2014, 29.3 percent of our management employees were women, compared with 29.1 percent in 2013. The overall UPS workforce was 20 percent female in 2014, as it was in 2013. Though we recruit women diligently for these jobs and they perform them successfully, men respond to front-line job opportunities at UPS in greater numbers than women. Coupled with our focus on promoting from within, this has created a need for us to develop and retain women for supervisory and management positions.
G4-10
82
5.4 | Workforce Diversity
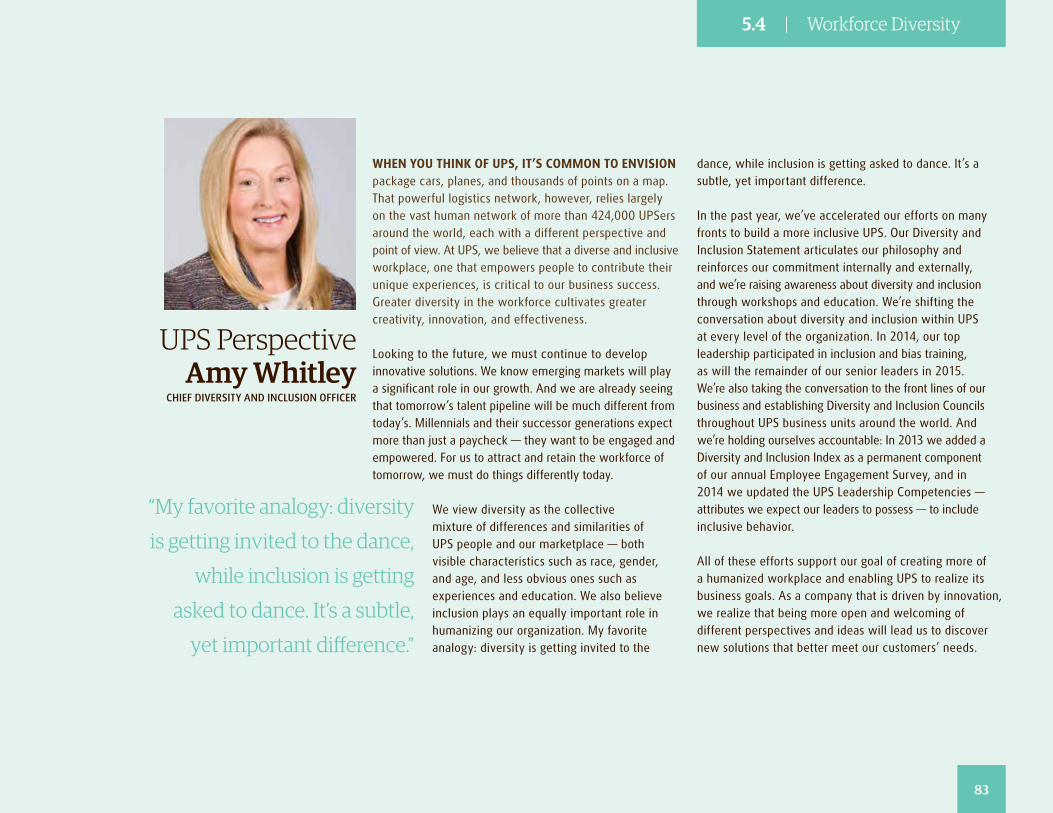
WHEN YOU THINK OF UPS, IT’S COMMON TO ENVISION package cars, planes, and thousands of points on a map. That powerful logistics network, however, relies largely on the vast human network of more than 424,000 UPSers around the world, each with a different perspective and point of view. At UPS, we believe that a diverse and inclusive workplace, one that empowers people to contribute their unique experiences, is critical to our business success. Greater diversity in the workforce cultivates greater creativity, innovation, and effectiveness.
Looking to the future, we must continue to develop innovative solutions. We know emerging markets will play a significant role in our growth. And we are already seeing that tomorrow’s talent pipeline will be much different from today’s. Millennials and their successor generations expect more than just a paycheck — they want to be engaged and empowered. For us to attract and retain the workforce of tomorrow, we must do things differently today.
We view diversity as the collective mixture of differences and similarities of UPS people and our marketplace — both visible characteristics such as race, gender, and age, and less obvious ones such as experiences and education. We also believe inclusion plays an equally important role in humanizing our organization. My favorite analogy: diversity is getting invited to the
dance, while inclusion is getting asked to dance. It’s a subtle, yet important difference.
In the past year, we’ve accelerated our efforts on many fronts to build a more inclusive UPS. Our Diversity and Inclusion Statement articulates our philosophy and reinforces our commitment internally and externally, and we’re raising awareness about diversity and inclusion through workshops and education. We’re shifting the conversation about diversity and inclusion within UPS at every level of the organization. In 2014, our top leadership participated in inclusion and bias training, as will the remainder of our senior leaders in 2015. We’re also taking the conversation to the front lines of our business and establishing Diversity and Inclusion Councils throughout UPS business units around the world. And we’re holding ourselves accountable: In 2013 we added a Diversity and Inclusion Index as a permanent component of our annual Employee Engagement Survey, and in 2014 we updated the UPS Leadership Competencies — attributes we expect our leaders to possess — to include inclusive behavior.
All of these efforts support our goal of creating more of a humanized workplace and enabling UPS to realize its business goals. As a company that is driven by innovation, we realize that being more open and welcoming of different perspectives and ideas will lead us to discover new solutions that better meet our customers’ needs.
“My favorite analogy: diversity
is getting invited to the dance,
while inclusion is getting
asked to dance. It’s a subtle,
yet important difference.”
UPS PerspectiveAmy Whitley
CHIEF DIVERSITY AND INCLUSION OFFICER
83
5.4 | Workforce Diversity
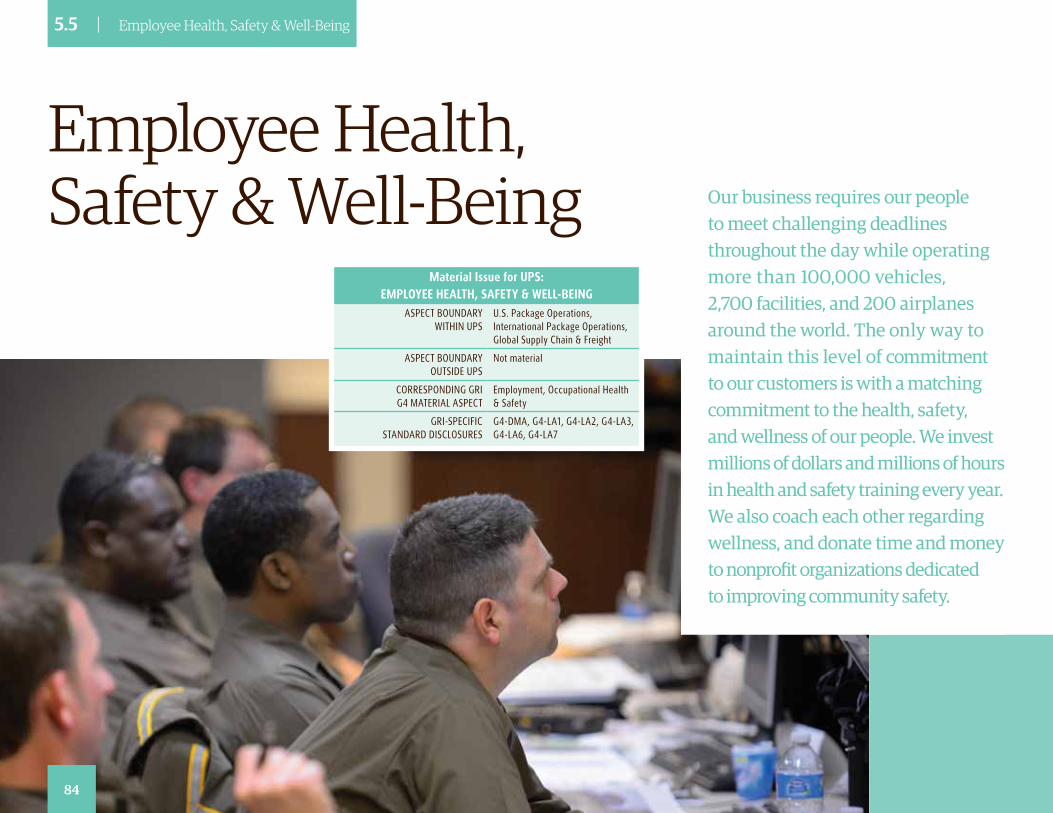
Employee Health, Safety & Well-Being
Material Issue for UPS: EMPLOYEE HEALTH, SAFETY & WELL-BEING
ASPECT BOUNDARY WITHIN UPS
U.S. Package Operations, International Package Operations, Global Supply Chain & Freight
ASPECT BOUNDARY OUTSIDE UPS
Not material
CORRESPONDING GRIG4 MATERIAL ASPECT
Employment, Occupational Health & Safety
GRI-SPECIFIC STANDARD DISCLOSURES
G4-DMA, G4-LA1, G4-LA2, G4-LA3, G4-LA6, G4-LA7
Our business requires our people to meet challenging deadlines throughout the day while operating more than 100,000 vehicles, 2,700 facilities, and 200 airplanes around the world. The only way to maintain this level of commitment to our customers is with a matching commitment to the health, safety, and wellness of our people. We invest millions of dollars and millions of hours in health and safety training every year. We also coach each other regarding wellness, and donate time and money to nonprofit organizations dedicated to improving community safety.
84
5.5 | Employee Health, Safety & Well-Being
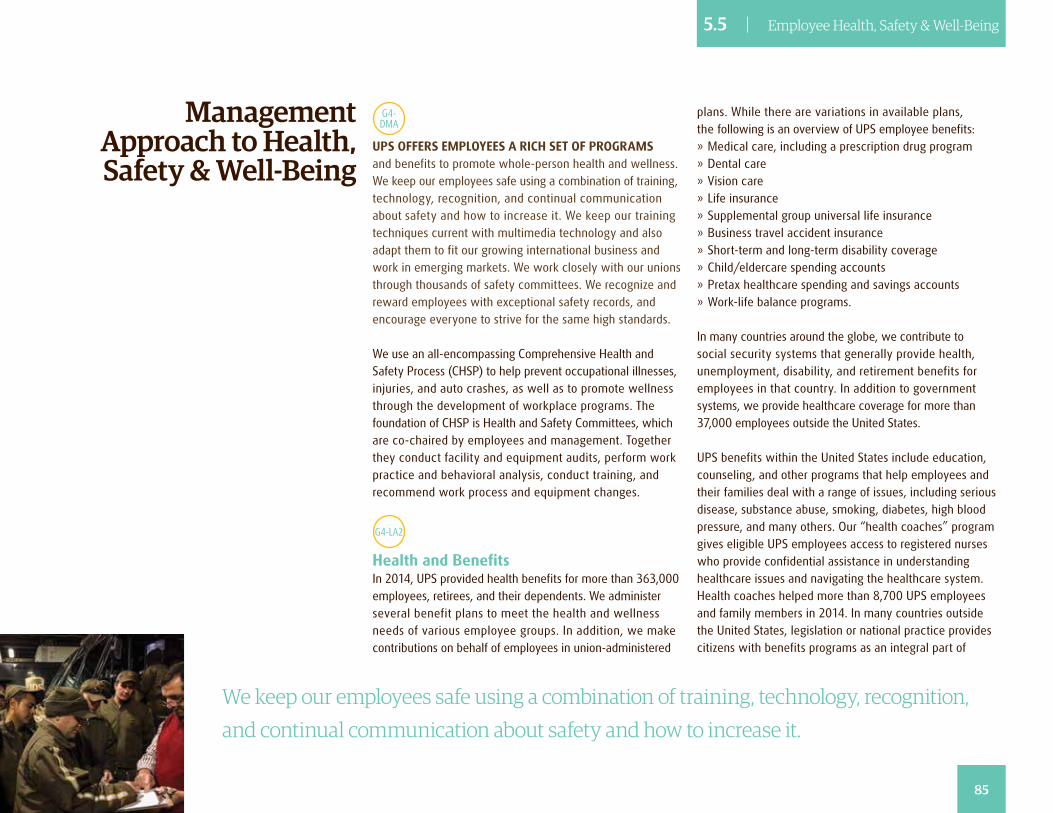
Management Approach to Health, Safety & Well-Being
G4- DMA
UPS OFFERS EMPLOYEES A RICH SET OF PROGRAMS and benefits to promote whole-person health and wellness. We keep our employees safe using a combination of training, technology, recognition, and continual communication about safety and how to increase it. We keep our training techniques current with multimedia technology and also adapt them to fit our growing international business and work in emerging markets. We work closely with our unions through thousands of safety committees. We recognize and reward employees with exceptional safety records, and encourage everyone to strive for the same high standards.
We use an all-encompassing Comprehensive Health and Safety Process (CHSP) to help prevent occupational illnesses, injuries, and auto crashes, as well as to promote wellness through the development of workplace programs. The foundation of CHSP is Health and Safety Committees, which are co-chaired by employees and management. Together they conduct facility and equipment audits, perform work practice and behavioral analysis, conduct training, and recommend work process and equipment changes.
G4-LA2
Health and BenefitsIn 2014, UPS provided health benefits for more than 363,000 employees, retirees, and their dependents. We administer several benefit plans to meet the health and wellness needs of various employee groups. In addition, we make contributions on behalf of employees in union-administered
plans. While there are variations in available plans, the following is an overview of UPS employee benefits: » Medical care, including a prescription drug program » Dental care » Vision care » Life insurance » Supplemental group universal life insurance » Business travel accident insurance » Short-term and long-term disability coverage » Child/eldercare spending accounts » Pretax healthcare spending and savings accounts » Work-life balance programs.
In many countries around the globe, we contribute to social security systems that generally provide health, unemployment, disability, and retirement benefits for employees in that country. In addition to government systems, we provide healthcare coverage for more than 37,000 employees outside the United States.
UPS benefits within the United States include education, counseling, and other programs that help employees and their families deal with a range of issues, including serious disease, substance abuse, smoking, diabetes, high blood pressure, and many others. Our “health coaches” program gives eligible UPS employees access to registered nurses who provide confidential assistance in understanding healthcare issues and navigating the healthcare system. Health coaches helped more than 8,700 UPS employees and family members in 2014. In many countries outside the United States, legislation or national practice provides citizens with benefits programs as an integral part of
We keep our employees safe using a combination of training, technology, recognition,
and continual communication about safety and how to increase it.
85
5.5 | Employee Health, Safety & Well-Being
the social system. We offer private-benefit plans to our international operations to supplement these programs.
In the United States, our Employee Assistance Program (EAP) provides practical information, referrals to trained professionals, and support for a wide range of work/life issues, from financial concerns and child care to substance abuse and bereavement. Since we began the EAP in 2006, more than 621,000 UPS employees and/or household members have benefited from it.
In 2014, we implemented two major changes in healthcare benefits that affected a limited number of our non-union employees in the United States. First, a UPS employee with a working spouse who had access to medical coverage through his or her employer was no longer eligible to enroll for medical coverage through UPS. Any spouse who does not work or does not have access to healthcare coverage through his or her own employer is still eligible for coverage
through the UPS employee’s plan. Second, we enacted a premium increase for medical coverage for tobacco users who do not complete the tobacco cessation program provided by UPS. Participants who completed the tobacco cessation program in 2014 were refunded the total tobacco premium increase they paid.
Additionally in 2014, we began a dependent eligibility re-verification process in the United States to ensure that only eligible persons are covered by the plan. This multiphased process resulted in the removal of 9,000 ineligible people from the plan, thus contributing to the sustainability of the plan and our ability to provide healthcare benefits.
G4-LA2
Other Benefits and AvailabilityWe further invest in our people by offering a competitive range of other benefits in addition to those for health and wellness. In the United States, these other benefits are generally provided to non-union employees without regard to full-time or part-time status. They include: » Retirement plans » 401(k) plans » Tuition assistance » Discounted employee stock purchase plan » Paid time off » Employee discounts » Relocation programs
Certain of these benefits are not available to all or some part-time employees. These include long-term disability coverage, business travel accident insurance, and tuition assistance; availability may vary by location and employee position. Furthermore, certain of these benefits may, in practical terms, apply only to management employees, such as those taking advantage of our relocation programs. Our union employees bargain collectively for their benefits
via their union representatives. Temporary employees and seasonal workers are not generally eligible for UPS benefits.
G4-LA3
Parental Leave Under the U.S. Family and Medical Leave Act, UPS employees in the U.S. are eligible for parental leave if they have worked for UPS for at least 12 months, for 1,250 hours over the previous 12 months. Additionally, any UPS employee who is not eligible according to the FMLA requirements, but has worked at UPS for a minimum of 36 consecutive months and for at least 625 hours during the previous 12-month period, may still be eligible for leave under the UPS FMLA Policy. In 2014, many of our employees would qualify for FMLA leave as well as short-term disability maternity leave for pregnancy. In addition, there are state laws that offer greater protections or have eligibility requirements different from the federal law. In the U.S. in 2014, more than 52,000 female employees and 230,000 male employees were eligible for parental leave; more than 7,000 employees took parental leave during the year. Of these, 26 percent were female. The return-to-work rate was 87 percent female; 94 percent male. Data from 2014 indicated that 92 percent of male and female employees combined who returned from parental leave were still employed at UPS at the time this Report was published.
G4-LA7
SafetyAt UPS, safety is deeply ingrained as a matter of formal training, careful facility and equipment design, and a corporate culture that values each person’s ability to perform for team success. That success begins with being a healthy individual who mitigates safety risks both at home and on the job. To reinforce this well-rounded approach among our employees, we are introducing a global wellness
86
5.5 | Employee Health, Safety & Well-Being

training courses in 2014. This represents about 24 percent of our training spend. Our employees devoted well over 4 million hours to safety training during the year, with the majority focused on working safely with vehicles, airplanes, and freight handling.
As always, we continued to enforce stringent policies governing working hours, rest hours, rest facilities, and leave times for people who drive and operate vehicles. These policies are tailored to the different types of work we do and how we do it. They conform to laws and regulations in the countries, states, and other political entities where we operate, and they are often included in our contracts with collective bargaining organizations. We regularly complete interviews, surveys, document reviews, and site inspections to evaluate the quality of our safety efforts and audit how well we conform to our safety policies. These activities also inform decisions around strategic changes that are necessary to better serve our people as our business grows.
AchievementsAlong with operating vehicles and handling packages, our drivers are the face of UPS to millions of customers every day. As such, we expect them to be among the safest drivers on the road. When our drivers have driven for UPS for 25 years without an avoidable accident, we induct them into our “Circle of Honor.” It is truly an honor among UPSers to enter the Circle because so many of us have been drivers and know what it takes to avoid accidents day in and day out. In 2014, 1,445 drivers from three countries — the United States, Canada, and Germany — reached this milestone. This includes 41 women from the United States. Meanwhile, many other members of the Circle of Honor are maintaining their exemplary safe driving records long after 25 years. Collectively, the 7,878 drivers in the Circle of Honor have logged more than 5.3 billion miles — enough to travel to Mars and back 36 times.
G4-LA6
Key Performance Indicators (KPIs) Employee safety KPIs cover our entire global operations. We recorded 1.82 lost-time injuries per 200,000 hours worked in 2014, and 9.96 auto accidents per 100,000 driver hours. For both KPIs, the 2014 results represented an increase compared with 2013. Elements affecting our lost-time injury and auto accident frequency include factors such as international expansion and severe weather events. Our 2016 goals for these KPIs are lost-time injury frequency of 1.75 and auto accident frequency of 9.00.
In 2014, 79.8 percent of injuries in the United States, Canada, and Puerto Rico involved men; the remaining 20.2 percent involved women. In these geographies, we use the Safety
We regularly complete interviews,
surveys, document reviews, and site
inspections to evaluate the quality of
our safety efforts and audit how well
we confirm to our safety policies.
During the past year, Virgina “Ginny” Odom became the first female UPS driver to reach the 40-year safe driving milestone.
In 2014, Thomas Camp reached 52 years of accident-free driving with UPS, the highest of any UPS driver.
guide called the Five Being Habits that focuses on five areas of wellness: fitness, sleep, nutrition, stress management, and hydration. These habits serve as actionable measures that employees and their families can take toward healthy lifestyles. A wellness champion within each CHSP Committee will use these five habits to drive messages of wellness within his or her respective workplace.
The wellness guide stems from the Five Being Habits program developed by UPS Freight and UPS Airlines. In 2014, the airline expanded the program with its Being Well Challenge, an innovative program that addresses specific environmental, health, and safety topics. The program was recognized with the Innovation Challenge Award from the National Safety Council’s Campbell Institute.
Nearly 600 people at UPS worked full time providing safety and wellness leadership in 2014, in addition to the leadership provided within CHSP Committees. We spent more than US$175 million on teaching more than 200 formal safety
87
5.5 | Employee Health, Safety & Well-Being

Health Risk Management Information System to track this data. We are planning to deploy an International Incident Reporting Tool in 2016. We do not currently report similar data in other countries, and we do not currently track days of absenteeism. We are not aware of any occupational diseases among UPS employees, or of any incidence or high risk of disease related to our occupations at UPS.
We deeply regret the fatal accidents that claimed the lives of five UPS employees in 2014, all of whom were men. Three of the fatalities involved auto accidents, while two involved a tragic workplace shooting. Whenever an accident occurs on the job at UPS, our management invests a significant amount of attention investigating the contributing causes and improving procedures and safety training where necessary.
Increasing Global Road SafetyThe U.N. Decade for Road Safety has identified motor vehicle accidents as a global epidemic. The UPS Road Code™ program teaches safe driving practices to teens, using sophisticated multimedia and teaching techniques drawn from UPS’s own driver safety courses. The UPS Foundation, through partnerships with youth development organizations, provides funds for the technology, while UPS employees and retirees teach the program on a volunteer basis. We offer UPS Road Code at 52 sites in the United States and four other countries: Canada, China, Germany, and the United Kingdom. We expect to reach 57 sites by the end
of 2017. In 2014, we extended our partnership with the Boys & Girls Clubs of America through 2017 and introduced a UPS Road Code Ambassador program to publicize the program in high schools. The UPS Foundation also is working toward the introduction of an insurance discount for teens who complete the program.
We also continued our support of another community road safety program in 2014 by funding the donation of helmets for young people riding scooters in Southeast Asia. In 2012, we pledged US$450,000 to the Asia Injury Prevention Foundation to purchase 27,500 helmets, 17,464 of which were purchased through the end of 2014. As part of this multiyear program, UPS employees are volunteering their time to urge schools, families, and children to promote wearing helmets as a way to avoid injuries in case of accidents.
88
5.5 | Employee Health, Safety & Well-Being
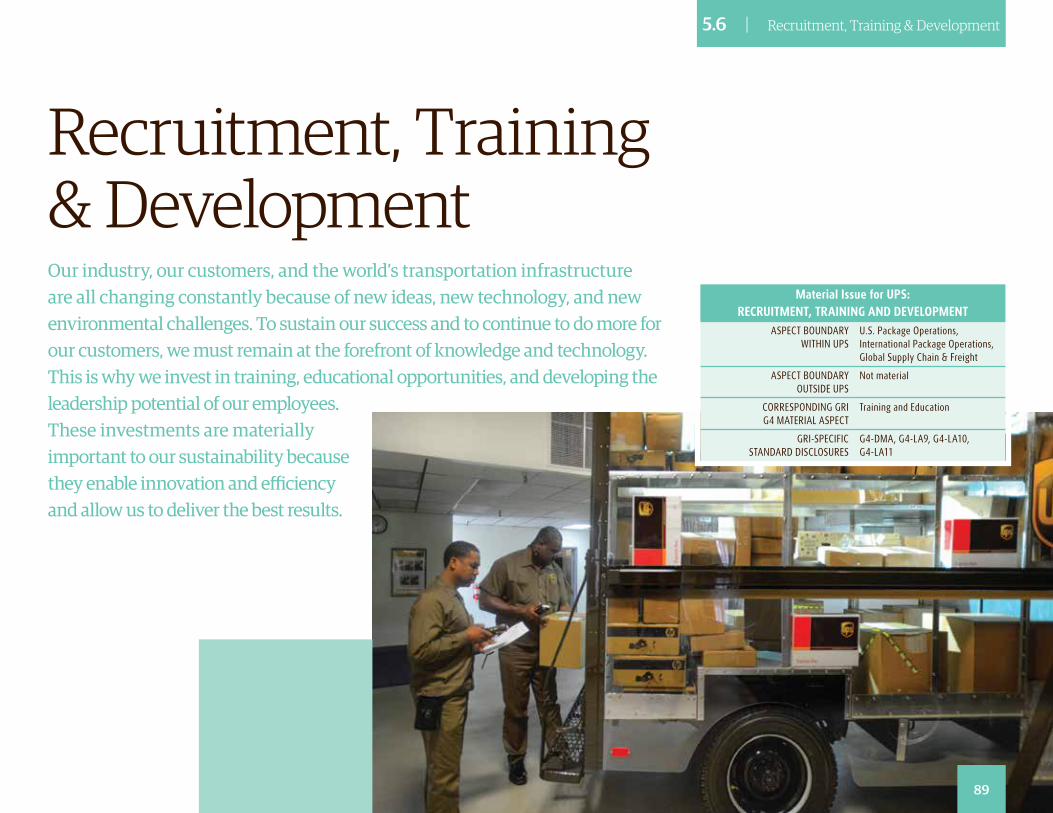
Our industry, our customers, and the world’s transportation infrastructure are all changing constantly because of new ideas, new technology, and new environmental challenges. To sustain our success and to continue to do more for our customers, we must remain at the forefront of knowledge and technology. This is why we invest in training, educational opportunities, and developing the leadership potential of our employees. These investments are materially important to our sustainability because they enable innovation and efficiency and allow us to deliver the best results.
Recruitment, Training & Development
Material Issue for UPS: RECRUITMENT, TRAINING AND DEVELOPMENT
ASPECT BOUNDARY WITHIN UPS
U.S. Package Operations, International Package Operations, Global Supply Chain & Freight
ASPECT BOUNDARY OUTSIDE UPS
Not material
CORRESPONDING GRIG4 MATERIAL ASPECT
Training and Education
GRI-SPECIFIC STANDARD DISCLOSURES
G4-DMA, G4-LA9, G4-LA10, G4-LA11
89
5.6 | Recruitment, Training & Development
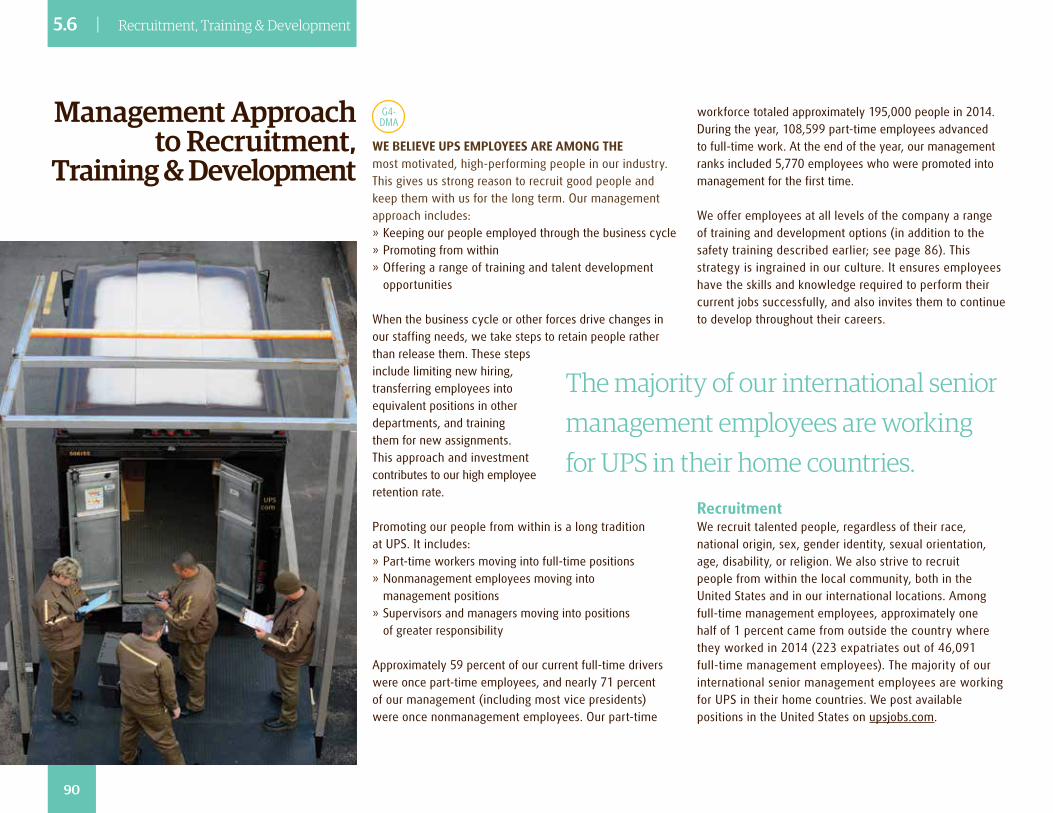
G4-DMA
WE BELIEVE UPS EMPLOYEES ARE AMONG THE most motivated, high-performing people in our industry. This gives us strong reason to recruit good people and keep them with us for the long term. Our management approach includes: » Keeping our people employed through the business cycle » Promoting from within » Offering a range of training and talent development opportunities
When the business cycle or other forces drive changes in our staffing needs, we take steps to retain people rather than release them. These steps include limiting new hiring, transferring employees into equivalent positions in other departments, and training them for new assignments. This approach and investment contributes to our high employee retention rate.
Promoting our people from within is a long tradition at UPS. It includes: » Part-time workers moving into full-time positions » Nonmanagement employees moving into management positions
» Supervisors and managers moving into positions of greater responsibility
Approximately 59 percent of our current full-time drivers were once part-time employees, and nearly 71 percent of our management (including most vice presidents) were once nonmanagement employees. Our part-time
workforce totaled approximately 195,000 people in 2014. During the year, 108,599 part-time employees advanced to full-time work. At the end of the year, our management ranks included 5,770 employees who were promoted into management for the first time.
We offer employees at all levels of the company a range of training and development options (in addition to the safety training described earlier; see page 86). This strategy is ingrained in our culture. It ensures employees have the skills and knowledge required to perform their current jobs successfully, and also invites them to continue to develop throughout their careers.
RecruitmentWe recruit talented people, regardless of their race, national origin, sex, gender identity, sexual orientation, age, disability, or religion. We also strive to recruit people from within the local community, both in the United States and in our international locations. Among full-time management employees, approximately one half of 1 percent came from outside the country where they worked in 2014 (223 expatriates out of 46,091 full-time management employees). The majority of our international senior management employees are working for UPS in their home countries. We post available positions in the United States on upsjobs.com.
Management Approach to Recruitment,
Training & Development
The majority of our international senior management employees are working for UPS in their home countries.
90
5.6 | Recruitment, Training & Development
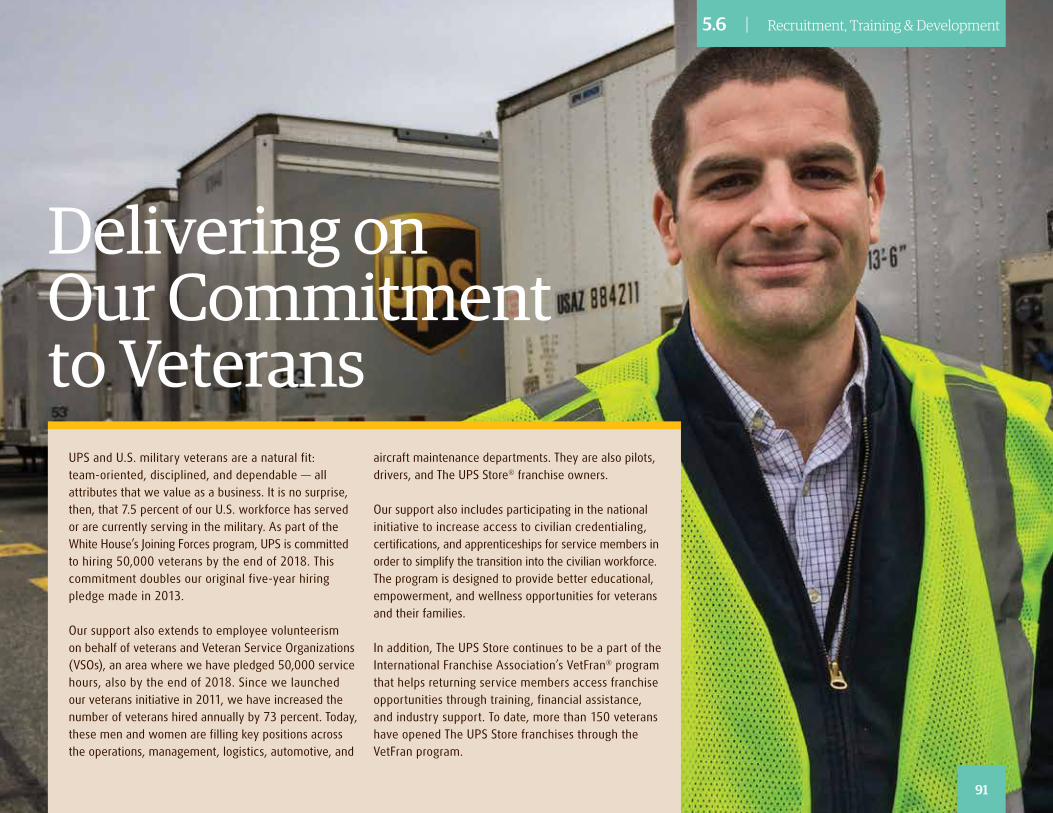
UPS and U.S. military veterans are a natural fit: team-oriented, disciplined, and dependable — all attributes that we value as a business. It is no surprise, then, that 7.5 percent of our U.S. workforce has served or are currently serving in the military. As part of the White House’s Joining Forces program, UPS is committed to hiring 50,000 veterans by the end of 2018. This commitment doubles our original five-year hiring pledge made in 2013.
Our support also extends to employee volunteerism on behalf of veterans and Veteran Service Organizations (VSOs), an area where we have pledged 50,000 service hours, also by the end of 2018. Since we launched our veterans initiative in 2011, we have increased the number of veterans hired annually by 73 percent. Today, these men and women are filling key positions across the operations, management, logistics, automotive, and
aircraft maintenance departments. They are also pilots, drivers, and The UPS Store® franchise owners.
Our support also includes participating in the national initiative to increase access to civilian credentialing, certifications, and apprenticeships for service members in order to simplify the transition into the civilian workforce. The program is designed to provide better educational, empowerment, and wellness opportunities for veterans and their families.
In addition, The UPS Store continues to be a part of the International Franchise Association’s VetFran® program that helps returning service members access franchise opportunities through training, financial assistance, and industry support. To date, more than 150 veterans have opened The UPS Store franchises through the VetFran program.
Delivering on Our Commitment to Veterans
91
5.6 | Recruitment, Training & Development
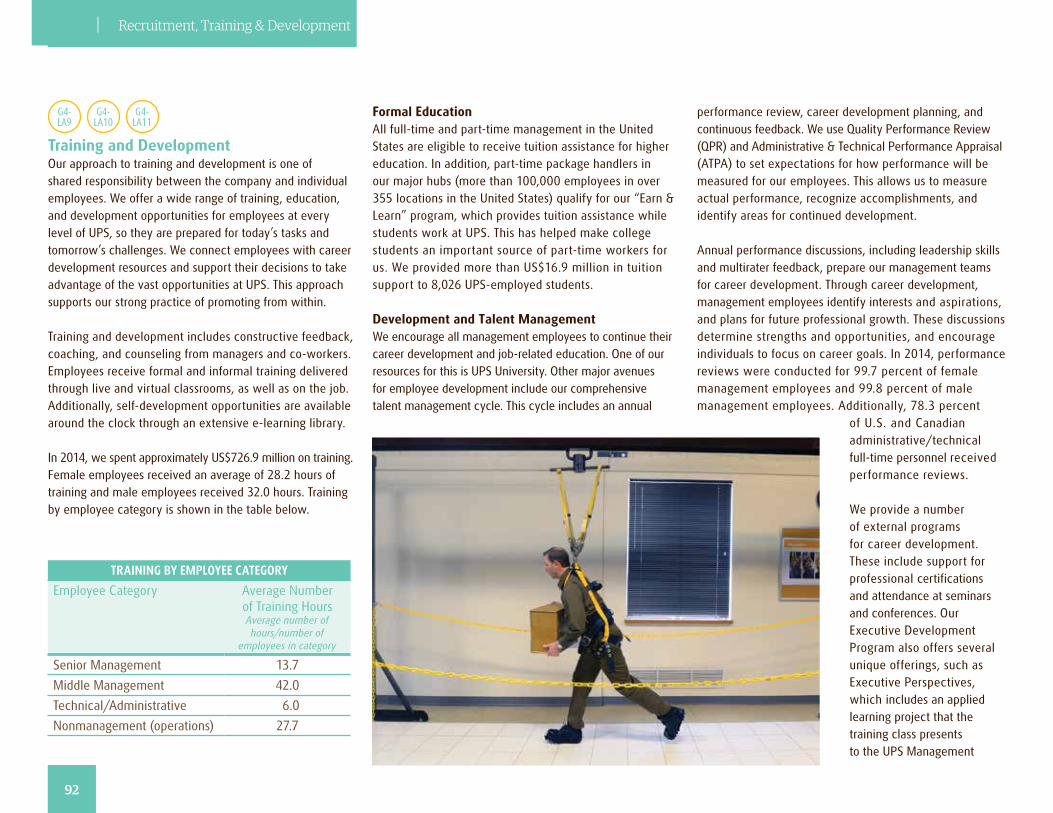
G4- LA9
G4-LA10
G4-LA11
Training and DevelopmentOur approach to training and development is one of shared responsibility between the company and individual employees. We offer a wide range of training, education, and development opportunities for employees at every level of UPS, so they are prepared for today’s tasks and tomorrow’s challenges. We connect employees with career development resources and support their decisions to take advantage of the vast opportunities at UPS. This approach supports our strong practice of promoting from within.
Training and development includes constructive feedback, coaching, and counseling from managers and co-workers. Employees receive formal and informal training delivered through live and virtual classrooms, as well as on the job. Additionally, self-development opportunities are available around the clock through an extensive e-learning library.
In 2014, we spent approximately US$726.9 million on training. Female employees received an average of 28.2 hours of training and male employees received 32.0 hours. Training by employee category is shown in the table below.
TRAINING BY EMPLOYEE CATEGORY
Employee Category Average Number of Training Hours Average number of hours/number of
employees in category
Senior Management 13.7
Middle Management 42.0
Technical/Administrative 6.0
Nonmanagement (operations) 27.7
Formal EducationAll full-time and part-time management in the United States are eligible to receive tuition assistance for higher education. In addition, part-time package handlers in our major hubs (more than 100,000 employees in over 355 locations in the United States) qualify for our “Earn & Learn” program, which provides tuition assistance while students work at UPS. This has helped make college students an important source of part-time workers for us. We provided more than US$16.9 million in tuition support to 8,026 UPS-employed students.
Development and Talent ManagementWe encourage all management employees to continue their career development and job-related education. One of our resources for this is UPS University. Other major avenues for employee development include our comprehensive talent management cycle. This cycle includes an annual
performance review, career development planning, and continuous feedback. We use Quality Performance Review (QPR) and Administrative & Technical Performance Appraisal (ATPA) to set expectations for how performance will be measured for our employees. This allows us to measure actual performance, recognize accomplishments, and identify areas for continued development.
Annual performance discussions, including leadership skills and multirater feedback, prepare our management teams for career development. Through career development, management employees identify interests and aspirations, and plans for future professional growth. These discussions determine strengths and opportunities, and encourage individuals to focus on career goals. In 2014, performance reviews were conducted for 99.7 percent of female management employees and 99.8 percent of male management employees. Additionally, 78.3 percent
of U.S. and Canadian administrative/technical full-time personnel received performance reviews.
We provide a number of external programs for career development. These include support for professional certifications and attendance at seminars and conferences. Our Executive Development Program also offers several unique offerings, such as Executive Perspectives, which includes an applied learning project that the training class presents to the UPS Management
5.6 | Recruitment, Training & Development
92
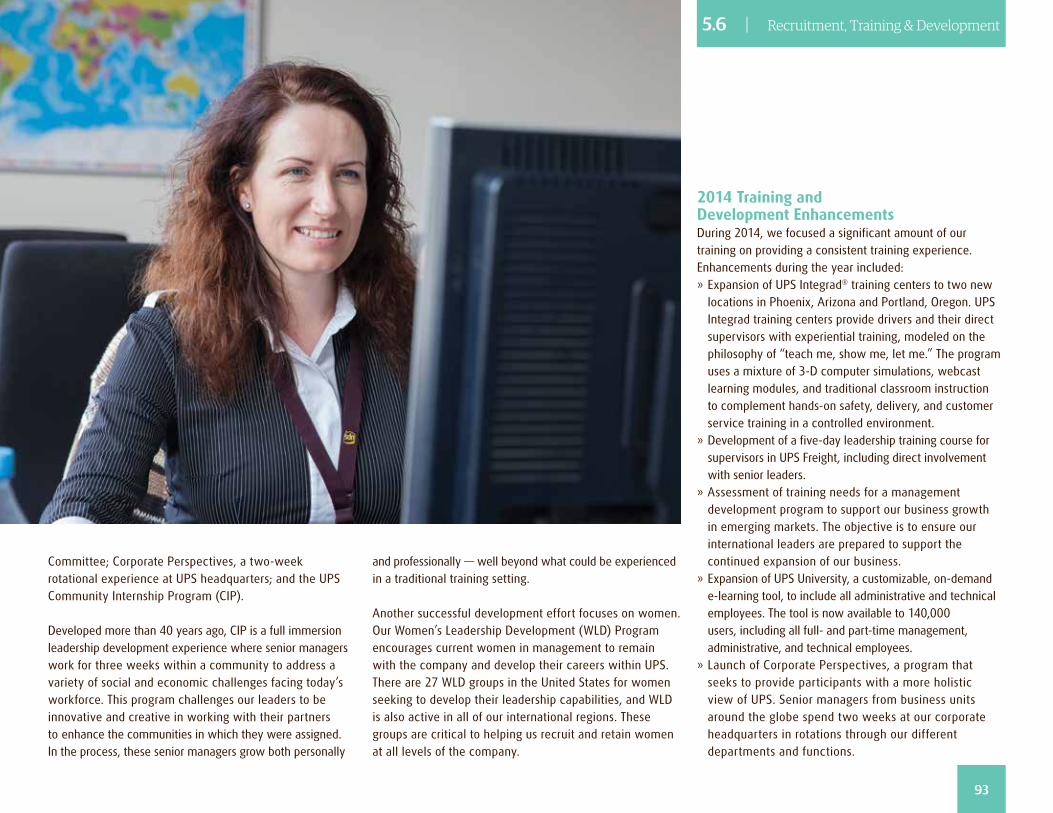
5.6 | Recruitment, Training & Development
Committee; Corporate Perspectives, a two-week rotational experience at UPS headquarters; and the UPS Community Internship Program (CIP).
Developed more than 40 years ago, CIP is a full immersion leadership development experience where senior managers work for three weeks within a community to address a variety of social and economic challenges facing today’s workforce. This program challenges our leaders to be innovative and creative in working with their partners to enhance the communities in which they were assigned. In the process, these senior managers grow both personally
and professionally — well beyond what could be experienced in a traditional training setting.
Another successful development effort focuses on women. Our Women’s Leadership Development (WLD) Program encourages current women in management to remain with the company and develop their careers within UPS. There are 27 WLD groups in the United States for women seeking to develop their leadership capabilities, and WLD is also active in all of our international regions. These groups are critical to helping us recruit and retain women at all levels of the company.
2014 Training and Development EnhancementsDuring 2014, we focused a significant amount of our training on providing a consistent training experience. Enhancements during the year included: » Expansion of UPS Integrad® training centers to two new locations in Phoenix, Arizona and Portland, Oregon. UPS Integrad training centers provide drivers and their direct supervisors with experiential training, modeled on the philosophy of “teach me, show me, let me.” The program uses a mixture of 3-D computer simulations, webcast learning modules, and traditional classroom instruction to complement hands-on safety, delivery, and customer service training in a controlled environment.
» Development of a five-day leadership training course for supervisors in UPS Freight, including direct involvement with senior leaders.
» Assessment of training needs for a management development program to support our business growth in emerging markets. The objective is to ensure our international leaders are prepared to support the continued expansion of our business.
» Expansion of UPS University, a customizable, on-demand e-learning tool, to include all administrative and technical employees. The tool is now available to 140,000 users, including all full- and part-time management, administrative, and technical employees.
» Launch of Corporate Perspectives, a program that seeks to provide participants with a more holistic view of UPS. Senior managers from business units around the globe spend two weeks at our corporate headquarters in rotations through our different departments and functions.
93

06Committed to More™
Ethical Conduct
94
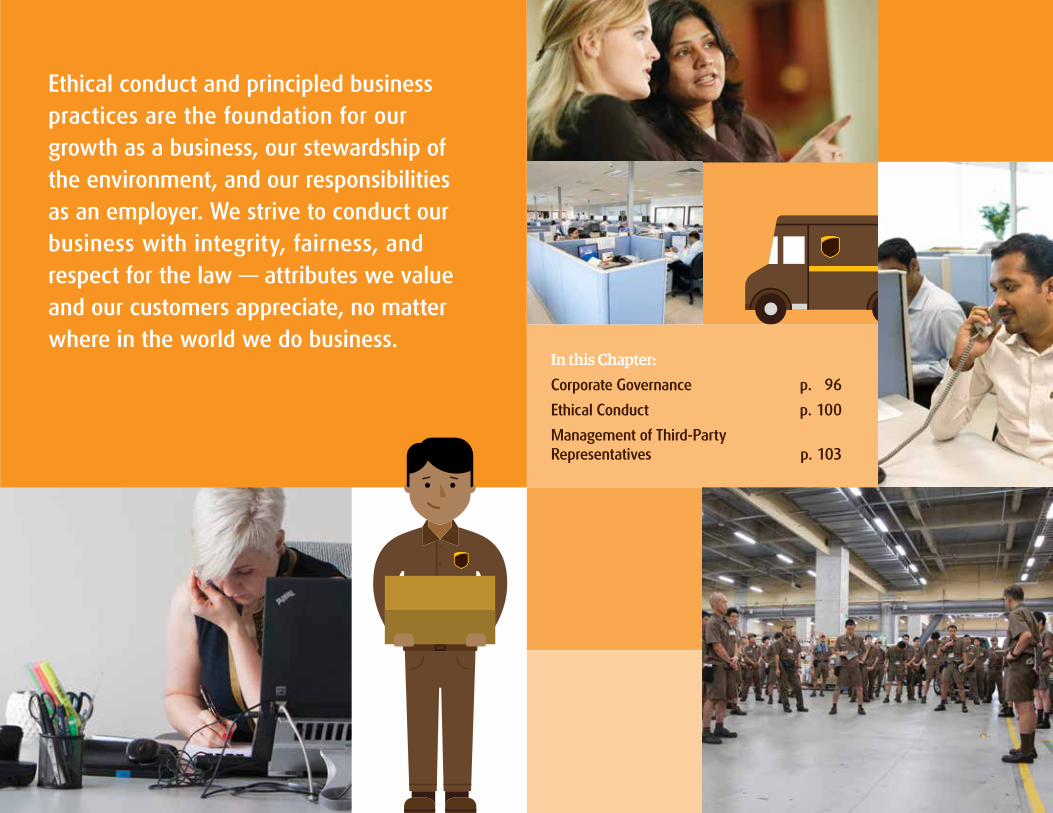
Ethical conduct and principled business practices are the foundation for our growth as a business, our stewardship of the environment, and our responsibilities as an employer. We strive to conduct our business with integrity, fairness, and respect for the law — attributes we value and our customers appreciate, no matter where in the world we do business.
In this Chapter:Corporate Governance p. 96
Ethical Conduct p. 100
Management of Third-Party Representatives p. 103
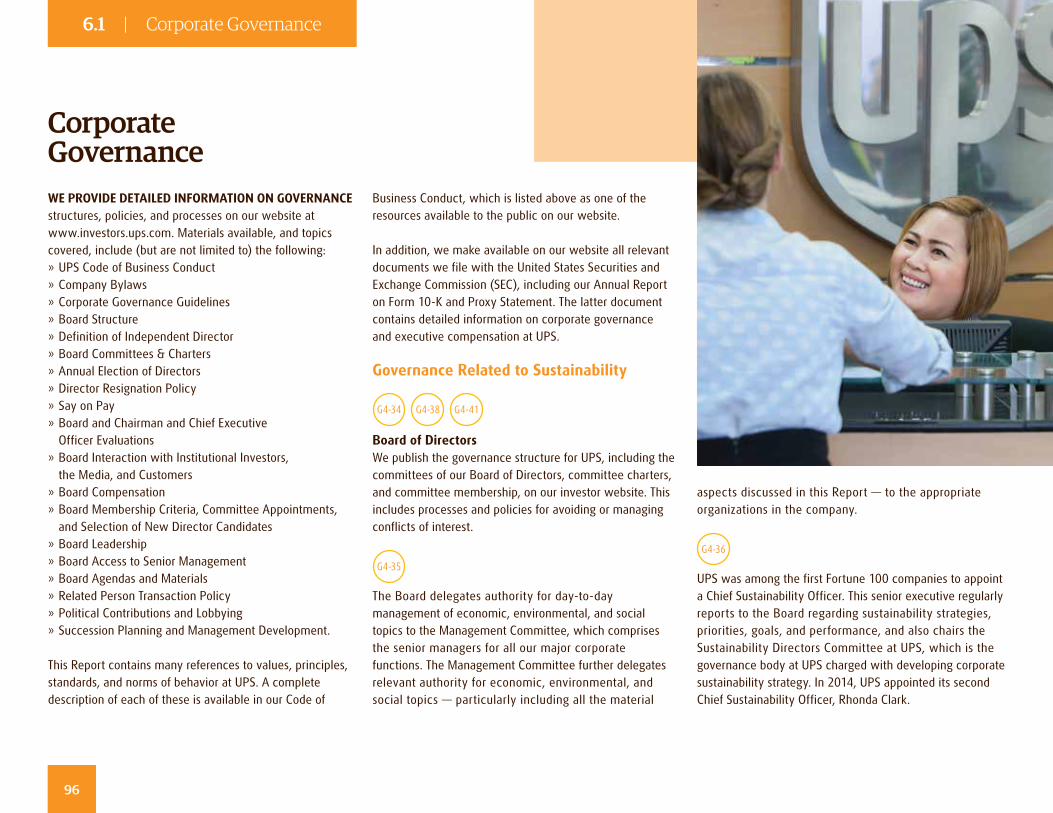
Corporate Governance
96
6.1 | Corporate Governance
96
WE PROVIDE DETAILED INFORMATION ON GOVERNANCE structures, policies, and processes on our website at www.investors.ups.com. Materials available, and topics covered, include (but are not limited to) the following: » UPS Code of Business Conduct » Company Bylaws » Corporate Governance Guidelines » Board Structure » Definition of Independent Director » Board Committees & Charters » Annual Election of Directors » Director Resignation Policy » Say on Pay » Board and Chairman and Chief Executive Officer Evaluations
» Board Interaction with Institutional Investors, the Media, and Customers
» Board Compensation » Board Membership Criteria, Committee Appointments, and Selection of New Director Candidates
» Board Leadership » Board Access to Senior Management » Board Agendas and Materials » Related Person Transaction Policy » Political Contributions and Lobbying » Succession Planning and Management Development.
This Report contains many references to values, principles, standards, and norms of behavior at UPS. A complete description of each of these is available in our Code of
Business Conduct, which is listed above as one of the resources available to the public on our website.
In addition, we make available on our website all relevant documents we file with the United States Securities and Exchange Commission (SEC), including our Annual Report on Form 10-K and Proxy Statement. The latter document contains detailed information on corporate governance and executive compensation at UPS.
Governance Related to Sustainability
G4-34 G4-38 G4-41
Board of Directors We publish the governance structure for UPS, including the committees of our Board of Directors, committee charters, and committee membership, on our investor website. This includes processes and policies for avoiding or managing conflicts of interest.
G4-35
The Board delegates authority for day-to-day management of economic, environmental, and social topics to the Management Committee, which comprises the senior managers for all our major corporate functions. The Management Committee further delegates relevant authority for economic, environmental, and social topics — particularly including all the material
aspects discussed in this Report — to the appropriate organizations in the company.
G4-36
UPS was among the first Fortune 100 companies to appoint a Chief Sustainability Officer. This senior executive regularly reports to the Board regarding sustainability strategies, priorities, goals, and performance, and also chairs the Sustainability Directors Committee at UPS, which is the governance body at UPS charged with developing corporate sustainability strategy. In 2014, UPS appointed its second Chief Sustainability Officer, Rhonda Clark.

97
6.1 | Corporate Governance
97
G4-37
Consultation between members of the Board of Directors and outside stakeholders occurs formally and informally throughout the year. Among the formal processes are reports to the Board by our Chief Sustainability Officer as described above. Stakeholders who wish to communicate directly with a member of our Board of Directors or with our nonmanagement directors as a group may do so by writing to UPS via our Corporate Secretary at:
UPS, c/o Corporate Secretary55 Glenlake Parkway, N.E., Atlanta, Georgia 30328
G4-39
In 2014, UPS separated the positions of CEO and Chairman, with the appointment of David Abney as Chief Executive Officer and former CEO D. Scott Davis as Non-Executive Chairman. We believe that having separated roles of Non-Executive Chairman and Chief Executive Officer, a board with a majority of independent directors who meet regularly in executive session, and independent chairs for the board’s Audit, Compensation, and Nominating and Corporate Governance Committees provide the best form of leadership for the company and our shareowners at this time. A complete discussion of our board leadership structure can be found in the 2015 Annual Proxy Statement Summary at www.ups.investors.com. All other UPS directors are independent and have no material relationships other than as a director with UPS or any of our subsidiaries.
G4-40
The Nominating and Corporate Governance Committee of the Board nominates directors based on their independence as well as their experience and expertise in a variety of areas, including economic, environmental, and social topics. In evaluating each candidate, the Committee considers factors such as personal character, values and disciplines, ethical standards, diversity, professional background, and skills. Shareholders may nominate director candidates in accordance with our bylaws. Director nominations are presented to our shareholders as part of our Annual Meeting process, which, because of the nature of UPS shareholding, means stakeholders with a broad range of views and interests are able to influence whether nominees become directors.
G4-42 G4-43 G4-45 G4-47G4-46 G4-48
With regard to economic, environmental, and social topics, the Board is in touch with stakeholder concerns through a number of processes. For example, the Board is regularly briefed on issues of concern for customers, unions, employees, retirees, and investors — among our largest and
most influential stakeholder constituencies. Members of the Board also review our Corporate Sustainability Report, which contains the results of our formal sustainability stakeholder engagement activities, such as our materiality assessment, as well as Stakeholder Statements from customers, philanthropic partners and nongovernmental organizations.
Our Board of Directors continually develops and enhances its knowledge of economic, environmental, and social impacts: » The Board of Directors reviews economic, environmental, and social impacts regularly at Board meetings and Board committee meetings.
» Our Chief Sustainability Officer (CSO) regularly reports to the Board regarding sustainability strategies, priorities, goals, and performance.
» The Board receives regular reports from other governance bodies at UPS.
» The Board oversees efforts by UPS management to develop, approve, and update our vision, values, strategies, policies, and goals related to economic, environmental, and social impacts.
Members of the Board also review our Corporate Sustainability Report.
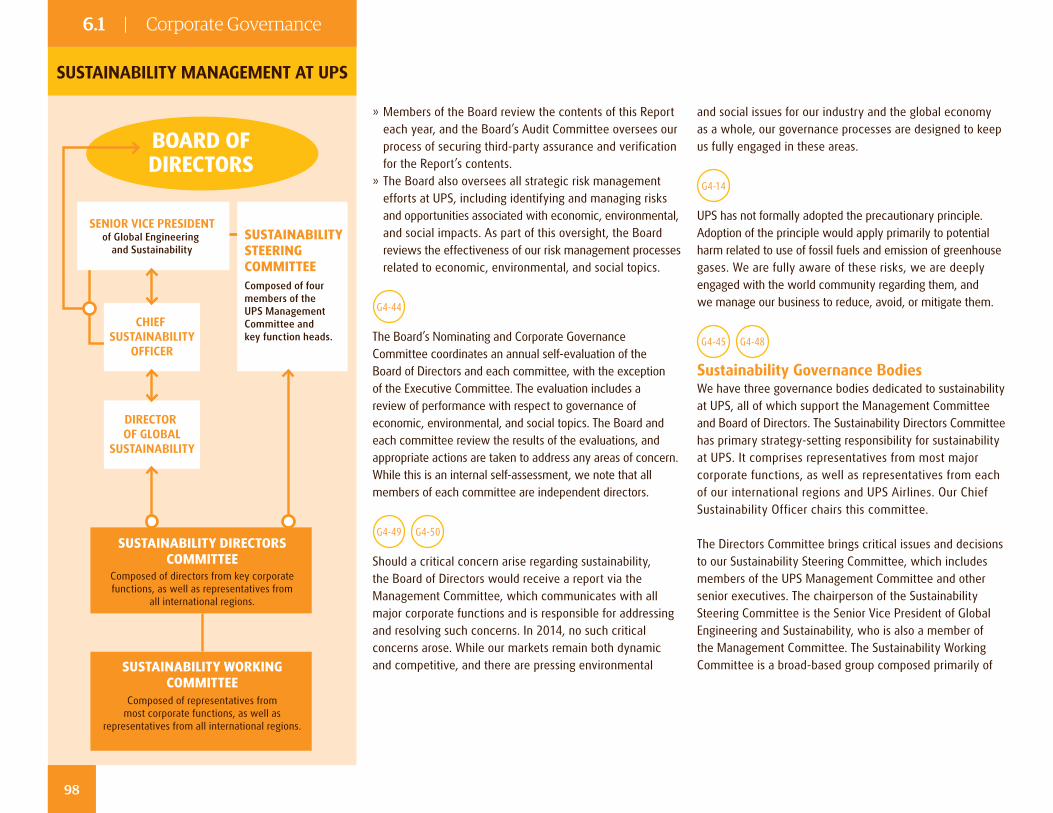
6.1 | Corporate Governance
» Members of the Board review the contents of this Report each year, and the Board’s Audit Committee oversees our process of securing third-party assurance and verification for the Report’s contents.
» The Board also oversees all strategic risk management efforts at UPS, including identifying and managing risks and opportunities associated with economic, environmental, and social impacts. As part of this oversight, the Board reviews the effectiveness of our risk management processes related to economic, environmental, and social topics.
G4-44
The Board’s Nominating and Corporate Governance Committee coordinates an annual self-evaluation of the Board of Directors and each committee, with the exception of the Executive Committee. The evaluation includes a review of performance with respect to governance of economic, environmental, and social topics. The Board and each committee review the results of the evaluations, and appropriate actions are taken to address any areas of concern. While this is an internal self-assessment, we note that all members of each committee are independent directors.
G4-49 G4-50
Should a critical concern arise regarding sustainability, the Board of Directors would receive a report via the Management Committee, which communicates with all major corporate functions and is responsible for addressing and resolving such concerns. In 2014, no such critical concerns arose. While our markets remain both dynamic and competitive, and there are pressing environmental
and social issues for our industry and the global economy as a whole, our governance processes are designed to keep us fully engaged in these areas.
G4-14
UPS has not formally adopted the precautionary principle. Adoption of the principle would apply primarily to potential harm related to use of fossil fuels and emission of greenhouse gases. We are fully aware of these risks, we are deeply engaged with the world community regarding them, and we manage our business to reduce, avoid, or mitigate them.
G4-45 G4-48
Sustainability Governance BodiesWe have three governance bodies dedicated to sustainability at UPS, all of which support the Management Committee and Board of Directors. The Sustainability Directors Committee has primary strategy-setting responsibility for sustainability at UPS. It comprises representatives from most major corporate functions, as well as representatives from each of our international regions and UPS Airlines. Our Chief Sustainability Officer chairs this committee.
The Directors Committee brings critical issues and decisions to our Sustainability Steering Committee, which includes members of the UPS Management Committee and other senior executives. The chairperson of the Sustainability Steering Committee is the Senior Vice President of Global Engineering and Sustainability, who is also a member of the Management Committee. The Sustainability Working Committee is a broad-based group composed primarily of
BOARD OFDIRECTORS
SUSTAINABILITY DIRECTORSCOMMITTEE
SUSTAINABILITY WORKINGCOMMITTEE
SUSTAINABILITY MANAGEMENT AT UPS
Composed of representatives from most corporate functions, as well as
representatives from all international regions.
Composed of directors from key corporate functions, as well as representatives from
all international regions.
SUSTAINABILITYSTEERINGCOMMITTEEComposed of fourmembers of the UPS ManagementCommittee and key function heads.
CHIEF SUSTAINABILITY
OFFICER
SENIOR VICE PRESIDENTof Global Engineering
and Sustainability
DIRECTOR OF GLOBAL
SUSTAINABILITY
98
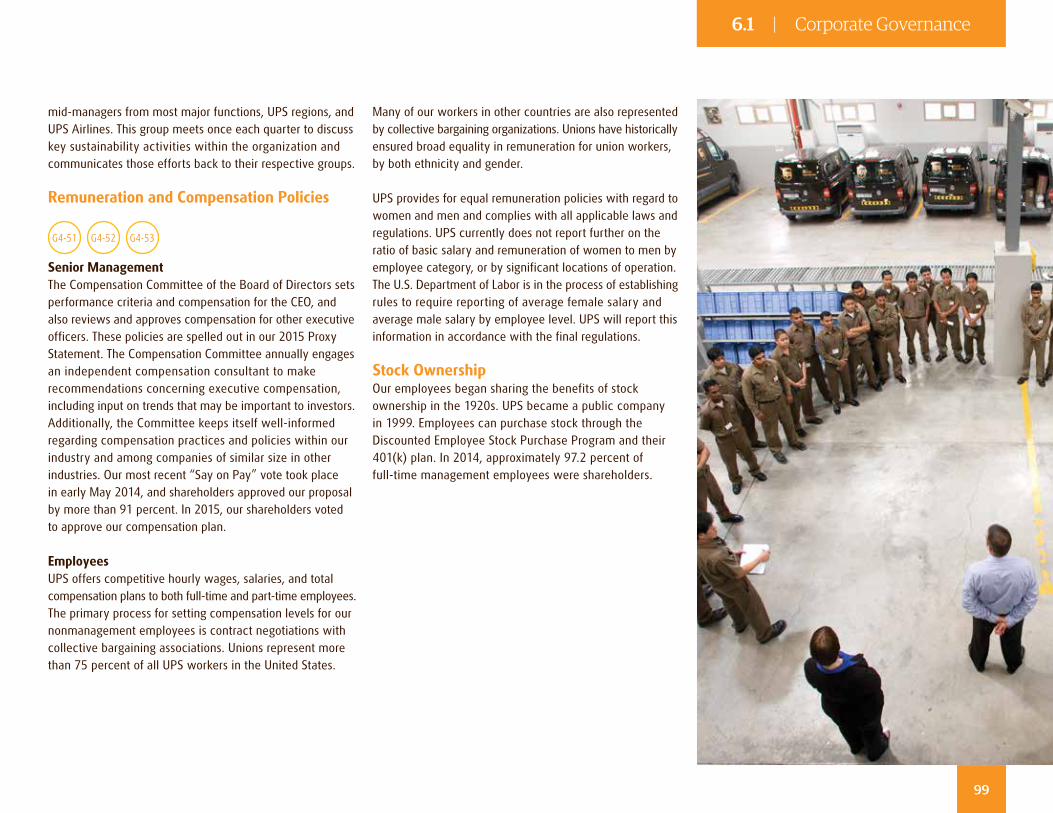
6.1 | Corporate Governance6.1 | Corporate Governance
99999999
mid-managers from most major functions, UPS regions, and UPS Airlines. This group meets once each quarter to discuss key sustainability activities within the organization and communicates those efforts back to their respective groups.
Remuneration and Compensation Policies
G4-51 G4-52 G4-53
Senior ManagementThe Compensation Committee of the Board of Directors sets performance criteria and compensation for the CEO, and also reviews and approves compensation for other executive officers. These policies are spelled out in our 2015 Proxy Statement. The Compensation Committee annually engages an independent compensation consultant to make recommendations concerning executive compensation, including input on trends that may be important to investors. Additionally, the Committee keeps itself well-informed regarding compensation practices and policies within our industry and among companies of similar size in other industries. Our most recent “Say on Pay” vote took place in early May 2014, and shareholders approved our proposal by more than 91 percent. In 2015, our shareholders voted to approve our compensation plan.
EmployeesUPS offers competitive hourly wages, salaries, and total compensation plans to both full-time and part-time employees. The primary process for setting compensation levels for our nonmanagement employees is contract negotiations with collective bargaining associations. Unions represent more than 75 percent of all UPS workers in the United States.
Many of our workers in other countries are also represented by collective bargaining organizations. Unions have historically ensured broad equality in remuneration for union workers, by both ethnicity and gender.
UPS provides for equal remuneration policies with regard to women and men and complies with all applicable laws and regulations. UPS currently does not report further on the ratio of basic salary and remuneration of women to men by employee category, or by significant locations of operation. The U.S. Department of Labor is in the process of establishing rules to require reporting of average female salary and average male salary by employee level. UPS will report this information in accordance with the final regulations.
Stock OwnershipOur employees began sharing the benefits of stock ownership in the 1920s. UPS became a public company in 1999. Employees can purchase stock through the Discounted Employee Stock Purchase Program and their 401(k) plan. In 2014, approximately 97.2 percent of full-time management employees were shareholders.
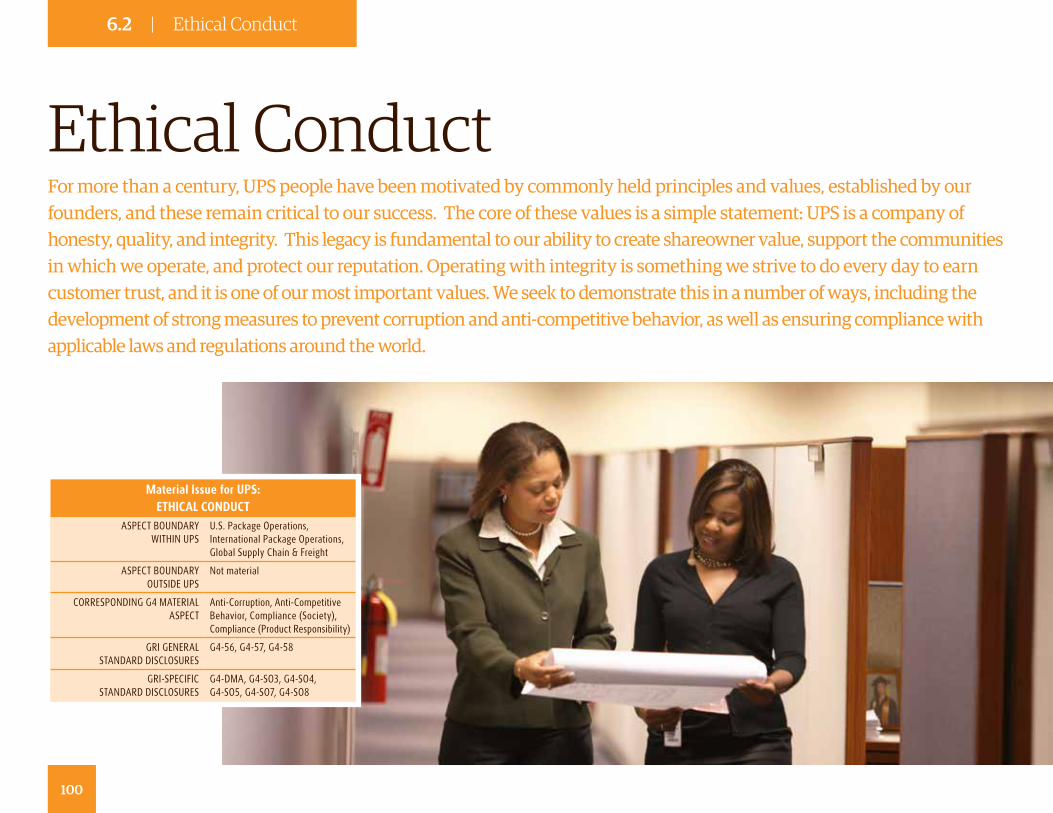
Material Issue for UPS: ETHICAL CONDUCT
ASPECT BOUNDARY WITHIN UPS
U.S. Package Operations, International Package Operations, Global Supply Chain & Freight
ASPECT BOUNDARY OUTSIDE UPS
Not material
CORRESPONDING G4 MATERIAL ASPECT
Anti-Corruption, Anti-Competitive Behavior, Compliance (Society), Compliance (Product Responsibility)
GRI GENERAL STANDARD DISCLOSURES
G4-56, G4-57, G4-58
GRI-SPECIFIC STANDARD DISCLOSURES
G4-DMA, G4-SO3, G4-SO4, G4-SO5, G4-SO7, G4-SO8
Ethical ConductFor more than a century, UPS people have been motivated by commonly held principles and values, established by our founders, and these remain critical to our success. The core of these values is a simple statement: UPS is a company of honesty, quality, and integrity. This legacy is fundamental to our ability to create shareowner value, support the communities in which we operate, and protect our reputation. Operating with integrity is something we strive to do every day to earn customer trust, and it is one of our most important values. We seek to demonstrate this in a number of ways, including the development of strong measures to prevent corruption and anti-competitive behavior, as well as ensuring compliance with applicable laws and regulations around the world.
100
6.2 | Ethical Conduct
Management Approach to Ethical Conduct
101
6.2 | Ethical Conduct
G4-56 G4- DMA
G4- SO4
OUR MANAGEMENT APPROACH TO ETHICAL CONDUCT and Management of Third-Party Representatives is to adhere to our corporate governance structures, policies, and processes. The most senior UPS executives and governing bodies secure a tone of Anti-Corruption compliance from the top. They not only receive communications about the well-established UPS Anti-Corruption policies, but they also remain apprised of various aspects of the Anti-Corruption Program. UPS executives and governing bodies receive reviews of relevant Enterprise Risk Management profiles, UPS’s management of third-party representatives, audits, self- audits, and other reporting, monitoring, and investigative programs as appropriate. Members of the UPS Management Committee received Anti-Corruption training through our Business Conduct and Compliance Program.
The UPS Code of Business Conduct sets out the behavior we expect from our employees, the processes available to them for raising concerns about ethical conduct, and the channels we use to respond. Because we operate globally, the Code is available in 17 languages so that our employees, agents, and third-party representatives in other countries can fully understand our guiding principles. Many employees also participate in training related to our Business Conduct and Compliance Program, including all management and specialist employees, as well as administrative and technical employees in certain functions with elevated risk.
New refresher courses are delivered biannually, and job-specific courses are provided to employees in certain jobs and functions, using a risk-based approach to identifying the most appropriate audiences.
As of the end of 2014, 113,063 employees have completed compliance training, representing 89 percent of the identified audience. Our 2015 goal is to move this completion rate to at least 95 percent.
G4- SO7
Anti-Corruption and Anti-Competitive BehaviorUPS’s policy is to comply with all applicable laws, rules, and regulations in all countries where we operate. Nevertheless, we are sometimes involved in lawsuits that arise in the normal course of business. The UPS Code of Business Conduct includes policies and procedures that prohibit UPS employees, and the people acting on our behalf, from engaging in anti-competitive behavior, as well as unlawful activities, including violations of the U.S. Foreign Corrupt Practices Act, the U.K. Bribery Act, and other applicable anti-bribery laws, rules, and regulations in countries where we operate. We are not aware of any allegations of corruption from any government agency in the world with oversight of this issue. In our filings with the SEC, we publicly disclose information about judicial proceedings, including actions involving competition law.
G4- SO5
ComplianceAt UPS, we are committed to operating responsibly because it is the right thing to do. We recognize our ethical business practices can be a competitive advantage, enabling us to: » Take strong, proven compliance practices and core values with us when we enter new markets
» Identify suppliers that align with our own approach to compliance
» Successfully identify, acquire, and integrate businesses that fit into our culture of integrity.
Global Compliance ProcessUPS invests significant resources in its Compliance & Ethics programs, inclusive of Anti-Corruption, Antitrust, Trade Restrictions, and other risk areas. We conduct an appropriate level of due diligence before entering into new business relationships, and we regularly review the work of our third-party representatives as a further check against compliance risks.
We have developed a multi-step process to ensure measurable compliance effectiveness in all our international package, freight, and distribution business entities, and we actively implement it. Our global compliance team facilitates the process for employees in our operating units.
The process starts with identifying and taking ownership of risks and then documenting processes and procedures to address those risks. Our compliance team then creates training programs and works with business unit managers to implement the processes, procedures, and training programs. The global compliance team continually monitors data streams and other information sources that our compliance processes and procedures generate. The focus
102
6.2 | Ethical Conduct
of this monitoring is to audit and improve our compliance systems and behavior both locally and internationally.
In 2014, we increased our focus on compliance and ethics communications to employees around the world through monthly intranet articles, quarterly magazines, and other internal communication channels. In particular, these communications emphasized positive reinforcement as a model behavior to encourage ethical conduct and compliance. We also implemented Business Risk and Compliance Committees (BRCC) in all international regions and most districts, to help coordinate risk and compliance matters throughout UPS operations.
Risk Analysis and TrainingAll managers and select non-managers of UPS receive initial training on compliance matters. We regularly review the UPS Code of Business Conduct with these employees, and we conduct comprehensive training on ethics and compliance every two years with a goal of training 100 percent of full-time managers and specialists, as well as administrative and technical employees in certain high-risk functions. In addition to this training, we analyze our business units for compliance risks. One of our primary tools is our Business Compliance and Ethics Questionnaire, which we use to survey managers, supervisors, and specialists each year to identify events, situations, or relationships that could pose ethical or legal risks. Approximately 50,000 full-time management and specialists (100 percent of identified audience) completed the Business Compliance and Ethics Questionnaire in 2014.
G4- SO3
Along with the training activities described above, we conduct systematic risk assessments relying on multiple internal and external factors to determine which UPS sites should be audited in any given year. We then audit
methodically for evidence of fraud and corruption. We audit in dozens of countries every year. As part of our audit process, we also pay particular attention to significant changes in a UPS business entity or its regulatory environment that could increase the risk of unethical practices or inadequate controls. In 2014, our risk assessment covered 221 countries and territories. We conducted 38 audits that included corruption testing, and 15 corruption-specific audits. These audits included businesses with which we have both direct and third-party relationships. We currently do not report audit activity as a percent of operations.
The information we generate through these activities goes to our senior management, up to and including the Management Committee, for prompt review and response. For 2014, organizational responsibility for our business conduct and compliance policies rests with Teri Plummer McClure, our Chief Legal Officer and Senior Vice President, Human Resources, along with the Nominating and Corporate Governance Committee of the Board of Directors. Additionally, the UPS Audit Committee is responsible for overseeing the company’s compliance obligations related to auditing (both financial and operational), accounting, and financial reporting.
G4- SO8
Compliance Challenges and Actions TakenA compliance challenge that we continued to address in 2014 was preventing the use of our shipping services by illicit online pharmacies. In March 2013, UPS forfeited US$40 million from such online pharmacies and entered into a Non-Prosecution Agreement with the United States Attorney’s Office (Northern District of California) that included a new Online Pharmacy Compliance Program (OPCP) aimed at preventing online pharmacies from
using our services illegally. For a full description of legal proceedings in which UPS is engaged, please see Note 8 of our 2014 10-K filed with the SEC.
G4-57 G4-58
Raising ConcernsAt UPS, we are encouraged to raise concerns about compliance, ethics, or business conduct with our direct supervisor. Our policy is that employees will not face retaliation if we report in good faith about a violation or suspected violation of UPS’s legal, ethical, or policy obligations. We can also contact any other manager or the Human Resources representative for our respective department.
Employees may also submit an anonymous report to the upshelpline.com or call a telephone “Help Line.” Both these channels are monitored by an independent service provider and are available 24 hours a day, 7 days a week. Translators are available to assist when needed. During 2014, we increased our use of data analytics to monitor Help Line trends.
In 2014, UPS received 7,066 reports of employee concerns through the Help Line. This number increased by 6 percent from 2013 due primarily to increased employee communication about ethics and compliance issues. UPS investigated all cases and took corrective or disciplinary action as appropriate to address each substantiated concern.
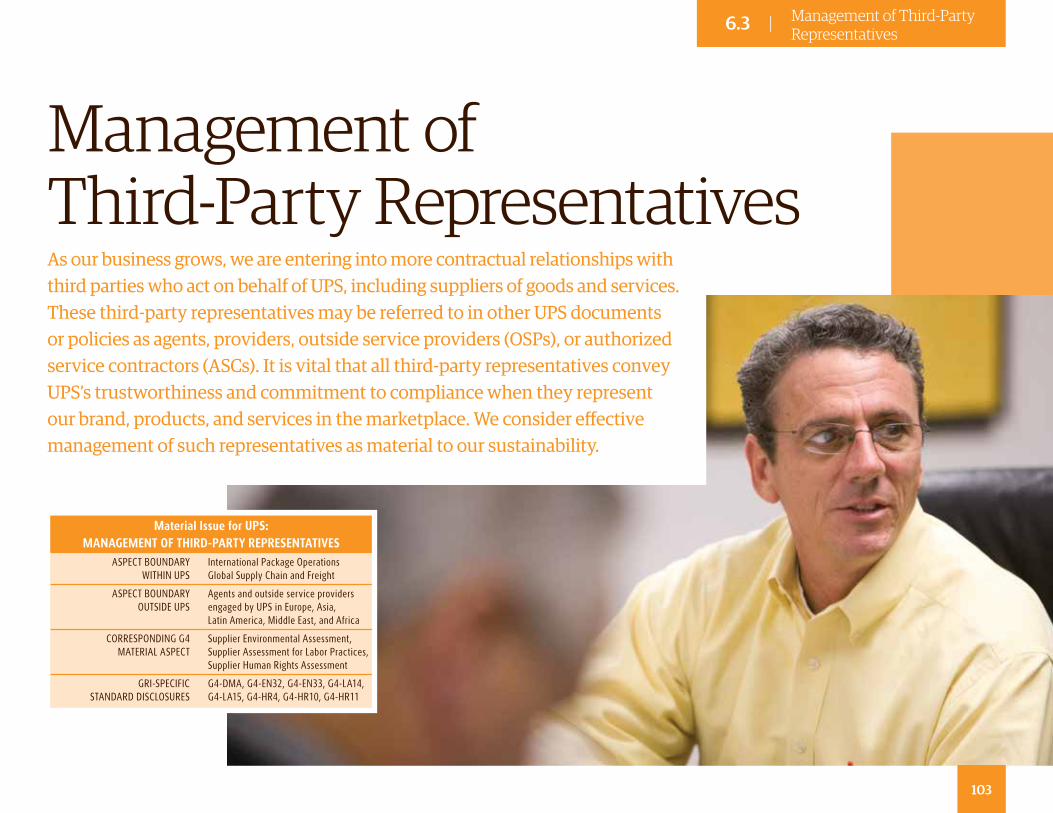
Management of Third-Party Representatives
Material Issue for UPS: MANAGEMENT OF THIRD-PARTY REPRESENTATIVES
ASPECT BOUNDARY WITHIN UPS
International Package Operations Global Supply Chain and Freight
ASPECT BOUNDARY OUTSIDE UPS
Agents and outside service providers engaged by UPS in Europe, Asia, Latin America, Middle East, and Africa
CORRESPONDING G4 MATERIAL ASPECT
Supplier Environmental Assessment, Supplier Assessment for Labor Practices, Supplier Human Rights Assessment
GRI-SPECIFIC STANDARD DISCLOSURES
G4-DMA, G4-EN32, G4-EN33, G4-LA14, G4-LA15, G4-HR4, G4-HR10, G4-HR11
103
6.3 | Management of Third-Party Representatives
As our business grows, we are entering into more contractual relationships with third parties who act on behalf of UPS, including suppliers of goods and services. These third-party representatives may be referred to in other UPS documents or policies as agents, providers, outside service providers (OSPs), or authorized service contractors (ASCs). It is vital that all third-party representatives convey UPS’s trustworthiness and commitment to compliance when they represent our brand, products, and services in the marketplace. We consider effective management of such representatives as material to our sustainability.
WE REQUIRE ALL SUPPLIERS TO COMPLY WITH RELEVANT portions of the UPS Code of Business Conduct. To make the requirements clear for third-party representatives, we have issued an Anti-Corruption Compliance Manual for Third-Party Representatives. This manual, available in 19 languages, helps them better understand our expectations and requirements, including the need to report actual or suspected compliance violations. As part of our risk and compliance review and audit process, we have numerous mechanisms in place to evaluate the contractual performance of third-party representatives.
G4-EN32
G4-EN33
G4-LA14
G4-LA15
G4- HR4
G4-HR10
G4-HR11
G4- DMA
Supplier EngagementOur relationships with all our suppliers are governed by the UPS Code of Business Conduct, which applies to all UPS entities globally, including UPS’s third-party representatives such as suppliers, vendors, consultants, and service contractors. We direct suppliers to the Code as part of the Supplier’s Principles Agreement we provide during the proposal process, and they must certify they have read the Code and are aware that compliance with the Code is both expected and subject to audit. We also reference UPS’s Statement of Environmental Sustainability in requests for proposals, to provide general awareness, and set expectations for suppliers. We consider our supply chain relatively low-risk to UPS regarding negative impacts related to the environment, labor practices, and human rights. Nevertheless, during our assessment of potential suppliers, we survey the market and analyze supplier risks, including those related to economic, environmental, and
Management of Third-Party Representatives
social issues, if deemed necessary. For example, social risks may arise in countries where employment laws and customs vary significantly from what is considered the norm in the United States and other developed countries. In such cases, we use language in contracts and supplier audits that addresses social responsibility. We consider risks related to these factors to apply only to a small number of our suppliers.
Collaboration is also a vital component of our approach to supplier management. We work with many governmental and nongovernmental organizations, as well as with our suppliers, to understand and improve sustainability in our supply chain. One important example of this collaboration is the EPA SmartWay program. UPS participates in this program, and we strongly encourage our purchased transportation suppliers to participate as well. As we continue to formally integrate sustainability into our procurement processes, we anticipate that we will make corresponding evaluations of and adjustments to our supplier selection process.
As discussed above, we consider risks related to environmental, social, or labor issues to apply only to a small number of our suppliers. We do not currently report specific numbers
or percentages related to screening or impact assessments, because we consider the information confidential. However, in 2014, we were not aware of any significant environmental, social, or labor issues related to these suppliers.
G4- SO4
Reviews of Third-Party RepresentativesWe take special care when selecting third-party representatives that may interact with government officials or other outside parties on behalf of UPS. We deploy an enhanced third-party due diligence (“3PDD”) process, which defines how we perform mandatory vetting of agents, vendors, and suppliers working in industry sectors or countries associated with higher risk. The enhanced 3PDD process requires us to assess candidates’ ownership, financial transparency, local licensure status, compliance record, labor practices, environmental practices, and more. This information is then recorded in a global electronic database to enable more effective ongoing monitoring and auditing of these third-party relationships. The process is mandatory for all in-scope vendors. In 2014, 1,600 companies went through this screening process.
104
6.3 | Management of Third-Party Representatives
Appendix
105105
Appendix A
GRI G4 Content IndexWe provide a complete GRI G4 content index in Appendix F, beginning on page 125.
GRI IndicatorsDisclosures on GRI indicators are marked inside gold circles near the titles of chapters and their subsections. These support transparent and comparable disclosures about sustainability within and across industries.
External Assurance ReportsGRI recommends the use of external assurance, but it is not a requirement to be in accordance with the Guidelines. We conduct a strong assurance program that includes the following external assurance reports:
» Deloitte & Touche LLP provides a review report on this Corporate Sustainability Report. Their external assurance statement is on page 107.
» Deloitte & Touche LLP provides an examination report on our global Statement of Greenhouse Gas Emissions. Their external assurance statement is included in Appendix B, on page 118.
» Société Généralede Surveillance (SGS) verifies our global Statement of Greenhouse Gas Emissions. Their external verification statement is included in Appendix C, on pages 119-120.
G4-33
Third-Party Assurance and VerificationWe believe external assurance is vital to the credibility and transparency of sustainability reporting and performance for all companies, because it promotes the broader cause of sustainability. We therefore engage with experienced and respected third parties to assure and verify our sustainability reporting. Authorization for these engagements, and approval of the providers we select,
comes from the Audit Committee of our Board of Directors, which is our highest governance body. The assurance providers we engage with are independent organizations that offer objective analysis and conclusions, free from outside influence.
For this Report, we engaged Deloitte & Touche LLP to conduct an examination, in accordance with attestation standards established by the American Institute of Certified Public Accountants, which includes AT Section 101, Attest Engagements, to provide a reasonable level of assurance on our Statement of Greenhouse Gas Emissions for the years ended December 31, 2013 and 2014.
We also engaged Deloitte & Touche LLP to conduct a review, in accordance with attestation standards established by the American Institute of Certified Public Accountants, which includes AT Section 101, Attest Engagements, to provide a limited level of assurance on our 2014 Corporate Sustainability Report. Deloitte & Touche LLP’s assurance reports are on pages 107 and 118 respectively.
We engaged SGS to conduct verification, in accordance with ISO 14064-3, to provide a reasonable level of assurance on our Statement of Greenhouse Gas Emissions for the year ended December 31, 2014. The resulting verification statement is on pages 119-120.
G4-31
Contact UsPlease send comments or questions about this Report to [email protected], or in writing to:
UPSAttention: Sustainability Report Editor 55 Glenlake Parkway N.E.Atlanta, Georgia 30328
About this Report
G4-28 G4-29 G4-30
Reporting PeriodThe report presents data for 2014 and comparable periods. We issue our Corporate Sustainability Report on an annual basis, including our previous Report focused on 2013. For Key Performance Indicators (KPIs), we present figures for up to four years (see pages 8-9).
G4-32
GRI ContentG4 ComprehensiveThe Report is organized and presented in accordance with the G4 framework established by the Global Reporting Initiative (GRI).
The G4 framework includes two options for reporting in accordance: “Core” and “Comprehensive.” This Report is ‘in accordance’ with the option Comprehensive of the GRI G4 Guidelines. We also present significant amounts of additional information not specified by GRI, such as statements contributed by outside stakeholders and graphics that illustrate various aspects of our business. UPS has voluntarily followed GRI reporting guidelines since 2003.
GRI G4 Content Index Service The GRI-G4 Content Index Service is GRI’s most comprehensive service for reports based on the G4 Sustainability Reporting Guidelines as it includes all of the disclosures from the GRI G4 Content Index. The Service emphasizes the importance of the accuracy and usability of the GRI Content Index. This Report has completed the Context Index Service successfully.
106
Independent Accountants’ Review Report
Appendix A
Board of Directors, Shareowners, and Stakeholders United Parcel Service, Inc. Atlanta, Georgia
We have reviewed the accompanying 2014 Corporate Sustainability Report of United Parcel Service, Inc. (the “Company”) for the year ended December 31, 2014. The Company’s management is responsible for the Corporate Sustainability Report.
We conducted our review in accordance with attestation standards established by the American Institute of Certified Public Accountants. A review consists principally of applying analytical procedures, considering management assumptions, methods, and findings, and making inquiries of and evaluating responses from persons responsible for corporate sustainability and operational matters. It is substantially less in scope than an examination, the objective of which is the expression of an opinion on the Corporate Sustainability Report. Accordingly, we do not express such an opinion. A review of the Corporate Sustainability Report is not intended to provide assurance on the entity’s compliance with laws or regulations.
The preparation of the Corporate Sustainability Report requires management to interpret the criteria, make determinations as to the relevancy of information to be included, and make estimates and assumptions that affect reported information. The selection of different but acceptable measurement techniques can result in materially different measurements. Different entities may make different but acceptable interpretations and determinations. The Corporate Sustainability Report includes information regarding the Company’s corporate sustainability initiatives and targets, the estimated future impact of events that have occurred or are expected
to occur, commitments, and uncertainties. Actual results in the future may differ materially from management’s present assessment of this information because events and circumstances frequently do not occur as expected.
Based on our review, nothing came to our attention that caused us to believe that the Corporate Sustainability Report does not include, in all material respects, the required elements of the Global Reporting Initiative G4 Sustainability Reporting Framework under its ‘in accordance’ Comprehensive option; that the 2010-2014 data and the 2007 Transportation Index baseline data included therein have not been accurately derived, in all material respects, from the Company’s records, or that the underlying information, determinations, estimates, and assumptions of the Company do not provide a reasonable basis for the disclosures contained therein.
The comparative disclosures for periods prior to 2009, other than the 2007 Transportation Intensity Index baseline, were not reviewed by us and, accordingly, we do not express any form of assurance on them.
Stamford, ConnecticutJune 29, 2015
107
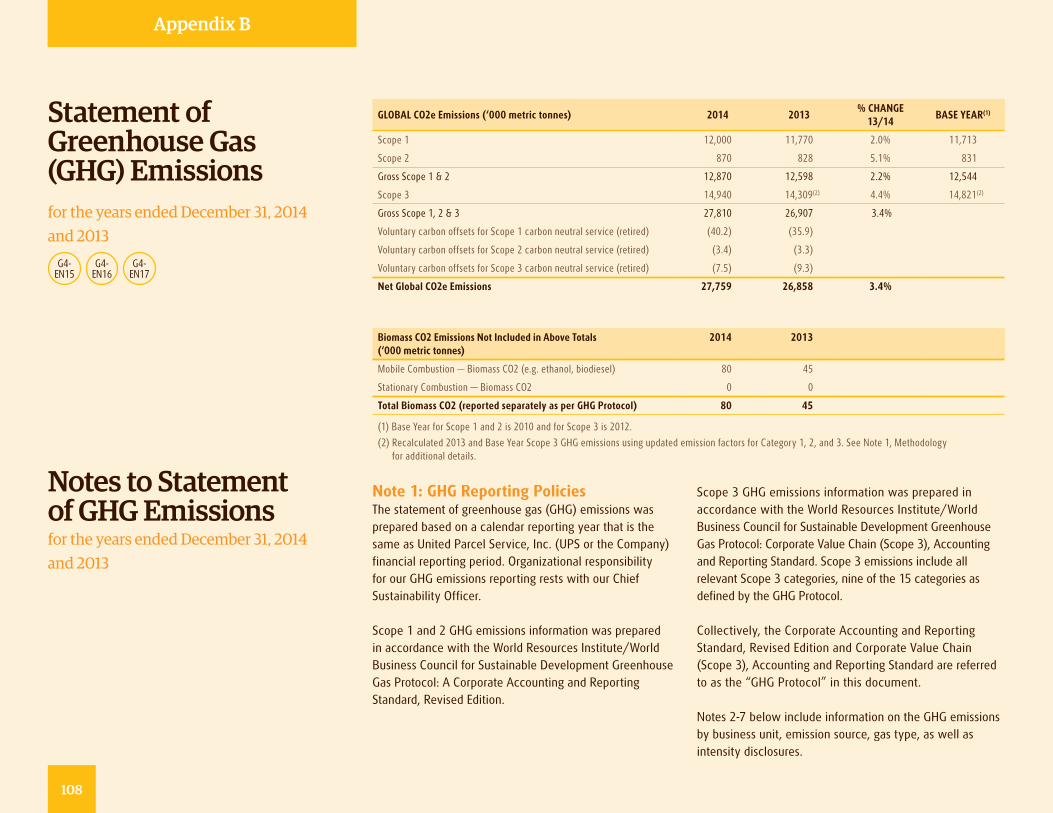
GLOBAL CO2e Emissions (‘000 metric tonnes) 2014 2013% CHANGE
13/14BASE YEAR(1)
Scope 1 12,000 11,770 2.0% 11,713
Scope 2 870 828 5.1% 831
Gross Scope 1 & 2 12,870 12,598 2.2% 12,544
Scope 3 14,940 14,309(2) 4.4% 14,821(2)
Gross Scope 1, 2 & 3 27,810 26,907 3.4%
Voluntary carbon offsets for Scope 1 carbon neutral service (retired) (40.2) (35.9)
Voluntary carbon offsets for Scope 2 carbon neutral service (retired) (3.4) (3.3)
Voluntary carbon offsets for Scope 3 carbon neutral service (retired) (7.5) (9.3)
Net Global CO2e Emissions 27,759 26,858 3.4%
Biomass CO2 Emissions Not Included in Above Totals (‘000 metric tonnes)
2014 2013
Mobile Combustion — Biomass CO2 (e.g. ethanol, biodiesel) 80 45
Stationary Combustion — Biomass CO2 0 0
Total Biomass CO2 (reported separately as per GHG Protocol) 80 45
(1) Base Year for Scope 1 and 2 is 2010 and for Scope 3 is 2012.
(2) Recalculated 2013 and Base Year Scope 3 GHG emissions using updated emission factors for Category 1, 2, and 3. See Note 1, Methodology for additional details.
Statement of Greenhouse Gas (GHG) Emissions for the years ended December 31, 2014 and 2013
Note 1: GHG Reporting PoliciesThe statement of greenhouse gas (GHG) emissions was prepared based on a calendar reporting year that is the same as United Parcel Service, Inc. (UPS or the Company) financial reporting period. Organizational responsibility for our GHG emissions reporting rests with our Chief Sustainability Officer.
Scope 1 and 2 GHG emissions information was prepared in accordance with the World Resources Institute/World Business Council for Sustainable Development Greenhouse Gas Protocol: A Corporate Accounting and Reporting Standard, Revised Edition.
Scope 3 GHG emissions information was prepared in accordance with the World Resources Institute/World Business Council for Sustainable Development Greenhouse Gas Protocol: Corporate Value Chain (Scope 3), Accounting and Reporting Standard. Scope 3 emissions include all relevant Scope 3 categories, nine of the 15 categories as defined by the GHG Protocol.
Collectively, the Corporate Accounting and Reporting Standard, Revised Edition and Corporate Value Chain (Scope 3), Accounting and Reporting Standard are referred to as the “GHG Protocol” in this document.
Notes 2-7 below include information on the GHG emissions by business unit, emission source, gas type, as well as intensity disclosures.
Notes to Statement of GHG Emissionsfor the years ended December 31, 2014 and 2013
G4-EN15
G4-EN16
G4-EN17
Appendix B
108
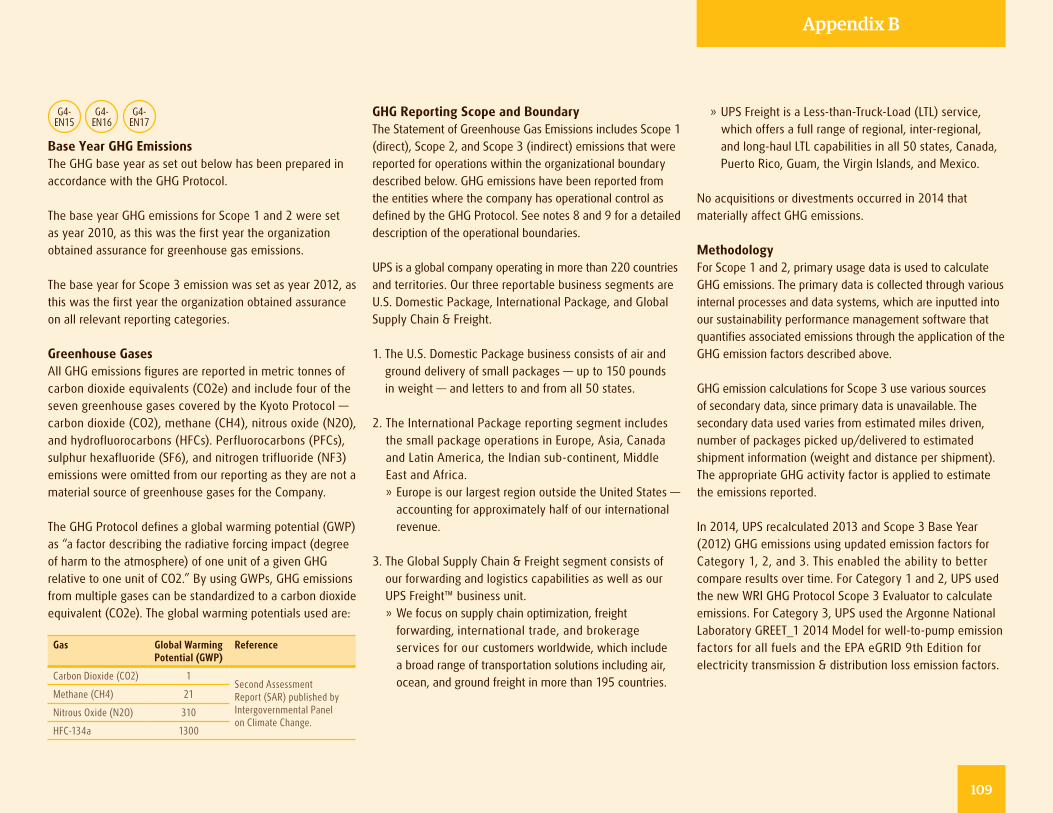
GHG Reporting Scope and BoundaryThe Statement of Greenhouse Gas Emissions includes Scope 1 (direct), Scope 2, and Scope 3 (indirect) emissions that were reported for operations within the organizational boundary described below. GHG emissions have been reported from the entities where the company has operational control as defined by the GHG Protocol. See notes 8 and 9 for a detailed description of the operational boundaries.
UPS is a global company operating in more than 220 countries and territories. Our three reportable business segments are U.S. Domestic Package, International Package, and Global Supply Chain & Freight.
1. The U.S. Domestic Package business consists of air and ground delivery of small packages — up to 150 pounds in weight — and letters to and from all 50 states.
2. The International Package reporting segment includes the small package operations in Europe, Asia, Canada and Latin America, the Indian sub-continent, Middle East and Africa. » Europe is our largest region outside the United States — accounting for approximately half of our international revenue.
3. The Global Supply Chain & Freight segment consists of our forwarding and logistics capabilities as well as our UPS Freight™ business unit. » We focus on supply chain optimization, freight forwarding, international trade, and brokerage services for our customers worldwide, which include a broad range of transportation solutions including air, ocean, and ground freight in more than 195 countries.
G4-EN15
G4-EN16
G4-EN17
Base Year GHG EmissionsThe GHG base year as set out below has been prepared in accordance with the GHG Protocol.
The base year GHG emissions for Scope 1 and 2 were set as year 2010, as this was the first year the organization obtained assurance for greenhouse gas emissions.
The base year for Scope 3 emission was set as year 2012, as this was the first year the organization obtained assurance on all relevant reporting categories.
Greenhouse GasesAll GHG emissions figures are reported in metric tonnes of carbon dioxide equivalents (CO2e) and include four of the seven greenhouse gases covered by the Kyoto Protocol — carbon dioxide (CO2), methane (CH4), nitrous oxide (N2O), and hydrofluorocarbons (HFCs). Perfluorocarbons (PFCs), sulphur hexafluoride (SF6), and nitrogen trifluoride (NF3) emissions were omitted from our reporting as they are not a material source of greenhouse gases for the Company.
The GHG Protocol defines a global warming potential (GWP) as “a factor describing the radiative forcing impact (degree of harm to the atmosphere) of one unit of a given GHG relative to one unit of CO2.” By using GWPs, GHG emissions from multiple gases can be standardized to a carbon dioxide equivalent (CO2e). The global warming potentials used are:
Gas Global Warming Potential (GWP)
Reference
Carbon Dioxide (CO2) 1Second Assessment Report (SAR) published by Intergovernmental Panel on Climate Change.
Methane (CH4) 21
Nitrous Oxide (N2O) 310
HFC-134a 1300
» UPS Freight is a Less-than-Truck-Load (LTL) service, which offers a full range of regional, inter-regional, and long-haul LTL capabilities in all 50 states, Canada, Puerto Rico, Guam, the Virgin Islands, and Mexico.
No acquisitions or divestments occurred in 2014 that materially affect GHG emissions.
MethodologyFor Scope 1 and 2, primary usage data is used to calculate GHG emissions. The primary data is collected through various internal processes and data systems, which are inputted into our sustainability performance management software that quantifies associated emissions through the application of the GHG emission factors described above.
GHG emission calculations for Scope 3 use various sources of secondary data, since primary data is unavailable. The secondary data used varies from estimated miles driven, number of packages picked up/delivered to estimated shipment information (weight and distance per shipment). The appropriate GHG activity factor is applied to estimate the emissions reported.
In 2014, UPS recalculated 2013 and Scope 3 Base Year (2012) GHG emissions using updated emission factors for Category 1, 2, and 3. This enabled the ability to better compare results over time. For Category 1 and 2, UPS used the new WRI GHG Protocol Scope 3 Evaluator to calculate emissions. For Category 3, UPS used the Argonne National Laboratory GREET_1 2014 Model for well-to-pump emission factors for all fuels and the EPA eGRID 9th Edition for electricity transmission & distribution loss emission factors.
Appendix B
109
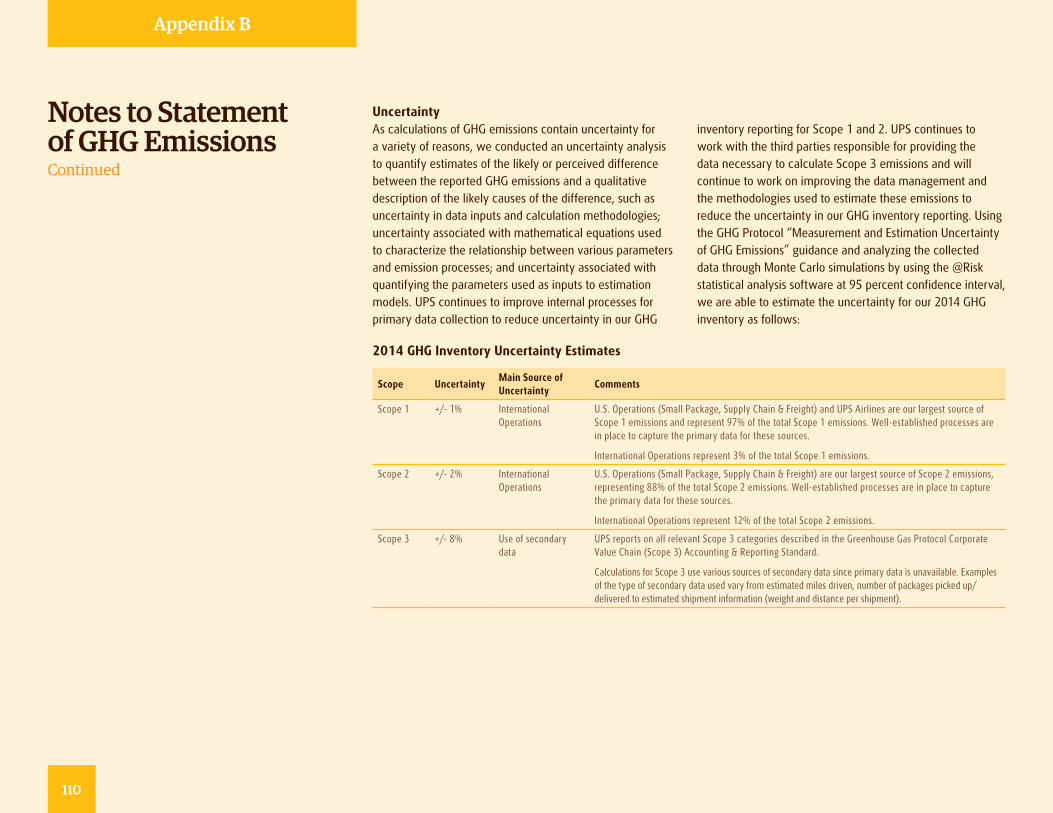
Scope UncertaintyMain Source of Uncertainty
Comments
Scope 1 +/- 1% International Operations
U.S. Operations (Small Package, Supply Chain & Freight) and UPS Airlines are our largest source of Scope 1 emissions and represent 97% of the total Scope 1 emissions. Well-established processes are in place to capture the primary data for these sources.
International Operations represent 3% of the total Scope 1 emissions.
Scope 2 +/- 2% International Operations
U.S. Operations (Small Package, Supply Chain & Freight) are our largest source of Scope 2 emissions, representing 88% of the total Scope 2 emissions. Well-established processes are in place to capture the primary data for these sources.
International Operations represent 12% of the total Scope 2 emissions.
Scope 3 +/- 8% Use of secondary data
UPS reports on all relevant Scope 3 categories described in the Greenhouse Gas Protocol Corporate Value Chain (Scope 3) Accounting & Reporting Standard.
Calculations for Scope 3 use various sources of secondary data since primary data is unavailable. Examples of the type of secondary data used vary from estimated miles driven, number of packages picked up/delivered to estimated shipment information (weight and distance per shipment).
UncertaintyAs calculations of GHG emissions contain uncertainty for a variety of reasons, we conducted an uncertainty analysis to quantify estimates of the likely or perceived difference between the reported GHG emissions and a qualitative description of the likely causes of the difference, such as uncertainty in data inputs and calculation methodologies; uncertainty associated with mathematical equations used to characterize the relationship between various parameters and emission processes; and uncertainty associated with quantifying the parameters used as inputs to estimation models. UPS continues to improve internal processes for primary data collection to reduce uncertainty in our GHG
Notes to Statement of GHG EmissionsContinued
inventory reporting for Scope 1 and 2. UPS continues to work with the third parties responsible for providing the data necessary to calculate Scope 3 emissions and will continue to work on improving the data management and the methodologies used to estimate these emissions to reduce the uncertainty in our GHG inventory reporting. Using the GHG Protocol “Measurement and Estimation Uncertainty of GHG Emissions” guidance and analyzing the collected data through Monte Carlo simulations by using the @Risk statistical analysis software at 95 percent confidence interval, we are able to estimate the uncertainty for our 2014 GHG inventory as follows:
2014 GHG Inventory Uncertainty Estimates
Appendix B
110
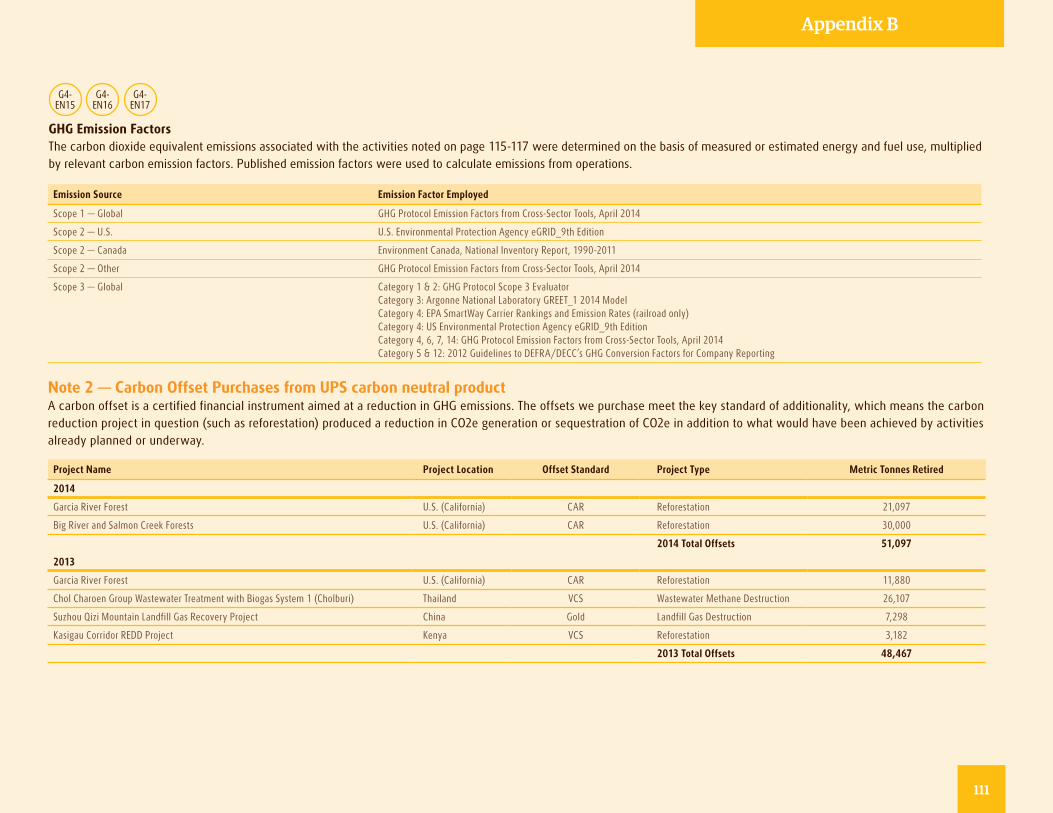
Emission Source Emission Factor Employed
Scope 1 — Global GHG Protocol Emission Factors from Cross-Sector Tools, April 2014
Scope 2 — U.S. U.S. Environmental Protection Agency eGRID_9th Edition
Scope 2 — Canada Environment Canada, National Inventory Report, 1990-2011
Scope 2 — Other GHG Protocol Emission Factors from Cross-Sector Tools, April 2014
Scope 3 — Global Category 1 & 2: GHG Protocol Scope 3 EvaluatorCategory 3: Argonne National Laboratory GREET_1 2014 ModelCategory 4: EPA SmartWay Carrier Rankings and Emission Rates (railroad only)Category 4: US Environmental Protection Agency eGRID_9th EditionCategory 4, 6, 7, 14: GHG Protocol Emission Factors from Cross-Sector Tools, April 2014Category 5 & 12: 2012 Guidelines to DEFRA/DECC’s GHG Conversion Factors for Company Reporting
Note 2 — Carbon Offset Purchases from UPS carbon neutral product A carbon offset is a certified financial instrument aimed at a reduction in GHG emissions. The offsets we purchase meet the key standard of additionality, which means the carbon reduction project in question (such as reforestation) produced a reduction in CO2e generation or sequestration of CO2e in addition to what would have been achieved by activities already planned or underway.
Project Name Project Location Offset Standard Project Type Metric Tonnes Retired
2014
Garcia River Forest U.S. (California) CAR Reforestation 21,097
Big River and Salmon Creek Forests U.S. (California) CAR Reforestation 30,000
2014 Total Offsets 51,097
2013
Garcia River Forest U.S. (California) CAR Reforestation 11,880
Chol Charoen Group Wastewater Treatment with Biogas System 1 (Cholburi) Thailand VCS Wastewater Methane Destruction 26,107
Suzhou Qizi Mountain Landfill Gas Recovery Project China Gold Landfill Gas Destruction 7,298
Kasigau Corridor REDD Project Kenya VCS Reforestation 3,182
2013 Total Offsets 48,467
G4-EN15
G4-EN16
G4-EN17
GHG Emission FactorsThe carbon dioxide equivalent emissions associated with the activities noted on page 115-117 were determined on the basis of measured or estimated energy and fuel use, multiplied by relevant carbon emission factors. Published emission factors were used to calculate emissions from operations.
Appendix B
111
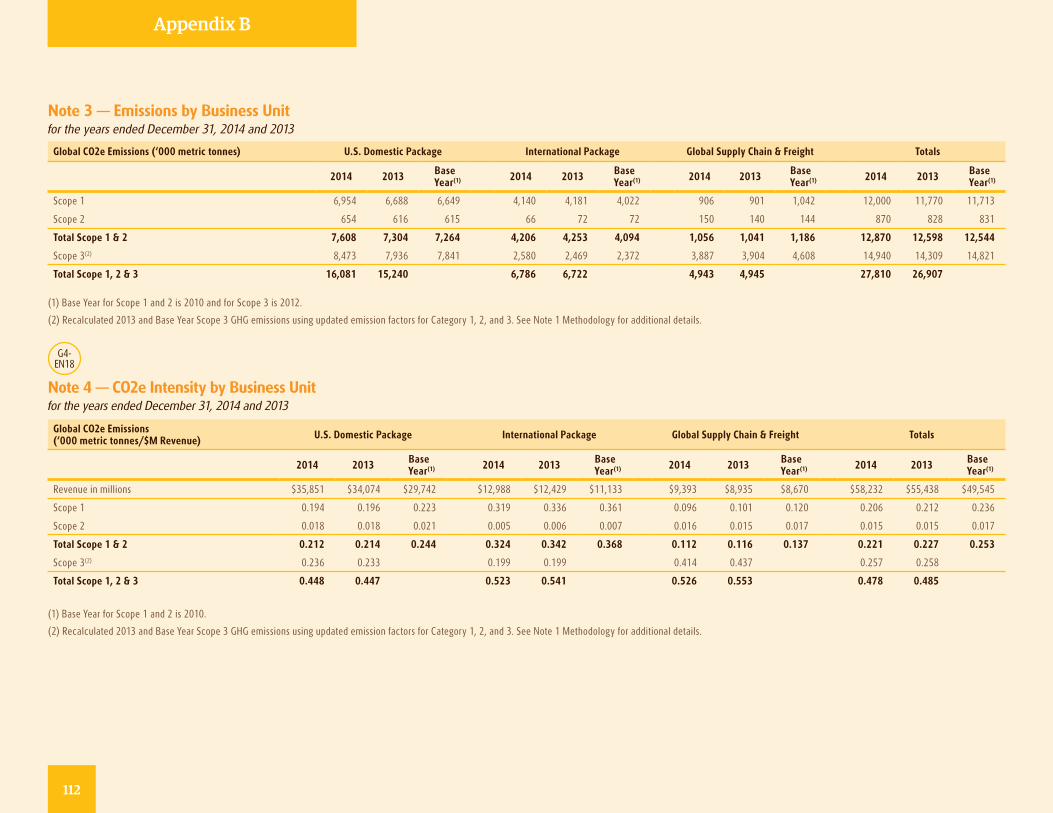
Note 3 — Emissions by Business Unit for the years ended December 31, 2014 and 2013
Global CO2e Emissions (‘000 metric tonnes) U.S. Domestic Package International Package Global Supply Chain & Freight Totals
2014 2013 Base Year(1) 2014 2013 Base
Year(1) 2014 2013 Base Year(1) 2014 2013 Base
Year(1)
Scope 1 6,954 6,688 6,649 4,140 4,181 4,022 906 901 1,042 12,000 11,770 11,713
Scope 2 654 616 615 66 72 72 150 140 144 870 828 831
Total Scope 1 & 2 7,608 7,304 7,264 4,206 4,253 4,094 1,056 1,041 1,186 12,870 12,598 12,544
Scope 3(2) 8,473 7,936 7,841 2,580 2,469 2,372 3,887 3,904 4,608 14,940 14,309 14,821
Total Scope 1, 2 & 3 16,081 15,240 6,786 6,722 4,943 4,945 27,810 26,907
(1) Base Year for Scope 1 and 2 is 2010 and for Scope 3 is 2012.
(2) Recalculated 2013 and Base Year Scope 3 GHG emissions using updated emission factors for Category 1, 2, and 3. See Note 1 Methodology for additional details.
G4-EN18
Note 4 — CO2e Intensity by Business Unit for the years ended December 31, 2014 and 2013
Global CO2e Emissions (‘000 metric tonnes/$M Revenue) U.S. Domestic Package International Package Global Supply Chain & Freight Totals
2014 2013 Base Year(1) 2014 2013 Base
Year(1) 2014 2013 Base Year(1) 2014 2013 Base
Year(1)
Revenue in millions $35,851 $34,074 $29,742 $12,988 $12,429 $11,133 $9,393 $8,935 $8,670 $58,232 $55,438 $49,545
Scope 1 0.194 0.196 0.223 0.319 0.336 0.361 0.096 0.101 0.120 0.206 0.212 0.236
Scope 2 0.018 0.018 0.021 0.005 0.006 0.007 0.016 0.015 0.017 0.015 0.015 0.017
Total Scope 1 & 2 0.212 0.214 0.244 0.324 0.342 0.368 0.112 0.116 0.137 0.221 0.227 0.253
Scope 3(2) 0.236 0.233 0.199 0.199 0.414 0.437 0.257 0.258
Total Scope 1, 2 & 3 0.448 0.447 0.523 0.541 0.526 0.553 0.478 0.485
(1) Base Year for Scope 1 and 2 is 2010.
(2) Recalculated 2013 and Base Year Scope 3 GHG emissions using updated emission factors for Category 1, 2, and 3. See Note 1 Methodology for additional details.
Appendix B
112
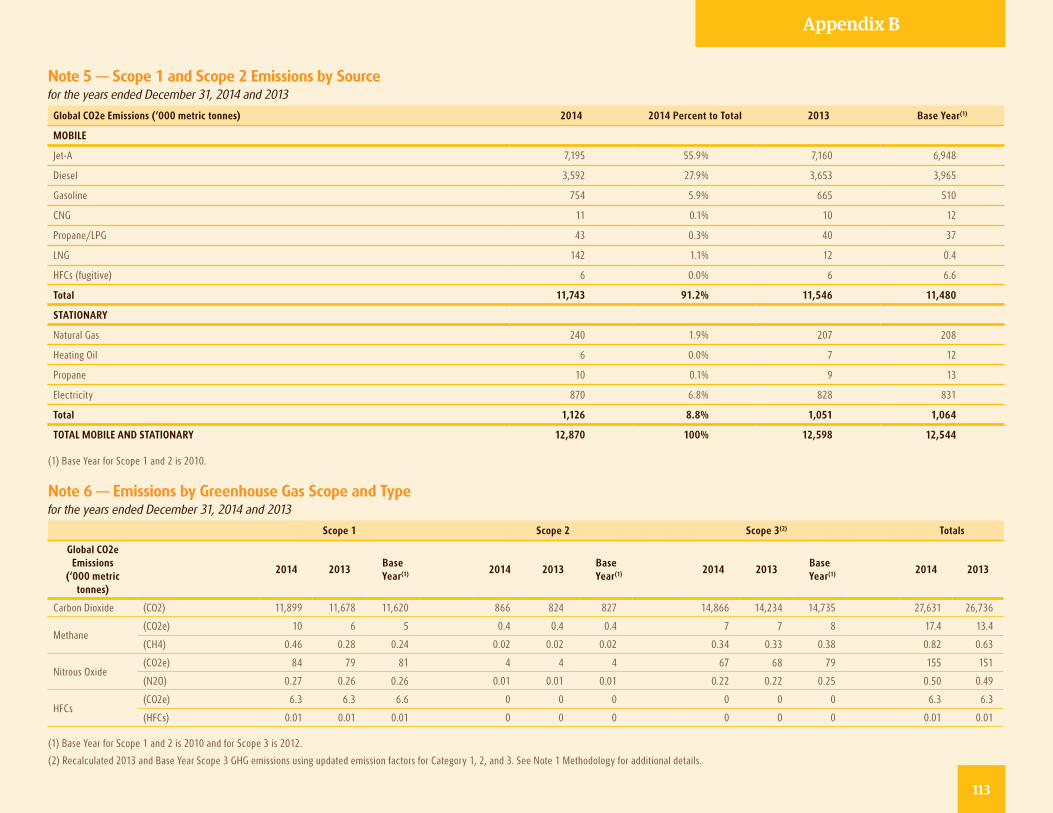
Note 5 — Scope 1 and Scope 2 Emissions by Source for the years ended December 31, 2014 and 2013
Global CO2e Emissions (‘000 metric tonnes) 2014 2014 Percent to Total 2013 Base Year(1)
MOBILE
Jet-A 7,195 55.9% 7,160 6,948
Diesel 3,592 27.9% 3,653 3,965
Gasoline 754 5.9% 665 510
CNG 11 0.1% 10 12
Propane/LPG 43 0.3% 40 37
LNG 142 1.1% 12 0.4
HFCs (fugitive) 6 0.0% 6 6.6
Total 11,743 91.2% 11,546 11,480
STATIONARY
Natural Gas 240 1.9% 207 208
Heating Oil 6 0.0% 7 12
Propane 10 0.1% 9 13
Electricity 870 6.8% 828 831
Total 1,126 8.8% 1,051 1,064
TOTAL MOBILE AND STATIONARY 12,870 100% 12,598 12,544
(1) Base Year for Scope 1 and 2 is 2010.
Note 6 — Emissions by Greenhouse Gas Scope and Type for the years ended December 31, 2014 and 2013
Scope 1 Scope 2 Scope 3(2) Totals
Global CO2e Emissions
(‘000 metric tonnes)
2014 2013Base
Year(1) 2014 2013Base
Year(1) 2014 2013Base
Year(1) 2014 2013
Carbon Dioxide (CO2) 11,899 11,678 11,620 866 824 827 14,866 14,234 14,735 27,631 26,736
Methane(CO2e) 10 6 5 0.4 0.4 0.4 7 7 8 17.4 13.4
(CH4) 0.46 0.28 0.24 0.02 0.02 0.02 0.34 0.33 0.38 0.82 0.63
Nitrous Oxide(CO2e) 84 79 81 4 4 4 67 68 79 155 151
(N2O) 0.27 0.26 0.26 0.01 0.01 0.01 0.22 0.22 0.25 0.50 0.49
HFCs(CO2e) 6.3 6.3 6.6 0 0 0 0 0 0 6.3 6.3
(HFCs) 0.01 0.01 0.01 0 0 0 0 0 0 0.01 0.01
(1) Base Year for Scope 1 and 2 is 2010 and for Scope 3 is 2012.
(2) Recalculated 2013 and Base Year Scope 3 GHG emissions using updated emission factors for Category 1, 2, and 3. See Note 1 Methodology for additional details.
Appendix B
113
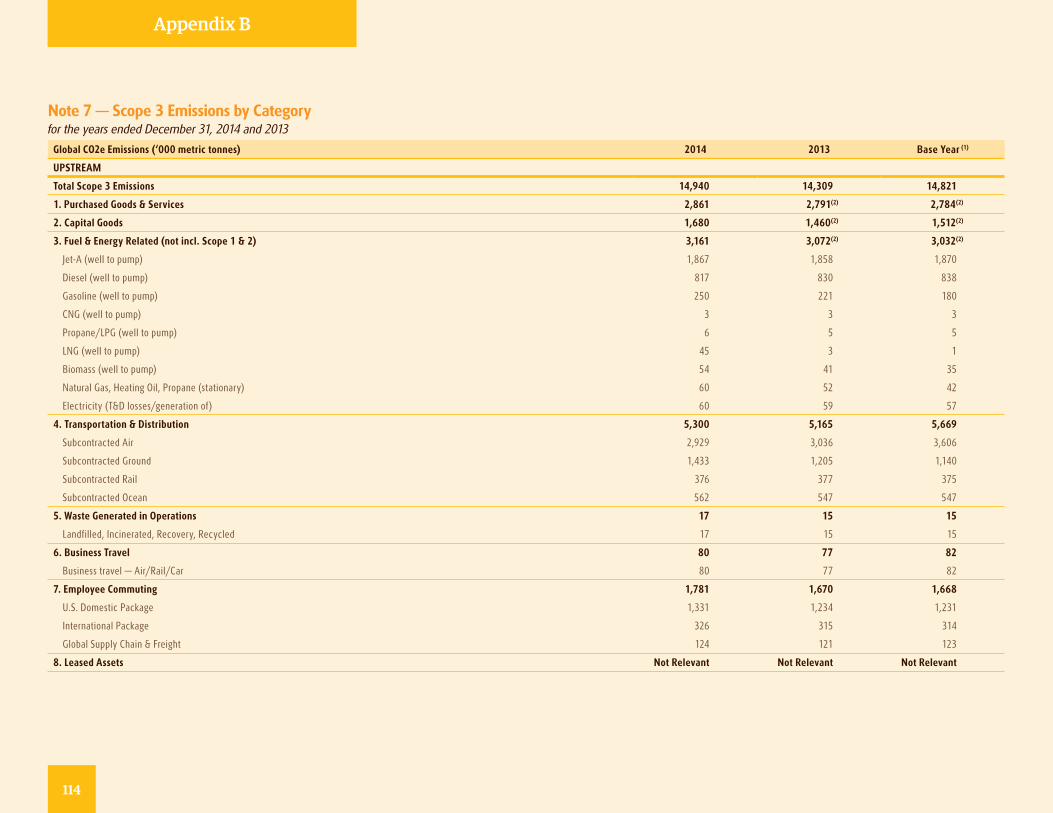
Note 7 — Scope 3 Emissions by Category for the years ended December 31, 2014 and 2013
Global CO2e Emissions (‘000 metric tonnes) 2014 2013 Base Year (1)
UPSTREAM
Total Scope 3 Emissions 14,940 14,309 14,821
1. Purchased Goods & Services 2,861 2,791(2) 2,784(2)
2. Capital Goods 1,680 1,460(2) 1,512(2)
3. Fuel & Energy Related (not incl. Scope 1 & 2) 3,161 3,072(2) 3,032(2)
Jet-A (well to pump) 1,867 1,858 1,870
Diesel (well to pump) 817 830 838
Gasoline (well to pump) 250 221 180
CNG (well to pump) 3 3 3
Propane/LPG (well to pump) 6 5 5
LNG (well to pump) 45 3 1
Biomass (well to pump) 54 41 35
Natural Gas, Heating Oil, Propane (stationary) 60 52 42
Electricity (T&D losses/generation of) 60 59 57
4. Transportation & Distribution 5,300 5,165 5,669
Subcontracted Air 2,929 3,036 3,606
Subcontracted Ground 1,433 1,205 1,140
Subcontracted Rail 376 377 375
Subcontracted Ocean 562 547 547
5. Waste Generated in Operations 17 15 15
Landfilled, Incinerated, Recovery, Recycled 17 15 15
6. Business Travel 80 77 82
Business travel — Air/Rail/Car 80 77 82
7. Employee Commuting 1,781 1,670 1,668
U.S. Domestic Package 1,331 1,234 1,231
International Package 326 315 314
Global Supply Chain & Freight 124 121 123
8. Leased Assets Not Relevant Not Relevant Not Relevant
Appendix B
114
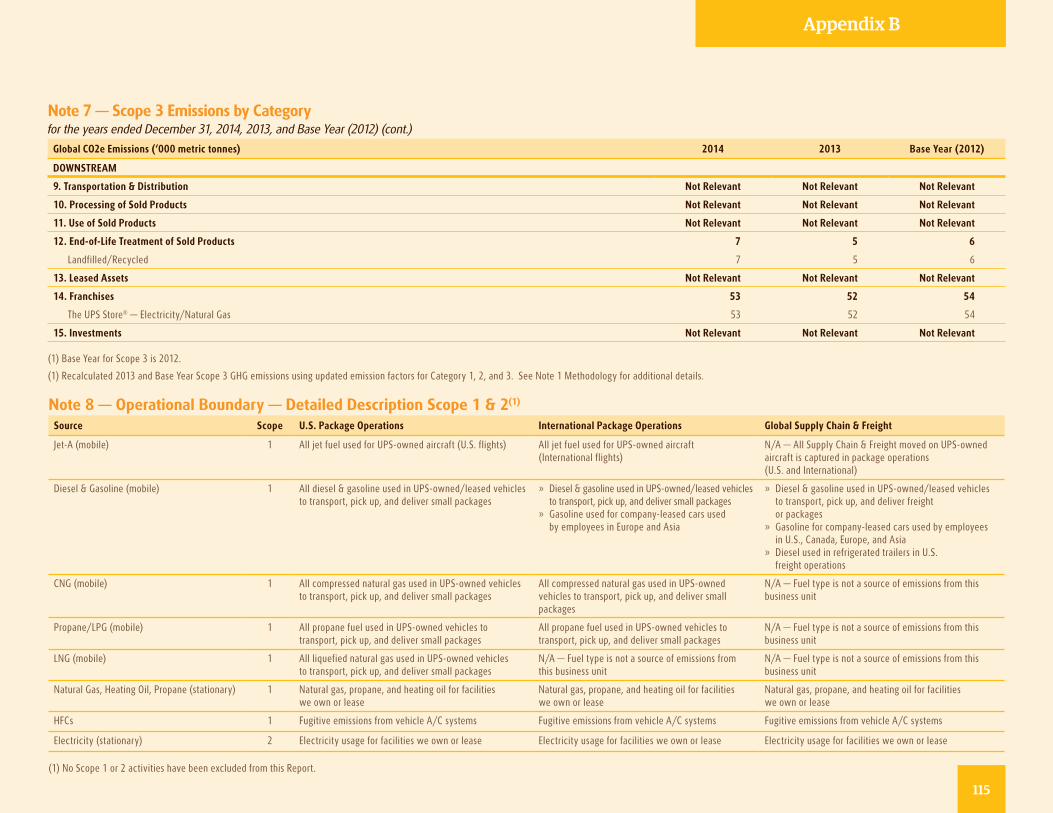
Note 7 — Scope 3 Emissions by Category for the years ended December 31, 2014 and 2013
Global CO2e Emissions (‘000 metric tonnes) 2014 2013 Base Year (1)
UPSTREAM
Total Scope 3 Emissions 14,940 14,309 14,821
1. Purchased Goods & Services 2,861 2,791(2) 2,784(2)
2. Capital Goods 1,680 1,460(2) 1,512(2)
3. Fuel & Energy Related (not incl. Scope 1 & 2) 3,161 3,072(2) 3,032(2)
Jet-A (well to pump) 1,867 1,858 1,870
Diesel (well to pump) 817 830 838
Gasoline (well to pump) 250 221 180
CNG (well to pump) 3 3 3
Propane/LPG (well to pump) 6 5 5
LNG (well to pump) 45 3 1
Biomass (well to pump) 54 41 35
Natural Gas, Heating Oil, Propane (stationary) 60 52 42
Electricity (T&D losses/generation of) 60 59 57
4. Transportation & Distribution 5,300 5,165 5,669
Subcontracted Air 2,929 3,036 3,606
Subcontracted Ground 1,433 1,205 1,140
Subcontracted Rail 376 377 375
Subcontracted Ocean 562 547 547
5. Waste Generated in Operations 17 15 15
Landfilled, Incinerated, Recovery, Recycled 17 15 15
6. Business Travel 80 77 82
Business travel — Air/Rail/Car 80 77 82
7. Employee Commuting 1,781 1,670 1,668
U.S. Domestic Package 1,331 1,234 1,231
International Package 326 315 314
Global Supply Chain & Freight 124 121 123
8. Leased Assets Not Relevant Not Relevant Not Relevant
Note 7 — Scope 3 Emissions by Category for the years ended December 31, 2014, 2013, and Base Year (2012) (cont.)
Global CO2e Emissions (‘000 metric tonnes) 2014 2013 Base Year (2012)
DOWNSTREAM
9. Transportation & Distribution Not Relevant Not Relevant Not Relevant
10. Processing of Sold Products Not Relevant Not Relevant Not Relevant
11. Use of Sold Products Not Relevant Not Relevant Not Relevant
12. End-of-Life Treatment of Sold Products 7 5 6
Landfilled/Recycled 7 5 6
13. Leased Assets Not Relevant Not Relevant Not Relevant
14. Franchises 53 52 54
The UPS Store® — Electricity/Natural Gas 53 52 54
15. Investments Not Relevant Not Relevant Not Relevant
(1) Base Year for Scope 3 is 2012.
(1) Recalculated 2013 and Base Year Scope 3 GHG emissions using updated emission factors for Category 1, 2, and 3. See Note 1 Methodology for additional details.
Note 8 — Operational Boundary — Detailed Description Scope 1 & 2(1)
Source Scope U.S. Package Operations International Package Operations Global Supply Chain & Freight
Jet-A (mobile) 1 All jet fuel used for UPS-owned aircraft (U.S. flights) All jet fuel used for UPS-owned aircraft (International flights)
N/A — All Supply Chain & Freight moved on UPS-owned aircraft is captured in package operations (U.S. and International)
Diesel & Gasoline (mobile) 1 All diesel & gasoline used in UPS-owned/leased vehicles to transport, pick up, and deliver small packages
» Diesel & gasoline used in UPS-owned/leased vehicles to transport, pick up, and deliver small packages
» Gasoline used for company-leased cars used by employees in Europe and Asia
» Diesel & gasoline used in UPS-owned/leased vehicles to transport, pick up, and deliver freight or packages
» Gasoline for company-leased cars used by employees in U.S., Canada, Europe, and Asia
» Diesel used in refrigerated trailers in U.S. freight operations
CNG (mobile) 1 All compressed natural gas used in UPS-owned vehicles to transport, pick up, and deliver small packages
All compressed natural gas used in UPS-owned vehicles to transport, pick up, and deliver small packages
N/A — Fuel type is not a source of emissions from this business unit
Propane/LPG (mobile) 1 All propane fuel used in UPS-owned vehicles to transport, pick up, and deliver small packages
All propane fuel used in UPS-owned vehicles to transport, pick up, and deliver small packages
N/A — Fuel type is not a source of emissions from this business unit
LNG (mobile) 1 All liquefied natural gas used in UPS-owned vehicles to transport, pick up, and deliver small packages
N/A — Fuel type is not a source of emissions from this business unit
N/A — Fuel type is not a source of emissions from this business unit
Natural Gas, Heating Oil, Propane (stationary) 1 Natural gas, propane, and heating oil for facilities we own or lease
Natural gas, propane, and heating oil for facilities we own or lease
Natural gas, propane, and heating oil for facilities we own or lease
HFCs 1 Fugitive emissions from vehicle A/C systems Fugitive emissions from vehicle A/C systems Fugitive emissions from vehicle A/C systems
Electricity (stationary) 2 Electricity usage for facilities we own or lease Electricity usage for facilities we own or lease Electricity usage for facilities we own or lease
(1) No Scope 1 or 2 activities have been excluded from this Report.
Appendix B
115
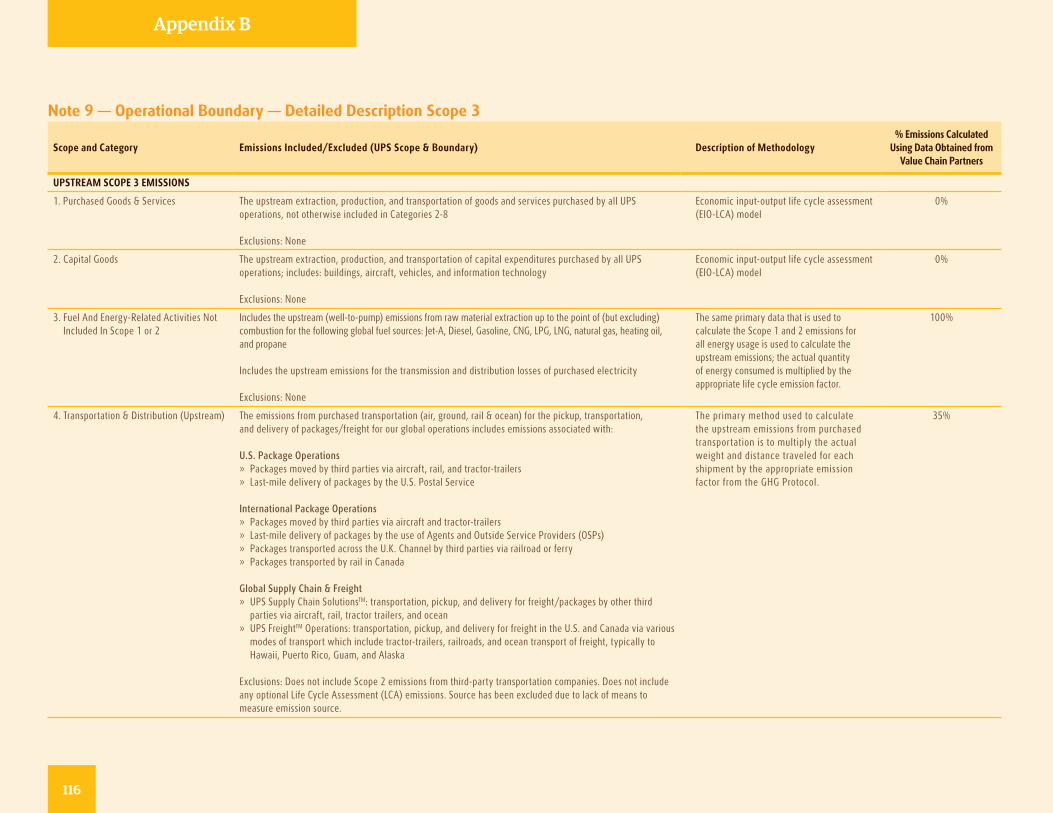
Note 9 — Operational Boundary — Detailed Description Scope 3
Scope and Category Emissions Included/Excluded (UPS Scope & Boundary) Description of Methodology% Emissions Calculated
Using Data Obtained from Value Chain Partners
UPSTREAM SCOPE 3 EMISSIONS
1. Purchased Goods & Services The upstream extraction, production, and transportation of goods and services purchased by all UPS operations, not otherwise included in Categories 2-8 Exclusions: None
Economic input-output life cycle assessment (EIO-LCA) model
0%
2. Capital Goods The upstream extraction, production, and transportation of capital expenditures purchased by all UPS operations; includes: buildings, aircraft, vehicles, and information technology Exclusions: None
Economic input-output life cycle assessment (EIO-LCA) model
0%
3. Fuel And Energy-Related Activities Not Included In Scope 1 or 2
Includes the upstream (well-to-pump) emissions from raw material extraction up to the point of (but excluding) combustion for the following global fuel sources: Jet-A, Diesel, Gasoline, CNG, LPG, LNG, natural gas, heating oil, and propane
Includes the upstream emissions for the transmission and distribution losses of purchased electricity Exclusions: None
The same primary data that is used to calculate the Scope 1 and 2 emissions for all energy usage is used to calculate the upstream emissions; the actual quantity of energy consumed is multiplied by the appropriate life cycle emission factor.
100%
4. Transportation & Distribution (Upstream) The emissions from purchased transportation (air, ground, rail & ocean) for the pickup, transportation, and delivery of packages/freight for our global operations includes emissions associated with: U.S. Package Operations » Packages moved by third parties via aircraft, rail, and tractor-trailers » Last-mile delivery of packages by the U.S. Postal Service
International Package Operations » Packages moved by third parties via aircraft and tractor-trailers » Last-mile delivery of packages by the use of Agents and Outside Service Providers (OSPs) » Packages transported across the U.K. Channel by third parties via railroad or ferry » Packages transported by rail in Canada
Global Supply Chain & Freight » UPS Supply Chain SolutionsTM: transportation, pickup, and delivery for freight/packages by other third parties via aircraft, rail, tractor trailers, and ocean
» UPS FreightTM Operations: transportation, pickup, and delivery for freight in the U.S. and Canada via various modes of transport which include tractor-trailers, railroads, and ocean transport of freight, typically to Hawaii, Puerto Rico, Guam, and Alaska
Exclusions: Does not include Scope 2 emissions from third-party transportation companies. Does not include any optional Life Cycle Assessment (LCA) emissions. Source has been excluded due to lack of means to measure emission source.
The primary method used to calculate the upstream emissions from purchased transportation is to multiply the actual weight and distance traveled for each shipment by the appropriate emission factor from the GHG Protocol.
35%
Appendix B
116
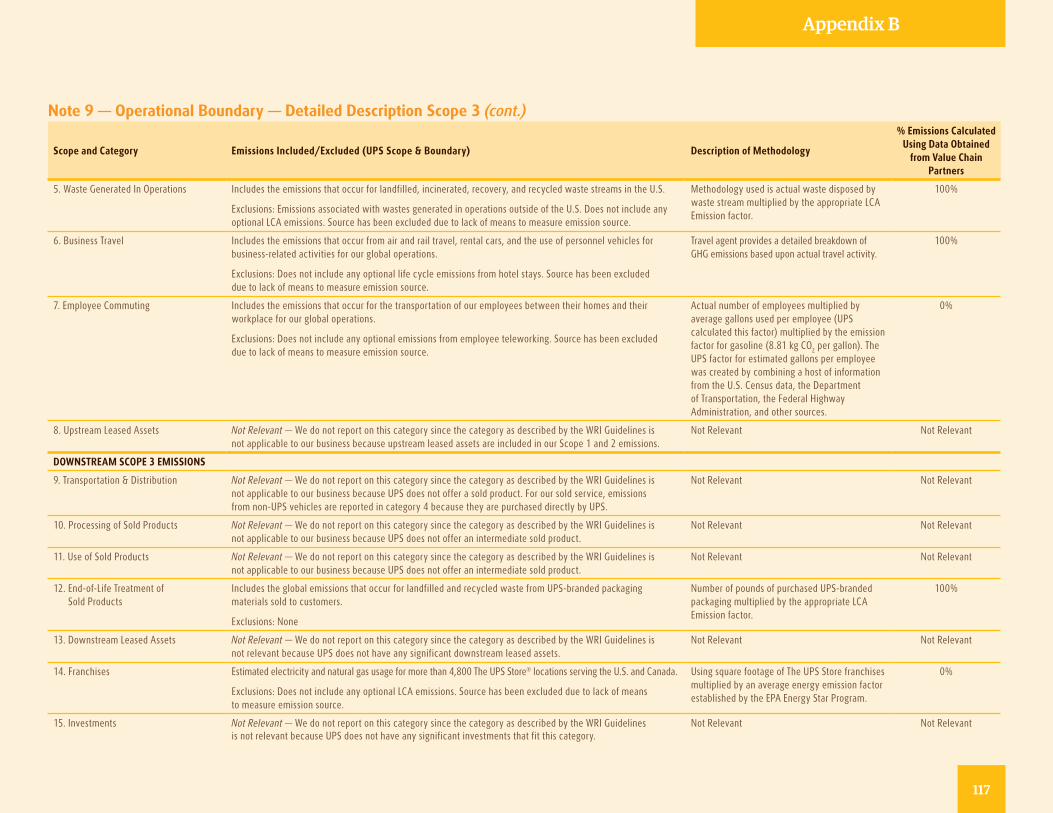
Note 9 — Operational Boundary — Detailed Description Scope 3 (cont.)
Scope and Category Emissions Included/Excluded (UPS Scope & Boundary) Description of Methodology
% Emissions Calculated Using Data Obtained
from Value Chain Partners
5. Waste Generated In Operations Includes the emissions that occur for landfilled, incinerated, recovery, and recycled waste streams in the U.S.
Exclusions: Emissions associated with wastes generated in operations outside of the U.S. Does not include any optional LCA emissions. Source has been excluded due to lack of means to measure emission source.
Methodology used is actual waste disposed by waste stream multiplied by the appropriate LCA Emission factor.
100%
6. Business Travel Includes the emissions that occur from air and rail travel, rental cars, and the use of personnel vehicles for business-related activities for our global operations.
Exclusions: Does not include any optional life cycle emissions from hotel stays. Source has been excluded due to lack of means to measure emission source.
Travel agent provides a detailed breakdown of GHG emissions based upon actual travel activity.
100%
7. Employee Commuting Includes the emissions that occur for the transportation of our employees between their homes and their workplace for our global operations.
Exclusions: Does not include any optional emissions from employee teleworking. Source has been excluded due to lack of means to measure emission source.
Actual number of employees multiplied by average gallons used per employee (UPS calculated this factor) multiplied by the emission factor for gasoline (8.81 kg CO2 per gallon). The UPS factor for estimated gallons per employee was created by combining a host of information from the U.S. Census data, the Department of Transportation, the Federal Highway Administration, and other sources.
0%
8. Upstream Leased Assets Not Relevant — We do not report on this category since the category as described by the WRI Guidelines is not applicable to our business because upstream leased assets are included in our Scope 1 and 2 emissions.
Not Relevant Not Relevant
DOWNSTREAM SCOPE 3 EMISSIONS
9. Transportation & Distribution Not Relevant — We do not report on this category since the category as described by the WRI Guidelines is not applicable to our business because UPS does not offer a sold product. For our sold service, emissions from non-UPS vehicles are reported in category 4 because they are purchased directly by UPS.
Not Relevant Not Relevant
10. Processing of Sold Products Not Relevant — We do not report on this category since the category as described by the WRI Guidelines is not applicable to our business because UPS does not offer an intermediate sold product.
Not Relevant Not Relevant
11. Use of Sold Products Not Relevant — We do not report on this category since the category as described by the WRI Guidelines is not applicable to our business because UPS does not offer an intermediate sold product.
Not Relevant Not Relevant
12. End-of-Life Treatment of Sold Products
Includes the global emissions that occur for landfilled and recycled waste from UPS-branded packaging materials sold to customers.
Exclusions: None
Number of pounds of purchased UPS-branded packaging multiplied by the appropriate LCA Emission factor.
100%
13. Downstream Leased Assets Not Relevant — We do not report on this category since the category as described by the WRI Guidelines is not relevant because UPS does not have any significant downstream leased assets.
Not Relevant Not Relevant
14. Franchises Estimated electricity and natural gas usage for more than 4,800 The UPS Store® locations serving the U.S. and Canada.
Exclusions: Does not include any optional LCA emissions. Source has been excluded due to lack of means to measure emission source.
Using square footage of The UPS Store franchises multiplied by an average energy emission factor established by the EPA Energy Star Program.
0%
15. Investments Not Relevant — We do not report on this category since the category as described by the WRI Guidelines is not relevant because UPS does not have any significant investments that fit this category.
Not Relevant Not Relevant
Appendix B
117
Independent Accountants’ Examination Report
Appendix B
Board of Directors, Shareowners, and Stakeholders United Parcel Service, Inc. Atlanta, Georgia
We have examined the accompanying Statement of Greenhouse Gas (GHG) Emissions (“Statement of GHG Emissions”) of United Parcel Service, Inc. (the “Company”) for the years ended December 31, 2014 and 2013, and the 2010 base year for Scope 1 and 2 greenhouse gas emissions and the 2012 base year for Scope 3 greenhouse gas emissions. The Company’s management is responsible for the Statement of GHG Emissions. Our responsibility is to express an opinion based on our examination.
Our examination was conducted in accordance with attestation standards established by the American Institute of Certified Public Accountants and, accordingly, included obtaining an understanding of the nature of the Company’s greenhouse gas emissions and its internal control over greenhouse gas emissions information, examining, on a test basis, evidence supporting the Company’s Statement of GHG Emissions and performing such other procedures as we considered necessary in the circumstances. We believe that our examination provides a reasonable basis for our opinion.
As described in Note 1, environmental and energy use data are subject to measurement uncertainties resulting from limitations inherent in the nature and the methods used for determining such data. The selection of different but acceptable measurement techniques can result in materially different measurements. The precision of different measurement techniques may also vary.
In our opinion, the Statement of GHG Emissions of the Company for the years ended December 31, 2014 and 2013, and the 2010 base year for Scope 1 and 2 greenhouse gas emissions and the 2012 base year for Scope 3 greenhouse gas emissions is presented, in all material respects, in conformity with the Greenhouse Gas Protocol Corporate Accounting and Reporting Standard (Scope 1 and 2) and the Corporate Value Chain (Scope 3) Accounting and Reporting Standard published by the World Business Council for Sustainable Development and the World Resources Institute (collectively, the “GHG Protocol”).
Stamford, Connecticut June 26, 2015
118
SGS Independent Verification Statement
Appendix C
SGS UNITED KINGDOM LIMITED (SGS) has been contracted by United Parcel Service General Service Co. (“UPS”) of 55 Glenlake Parkway NE, Atlanta, Georgia 30328 for the independent third party verification of direct and indirect carbon dioxide equivalent emissions (CO2e) as provided in their 2014 GHG Assertion. Verification was conducted in accordance with ISO 14064-3.
Roles and responsibilitiesThe management of UPS is responsible for the organisation’s GHG information system, the development and maintenance of records and reporting procedures in accordance with that system, including the calculation and determination of GHG emissions information and the reported GHG emissions.
It is SGS’ responsibility to express an independent GHG verification opinion on the emissions as provided in the UPS GHG Assertion for the period January 1st 2014– December 31st 2014.
Title or description activities:The scope of this engagement covers the assessment of emissions from the following source streams:
Scope 1 Emissions: » Jet fuel used in UPS owned aircraft » Diesel and gasoline used in UPS controlled vehicles » Compressed and liquefied natural gas used in UPS controlled vehicles
» Propane and LPG used in UPS controlled vehicles » Natural gas, heating oil and propane used in UPS controlled facilities
» HFC’s (fugitive) from vehicle A/C systems and refrigerated trailers
Scope 2 Emissions:Electricity use in UPS controlled facilities
Scope 3 Emissions: » Category 1 Purchased goods & services » Category 2 Capital Goods » Category 3 Fuel and energy related
› Upstream well to pump related emission to the point of (but excluding) combustion for Jet-A, Diesel, Gasoline, CNG, LNG, propane/LPG, Natural gas, heating oil and propane.
› Electricity – (generation and Transmission and distribution losses)
» Category 4 Upstream transportation and distribution › Subcontracted transportation including air, rail, ground and ocean
» Category 5 Waste generated in operation › Landfill, Recycled
» Category 6 Business Travel › Air, Rail, Car rental
» Category 7 Employee Commuting » Category 12 End-of-Life Treatment of sold products
› Landfill, Recycled » Category 14 Franchises
› Electricity, Natural Gas
Data and information supporting the GHG assertion were historical in nature for Scope 1 & 2 emissions and historical/estimated for Scope 3.
The organisational boundary was established following the operational control approach on a global basis.
Additional note for reporting for Scope 3Please note that the Scope 3, category 1-3 Purchased goods & services, Capital Goods, and Fuel and energy related uses (not including Scope 1) have been recalculated for 2013 and 2012 using updated emission factors and revised methodology, enabling the ability to better compare results over time.
119
SGS Independent Verification StatementContinued
Appendix C
Scope » Reporting period — 1st January 2014 to 31st December 2014 » Intended user of the Verification Statement: UPS management, CDP, staff, stakeholders and general public.
» Location/boundary of the activities: worldwide » Types of GHGs included: CO2, CH4, N2O, HFCs » Consolidation Approach: Operational Control
Conclusion We planned and performed our work to obtain the information, explanations and evidence that we considered necessary to provide a reasonable level of assurance that the reported GHG emissions for the period are fairly stated.
We conducted our verification with regard to the GHG assertion of UPS which included an assessment of the GHG information system and monitoring and reporting methodology. This assessment included the collection of evidence supporting the reported data, and checking whether the provisions of the standard and methodology referenced in the verification criteria, were consistently and appropriately applied.
This statement shall be interpreted with the GHG assertion of UPS as a whole.
SGS’ approach is risk-based, drawing on an understanding of the risks associated with calculating GHG emission information and the controls in place to mitigate these risks. Our examination included assessment, on a sample basis, of evidence relevant to the reporting of emission information.
Based on the data and information provided by UPS and the processes and procedures conducted, SGS concludes with reasonable assurance that: » The GHG inventory methodology applied by UPS is sound, valid and based on best practice.
ObjectivesThe objectives of this verification exercise were, by review of objective evidence, to confirm whether the GHG emissions as declared in the organisation’s GHG assertion were: » Accurate, complete, consistent, transparent and free of material error or omission.
» Determined in accordance with the verification criteria below.
CriteriaCriteria against which the verification assessment was undertaken are the requirements of the ISO 14064-1:2006 Reference calculation methodologies used: » Scope 1 & 2 emissions — World Resources Institute/World Business Council for Sustainable Development Greenhouse Gas Protocol: A Corporate Accounting and Reporting Standard, Revised Edition (the GHG Protocol)
» Scope 3 emissions, the World Resources Institute/World Business Council for Sustainable Development Greenhouse Gas Protocol: Corporate Value Chain (Scope 3), Accounting and Reporting Standard.
Level of Assurance and MaterialityThe level of assurance agreed is that of reasonable assurance. A materiality level of 5% was applied. Note that assessment of compliance and materiality was undertaken against the stated calculation methodology.
» The estimated annual emissions are accurate, complete, consistent, transparent and free of material error or omission in relation to the requirements of the calculation methodologies employed.
UPS provided the GHG assertion based on the requirements of ISO 14064-1:2006. The GHG information for the period 1st January 2014 to 31st December 2014 disclosing emissions of 27,810 thousand metric tonnes of CO2 equivalent are verified by SGS to a reasonable level of assurance, consistent with the agreed verification scope, objectives and criteria.
Emissions by scope are verified as follows:Scope 1: 12,000 thousand tonnes of CO2e Scope 2: 870 thousand tonnes of CO2eScope 3: 14,940 thousand tonnes of CO2e
In addition to the emissions reported above, UPS has included in its GHG assertion that it has partially offset its emissions through the purchase and retirement of voluntary carbon offsets of 51,097 tonnes of CO2 equivalent. SGS has verified that these credits have been retired and are from projects adhering to international quality standards. This verification is outside the scope of the ISO 14064-1:2006 inventory.
Authorised by:
Jonathan HallBusiness ManagerSGS United Kingdom Ltd
Verification statement date 27th May 2015
120
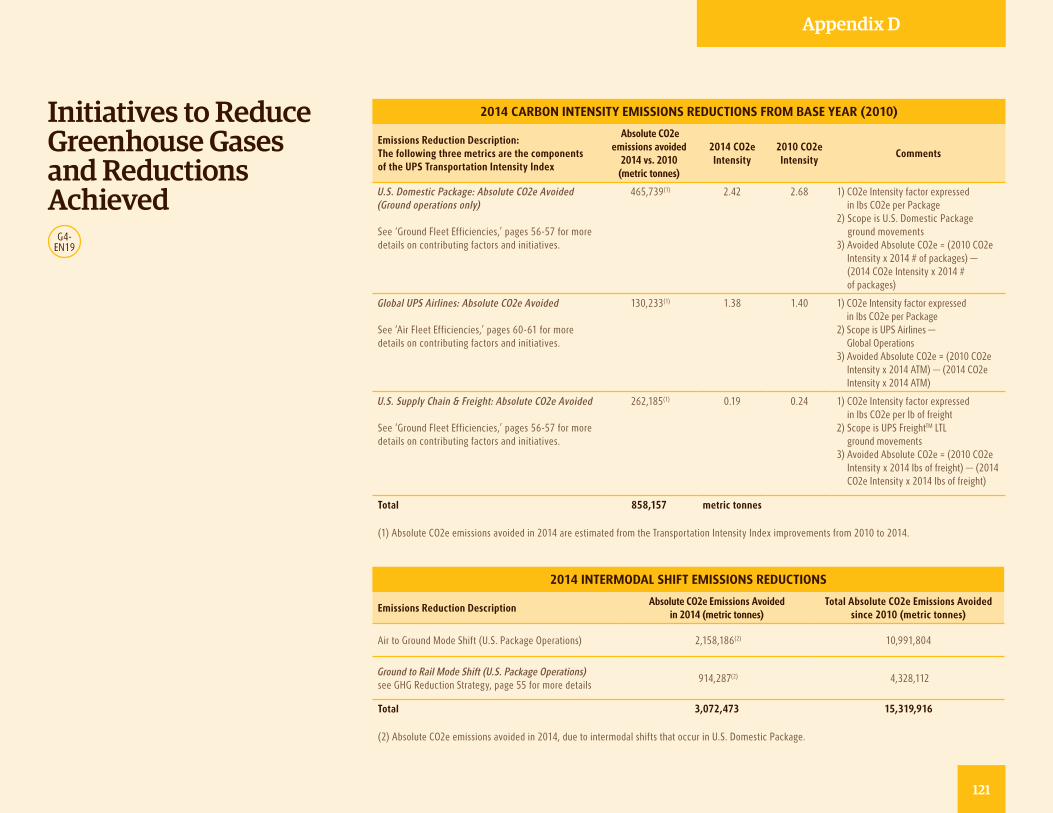
2014 CARBON INTENSITY EMISSIONS REDUCTIONS FROM BASE YEAR (2010)
Emissions Reduction Description:The following three metrics are the components of the UPS Transportation Intensity Index
Absolute CO2e emissions avoided
2014 vs. 2010(metric tonnes)
2014 CO2e Intensity
2010 CO2e Intensity
Comments
U.S. Domestic Package: Absolute CO2e Avoided (Ground operations only) See ‘Ground Fleet Efficiencies,’ pages 56-57 for more details on contributing factors and initiatives.
465,739(1) 2.42 2.68 1) CO2e Intensity factor expressed in lbs CO2e per Package
2) Scope is U.S. Domestic Package ground movements
3) Avoided Absolute CO2e = (2010 CO2e Intensity x 2014 # of packages) — (2014 CO2e Intensity x 2014 # of packages)
Global UPS Airlines: Absolute CO2e Avoided See ‘Air Fleet Efficiencies,’ pages 60-61 for more details on contributing factors and initiatives.
130,233(1) 1.38 1.40 1) CO2e Intensity factor expressed in lbs CO2e per Package
2) Scope is UPS Airlines — Global Operations
3) Avoided Absolute CO2e = (2010 CO2e Intensity x 2014 ATM) — (2014 CO2e Intensity x 2014 ATM)
U.S. Supply Chain & Freight: Absolute CO2e Avoided See ‘Ground Fleet Efficiencies,’ pages 56-57 for more details on contributing factors and initiatives.
262,185(1) 0.19 0.24 1) CO2e Intensity factor expressed in lbs CO2e per lb of freight
2) Scope is UPS FreightTM LTL ground movements
3) Avoided Absolute CO2e = (2010 CO2e Intensity x 2014 lbs of freight) — (2014 CO2e Intensity x 2014 lbs of freight)
Total 858,157 metric tonnes
(1) Absolute CO2e emissions avoided in 2014 are estimated from the Transportation Intensity Index improvements from 2010 to 2014.
Initiatives to Reduce Greenhouse Gases and Reductions Achieved
2014 INTERMODAL SHIFT EMISSIONS REDUCTIONS
Emissions Reduction DescriptionAbsolute CO2e Emissions Avoided
in 2014 (metric tonnes)Total Absolute CO2e Emissions Avoided
since 2010 (metric tonnes)
Air to Ground Mode Shift (U.S. Package Operations) 2,158,186(2) 10,991,804
Ground to Rail Mode Shift (U.S. Package Operations)see GHG Reduction Strategy, page 55 for more details
914,287(2) 4,328,112
Total 3,072,473 15,319,916
(2) Absolute CO2e emissions avoided in 2014, due to intermodal shifts that occur in U.S. Domestic Package.
G4-EN19
Appendix D
121
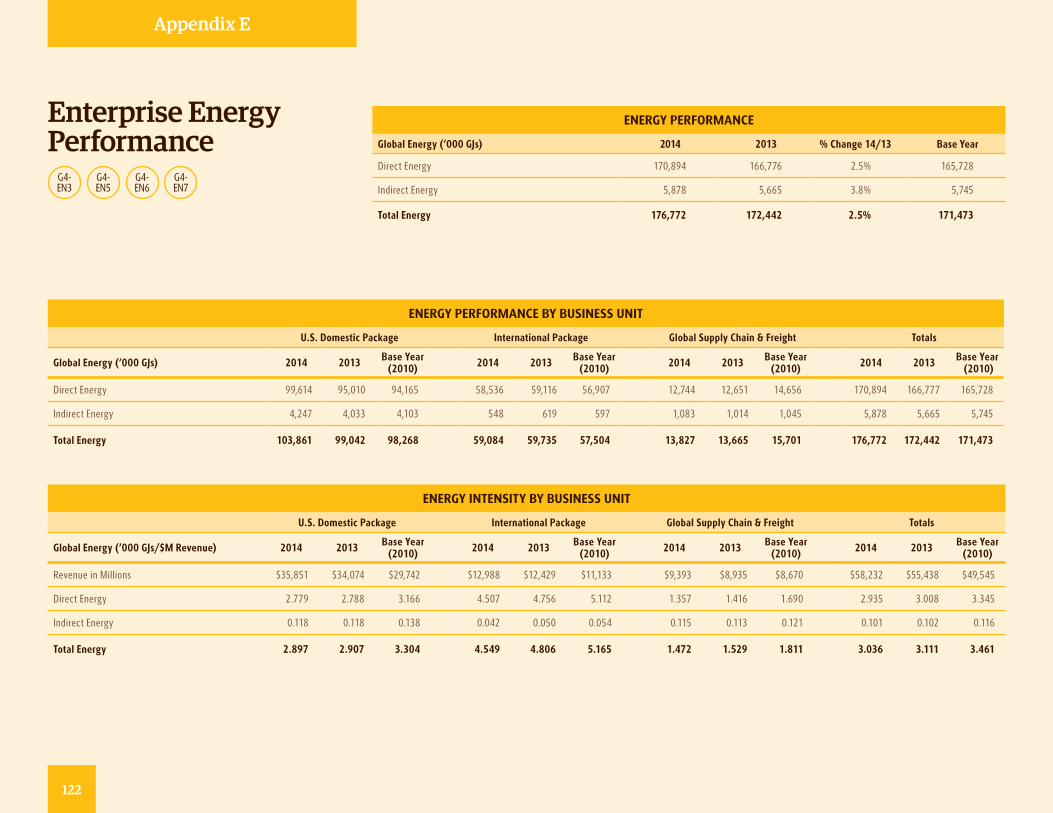
ENERGY PERFORMANCE
Global Energy (‘000 GJs) 2014 2013 % Change 14/13 Base Year
Direct Energy 170,894 166,776 2.5% 165,728
Indirect Energy 5,878 5,665 3.8% 5,745
Total Energy 176,772 172,442 2.5% 171,473
Enterprise Energy Performance
ENERGY PERFORMANCE BY BUSINESS UNIT
U.S. Domestic Package International Package Global Supply Chain & Freight Totals
Global Energy (‘000 GJs) 2014 2013 Base Year (2010) 2014 2013 Base Year
(2010) 2014 2013 Base Year (2010) 2014 2013 Base Year
(2010)
Direct Energy 99,614 95,010 94,165 58,536 59,116 56,907 12,744 12,651 14,656 170,894 166,777 165,728
Indirect Energy 4,247 4,033 4,103 548 619 597 1,083 1,014 1,045 5,878 5,665 5,745
Total Energy 103,861 99,042 98,268 59,084 59,735 57,504 13,827 13,665 15,701 176,772 172,442 171,473
ENERGY INTENSITY BY BUSINESS UNIT
U.S. Domestic Package International Package Global Supply Chain & Freight Totals
Global Energy (‘000 GJs/$M Revenue) 2014 2013 Base Year (2010) 2014 2013 Base Year
(2010) 2014 2013 Base Year (2010) 2014 2013 Base Year
(2010)
Revenue in Millions $35,851 $34,074 $29,742 $12,988 $12,429 $11,133 $9,393 $8,935 $8,670 $58,232 $55,438 $49,545
Direct Energy 2.779 2.788 3.166 4.507 4.756 5.112 1.357 1.416 1.690 2.935 3.008 3.345
Indirect Energy 0.118 0.118 0.138 0.042 0.050 0.054 0.115 0.113 0.121 0.101 0.102 0.116
Total Energy 2.897 2.907 3.304 4.549 4.806 5.165 1.472 1.529 1.811 3.036 3.111 3.461
G4- EN3
G4- EN5
G4- EN6
G4- EN7
Appendix E
122

ENERGY BY SOURCE
Global Energy (‘000 GJs) 2014 Percent to Total Emissions 2014 2013 Base Year (2010)
DIRECT ENERGY
Jet-A 101,597 57.5% 101,108 98,117
Diesel 49,659 28.1% 50,491 54,814
Gasoline 11,101 6.3% 9,797 7,410
CNG 201 0.1% 197 224
Propane/LPG 676 0.4% 637 625
LNG 2,672 1.5% 213 9
Natural Gas 4,751 2.7% 4,093 4,124
Heating Oil 80 0.0% 94 185
Propane 157 0.1% 145 220
Subtotal — Direct Energy 170,894 96.7% 166,776 165,728
INDIRECT ENERGY
Electricity 5,867 3.3% 5,659 5,745
Facility Solar Power Generated 11 0.0% 6 0
Grand Total 176,772 100.0% 172,442 171,474
Appendix E
123
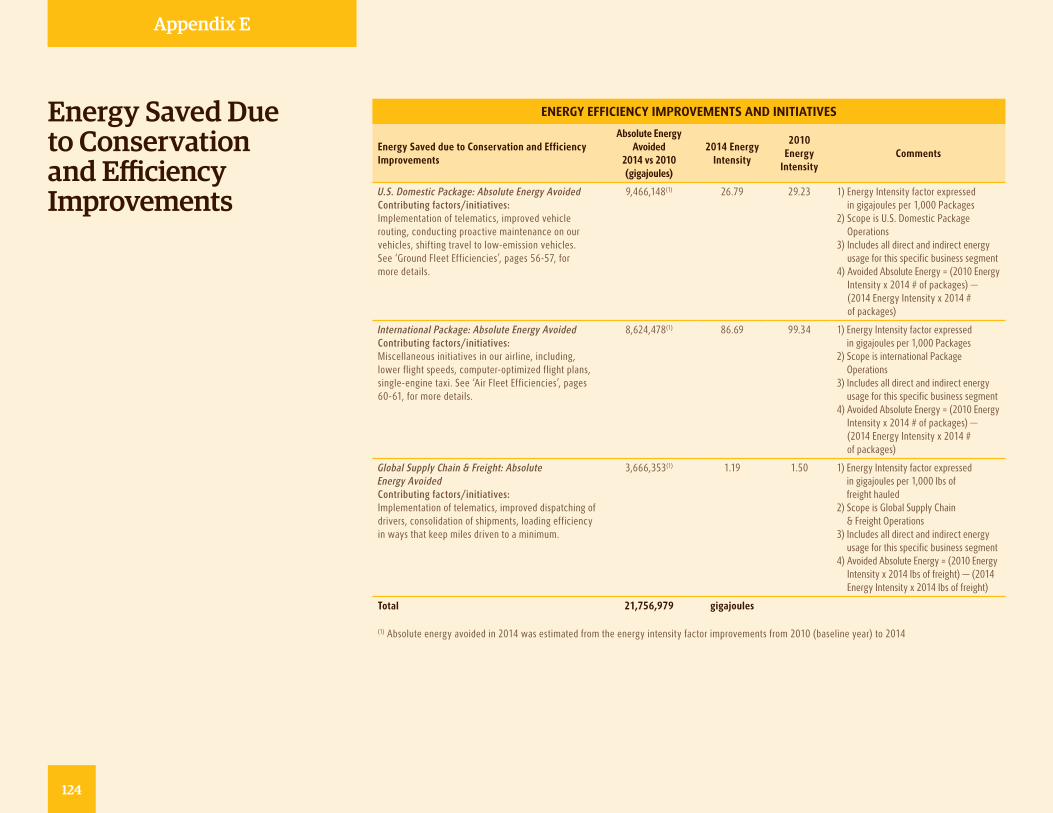
Energy Saved Due to Conservation and Efficiency Improvements
ENERGY EFFICIENCY IMPROVEMENTS AND INITIATIVES
Energy Saved due to Conservation and Efficiency Improvements
Absolute Energy Avoided
2014 vs 2010(gigajoules)
2014 Energy Intensity
2010 Energy
IntensityComments
U.S. Domestic Package: Absolute Energy Avoided Contributing factors/initiatives: Implementation of telematics, improved vehicle routing, conducting proactive maintenance on our vehicles, shifting travel to low-emission vehicles. See ‘Ground Fleet Efficiencies’, pages 56-57, for more details.
9,466,148(1) 26.79 29.23 1) Energy Intensity factor expressed in gigajoules per 1,000 Packages
2) Scope is U.S. Domestic Package Operations
3) Includes all direct and indirect energy usage for this specific business segment
4) Avoided Absolute Energy = (2010 Energy Intensity x 2014 # of packages) — (2014 Energy Intensity x 2014 # of packages)
International Package: Absolute Energy Avoided Contributing factors/initiatives: Miscellaneous initiatives in our airline, including, lower flight speeds, computer-optimized flight plans, single-engine taxi. See ‘Air Fleet Efficiencies’, pages 60-61, for more details.
8,624,478(1) 86.69 99.34 1) Energy Intensity factor expressed in gigajoules per 1,000 Packages
2) Scope is international Package Operations
3) Includes all direct and indirect energy usage for this specific business segment
4) Avoided Absolute Energy = (2010 Energy Intensity x 2014 # of packages) — (2014 Energy Intensity x 2014 # of packages)
Global Supply Chain & Freight: Absolute Energy Avoided Contributing factors/initiatives: Implementation of telematics, improved dispatching of drivers, consolidation of shipments, loading efficiency in ways that keep miles driven to a minimum.
3,666,353(1) 1.19 1.50 1) Energy Intensity factor expressed in gigajoules per 1,000 lbs of freight hauled
2) Scope is Global Supply Chain & Freight Operations
3) Includes all direct and indirect energy usage for this specific business segment
4) Avoided Absolute Energy = (2010 Energy Intensity x 2014 lbs of freight) — (2014 Energy Intensity x 2014 lbs of freight)
Total 21,756,979 gigajoules
(1) Absolute energy avoided in 2014 was estimated from the energy intensity factor improvements from 2010 (baseline year) to 2014
Appendix E
124
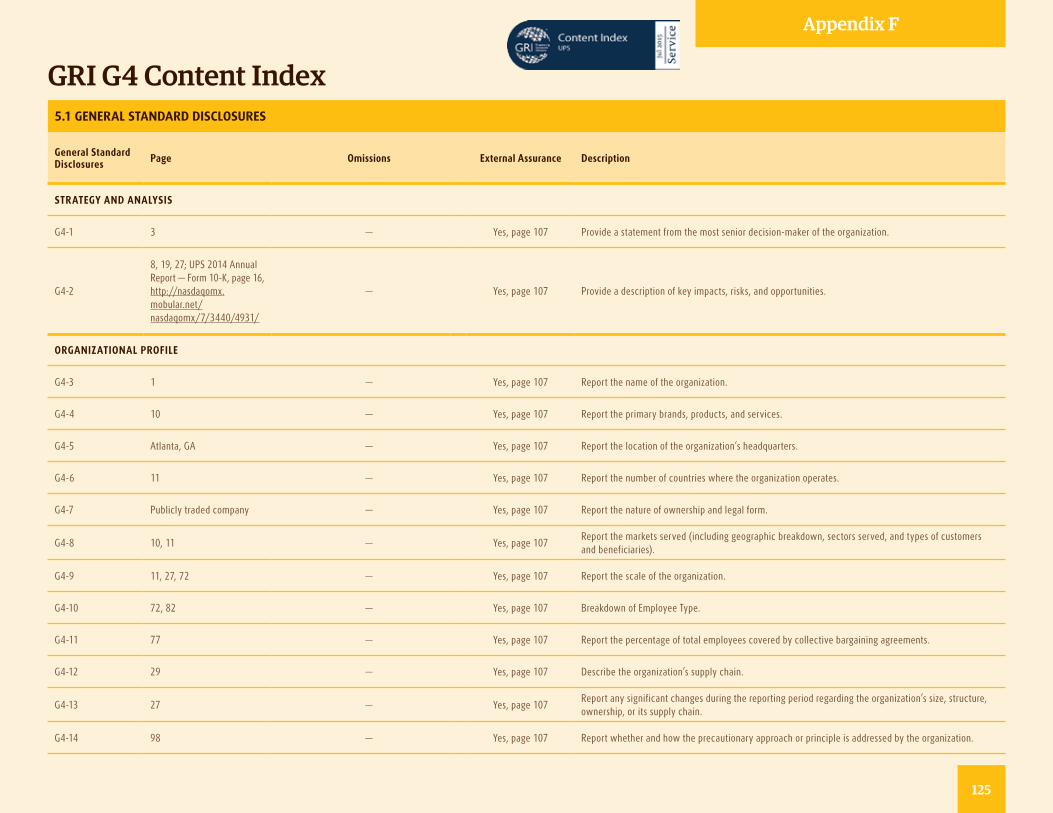
GRI G4 Content Index5.1 GENERAL STANDARD DISCLOSURES
General Standard Disclosures Page Omissions External Assurance Description
STRATEGY AND ANALYSIS
G4-1 3 — Yes, page 107 Provide a statement from the most senior decision-maker of the organization.
G4-2
8, 19, 27; UPS 2014 Annual Report — Form 10-K, page 16,http://nasdaqomx.mobular.net/nasdaqomx/7/3440/4931/
— Yes, page 107 Provide a description of key impacts, risks, and opportunities.
ORGANIZATIONAL PROFILE
G4-3 1 — Yes, page 107 Report the name of the organization.
G4-4 10 — Yes, page 107 Report the primary brands, products, and services.
G4-5 Atlanta, GA — Yes, page 107 Report the location of the organization’s headquarters.
G4-6 11 — Yes, page 107 Report the number of countries where the organization operates.
G4-7 Publicly traded company — Yes, page 107 Report the nature of ownership and legal form.
G4-8 10, 11 — Yes, page 107Report the markets served (including geographic breakdown, sectors served, and types of customers and beneficiaries).
G4-9 11, 27, 72 — Yes, page 107 Report the scale of the organization.
G4-10 72, 82 — Yes, page 107 Breakdown of Employee Type.
G4-11 77 — Yes, page 107 Report the percentage of total employees covered by collective bargaining agreements.
G4-12 29 — Yes, page 107 Describe the organization’s supply chain.
G4-13 27 — Yes, page 107Report any significant changes during the reporting period regarding the organization’s size, structure, ownership, or its supply chain.
G4-14 98 — Yes, page 107 Report whether and how the precautionary approach or principle is addressed by the organization.
125
Appendix F
125
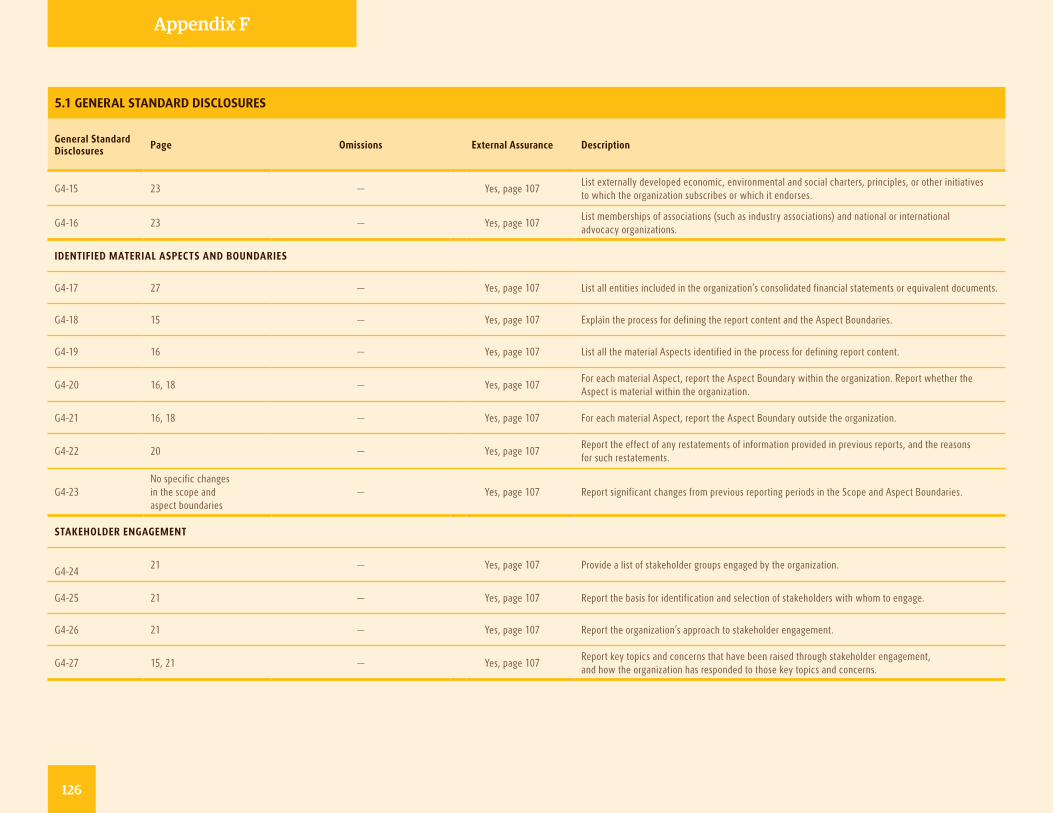
5.1 GENERAL STANDARD DISCLOSURES
General Standard Disclosures Page Omissions External Assurance Description
G4-15 23 — Yes, page 107List externally developed economic, environmental and social charters, principles, or other initiatives to which the organization subscribes or which it endorses.
G4-16 23 — Yes, page 107List memberships of associations (such as industry associations) and national or international advocacy organizations.
IDENTIFIED MATERIAL ASPECTS AND BOUNDARIES
G4-17 27 — Yes, page 107 List all entities included in the organization’s consolidated financial statements or equivalent documents.
G4-18 15 — Yes, page 107 Explain the process for defining the report content and the Aspect Boundaries.
G4-19 16 — Yes, page 107 List all the material Aspects identified in the process for defining report content.
G4-20 16, 18 — Yes, page 107For each material Aspect, report the Aspect Boundary within the organization. Report whether the Aspect is material within the organization.
G4-21 16, 18 — Yes, page 107 For each material Aspect, report the Aspect Boundary outside the organization.
G4-22 20 — Yes, page 107Report the effect of any restatements of information provided in previous reports, and the reasons for such restatements.
G4-23No specific changes in the scope and aspect boundaries
— Yes, page 107 Report significant changes from previous reporting periods in the Scope and Aspect Boundaries.
STAKEHOLDER ENGAGEMENT
G4-24
21 — Yes, page 107 Provide a list of stakeholder groups engaged by the organization.
G4-25 21 — Yes, page 107 Report the basis for identification and selection of stakeholders with whom to engage.
G4-26 21 — Yes, page 107 Report the organization’s approach to stakeholder engagement.
G4-27 15, 21 — Yes, page 107Report key topics and concerns that have been raised through stakeholder engagement, and how the organization has responded to those key topics and concerns.
126
Appendix F
126
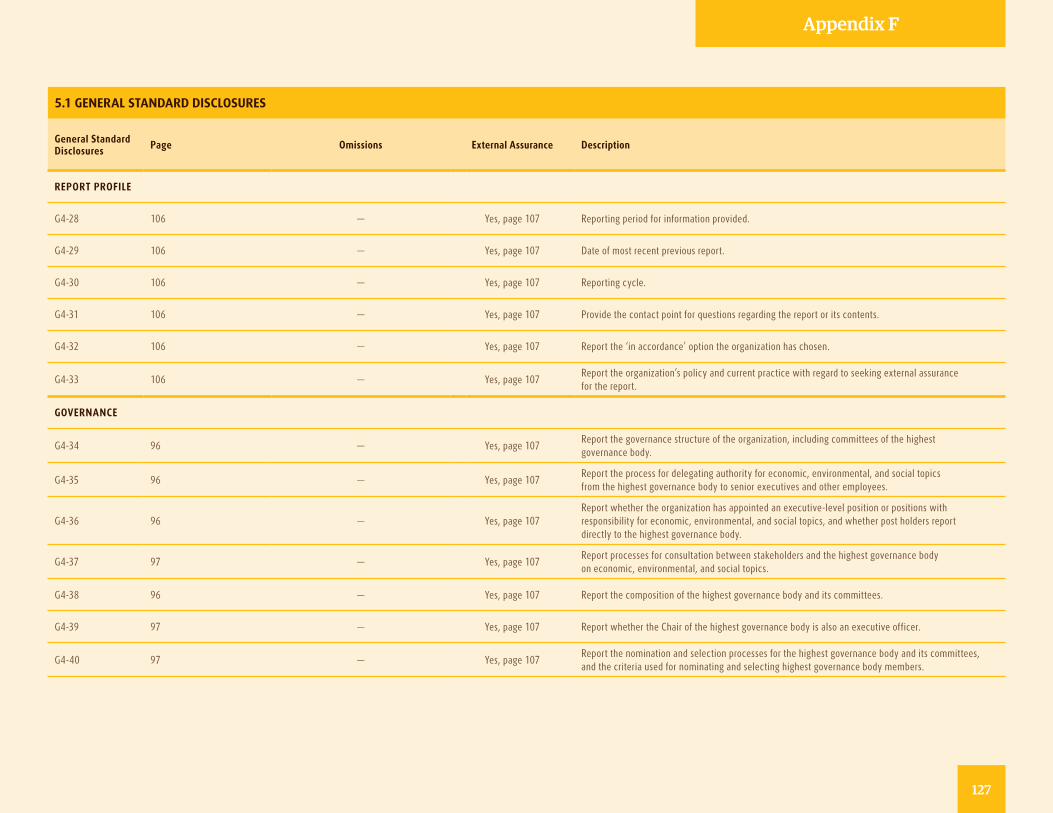
5.1 GENERAL STANDARD DISCLOSURES
General Standard Disclosures Page Omissions External Assurance Description
REPORT PROFILE
G4-28 106 — Yes, page 107 Reporting period for information provided.
G4-29 106 — Yes, page 107 Date of most recent previous report.
G4-30 106 — Yes, page 107 Reporting cycle.
G4-31 106 — Yes, page 107 Provide the contact point for questions regarding the report or its contents.
G4-32 106 — Yes, page 107 Report the ‘in accordance’ option the organization has chosen.
G4-33 106 — Yes, page 107Report the organization’s policy and current practice with regard to seeking external assurance for the report.
GOVERNANCE
G4-34 96 — Yes, page 107Report the governance structure of the organization, including committees of the highest governance body.
G4-35 96 — Yes, page 107Report the process for delegating authority for economic, environmental, and social topics from the highest governance body to senior executives and other employees.
G4-36 96 — Yes, page 107Report whether the organization has appointed an executive-level position or positions with responsibility for economic, environmental, and social topics, and whether post holders report directly to the highest governance body.
G4-37 97 — Yes, page 107Report processes for consultation between stakeholders and the highest governance body on economic, environmental, and social topics.
G4-38 96 — Yes, page 107 Report the composition of the highest governance body and its committees.
G4-39 97 — Yes, page 107 Report whether the Chair of the highest governance body is also an executive officer.
G4-40 97 — Yes, page 107Report the nomination and selection processes for the highest governance body and its committees, and the criteria used for nominating and selecting highest governance body members.
Appendix F
127
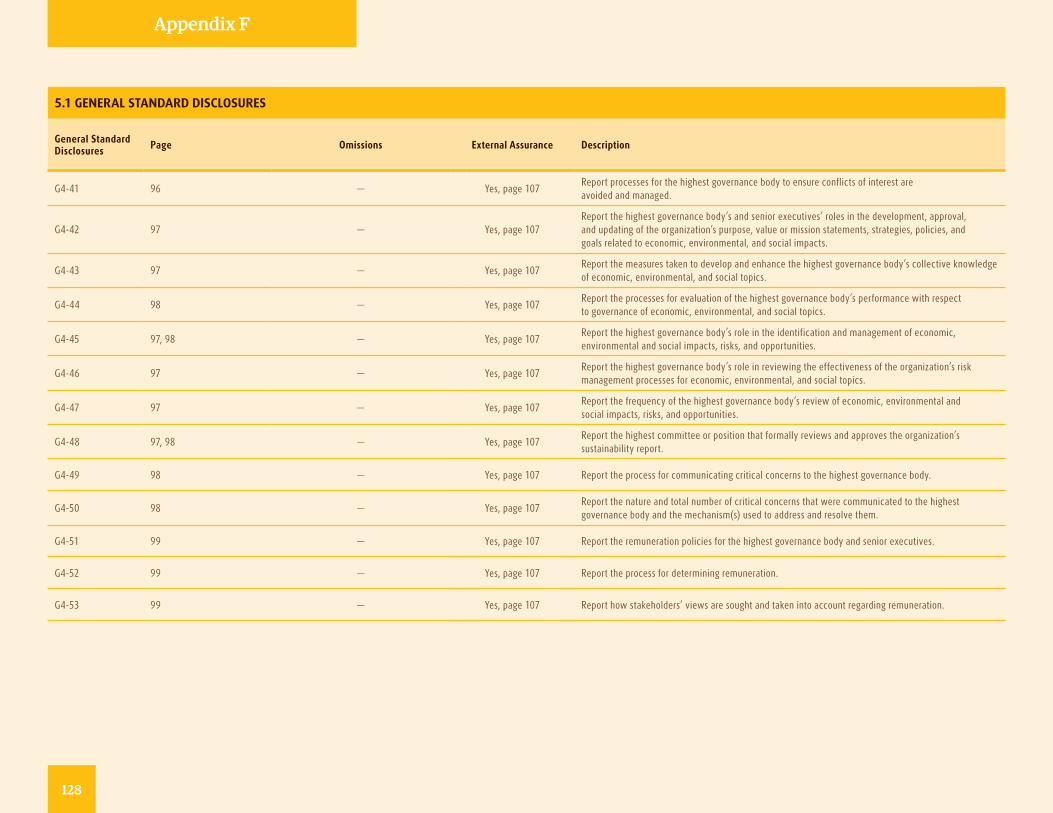
5.1 GENERAL STANDARD DISCLOSURES
General Standard Disclosures Page Omissions External Assurance Description
G4-41 96 — Yes, page 107Report processes for the highest governance body to ensure conflicts of interest are avoided and managed.
G4-42 97 — Yes, page 107Report the highest governance body’s and senior executives’ roles in the development, approval, and updating of the organization’s purpose, value or mission statements, strategies, policies, and goals related to economic, environmental, and social impacts.
G4-43 97 — Yes, page 107Report the measures taken to develop and enhance the highest governance body’s collective knowledge of economic, environmental, and social topics.
G4-44 98 — Yes, page 107Report the processes for evaluation of the highest governance body’s performance with respect to governance of economic, environmental, and social topics.
G4-45 97, 98 — Yes, page 107Report the highest governance body’s role in the identification and management of economic, environmental and social impacts, risks, and opportunities.
G4-46 97 — Yes, page 107Report the highest governance body’s role in reviewing the effectiveness of the organization’s risk management processes for economic, environmental, and social topics.
G4-47 97 — Yes, page 107Report the frequency of the highest governance body’s review of economic, environmental and social impacts, risks, and opportunities.
G4-48 97, 98 — Yes, page 107Report the highest committee or position that formally reviews and approves the organization’s sustainability report.
G4-49 98 — Yes, page 107 Report the process for communicating critical concerns to the highest governance body.
G4-50 98 — Yes, page 107Report the nature and total number of critical concerns that were communicated to the highest governance body and the mechanism(s) used to address and resolve them.
G4-51 99 — Yes, page 107 Report the remuneration policies for the highest governance body and senior executives.
G4-52 99 — Yes, page 107 Report the process for determining remuneration.
G4-53 99 — Yes, page 107 Report how stakeholders’ views are sought and taken into account regarding remuneration.
Appendix F
128
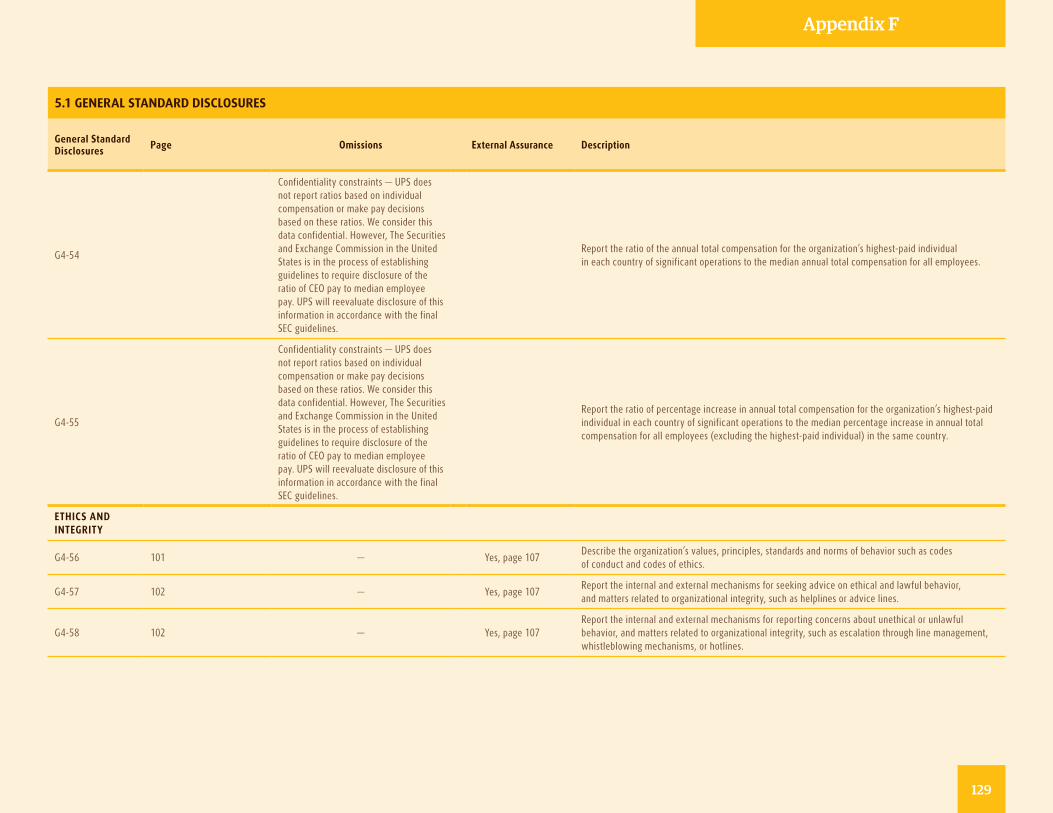
5.1 GENERAL STANDARD DISCLOSURES
General Standard Disclosures Page Omissions External Assurance Description
G4-54
Confidentiality constraints — UPS does not report ratios based on individual compensation or make pay decisionsbased on these ratios. We consider this data confidential. However, The Securities and Exchange Commission in the United States is in the process of establishing guidelines to require disclosure of the ratio of CEO pay to median employee pay. UPS will reevaluate disclosure of this information in accordance with the final SEC guidelines.
Report the ratio of the annual total compensation for the organization’s highest-paid individual in each country of significant operations to the median annual total compensation for all employees.
G4-55
Confidentiality constraints — UPS does not report ratios based on individual compensation or make pay decisionsbased on these ratios. We consider this data confidential. However, The Securities and Exchange Commission in the United States is in the process of establishing guidelines to require disclosure of the ratio of CEO pay to median employee pay. UPS will reevaluate disclosure of this information in accordance with the final SEC guidelines.
Report the ratio of percentage increase in annual total compensation for the organization’s highest-paid individual in each country of significant operations to the median percentage increase in annual total compensation for all employees (excluding the highest-paid individual) in the same country.
ETHICS AND INTEGRITY
G4-56 101 — Yes, page 107Describe the organization’s values, principles, standards and norms of behavior such as codes of conduct and codes of ethics.
G4-57 102 — Yes, page 107Report the internal and external mechanisms for seeking advice on ethical and lawful behavior, and matters related to organizational integrity, such as helplines or advice lines.
G4-58 102 — Yes, page 107Report the internal and external mechanisms for reporting concerns about unethical or unlawful behavior, and matters related to organizational integrity, such as escalation through line management, whistleblowing mechanisms, or hotlines.
Appendix F
129
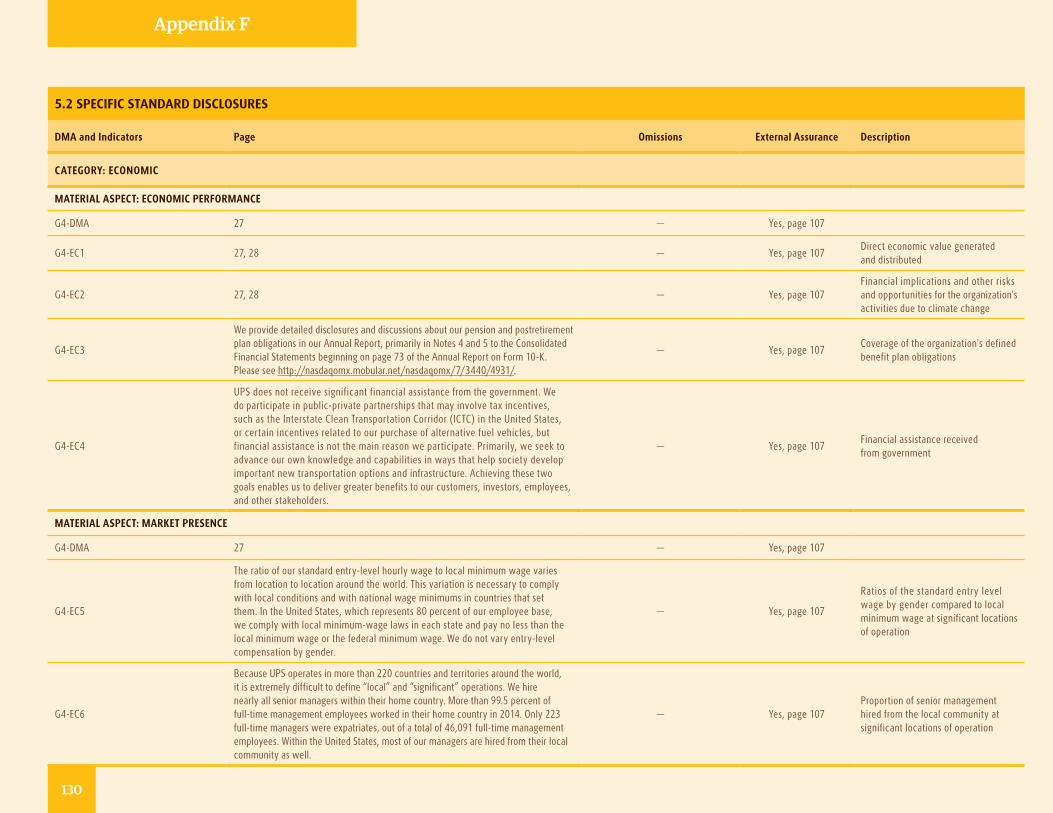
5.2 SPECIFIC STANDARD DISCLOSURES
DMA and Indicators Page Omissions External Assurance Description
CATEGORY: ECONOMIC
MATERIAL ASPECT: ECONOMIC PERFORMANCE
G4-DMA 27 — Yes, page 107
G4-EC1 27, 28 — Yes, page 107Direct economic value generated and distributed
G4-EC2 27, 28 — Yes, page 107Financial implications and other risks and opportunities for the organization's activities due to climate change
G4-EC3
We provide detailed disclosures and discussions about our pension and postretirement plan obligations in our Annual Report, primarily in Notes 4 and 5 to the Consolidated Financial Statements beginning on page 73 of the Annual Report on Form 10-K.Please see http://nasdaqomx.mobular.net/nasdaqomx/7/3440/4931/.
— Yes, page 107Coverage of the organization's defined benefit plan obligations
G4-EC4
UPS does not receive significant financial assistance from the government. We do participate in public-private partnerships that may involve tax incentives, such as the Interstate Clean Transportation Corridor (ICTC) in the United States, or certain incentives related to our purchase of alternative fuel vehicles, but financial assistance is not the main reason we participate. Primarily, we seek to advance our own knowledge and capabilities in ways that help society develop important new transportation options and infrastructure. Achieving these two goals enables us to deliver greater benefits to our customers, investors, employees, and other stakeholders.
— Yes, page 107Financial assistance received from government
MATERIAL ASPECT: MARKET PRESENCE
G4-DMA 27 — Yes, page 107
G4-EC5
The ratio of our standard entry-level hourly wage to local minimum wage varies from location to location around the world. This variation is necessary to comply with local conditions and with national wage minimums in countries that set them. In the United States, which represents 80 percent of our employee base, we comply with local minimum-wage laws in each state and pay no less than the local minimum wage or the federal minimum wage. We do not vary entry-level compensation by gender.
— Yes, page 107
Ratios of the standard entry level wage by gender compared to local minimum wage at significant locations of operation
G4-EC6
Because UPS operates in more than 220 countries and territories around the world, it is extremely difficult to define “local” and “significant” operations. We hire nearly all senior managers within their home country. More than 99.5 percent of full-time management employees worked in their home country in 2014. Only 223 full-time managers were expatriates, out of a total of 46,091 full-time management employees. Within the United States, most of our managers are hired from their local community as well.
— Yes, page 107Proportion of senior management hired from the local community at significant locations of operation
Appendix F
130

5.2 SPECIFIC STANDARD DISCLOSURES
DMA and Indicators Page Omissions External Assurance Description
MATERIAL ASPECT: INDIRECT ECONOMIC IMPACTS
G4-DMA 27, 37 — Yes, page 107
G4-EC7 28, 37 — Yes, page 107Development and impact of infrastructure investments and services supported
G4-EC8 28, 37 — Yes, page 107Significant indirect economic impacts, including the extent of impacts
MATERIAL ASPECT: PROCUREMENT PRACTICES
G4-DMA 29 — Yes, page 107
G4-EC9 29 — Yes, page 107Proportion of spending on local suppliers at significant locations of operation
CATEGORY: ENVIRONMENTAL
MATERIAL ASPECT: ENERGY
G4-DMA 52 — Yes, page 107
G4-EN3 122 — Yes, page 107Energy consumption within the organization
G4-EN4
Currently unavailable — UPS is developing the necessary reporting capability and intends to report this indicator in 2017.
Energy consumption outside the organization
G4-EN5 122 — Yes, page 107 Energy intensity
G4-EN6 122 — Yes, page 107 Reduction of energy consumption
G4-EN7 122 — Yes, page 107Reductions in energy requirements of products and services
Appendix F
131
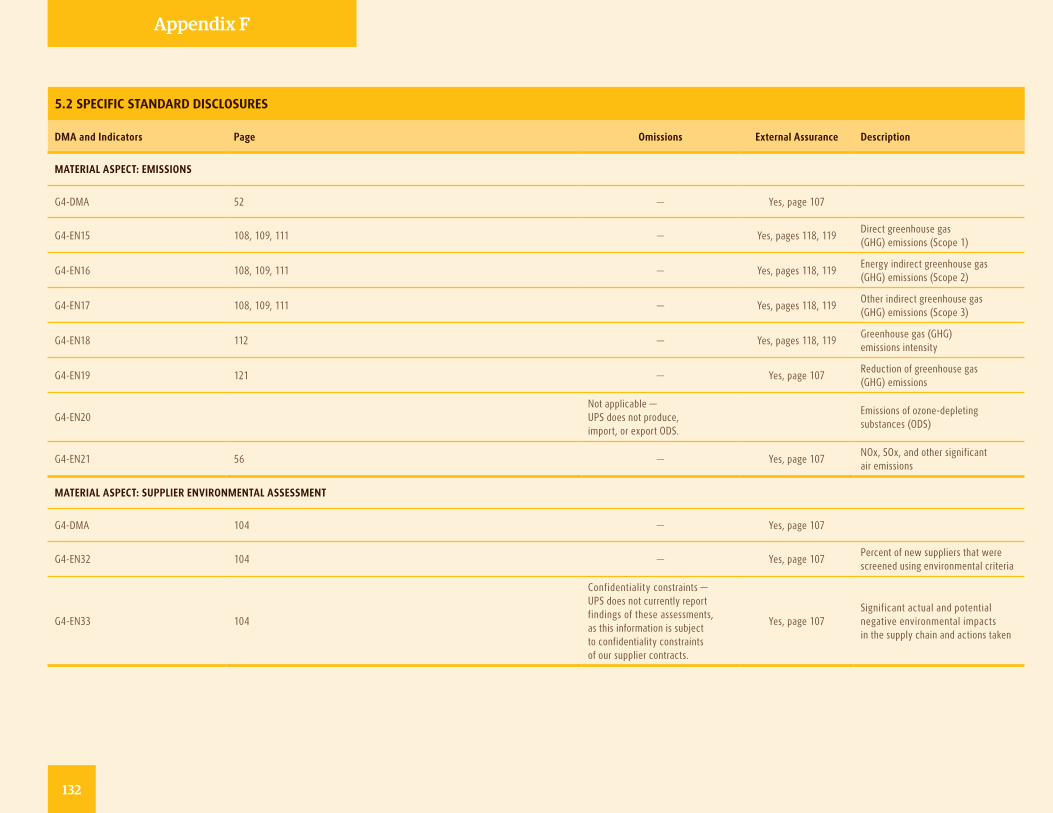
5.2 SPECIFIC STANDARD DISCLOSURES
DMA and Indicators Page Omissions External Assurance Description
MATERIAL ASPECT: EMISSIONS
G4-DMA 52 — Yes, page 107
G4-EN15 108, 109, 111 — Yes, pages 118, 119Direct greenhouse gas (GHG) emissions (Scope 1)
G4-EN16 108, 109, 111 — Yes, pages 118, 119Energy indirect greenhouse gas (GHG) emissions (Scope 2)
G4-EN17 108, 109, 111 — Yes, pages 118, 119Other indirect greenhouse gas (GHG) emissions (Scope 3)
G4-EN18 112 — Yes, pages 118, 119Greenhouse gas (GHG) emissions intensity
G4-EN19 121 — Yes, page 107Reduction of greenhouse gas (GHG) emissions
G4-EN20 Not applicable — UPS does not produce,import, or export ODS.
Emissions of ozone-depleting substances (ODS)
G4-EN21 56 — Yes, page 107NOx, SOx, and other significant air emissions
MATERIAL ASPECT: SUPPLIER ENVIRONMENTAL ASSESSMENT
G4-DMA 104 — Yes, page 107
G4-EN32 104 — Yes, page 107Percent of new suppliers that were screened using environmental criteria
G4-EN33 104
Confidentiality constraints — UPS does not currently report findings of these assessments, as this information is subject to confidentiality constraints of our supplier contracts.
Yes, page 107Significant actual and potential negative environmental impacts in the supply chain and actions taken
Appendix F
132
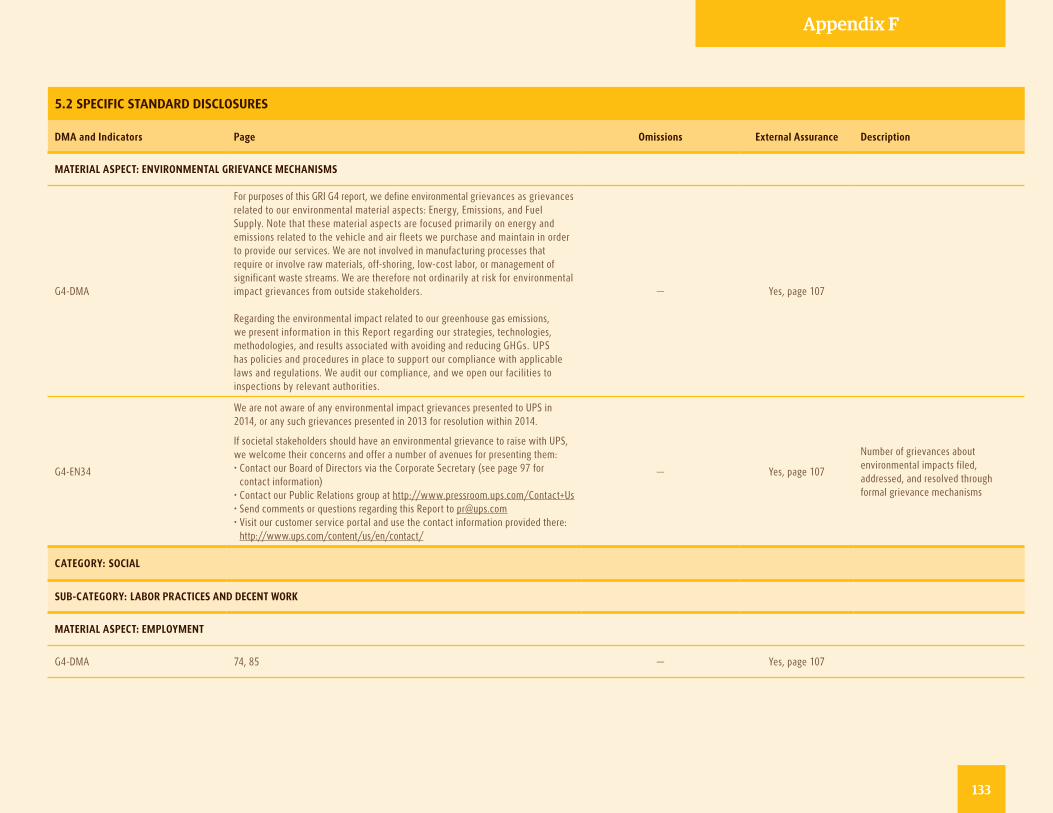
5.2 SPECIFIC STANDARD DISCLOSURES
DMA and Indicators Page Omissions External Assurance Description
MATERIAL ASPECT: ENVIRONMENTAL GRIEVANCE MECHANISMS
G4-DMA
For purposes of this GRI G4 report, we define environmental grievances as grievances related to our environmental material aspects: Energy, Emissions, and Fuel Supply. Note that these material aspects are focused primarily on energy and emissions related to the vehicle and air fleets we purchase and maintain in order to provide our services. We are not involved in manufacturing processes that require or involve raw materials, off-shoring, low-cost labor, or management of significant waste streams. We are therefore not ordinarily at risk for environmental impact grievances from outside stakeholders.
Regarding the environmental impact related to our greenhouse gas emissions, we present information in this Report regarding our strategies, technologies, methodologies, and results associated with avoiding and reducing GHGs. UPS has policies and procedures in place to support our compliance with applicable laws and regulations. We audit our compliance, and we open our facilities to inspections by relevant authorities.
— Yes, page 107
G4-EN34
We are not aware of any environmental impact grievances presented to UPS in 2014, or any such grievances presented in 2013 for resolution within 2014.
If societal stakeholders should have an environmental grievance to raise with UPS, we welcome their concerns and offer a number of avenues for presenting them:• Contact our Board of Directors via the Corporate Secretary (see page 97 for
contact information)• Contact our Public Relations group at http://www.pressroom.ups.com/Contact+Us • Send comments or questions regarding this Report to [email protected]• Visit our customer service portal and use the contact information provided there:
http://www.ups.com/content/us/en/contact/
— Yes, page 107
Number of grievances about environmental impacts filed, addressed, and resolved through formal grievance mechanisms
CATEGORY: SOCIAL
SUB-CATEGORY: LABOR PRACTICES AND DECENT WORK
MATERIAL ASPECT: EMPLOYMENT
G4-DMA 74, 85 — Yes, page 107
133
Appendix F
133
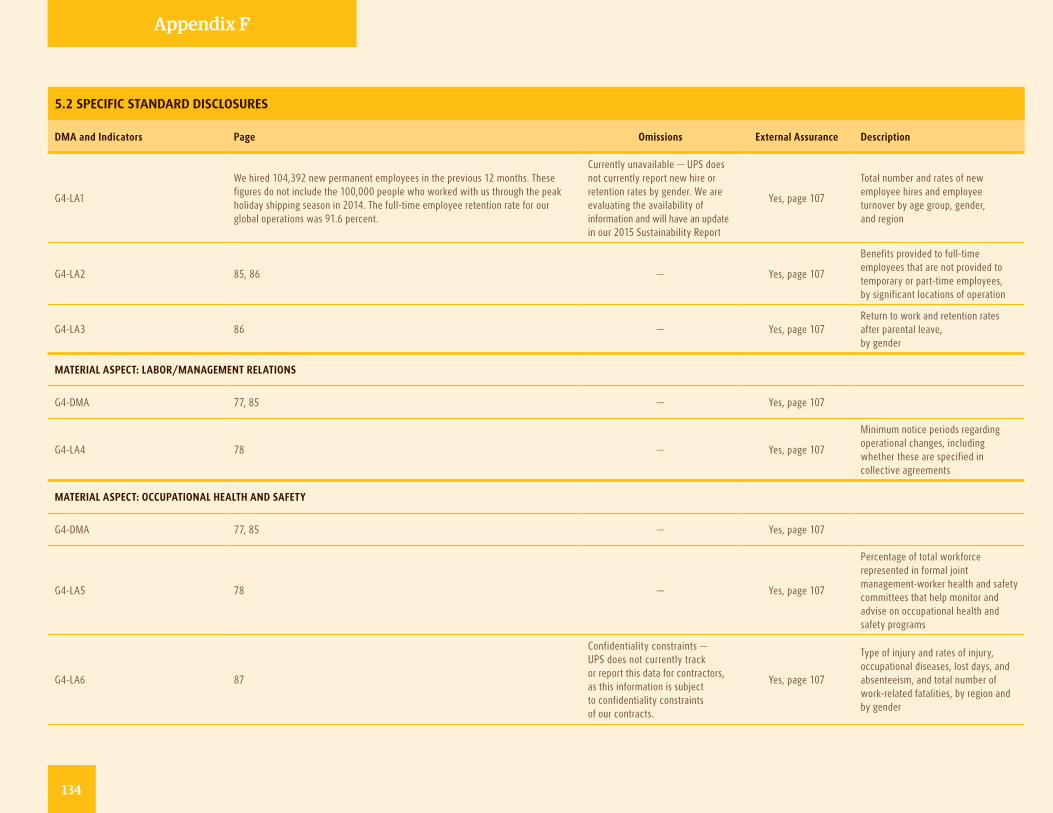
5.2 SPECIFIC STANDARD DISCLOSURES
DMA and Indicators Page Omissions External Assurance Description
G4-LA1
We hired 104,392 new permanent employees in the previous 12 months. These figures do not include the 100,000 people who worked with us through the peak holiday shipping season in 2014. The full-time employee retention rate for our global operations was 91.6 percent.
Currently unavailable — UPS does not currently report new hire or retention rates by gender. We are evaluating the availability of information and will have an update in our 2015 Sustainability Report
Yes, page 107
Total number and rates of new employee hires and employee turnover by age group, gender, and region
G4-LA2 85, 86 — Yes, page 107
Benefits provided to full-time employees that are not provided to temporary or part-time employees, by significant locations of operation
G4-LA3 86 — Yes, page 107Return to work and retention rates after parental leave, by gender
MATERIAL ASPECT: LABOR/MANAGEMENT RELATIONS
G4-DMA 77, 85 — Yes, page 107
G4-LA4 78 — Yes, page 107
Minimum notice periods regarding operational changes, including whether these are specified in collective agreements
MATERIAL ASPECT: OCCUPATIONAL HEALTH AND SAFETY
G4-DMA 77, 85 — Yes, page 107
G4-LA5 78 — Yes, page 107
Percentage of total workforce represented in formal joint management-worker health and safety committees that help monitor and advise on occupational health and safety programs
G4-LA6 87
Confidentiality constraints — UPS does not currently track or report this data for contractors, as this information is subject to confidentiality constraints of our contracts.
Yes, page 107
Type of injury and rates of injury, occupational diseases, lost days, and absenteeism, and total number of work-related fatalities, by region and by gender
Appendix F
134
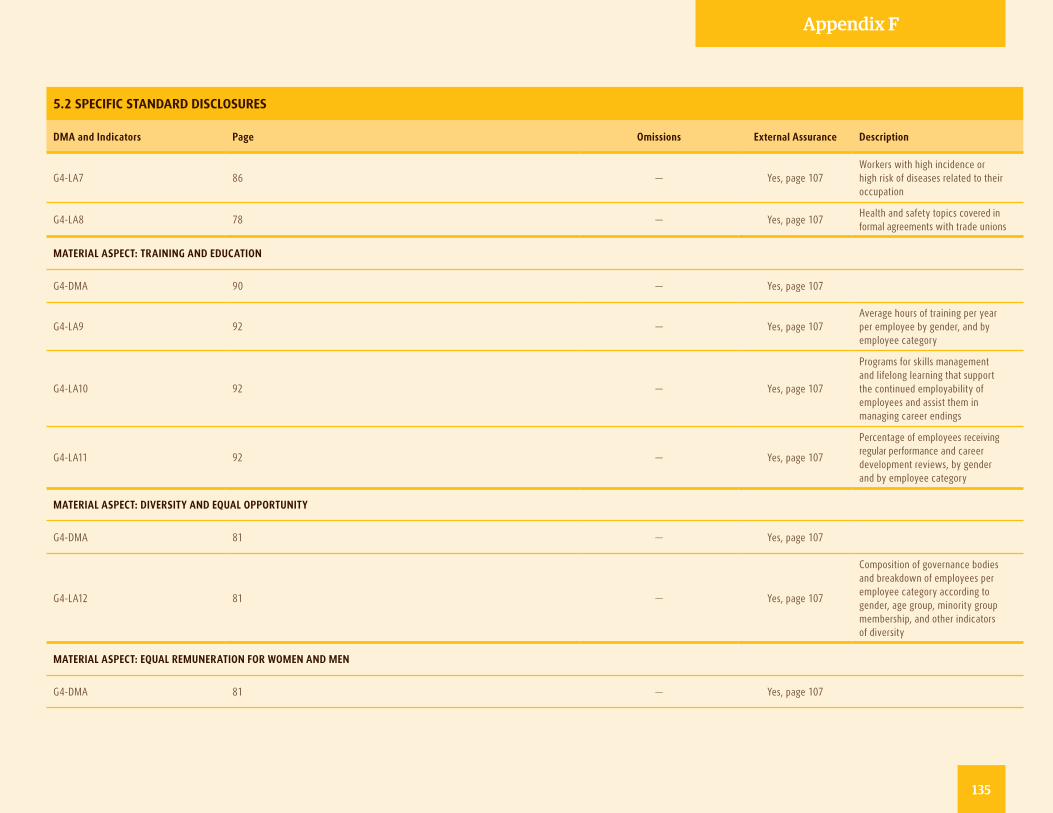
5.2 SPECIFIC STANDARD DISCLOSURES
DMA and Indicators Page Omissions External Assurance Description
G4-LA7 86 — Yes, page 107Workers with high incidence or high risk of diseases related to their occupation
G4-LA8 78 — Yes, page 107Health and safety topics covered in formal agreements with trade unions
MATERIAL ASPECT: TRAINING AND EDUCATION
G4-DMA 90 — Yes, page 107
G4-LA9 92 — Yes, page 107Average hours of training per year per employee by gender, and by employee category
G4-LA10 92 — Yes, page 107
Programs for skills management and lifelong learning that support the continued employability of employees and assist them in managing career endings
G4-LA11 92 — Yes, page 107
Percentage of employees receiving regular performance and career development reviews, by gender and by employee category
MATERIAL ASPECT: DIVERSITY AND EQUAL OPPORTUNITY
G4-DMA 81 — Yes, page 107
G4-LA12 81 — Yes, page 107
Composition of governance bodies and breakdown of employees per employee category according to gender, age group, minority group membership, and other indicators of diversity
MATERIAL ASPECT: EQUAL REMUNERATION FOR WOMEN AND MEN
G4-DMA 81 — Yes, page 107
135
Appendix F
135
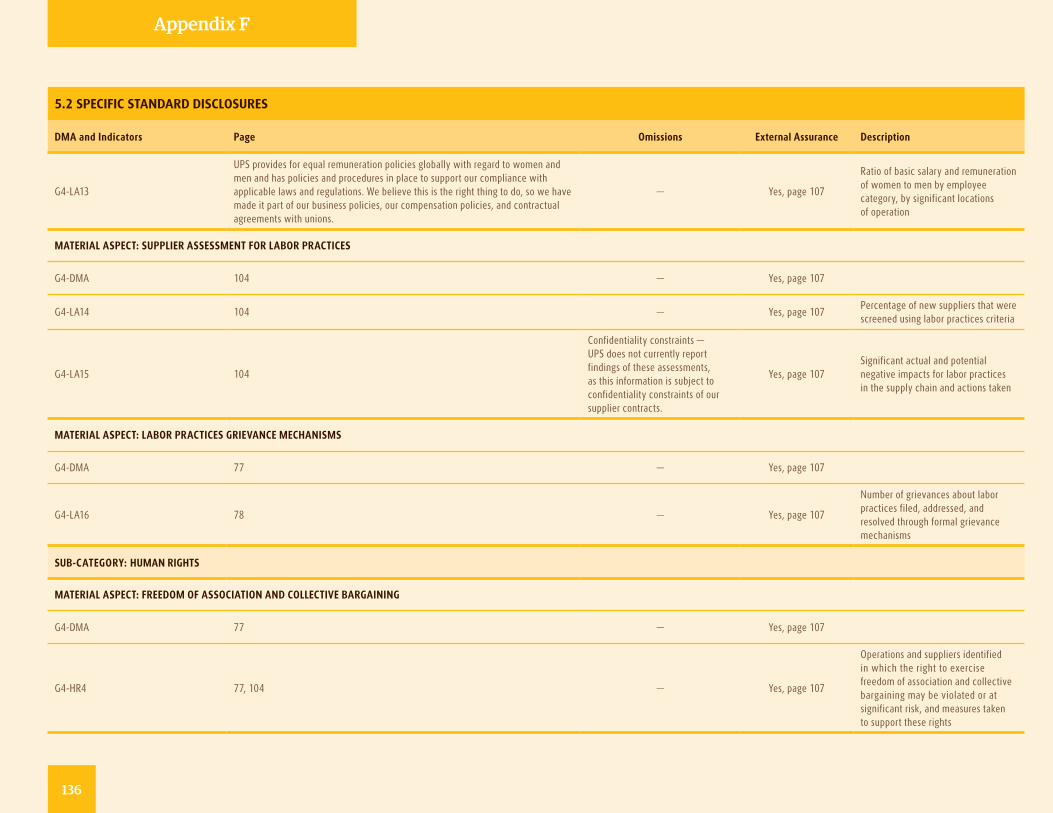
5.2 SPECIFIC STANDARD DISCLOSURES
DMA and Indicators Page Omissions External Assurance Description
G4-LA13
UPS provides for equal remuneration policies globally with regard to women and men and has policies and procedures in place to support our compliance with applicable laws and regulations. We believe this is the right thing to do, so we have made it part of our business policies, our compensation policies, and contractual agreements with unions.
— Yes, page 107
Ratio of basic salary and remuneration of women to men by employee category, by significant locations of operation
MATERIAL ASPECT: SUPPLIER ASSESSMENT FOR LABOR PRACTICES
G4-DMA 104 — Yes, page 107
G4-LA14 104 — Yes, page 107Percentage of new suppliers that were screened using labor practices criteria
G4-LA15 104
Confidentiality constraints — UPS does not currently report findings of these assessments, as this information is subject to confidentiality constraints of our supplier contracts.
Yes, page 107Significant actual and potential negative impacts for labor practices in the supply chain and actions taken
MATERIAL ASPECT: LABOR PRACTICES GRIEVANCE MECHANISMS
G4-DMA 77 — Yes, page 107
G4-LA16 78 — Yes, page 107
Number of grievances about labor practices filed, addressed, and resolved through formal grievance mechanisms
SUB-CATEGORY: HUMAN RIGHTS
MATERIAL ASPECT: FREEDOM OF ASSOCIATION AND COLLECTIVE BARGAINING
G4-DMA 77 — Yes, page 107
G4-HR4 77, 104 — Yes, page 107
Operations and suppliers identified in which the right to exercise freedom of association and collective bargaining may be violated or at significant risk, and measures taken to support these rights
Appendix F
136
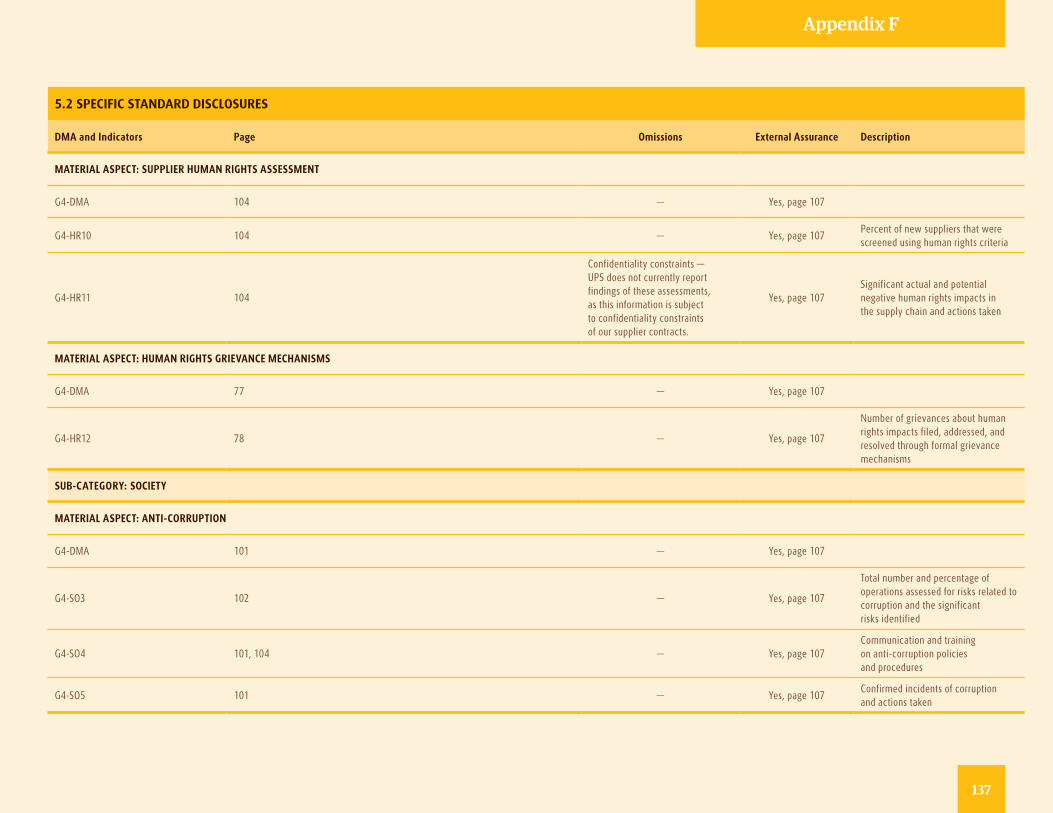
5.2 SPECIFIC STANDARD DISCLOSURES
DMA and Indicators Page Omissions External Assurance Description
MATERIAL ASPECT: SUPPLIER HUMAN RIGHTS ASSESSMENT
G4-DMA 104 — Yes, page 107
G4-HR10 104 — Yes, page 107Percent of new suppliers that were screened using human rights criteria
G4-HR11 104
Confidentiality constraints — UPS does not currently report findings of these assessments, as this information is subject to confidentiality constraints of our supplier contracts.
Yes, page 107Significant actual and potential negative human rights impacts in the supply chain and actions taken
MATERIAL ASPECT: HUMAN RIGHTS GRIEVANCE MECHANISMS
G4-DMA 77 — Yes, page 107
G4-HR12 78 — Yes, page 107
Number of grievances about human rights impacts filed, addressed, and resolved through formal grievance mechanisms
SUB-CATEGORY: SOCIETY
MATERIAL ASPECT: ANTI-CORRUPTION
G4-DMA 101 — Yes, page 107
G4-SO3 102 — Yes, page 107
Total number and percentage of operations assessed for risks related to corruption and the significant risks identified
G4-SO4 101, 104 — Yes, page 107Communication and training on anti-corruption policies and procedures
G4-SO5 101 — Yes, page 107Confirmed incidents of corruption and actions taken
Appendix F
137
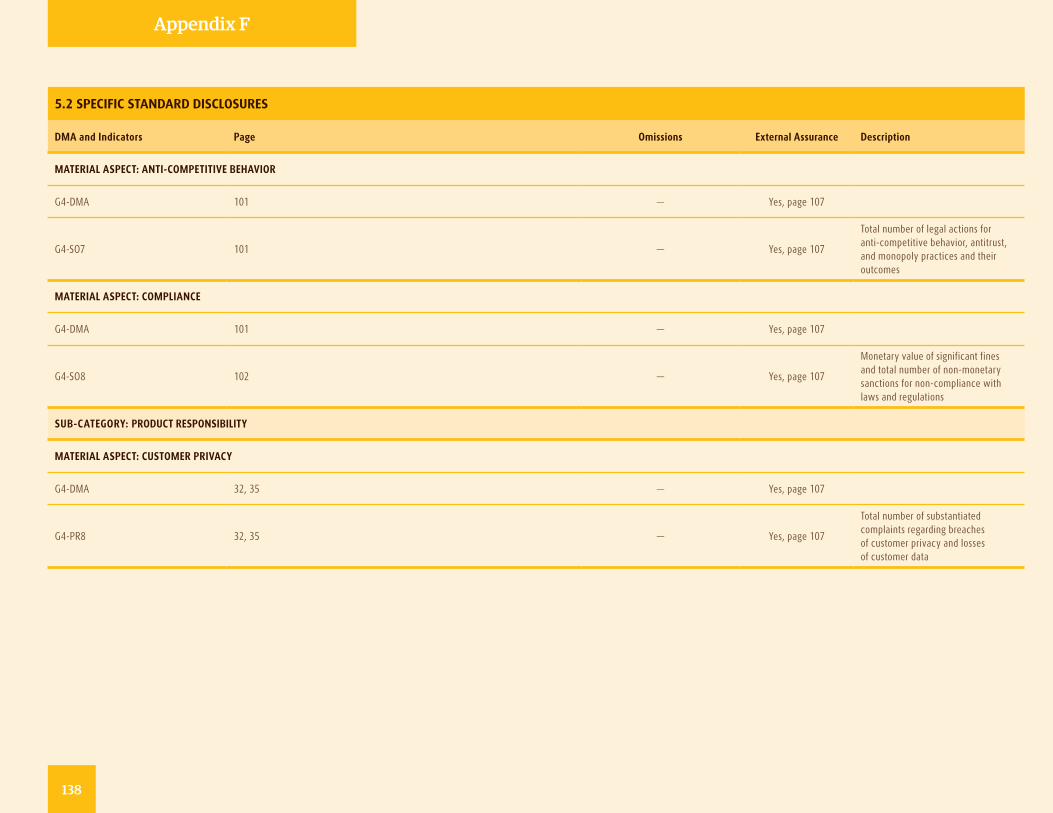
5.2 SPECIFIC STANDARD DISCLOSURES
DMA and Indicators Page Omissions External Assurance Description
MATERIAL ASPECT: ANTI-COMPETITIVE BEHAVIOR
G4-DMA 101 — Yes, page 107
G4-SO7 101 — Yes, page 107
Total number of legal actions for anti-competitive behavior, antitrust, and monopoly practices and their outcomes
MATERIAL ASPECT: COMPLIANCE
G4-DMA 101 — Yes, page 107
G4-SO8 102 — Yes, page 107
Monetary value of significant fines and total number of non-monetary sanctions for non-compliance with laws and regulations
SUB-CATEGORY: PRODUCT RESPONSIBILITY
MATERIAL ASPECT: CUSTOMER PRIVACY
G4-DMA 32, 35 — Yes, page 107
G4-PR8 32, 35 — Yes, page 107
Total number of substantiated complaints regarding breaches of customer privacy and losses of customer data
Appendix F
138

Committed to More™
UPS 2014 Corporate Sustainability Report
UPS55 Glenlake Parkway, NEAtlanta, GA 30328
ups.com/sustainability
© 2015 United Parcel Service of America, Inc. UPS, the UPS brandmark and the color brown are registered trademarks of United Parcel Service of America, Inc. All rights reserved.
UPS 2014 CORPO
RATE SUSTAINABILITY REPO
RT