Embed Size (px)
Citation preview
Satyam Agarwal ([email protected]); +91 22 3982 5410
Amit Shah ([email protected]) / Nirav Vasa ([email protected])
17 September 2014
Update | Sector: Capital Goods
BHEL CMP: INR220 TP: INR300 Buy
The Turn of the Tide Cyclical factors support recovery
Power segment BTB shows cyclical uptick; EPC pricing trends stabilize We expect Industry BTG project awards to improve from just ~6GW in FY14
to ~10-12GW pa during FY15-17E, leading to a 40% increase in BHEL’s power sector intake during FY15-17E (vs FY12-14 levels). For BHEL, power segment BTB declined from peak levels of 5.2x in 3QFY09 to 2.6x, and we expect the ratio to stabilize at ~ 3x by end FY15E. Our macro analysis suggests that normative industry ordering stands at ~20-24GW pa (power demand at 1.5BUs in FY19E). The journey from 6GW in FY14 to 10-12GW pa in FY15-17E and then at ~20-24GW pa provides interesting possibilities.
Recent pricing trends in EPC contracts suggest stabilization, albeit at lower levels. From a market structure that was threatened by: i) intense overseas competition ii) and, possibility of ~5-6 players in the domestic market, the BTG manufacturing sector has consolidated, with just ~3-4 serious players in Boilers / Turbines commissioning manufacturing facilities.
BHEL has expanded its offerings to capture a larger share in project execution. Cost structure has also been corrected given various initiatives, including achieving ~90% indigenization levels for supercritical boilers in the last tender (vs ~70% in bulk tender projects).
Strong operating leverage, cyclical factors support recovery BHEL is strongly exposed to cyclical factors: i) Contribution margins at ~42%
vs EBIDTA margin of 12% (adjusted) in FY14, leading to a meaningful operating leverage ii) Core NWC stable at 200 days; cyclical factors of Retention money (at 181 days in FY14 vs 55-60 days in FY07-09) and customer advances (deteriorated from 63% of revenues in FY09 to 38% in FY14) that impacted reported NWC are expected to normalize, as we expect BTB to increase from 2.6x currently to 3x in FY15.
We expect Operating Cash Flows to improve from average of ~INR20b in FY10-13 to INR77b in FY15/16E. Thus, net cash is likely to increase from INR92b in FY14 to INR252b in FY17E (~46% of current market cap). Even in FY14, operating cash flow had improved to INR54.2b vs INR24.4b in FY13.
BTB has inched up to 2.5x in FY14: a key trend driving cyclical factors We expect BHEL to report EPS of INR10.2 in FY15E/INR14.6 in FY16E /
INR19.5 in FY17E. At the CMP, the stock quotes at PER of 21.6x FY15E / 15.1x FY16 / 11.3x FY17E. We maintain Buy with a price target of INR300/sh (PER of 20x FY16E).
The key variable to watch out for is the impact of the Pay Commission (effective January 2017), and could be an important swing factor. Another important variable is the possible coal mine de-allocations.
BSE Sensex S&P CNX 26,631 7,976
Stock Info Bloomberg BHEL IN
Equity Shares (m) 2,447.6
52-Week Range (INR) 292/126
1, 6, 12 Rel. Per (%) 1/-6/19
M.Cap. (INR b) 538.1
M.Cap. (USD b) 8.8
Financial Snapshot (INR b) Y/E Mar 2015E 2016E 2017E Net Sales 326.2 360.4 403.5
EBITDA 33.9 46.2 61.3
Adj PAT 24.9 35.7 47.6
EPS (INR) 10.2 14.6 19.5
Gr. (%) -31 43 34
BV/Sh (INR) 143 154 169
RoE (%) 7.3 9.8 12.1
RoCE (%) 6.6 9.1 11.8
P/E (x) 21.6 15.1 11.3
P/BV (x) 1.5 1.4 1.3
Shareholding pattern % (Jun-14)
Jun-14 Mar-14 Jun-13
Promoter 63.1 63.1 67.7
DII 16.6 16.5 12.2
FII 15.9 16.1 15.0
Others 4.4 4.3 5.1 Notes: FII includes depository receipts
Stock Performance (1-year)
120
170
220
270
320
Sep-
13
Dec
-13
Mar
-14
Jun-
14
Sep-
14
BHEL Sensex - Rebased
Investors are advised to refer through disclosures made at the end of the Research Report.
BHEL
17 September 2014 2
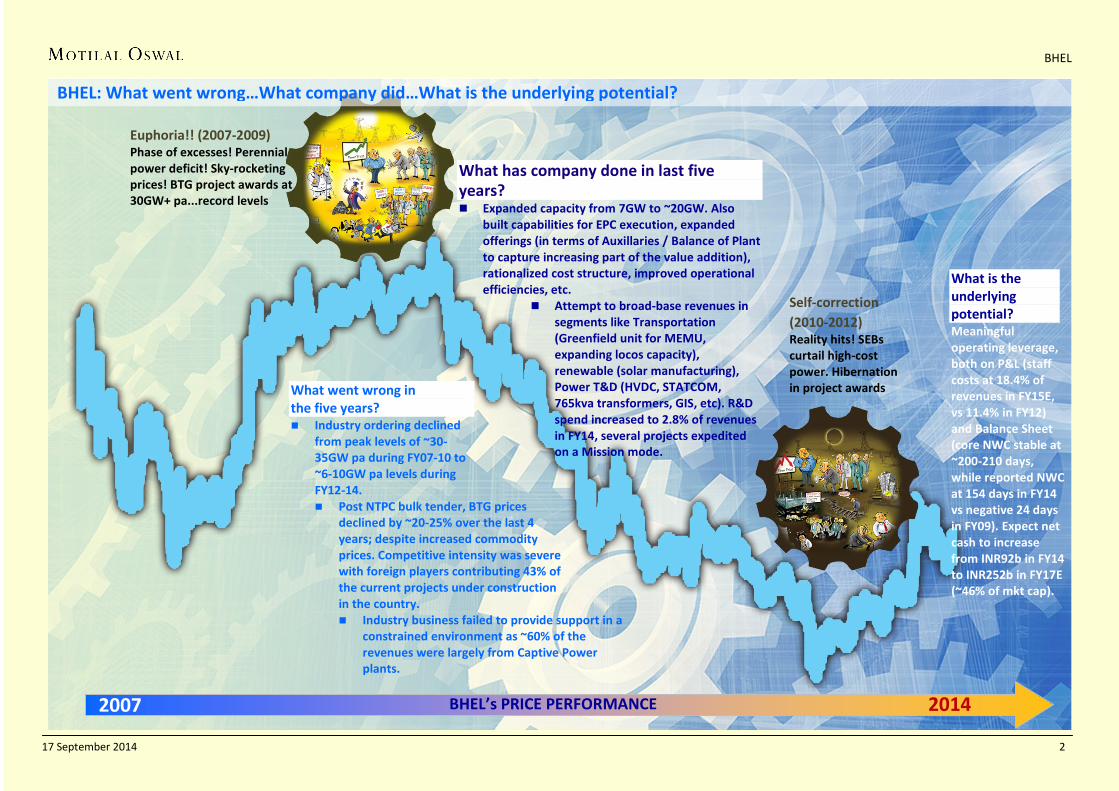
What went wrong in the five years? Industry ordering declined
from peak levels of ~30-35GW pa during FY07-10 to ~6-10GW pa levels during FY12-14. Post NTPC bulk tender, BTG prices
declined by ~20-25% over the last 4 years; despite increased commodity prices. Competitive intensity was severe with foreign players contributing 43% of the current projects under construction in the country. Industry business failed to provide support in a
constrained environment as ~60% of the revenues were largely from Captive Power plants.
What has company done in last five years? Expanded capacity from 7GW to ~20GW. Also
built capabilities for EPC execution, expanded offerings (in terms of Auxillaries / Balance of Plant to capture increasing part of the value addition), rationalized cost structure, improved operational efficiencies, etc.
Attempt to broad-base revenues in segments like Transportation (Greenfield unit for MEMU, expanding locos capacity), renewable (solar manufacturing), Power T&D (HVDC, STATCOM, 765kva transformers, GIS, etc). R&D spend increased to 2.8% of revenues in FY14, several projects expedited on a Mission mode.
What is the underlying potential? Meaningful operating leverage, both on P&L (staff costs at 18.4% of revenues in FY15E, vs 11.4% in FY12) and Balance Sheet (core NWC stable at ~200-210 days, while reported NWC at 154 days in FY14 vs negative 24 days in FY09). Expect net cash to increase from INR92b in FY14 to INR252b in FY17E (~46% of mkt cap).
Euphoria!! (2007-2009) Phase of excesses! Perennial power deficit! Sky-rocketing prices! BTG project awards at 30GW+ pa...record levels
Self-correction (2010-2012) Reality hits! SEBs curtail high-cost power. Hibernation in project awards
2007 2014 BHEL’s PRICE PERFORMANCE
BHEL: What went wrong…What company did…What is the underlying potential?
BHEL
17 September 2014 3
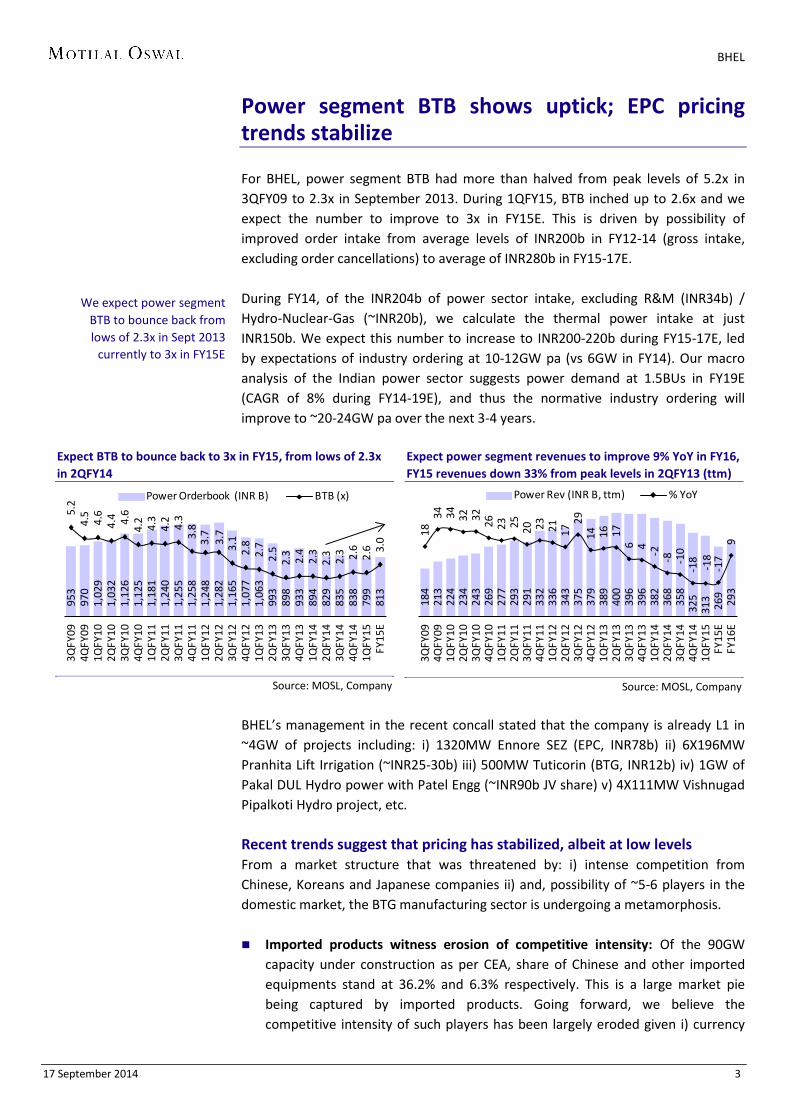
Power segment BTB shows uptick; EPC pricing trends stabilize For BHEL, power segment BTB had more than halved from peak levels of 5.2x in 3QFY09 to 2.3x in September 2013. During 1QFY15, BTB inched up to 2.6x and we expect the number to improve to 3x in FY15E. This is driven by possibility of improved order intake from average levels of INR200b in FY12-14 (gross intake, excluding order cancellations) to average of INR280b in FY15-17E. During FY14, of the INR204b of power sector intake, excluding R&M (INR34b) / Hydro-Nuclear-Gas (~INR20b), we calculate the thermal power intake at just INR150b. We expect this number to increase to INR200-220b during FY15-17E, led by expectations of industry ordering at 10-12GW pa (vs 6GW in FY14). Our macro analysis of the Indian power sector suggests power demand at 1.5BUs in FY19E (CAGR of 8% during FY14-19E), and thus the normative industry ordering will improve to ~20-24GW pa over the next 3-4 years.
Expect BTB to bounce back to 3x in FY15, from lows of 2.3x in 2QFY14
Source: MOSL, Company
Expect power segment revenues to improve 9% YoY in FY16, FY15 revenues down 33% from peak levels in 2QFY13 (ttm)
Source: MOSL, Company
BHEL’s management in the recent concall stated that the company is already L1 in ~4GW of projects including: i) 1320MW Ennore SEZ (EPC, INR78b) ii) 6X196MW Pranhita Lift Irrigation (~INR25-30b) iii) 500MW Tuticorin (BTG, INR12b) iv) 1GW of Pakal DUL Hydro power with Patel Engg (~INR90b JV share) v) 4X111MW Vishnugad Pipalkoti Hydro project, etc. Recent trends suggest that pricing has stabilized, albeit at low levels From a market structure that was threatened by: i) intense competition from Chinese, Koreans and Japanese companies ii) and, possibility of ~5-6 players in the domestic market, the BTG manufacturing sector is undergoing a metamorphosis. Imported products witness erosion of competitive intensity: Of the 90GW
capacity under construction as per CEA, share of Chinese and other imported equipments stand at 36.2% and 6.3% respectively. This is a large market pie being captured by imported products. Going forward, we believe the competitive intensity of such players has been largely eroded given i) currency
953
970
1,02
9 1,
032
1,12
6 1,
125
1,18
1 1,
240
1,25
5 1,
258
1,24
8 1,
282
1,16
5 1,
077
1,06
3 99
3 89
8 93
3 89
4 82
9 83
5 83
8 79
9 81
3
5.2
4.5
4.6
4.4 4.6
4.2
4.3
4.2
4.3
3.8
3.7
3.7
3.1
2.8
2.7
2.5
2.3
2.4
2.3
2.3
2.3 2.6
2.6 3.
0
3QFY
094Q
FY09
1QFY
102Q
FY10
3QFY
104Q
FY10
1QFY
112Q
FY11
3QFY
114Q
FY11
1QFY
122Q
FY12
3QFY
124Q
FY12
1QFY
132Q
FY13
3QFY
134Q
FY13
1QFY
142Q
FY14
3QFY
144Q
FY14
1QFY
15FY
15E
Power Orderbook (INR B) BTB (x)
184
213
224
234
243
269
277
293
291
332
336
343
375
379
389
400
396
396
382
368
358
325
313
269
293
1834 34 32 32 26 23 25 20 23 21 17
2914 16 17
6 4 -2 -8 -10
-18
-18
-17
9
3QFY
094Q
FY09
1QFY
102Q
FY10
3QFY
104Q
FY10
1QFY
112Q
FY11
3QFY
114Q
FY11
1QFY
122Q
FY12
3QFY
124Q
FY12
1QFY
132Q
FY13
3QFY
134Q
FY13
1QFY
142Q
FY14
3QFY
144Q
FY14
1QFY
15FY
15E
FY16
E
Power Rev (INR B, ttm) % YoY
We expect power segment BTB to bounce back from lows of 2.3x in Sept 2013
currently to 3x in FY15E
BHEL
17 September 2014 4
movements (sharp 56% currency depreciation over the last 3 years), ii) imposition of 21% import duty in 2012 leading to differential of ~14% for domestic players and iii) also intense competition given commissioning of ~21-24GW of supercritical BTG manufacturing capacities in India has led to a 15% price correction in boilers and 20% in turbines under bulk tender 2 vs bulk tender 1.
Disciplined competitive aggression amongst domestic players: The domestic market structure is also showing resemblance of stability, with ~4 players each in boilers and turbines setting up manufacturing capacities of ~21-24GW pa for supercritical projects. Based on interactions with industry players, we understand that there has been limited progress in setting up integrated manufacturing capacities for supercritical projects by few players like BGR Hitachi, GB Engineering - Ansaldo, ISGEC - Foster Wheeler, Cethar - Riley, etc. In October 2013, the EPC bid for 600MW Surat Lignite project awarded to Lanco Infra (INR33b) was cancelled as the company did not submit 10% bank guarantee.
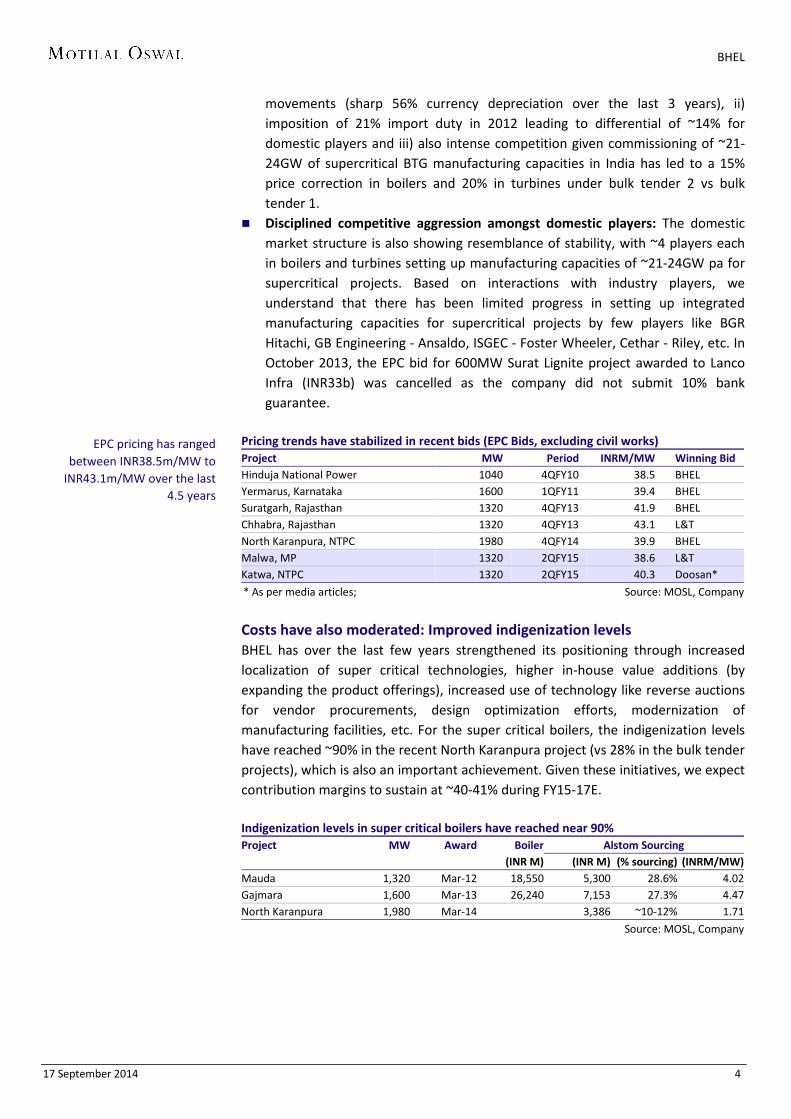
Pricing trends have stabilized in recent bids (EPC Bids, excluding civil works) Project MW Period INRM/MW Winning Bid Hinduja National Power 1040 4QFY10 38.5 BHEL Yermarus, Karnataka 1600 1QFY11 39.4 BHEL Suratgarh, Rajasthan 1320 4QFY13 41.9 BHEL Chhabra, Rajasthan 1320 4QFY13 43.1 L&T North Karanpura, NTPC 1980 4QFY14 39.9 BHEL Malwa, MP 1320 2QFY15 38.6 L&T Katwa, NTPC 1320 2QFY15 40.3 Doosan*
* As per media articles; Source: MOSL, Company
Costs have also moderated: Improved indigenization levels BHEL has over the last few years strengthened its positioning through increased localization of super critical technologies, higher in-house value additions (by expanding the product offerings), increased use of technology like reverse auctions for vendor procurements, design optimization efforts, modernization of manufacturing facilities, etc. For the super critical boilers, the indigenization levels have reached ~90% in the recent North Karanpura project (vs 28% in the bulk tender projects), which is also an important achievement. Given these initiatives, we expect contribution margins to sustain at ~40-41% during FY15-17E. Indigenization levels in super critical boilers have reached near 90% Project MW Award Boiler Alstom Sourcing (INR M) (INR M) (% sourcing) (INRM/MW) Mauda 1,320 Mar-12 18,550 5,300 28.6% 4.02 Gajmara 1,600 Mar-13 26,240 7,153 27.3% 4.47 North Karanpura 1,980 Mar-14 3,386 ~10-12% 1.71
Source: MOSL, Company
EPC pricing has ranged between INR38.5m/MW to
INR43.1m/MW over the last 4.5 years
BHEL
17 September 2014 5
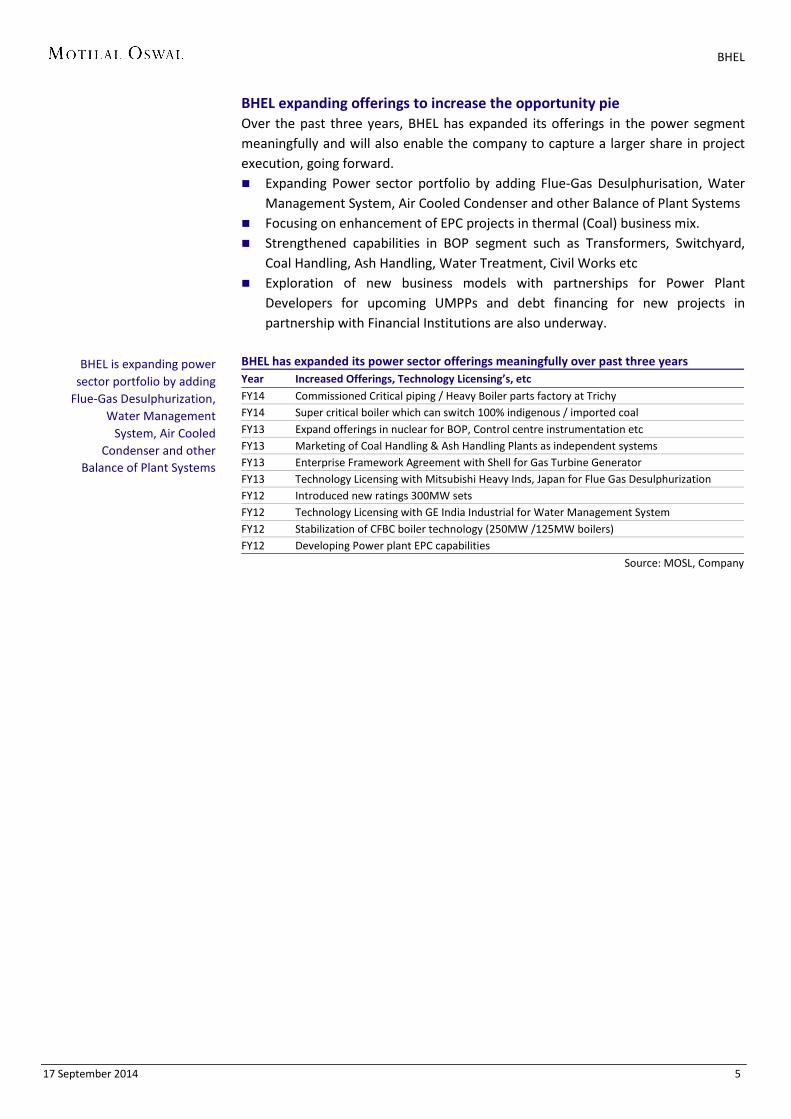
BHEL expanding offerings to increase the opportunity pie Over the past three years, BHEL has expanded its offerings in the power segment meaningfully and will also enable the company to capture a larger share in project execution, going forward. Expanding Power sector portfolio by adding Flue-Gas Desulphurisation, Water
Management System, Air Cooled Condenser and other Balance of Plant Systems Focusing on enhancement of EPC projects in thermal (Coal) business mix. Strengthened capabilities in BOP segment such as Transformers, Switchyard,
Coal Handling, Ash Handling, Water Treatment, Civil Works etc Exploration of new business models with partnerships for Power Plant
Developers for upcoming UMPPs and debt financing for new projects in partnership with Financial Institutions are also underway.
BHEL has expanded its power sector offerings meaningfully over past three years Year Increased Offerings, Technology Licensing’s, etc FY14 Commissioned Critical piping / Heavy Boiler parts factory at Trichy FY14 Super critical boiler which can switch 100% indigenous / imported coal FY13 Expand offerings in nuclear for BOP, Control centre instrumentation etc FY13 Marketing of Coal Handling & Ash Handling Plants as independent systems FY13 Enterprise Framework Agreement with Shell for Gas Turbine Generator FY13 Technology Licensing with Mitsubishi Heavy Inds, Japan for Flue Gas Desulphurization FY12 Introduced new ratings 300MW sets FY12 Technology Licensing with GE India Industrial for Water Management System FY12 Stabilization of CFBC boiler technology (250MW /125MW boilers) FY12 Developing Power plant EPC capabilities
Source: MOSL, Company
BHEL is expanding power sector portfolio by adding
Flue-Gas Desulphurization, Water Management
System, Air Cooled Condenser and other
Balance of Plant Systems
BHEL
17 September 2014 п
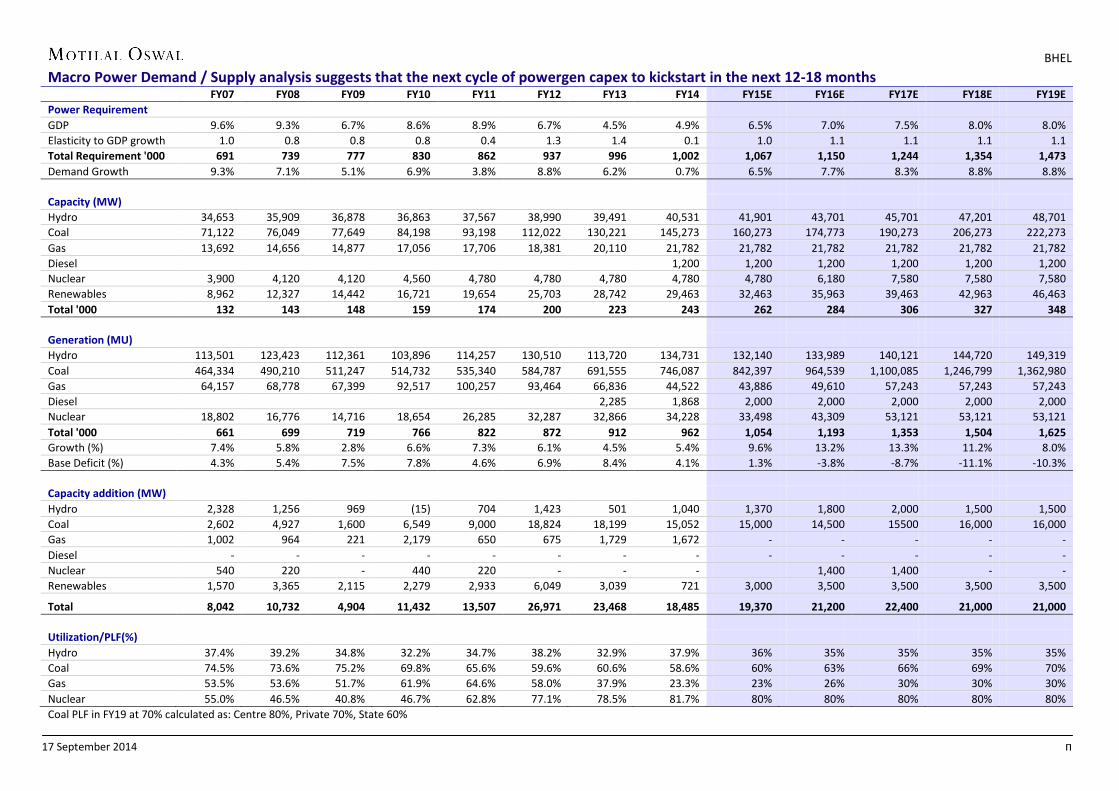
Macro Power Demand / Supply analysis suggests that the next cycle of powergen capex to kickstart in the next 12-18 months FY07 FY08 FY09 FY10 FY11 FY12 FY13 FY14 FY15E FY16E FY17E FY18E FY19E Power Requirement GDP 9.6% 9.3% 6.7% 8.6% 8.9% 6.7% 4.5% 4.9% 6.5% 7.0% 7.5% 8.0% 8.0% Elasticity to GDP growth 1.0 0.8 0.8 0.8 0.4 1.3 1.4 0.1 1.0 1.1 1.1 1.1 1.1 Total Requirement '000 691 739 777 830 862 937 996 1,002 1,067 1,150 1,244 1,354 1,473 Demand Growth 9.3% 7.1% 5.1% 6.9% 3.8% 8.8% 6.2% 0.7% 6.5% 7.7% 8.3% 8.8% 8.8%
Capacity (MW) Hydro 34,653 35,909 36,878 36,863 37,567 38,990 39,491 40,531 41,901 43,701 45,701 47,201 48,701 Coal 71,122 76,049 77,649 84,198 93,198 112,022 130,221 145,273 160,273 174,773 190,273 206,273 222,273 Gas 13,692 14,656 14,877 17,056 17,706 18,381 20,110 21,782 21,782 21,782 21,782 21,782 21,782 Diesel 1,200 1,200 1,200 1,200 1,200 1,200 Nuclear 3,900 4,120 4,120 4,560 4,780 4,780 4,780 4,780 4,780 6,180 7,580 7,580 7,580 Renewables 8,962 12,327 14,442 16,721 19,654 25,703 28,742 29,463 32,463 35,963 39,463 42,963 46,463 Total '000 132 143 148 159 174 200 223 243 262 284 306 327 348 Generation (MU) Hydro 113,501 123,423 112,361 103,896 114,257 130,510 113,720 134,731 132,140 133,989 140,121 144,720 149,319 Coal 464,334 490,210 511,247 514,732 535,340 584,787 691,555 746,087 842,397 964,539 1,100,085 1,246,799 1,362,980 Gas 64,157 68,778 67,399 92,517 100,257 93,464 66,836 44,522 43,886 49,610 57,243 57,243 57,243 Diesel 2,285 1,868 2,000 2,000 2,000 2,000 2,000 Nuclear 18,802 16,776 14,716 18,654 26,285 32,287 32,866 34,228 33,498 43,309 53,121 53,121 53,121 Total '000 661 699 719 766 822 872 912 962 1,054 1,193 1,353 1,504 1,625 Growth (%) 7.4% 5.8% 2.8% 6.6% 7.3% 6.1% 4.5% 5.4% 9.6% 13.2% 13.3% 11.2% 8.0% Base Deficit (%) 4.3% 5.4% 7.5% 7.8% 4.6% 6.9% 8.4% 4.1% 1.3% -3.8% -8.7% -11.1% -10.3% Capacity addition (MW) Hydro 2,328 1,256 969 (15) 704 1,423 501 1,040 1,370 1,800 2,000 1,500 1,500 Coal 2,602 4,927 1,600 6,549 9,000 18,824 18,199 15,052 15,000 14,500 15500 16,000 16,000 Gas 1,002 964 221 2,179 650 675 1,729 1,672 - - - - - Diesel - - - - - - - - - - - - - Nuclear 540 220 - 440 220 - - - 1,400 1,400 - - Renewables 1,570 3,365 2,115 2,279 2,933 6,049 3,039 721 3,000 3,500 3,500 3,500 3,500
Total 8,042 10,732 4,904 11,432 13,507 26,971 23,468 18,485 19,370 21,200 22,400 21,000 21,000 Utilization/PLF(%) Hydro 37.4% 39.2% 34.8% 32.2% 34.7% 38.2% 32.9% 37.9% 36% 35% 35% 35% 35% Coal 74.5% 73.6% 75.2% 69.8% 65.6% 59.6% 60.6% 58.6% 60% 63% 66% 69% 70% Gas 53.5% 53.6% 51.7% 61.9% 64.6% 58.0% 37.9% 23.3% 23% 26% 30% 30% 30% Nuclear 55.0% 46.5% 40.8% 46.7% 62.8% 77.1% 78.5% 81.7% 80% 80% 80% 80% 80% Coal PLF in FY19 at 70% calculated as: Centre 80%, Private 70%, State 60%
BHEL
17 September 2014 7
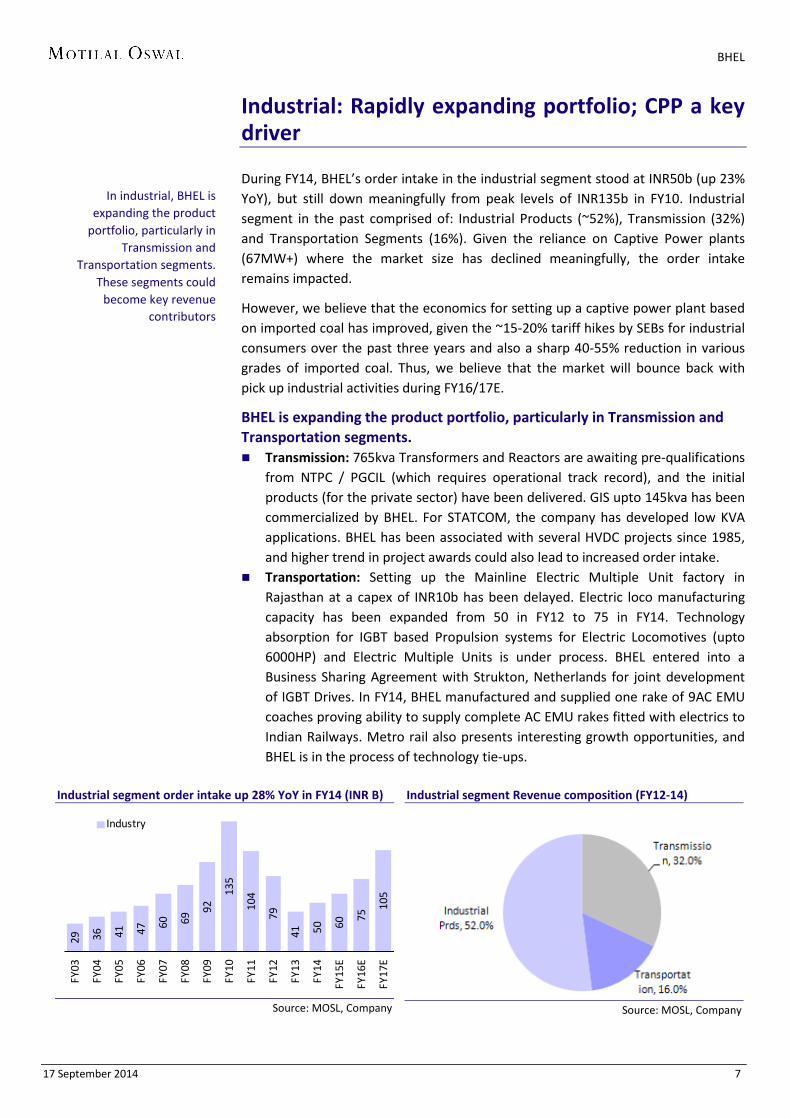
Industrial: Rapidly expanding portfolio; CPP a key driver During FY14, BHEL’s order intake in the industrial segment stood at INR50b (up 23% YoY), but still down meaningfully from peak levels of INR135b in FY10. Industrial segment in the past comprised of: Industrial Products (~52%), Transmission (32%) and Transportation Segments (16%). Given the reliance on Captive Power plants (67MW+) where the market size has declined meaningfully, the order intake remains impacted.
However, we believe that the economics for setting up a captive power plant based on imported coal has improved, given the ~15-20% tariff hikes by SEBs for industrial consumers over the past three years and also a sharp 40-55% reduction in various grades of imported coal. Thus, we believe that the market will bounce back with pick up industrial activities during FY16/17E.
BHEL is expanding the product portfolio, particularly in Transmission and Transportation segments. Transmission: 765kva Transformers and Reactors are awaiting pre-qualifications
from NTPC / PGCIL (which requires operational track record), and the initial products (for the private sector) have been delivered. GIS upto 145kva has been commercialized by BHEL. For STATCOM, the company has developed low KVA applications. BHEL has been associated with several HVDC projects since 1985, and higher trend in project awards could also lead to increased order intake.
Transportation: Setting up the Mainline Electric Multiple Unit factory in Rajasthan at a capex of INR10b has been delayed. Electric loco manufacturing capacity has been expanded from 50 in FY12 to 75 in FY14. Technology absorption for IGBT based Propulsion systems for Electric Locomotives (upto 6000HP) and Electric Multiple Units is under process. BHEL entered into a Business Sharing Agreement with Strukton, Netherlands for joint development of IGBT Drives. In FY14, BHEL manufactured and supplied one rake of 9AC EMU coaches proving ability to supply complete AC EMU rakes fitted with electrics to Indian Railways. Metro rail also presents interesting growth opportunities, and BHEL is in the process of technology tie-ups.
Industrial segment order intake up 28% YoY in FY14 (INR B)
Source: MOSL, Company
Industrial segment Revenue composition (FY12-14)
Source: MOSL, Company
29 36 41 47 60 69
92
135
104
79
41 50 60
75
105
FY03
FY04
FY05
FY06
FY07
FY08
FY09
FY10
FY11
FY12
FY13
FY14
FY15
E
FY16
E
FY17
E
Industry
In industrial, BHEL is expanding the product
portfolio, particularly in Transmission and
Transportation segments. These segments could
become key revenue contributors
BHEL
17 September 2014 8
New initiatives / expansion plans (in last one year) MoU with Solar Energy Corporation, PGCIL, SJVNL, Sambhar Salts, and Rajasthan
Electronics for setting up a 4GW Ultra Mega Solar Power Project at Sambhar, Rajasthan. Also, the company has plans to set up an integrated manufacturing facility for 480 MW Solar PV systems (Wafers-Cells-Modules). We understand that the company has approached the National Clean Cess Fund to get a 40% capex subsidy.
In HVDC, BHEL has augmented its facilities for manufacturing UHVDC equipments viz. Converter Transformers, Thyristor valves, Filter Capacitors, etc.
BHEL has also developed and supplied 400 kV Control Shunt Reactor, Fixed series compensation schemes for transmission utilities and small rating STATCOMs for Industry applications.
BHEL manufactured and supplied one rake of 9AC EMU coaches proving ability to supply complete AC EMU rakes fitted with electrics to Indian Railways
BHEL received the first order of Water Treatment system in Petrochemicals sector for 96mld Raw Water Treatment Plant (Membrane Filtration based) from OPAL. BHEL has a long term Manufacturing Associate Agreement with GE India Industrial for Membrane based water treatment business.
BHEL
17 September 2014 9
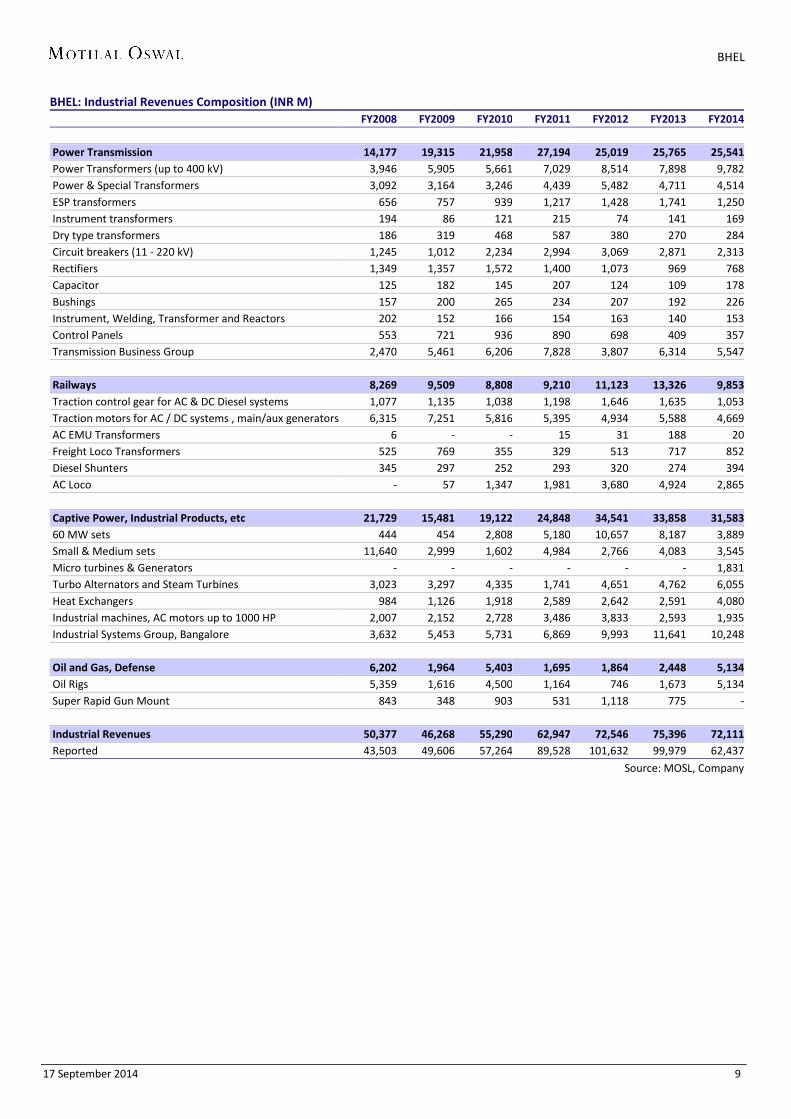
BHEL: Industrial Revenues Composition (INR M)
FY2008 FY2009 FY2010 FY2011 FY2012 FY2013 FY2014
Power Transmission 14,177 19,315 21,958 27,194 25,019 25,765 25,541 Power Transformers (up to 400 kV) 3,946 5,905 5,661 7,029 8,514 7,898 9,782 Power & Special Transformers 3,092 3,164 3,246 4,439 5,482 4,711 4,514 ESP transformers 656 757 939 1,217 1,428 1,741 1,250 Instrument transformers 194 86 121 215 74 141 169 Dry type transformers 186 319 468 587 380 270 284 Circuit breakers (11 - 220 kV) 1,245 1,012 2,234 2,994 3,069 2,871 2,313 Rectifiers 1,349 1,357 1,572 1,400 1,073 969 768 Capacitor 125 182 145 207 124 109 178 Bushings 157 200 265 234 207 192 226 Instrument, Welding, Transformer and Reactors 202 152 166 154 163 140 153 Control Panels 553 721 936 890 698 409 357 Transmission Business Group 2,470 5,461 6,206 7,828 3,807 6,314 5,547 Railways 8,269 9,509 8,808 9,210 11,123 13,326 9,853 Traction control gear for AC & DC Diesel systems 1,077 1,135 1,038 1,198 1,646 1,635 1,053 Traction motors for AC / DC systems , main/aux generators 6,315 7,251 5,816 5,395 4,934 5,588 4,669 AC EMU Transformers 6 - - 15 31 188 20 Freight Loco Transformers 525 769 355 329 513 717 852 Diesel Shunters 345 297 252 293 320 274 394 AC Loco - 57 1,347 1,981 3,680 4,924 2,865 Captive Power, Industrial Products, etc 21,729 15,481 19,122 24,848 34,541 33,858 31,583 60 MW sets 444 454 2,808 5,180 10,657 8,187 3,889 Small & Medium sets 11,640 2,999 1,602 4,984 2,766 4,083 3,545 Micro turbines & Generators - - - - - - 1,831 Turbo Alternators and Steam Turbines 3,023 3,297 4,335 1,741 4,651 4,762 6,055 Heat Exchangers 984 1,126 1,918 2,589 2,642 2,591 4,080 Industrial machines, AC motors up to 1000 HP 2,007 2,152 2,728 3,486 3,833 2,593 1,935 Industrial Systems Group, Bangalore 3,632 5,453 5,731 6,869 9,993 11,641 10,248 Oil and Gas, Defense 6,202 1,964 5,403 1,695 1,864 2,448 5,134 Oil Rigs 5,359 1,616 4,500 1,164 746 1,673 5,134 Super Rapid Gun Mount 843 348 903 531 1,118 775 - Industrial Revenues 50,377 46,268 55,290 62,947 72,546 75,396 72,111 Reported 43,503 49,606 57,264 89,528 101,632 99,979 62,437
Source: MOSL, Company
BHEL
17 September 2014 10
Strong operating leverage, cyclical factors support recovery BHEL is strongly exposed to cyclical factors: i) Contribution margins at ~42% vs expected EBIDTA margin of 12.4% (adjusted) in FY14, leading to a meaningful operating leverage ii) Core NWC stable at 200 days; cyclical factors of Retention money (at 181 days in FY14 vs 55-60 days in FY07-09) and customer advances (deteriorated from 63% of revenues in FY09 to 38% in FY14) that impacted reported NWC are expected to normalize, as we expect BTB to increase from 2.6x currently to 3x in FY15.
Expect EBIDTA margins to bottom in FY15, supported by operating leverage We expect BHEL’s EBIDTA margins to decline from 19.4% in FY13 to 10.2% in
FY15E, and improve to 12.5% in FY16E / 14.9% in FY17E. During this period, we expect contribution margins to be maintained at ~41%, and thus the expectations of margin expansion are largely a function of the operating leverage, particularly staff costs (14.7% in FY17E, vs 18.7% in FY15E) and provisions, including Liquidated Damages (at 2.8% in FY17E vs 5.8% in FY14).
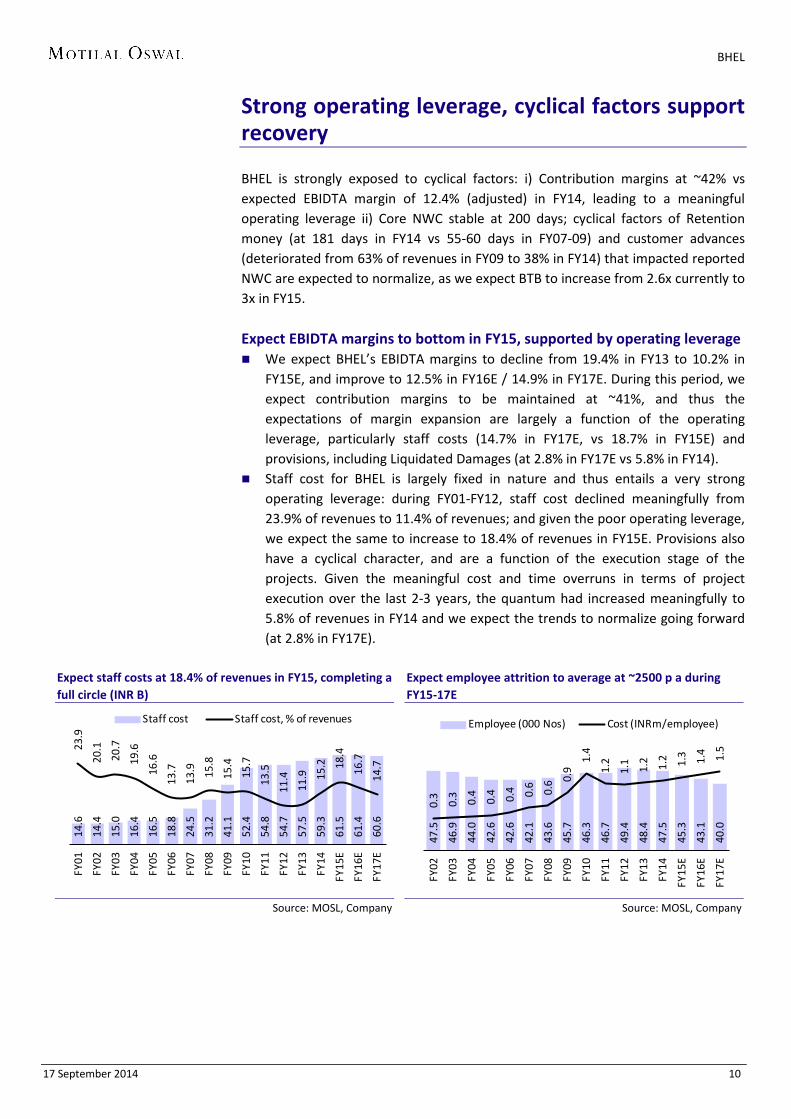
Staff cost for BHEL is largely fixed in nature and thus entails a very strong operating leverage: during FY01-FY12, staff cost declined meaningfully from 23.9% of revenues to 11.4% of revenues; and given the poor operating leverage, we expect the same to increase to 18.4% of revenues in FY15E. Provisions also have a cyclical character, and are a function of the execution stage of the projects. Given the meaningful cost and time overruns in terms of project execution over the last 2-3 years, the quantum had increased meaningfully to 5.8% of revenues in FY14 and we expect the trends to normalize going forward (at 2.8% in FY17E).
Expect staff costs at 18.4% of revenues in FY15, completing a full circle (INR B)
Source: MOSL, Company
Expect employee attrition to average at ~2500 p a during FY15-17E
Source: MOSL, Company
14.6
14.4
15.0
16.4
16.5
18.8
24.5
31.2
41.1
52.4
54.8
54.7
57.5
59.3
61.5
61.4
60.6
23.9
20.1
20.7
19.6
16.6
13.7
13.9
15.8
15.4
15.7
13.5
11.4
11.9
15.2
18.4
16.7
14.7
FY01
FY02
FY03
FY04
FY05
FY06
FY07
FY08
FY09
FY10
FY11
FY12
FY13
FY14
FY15
E
FY16
E
FY17
E
Staff cost Staff cost, % of revenues
47.5
46.9
44.0
42.6
42.6
42.1
43.6
45.7
46.3
46.7
49.4
48.4
47.5
45.3
43.1
40.0
0.3
0.3
0.4
0.4 0.4 0.6
0.6 0.
9
1.4
1.2
1.1
1.2 1.2 1.3 1.4 1.5
FY02
FY03
FY04
FY05
FY06
FY07
FY08
FY09
FY10
FY11
FY12
FY13
FY14
FY15
E
FY16
E
FY17
EEmployee (000 Nos) Cost (INRm/employee)
BHEL
17 September 2014 11
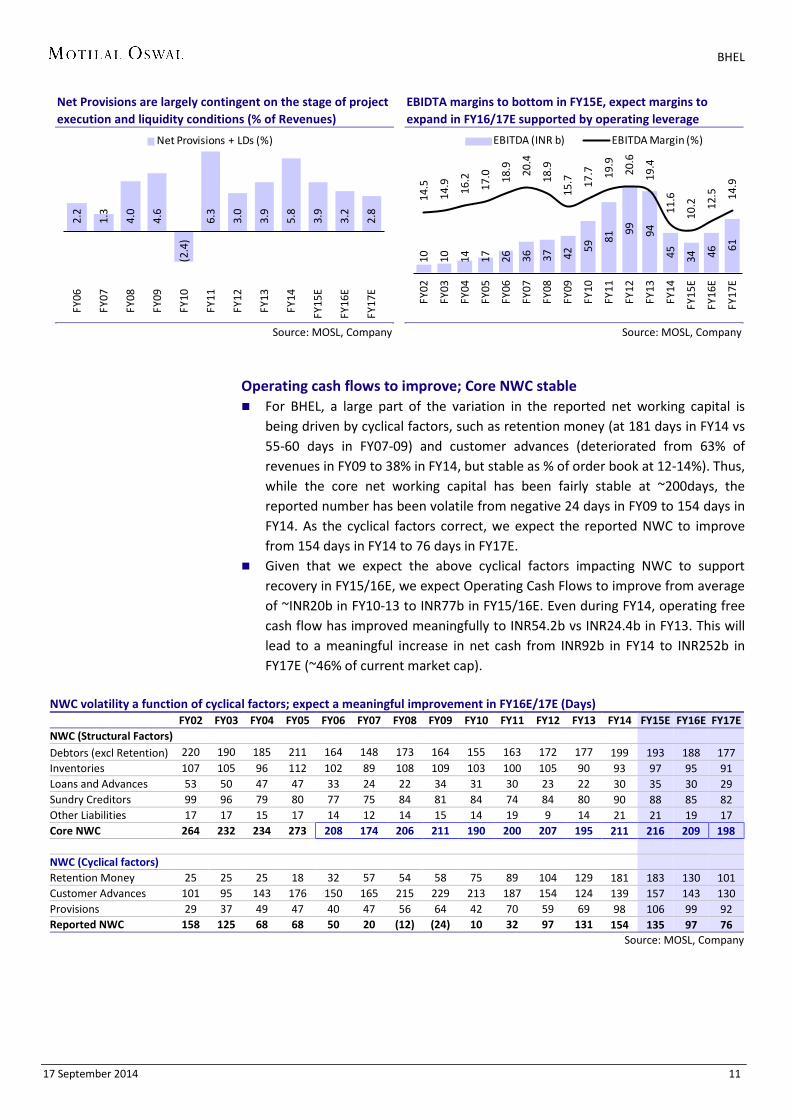
Net Provisions are largely contingent on the stage of project execution and liquidity conditions (% of Revenues)
Source: MOSL, Company
EBIDTA margins to bottom in FY15E, expect margins to expand in FY16/17E supported by operating leverage
Source: MOSL, Company
Operating cash flows to improve; Core NWC stable For BHEL, a large part of the variation in the reported net working capital is
being driven by cyclical factors, such as retention money (at 181 days in FY14 vs 55-60 days in FY07-09) and customer advances (deteriorated from 63% of revenues in FY09 to 38% in FY14, but stable as % of order book at 12-14%). Thus, while the core net working capital has been fairly stable at ~200days, the reported number has been volatile from negative 24 days in FY09 to 154 days in FY14. As the cyclical factors correct, we expect the reported NWC to improve from 154 days in FY14 to 76 days in FY17E.
Given that we expect the above cyclical factors impacting NWC to support recovery in FY15/16E, we expect Operating Cash Flows to improve from average of ~INR20b in FY10-13 to INR77b in FY15/16E. Even during FY14, operating free cash flow has improved meaningfully to INR54.2b vs INR24.4b in FY13. This will lead to a meaningful increase in net cash from INR92b in FY14 to INR252b in FY17E (~46% of current market cap).
NWC volatility a function of cyclical factors; expect a meaningful improvement in FY16E/17E (Days) FY02 FY03 FY04 FY05 FY06 FY07 FY08 FY09 FY10 FY11 FY12 FY13 FY14 FY15E FY16E FY17E NWC (Structural Factors)
Debtors (excl Retention) 220 190 185 211 164 148 173 164 155 163 172 177 199 193 188 177 Inventories 107 105 96 112 102 89 108 109 103 100 105 90 93 97 95 91 Loans and Advances 53 50 47 47 33 24 22 34 31 30 23 22 30 35 30 29 Sundry Creditors 99 96 79 80 77 75 84 81 84 74 84 80 90 88 85 82 Other Liabilities 17 17 15 17 14 12 14 15 14 19 9 14 21 21 19 17 Core NWC 264 232 234 273 208 174 206 211 190 200 207 195 211 216 209 198
NWC (Cyclical factors)
Retention Money 25 25 25 18 32 57 54 58 75 89 104 129 181 183 130 101 Customer Advances 101 95 143 176 150 165 215 229 213 187 154 124 139 157 143 130 Provisions 29 37 49 47 40 47 56 64 42 70 59 69 98 106 99 92 Reported NWC 158 125 68 68 50 20 (12) (24) 10 32 97 131 154 135 97 76
Source: MOSL, Company
2.2
1.3
4.0
4.6
(2.4
)
6.3
3.0
3.9
5.8
3.9
3.2
2.8
FY06
FY07
FY08
FY09
FY10
FY11
FY12
FY13
FY14
FY15
E
FY16
E
FY17
E
Net Provisions + LDs (%)
10
10
14
17
26
36
37
42 59
81 99
94
45
34
46 61
14.5
14.9 16
.2
17.0 18
.9 20.4
18.9
15.7 17
.7 19.9
20.6
19.4
11.6
10.2 12
.5 14.9
FY02
FY03
FY04
FY05
FY06
FY07
FY08
FY09
FY10
FY11
FY12
FY13
FY14
FY15
E
FY16
E
FY17
E
EBITDA (INR b) EBITDA Margin (%)

BHEL
17 September 2014 12
Retention money is largely a function of negotiation with the customers, and expect the quantum to decline (INR B)
Source: MOSL, Company
Customer advances have remained stable (as % of order book), but volatile as % of revenues
Source: MOSL, Company
5 5 5 5 12
27
28
42
68
97
135
168
190
164
129
111
25 25 25 18 32
57 54 58 75
89 104
129
181 183
130
101
FY02
FY03
FY04
FY05
FY06
FY07
FY08
FY09
FY10
FY11
FY12
FY13
FY14
FY15
E
FY16
E
FY17
E
Retention Money No of days (x)
28%
26%
39%
48%
41%
45%
59%
63%
58%
51%
42%
34%
38%
43%
39%
36%
14%
11%
13%
14% 15
%
14%
13% 14
%
13%
12%
15%
14% 14
%
14%
14%
14%
FY02
FY03
FY04
FY05
FY06
FY07
FY08
FY09
FY10
FY11
FY12
FY13
FY14
FY15
E
FY16
E
FY17
E
Client advances, % sales Client advances, % OB
BHEL
17 September 2014 13
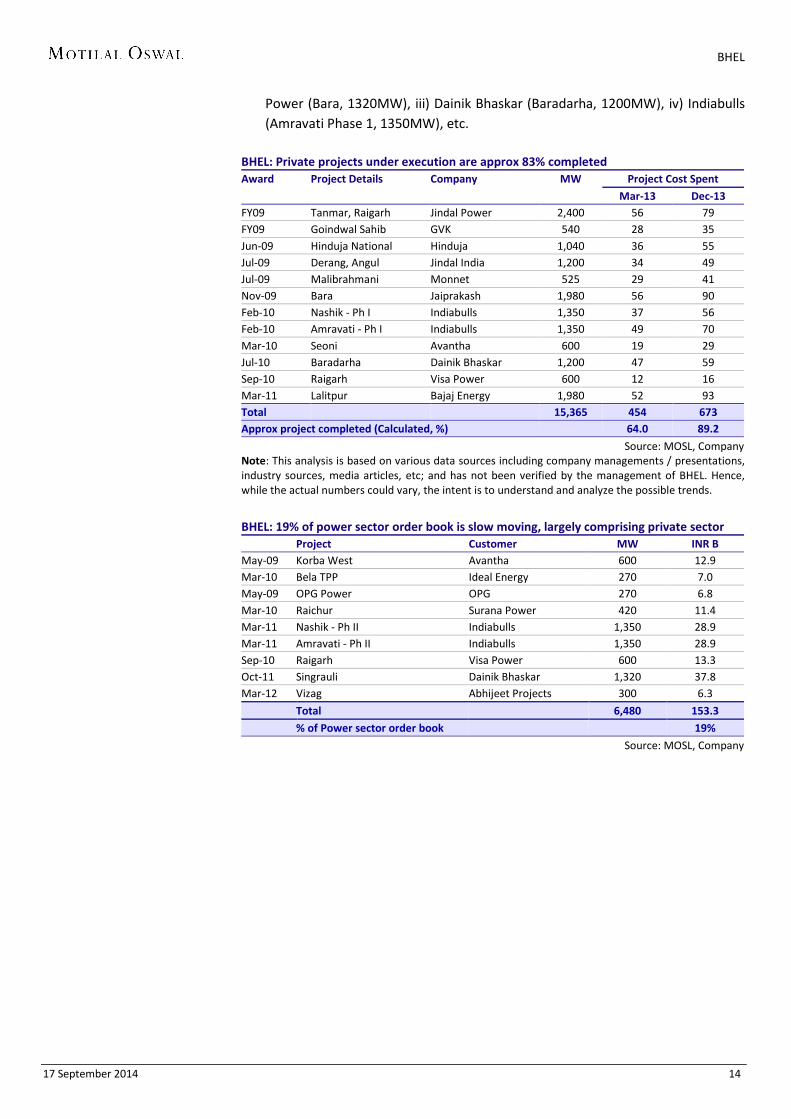
Binary trends support execution, focus shifts on public sector We analyzed each of the private sector projects in BHEL's order book to gauge
the possible trends in execution. We calculate that the unexecuted private sector order book stands at ~INR190b, and thus contributes ~24% to BHEL’s power sector order backlog of INR799b. Of this, ~INR153b are non-moving / slow-moving, and largely comprises of subsequent units in projects that are being postponed given the financial and viability constraints. Of the balance INR40b private sector backlog, we calculate that this corresponds to just ~10-15% of the initial order value, and thus several of these projects under execution are in advanced stages of commissioning.
Given these binary trends in private sector order backlog, the focus increasingly now shifts towards public sector projects (both Central and State sector) in terms of gauging execution for BHEL. This is positive as private sector faces several headwinds in project execution, including funding and viability issues.
We expect BHEL’s revenues to decline 16% YoY in FY15 given the constrained intake and increased proportion of slow moving backlog; and then improving in FY16E / FY17E (growth of 10% / 12% YoY) as execution improves from recent project wins in the public sector. Another factor supporting execution will be the shortened time periods offered by equipment vendors (for instance BHEL is offering execution time periods of ~42 months vs earlier 48 months for super critical projects).
We analyzed each private sector power project in BHEL's order book to gauge the possible trends in execution For BHEL, a sizeable part of the power sector project awards in FY10 (at 80%, INR330b) / FY11 (at 40%, INR180b) were from the private sector, and many of these projects face multiple execution challenges. Non-moving / slow-moving order book of INR153b: We understand that 6.5GW
of capacity, comprising INR153b of private sector order book are non-moving. Key projects in the non-moving category are: Indiabulls Nashik and Amravati (INR58b), DB Power (INR38b), Visa Power (INR13b), Avantha Power (INR13b), etc.
Balance ~INR40b in final stages of project commissioning; several projects perceived as slow moving have witnessed ~15-20% project execution in FY14: We understand that ~13 projects (16GW) in the private sector are currently under execution by BHEL. The initial order value of these projects stood at INR390b, and we calculate that on an aggregate basis, ~85%+ of the work on these projects have been completed. Thus, several of these projects are in the final stages of commissioning in 4QFY14 / FY15. Our analysis also indicates that the project completion has increased from ~64% in March 2013 to ~85% currently; and thus while the pace has remained constrained given the tight liquidity conditions; still a 21% project completion in FY14 is commendable. Importantly, few projects perceived as slow moving have also seen execution at ~15-20% of the project cost: i) Bajaj Energy (Lalitpur, 1980MW), ii) Jaiprakash
Given these binary trends in private sector order
backlog, the focus increasingly now shifts towards public sector
projects (both Central and State sector) in terms of
gauging execution for BHEL
BHEL
17 September 2014 14
Power (Bara, 1320MW), iii) Dainik Bhaskar (Baradarha, 1200MW), iv) Indiabulls (Amravati Phase 1, 1350MW), etc.
BHEL: Private projects under execution are approx 83% completed Award Project Details Company MW Project Cost Spent
Mar-13 Dec-13 FY09 Tanmar, Raigarh Jindal Power 2,400 56 79 FY09 Goindwal Sahib GVK 540 28 35 Jun-09 Hinduja National Hinduja 1,040 36 55 Jul-09 Derang, Angul Jindal India 1,200 34 49 Jul-09 Malibrahmani Monnet 525 29 41 Nov-09 Bara Jaiprakash 1,980 56 90 Feb-10 Nashik - Ph I Indiabulls 1,350 37 56 Feb-10 Amravati - Ph I Indiabulls 1,350 49 70 Mar-10 Seoni Avantha 600 19 29 Jul-10 Baradarha Dainik Bhaskar 1,200 47 59 Sep-10 Raigarh Visa Power 600 12 16 Mar-11 Lalitpur Bajaj Energy 1,980 52 93 Total 15,365 454 673 Approx project completed (Calculated, %)
64.0 89.2
Source: MOSL, Company Note: This analysis is based on various data sources including company managements / presentations, industry sources, media articles, etc; and has not been verified by the management of BHEL. Hence, while the actual numbers could vary, the intent is to understand and analyze the possible trends.
BHEL: 19% of power sector order book is slow moving, largely comprising private sector Project Customer MW INR B May-09 Korba West Avantha 600 12.9 Mar-10 Bela TPP Ideal Energy 270 7.0 May-09 OPG Power OPG 270 6.8 Mar-10 Raichur Surana Power 420 11.4 Mar-11 Nashik - Ph II Indiabulls 1,350 28.9 Mar-11 Amravati - Ph II Indiabulls 1,350 28.9 Sep-10 Raigarh Visa Power 600 13.3 Oct-11 Singrauli Dainik Bhaskar 1,320 37.8 Mar-12 Vizag Abhijeet Projects 300 6.3
Total 6,480 153.3
% of Power sector order book
19%
Source: MOSL, Company
BHEL
17 September 2014 15
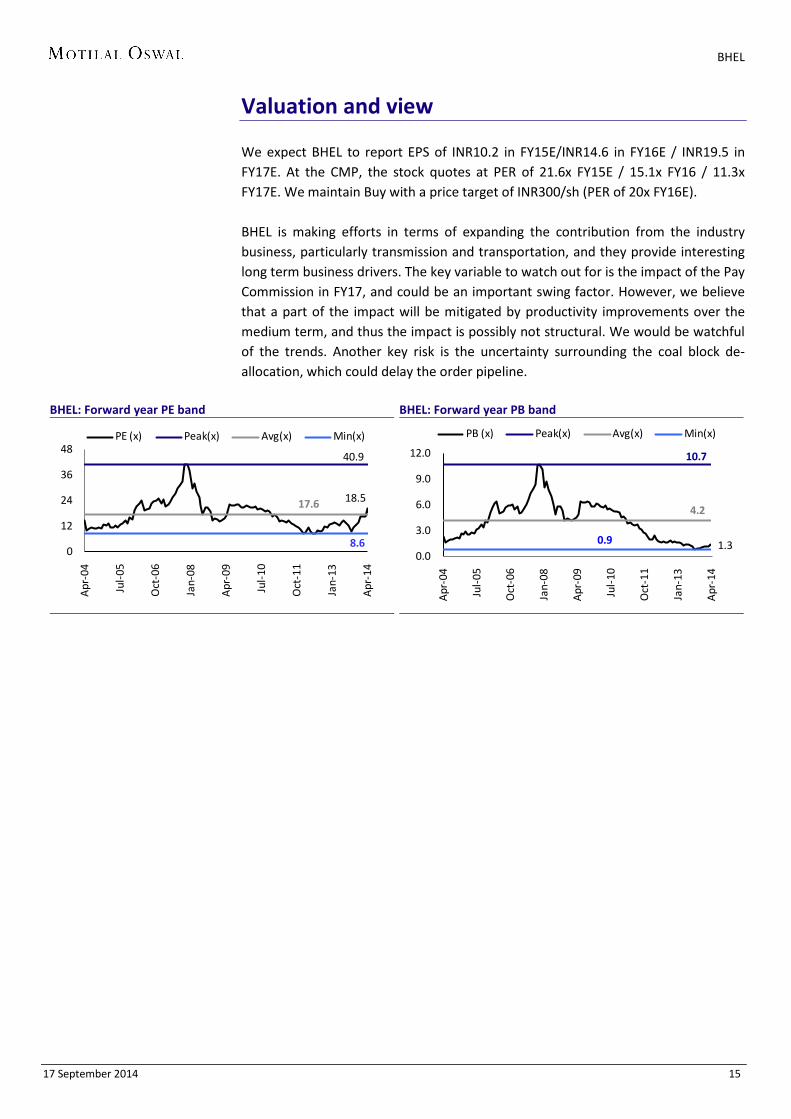
Valuation and view We expect BHEL to report EPS of INR10.2 in FY15E/INR14.6 in FY16E / INR19.5 in FY17E. At the CMP, the stock quotes at PER of 21.6x FY15E / 15.1x FY16 / 11.3x FY17E. We maintain Buy with a price target of INR300/sh (PER of 20x FY16E). BHEL is making efforts in terms of expanding the contribution from the industry business, particularly transmission and transportation, and they provide interesting long term business drivers. The key variable to watch out for is the impact of the Pay Commission in FY17, and could be an important swing factor. However, we believe that a part of the impact will be mitigated by productivity improvements over the medium term, and thus the impact is possibly not structural. We would be watchful of the trends. Another key risk is the uncertainty surrounding the coal block de-allocation, which could delay the order pipeline.
BHEL: Forward year PE band
BHEL: Forward year PB band
18.5
40.9
17.6
8.60
12
24
36
48
Apr
-04
Jul-
05
Oct
-06
Jan-
08
Apr
-09
Jul-
10
Oct
-11
Jan-
13
Apr
-14
PE (x) Peak(x) Avg(x) Min(x)
1.3
10.7
4.2
0.90.0
3.0
6.0
9.0
12.0A
pr-0
4
Jul-
05
Oct
-06
Jan-
08
Apr
-09
Jul-
10
Oct
-11
Jan-
13
Apr
-14
PB (x) Peak(x) Avg(x) Min(x)
BHEL
17 September 2014 16
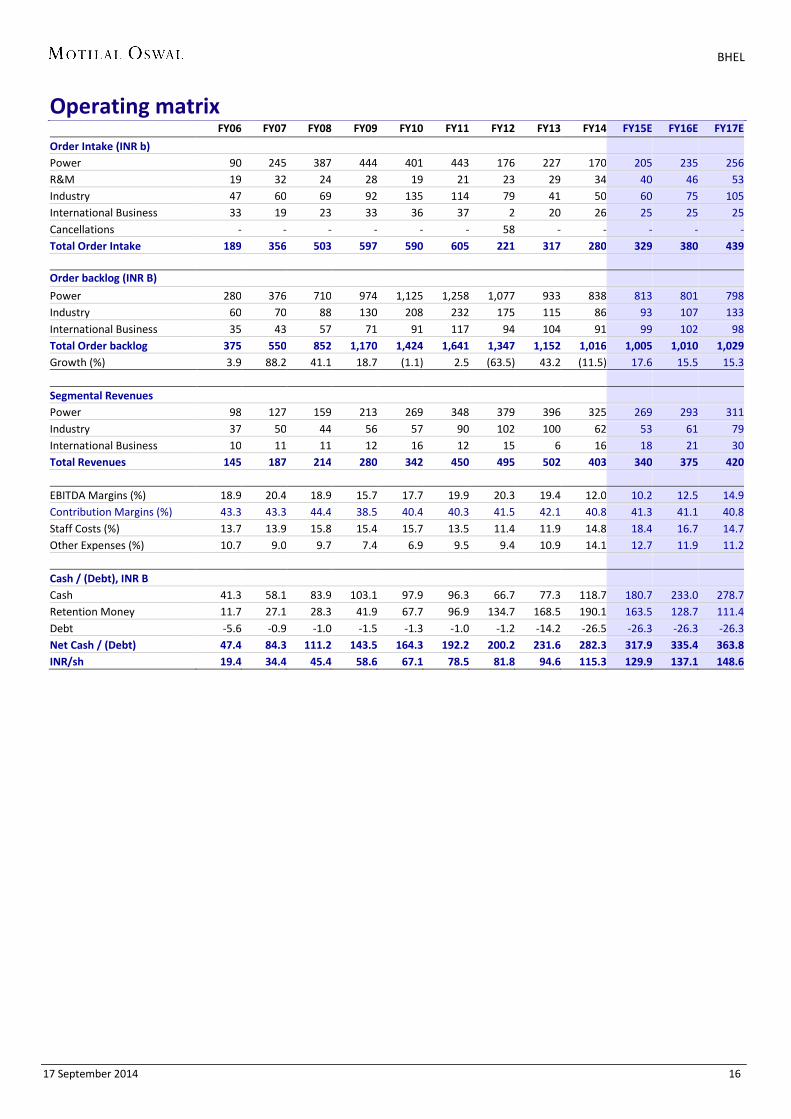
Operating matrix FY06 FY07 FY08 FY09 FY10 FY11 FY12 FY13 FY14 FY15E FY16E FY17E
Order Intake (INR b) Power 90 245 387 444 401 443 176 227 170 205 235 256 R&M 19 32 24 28 19 21 23 29 34 40 46 53 Industry 47 60 69 92 135 114 79 41 50 60 75 105 International Business 33 19 23 33 36 37 2 20 26 25 25 25 Cancellations - - - - - - 58 - - - - - Total Order Intake 189 356 503 597 590 605 221 317 280 329 380 439
Order backlog (INR B)
Power 280 376 710 974 1,125 1,258 1,077 933 838 813 801 798 Industry 60 70 88 130 208 232 175 115 86 93 107 133 International Business 35 43 57 71 91 117 94 104 91 99 102 98 Total Order backlog 375 550 852 1,170 1,424 1,641 1,347 1,152 1,016 1,005 1,010 1,029 Growth (%) 3.9 88.2 41.1 18.7 (1.1) 2.5 (63.5) 43.2 (11.5) 17.6 15.5 15.3
Segmental Revenues Power 98 127 159 213 269 348 379 396 325 269 293 311 Industry 37 50 44 56 57 90 102 100 62 53 61 79 International Business 10 11 11 12 16 12 15 6 16 18 21 30 Total Revenues 145 187 214 280 342 450 495 502 403 340 375 420 EBITDA Margins (%) 18.9 20.4 18.9 15.7 17.7 19.9 20.3 19.4 12.0 10.2 12.5 14.9 Contribution Margins (%) 43.3 43.3 44.4 38.5 40.4 40.3 41.5 42.1 40.8 41.3 41.1 40.8 Staff Costs (%) 13.7 13.9 15.8 15.4 15.7 13.5 11.4 11.9 14.8 18.4 16.7 14.7 Other Expenses (%) 10.7 9.0 9.7 7.4 6.9 9.5 9.4 10.9 14.1 12.7 11.9 11.2 Cash / (Debt), INR B Cash 41.3 58.1 83.9 103.1 97.9 96.3 66.7 77.3 118.7 180.7 233.0 278.7 Retention Money 11.7 27.1 28.3 41.9 67.7 96.9 134.7 168.5 190.1 163.5 128.7 111.4 Debt -5.6 -0.9 -1.0 -1.5 -1.3 -1.0 -1.2 -14.2 -26.5 -26.3 -26.3 -26.3 Net Cash / (Debt) 47.4 84.3 111.2 143.5 164.3 192.2 200.2 231.6 282.3 317.9 335.4 363.8 INR/sh 19.4 34.4 45.4 58.6 67.1 78.5 81.8 94.6 115.3 129.9 137.1 148.6
BHEL
17 September 2014 17
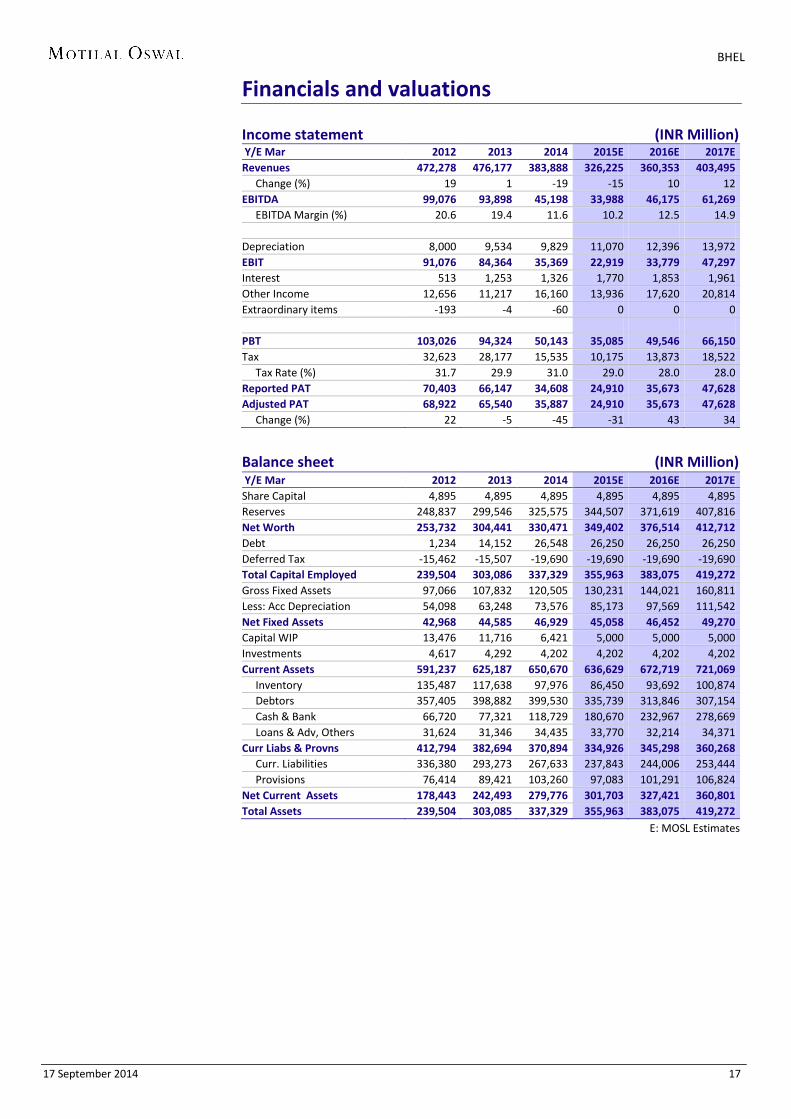
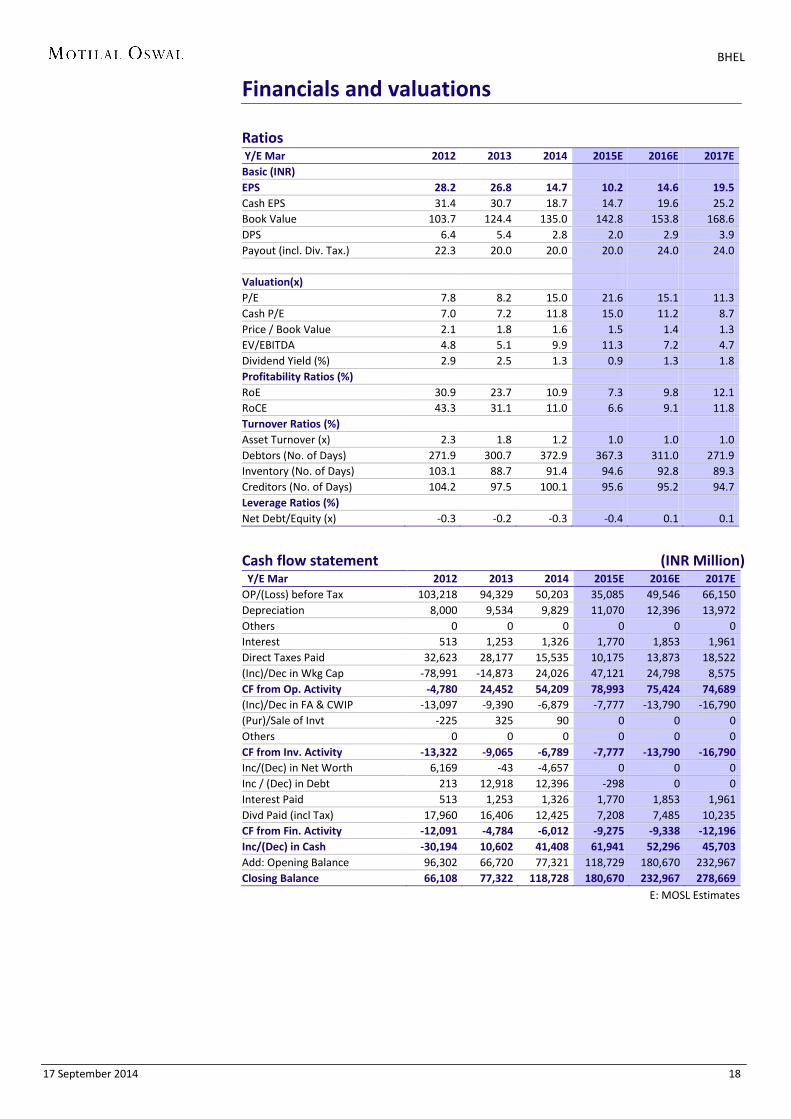
Financials and valuations Income statement (INR Million) Y/E Mar 2012 2013 2014 2015E 2016E 2017E Revenues 472,278 476,177 383,888 326,225 360,353 403,495 Change (%) 19 1 -19 -15 10 12 EBITDA 99,076 93,898 45,198 33,988 46,175 61,269 EBITDA Margin (%) 20.6 19.4 11.6 10.2 12.5 14.9 Depreciation 8,000 9,534 9,829 11,070 12,396 13,972 EBIT 91,076 84,364 35,369 22,919 33,779 47,297 Interest 513 1,253 1,326 1,770 1,853 1,961 Other Income 12,656 11,217 16,160 13,936 17,620 20,814 Extraordinary items -193 -4 -60 0 0 0 PBT 103,026 94,324 50,143 35,085 49,546 66,150 Tax 32,623 28,177 15,535 10,175 13,873 18,522 Tax Rate (%) 31.7 29.9 31.0 29.0 28.0 28.0 Reported PAT 70,403 66,147 34,608 24,910 35,673 47,628 Adjusted PAT 68,922 65,540 35,887 24,910 35,673 47,628 Change (%) 22 -5 -45 -31 43 34
Balance sheet (INR Million) Y/E Mar 2012 2013 2014 2015E 2016E 2017E Share Capital 4,895 4,895 4,895 4,895 4,895 4,895 Reserves 248,837 299,546 325,575 344,507 371,619 407,816 Net Worth 253,732 304,441 330,471 349,402 376,514 412,712 Debt 1,234 14,152 26,548 26,250 26,250 26,250 Deferred Tax -15,462 -15,507 -19,690 -19,690 -19,690 -19,690 Total Capital Employed 239,504 303,086 337,329 355,963 383,075 419,272 Gross Fixed Assets 97,066 107,832 120,505 130,231 144,021 160,811 Less: Acc Depreciation 54,098 63,248 73,576 85,173 97,569 111,542 Net Fixed Assets 42,968 44,585 46,929 45,058 46,452 49,270 Capital WIP 13,476 11,716 6,421 5,000 5,000 5,000 Investments 4,617 4,292 4,202 4,202 4,202 4,202 Current Assets 591,237 625,187 650,670 636,629 672,719 721,069 Inventory 135,487 117,638 97,976 86,450 93,692 100,874 Debtors 357,405 398,882 399,530 335,739 313,846 307,154 Cash & Bank 66,720 77,321 118,729 180,670 232,967 278,669 Loans & Adv, Others 31,624 31,346 34,435 33,770 32,214 34,371 Curr Liabs & Provns 412,794 382,694 370,894 334,926 345,298 360,268 Curr. Liabilities 336,380 293,273 267,633 237,843 244,006 253,444 Provisions 76,414 89,421 103,260 97,083 101,291 106,824 Net Current Assets 178,443 242,493 279,776 301,703 327,421 360,801 Total Assets 239,504 303,085 337,329 355,963 383,075 419,272
E: MOSL Estimates
BHEL
17 September 2014 18
Financials and valuations
Ratios Y/E Mar 2012 2013 2014 2015E 2016E 2017E Basic (INR) EPS 28.2 26.8 14.7 10.2 14.6 19.5 Cash EPS 31.4 30.7 18.7 14.7 19.6 25.2 Book Value 103.7 124.4 135.0 142.8 153.8 168.6 DPS 6.4 5.4 2.8 2.0 2.9 3.9 Payout (incl. Div. Tax.) 22.3 20.0 20.0 20.0 24.0 24.0 Valuation(x) P/E 7.8 8.2 15.0 21.6 15.1 11.3 Cash P/E 7.0 7.2 11.8 15.0 11.2 8.7 Price / Book Value 2.1 1.8 1.6 1.5 1.4 1.3 EV/EBITDA 4.8 5.1 9.9 11.3 7.2 4.7 Dividend Yield (%) 2.9 2.5 1.3 0.9 1.3 1.8 Profitability Ratios (%) RoE 30.9 23.7 10.9 7.3 9.8 12.1 RoCE 43.3 31.1 11.0 6.6 9.1 11.8 Turnover Ratios (%) Asset Turnover (x) 2.3 1.8 1.2 1.0 1.0 1.0 Debtors (No. of Days) 271.9 300.7 372.9 367.3 311.0 271.9 Inventory (No. of Days) 103.1 88.7 91.4 94.6 92.8 89.3 Creditors (No. of Days) 104.2 97.5 100.1 95.6 95.2 94.7 Leverage Ratios (%) Net Debt/Equity (x) -0.3 -0.2 -0.3 -0.4 0.1 0.1
Cash flow statement (INR Million) Y/E Mar 2012 2013 2014 2015E 2016E 2017E OP/(Loss) before Tax 103,218 94,329 50,203 35,085 49,546 66,150 Depreciation 8,000 9,534 9,829 11,070 12,396 13,972 Others 0 0 0 0 0 0 Interest 513 1,253 1,326 1,770 1,853 1,961 Direct Taxes Paid 32,623 28,177 15,535 10,175 13,873 18,522 (Inc)/Dec in Wkg Cap -78,991 -14,873 24,026 47,121 24,798 8,575 CF from Op. Activity -4,780 24,452 54,209 78,993 75,424 74,689 (Inc)/Dec in FA & CWIP -13,097 -9,390 -6,879 -7,777 -13,790 -16,790 (Pur)/Sale of Invt -225 325 90 0 0 0 Others 0 0 0 0 0 0 CF from Inv. Activity -13,322 -9,065 -6,789 -7,777 -13,790 -16,790 Inc/(Dec) in Net Worth 6,169 -43 -4,657 0 0 0 Inc / (Dec) in Debt 213 12,918 12,396 -298 0 0 Interest Paid 513 1,253 1,326 1,770 1,853 1,961 Divd Paid (incl Tax) 17,960 16,406 12,425 7,208 7,485 10,235 CF from Fin. Activity -12,091 -4,784 -6,012 -9,275 -9,338 -12,196 Inc/(Dec) in Cash -30,194 10,602 41,408 61,941 52,296 45,703 Add: Opening Balance 96,302 66,720 77,321 118,729 180,670 232,967 Closing Balance 66,108 77,322 118,728 180,670 232,967 278,669
E: MOSL Estimates
Capital Goods
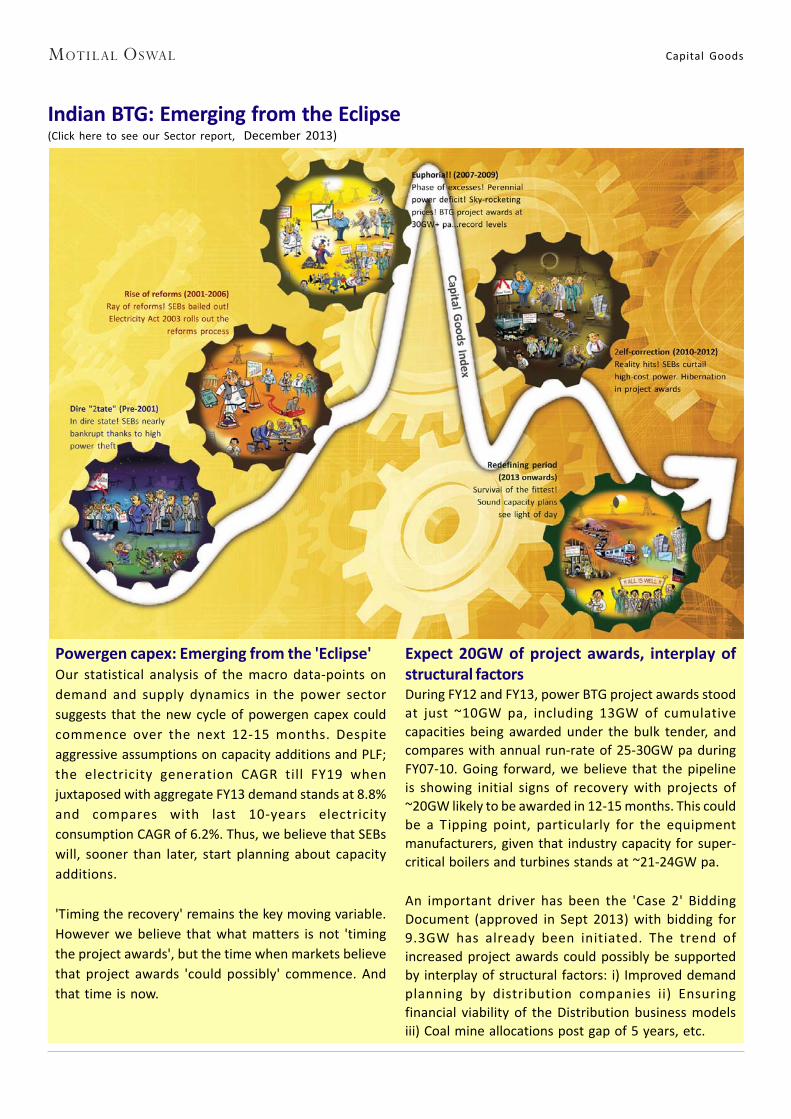
Indian BTG: Emerging from the Eclipse(Click here to see our Sector report, December 2013)
Powergen capex: Emerging from the 'Eclipse'Our statistical analysis of the macro data-points on
demand and supply dynamics in the power sector
suggests that the new cycle of powergen capex could
commence over the next 12-15 months. Despite
aggressive assumptions on capacity additions and PLF;
the electricity generation CAGR till FY19 when
juxtaposed with aggregate FY13 demand stands at 8.8%
and compares with last 10-years electricity
consumption CAGR of 6.2%. Thus, we believe that SEBs
will, sooner than later, start planning about capacity
additions.
'Timing the recovery' remains the key moving variable.
However we believe that what matters is not 'timing
the project awards', but the time when markets believe
that project awards 'could possibly' commence. And
that time is now.
Expect 20GW of project awards, interplay ofstructural factorsDuring FY12 and FY13, power BTG project awards stood
at just ~10GW pa, including 13GW of cumulative
capacities being awarded under the bulk tender, and
compares with annual run-rate of 25-30GW pa during
FY07-10. Going forward, we believe that the pipeline
is showing initial signs of recovery with projects of
~20GW likely to be awarded in 12-15 months. This could
be a Tipping point, particularly for the equipment
manufacturers, given that industry capacity for super-
critical boilers and turbines stands at ~21-24GW pa.
An important driver has been the 'Case 2' Bidding
Document (approved in Sept 2013) with bidding for
9.3GW has already been initiated. The trend of
increased project awards could possibly be supported
by interplay of structural factors: i) Improved demand
planning by distribution companies ii) Ensuring
financial viability of the Distribution business models
iii) Coal mine allocations post gap of 5 years, etc.

Bharat Electronics
10 September 2014 24

BHEL
17 September 2014 21
N O T E S
BHEL
17 September 2014 22
Disclosures This research report has been prepared by MOSt to provide information about the company(ies) and sector(s), if any, covered in the report and may be distributed by it and/or its affiliated company(ies). This report is for personal information of the select recipient and does not construe to be any investment, legal or taxation advice to you. This research report does not constitute an offer, invitation or inducement to invest in securities or other investments and Motilal Oswal Securities Limited (hereinafter referred as MOSt) is not soliciting any action based upon it. This report is not for public distribution and has been furnished to you solely for your general information and should not be reproduced or redistributed to any other person in any form. This report does not constitute a personal recommendation or take into account the particular investment objectives, financial situations, or needs of individual clients. Before acting on any advice or recommendation in this material, investors should consider whether it is suitable for their particular circumstances and, if necessary, seek professional advice. The price and value of the investments referred to in this material and the income from them may go down as well as up, and investors may realize losses on any investments. Past performance is not a guide for future performance, future returns are not guaranteed and a loss of original capital may occur.
MOSt and its affiliates are a full-service, integrated investment banking, investment management, brokerage and financing group. We and our affiliates have investment banking and other business relationships with a significant percentage of the companies covered by our Research Department Our research professionals provide important input into our investment banking and other business selection processes. Investors should assume that MOSt and/or its affiliates are seeking or will seek investment banking or other business from the company or companies that are the subject of this material and that the research professionals who were involved in preparing this material may participate in the solicitation of such business. The research professionals responsible for the preparation of this document may interact with trading desk personnel, sales personnel and other parties for the purpose of gathering, applying and interpreting market information. Our research professionals are paid in part based on the profitability of MOSt which include earnings from investment banking and other business. MOSt generally prohibits its analysts, persons reporting to analysts, and members of their households from maintaining a financial interest in the securities or derivatives of any companies that the analysts cover. Additionally, MOSt generally prohibits its analysts and persons reporting to analysts from serving as an officer, director, or advisory board member of any companies that the analysts cover. Our salespeople, traders, and other professionals or affiliates may provide oral or written market commentary or trading strategies to our clients that reflect opinions that are contrary to the opinions expressed herein, and our proprietary trading and investing businesses may make investment decisions that are inconsistent with the recommendations expressed herein. In reviewing these materials, you should be aware that any or all o the foregoing, among other things, may give rise to real or potential conflicts of interest . MOSt and its affiliated company(ies), their directors and employees may; (a) from time to time, have a long or short position in, and buy or sell the securities of the company(ies) mentioned herein or (b) be engaged in any other transaction involving such securities and earn brokerage or other compensation or act as a market maker in the financial instruments of the company(ies) discussed herein or act as an advisor or lender/borrower to such company(ies) or may have any other potential conflict of interests with respect to any recommendation and other related information and opinions.
Unauthorized disclosure, use, dissemination or copying (either whole or partial) of this information, is prohibited. The person accessing this information specifically agrees to exempt MOSt or any of its affiliates or employees from, any and all responsibility/liability arising from such misuse and agrees not to hold MOSt or any of its affiliates or employees responsible for any such misuse and further agrees to hold MOSt or any of its affiliates or employees free and harmless from all losses, costs, damages, expenses that may be suffered by the person accessing this information due to any errors and delays. The information contained herein is based on publicly available data or other sources believed to be reliable. Any statements contained in this report attributed to a third party represent MOSt’s interpretation of the data, information and/or opinions provided by that third party either publicly or through a subscription service, and such use and interpretation have not been reviewed by the third party. This Report is not intended to be a complete statement or summary of the securities, markets or developments referred to in the document. While we would endeavor to update the information herein on reasonable basis, MOSt and/or its affiliates are under no obligation to update the information. Also there may be regulatory, compliance, or other reasons that may prevent MOSt and/or its affiliates from doing so. MOSt or any of its affiliates or employees shall not be in any way responsible and liable for any loss or damage that may arise to any person from any inadvertent error in the information contained in this report. MOSt or any of its affiliates or employees do not provide, at any time, any express or implied warranty of any kind, regarding any matter pertaining to this report, including without limitation the implied warranties of merchantability, fitness for a particular purpose, and non-infringement. The recipients of this report should rely on their own investigations.
Recipients who are not institutional investors should seek advice of their independent financial advisor prior to taking any investment decision based on this report or for any necessary explanation of its contents.
MOSt and/or its affiliates and/or employees may have interests/positions, financial or otherwise in the securities mentioned in this report. To enhance transparency, MOSt has incorporated a Disclosure of Interest Statement in this document. This should, however, not be treated as endorsement of the views expressed in the report.
Disclosure of Interest Statement BHARAT HEAVY ELECTRIC Analyst ownership of the stock No
Analyst Certification The views expressed in this research report accurately reflect the personal views of the analyst(s) about the subject securities or issues, and no part of the compensation of the research analyst(s) was, is, or will be directly or indirectly related to the specific recommendations and views expressed by research analyst(s) in this report. The research analysts, strategists, or research associates principally responsible for preparation of MOSt research receive compensation based upon various factors, including quality of research, investor client feedback, stock picking, competitive factors and firm revenues.
Regional Disclosures (outside India) This report is not directed or intended for distribution to or use by any person or entity resident in a state, country or any jurisdiction, where such distribution, publication, availability or use would be contrary to law, regulation or which would subject MOSt & its group companies to registration or licensing requirements within such jurisdictions.
For U.K. This report is intended for distribution only to persons having professional experience in matters relating to investments as described in Article 19 of the Financial Services and Markets Act 2000 (Financial Promotion) Order 2005 (referred to as "investment professionals"). This document must not be acted on or relied on by persons who are not investment professionals. Any investment or investment activity to which this document relates is only available to investment professionals and will be engaged in only with such persons.
For U.S. Motilal Oswal Securities Limited (MOSL) is not a registered broker - dealer under the U.S. Securities Exchange Act of 1934, as amended (the"1934 act") and under applicable state laws in the United States. In addition MOSL is not a registered investment adviser under the U.S. Investment Advisers Act of 1940, as amended (the "Advisers Act" and together with the 1934 Act, the "Acts), and under applicable state laws in the United States. Accordingly, in the absence of specific exemption under the Acts, any brokerage and investment services provided by MOSL, including the products and services described herein are not available to or intended for U.S. persons.
This report is intended for distribution only to "Major Institutional Investors" as defined by Rule 15a-6(b)(4) of the Exchange Act and interpretations thereof by SEC (henceforth referred to as "major institutional investors"). This document must not be acted on or relied on by persons who are not major institutional investors. Any investment or investment activity to which this document relates is only available to major institutional investors and will be engaged in only with major institutional investors. In reliance on the exemption from registration provided by Rule 15a-6 of the U.S. Securities Exchange Act of 1934, as amended (the "Exchange Act") and interpretations thereof by the U.S. Securities and Exchange Commission ("SEC") in order to conduct business with Institutional Investors based in the U.S., MOSL has entered into a chaperoning agreement with a U.S. registered broker-dealer, Motilal Oswal Securities International Private Limited. ("MOSIPL"). Any business interaction pursuant to this report will have to be executed within the provisions of this chaperoning agreement.
The Research Analysts contributing to the report may not be registered /qualified as research analyst with FINRA. Such research analyst may not be associated persons of the U.S. registered broker-dealer, MOSIPL, and therefore, may not be subject to NASD rule 2711 and NYSE Rule 472 restrictions on communication with a subject company, public appearances and trading securities held by a research analyst account.
For Singapore Motilal Oswal Capital Markets Singapore Pte Limited is acting as an exempt financial advisor under section 23(1)(f) of the Financial Advisers Act(FAA) read with regulation 17(1)(d) of the Financial Advisors Regulations and is a subsidiary of Motilal Oswal Securities Limited in India. This research is distributed in Singapore by Motilal Oswal Capital Markets Singapore Pte Limited and it is only directed in Singapore to accredited investors, as defined in the Financial Advisers Regulations and the Securities and Futures Act (Chapter 289), as amended from time to time. In respect of any matter arising from or in connection with the research you could contact the following representatives of Motilal Oswal Capital Markets Singapore Pte Limited: Anosh Koppikar Kadambari Balachandran Email:[email protected] Email : [email protected] Contact(+65)68189232 Contact: (+65) 68189233 / 65249115 Office Address:21 (Suite 31),16 Collyer Quay,Singapore 04931
Motilal Oswal Securities Ltd
Motilal Oswal Tower, Level 9, Sayani Road, Prabhadevi, Mumbai 400 025 Phone: +91 22 3982 5500 E-mail: [email protected]