Embed Size (px)
Citation preview
For updated information, please visit www.ibef.orgSeptember 2021
ENGINEERING AND CAPITAL GOODS
2
Executive Summary 3
Advantage India 5
Market Overview 7
Notable Trends and Strategies 18
Growth Drivers 21
Opportunities 34
Key Industry Contacts 40
Appendix 42
Table of Contents

3
Executive summary … (1/2)
Electrical equipment production (US$ billion)
27.3
100
0
50
100
150
FY18 FY22F
Engineering R&D Revenue (US$ billion)
36 4263
0
20
40
60
80
FY19* FY22F FY25F
Capital goods turnover (US$ billion)
92.00115.17
0
50
100
150
2019 2025F
Engineering is one of the largest industrial sectors in India.
It accounts for 27% of the total factories in the industrial sectors andrepresents 63% of the overall foreign collaborations.
Increasing industrialisation and economic development drives growthin the capital goods market.
Turnover of the capital goods industry was estimated at US$ 92billion in 2019 and is forecast to reach US$ 115.17 billion by 2025.
Growth in the power industry is expected to drive growth in theelectrical equipment industry.
Electrical equipment market production is forecast to reach Rs.500,000 crore (US$ 100 billion) by 2022 from Rs. 175,000 crore(US$ 27.3 billion) in 2017-18.
The Index of Industrial Production (IIP) for the electrical equipment industry stood at 92.0 in FY21.
Engineering R&D (ER&D) revenues are projected to reach US$ 42 billion by FY22F from US$ 36 billion in FY19*.
– According to the National Association of Software and ServiceCompanies (Nasscom), India’s share in the global engineeringand research and development (ER&D) market is likely to expandat a CAGR of 12-13% to reach US$ 63 billion by 2025.
Source: Dept. of Heavy Industries, India Electrical and Electronics Manufacturer Association, NASSCOM, Business TodayNote: *including product engineering services, F-Forecast,
4
Executive summary … (2/2)
Production by CPSEs under DHI (US$ billion)
5.20
5.61 5.68
4.805.005.205.405.605.80
FY18A FY19E FY20T
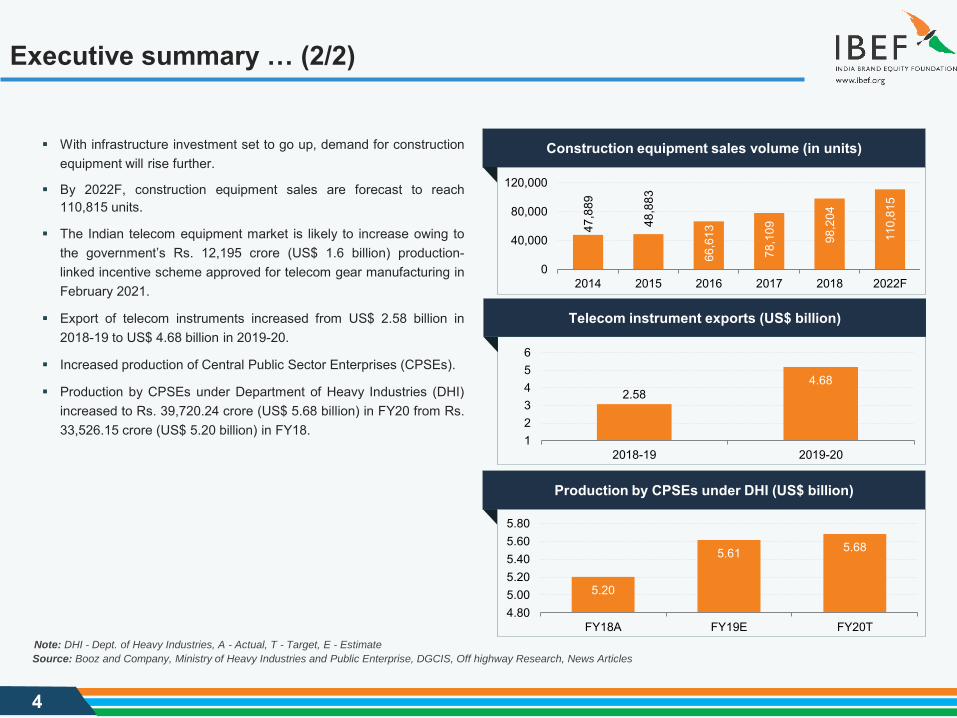
With infrastructure investment set to go up, demand for constructionequipment will rise further.
By 2022F, construction equipment sales are forecast to reach110,815 units.
The Indian telecom equipment market is likely to increase owing tothe government’s Rs. 12,195 crore (US$ 1.6 billion) production-linked incentive scheme approved for telecom gear manufacturing inFebruary 2021.
Export of telecom instruments increased from US$ 2.58 billion in2018-19 to US$ 4.68 billion in 2019-20.
Increased production of Central Public Sector Enterprises (CPSEs).
Production by CPSEs under Department of Heavy Industries (DHI)increased to Rs. 39,720.24 crore (US$ 5.68 billion) in FY20 from Rs.33,526.15 crore (US$ 5.20 billion) in FY18.
Source: Booz and Company, Ministry of Heavy Industries and Public Enterprise, DGCIS, Off highway Research, News Articles
Telecom instrument exports (US$ billion)
2.584.68
123456
2018-19 2019-20
Construction equipment sales volume (in units)
47,8
89
48,8
83
66,6
13
78,1
09
98,2
04
110,
815
0
40,000
80,000
120,000
2014 2015 2016 2017 2018 2022F
Note: DHI - Dept. of Heavy Industries, A - Actual, T - Target, E - Estimate
5
Advantage India
6
Advantage India
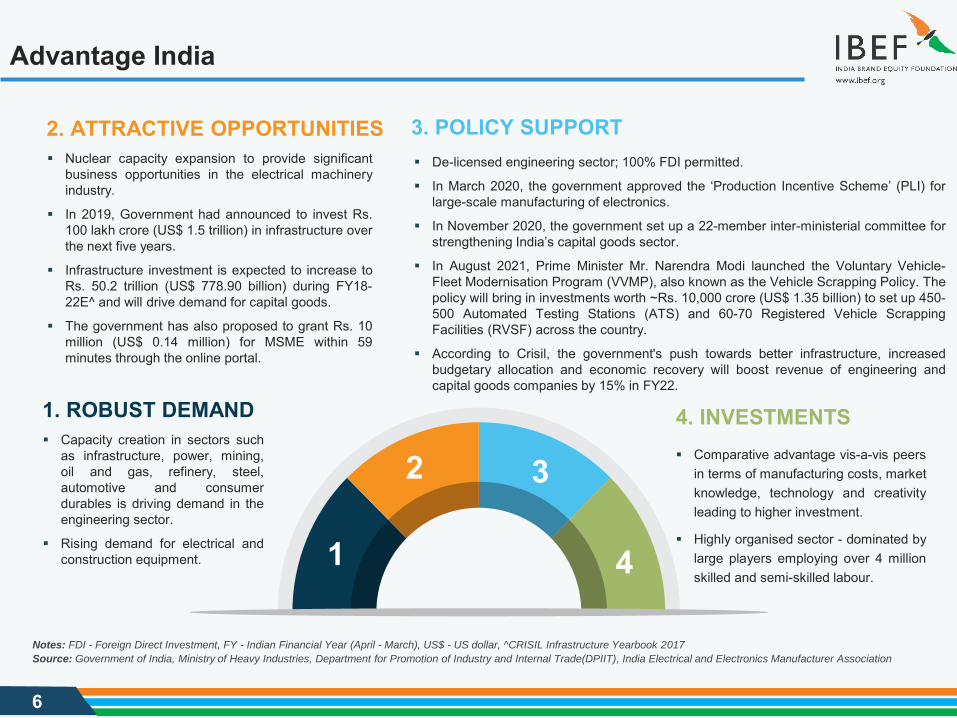
4. INVESTMENTS Comparative advantage vis-a-vis peers
in terms of manufacturing costs, marketknowledge, technology and creativityleading to higher investment.
Highly organised sector - dominated bylarge players employing over 4 millionskilled and semi-skilled labour.
1. ROBUST DEMAND Capacity creation in sectors such
as infrastructure, power, mining,oil and gas, refinery, steel,automotive and consumerdurables is driving demand in theengineering sector.
Rising demand for electrical andconstruction equipment.
3. POLICY SUPPORT De-licensed engineering sector; 100% FDI permitted.
In March 2020, the government approved the ‘Production Incentive Scheme’ (PLI) forlarge-scale manufacturing of electronics.
In November 2020, the government set up a 22-member inter-ministerial committee forstrengthening India’s capital goods sector.
In August 2021, Prime Minister Mr. Narendra Modi launched the Voluntary Vehicle-Fleet Modernisation Program (VVMP), also known as the Vehicle Scrapping Policy. Thepolicy will bring in investments worth ~Rs. 10,000 crore (US$ 1.35 billion) to set up 450-500 Automated Testing Stations (ATS) and 60-70 Registered Vehicle ScrappingFacilities (RVSF) across the country.
According to Crisil, the government's push towards better infrastructure, increasedbudgetary allocation and economic recovery will boost revenue of engineering andcapital goods companies by 15% in FY22.
1
2 3
4
Source: Government of India, Ministry of Heavy Industries, Department for Promotion of Industry and Internal Trade(DPIIT), India Electrical and Electronics Manufacturer Association
Notes: FDI - Foreign Direct Investment, FY - Indian Financial Year (April - March), US$ - US dollar, ^CRISIL Infrastructure Yearbook 2017
2. ATTRACTIVE OPPORTUNITIES Nuclear capacity expansion to provide significant
business opportunities in the electrical machineryindustry.
In 2019, Government had announced to invest Rs.100 lakh crore (US$ 1.5 trillion) in infrastructure overthe next five years.
Infrastructure investment is expected to increase toRs. 50.2 trillion (US$ 778.90 billion) during FY18-22E^ and will drive demand for capital goods.
The government has also proposed to grant Rs. 10million (US$ 0.14 million) for MSME within 59minutes through the online portal.
7
Market Overview
MARKET OVERVIEW
8
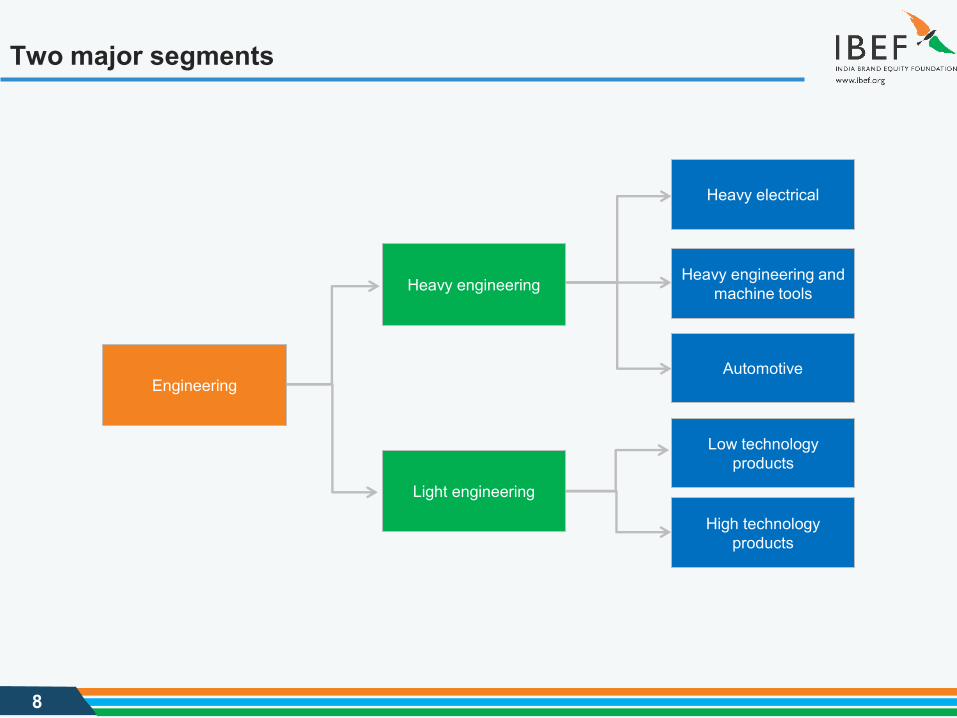
Two major segments
Engineering
Heavy engineering
Light engineering
Heavy electrical
Heavy engineering and machine tools
Automotive
Low technology products
High technology products

9
Heavy engineering - key segments ... (1/2)
1Machine tools
The Indian machine tool production and consumption were estimated at Rs. 6,150 crore (US$ 872.46 million) and Rs. 15,670 crore (US$ 2.22 billion), respectively, in 2019-20.
This segment churns out basic machinery for all the major industries and determine competitiveness in other sectors such as automobiles, heavy electrical and defence.
In September 2021, Bharat Fritz Werner India, a leading machine tool manufacturer in the subcontinent, announced that it is entering the metal additive manufacturing area.
2Textile machinery• It comprises over 1,446 units involved in churning out machinery and components. Another 600 units manufacture complete machinery.• Market size of textile machinery stood at US$ 4.85 billion in 2018 and is expected to reach US$ 5.2 billion by 2021.• The industry produced total machinery worth Rs. 6,900 crore (US$ 1,070.60 million) in FY19 including spares and accessories worth Rs.
920 crore (US$ 142.75 million).• In September 2021, the government announced its Production-linked Incentive (PLI) scheme of Rs. 10,683 crore (US$ 1.4 billion), for
textiles, specifically aimed at boosting production of man-made fibre (MMF) fabric, MMF apparel and technical textiles.
3Cement machinery
Cement plants based on raw mill grinding, pre-processing and cement grinding process technology (for capacities up to 10,000 TPD) are being manufactured in India.
Currently,100% FDI is allowed under the automatic route.
Source: Indian Machine Tool Manufacturers' Association, Textile Machinery Manufacturing Association, Cabinet Committee on Infrastructure report, ITMACH India
10
Heavy engineering - key segments ... (2/2)
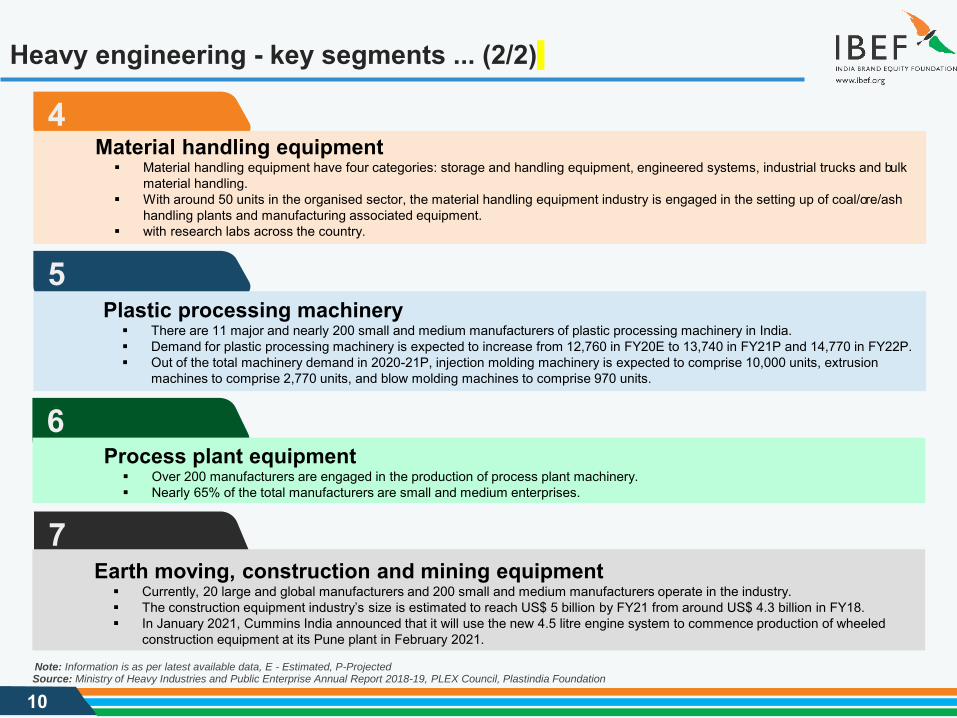
4Material handling equipment
Material handling equipment have four categories: storage and handling equipment, engineered systems, industrial trucks and bulkmaterial handling.
With around 50 units in the organised sector, the material handling equipment industry is engaged in the setting up of coal/ore/ash handling plants and manufacturing associated equipment.
with research labs across the country.
5Plastic processing machinery
There are 11 major and nearly 200 small and medium manufacturers of plastic processing machinery in India. Demand for plastic processing machinery is expected to increase from 12,760 in FY20E to 13,740 in FY21P and 14,770 in FY22P. Out of the total machinery demand in 2020-21P, injection molding machinery is expected to comprise 10,000 units, extrusion
machines to comprise 2,770 units, and blow molding machines to comprise 970 units.
6Process plant equipment
Over 200 manufacturers are engaged in the production of process plant machinery. Nearly 65% of the total manufacturers are small and medium enterprises.
7Earth moving, construction and mining equipment
Currently, 20 large and global manufacturers and 200 small and medium manufacturers operate in the industry. The construction equipment industry’s size is estimated to reach US$ 5 billion by FY21 from around US$ 4.3 billion in FY18. In January 2021, Cummins India announced that it will use the new 4.5 litre engine system to commence production of wheeled
construction equipment at its Pune plant in February 2021.
Source: Ministry of Heavy Industries and Public Enterprise Annual Report 2018-19, PLEX Council, Plastindia FoundationNote: Information is as per latest available data, E - Estimated, P-Projected

11
Light engineering - key segments
3. Industrial fasteners The fasteners industry in India can be classified into high tensile and mild steel fasteners.
Mild steel fasteners are primarily manufactured by the unorganised sector, while the high tensile steelsegment is dominated by the organised sector.
1. Casting and forging India overtook US to become the
second largest casting producerglobally. Production of castings inIndia stood at 12.05 MT in FY19.
Turnover of the Indian forging industrygrew nearly 12% y-o-y to Rs. 35,000crore (US$ 5.43 billion) in FY19.
2. Medical and surgical equipment The medical and surgical equipment
industry manufactures a wide range ofmedical equipment, such as ECG and X-ray scanners.
The indigenous industry caters to 40% ofdemand, while the remaining is metthrough imports.
Export of medical and scientificinstruments reached US$ 36 billion inFY20.
Source: Ministry of Heavy Industries and Public Enterprise Annual Report, Association of Indian Forging Industry (AIFI), IVG Research

12
Heavy electrical - key segments
4. SWITCHGEAR AND CONTROL GEAR
The market size of highvoltage switchgear(including panels) and owvoltage switchgear(including panels) stoodat Rs. 4,793 crore (US$679.95 million).
1. BOILERS As per the latest data available,
the Indian boiler industry has the capability to manufacture boilers with super critical parameters up to 1,000 MW unit size.
The industry’s market size reached US$ 12.8 billion in 2018 and is expected to reach US$ 20 billion in 2026.
Export for boilers stood at US$ 29.68 million in FY20.
3. TRANSFORMERS A whole range of power and distribution transformers, including
special type of transformers required for furnaces, electric tracts and rectifiers, are manufactured in India.
In April 2021, Tata Power, in collaboration with Hitachi ABBPower Grids and Cargill, commissioned India’s largest naturalester-filled 110/33/22 kV, 125 MVA power transformer in theMumbai Transmission network at the Bandra-Kurla Complexreceiving station.
2. TURBINES AND GENERATOR SETS As per the latest data available, the industry manufactures various
turbines in the range of 800-7000 MW per annum and generatorsranging from 0.5 KVA to (ones even higher than) 25000 KVA.
In August 2021, Bharat Heavy Electricals secured its largest-ever orderworth Rs. 10,800 crore (US$ 1.45 billion) from the Nuclear PowerCorporation of India Limited (NPCIL) for the EPC of a turbine island for 6units of 700 MW.
1
2 3
4
Source: Ministry of Heavy Industries and Public Enterprise Annual Report, News Articles
Notes: MW - Mega Watt, KVA - KiloVolt - Ampere
13
Automotive - key segments
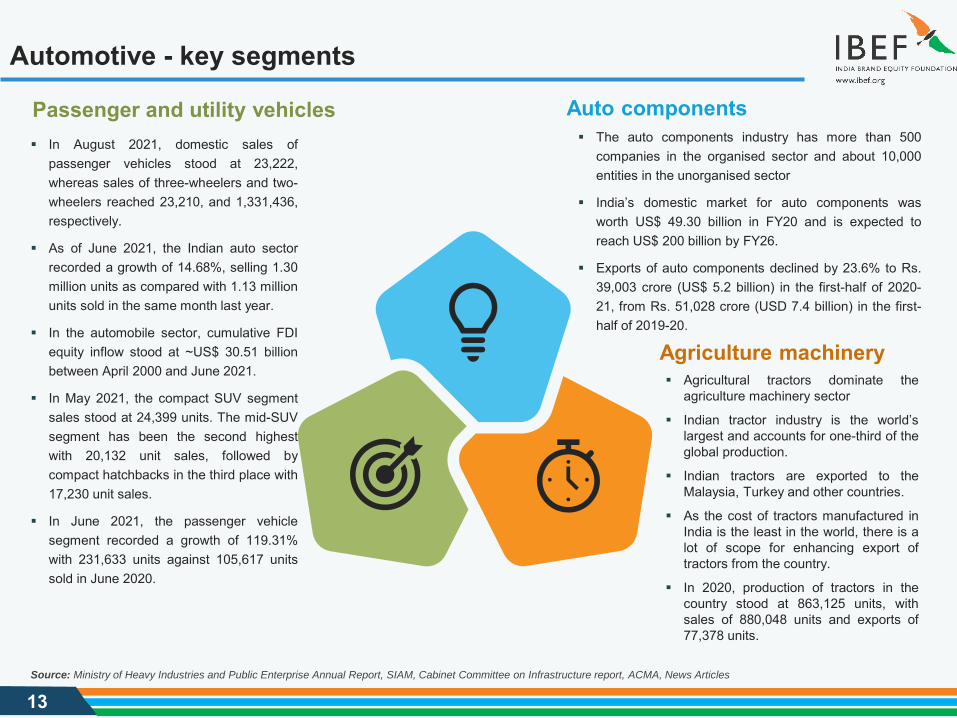
Agriculture machinery Agricultural tractors dominate the
agriculture machinery sector
Indian tractor industry is the world’slargest and accounts for one-third of theglobal production.
Indian tractors are exported to theMalaysia, Turkey and other countries.
As the cost of tractors manufactured inIndia is the least in the world, there is alot of scope for enhancing export oftractors from the country.
In 2020, production of tractors in thecountry stood at 863,125 units, withsales of 880,048 units and exports of77,378 units.
Passenger and utility vehicles In August 2021, domestic sales of
passenger vehicles stood at 23,222,whereas sales of three-wheelers and two-wheelers reached 23,210, and 1,331,436,respectively.
As of June 2021, the Indian auto sectorrecorded a growth of 14.68%, selling 1.30million units as compared with 1.13 millionunits sold in the same month last year.
In the automobile sector, cumulative FDIequity inflow stood at ~US$ 30.51 billionbetween April 2000 and June 2021.
In May 2021, the compact SUV segmentsales stood at 24,399 units. The mid-SUVsegment has been the second highestwith 20,132 unit sales, followed bycompact hatchbacks in the third place with17,230 unit sales.
In June 2021, the passenger vehiclesegment recorded a growth of 119.31%with 231,633 units against 105,617 unitssold in June 2020.
Auto components The auto components industry has more than 500
companies in the organised sector and about 10,000entities in the unorganised sector
India’s domestic market for auto components wasworth US$ 49.30 billion in FY20 and is expected toreach US$ 200 billion by FY26.
Exports of auto components declined by 23.6% to Rs.39,003 crore (US$ 5.2 billion) in the first-half of 2020-21, from Rs. 51,028 crore (USD 7.4 billion) in the first-half of 2019-20.
Source: Ministry of Heavy Industries and Public Enterprise Annual Report, SIAM, Cabinet Committee on Infrastructure report, ACMA, News Articles
14
Robust growth in India’s engineering export over the years
58.6
0 65.2
4
76.2
0 80.9
5
75.9
0
76.6
2
26.8
5
0.00
10.00
20.00
30.00
40.00
50.00
60.00
70.00
80.00
90.00
FY16
FY17
FY18
FY19
FY20
FY21
FY22
*
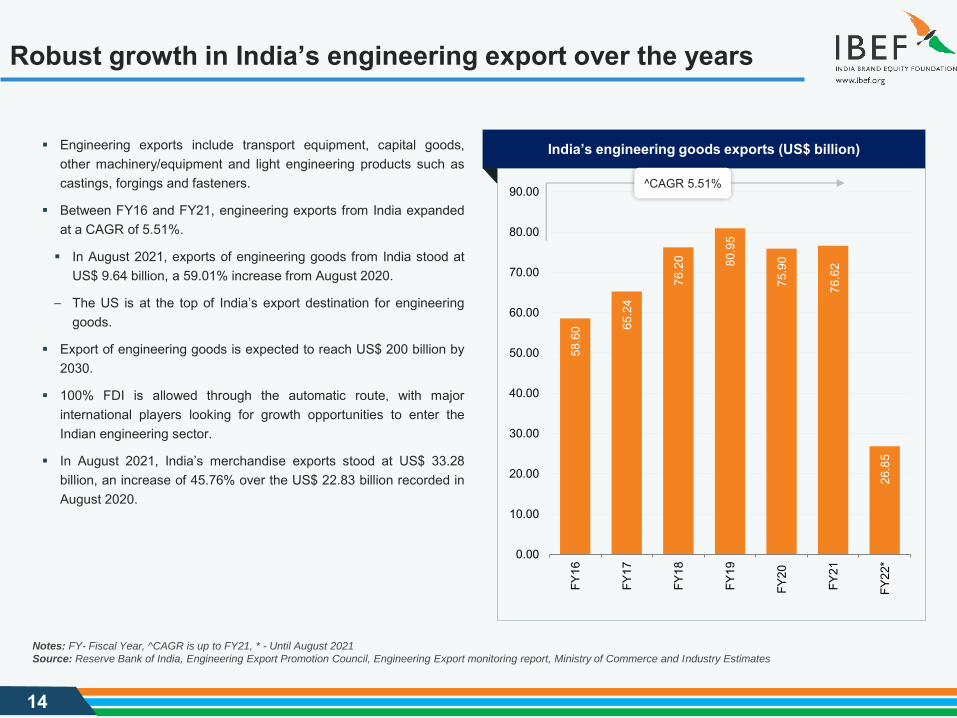
Engineering exports include transport equipment, capital goods,other machinery/equipment and light engineering products such ascastings, forgings and fasteners.
Between FY16 and FY21, engineering exports from India expandedat a CAGR of 5.51%.
In August 2021, exports of engineering goods from India stood atUS$ 9.64 billion, a 59.01% increase from August 2020.
– The US is at the top of India’s export destination for engineeringgoods.
Export of engineering goods is expected to reach US$ 200 billion by2030.
100% FDI is allowed through the automatic route, with majorinternational players looking for growth opportunities to enter theIndian engineering sector.
In August 2021, India’s merchandise exports stood at US$ 33.28billion, an increase of 45.76% over the US$ 22.83 billion recorded inAugust 2020.
India’s engineering goods exports (US$ billion)
^CAGR 5.51%
Notes: FY- Fiscal Year, ^CAGR is up to FY21, * - Until August 2021
Source: Reserve Bank of India, Engineering Export Promotion Council, Engineering Export monitoring report, Ministry of Commerce and Industry Estimates
15
Key categories of engineering exports
21.32%
19.96%
17.81%5.98%
11.30%
11.75%
10.00%
1.87%
Iron and Steel and Productsmade of Iron and Steel
Automobiles
Industrial Machinery
Ships, Boats and Floatingproducts and parts
Other engineering products
Electrical Machinery
Non-Ferrous Metals andProducts made of Non-FerrousMetalsAircrafts and Spacecraft partsand products
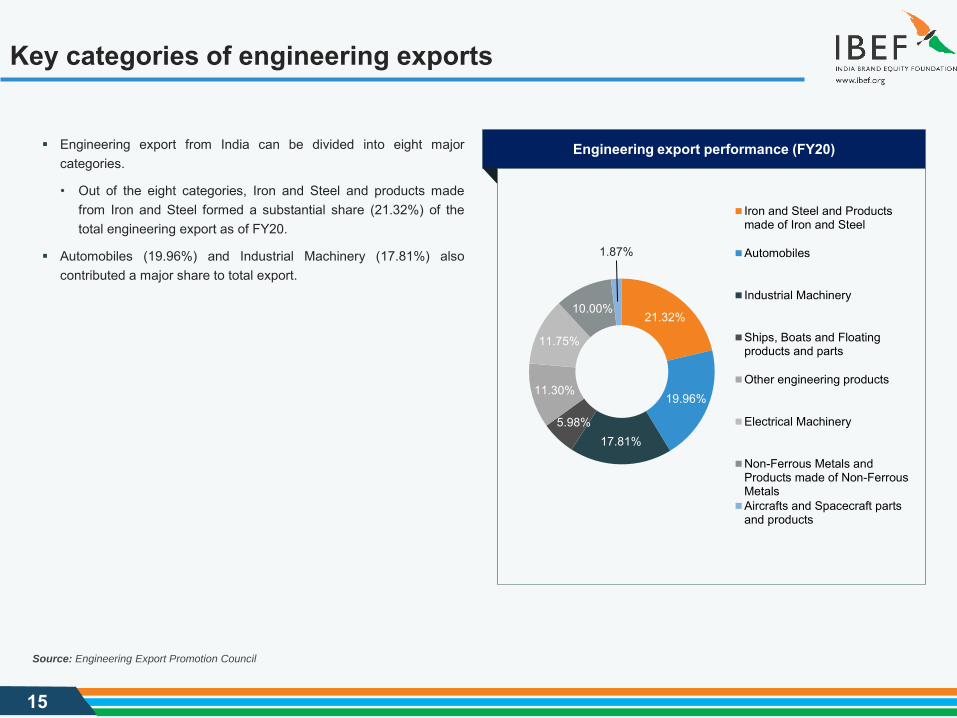
Engineering export from India can be divided into eight majorcategories.
• Out of the eight categories, Iron and Steel and products madefrom Iron and Steel formed a substantial share (21.32%) of thetotal engineering export as of FY20.
Automobiles (19.96%) and Industrial Machinery (17.81%) alsocontributed a major share to total export.
Visakhapatnam port traffic (million tonnes)Engineering export performance (FY20)
Source: Engineering Export Promotion Council

16
Company Revenue (FY21) Products
Larsen and Toubro Rs. 73,316 crore (US$ 9.88 billion)
Engineering and construction, cement, electrical and electronics
Bharat Heavy Electricals Ltd. Rs. 17,678.28 crore (US$ 2.38 billion)
Power generation, transmission, transportation
ABB India Ltd. Rs. 5,926 crore (US$ 798 million) Transformers, switch gears, control gears
CG Power and Industrial Solutions Ltd. Rs. 3,065 crore (US$ 413 million)
Power generation and transmission equipment
Source: Company Annual reports, News Articles, Money control, Bloomberg
Note: Exchanges rates used are average of the period, provided on page 44, *Consolidated Total Revenue
Key players ... (1/2)
17
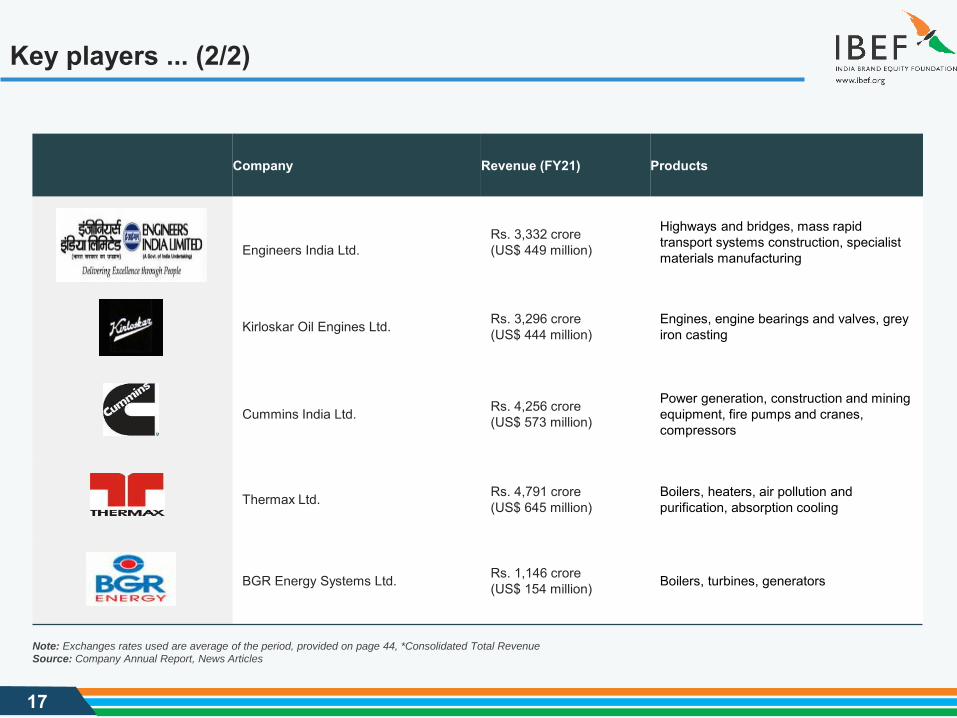
Company Revenue (FY21) Products
Engineers India Ltd.Rs. 3,332 crore (US$ 449 million)
Highways and bridges, mass rapid transport systems construction, specialist materials manufacturing
Kirloskar Oil Engines Ltd. Rs. 3,296 crore (US$ 444 million)
Engines, engine bearings and valves, grey iron casting
Cummins India Ltd. Rs. 4,256 crore (US$ 573 million)
Power generation, construction and mining equipment, fire pumps and cranes, compressors
Thermax Ltd. Rs. 4,791 crore (US$ 645 million)
Boilers, heaters, air pollution and purification, absorption cooling
BGR Energy Systems Ltd. Rs. 1,146 crore (US$ 154 million) Boilers, turbines, generators
Source: Company Annual Report, News Articles
Note: Exchanges rates used are average of the period, provided on page 44, *Consolidated Total Revenue
Key players ... (2/2)

18
Recent Trends and Strategies
RECENT TRENDS AND STRATEGIES

19
Notable trends in the industry
3. Partnership Companies across this sector are
partnering with technologyproviders to enhance theircapabilities and sustain the marketuncertainties.
In December 2020, Schindlerpartnered with L&T TechnologyServices Limited (LTTS) to enhanceits innovative digital engineeringcapabilities. Under this partnership,LTTS would provide services &solutions for product development,innovation and engineering that willhelp Schindler accelerate itsdigitisation and connectivityinitiatives.
Source: Sutherland Research, News Sources
2. Entry of international companies With 100% FDI allowed through the automatic route, major international players such as Cummins,
GE, ABB and Alfa Laval have entered the Indian engineering sector due to growth opportunities.
In June 2019, Joysons Safety Systems (JSS) announced merger of its two joint ventures (JVs) inIndia into a tri-party JV called as Joyson Anand Abhishek Safety Systems Private Limited (JAASS).
1. Diversification Several companies in the
engineering sector have diversified,either geographically (mainly toMiddle Eastern countries) or sector-wise.
BHEL plans to foray into Ukraine.
Simplex Infra has moved to theMiddle East.
Larsen and Toubro (L&T) hasdiversified into power equipmentmanufacturing.
Thermax entered the power utilitysegment.
Reliance Industries diversified intotelecom, power generation, fertiliserand retail sectors.
20
Source: KPMG Report on Engineering sector
Strategies adopted
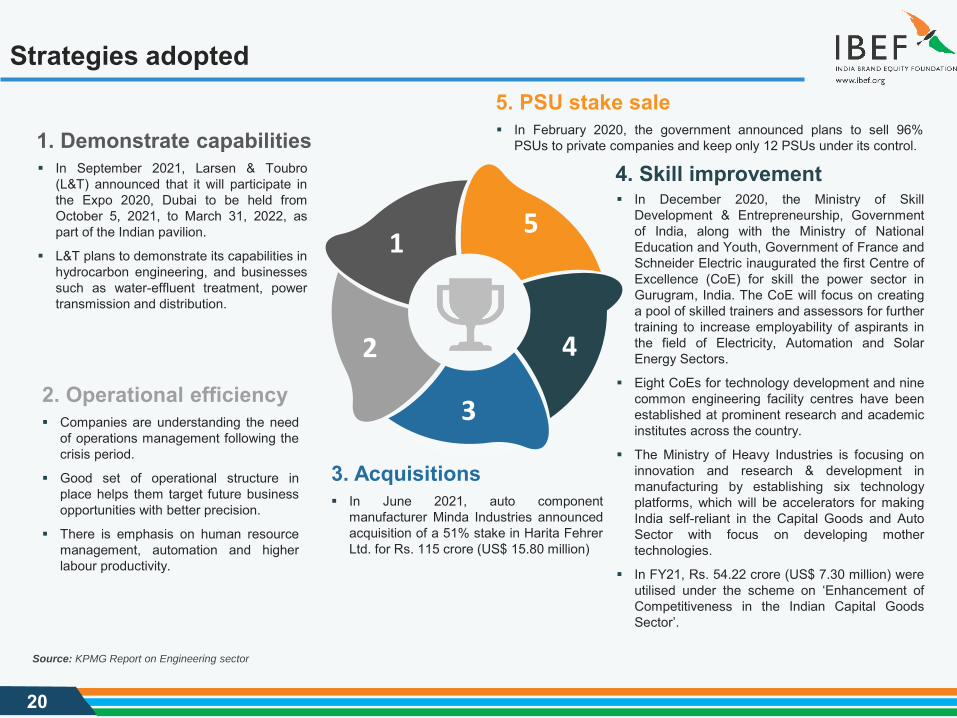
3. Acquisitions In June 2021, auto component
manufacturer Minda Industries announcedacquisition of a 51% stake in Harita FehrerLtd. for Rs. 115 crore (US$ 15.80 million)
5. PSU stake sale In February 2020, the government announced plans to sell 96%
PSUs to private companies and keep only 12 PSUs under its control.1. Demonstrate capabilities In September 2021, Larsen & Toubro
(L&T) announced that it will participate inthe Expo 2020, Dubai to be held fromOctober 5, 2021, to March 31, 2022, aspart of the Indian pavilion.
L&T plans to demonstrate its capabilities inhydrocarbon engineering, and businessessuch as water-effluent treatment, powertransmission and distribution.
4. Skill improvement In December 2020, the Ministry of Skill
Development & Entrepreneurship, Governmentof India, along with the Ministry of NationalEducation and Youth, Government of France andSchneider Electric inaugurated the first Centre ofExcellence (CoE) for skill the power sector inGurugram, India. The CoE will focus on creatinga pool of skilled trainers and assessors for furthertraining to increase employability of aspirants inthe field of Electricity, Automation and SolarEnergy Sectors.
Eight CoEs for technology development and ninecommon engineering facility centres have beenestablished at prominent research and academicinstitutes across the country.
The Ministry of Heavy Industries is focusing oninnovation and research & development inmanufacturing by establishing six technologyplatforms, which will be accelerators for makingIndia self-reliant in the Capital Goods and AutoSector with focus on developing mothertechnologies.
In FY21, Rs. 54.22 crore (US$ 7.30 million) wereutilised under the scheme on ‘Enhancement ofCompetitiveness in the Indian Capital GoodsSector’.
2. Operational efficiency Companies are understanding the need
of operations management following thecrisis period.
Good set of operational structure inplace helps them target future businessopportunities with better precision.
There is emphasis on human resourcemanagement, automation and higherlabour productivity.
5
4
3
2
1

21
Growth Drivers
GROWTH DRIVERS
22
Growth drivers for the Indian engineering sector
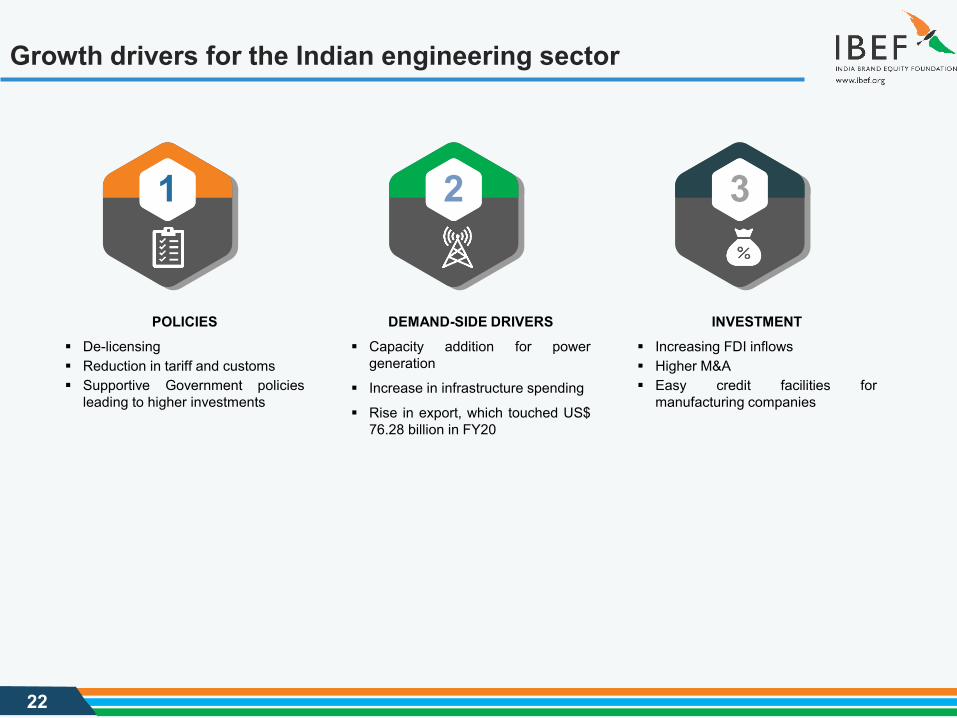
1
POLICIES De-licensing Reduction in tariff and customs Supportive Government policies
leading to higher investments
2
DEMAND-SIDE DRIVERS Capacity addition for power
generation
Increase in infrastructure spending
Rise in export, which touched US$76.28 billion in FY20
3
INVESTMENT Increasing FDI inflows Higher M&A Easy credit facilities for
manufacturing companies
23
Capacity augmentation boosts demand
304.42
175.00
Renewable Sources
287.72
94.43
Conventional Sources
1,21
2.13
1,27
4.56
1,29
0.02
1,56
6.00 2,
047.
000
500
1000
1500
2000
2500
FY18
FY19
FY20
FY22
FY27
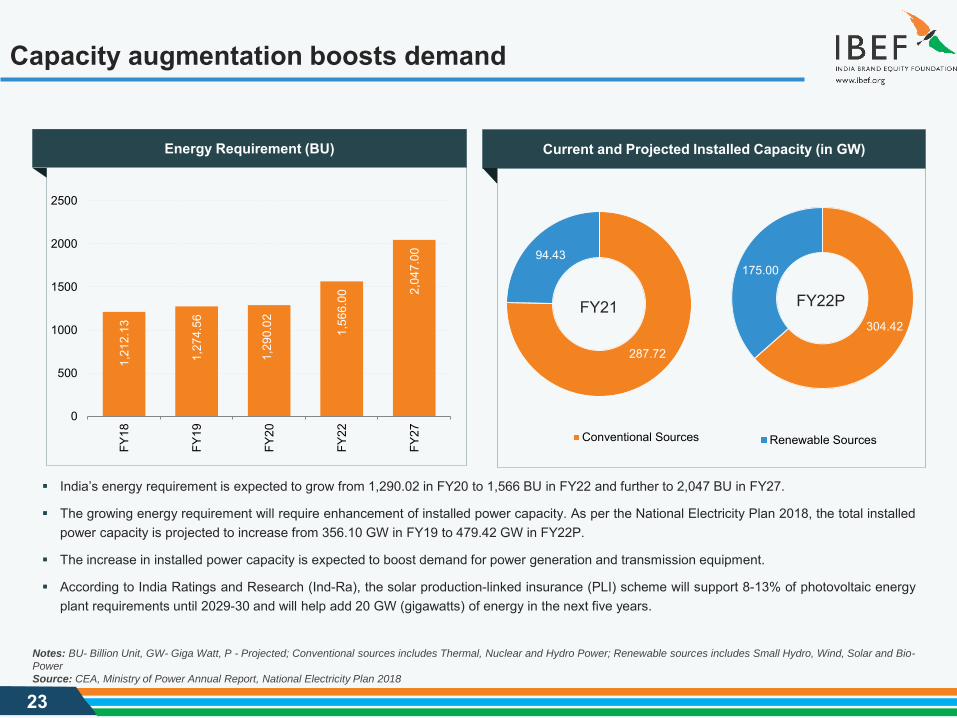
India’s energy requirement is expected to grow from 1,290.02 in FY20 to 1,566 BU in FY22 and further to 2,047 BU in FY27.
The growing energy requirement will require enhancement of installed power capacity. As per the National Electricity Plan 2018, the total installedpower capacity is projected to increase from 356.10 GW in FY19 to 479.42 GW in FY22P.
The increase in installed power capacity is expected to boost demand for power generation and transmission equipment.
According to India Ratings and Research (Ind-Ra), the solar production-linked insurance (PLI) scheme will support 8-13% of photovoltaic energyplant requirements until 2029-30 and will help add 20 GW (gigawatts) of energy in the next five years.
Visakhapatnam port traffic (million tonnes)Current and Projected Installed Capacity (in GW)
Notes: BU- Billion Unit, GW- Giga Watt, P - Projected; Conventional sources includes Thermal, Nuclear and Hydro Power; Renewable sources includes Small Hydro, Wind, Solar and Bio-
Power
Source: CEA, Ministry of Power Annual Report, National Electricity Plan 2018
FY21 FY22P
Energy Requirement (BU)
24
Infrastructure, one of the key demand drivers for machinery... (1/2)
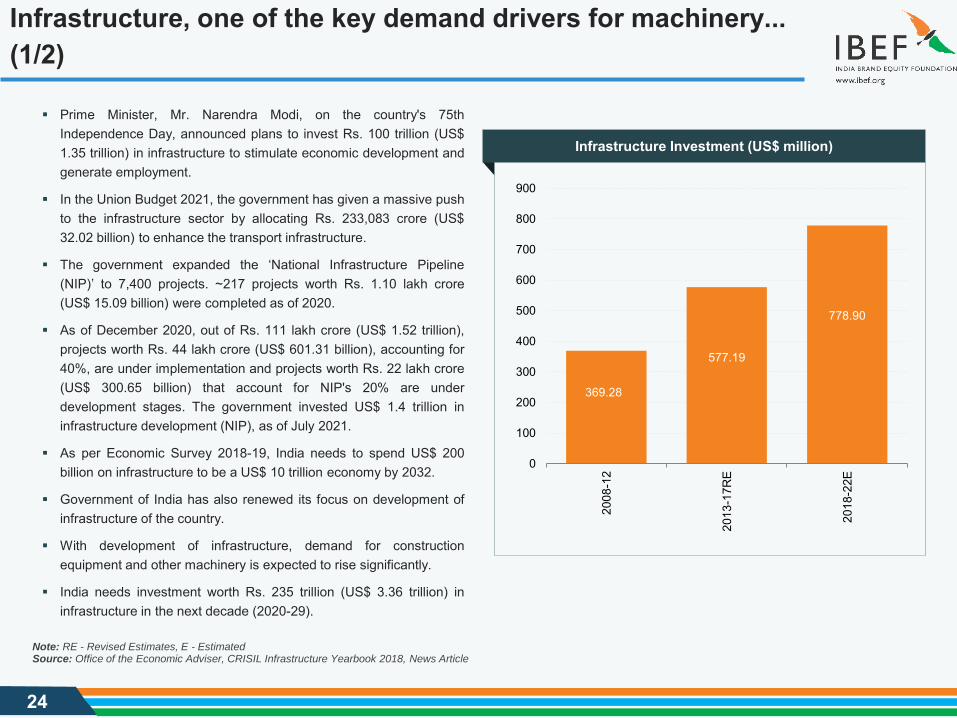
Prime Minister, Mr. Narendra Modi, on the country's 75thIndependence Day, announced plans to invest Rs. 100 trillion (US$1.35 trillion) in infrastructure to stimulate economic development andgenerate employment.
In the Union Budget 2021, the government has given a massive pushto the infrastructure sector by allocating Rs. 233,083 crore (US$32.02 billion) to enhance the transport infrastructure.
The government expanded the ‘National Infrastructure Pipeline(NIP)’ to 7,400 projects. ~217 projects worth Rs. 1.10 lakh crore(US$ 15.09 billion) were completed as of 2020.
As of December 2020, out of Rs. 111 lakh crore (US$ 1.52 trillion),projects worth Rs. 44 lakh crore (US$ 601.31 billion), accounting for40%, are under implementation and projects worth Rs. 22 lakh crore(US$ 300.65 billion) that account for NIP's 20% are underdevelopment stages. The government invested US$ 1.4 trillion ininfrastructure development (NIP), as of July 2021.
As per Economic Survey 2018-19, India needs to spend US$ 200billion on infrastructure to be a US$ 10 trillion economy by 2032.
Government of India has also renewed its focus on development ofinfrastructure of the country.
With development of infrastructure, demand for constructionequipment and other machinery is expected to rise significantly.
India needs investment worth Rs. 235 trillion (US$ 3.36 trillion) ininfrastructure in the next decade (2020-29).
Source: Office of the Economic Adviser, CRISIL Infrastructure Yearbook 2018, News Article
369.28
577.19
778.90
0
100
200
300
400
500
600
700
800
900
2008
-12
2013
-17R
E
2018
-22E
Infrastructure Investment (US$ million)
Note: RE - Revised Estimates, E - Estimated

25
Infrastructure, one of the key demand drivers for machinery... (2/2)
4,41
0
6,06
1
8,23
1 9,82
9
10,8
00
8,78
4
9,24
2
0
2,000
4,000
6,000
8,000
10,000
12,000
FY15 FY16 FY17 FY18 FY19 FY20 FY21
103.
8
106.
5
111.
7
115.
1
120.
5
125.
7
131.
2
131.
6
123.
2
0.0
20.0
40.0
60.0
80.0
100.0
120.0
140.0
FY13 FY14 FY15 FY16 FY17 FY18 FY19 FY20 FY21
Source: National Highway Authority of India, Ministry of Road Transport and Highways
India has one of the largest road networks (5.48 million kms) comprising expressways, national, state highways, districts and village roads.
In 2021-22, the Indian government has fixed a target to construct 12,000 km of National Highways. The daily average length of the nationalhighways constructed during 2020-21 is to the tune of 29.81 km per day.
Demand for related machinery in building roads has increased significantly due to large-scale public and private investment in roads.
Government of India allocated over Rs. 80,250 crore (US$ 12.01 billion) for upgradation of 125,000 kms of rural roads under phase-III of thePradhan Mantri Gram Sadak Yojana.
The Infrastructure Supporting Industries Index (part of the wider Index of Industrial Production) comprises eight core industries, such as coal,crude oil, natural gas, petroleum refinery products, fertilisers, steel, cement and electricity. This index reached 123.2 in FY21, a decrease from131.6 recorded in FY20.
Length of National Highways Constructed (in kms)Infrastructure Supporting Industries Index
26
Strong policy support crucial for the sector…(1/3)
Source: DHI Annual Report, Ministry of Power Annual Report, Make in India
Notes: GW - Giga Watt
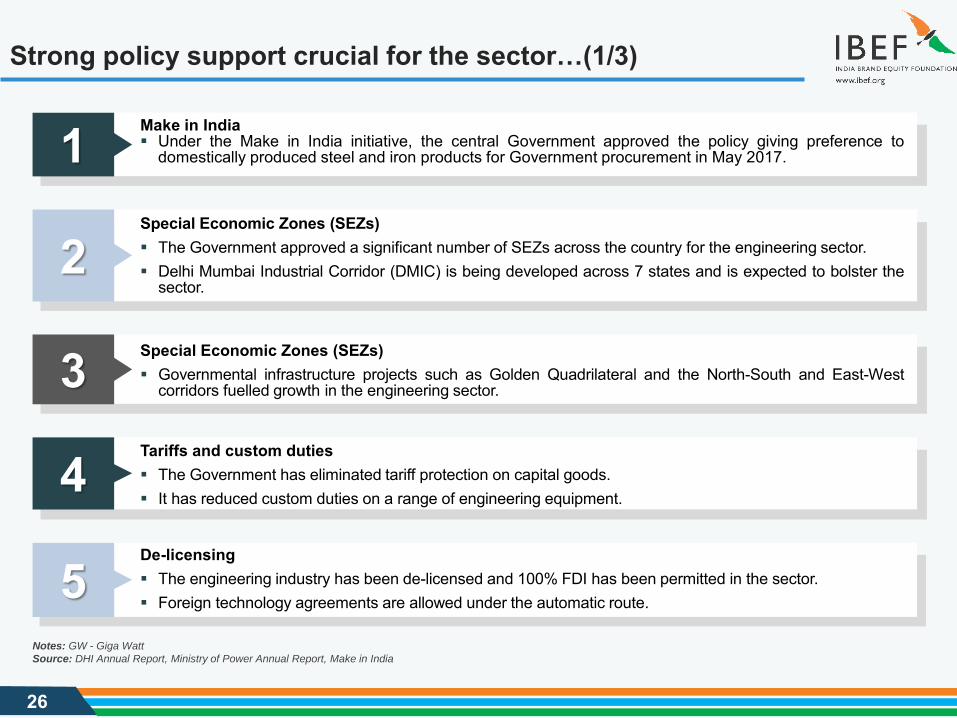
1 Make in India Under the Make in India initiative, the central Government approved the policy giving preference to
domestically produced steel and iron products for Government procurement in May 2017.
2Special Economic Zones (SEZs) The Government approved a significant number of SEZs across the country for the engineering sector. Delhi Mumbai Industrial Corridor (DMIC) is being developed across 7 states and is expected to bolster the
sector.
3 Special Economic Zones (SEZs) Governmental infrastructure projects such as Golden Quadrilateral and the North-South and East-West
corridors fuelled growth in the engineering sector.
4Tariffs and custom duties The Government has eliminated tariff protection on capital goods. It has reduced custom duties on a range of engineering equipment.
5De-licensing The engineering industry has been de-licensed and 100% FDI has been permitted in the sector. Foreign technology agreements are allowed under the automatic route.
27Source: Union Budget FY14, Union Budget 2018-19 and 2019-20
Notes: Capex - Capital Expenditure, JNNURM - Jawaharlal Nehru National Urban Renewal Mission
Strong policy support crucial for the sector…(2/3)
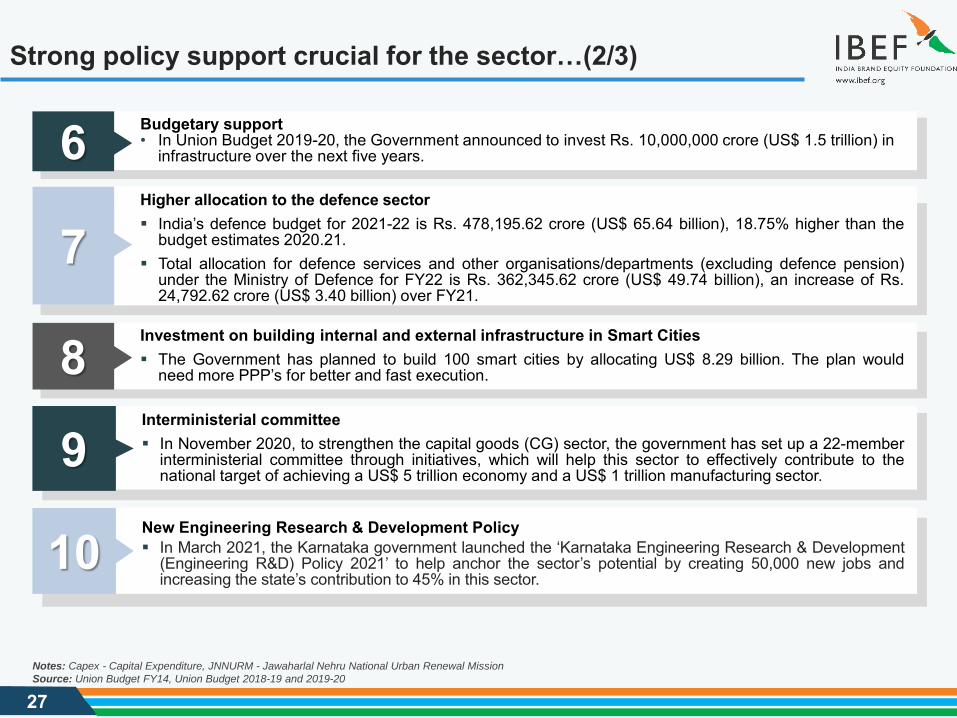
6 Budgetary support• In Union Budget 2019-20, the Government announced to invest Rs. 10,000,000 crore (US$ 1.5 trillion) in
infrastructure over the next five years.
7Higher allocation to the defence sector India’s defence budget for 2021-22 is Rs. 478,195.62 crore (US$ 65.64 billion), 18.75% higher than the
budget estimates 2020.21. Total allocation for defence services and other organisations/departments (excluding defence pension)
under the Ministry of Defence for FY22 is Rs. 362,345.62 crore (US$ 49.74 billion), an increase of Rs.24,792.62 crore (US$ 3.40 billion) over FY21.
8 Investment on building internal and external infrastructure in Smart Cities The Government has planned to build 100 smart cities by allocating US$ 8.29 billion. The plan would
need more PPP’s for better and fast execution.
9Interministerial committee In November 2020, to strengthen the capital goods (CG) sector, the government has set up a 22-member
interministerial committee through initiatives, which will help this sector to effectively contribute to thenational target of achieving a US$ 5 trillion economy and a US$ 1 trillion manufacturing sector.
10New Engineering Research & Development Policy In March 2021, the Karnataka government launched the ‘Karnataka Engineering Research & Development
(Engineering R&D) Policy 2021’ to help anchor the sector’s potential by creating 50,000 new jobs andincreasing the state’s contribution to 45% in this sector.
28Source: Press releases
Strong policy support crucial for the sector…(3/3)
11
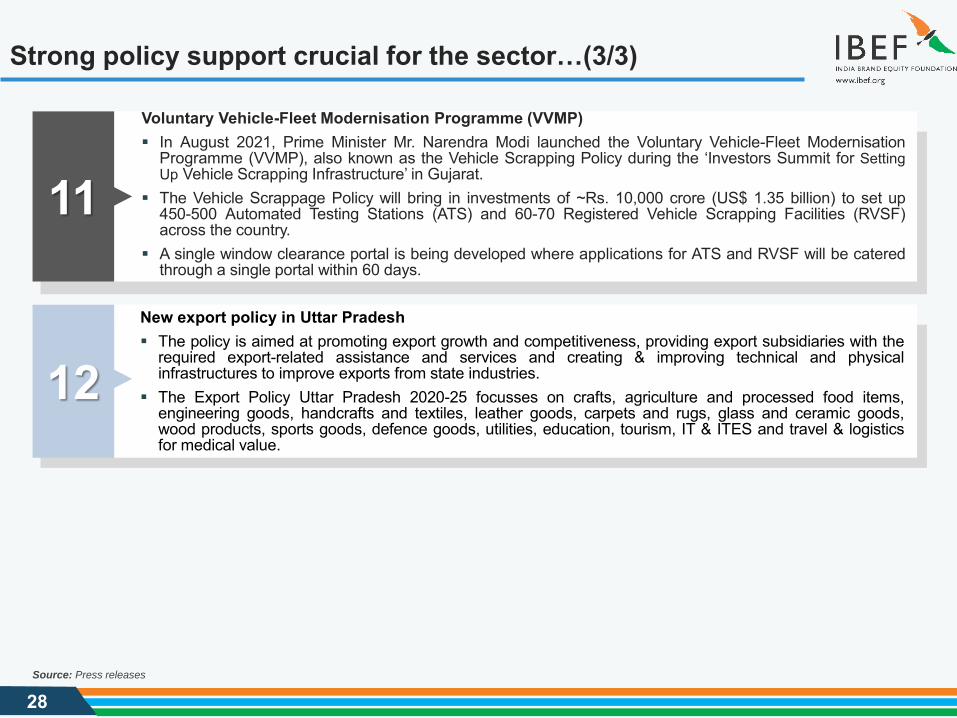
Voluntary Vehicle-Fleet Modernisation Programme (VVMP) In August 2021, Prime Minister Mr. Narendra Modi launched the Voluntary Vehicle-Fleet Modernisation
Programme (VVMP), also known as the Vehicle Scrapping Policy during the ‘Investors Summit for SettingUp Vehicle Scrapping Infrastructure’ in Gujarat.
The Vehicle Scrappage Policy will bring in investments of ~Rs. 10,000 crore (US$ 1.35 billion) to set up450-500 Automated Testing Stations (ATS) and 60-70 Registered Vehicle Scrapping Facilities (RVSF)across the country.
A single window clearance portal is being developed where applications for ATS and RVSF will be cateredthrough a single portal within 60 days.
12New export policy in Uttar Pradesh The policy is aimed at promoting export growth and competitiveness, providing export subsidiaries with the
required export-related assistance and services and creating & improving technical and physicalinfrastructures to improve exports from state industries.
The Export Policy Uttar Pradesh 2020-25 focusses on crafts, agriculture and processed food items,engineering goods, handcrafts and textiles, leather goods, carpets and rugs, glass and ceramic goods,wood products, sports goods, defence goods, utilities, education, tourism, IT & ITES and travel & logisticsfor medical value.
29
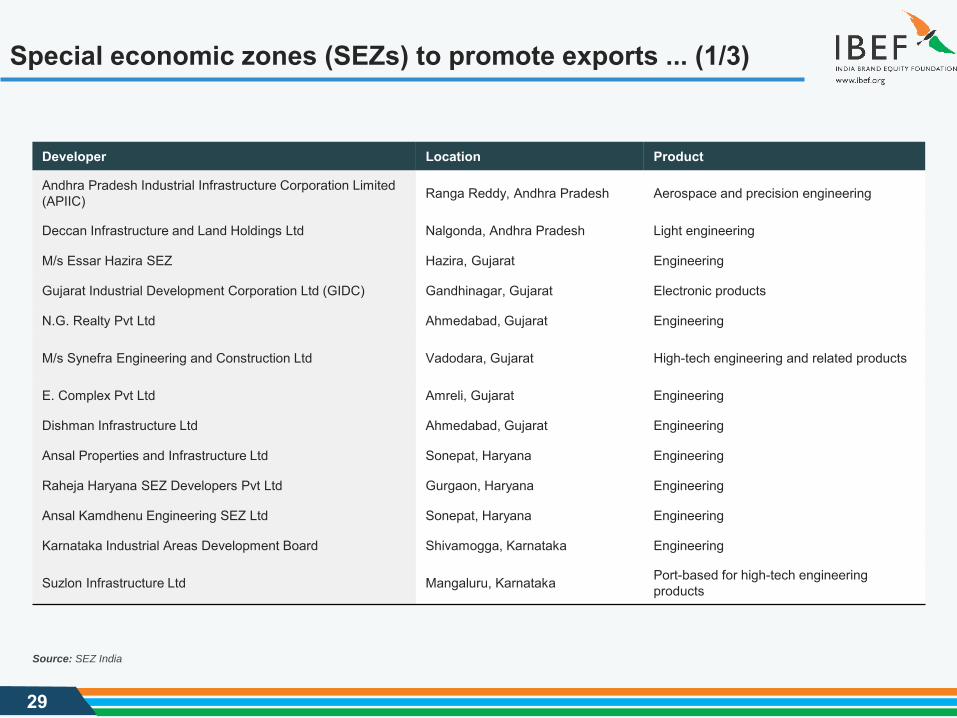
Special economic zones (SEZs) to promote exports ... (1/3)
Source: SEZ India
Developer Location Product
Andhra Pradesh Industrial Infrastructure Corporation Limited (APIIC) Ranga Reddy, Andhra Pradesh Aerospace and precision engineering
Deccan Infrastructure and Land Holdings Ltd Nalgonda, Andhra Pradesh Light engineering
M/s Essar Hazira SEZ Hazira, Gujarat Engineering
Gujarat Industrial Development Corporation Ltd (GIDC) Gandhinagar, Gujarat Electronic products
N.G. Realty Pvt Ltd Ahmedabad, Gujarat Engineering
M/s Synefra Engineering and Construction Ltd Vadodara, Gujarat High-tech engineering and related products
E. Complex Pvt Ltd Amreli, Gujarat Engineering
Dishman Infrastructure Ltd Ahmedabad, Gujarat Engineering
Ansal Properties and Infrastructure Ltd Sonepat, Haryana Engineering
Raheja Haryana SEZ Developers Pvt Ltd Gurgaon, Haryana Engineering
Ansal Kamdhenu Engineering SEZ Ltd Sonepat, Haryana Engineering
Karnataka Industrial Areas Development Board Shivamogga, Karnataka Engineering
Suzlon Infrastructure Ltd Mangaluru, Karnataka Port-based for high-tech engineering products
30
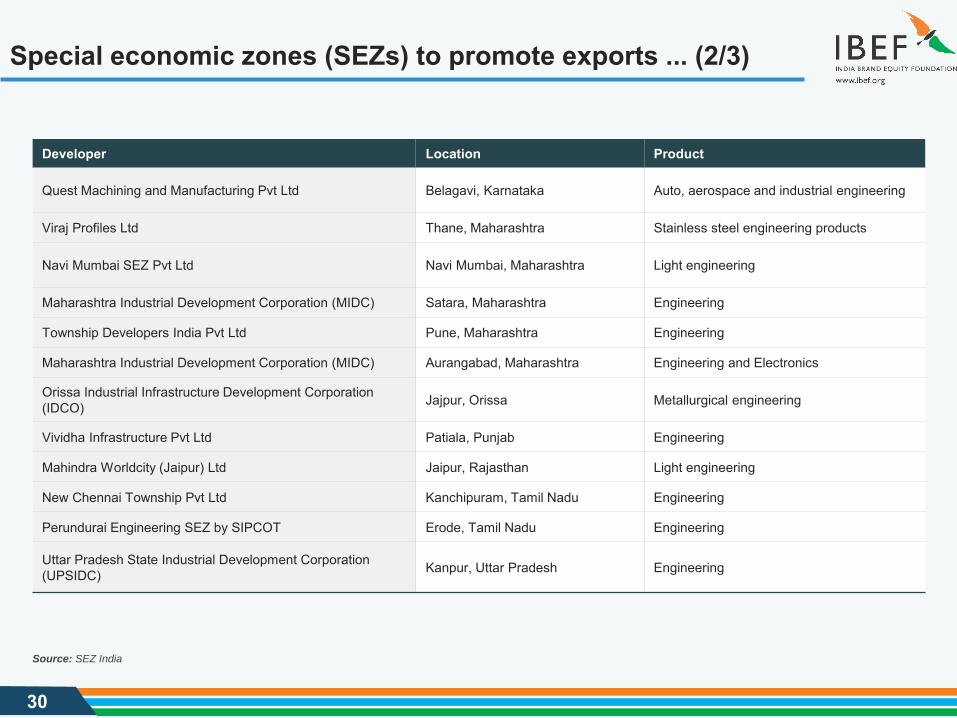
Special economic zones (SEZs) to promote exports ... (2/3)
Source: SEZ India
Developer Location Product
Quest Machining and Manufacturing Pvt Ltd Belagavi, Karnataka Auto, aerospace and industrial engineering
Viraj Profiles Ltd Thane, Maharashtra Stainless steel engineering products
Navi Mumbai SEZ Pvt Ltd Navi Mumbai, Maharashtra Light engineering
Maharashtra Industrial Development Corporation (MIDC) Satara, Maharashtra Engineering
Township Developers India Pvt Ltd Pune, Maharashtra Engineering
Maharashtra Industrial Development Corporation (MIDC) Aurangabad, Maharashtra Engineering and Electronics
Orissa Industrial Infrastructure Development Corporation (IDCO) Jajpur, Orissa Metallurgical engineering
Vividha Infrastructure Pvt Ltd Patiala, Punjab Engineering
Mahindra Worldcity (Jaipur) Ltd Jaipur, Rajasthan Light engineering
New Chennai Township Pvt Ltd Kanchipuram, Tamil Nadu Engineering
Perundurai Engineering SEZ by SIPCOT Erode, Tamil Nadu Engineering
Uttar Pradesh State Industrial Development Corporation(UPSIDC) Kanpur, Uttar Pradesh Engineering
31
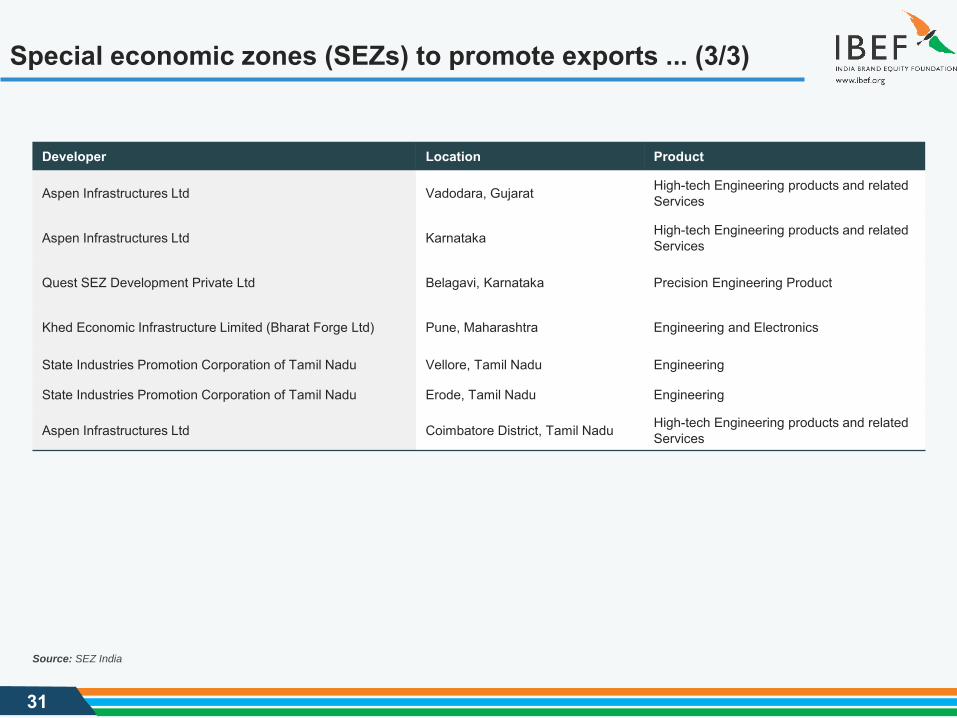
Special economic zones (SEZs) to promote exports ... (3/3)
Source: SEZ India
Developer Location Product
Aspen Infrastructures Ltd Vadodara, Gujarat High-tech Engineering products and related Services
Aspen Infrastructures Ltd Karnataka High-tech Engineering products and related Services
Quest SEZ Development Private Ltd Belagavi, Karnataka Precision Engineering Product
Khed Economic Infrastructure Limited (Bharat Forge Ltd) Pune, Maharashtra Engineering and Electronics
State Industries Promotion Corporation of Tamil Nadu Vellore, Tamil Nadu Engineering
State Industries Promotion Corporation of Tamil Nadu Erode, Tamil Nadu Engineering
Aspen Infrastructures Ltd Coimbatore District, Tamil Nadu High-tech Engineering products and related Services
32
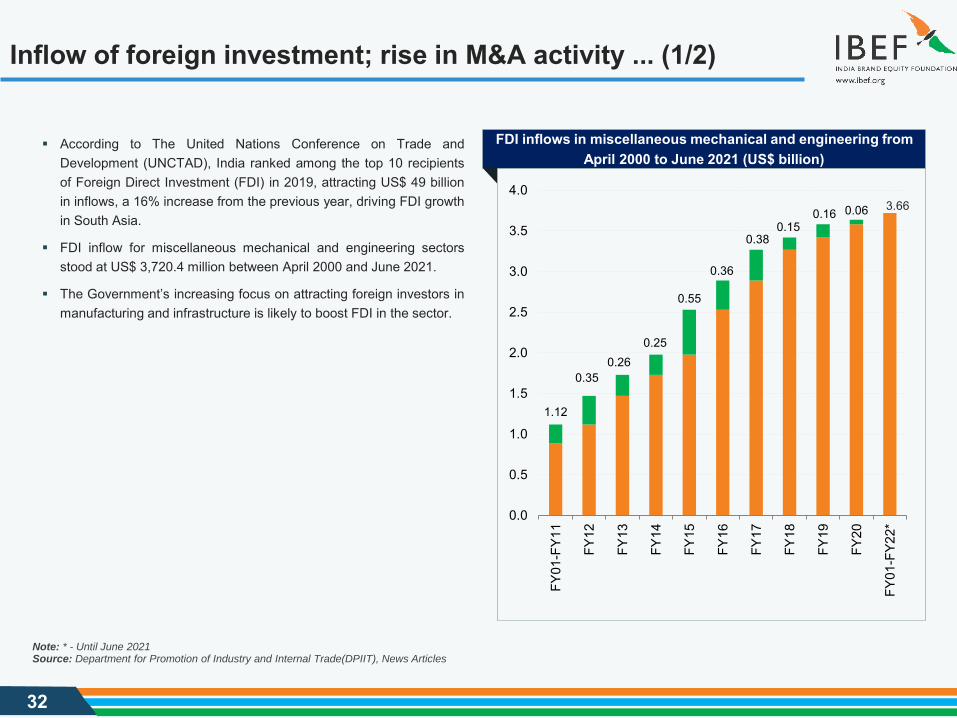
Inflow of foreign investment; rise in M&A activity ... (1/2)
According to The United Nations Conference on Trade andDevelopment (UNCTAD), India ranked among the top 10 recipientsof Foreign Direct Investment (FDI) in 2019, attracting US$ 49 billionin inflows, a 16% increase from the previous year, driving FDI growthin South Asia.
FDI inflow for miscellaneous mechanical and engineering sectorsstood at US$ 3,720.4 million between April 2000 and June 2021.
The Government’s increasing focus on attracting foreign investors inmanufacturing and infrastructure is likely to boost FDI in the sector.
Source: Department for Promotion of Industry and Internal Trade(DPIIT), News Articles
FDI inflows in miscellaneous mechanical and engineering from April 2000 to June 2021 (US$ billion)
0.350.26
0.25
0.55
0.36
0.380.15
0.16 0.06
1.12
3.66
0.0
0.5
1.0
1.5
2.0
2.5
3.0
3.5
4.0
FY01
-FY1
1
FY12
FY13
FY14
FY15
FY16
FY17
FY18
FY19
FY20
FY01
-FY2
2*
Note: * - Until June 2021
33
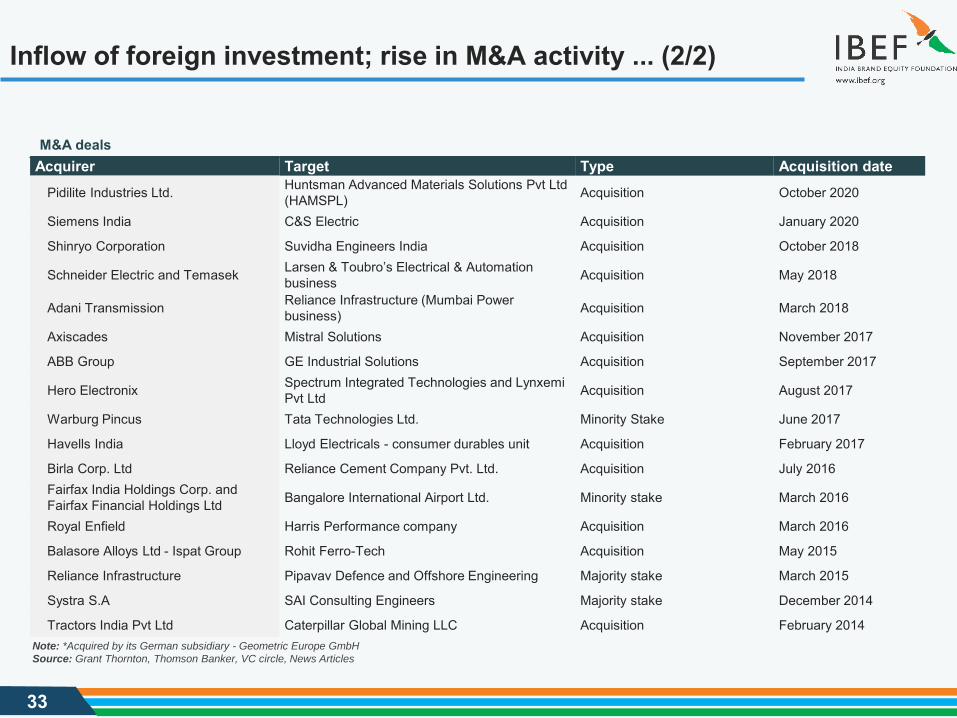
Inflow of foreign investment; rise in M&A activity ... (2/2)
Acquirer Target Type Acquisition date Pidilite Industries Ltd. Huntsman Advanced Materials Solutions Pvt Ltd
(HAMSPL) Acquisition October 2020
Siemens India C&S Electric Acquisition January 2020
Shinryo Corporation Suvidha Engineers India Acquisition October 2018
Schneider Electric and Temasek Larsen & Toubro’s Electrical & Automation business Acquisition May 2018
Adani Transmission Reliance Infrastructure (Mumbai Power business) Acquisition March 2018
Axiscades Mistral Solutions Acquisition November 2017
ABB Group GE Industrial Solutions Acquisition September 2017
Hero Electronix Spectrum Integrated Technologies and Lynxemi Pvt Ltd Acquisition August 2017
Warburg Pincus Tata Technologies Ltd. Minority Stake June 2017
Havells India Lloyd Electricals - consumer durables unit Acquisition February 2017
Birla Corp. Ltd Reliance Cement Company Pvt. Ltd. Acquisition July 2016Fairfax India Holdings Corp. andFairfax Financial Holdings Ltd Bangalore International Airport Ltd. Minority stake March 2016
Royal Enfield Harris Performance company Acquisition March 2016
Balasore Alloys Ltd - Ispat Group Rohit Ferro-Tech Acquisition May 2015
Reliance Infrastructure Pipavav Defence and Offshore Engineering Majority stake March 2015
Systra S.A SAI Consulting Engineers Majority stake December 2014
Tractors India Pvt Ltd Caterpillar Global Mining LLC Acquisition February 2014
M&A deals
Note: *Acquired by its German subsidiary - Geometric Europe GmbH
Source: Grant Thornton, Thomson Banker, VC circle, News Articles

34
Opportunities
OPPORTUNITIES
35
Growth opportunities in the engineering sector … (1/2)
Source: Sutherland Research, Crisil, News Source
Notes: GW - Giga Watt, SME - Small and Medium Enterprises, CY - Calendar Year, *As per CRISIL Research
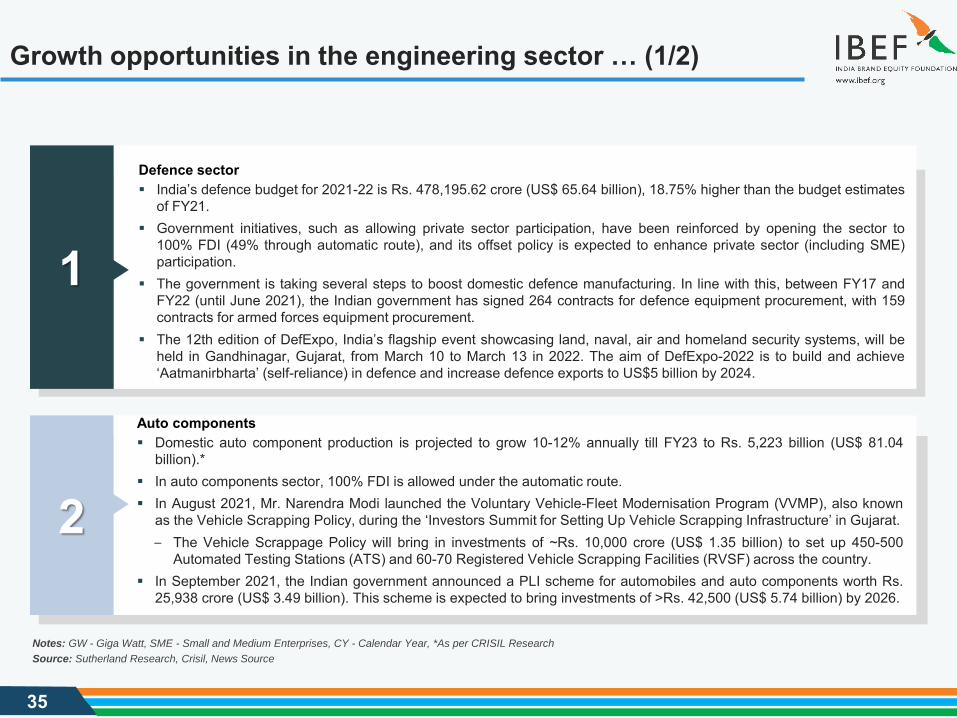
1
Defence sector India’s defence budget for 2021-22 is Rs. 478,195.62 crore (US$ 65.64 billion), 18.75% higher than the budget estimates
of FY21. Government initiatives, such as allowing private sector participation, have been reinforced by opening the sector to
100% FDI (49% through automatic route), and its offset policy is expected to enhance private sector (including SME)participation.
The government is taking several steps to boost domestic defence manufacturing. In line with this, between FY17 andFY22 (until June 2021), the Indian government has signed 264 contracts for defence equipment procurement, with 159contracts for armed forces equipment procurement.
The 12th edition of DefExpo, India’s flagship event showcasing land, naval, air and homeland security systems, will beheld in Gandhinagar, Gujarat, from March 10 to March 13 in 2022. The aim of DefExpo-2022 is to build and achieve‘Aatmanirbharta’ (self-reliance) in defence and increase defence exports to US$5 billion by 2024.
2
Auto components Domestic auto component production is projected to grow 10-12% annually till FY23 to Rs. 5,223 billion (US$ 81.04
billion).* In auto components sector, 100% FDI is allowed under the automatic route. In August 2021, Mr. Narendra Modi launched the Voluntary Vehicle-Fleet Modernisation Program (VVMP), also known
as the Vehicle Scrapping Policy, during the ‘Investors Summit for Setting Up Vehicle Scrapping Infrastructure’ in Gujarat.– The Vehicle Scrappage Policy will bring in investments of ~Rs. 10,000 crore (US$ 1.35 billion) to set up 450-500
Automated Testing Stations (ATS) and 60-70 Registered Vehicle Scrapping Facilities (RVSF) across the country. In September 2021, the Indian government announced a PLI scheme for automobiles and auto components worth Rs.
25,938 crore (US$ 3.49 billion). This scheme is expected to bring investments of >Rs. 42,500 (US$ 5.74 billion) by 2026.

36
Growth opportunities in the engineering sector … (2/2)
Source: Sutherland Research
Note: CKM- Circuit Kilometres
3Civil nuclear sectorIn January 2021, India’s nuclear power installed capacity was 6.78 GW and ~3,300 MW of nuclear capacity is expected to be commissioned by 2022.It represents business opportunity worth US$ 312 million for the manufacturing industry.
4Power transmission and distribution (T&DT&D expenditure is set to increase on growth in power generation and privatisation of distribution.In June 2019, the government launched US$ 5 billion of transmission-line tenders in phases to reach 175 GW target by 2022.
5Machine tools Demand for machine tools from the capital goods sector (especially automobile and textile industries) is projected to remain high.Considering the industry's demand for higher productivity, superior precision, accuracy and low-cost manufacturing solutions, Computer Numerically Controlled (CNC) machine tools are set to be in greater demand.
6Material handling equipmentThe material handling equipment sector is expected to gain from robust demand from steel, power, mineral and other infrastructure industries.The ‘Make in India’ initiative and government's focus on ease of doing business is likely to present several opportunities inmaterial handling equipment sectorThe Indian market for material handling equipment accounted for ~13% share of the country's construction equipment industry in 2019.
37
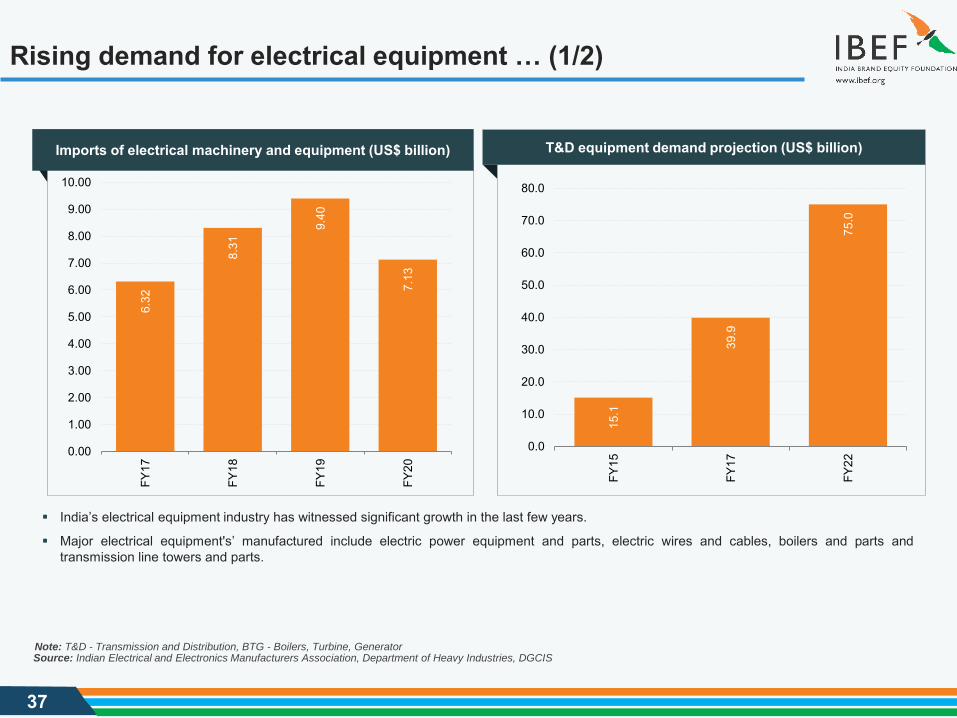
Rising demand for electrical equipment … (1/2)
15.1
39.9
75.0
0.0
10.0
20.0
30.0
40.0
50.0
60.0
70.0
80.0
FY15
FY17
FY22
6.32
8.31
9.40
7.13
0.00
1.00
2.00
3.00
4.00
5.00
6.00
7.00
8.00
9.00
10.00
FY17
FY18
FY19
FY20
Note: T&D - Transmission and Distribution, BTG - Boilers, Turbine, Generator
India’s electrical equipment industry has witnessed significant growth in the last few years.
Major electrical equipment's’ manufactured include electric power equipment and parts, electric wires and cables, boilers and parts andtransmission line towers and parts.
T&D equipment demand projection (US$ billion)Imports of electrical machinery and equipment (US$ billion)
Source: Indian Electrical and Electronics Manufacturers Association, Department of Heavy Industries, DGCIS
38
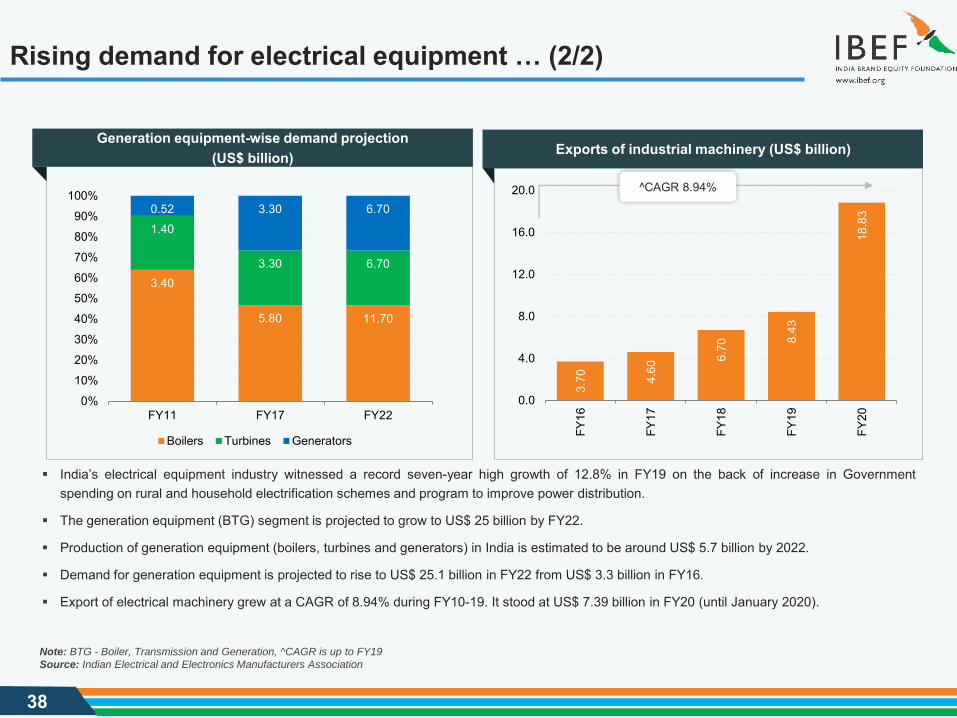
Rising demand for electrical equipment … (2/2)
3.40
5.80 11.70
1.40
3.30 6.70
0.52 3.30 6.70
0%
10%
20%
30%
40%
50%
60%
70%
80%
90%
100%
FY11 FY17 FY22
Boilers Turbines Generators
3.70 4.
60
6.70 8.
43
18.8
3
0.0
4.0
8.0
12.0
16.0
20.0
FY16
FY17
FY18
FY19
FY20
India’s electrical equipment industry witnessed a record seven-year high growth of 12.8% in FY19 on the back of increase in Governmentspending on rural and household electrification schemes and program to improve power distribution.
The generation equipment (BTG) segment is projected to grow to US$ 25 billion by FY22.
Production of generation equipment (boilers, turbines and generators) in India is estimated to be around US$ 5.7 billion by 2022.
Demand for generation equipment is projected to rise to US$ 25.1 billion in FY22 from US$ 3.3 billion in FY16.
Export of electrical machinery grew at a CAGR of 8.94% during FY10-19. It stood at US$ 7.39 billion in FY20 (until January 2020).
Generation equipment-wise demand projection (US$ billion) Exports of industrial machinery (US$ billion)
^CAGR 8.94%
Note: BTG - Boiler, Transmission and Generation, ^CAGR is up to FY19
Source: Indian Electrical and Electronics Manufacturers Association
39
Growth potential in the construction equipment industry
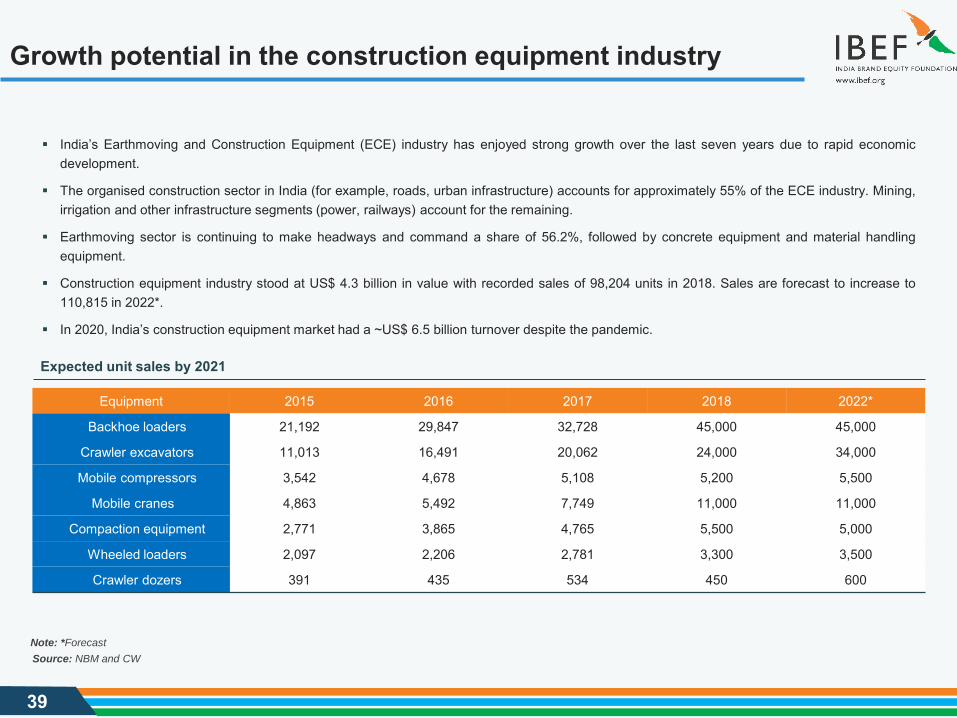
India’s Earthmoving and Construction Equipment (ECE) industry has enjoyed strong growth over the last seven years due to rapid economicdevelopment.
The organised construction sector in India (for example, roads, urban infrastructure) accounts for approximately 55% of the ECE industry. Mining,irrigation and other infrastructure segments (power, railways) account for the remaining.
Earthmoving sector is continuing to make headways and command a share of 56.2%, followed by concrete equipment and material handlingequipment.
Construction equipment industry stood at US$ 4.3 billion in value with recorded sales of 98,204 units in 2018. Sales are forecast to increase to110,815 in 2022*.
In 2020, India’s construction equipment market had a ~US$ 6.5 billion turnover despite the pandemic.
Equipment 2015 2016 2017 2018 2022*
Backhoe loaders 21,192 29,847 32,728 45,000 45,000
Crawler excavators 11,013 16,491 20,062 24,000 34,000
Mobile compressors 3,542 4,678 5,108 5,200 5,500
Mobile cranes 4,863 5,492 7,749 11,000 11,000
Compaction equipment 2,771 3,865 4,765 5,500 5,000
Wheeled loaders 2,097 2,206 2,781 3,300 3,500
Crawler dozers 391 435 534 450 600
Expected unit sales by 2021
Source: NBM and CW
Note: *Forecast

40
Key Industry Contacts
41
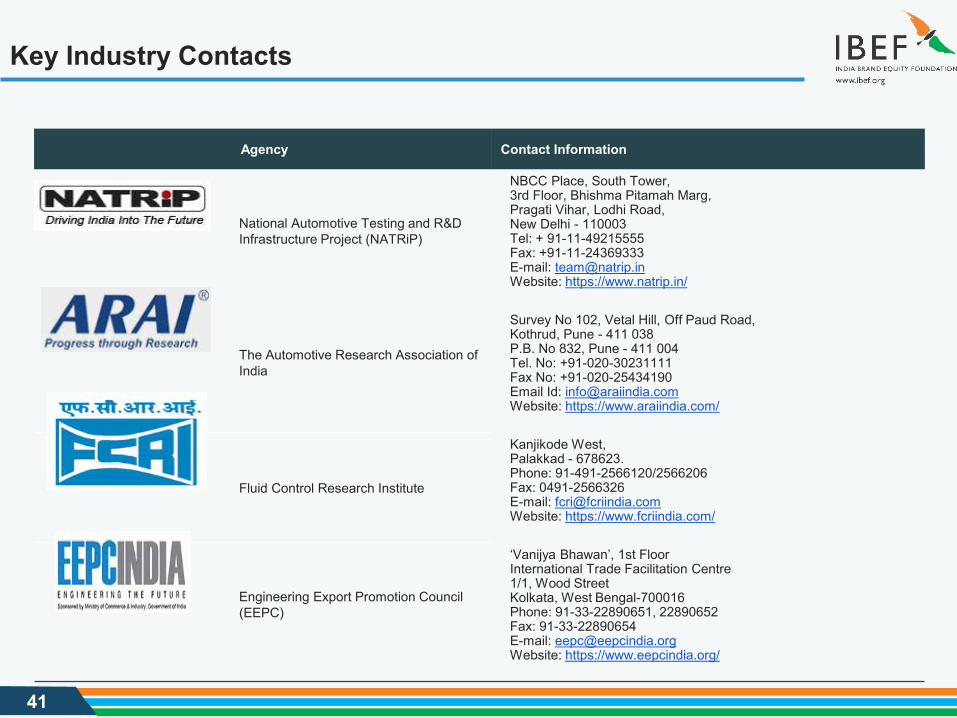
Key Industry Contacts
Agency Contact Information
National Automotive Testing and R&D Infrastructure Project (NATRiP)
NBCC Place, South Tower, 3rd Floor, Bhishma Pitamah Marg, Pragati Vihar, Lodhi Road,New Delhi - 110003 Tel: + 91-11-49215555 Fax: +91-11-24369333 E-mail: [email protected]: https://www.natrip.in/
The Automotive Research Association of India
Survey No 102, Vetal Hill, Off Paud Road, Kothrud, Pune - 411 038P.B. No 832, Pune - 411 004Tel. No: +91-020-30231111Fax No: +91-020-25434190Email Id: [email protected]: https://www.araiindia.com/
Fluid Control Research Institute
Kanjikode West,Palakkad - 678623. Phone: 91-491-2566120/2566206 Fax: 0491-2566326 E-mail: [email protected]: https://www.fcriindia.com/
Engineering Export Promotion Council (EEPC)
‘Vanijya Bhawan’, 1st FloorInternational Trade Facilitation Centre1/1, Wood StreetKolkata, West Bengal-700016Phone: 91-33-22890651, 22890652Fax: 91-33-22890654E-mail: [email protected]: https://www.eepcindia.org/
42
Appendix
43
Glossary
BTG: Boilers, Turbines, Generators
BHEL: Bharat Heavy Electricals Limited
MHI: Mitsubishi heavy industries
DHI: Department of Heavy industries
BHEL: Bharat Heavy Electricals Ltd
ICEMA: Indian Construction Equipment Manufacturer’s Association
HAL: Hindustan Aeronautics Limited
IEEMA: Indian Electrical and Electronics Manufacturers Association
EEPC: Engineering Export Promotion Council
TPD: Tonnes Per Day
NHAI: National Highway Authority of India
MORTH: Ministry of Road Transport and Highways
CEA: Central Electrical Authority
HVDC: High Voltage Direct Current
US$: US Dollar
Rs: Indian Rupee
FY: Indian Financial Year (April to March)
Wherever applicable, numbers have been rounded off to two decimals
44
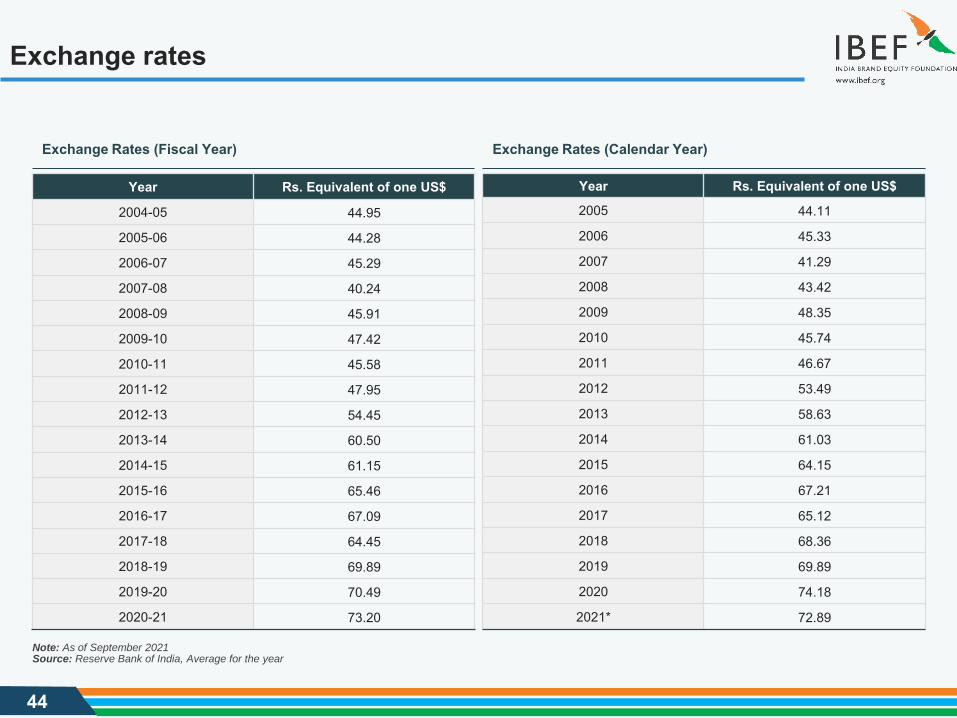
Exchange rates
Exchange Rates (Fiscal Year) Exchange Rates (Calendar Year)
Year Rs. Equivalent of one US$
2004-05 44.95
2005-06 44.28
2006-07 45.29
2007-08 40.24
2008-09 45.91
2009-10 47.42
2010-11 45.58
2011-12 47.95
2012-13 54.45
2013-14 60.50
2014-15 61.15
2015-16 65.46
2016-17 67.09
2017-18 64.45
2018-19 69.89
2019-20 70.49
2020-21 73.20
Source: Reserve Bank of India, Average for the yearNote: As of September 2021
Year Rs. Equivalent of one US$
2005 44.11
2006 45.33
2007 41.29
2008 43.42
2009 48.35
2010 45.74
2011 46.67
2012 53.49
2013 58.63
2014 61.03
2015 64.15
2016 67.21
2017 65.12
2018 68.36
2019 69.89
2020 74.18
2021* 72.89
45
Disclaimer
India Brand Equity Foundation (IBEF) engaged Sutherland Global Services Private Limited to prepare/update this presentation.
All rights reserved. All copyright in this presentation and related works is solely and exclusively owned by IBEF, delivered during the course ofengagement under the Professional Service Agreement signed by the Parties. The same may not be reproduced, wholly or in part in any materialform (including photocopying or storing it in any medium by electronic means and whether or not transiently or incidentally to some other use of thispresentation), modified or in any manner communicated to any third party except with the written approval of IBEF.
This presentation is for information purposes only. While due care has been taken during the compilation of this presentation to ensure that theinformation is accurate to the best of Sutherland Global Services’ Private Limited and IBEF’s knowledge and belief, the content is not to be construedin any manner whatsoever as a substitute for professional advice.
Sutherland Global Services Private Limited and IBEF neither recommend nor endorse any specific products or services that may have beenmentioned in this presentation and nor do they assume any liability, damages or responsibility for the outcome of decisions taken as a result of anyreliance placed on this presentation.
Neither Sutherland Global Services Private Limited nor IBEF shall be liable for any special, direct, indirect or consequential damages that may arisedue to any act or omission on the part of the user due to any reliance placed or guidance taken from any portion of this presentation.