Embed Size (px)
Citation preview

DNV GL Headquarters, Veritasveien 1, P.O.Box 300, 1322 Høvik, Norway. Tel: +47 67 57 99 00. www.dnvgl.com
Øra LNG terminal QRA update and firewall
assessment_FinalMemo_rev1.docx
Memo to: Memo No: 920669, rev. 1 (final, after
customer comments) Arild Skar – Gasum LNG Production AS Tommy Borgaas – Gasum LNG Production AS
From: Marta Bucelli Date: 2020-09-24
Copied to: Stephen Andrew Town – DNV GL
Prep. By: Marta Bucelli Reviewed by Snorre Sæternes
UPDATE OF ØRA LNG TERMINAL RISK CONTOURS 1 INTRODUCTION AND SCOPE OF WORK Gasum AS (Gasum) has requested DNV GL to re-assess the risk contours at the Øra LNG terminal to reflect the following modifications:
1. Addition of two LNG storage tanks in the storage area at the terminal;
2. Construction of a protective structure at the road cross at Øraveien for the filling line.
The Øra LNG QRA model has been upgraded the latest version of Safeti Onshore (version 8.23), with improved Unified Dispersion Model.
1.1 Abbreviations ESD Emergency Shut Down
LNG Liquefied Natural Gas
PSV Pressure Safety Valve
QRA Quantitative Risk Analysis
2 UPDATE OF ØRA LNG TERMINAL RISK CONTOURS
2.1 Basis for work The present analysis focuses on the modifications as stated in the scope of work and no other change in the model is included.
2.2 Assumptions The following assumptions are made for the current update:
- The height of interest is modified to 1.5 m. This is a value normally used in QRAs as it corresponds to the height of workers/populations walking/running during escape and evacuation in a hazardous situation.
- The releases from the additional storage tanks are located as in Figure 2.1.
- The length of the additional piping connected to the 2 additional storage tank is estimated as 15 m. This value is chosen in analogy to the pipe length associated to the 9 existing storage tanks (50m).
- Ignitions are modelled using UKOOA for case A and set as unitary for case B.
- The ESD probability of failure is set as 10% as per 2019 update (ref. /8/).

Page 2 of 11
Øra LNG terminal QRA update and firewall
assessment_FinalMemo_rev1.docx
Figure 2.1 Location of additional LNG tanks at Øra plant
2.3 Release frequencies adopted in the analysis 2.3.1 Additional storage tanks The release frequency calculations for the two additional LNG storage tanks have been carried out in this analysis. The tanks will be assumed identical to the existing ones at Øra plant and no additional parts count has been carried out.
The following scenarios and release frequencies summarized in Table 2-1 are used in the QRA update for the new storage tanks. The cases considered are analogue to the ones described for the existing LNG storage tanks at Øra terminal.
Table 2-1 Release cases considered for the additional tanks at the storage area at Øra LNG
Case number Case description Frequency (/year)
13bis Small LNG leak from piping, ESD success (*) 6.75E-05
14bis Large LNG leak from piping, ESD success (*) 1.35E-05
15bis Small LNG leak from storage tank or piping, ESD failure 2.75E-05
16bis Large LNG leak from storage tank or piping, ESD failure 2.50E-06
17bis Tank rupture 1.00E-06
(*) ESD success is not relevant for a leak from tank as in any case the total inventory from the tank will be released. Therefore, all tank release frequency is moved to the case with failed ESD.
The release frequencies are based on the RIVM BEVI database (ref. /9/), as in the previous QRA.
2.3.2 Car crash on the filling line In the current analysis, the release frequency of LNG filling line at the road cross has been reviewed. Gasum is considering to build a protection structure at Øraveien to reduce the risk of car/truck impacts on the LNG pipeline.

Page 3 of 11
Øra LNG terminal QRA update and firewall
assessment_FinalMemo_rev1.docx
The release frequency due to car crashes at the road cross has been reviewed from the original QRA model and compared with transport accident statistics for 2019 in Norway. In the original QRA the collision risk was based on a generic individual accident fatality risk based on accident events in Norway in the period 1992-2008 (ref /1/, Appendix 2, Table 1). It was attempted to verify this figure by applying statistics more relevant to traffic incidents and the actual traffic density at the specific location. By applying traffic incident statistics form Norway in 2019 (ref /3/, /4/ and /5/) and combining this with the traffic density at Øra (ÅDT of 300 (2015 data), ref /2/), an annual probability of a local traffic accident was established. Dependent on which incident statistics applied, the risk of a traffic accident at Øra was found to span from 3.00E-4/km year to 7.00E-03 /km year. The lowest number indicating the risk of fatality and the highest representing the risk of any traffic incident involving personnel injury. Translating this risk to the risk of hitting and damaging the LNG pipeline at Øra, it may conservatively be adjusted to be in the range from 8.00E-05/year to 2.00E-03/yr. The current frequency applied for a traffic incident is 4.40E-04/year and lies a bit low in the confidence interval of the updated risk estimate. Admitting a relatively large uncertainty, the same figure as applied in the QRA has been applied for estimating the effect of implementing a collision protection barrier for the vulnerable section of the LNG pipeline.
Assuming a high reliability protection barrier, complying with the standards defined in ref /5/ and /6/, a high performance of the barrier may be allowed for. Ref /6/ indicates that a H4 type crash barrier should be used in cases where the accident may involve very severe consequences for personnel not involved in the accident itself.
A reduction of the accident frequency to 90% has been applied to calculate the effect of a protection structure allowing for a residual risk of 10% failure of the protection function due to e.g. capacity limitation, design failure, limited coverage, etc.
2.4 Ignition modelling In the current analysis, as well as in the original QRA study, the model used for ignitions is the UKOOA. Immediate and delayed ignitions are assigned on the basis of the leak rate and the type of plant. For the Øra LNG terminal, the type of plant used in the UKOOA model is small. The total ignition probability for a given release rate is split in 30% as immediate and 70% as delayed. The UKOOA model is a generic model which does not reflect specific ignition mechanisms or ignition probability density from defined activities or point sources. It is however widely used when detailed information about the activity level and specific ignition sources is uncertain or unavailable. The model is believed to yield conservative results compared to more detailed ignition probability models.
2.5 Risk Results The risk contours for the Base Case model of Øra LNG plant are presented in Figure 2.2. These correspond to the ones presented in the Base Case A of the 2019 study (ref. /8/). In this case anyway, the height of interest is set as 1.5 m (while it was 0 in ref. /8/) and the model has been upgraded to Safeti Onshore version 8.23. The Base Case presents the risk contours considering the ignition modelling by using UKOOA.
Figure 2.3 shows the iso-risk contours with unitary delayed ignition.

Page 4 of 11
Øra LNG terminal QRA update and firewall
assessment_FinalMemo_rev1.docx
Figure 2.2 Risk iso-contours for Øra LNG plant, base case. Height of interest 1.5 m. UKOOA ignition modelling.
Figure 2.3 Risk iso-contours for Øra LNG plant, base case. Height of interest 1.5 m. Unitary delayed ignition.
The iso-risk contour corresponding to 1.00E-05 /average year is not limited to the plant area but partially covers Øraveien and the jetty area.
The updated risk contours, including the additional tanks at the storage area and the review of the car crash frequency at Øraveien, for the Øra LNG terminal are presented in the following of this chapter. Two cases, namely case A and B, are considered for the update. The cases differ for the ignition modelling
Page 5 of 11
Øra LNG terminal QRA update and firewall
assessment_FinalMemo_rev1.docx
criteria: in case A ignitions are modelled following the UKOOA method, while in Case B a unitary delayed ignition is assigned to each release scenario (in agreement with DSB requirements criteria).
The risk contours are presented for two configuration, 1 and 2. For configuration 1, the release frequency at the car crash on the filling line is not modified from the original study and the additional release frequencies due to the new storage tanks are added. For configuration 2, also the car crash frequency at the car crash on the filling line is modified, reduced by 90% as per discussion in chapter 2.3.2.
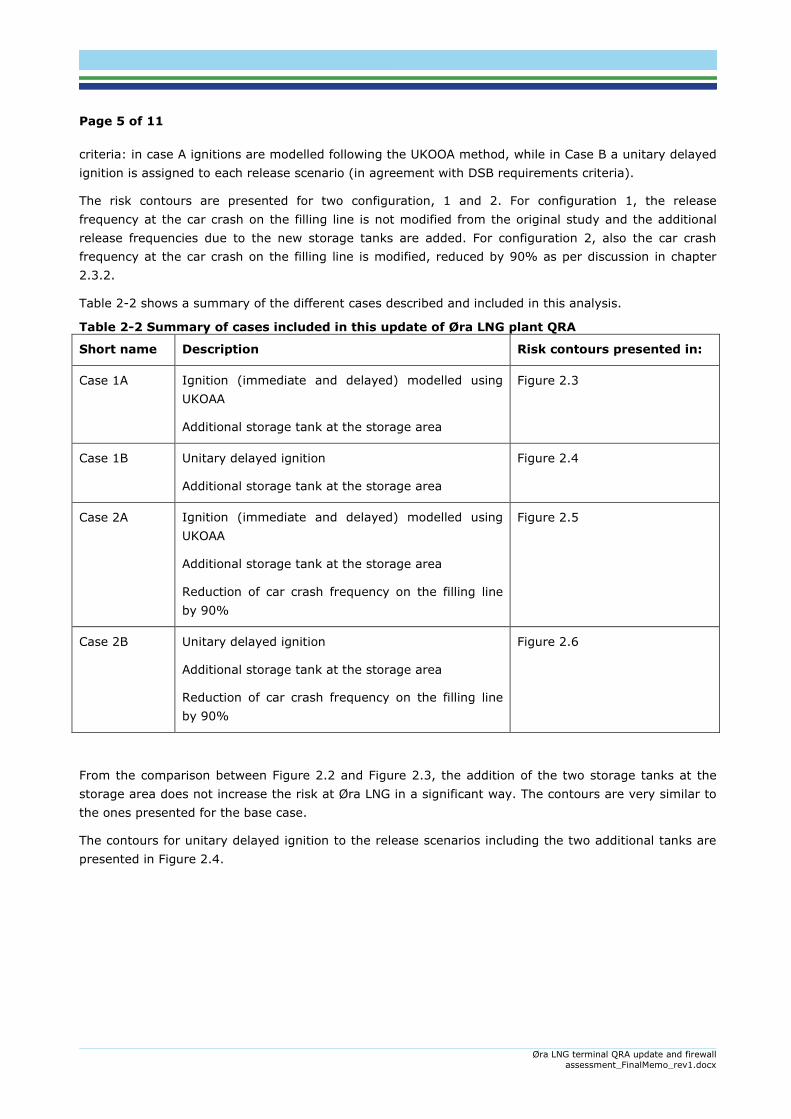
Table 2-2 shows a summary of the different cases described and included in this analysis.
Table 2-2 Summary of cases included in this update of Øra LNG plant QRA
Short name Description Risk contours presented in:
Case 1A Ignition (immediate and delayed) modelled using UKOAA
Additional storage tank at the storage area
Figure 2.3
Case 1B Unitary delayed ignition
Additional storage tank at the storage area
Figure 2.4
Case 2A Ignition (immediate and delayed) modelled using UKOAA
Additional storage tank at the storage area
Reduction of car crash frequency on the filling line by 90%
Figure 2.5
Case 2B Unitary delayed ignition
Additional storage tank at the storage area
Reduction of car crash frequency on the filling line by 90%
Figure 2.6
From the comparison between Figure 2.2 and Figure 2.3, the addition of the two storage tanks at the storage area does not increase the risk at Øra LNG in a significant way. The contours are very similar to the ones presented for the base case.
The contours for unitary delayed ignition to the release scenarios including the two additional tanks are presented in Figure 2.4.

Page 6 of 11
Øra LNG terminal QRA update and firewall
assessment_FinalMemo_rev1.docx
Figure 2.4 CASE 1A. Risk iso-contours for Øra LNG plant including the two additional storage tanks at the LNG storage area. Height of interest 1.5 m. UKOOA ignition modelling.
Page 7 of 11
Øra LNG terminal QRA update and firewall
assessment_FinalMemo_rev1.docx
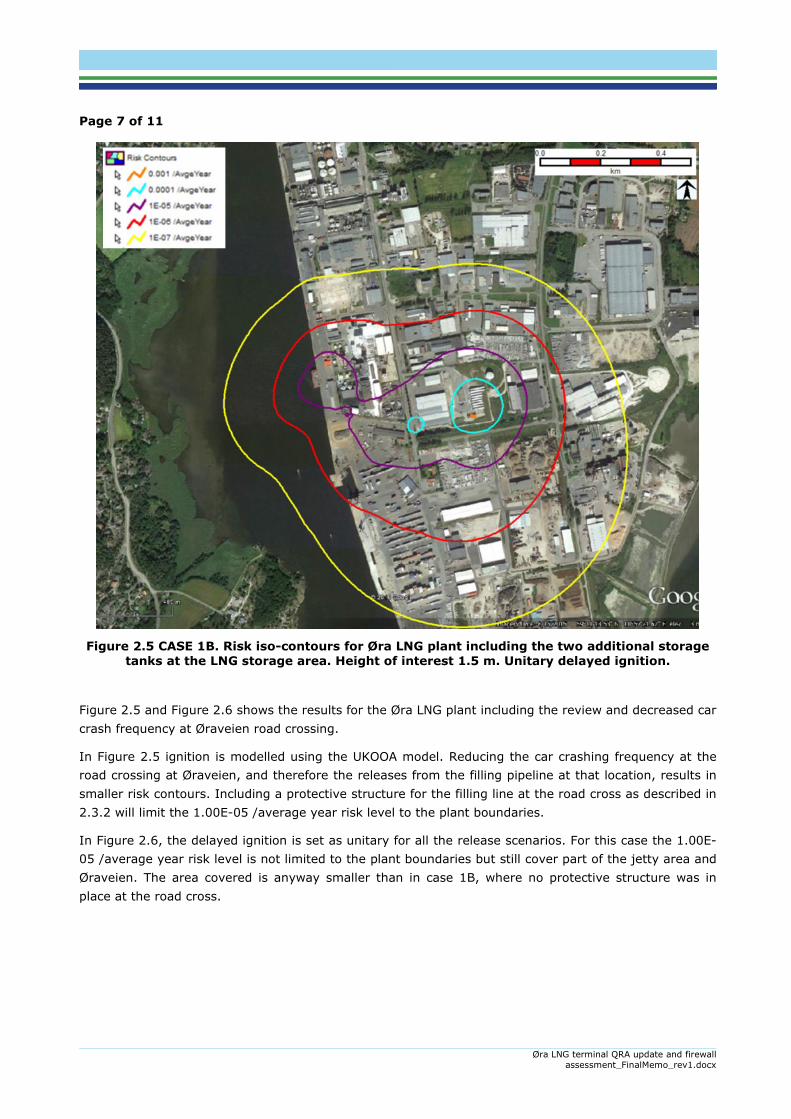
Figure 2.5 CASE 1B. Risk iso-contours for Øra LNG plant including the two additional storage tanks at the LNG storage area. Height of interest 1.5 m. Unitary delayed ignition.
Figure 2.5 and Figure 2.6 shows the results for the Øra LNG plant including the review and decreased car crash frequency at Øraveien road crossing.
In Figure 2.5 ignition is modelled using the UKOOA model. Reducing the car crashing frequency at the road crossing at Øraveien, and therefore the releases from the filling pipeline at that location, results in smaller risk contours. Including a protective structure for the filling line at the road cross as described in 2.3.2 will limit the 1.00E-05 /average year risk level to the plant boundaries.
In Figure 2.6, the delayed ignition is set as unitary for all the release scenarios. For this case the 1.00E-05 /average year risk level is not limited to the plant boundaries but still cover part of the jetty area and Øraveien. The area covered is anyway smaller than in case 1B, where no protective structure was in place at the road cross.

Page 8 of 11
Øra LNG terminal QRA update and firewall
assessment_FinalMemo_rev1.docx
Figure 2.6 CASE 2A. Risk iso-contours for Øra LNG plant including the two additional storage tanks at the LNG storage area and 90% car crash reduction at the Øraveien road cross. Height
of interest 1.5 m. UKOOA ignition modelling.

Page 9 of 11
Øra LNG terminal QRA update and firewall
assessment_FinalMemo_rev1.docx
Figure 2.7 CASE 2B. Risk iso-contours for Øra LNG plant including the two additional storage tanks at the LNG storage area and 90% car crash reduction at the Øraveien road cross. Height
of interest 1.5 m. Unitary delayed ignition.

Page 10 of 11
Øra LNG terminal QRA update and firewall
assessment_FinalMemo_rev1.docx

Page 11 of 11
Øra LNG terminal QRA update and firewall
assessment_FinalMemo_rev1.docx
3 REFERENCES /1/ Sikkerheten rundt anlegg som håndterer brannfarlige, reaksjonsfarlige, trykksatte og
eksplosjonsfarlige stoffer, kriterier for akseptabel risiko, DSB Temarapport 13, ISBN 978-82-7768-310-2
/2/ https://vegkart.atlas.vegvesen.no/
/3/ Statistisk Sentralbyrå, Trafikkulykker med personskade for 2019
/4/ Statistisk Sentralbyrå, Kjørelengder 2018-19
/4/ Statistisk Sentralbyrå, Bilparken 2019
/5/ Vegrekkverk og andre trafikksikkerhetstiltak, Statens vegvesen Håndbok V160, ISBN: 978-82-7207-696-1
/6/ Rekkverk og vegens sideområder, Statens vegvesens Håndbok N101, ISBN: 978-82-91228-33-4
/7/ Chart Ferox. External piping. Drawing number: H0004461_R1.
/8/ DNV GL Memo no. 401814 – Rev. 0 To Tommy Borgaas and Daniel Brasetvik (Gasum LNG production AS) Prepared by Marta Bucelli and Olivier Baldan. 28.06.2019.
/9/ RIVM. Reference Manual Bevi Risk Assessments, version 3.2. National Institute of Public Health and Environment (RIVM) in Netherland. 2009.