Embed Size (px)
Citation preview
Up in the air on carbon
By Dr. Dinah A. Koehler
How investors can leverage carbon data
2
For institutional client use only.
On October 5, 2016, 127 out of 197 Parties to the Framework Convention on Climate Change ratified the Paris Agreement.1 The agreement represents limiting the rise in global temperatures to, at most, 2°C above pre-industrial (1880) levels. Furthermore, the Parties agreed to the stretch goal of limiting warming to 1.5°C by 2100.
As governments begin to act on this commitment we will see ripple effects across many industries, especially those that are carbon intensive. We will also see growth in new technologies that help reduce carbon emissions. About 40 national governments and up to 20 regions and states (including California) are putting a price on each ton of greenhouse gas (GHG) emissions—a carbon fee, with the aim to accelerate the transition to a low carbon economy.2 A carbon tax or fee has the potential to change the financial calculus for companies that emit CO2 or are consumers of fossil fuels.3 Investment managers, analysts and asset-owners will want to consider these developments when evaluating investment opportunities or constructing portfolios. But many ask: where do we start, and how can investors evaluate providers of this information and incorporate the information into their portfolios?
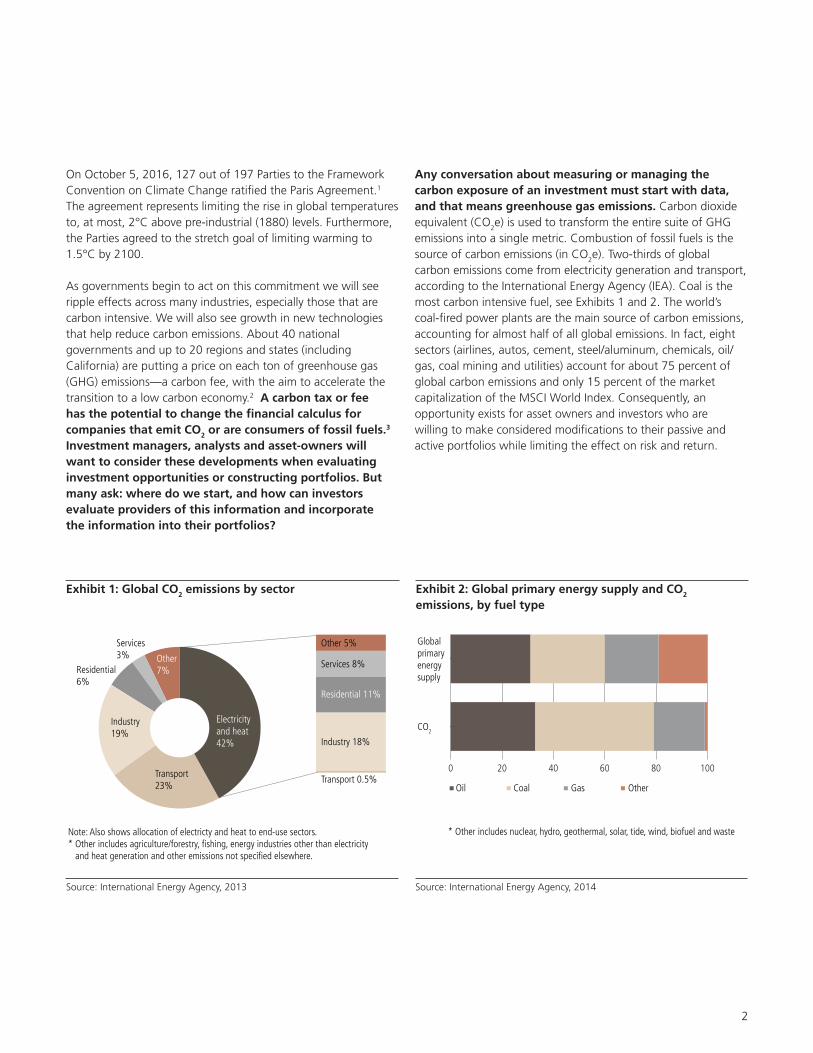
Any conversation about measuring or managing the carbon exposure of an investment must start with data, and that means greenhouse gas emissions. Carbon dioxide equivalent (CO2e) is used to transform the entire suite of GHG emissions into a single metric. Combustion of fossil fuels is the source of carbon emissions (in CO2e). Two-thirds of global carbon emissions come from electricity generation and transport, according to the International Energy Agency (IEA). Coal is the most carbon intensive fuel, see Exhibits 1 and 2. The world’s coal-fired power plants are the main source of carbon emissions, accounting for almost half of all global emissions. In fact, eight sectors (airlines, autos, cement, steel/aluminum, chemicals, oil/gas, coal mining and utilities) account for about 75 percent of global carbon emissions and only 15 percent of the market capitalization of the MSCI World Index. Consequently, an opportunity exists for asset owners and investors who are willing to make considered modifications to their passive and active portfolios while limiting the effect on risk and return.
Exhibit 1: Global CO2 emissions by sector Exhibit 2: Global primary energy supply and CO2 emissions, by fuel type
Electricity and heat42%
Transport23%
Industry19%
Residential6%
Services3% Other
7%
Transport 0.5%
Industry 18%
Residential 11%
Services 8%
Other 5%
0 20 40 60 80 100
Globalprimaryenergysupply
CO2
Oil Coal Gas Other
* Other includes nuclear, hydro, geothermal, solar, tide, wind, biofuel and wasteNote: Also shows allocation of electricty and heat to end-use sectors.* Other includes agriculture/forestry, fishing, energy industries other than electricity and heat generation and other emissions not specified elsewhere.
Source: International Energy Agency, 2013 Source: International Energy Agency, 2014
3
For institutional client use only.
Exhibit 3: Greenhouse gas emissions reporting protocol
CO2
SF6
CH4
N2O
HFCs
PFCs
Scope 1DirectScope 2
IndirectScope 3Indirect
Purchasedelectricityfor own use
Fuel combustion
Company- owned vehicles
Contractor-ownedvehicles
Wastedisposal
Employee business travel
Outsourced activities
Product use
Productionof purchasedmaterials
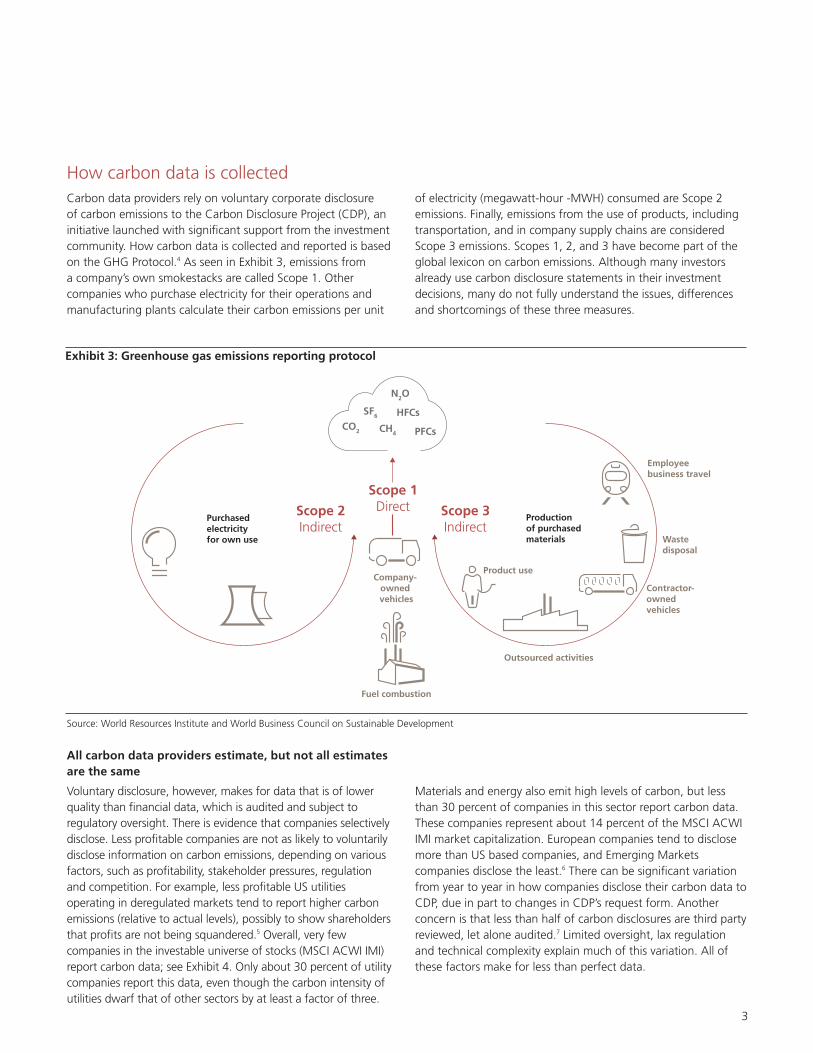
How carbon data is collectedCarbon data providers rely on voluntary corporate disclosure of carbon emissions to the Carbon Disclosure Project (CDP), an initiative launched with significant support from the investment community. How carbon data is collected and reported is based on the GHG Protocol.4 As seen in Exhibit 3, emissions from a company’s own smokestacks are called Scope 1. Other companies who purchase electricity for their operations and manufacturing plants calculate their carbon emissions per unit
of electricity (megawatt-hour -MWH) consumed are Scope 2 emissions. Finally, emissions from the use of products, including transportation, and in company supply chains are considered Scope 3 emissions. Scopes 1, 2, and 3 have become part of the global lexicon on carbon emissions. Although many investors already use carbon disclosure statements in their investment decisions, many do not fully understand the issues, differences and shortcomings of these three measures.
All carbon data providers estimate, but not all estimates are the same
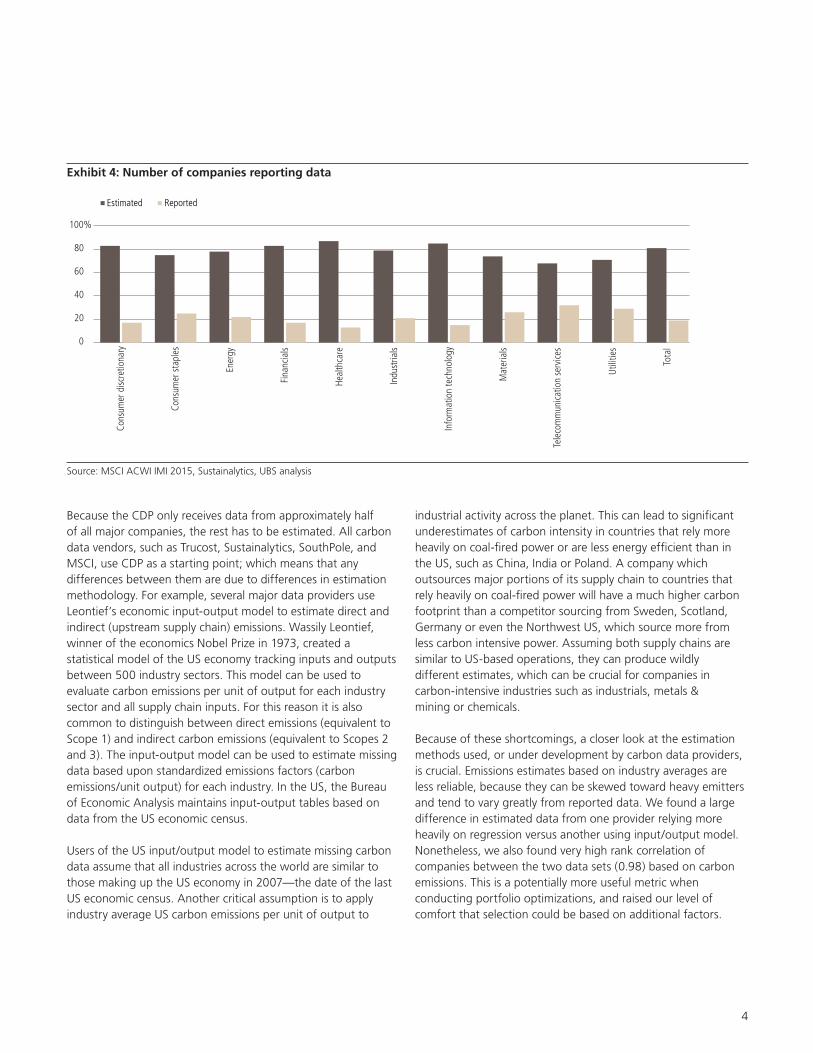
Voluntary disclosure, however, makes for data that is of lower quality than financial data, which is audited and subject to regulatory oversight. There is evidence that companies selectively disclose. Less profitable companies are not as likely to voluntarily disclose information on carbon emissions, depending on various factors, such as profitability, stakeholder pressures, regulation and competition. For example, less profitable US utilities operating in deregulated markets tend to report higher carbon emissions (relative to actual levels), possibly to show shareholders that profits are not being squandered.5 Overall, very few companies in the investable universe of stocks (MSCI ACWI IMI) report carbon data; see Exhibit 4. Only about 30 percent of utility companies report this data, even though the carbon intensity of utilities dwarf that of other sectors by at least a factor of three.
Materials and energy also emit high levels of carbon, but less than 30 percent of companies in this sector report carbon data. These companies represent about 14 percent of the MSCI ACWI IMI market capitalization. European companies tend to disclose more than US based companies, and Emerging Markets companies disclose the least.6 There can be significant variation from year to year in how companies disclose their carbon data to CDP, due in part to changes in CDP’s request form. Another concern is that less than half of carbon disclosures are third party reviewed, let alone audited.7 Limited oversight, lax regulation and technical complexity explain much of this variation. All of these factors make for less than perfect data.
Source: World Resources Institute and World Business Council on Sustainable Development
4
For institutional client use only.
Exhibit 4: Number of companies reporting data
* Other includes nuclear, hydro, geothermal, solar, tide, wind, biofuel and waste
0
20
40
60
80
100%
Tota
l
Utili
ties
Tele
com
mun
icatio
n se
rvice
s
Mat
eria
ls
Info
rmat
ion
tech
nolo
gy
Indu
stria
ls
Heal
thca
re
Fina
ncia
ls
Ener
gy
Cons
umer
sta
ples
Cons
umer
disc
retio
nary
0
30,000,000
40,000,000
50,000,000
60,000,000
$70,000,000
Estimated Reported
2015 market cap (USD millions)
10,000,000
20,000,000
Source: MSCI ACWI IMI 2015, Sustainalytics, UBS analysis
Because the CDP only receives data from approximately half of all major companies, the rest has to be estimated. All carbon data vendors, such as Trucost, Sustainalytics, SouthPole, and MSCI, use CDP as a starting point; which means that any differences between them are due to differences in estimation methodology. For example, several major data providers use Leontief’s economic input-output model to estimate direct and indirect (upstream supply chain) emissions. Wassily Leontief, winner of the economics Nobel Prize in 1973, created a statistical model of the US economy tracking inputs and outputs between 500 industry sectors. This model can be used to evaluate carbon emissions per unit of output for each industry sector and all supply chain inputs. For this reason it is also common to distinguish between direct emissions (equivalent to Scope 1) and indirect carbon emissions (equivalent to Scopes 2 and 3). The input-output model can be used to estimate missing data based upon standardized emissions factors (carbon emissions/unit output) for each industry. In the US, the Bureau of Economic Analysis maintains input-output tables based on data from the US economic census.
Users of the US input/output model to estimate missing carbon data assume that all industries across the world are similar to those making up the US economy in 2007—the date of the last US economic census. Another critical assumption is to apply industry average US carbon emissions per unit of output to
industrial activity across the planet. This can lead to significant underestimates of carbon intensity in countries that rely more heavily on coal-fired power or are less energy efficient than in the US, such as China, India or Poland. A company which outsources major portions of its supply chain to countries that rely heavily on coal-fired power will have a much higher carbon footprint than a competitor sourcing from Sweden, Scotland, Germany or even the Northwest US, which source more from less carbon intensive power. Assuming both supply chains are similar to US-based operations, they can produce wildly different estimates, which can be crucial for companies in carbon-intensive industries such as industrials, metals & mining or chemicals.
Because of these shortcomings, a closer look at the estimation methods used, or under development by carbon data providers, is crucial. Emissions estimates based on industry averages are less reliable, because they can be skewed toward heavy emitters and tend to vary greatly from reported data. We found a large difference in estimated data from one provider relying more heavily on regression versus another using input/output model. Nonetheless, we also found very high rank correlation of companies between the two data sets (0.98) based on carbon emissions. This is a potentially more useful metric when conducting portfolio optimizations, and raised our level of comfort that selection could be based on additional factors.
5
For institutional client use only.
An investor purchasing access to carbon data also needs to consider how the data will be used. If the objective is to design a low carbon index, then using high level estimates (sector averages) may suffice. If the objective is to leverage carbon data in active equity portfolio construction or to report on a portfolio’s carbon footprint, precision starts to matter more because of the much lower number of holdings in an actively managed portfolio. In particular, (sub) industry specific models are more important for carbon-intensive sectors where differences in estimated emissions can affect carbon data in industry sectors that rely on inputs from these industries. Average carbon emissions estimates cannot capture large differences in companies within these industries. Finally, if the objective is to build a fossil fuel divestment strategy, then this requires a bottom-up detailed analysis of individual companies in the energy sector. Inputs would include engineering data, fuel-specific carbon profile, reserves data, production and cash flow analysis. Our UBS Sustainable Investors team has looked at the consequences of carbon divestment strategies.8
In conclusion, carbon data provider selection is a matter of preference and purpose. All data providers draw from voluntarily reported data, mostly CDP, which has considerably high year-over-year variance. Data providers need to estimate about 50 percent of the data to cover any index or sizable universe, and they all struggle to adequately capture/estimate Scope 1 emissions from energy, utilities and materials sectors, which have the biggest carbon footprint. This can lead to significant differences that propagate through the entire database (Scope 2 and Scope 3 for all other sectors). What is most important, however, is that we find little difference in company rankings between data providers, which suggests that despite some issues, the carbon data that is available today can be used very successfully in active and passive investment processes.
Carbon footprintingHaving settled on a carbon data provider, the next question is how to use the data to make investment decisions. An investor or asset owner can use the data to report on the carbon emissions associated with stocks in a portfolio at a given point in time—commonly called its “carbon footprint”. But coming up with a meaningful answer is not straightforward.
Carbon footprinting of an investment strategy requires developing an approach that: 1) provides insight into the main sources of carbon emissions in an investable universe (e.g. MSCI World Index or FTSE All-World Index), 2) disaggregates carbon emissions to inform on actions taken at the company level, and
3) allows comparison to alternative investments (e.g. an index or an alternative portfolio). It is important to find the right context for a carbon number; otherwise it becomes very difficult to interpret what so many metric tons of CO2e emitted can mean and how to react as an investor.
The lack of uniform portfolio carbon reporting standards presents some issues as well. Is a specific number too high or too low? Is the company doing enough, or too little? How would we know? To this end, carbon footprinting at an individual stock level needs to be meaningful, and that depends on the context within which it is interpreted. For active investors these answers play a bigger role than for passive strategies such as index funds, where taking a bite of carbon out of a standard benchmark can suffice.
The majority of carbon footprinting focuses on Scope 1 and 2 emissions, which provide insight into a company’s energy suppliers and its demand for energy. Indeed, carbon footprinting is on more solid ground if Scope 3 emissions are omitted. Very few companies disclose this information, and gathering the data is difficult, because digging deep into supply chains for carbon emission data is extremely difficult for many companies with vast global supply chains. The further up you go, the less data, and the less reliable data. Thus, Scope 3 data is largely estimated, and there is little to be gained from leveraging industry average estimates. In the footprinting examples that follow, we focus on Scope 1 and 2 carbon emissions and carbon intensity.
Exhibits 5 and 6 show some of the nuances of carbon measurement at the stock and portfolio levels respectively. To explain these nuances, let’s compare two energy companies (A & B, Exhibit 5). Energy Corp A has higher on-site Scope 1 emissions due to fossil fuel combustion and higher Scope 2 emissions associated with purchased energy, when compared to Energy Corp B. However, when emissions are normalized by revenue we can see that Energy Corp B appears much more carbon intensive than Energy Corp A in terms of Scope 1 on-site activities versus Scope 2 intensity, which is significantly lower. In absolute terms, Energy Corp B may be the better investment from a carbon emissions perspective, but it is also much more energy intensive. A simplistic conclusion might be that Energy Corp A is the better “carbon-lite” investment per unit of output. However, the underlying reason is that Energy Corp A is a large integrated oil and gas company with refining operations, causing it to purchase more energy (evidenced by Scope 2 emissions). Energy Corp B is a smaller oil and gas exploration and production company. Size is therefore not an adequate predictor of carbon intensity. Rather, industry sub-sector

6
For institutional client use only.
Source: UBS analysis.
membership and the nature of the business model can have a significant impact on a company’s carbon footprint.
These nuances are important from an investment perspective when comparing companies within the energy sector. Like versus like comparisons are much more meaningful and more representative of the company business model. This bottom-up view is critical for active managers who can actively take carbon exposure into account. Passive strategies can afford to take
a more aggregate sector view, though this can also lead to unintended consequences. Large energy companies that are not very carbon intensive can be overweight, possibly leading to counterintuitive results. Just focusing on absolute carbon emissions will also penalize large companies, which is not favorable for diversified portfolios with a large-cap bias. These considerations are critical to portfolio construction as we explain further in the next section.
Exhibit 5: Carbon footprint, Company examples
Carbon emission (million tons CO2e) Carbon intensity (M metric tons CO2e/revenue)
Company Scope 1 absolute Scope 2 absolute Scope 1 intensity Scope 2 intensity
On-site resources, combustion of fossil fuels
Consumption of purchased energy
On-site resources, combustion of fossil fuels
Consumption of purchased energy
Energy Corp A 120,000,000 8,000,000 300 20
Energy Corp B 5,000,000 3,250 2,010 2
Chemicals Corp A 25,000,000 7,600,000 500 155
Chemicals Corp B 13,000,000 3,000,000 930 210
Metals Corp A 10,000,000 3,500,000 775 280
Metals Corp B 3,000,000 1,550,000 1,400 720
Industrials Corp A 35,000,000 330,000 860 8
Industrials Corp B 16,000,000 230,000 1,200 18
IT Corp A 600,000 1,500,000 66 175
IT Corp B 1,000,000 9,500,000 19 17
Additional examples from other sectors show a similar dynamic. For example, two diversified chemical companies with very different carbon intensity profiles. In terms of absolute, Scope 1 emissions Chemicals Corp A is less attractive, but almost twice as efficient from an intensity perspective as Chemicals Corp B. These differences are an invitation to a deeper exploration: What chemicals are produced? How much energy is sourced from coal-fired power plants versus natural gas or renewables? How much of the production is outsourced? These are all business model decisions that can inform on a company’s competitiveness from a cost perspective and on future competitiveness should carbon emissions be taxed or otherwise regulated.
The other industry examples compare two aluminum manufacturers, an airline versus a waste management company (Industrials Corp A versus B) and finally two IT corporations. IT Corp A and B are both semiconductor manufacturers with very different carbon footprints. IT Corp B is indeed much larger in terms of revenue, but it is also significantly less carbon intensive.
We can also see that both IT companies emit more Scope 2 carbon versus Scope 1, indicating that their main climate change impacts are due to purchased energy. For many manufacturing, retail and other service sector companies, Scope 2 emissions matter more than Scope 1 emissions. Indeed, the majority of Scope 1 emissions come from the utility and energy sectors, which is in line with IEA data. Insightful analysis of carbon exposures needs to take into account these important differences to achieve the right trade-off between risk, return opportunity and carbon emissions.
From a portfolio perspective, absolute carbon relative to a benchmark can be informative. But this is most helpful when comparing a near-passive strategy to its benchmark, e.g. MSCI World Index or FTSE All-world Index. These are like-to-like constituent comparisons, and the investment aim should be to reduce total carbon emissions of the product by reweighting constituents compared to its benchmark, while keeping active risk low. Exactly by how much is discussed in the next section.
7
For institutional client use only.
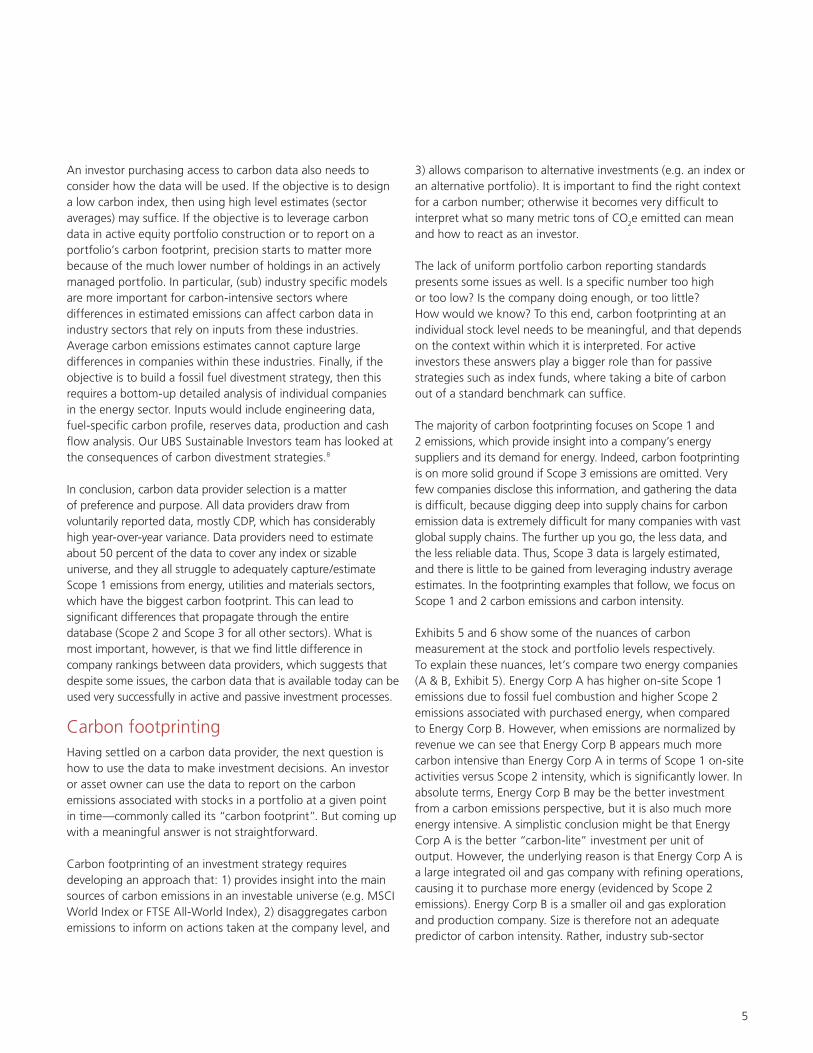
For actively managed portfolios, absolute carbon levels are less meaningful when compared with a benchmark. In most cases an actively managed portfolio will have lower absolute emissions because it does not hold the entire index by definition; see Exhibit 6. The companies in a representative portfolio emit a total of 156.8 million metric tons of CO2e (MT CO2e), compared to the index (5.2 trillion MT CO2e).9 This assumes that the portfolio owns the full market value of each holding, which is clearly not the case. Thus, a more relevant analysis of a portfolio’s carbon footprint is relative to holdings in the actual portfolio—the ownership view.10 The comparison to an index (or competing portfolios) is best done on a dollar-invested basis or on the basis of AUM held in the portfolio. Ownership of portfolio carbon is denoted by:
However, emissions, as noted above, give a limited view on portfolio carbon performance in terms of stock-picking skill. If carbon is a key ingredient in portfolio construction we would like to understand whether the best-performing companies in terms of carbon emissions relative to their industry peers were indeed selected. This approach is particularly crucial to preserving a well-diversified portfolio. Carbon intensity serves to answer that question. For example, the carbon intensity of the holdings in the representative portfolio is 14,000 (MT CO2e/sales), compared to the index (18,000 MT CO2e/sales), utilizing the following formula:
Exhibit 6: Portfolio carbon footprint
What is my portfolio’s total carbon footprint, relative to share ownership?
What is my portfolio’s exposure to carbon
intensive companies?
Total emissions scope 1+2 (MT CO2e)
Scope 1+2 (MT CO2e) Scope 1+2 (MT CO2e/Sales)
Portfolio 156,800,000 3,620,000 14,000
Standard Index 5,158,000,000 6,800,000 18,000
Source: UBS analysis.
The conclusion from this analysis would be that, yes indeed, an investment in this representative portfolio means an investment in less carbon emissions—compared to the standard index.
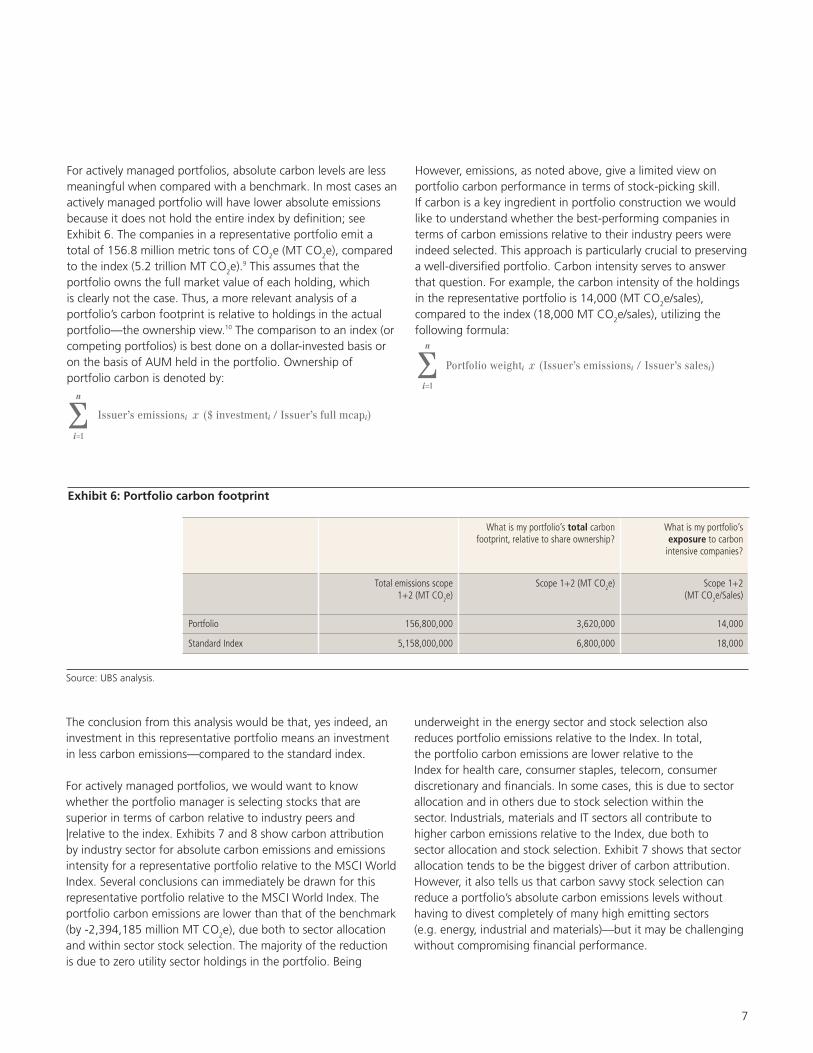
For actively managed portfolios, we would want to know whether the portfolio manager is selecting stocks that are superior in terms of carbon relative to industry peers and |relative to the index. Exhibits 7 and 8 show carbon attribution by industry sector for absolute carbon emissions and emissions intensity for a representative portfolio relative to the MSCI World Index. Several conclusions can immediately be drawn for this representative portfolio relative to the MSCI World Index. The portfolio carbon emissions are lower than that of the benchmark (by -2,394,185 million MT CO2e), due both to sector allocation and within sector stock selection. The majority of the reduction is due to zero utility sector holdings in the portfolio. Being
underweight in the energy sector and stock selection also reduces portfolio emissions relative to the Index. In total, the portfolio carbon emissions are lower relative to the Index for health care, consumer staples, telecom, consumer discretionary and financials. In some cases, this is due to sector allocation and in others due to stock selection within the sector. Industrials, materials and IT sectors all contribute to higher carbon emissions relative to the Index, due both to sector allocation and stock selection. Exhibit 7 shows that sector allocation tends to be the biggest driver of carbon attribution. However, it also tells us that carbon savvy stock selection can reduce a portfolio’s absolute carbon emissions levels without having to divest completely of many high emitting sectors (e.g. energy, industrial and materials)—but it may be challenging without compromising financial performance.
($ investmenti / Issuer’s full mcapi) Issuer’s emissionsi x Σn
i=1
Portfolio weighti x (Issuer’s emissionsi / Issuer’s salesi)Σn
i=1
8
For institutional client use only.
Exhibit 7: Carbon emissions attribution analysis, representative portfolio
Exhibit 8: Carbon intensity attribution analysis, representative portfolio
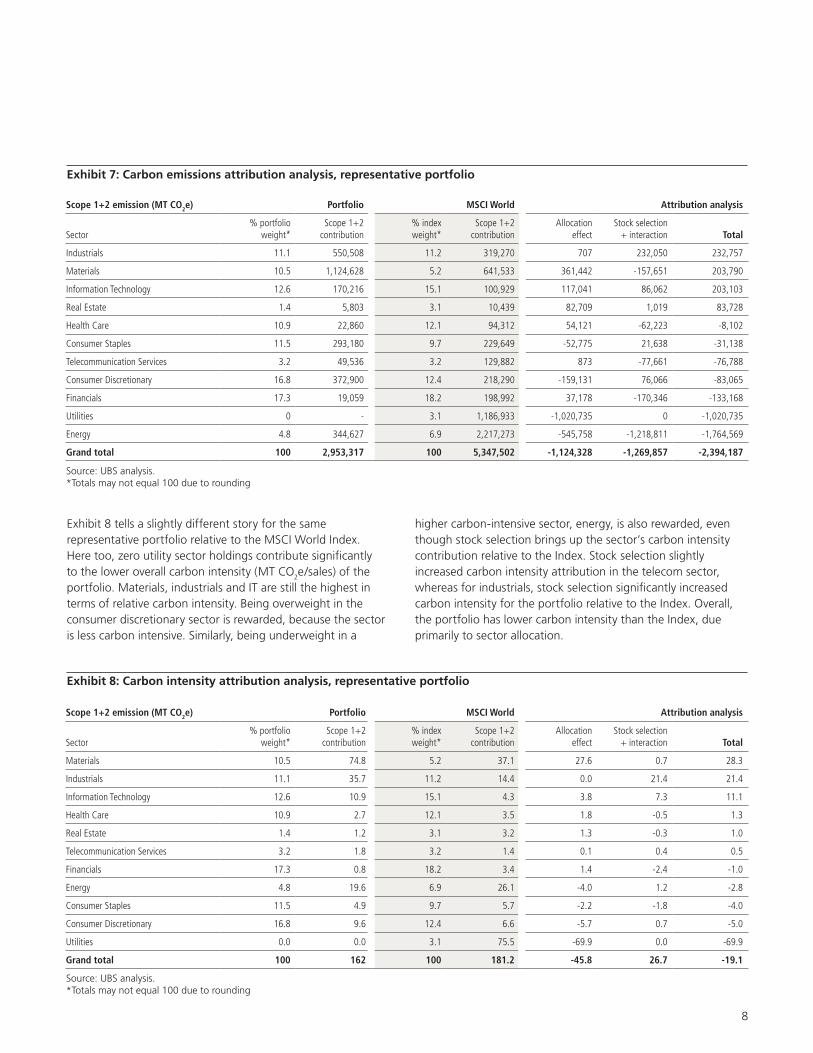
Exhibit 8 tells a slightly different story for the same representative portfolio relative to the MSCI World Index. Here too, zero utility sector holdings contribute significantly to the lower overall carbon intensity (MT CO2e/sales) of the portfolio. Materials, industrials and IT are still the highest in terms of relative carbon intensity. Being overweight in the consumer discretionary sector is rewarded, because the sector is less carbon intensive. Similarly, being underweight in a
higher carbon-intensive sector, energy, is also rewarded, even though stock selection brings up the sector’s carbon intensity contribution relative to the Index. Stock selection slightly increased carbon intensity attribution in the telecom sector, whereas for industrials, stock selection significantly increased carbon intensity for the portfolio relative to the Index. Overall, the portfolio has lower carbon intensity than the Index, due primarily to sector allocation.
Scope 1+2 emission (MT CO2e) Portfolio MSCI World Attribution analysis
Sector% portfolio
weight*Scope 1+2
contribution% index weight*
Scope 1+2 contribution
Allocation effect
Stock selection + interaction
Total
Industrials 11.1 550,508 11.2 319,270 707 232,050 232,757
Materials 10.5 1,124,628 5.2 641,533 361,442 -157,651 203,790
Information Technology 12.6 170,216 15.1 100,929 117,041 86,062 203,103
Real Estate 1.4 5,803 3.1 10,439 82,709 1,019 83,728
Health Care 10.9 22,860 12.1 94,312 54,121 -62,223 -8,102
Consumer Staples 11.5 293,180 9.7 229,649 -52,775 21,638 -31,138
Telecommunication Services 3.2 49,536 3.2 129,882 873 -77,661 -76,788
Consumer Discretionary 16.8 372,900 12.4 218,290 -159,131 76,066 -83,065
Financials 17.3 19,059 18.2 198,992 37,178 -170,346 -133,168
Utilities 0 - 3.1 1,186,933 -1,020,735 0 -1,020,735
Energy 4.8 344,627 6.9 2,217,273 -545,758 -1,218,811 -1,764,569
Grand total 100 2,953,317 100 5,347,502 -1,124,328 -1,269,857 -2,394,187
Scope 1+2 emission (MT CO2e) Portfolio MSCI World Attribution analysis
Sector% portfolio
weight*Scope 1+2
contribution% index weight*
Scope 1+2 contribution
Allocation effect
Stock selection + interaction
Total
Materials 10.5 74.8 5.2 37.1 27.6 0.7 28.3
Industrials 11.1 35.7 11.2 14.4 0.0 21.4 21.4
Information Technology 12.6 10.9 15.1 4.3 3.8 7.3 11.1
Health Care 10.9 2.7 12.1 3.5 1.8 -0.5 1.3
Real Estate 1.4 1.2 3.1 3.2 1.3 -0.3 1.0
Telecommunication Services 3.2 1.8 3.2 1.4 0.1 0.4 0.5
Financials 17.3 0.8 18.2 3.4 1.4 -2.4 -1.0
Energy 4.8 19.6 6.9 26.1 -4.0 1.2 -2.8
Consumer Staples 11.5 4.9 9.7 5.7 -2.2 -1.8 -4.0
Consumer Discretionary 16.8 9.6 12.4 6.6 -5.7 0.7 -5.0
Utilities 0.0 0.0 3.1 75.5 -69.9 0.0 -69.9
Grand total 100 162 100 181.2 -45.8 26.7 -19.1
Source: UBS analysis. *Totals may not equal 100 due to rounding
Source: UBS analysis. *Totals may not equal 100 due to rounding
9
For institutional client use only.
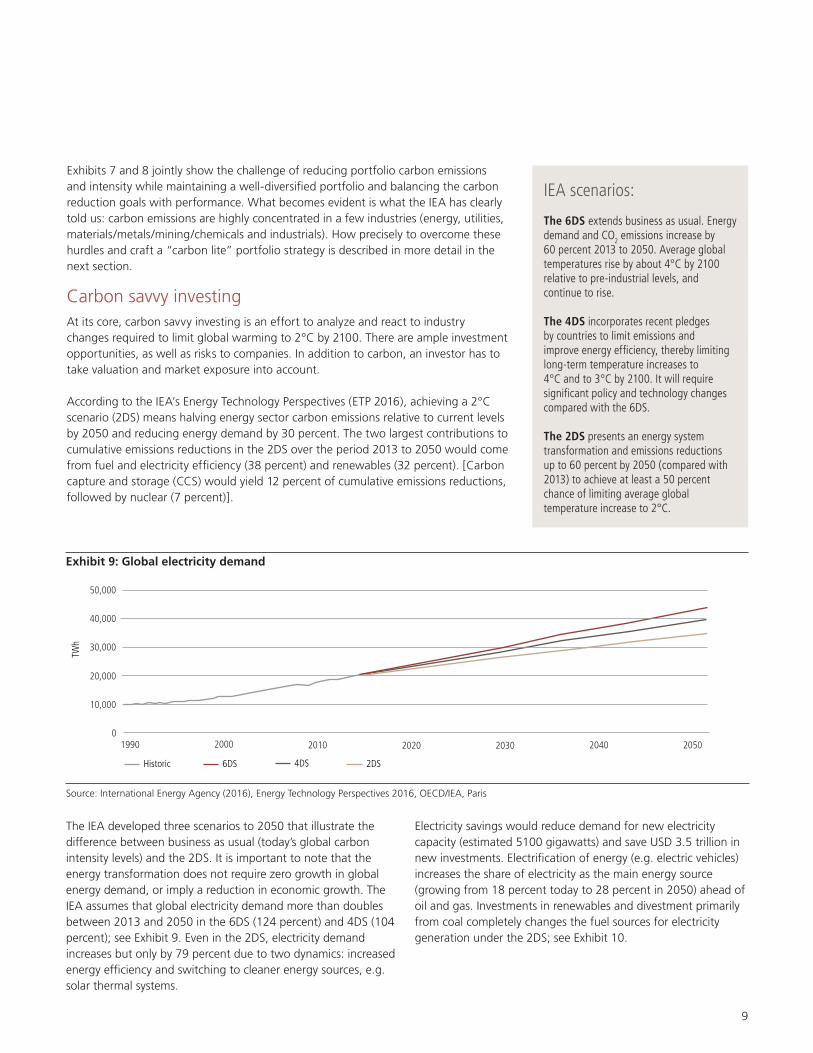
The IEA developed three scenarios to 2050 that illustrate the difference between business as usual (today’s global carbon intensity levels) and the 2DS. It is important to note that the energy transformation does not require zero growth in global energy demand, or imply a reduction in economic growth. The IEA assumes that global electricity demand more than doubles between 2013 and 2050 in the 6DS (124 percent) and 4DS (104 percent); see Exhibit 9. Even in the 2DS, electricity demand increases but only by 79 percent due to two dynamics: increased energy efficiency and switching to cleaner energy sources, e.g. solar thermal systems.
Electricity savings would reduce demand for new electricity capacity (estimated 5100 gigawatts) and save USD 3.5 trillion in new investments. Electrification of energy (e.g. electric vehicles) increases the share of electricity as the main energy source (growing from 18 percent today to 28 percent in 2050) ahead of oil and gas. Investments in renewables and divestment primarily from coal completely changes the fuel sources for electricity generation under the 2DS; see Exhibit 10.
Exhibits 7 and 8 jointly show the challenge of reducing portfolio carbon emissions and intensity while maintaining a well-diversified portfolio and balancing the carbon reduction goals with performance. What becomes evident is what the IEA has clearly told us: carbon emissions are highly concentrated in a few industries (energy, utilities, materials/metals/mining/chemicals and industrials). How precisely to overcome these hurdles and craft a “carbon lite” portfolio strategy is described in more detail in the next section.
Carbon savvy investingAt its core, carbon savvy investing is an effort to analyze and react to industry changes required to limit global warming to 2°C by 2100. There are ample investment opportunities, as well as risks to companies. In addition to carbon, an investor has to take valuation and market exposure into account.
According to the IEA’s Energy Technology Perspectives (ETP 2016), achieving a 2°C scenario (2DS) means halving energy sector carbon emissions relative to current levels by 2050 and reducing energy demand by 30 percent. The two largest contributions to cumulative emissions reductions in the 2DS over the period 2013 to 2050 would come from fuel and electricity efficiency (38 percent) and renewables (32 percent). [Carbon capture and storage (CCS) would yield 12 percent of cumulative emissions reductions, followed by nuclear (7 percent)].
IEA scenarios:
The 6DS extends business as usual. Energy demand and CO2 emissions increase by 60 percent 2013 to 2050. Average global temperatures rise by about 4°C by 2100 relative to pre-industrial levels, and continue to rise.
The 4DS incorporates recent pledges by countries to limit emissions and improve energy efficiency, thereby limiting long-term temperature increases to 4°C and to 3°C by 2100. It will require significant policy and technology changes compared with the 6DS.
The 2DS presents an energy system transformation and emissions reductions up to 60 percent by 2050 (compared with 2013) to achieve at least a 50 percent chance of limiting average global temperature increase to 2°C.
Exhibit 9: Global electricity demand
* Other includes nuclear, hydro, geothermal, solar, tide, wind, biofuel and waste
50,000
40,000
30,000
20,000
10,000
0
TWh
1990 2000 2010 2020 2030 2040 2050
Historic 6DS 4DS 2DS
Source: International Energy Agency (2016), Energy Technology Perspectives 2016, OECD/IEA, Paris
10
For institutional client use only.
Exhibit 10: Global electricity generation mix in the 2DS
* Other includes nuclear, hydro, geothermal, solar, tide, wind, biofuel and waste
50,000
40,000
30,000
20,000
10,000
0
TWh
1990 2000
2013 2020 2030 2040 2050
Historic 6DS 4DS 2DS
100%
80
60
40
20
0
OtherWindSTESolar PVHydroBiofuels and wasteNuclearCoal with CSSCoalOilNatural gas with CSSNatural gasLow-carbon share
Source: International Energy Agency (2016), Energy Technology Perspectives 2016, OECD/IEA, Paris
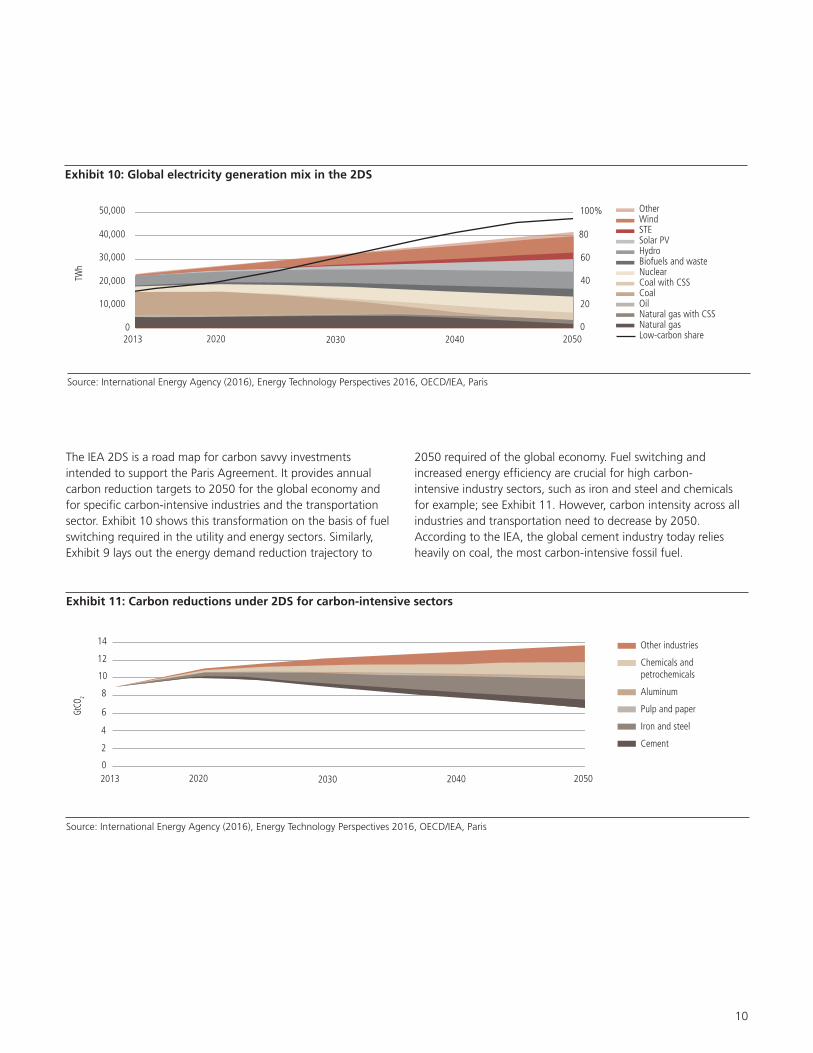
The IEA 2DS is a road map for carbon savvy investments intended to support the Paris Agreement. It provides annual carbon reduction targets to 2050 for the global economy and for specific carbon-intensive industries and the transportation sector. Exhibit 10 shows this transformation on the basis of fuel switching required in the utility and energy sectors. Similarly, Exhibit 9 lays out the energy demand reduction trajectory to
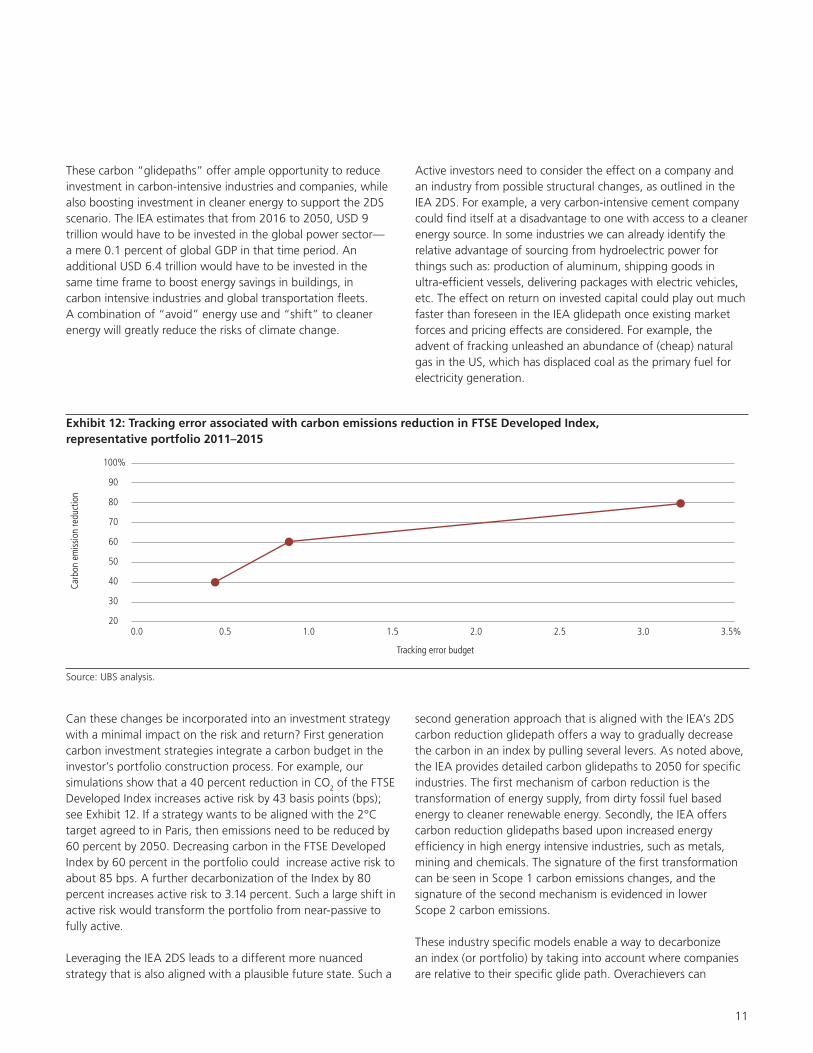
2050 required of the global economy. Fuel switching and increased energy efficiency are crucial for high carbon- intensive industry sectors, such as iron and steel and chemicals for example; see Exhibit 11. However, carbon intensity across all industries and transportation need to decrease by 2050. According to the IEA, the global cement industry today relies heavily on coal, the most carbon-intensive fossil fuel.
Exhibit 11: Carbon reductions under 2DS for carbon-intensive sectors
Source: International Energy Agency (2016), Energy Technology Perspectives 2016, OECD/IEA, Paris
GtCO
2
2013 2020 2030 2040 20500
2
4
6
8
10
12
14 Other industries
Chemicals and petrochemicals
Aluminum
Pulp and paper
Iron and steel
Cement
11
For institutional client use only.
These carbon “glidepaths” offer ample opportunity to reduce investment in carbon-intensive industries and companies, while also boosting investment in cleaner energy to support the 2DS scenario. The IEA estimates that from 2016 to 2050, USD 9 trillion would have to be invested in the global power sector— a mere 0.1 percent of global GDP in that time period. An additional USD 6.4 trillion would have to be invested in the same time frame to boost energy savings in buildings, in carbon intensive industries and global transportation fleets. A combination of “avoid” energy use and “shift” to cleaner energy will greatly reduce the risks of climate change.
Active investors need to consider the effect on a company and an industry from possible structural changes, as outlined in the IEA 2DS. For example, a very carbon-intensive cement company could find itself at a disadvantage to one with access to a cleaner energy source. In some industries we can already identify the relative advantage of sourcing from hydroelectric power for things such as: production of aluminum, shipping goods in ultra-efficient vessels, delivering packages with electric vehicles, etc. The effect on return on invested capital could play out much faster than foreseen in the IEA glidepath once existing market forces and pricing effects are considered. For example, the advent of fracking unleashed an abundance of (cheap) natural gas in the US, which has displaced coal as the primary fuel for electricity generation.
Exhibit 12: Tracking error associated with carbon emissions reduction in FTSE Developed Index, representative portfolio 2011–2015
Carb
on e
miss
ion
redu
ctio
n
0.020
30
40
50
60
70
80
90
100%
0.5 1.0
Tracking error budget
1.5 2.0 2.5 3.0 3.5%
Source: UBS analysis.
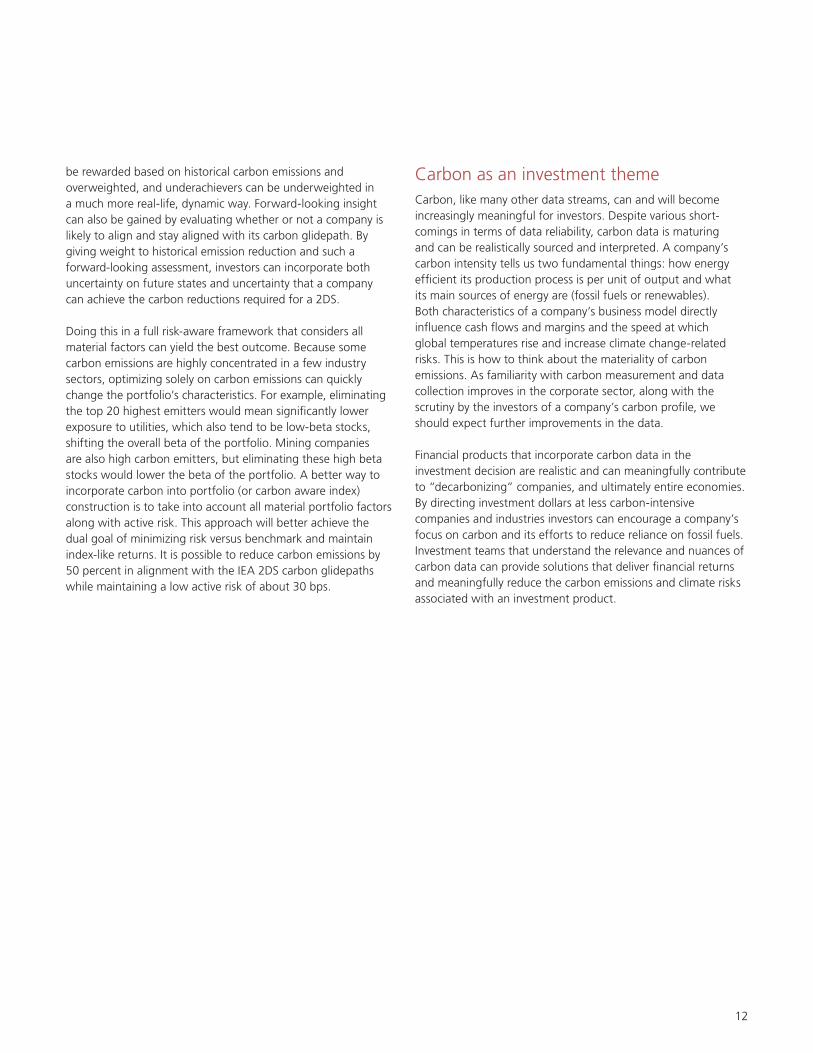
Can these changes be incorporated into an investment strategy with a minimal impact on the risk and return? First generation carbon investment strategies integrate a carbon budget in the investor’s portfolio construction process. For example, our simulations show that a 40 percent reduction in CO2 of the FTSE Developed Index increases active risk by 43 basis points (bps); see Exhibit 12. If a strategy wants to be aligned with the 2°C target agreed to in Paris, then emissions need to be reduced by 60 percent by 2050. Decreasing carbon in the FTSE Developed Index by 60 percent in the portfolio could increase active risk to about 85 bps. A further decarbonization of the Index by 80 percent increases active risk to 3.14 percent. Such a large shift in active risk would transform the portfolio from near-passive to fully active.
Leveraging the IEA 2DS leads to a different more nuanced strategy that is also aligned with a plausible future state. Such a
second generation approach that is aligned with the IEA’s 2DS carbon reduction glidepath offers a way to gradually decrease the carbon in an index by pulling several levers. As noted above, the IEA provides detailed carbon glidepaths to 2050 for specific industries. The first mechanism of carbon reduction is the transformation of energy supply, from dirty fossil fuel based energy to cleaner renewable energy. Secondly, the IEA offers carbon reduction glidepaths based upon increased energy efficiency in high energy intensive industries, such as metals, mining and chemicals. The signature of the first transformation can be seen in Scope 1 carbon emissions changes, and the signature of the second mechanism is evidenced in lower Scope 2 carbon emissions.
These industry specific models enable a way to decarbonize an index (or portfolio) by taking into account where companies are relative to their specific glide path. Overachievers can
12
For institutional client use only.
be rewarded based on historical carbon emissions and overweighted, and underachievers can be underweighted in a much more real-life, dynamic way. Forward-looking insight can also be gained by evaluating whether or not a company is likely to align and stay aligned with its carbon glidepath. By giving weight to historical emission reduction and such a forward-looking assessment, investors can incorporate both uncertainty on future states and uncertainty that a company can achieve the carbon reductions required for a 2DS.
Doing this in a full risk-aware framework that considers all material factors can yield the best outcome. Because some carbon emissions are highly concentrated in a few industry sectors, optimizing solely on carbon emissions can quickly change the portfolio’s characteristics. For example, eliminating the top 20 highest emitters would mean significantly lower exposure to utilities, which also tend to be low-beta stocks, shifting the overall beta of the portfolio. Mining companies are also high carbon emitters, but eliminating these high beta stocks would lower the beta of the portfolio. A better way to incorporate carbon into portfolio (or carbon aware index) construction is to take into account all material portfolio factors along with active risk. This approach will better achieve the dual goal of minimizing risk versus benchmark and maintain index-like returns. It is possible to reduce carbon emissions by 50 percent in alignment with the IEA 2DS carbon glidepaths while maintaining a low active risk of about 30 bps.
Carbon as an investment theme Carbon, like many other data streams, can and will become increasingly meaningful for investors. Despite various short- comings in terms of data reliability, carbon data is maturing and can be realistically sourced and interpreted. A company’s carbon intensity tells us two fundamental things: how energy efficient its production process is per unit of output and what its main sources of energy are (fossil fuels or renewables). Both characteristics of a company’s business model directly influence cash flows and margins and the speed at which global temperatures rise and increase climate change-related risks. This is how to think about the materiality of carbon emissions. As familiarity with carbon measurement and data collection improves in the corporate sector, along with the scrutiny by the investors of a company’s carbon profile, we should expect further improvements in the data.
Financial products that incorporate carbon data in the investment decision are realistic and can meaningfully contribute to “decarbonizing” companies, and ultimately entire economies. By directing investment dollars at less carbon-intensive companies and industries investors can encourage a company’s focus on carbon and its efforts to reduce reliance on fossil fuels. Investment teams that understand the relevance and nuances of carbon data can provide solutions that deliver financial returns and meaningfully reduce the carbon emissions and climate risks associated with an investment product.
13
For institutional client use only.
Blue sky thinking
Every year an estimated 1.4 million to 1.6 million people die prematurely in China due to heavy air pollution. Beijing regularly experiences extremely high air pollution levels (over 400 parts per million), at 17 times the safe level recommended by the World Health Organization of 25 ppm. Five hundred thousand Chinese citizens suffer under smoggy skies for almost half of the year.11 In January 2017, the former Chinese health minister publicly stated that between 350,000 and 500,000 people die prematurely each year in Beijing as a result of air pollution.12 Shortly thereafter, the acting major of Beijing announced that the city would spend USD 2.7 billion to fight air pollution in 2017. The country is trying to reduce its reliance on coal-fired power, currently 60 percent of electricity.13
Heavy pollution in China is being mirrored by similar images of Indian cities shrouded in smog. In 2015, an estimated 1.1 million people died prematurely from air pollution in India. Indeed, India’s air has been worsening while the overall global air pollution situation has stabilized in recent years—due in part to slow global economic growth.14 While the US and Europe established regulatory standards to protect their populations from this threat, even in the US an estimated 88,000 people died prematurely in 2015 from exposure to air pollution. The main sources in the US, as in India and China, are coal-fired power plants (the US sources 33 percent of its power from coal) and transportation. Cleaning up our skies is a win-win: less people die from respiratory disease and cardio-vascular distress related to air pollution, and the speed of climate change is decelerated.
Blue skies are on the horizon. Ninety percent of new power added to European electricity grids in 2016 was renewable energy.15 In the US, solar installations increased by 95 percent in 2016 relative to 2015, according to the Solar Energy Industries Association.16 Solar was the top source of new power additions to the US grid. One million workers are employed in renewable energy in the US—five times the
employment in traditional fossil fuel-based electricity, including coal, gas and oil workers, based on data from the US Department of Energy.17 China has become the largest investor in renewable energy.18 In 2016, China invested USD 32 billion in renewables and has committed to USD 360 billion investment in renewable energy by 2020. Other countries are following suit: in Chile, Morocco and the United Arab Emirates, new solar installations will provide electricity at costs much lower than those charged by conventional fossil fuel plants.19
Over the past seven years, the cost of wind power in the US has dropped from USD 60 to USD 100 per megawatt-hour (MWh) to around USD 15 to USD 25/MWh in the middle third of the US. For large solar installations, it has declined from USD 100 to USD 300, to USD 40 to USD 70 per MWh. Wind power is currently the cheapest source of energy in the middle third of the US, with its all-in cost of USD 15 to USD 25/MWh, compared to the USD 55 to USD 65/MWh for a new natural-gas-fired plant.20 Wind and solar are the cheapest sources of power in many parts of the US without any subsidies.21 By 2017, large-scale solar projects in Texas will require revenue of about USD 45/MWh, lower than that required for a natural-gas-fired power plant. In Texas, 12 percent of in-state energy production comes from wind energy, powering an estimated 4.1 million homes (Q3 2016).22 California and New York plan to reduce GHG emissions to 40 percent below 1990 levels by 2030, and Hawaii is targeting 100 percent renewable energy by 2045. Other states are following with ambitious GHG emissions reduction goals. With natural gas cheaper than coal (per MWh), it is very unlikely that coal can make a come-back in the US.
These developments set the tone for future investments. Carbon is a meaningful “currency” to identify this rapidly growing opportunity set. No longer a fringe issue, carbon can also help investors minimize risks associated with emerging regulations around to global that aim to reduce carbon emissions. These strategies can generate strong returns, alleviate climate change and save human lives.

14
For institutional client use only.
Endnotes
1 The Agreement entered into force on November 4, 2016.
2 World Bank Group, “State and Trends of Carbon Pricing,” Washington DC, October 2016.
3 A carbon tax is not a prerequisite for investors to be cognizant of carbon emissions. Although it would directly impact their financial statements, understanding the carbon intensity of a company relative to their peers as a gauge for efficiency can be material information used in the investment decision making process.
4 Greenhouse Gas (GHG) Protocol was developed by the World Resources Institute (WRI) and the World Business Council on Sustainable Development (WBCSD) in 1998, and sets the global standard for how to measure, manage, and report greenhouse gas emissions.
5 Eun-Hee Kim & Thomas P. Lyon, “ Greenwash vs. Brownwash: Exaggeration and Undue Modesty in Corporate Sustainability Disclosure,” Organization Science, Articles in Advance, pp. 1–19, 2014.
6 Matisoff, D. C., Noonan, D. S., & O’Brien, J. J. (2013). Convergence in Environmental Reporting: Assessing the Carbon Disclosure Project. Business Strategy and the Environment, 22(5), 285–305
7 ibid
8 Dinah Koehler and Bruno Bertocci, “Stranded Assets: what lies beneath,” UBS Asset Management, 2016.
9 The carbon levels and related characteristics attributed to the representative portfolio reflect the estimated carbon footprint of an actual Global Sustainable Equity client portfolio managed by UBS AM. For illustrative purposes only.
10 A good summary of carbon footprinting: Ken Frankel, Manish Shakdwipee, and Laura Nishikawa, “Carbon Footprinting 101, A Practical Guide to Understanding and Applying Carbon Metrics,” MSCI, September 2015.
11 https://www.theguardian.com/world/2016/dec/21/smog-refugees-flee-chinese-cities-as-airpocalypse-blights-half-a-billion
12 https://www.theguardian.com/cities/2014/dec/16/beijing-airpocalypse-city-almost- uninhabitable-pollution-china
13 http://journals.plos.org/plosone/article?id=10.1371/journal.pone.0135749; http://www.nature.com/nature/journal/v525/n7569/full/nature15371.html; https://www.thestar.com/news/world/2017/01/19/beijing-spending-27-billion-to-clean-up-air-pollution.html; https://www.thestar.com/news/world/2015/12/07/beijing-braces-for-more-than-3-days-of-severe-smog-in-first-red-alert.html
14 https://mobile.nytimes.com/2017/02/14/world/asia/indias-air-pollution-rivals- china-as-worlds-deadliest.html?emc=edit_th_20170214&nl=todaysheadlines& nlid=49249494&_r=0&referer; https://www.stateofglobalair.org/data
15 https://www.theguardian.com/environment/2017/feb/09/new-energy-europe- renewable-sources-2016
16 https://www.greentechmedia.com/articles/read/us-solar-market-grows-95-in-2016-smashes-records
17 https://energy.gov/downloads/2017-us-energy-and-employment-report
18 http://www.publicfinanceinternational.org/news/2016/03/china-worlds-largest- investor-renewable-energy
19 https://about.bnef.com/blog/liebreich-year-hectic-change-off-target-predictions/
20 http://www.forbes.com/sites/morganstanley/2016/11/23/why-clean-energy-can- withstand-changing-political-winds/; emphasis added
21 https://energy.gov/eere/downloads/revolution-now-future-arrives-five-clean-energy- technologies-2015-update; https://news.utexas.edu/2016/12/08/natural-gas-and-wind-are-the-lowest-cost-for-much-of-us
22 http://www.awea.org/resources/statefactsheets.aspx?itemnumber=890&navItem Number=5067

15
For institutional client use only.
AmericasThe views expressed are a general guide to the views of UBS Asset Manage-ment as of April 2017. The information contained herein should not be considered a recommendation to purchase or sell securities or any particular strategy or fund. Commentary is at a macro level and is not with reference to any investment strategy, product or fund offered by UBS Asset Management. The information contained herein does not constitute investment research, has not been prepared in line with the requirements of any jurisdiction designed to promote the independence of investment research and is not subject to any prohibition on dealing ahead of the dissemination of investment research. The information and opinions contained in this document have been compiled or arrived at based upon information obtained from sources believed to be reliable and in good faith. All such information and opinions are subject to change without notice. Care has been taken to ensure its accuracy but no responsibility is accepted for any errors or omissions herein. A number of the comments in this document are based on current expectations and are considered “forward-looking statements.” Actual future results, however, may prove to be different from expectations. The opinions expressed are a reflection of UBS Asset Management’s best judgment at the time this document was compiled, and any obligation to update or alter forward-looking statements as a result of new information, future events or otherwise is disclaimed. Furthermore, these views are not intended to predict or guarantee the future performance of any individual security, asset class or market generally, nor are they intended to predict the future performance of any UBS Asset Management account, portfolio or fund.
EMEAThe information and opinions contained in this document have been compiled or arrived at based upon information obtained from sources believed to be reliable and in good faith, but is not guaranteed as being accurate, nor is it a complete statement or summary of the securities, markets or developments referred to in the document. UBS AG and / or other members of the UBS Group may have a position in and may make a purchase and / or sale of any of the securities or other financial instruments mentioned in this document.
Before investing in a product please read the latest prospectus carefully and thoroughly. Units of UBS funds mentioned herein may not be eligible for sale in all jurisdictions or to certain categories of investors and may not be offered, sold or delivered in the United States. The information mentioned herein is not intended to be construed as a solicitation or an offer to buy or sell any securities or related financial instruments. Past performance is not a reliable indicator of future results. The performance shown does not take account of any commissions and costs charged when subscribing to and redeeming units. Commissions and costs have a negative impact on performance. If the currency of a financial product or financial service is different from your reference currency, the return can increase or decrease as a result of currency fluctuations. This information pays no regard to the specific or future investment objectives, financial or tax situation or particular needs of any specific recipient.
The details and opinions contained in this document are provided by UBS without any guarantee or warranty and are for the recipient’s personal use and information purposes only. This document may not be reproduced, redistributed or republished for any purpose without the written permission of UBS AG.
This document contains statements that constitute “forward-looking statements”, including, but not limited to, statements relating to our future business development. While these forward-looking statements represent our judgments and future expectations concerning the development of our business, a number of risks, uncertainties and other important factors could cause actual developments and results to differ materially from our expectations.
UKIssued in the UK by UBS Asset Management (UK) Ltd. Authorised and regulated by the Financial Conduct Authority.
APACThis document and its contents have not been reviewed by, delivered to or registered with any regulatory or other relevant authority in APAC. This document is for informational purposes and should not be construed as an offer or invitation to the public, direct or indirect, to buy or sell securities. This document is intended for limited distribution and only to the extent permitted under applicable laws in your jurisdiction. No representations are made with respect to the eligibility of any recipients of this document to acquire interests in securities under the laws of your jurisdiction.
Using, copying, redistributing or republishing any part of this document without prior written permission from UBS Asset Management is prohibited. Any statements made regarding investment performance objectives, risk and/or return targets shall not constitute a representation or warranty that such objectives or expectations will be achieved or risks are fully disclosed. The information and opinions contained in this document is based upon information obtained from sources believed to be reliable and in good faith but no responsibility is accepted for any misrepresentation, errors or omissions. All such information and opinions are subject to change without notice. A number of comments in this document are based on current expectations and are considered “forward-looking statements”. Actual future results may prove to be different from expectations and any unforeseen risk or event may arise in the future. The opinions expressed are a reflection of UBS Asset Management’s judgment at the time this document is compiled and any obligation to update or alter forward-looking statements as a result of new information, future events, or otherwise is disclaimed.
You are advised to exercise caution in relation to this document. The information in this document does not constitute advice and does not take into consideration your investment objectives, legal, financial or tax situation or particular needs in any other respect. Investors should be aware that past performance of investment is not necessarily indicative of future perfor-mance. Potential for profit is accompanied by possibility of loss. If you are in any doubt about any of the contents of this document, you should obtain independent professional advice.
Australia This document is provided by UBS Asset Management (Australia) Ltd, ABN 31 003 146 290 and AFS License No. 222605.
China The securities may not be offered or sold directly or indirectly in the People’s Republic of China (the “PRC”). Neither this document or information contained or incorporated by reference herein relating to the securities, which have not been and will not be submitted to or approved/verified by or registered with the China Securities Regulatory Commission (“CSRC”) or other relevant governmental authorities in the PRC pursuant to relevant laws and regulations, may be supplied to the public in the PRC or used in connection with any offer for the subscription or sale of the Securities in the PRC. The securities may only be offered or sold to the PRC investors that are authorized to engage in the purchase of Securities of the type being offered or sold. PRC investors are responsible for obtaining all relevant government regulatory approvals/licenses, verification and/or registrations themselves, including, but not limited to, any which may be required from the CSRC, the State Administration of Foreign Exchange and/or the China Banking Regulatory Commission, and complying with all relevant PRC regulations, including, but not limited to, all relevant foreign exchange regulations and/or foreign investment regulations.
Hong Kong This document and its contents have not been reviewed by any regulatory authority in Hong Kong. No person may issue any invitation, advertisement or other document relating to the Interests whether in Hong Kong or elsewhere, which is directed at, or the contents of which are likely to be accessed or read by, the public in Hong Kong (except if permitted to do so under the securities laws of Hong Kong) other than with respect to the Interests which are or are intended to be disposed of only to persons outside Hong Kong or only to “professional investors” within the meaning of the Securities and Futures Ordinance (Cap. 571) and the Securities and Futures (Professional Investor) Rules made thereunder.

© UBS 2017. The key symbol and UBS are among the registered and unregistered trademarks of UBS. All rights reserved.17-0173 4/17ubs.com/am
JapanThis document is for informational purposes only and is not intended as an offer or a solicitation to buy or sell any specific financial products, or to provide any investment advisory/management services.
KoreaThe securities may not be offered, sold and delivered directly or indirectly, or offered or sold to any person for re-offering or resale, directly or indirectly, in Korea or to any resident of Korea except pursuant to the applicable laws and regulations of Korea, including the Capital Market and Financial Investment Business Act and the Foreign Exchange Transaction Law of Korea, the presidential decrees and regulations thereunder and any other applicable laws, regulations or rules of Korea. UBS Asset Management has not been registered with the Financial Services Commission of Korea for a public offering in Korea nor has it been registered with the Financial Services Commission for distribution to non-qualified investors in Korea.
Malaysia This document is sent to you, at your request, merely for information purposes only. No invitation or offer to subscribe or purchase securities is made by UBS Asset Management as the prior approval of the Securities Commission of Malaysia or other regulatory authorities of Malaysia have not been obtained. No prospectus has or will be filed or registered with the Securities Commission of Malaysia.
SingaporeThis document has not been registered with the Monetary Authority of Singapore pursuant to the exemption under Section 304 of the SFA. Accordingly, this document may not be circulated or distributed, nor
may the Securities be offered or sold, whether directly or indirectly, to any person in Singapore other than (i) to an institutional investor pursuant to Section 304 of the SFA.
TaiwanThis document and its contents have not been reviewed by, delivered to or registered with any regulatory or other relevant authority in the Republic of China (R.O.C.). This document is for informational purposes and should not be construed as an offer or invitation to the public, direct or indirect, to buy or sell securities. This document is intended for limited distribution and only to the extent permitted under applicable laws in the Republic of China (R.O.C.). No representations are made with respect to the eligibility of any recipients of this document to acquire interests in securities under the laws of the Republic of China (R.O.C.).
Source for all data and charts (if not indicated otherwise): UBS Asset Management