Embed Size (px)
Citation preview

REICHSTETTER, M., and CHANSON, H. (2013). "Unsteady Turbulent Properties in Negative Waves in Open Channels." European Journal of Mechanics B/Fluids, Vol. 37, pp. 1-9 & 2 video movies (DOI: 10.1016/j.euromechflu.2012.07.003) (ISSN 0997-7546).
Page 1
UNSTEADY TURBULENT PROPERTIES IN NEGATIVE WAVES IN OPEN CHANNELS
by Martina Reichstetter (1) and Hubert Chanson (1)
(1) The University of Queensland, School of Civil Engineering, Brisbane QLD 4072, Australia.
Corresponding author:
Hubert Chanson, Professor
School of Civil Engineering, The University of Queensland
Brisbane QLD 4072, Australia
Fax: (61 7) 33 65 45 99 Email: [email protected]
Abstract:
In an open channel, a sudden drop in free-surface elevation is associated with the development of a negative wave.
While some simple analytical solution is widely described in textbooks, little research was conducted to date on the
unsteady turbulence properties beneath negative waves. A series of new physical experiments were conducted in a
rectangular channel. The unsteady free-surface profile and turbulence characteristics were measured in a negative wave
propagating upstream against an initially steady flow using non-intrusive acoustic displacement meters, video imagery
and acoustic Doppler velocimetry (ADV). For one set of flow conditions, the experiments were repeated 25 times at
two longitudinal locations and four vertical elevations to yield ensemble-averaged data. The wave leading edge
propagated upstream with a speed which was a function of with time and space. The velocity data showed that the
upstream propagation of the negative wave was linked with a gentle drop in water elevation associated with an
acceleration of the flow, while some increased turbulence occurred beneath the wave associated with large velocity
fluctuations and large Reynolds stress components. The velocity fluctuations and turbulent stresses were significantly
larger than in the initially steady flow and in the final flow motion.
Keywords: Negative waves, Open channel flows, Turbulent velocity measurements, Acoustic Doppler velocimetry,
Ensemble-average, Unsteady turbulence.

REICHSTETTER, M., and CHANSON, H. (2013). "Unsteady Turbulent Properties in Negative Waves in Open Channels." European Journal of Mechanics B/Fluids, Vol. 37, pp. 1-9 & 2 video movies (DOI: 10.1016/j.euromechflu.2012.07.003) (ISSN 0997-7546).
Page 2
1. INTRODUCTION
In an open channel, a sudden increase in water depth is called a positive surge or bore which is a major flow
discontinuity characterised by a steep front with intense mixing beneath. On the other hand, a sudden decrease in water
depth, called a negative wave or surge, is characterised by a gentle change in free-surface elevation (Fig. 1). It may
occur upstream of an opening gate, as well as downstream of a closing gate (Henderson 1966, Liggett 1994). The
generation of a negative surge is of particular relevance to the hydropower industry, when a sudden increase in water
demand may induce a drawdown in the hydropower (forebay) canal. The maximum available discharge Qmax is set by
the open channel hydraulic conditions (Montes 1998, Chanson 2004). For a rectangular channel of width B, it yields:
Bdg27
8Q 2/3
omax (1)
where do is the initial flow depth in the forebay canal.
A simple solution of the negative wave is commonly treated in fluid mechanics and hydraulics textbooks (Henderson
1966, Lighthill 1978, Liggett 1994). Although a classical data set was the seminal study of Favre (1935), little research
was conducted to date on the unsteady turbulence properties beneath negative waves despite the practical relevance, for
example to canal and reservoir desilting during drawdown. The present study investigates physically the unsteady flow
properties of negative waves under controlled flow conditions. It is the aim of this work to characterise the unsteady
open channel flow motion including free-surface properties and velocity field in negative wave and surges
2. PHYSICAL MODELLING AND EXPERIMENTAL PROCEDURES
2.1 Presentation
The physical studies of negative surges and waves are performed with geometrically similar models, and the modelling
requires the selection of the relevant similitude. For the simple case of a negative surge propagating in a rectangular,
horizontal channel after a sudden and complete gate opening, a dimensional analysis yields:
zyx V,V,V,d = ...,,,g,B,,V,d,t,z,y,xF oo1 (2)
where d is the flow depth, Vx, Vy, Vz are respectively the longitudinal, transverse and vertical velocity components at a
location (x, y, z), x is the coordinate in the flow direction, y is the horizontal transverse coordinate measured from the
channel centreline, z is the vertical coordinate measured from channel bed, t is the time, do and Vo are the initial flow
depth and velocity respectively, is the initial boundary layer thickness at x, B is the channel width, g is the gravity
acceleration, and are the water density and dynamic viscosity respectively, and is the surface tension between air
REICHSTETTER, M., and CHANSON, H. (2013). "Unsteady Turbulent Properties in Negative Waves in Open Channels." European Journal of Mechanics B/Fluids, Vol. 37, pp. 1-9 & 2 video movies (DOI: 10.1016/j.euromechflu.2012.07.003) (ISSN 0997-7546).
Page 3
and water. Equation (2) expresses the unsteady flow properties (left handside terms) at a point in space (x, y, z) and
time t as functions of the initial flow conditions, channel geometry and fluid properties.
Some basic considerations show that the relevant characteristic length and velocity scales are respectively the initial
flow depth do and velocity Vo. Equation (2) may be rewritten in dimensionless terms:
o
z
o
y
o
x
o V
V,
V
V,
V
V,
d
d =
,...g
,d
B,
d,
dV,
gd
V,
d
gt,
d
z,
d
y,
d
xF
3
4
oo
oo
o
o
oooo2 (3)
In Equation (3) right handside, the fifth and sixth terms are the Froude and Reynolds numbers respectively, and the
ninth term is the Morton number.
In a geometrically similar model, a true dynamic similarity is achieved only if each dimensionless parameter has the
same value in both model and prototype. Scale effects may exist when one or more -terms have different values
between the model and prototype. In free-surface flows including negative waves, the gravity effects are important and
a Froude similitude is commonly used (Henderson 1966, Chanson 1999). This is also the case in the present study.
2.2 Experimental facility
The experiments were performed in a 12 m long, 0.5 m wide horizontal flume made of smooth PVC bed and glass
sidewalls. The water was supplied by a constant head tank feeding a large intake chamber with a smooth convergent
into the 12 m long glass-walled channel. A fast-opening gate was located at the channel downstream end x = 11.15 m
where x is the longitudinal distance from the channel upstream end (Fig. 1). The tainter gate was identical to that used
by Koch and Chanson (2009). The water discharge was measured with two orifice meters which were calibrated on site
using a volume per time technique. The percentage of error was less than 2%. In steady flows, the water depths were
measured using rail mounted pointer gauges. The unsteady water depth was measured using a series of acoustic
displacement meters MicrosonicTM Mic+25/ IU/TC. The data accuracy and response of the acoustic displacement
meters were 0.18 mm and 50 ms respectively. The displacement meters were located at x = 5.6, 6.0, 6.2, 10.2, 10.5,
10.8 m. Additional observations were performed using a digital video camera PanasonicTM NV-GS300 (25 fps) and a
dSLR camera PentaxTM K-7.
Further informations on the experimental facility and instrumentation as well as the full data set reported in Reichstetter
and Chanson (2011).

REICHSTETTER, M., and CHANSON, H. (2013). "Unsteady Turbulent Properties in Negative Waves in Open Channels." European Journal of Mechanics B/Fluids, Vol. 37, pp. 1-9 & 2 video movies (DOI: 10.1016/j.euromechflu.2012.07.003) (ISSN 0997-7546).
Page 4
2.3 Acoustic Doppler velocimetry and data post processing
The turbulent velocity components were measured using an acoustic Doppler velocimeter (ADV) NortekTM Vectrino+
(Serial No. VNO 0436) equipped with a side-looking head. The velocity rate was set to 1.0 m/s and the sampling rate
was 200 Hz for all the experiments with a data accuracy of 0.01 m/s. The translation of the ADV probe in the vertical
direction was controlled by a fine adjustment travelling mechanism connected to a MitutoyoTM digimatic scale unit with
an error less than 0.1 mm. Herein all the measurements were taken on the channel centreline, and the ADV and
displacement sensors were synchronised and sampled simultaneously at 200 Hz.
In a turbulent flow, the instantaneous velocity V is typically decomposed into an average component V and a turbulent
fluctuation v: V = V + v. In an unsteady flow, the long-term trend and the short-term turbulent fluctuations must be
processed separately (Bradshaw 1971). A technique consists in the repetition of the same experiment for N times, and
V is the ensemble-average. In the present study, a series of twenty five instantaneous velocity records were repeated at
four vertical elevations (z/do = 0.03, 0.11, 0.56 and 0.61) in a manner such that the initial flow conditions were
perfectly identical for each run, where z is the vertical elevation and do the initial flow depth. An ensemble-median of
each instantaneous velocity component was produced for each vertical elevation.
The ADV unit was mounted at x = 6 or 10.5 m. For the two upper locations (z/do = 0.56 and 0.61), the sampling was
stopped when the ADV head became out of water.
2.4 Experimental flow conditions and negative wave generation
A series of experiments were performed with an initially steady flow rate Q = 0.020 & 0.030 m3/s and a range of
undershoot gate height before fast-opening h = 0.030 to 0.050 m (Table 1, Series 1). The turbulent velocity
measurements were conducted for Q = 0.020 m3/s and h = 0.030 m with an initial water depth do = 0.24 m at x = 6 m
(Table 1, Series 2).
For each experimental run, the steady gradually-varied flow conditions were established prior to the first
measurements. The negative surge was produced by opening rapidly the tainter gate: the opening time was less than
0.15 to 0.2 s. Such an opening time was small enough to have a negligible effect on the surge propagation as shown by
Lauber (1997).
Prior to gate opening, the free-surface was controlled by the flow conditions around the tainter gate. The initial free-
surface profile is shown in Figure 2 for Q = 0.020 m3/s. After gate opening, the final free-surface shape (recorded 5
minutes after opening) was controlled by the overfall at the channel downstream end where critical flow conditions

REICHSTETTER, M., and CHANSON, H. (2013). "Unsteady Turbulent Properties in Negative Waves in Open Channels." European Journal of Mechanics B/Fluids, Vol. 37, pp. 1-9 & 2 video movies (DOI: 10.1016/j.euromechflu.2012.07.003) (ISSN 0997-7546).
Page 5
took place. The final free-surface profiles are reported in Figure 2, where the data are compared with the numerical
integration of the backwater equation.
The backwater equation is a differential form of the energy equation which yields for a steady open channel flow:
2fo
Fr1
SS
x
d
(3)
where So is the bed slope (herein So = 0), Sf is the friction slope (Sf = f V2/(2 g DH)), f is the Darcy-Weisbach friction
factor, DH is the hydraulic diameter (DH = 4A/Pw) with A the flow cross-section area and Pw the wetted perimeter, and
Fr is the Froude number (Henderson 1966, Montes 1998, Chanson 2004).
3. BASIC OBSERVATIONS
3.1 Presentation
The visual observations as well as the free surface measurements at the gate showed a steep drop of the water surface
next to the gate (e.g. 10 < x < 11.15 m) immediately after the gate opening (Fig. 3 & Appendix I). Figure 3 presents a
series of instantaneous free-surface profiles next to the gate (10.48 < x < 11.2 m, Fig. 3A) and further upstream (5.8 < x
< 6.3 m, Fig. 3B) recorded with the video camera. In Figure 3, do is the initial flow depth at x = 6 m, x' and x" are
positive upstream, and the data were recorded at 25 fps. Some supplementary video data are listed in Appendix I. In
both Figure 3 and the video data, the initially steady discharge flowed from right to left, and the negative surge
propagated from left to right.
The observations highlighted the rapid gate opening and wave formation (Fig. 3A & movie
[23_03_2010_1_short.AVI]), although the disturbance vanished very rapidly, within one second. The instantaneous
free-surface exhibited a smooth shape further upstream as seen in Figure 3B and in the movie [2010-05-05 13.41.43
ns5.a_very_short. AVI]. During the upstream wave propagation, the free-surface was very flat and smooth, and the
visual observations illustrated the gradual lowering of the water surface during the upstream propagation of the
negative surge (movie [2010-05-05 13.41.43 ns5.a_very_short. AVI]). Except next to the gate shortly after opening, the
upstream propagation of the negative wave was barely perceptible, as illustrated in the movie [2010-05-05 13.41.43
ns5.a_very_short. AVI].
The celerity of the negative wave leading edge was recorded using a combination of photographic, video and acoustic
displacement meter data. Figure 4 presents a typical data set, where x' is the upstream distance from gate. The data
showed two distinct trends. Immediately after the gate closure, the negative wave formed rapidly and the celerity of its
REICHSTETTER, M., and CHANSON, H. (2013). "Unsteady Turbulent Properties in Negative Waves in Open Channels." European Journal of Mechanics B/Fluids, Vol. 37, pp. 1-9 & 2 video movies (DOI: 10.1016/j.euromechflu.2012.07.003) (ISSN 0997-7546).
Page 6
leading edge increased with time up to x'/do = 4. This acceleration phase was associated by some strong flow
disturbance as seen in the movie [23_03_2010_1_short.AVI]. Further upstream (x'/do > 4), the negative wave
propagated in a more gradual, gentle manner during which its leading edge was very flat and barely perceptible. The
wave celerity decreased slowly with increasing distance from the gate as illustrated in Figure 4.
3.2 Instantaneous free-surface and velocity measurements
During the negative wave, the water depth decreased relatively gradually after the initial surge formation. The free
surface measurements showed some surface curvature near the surge leading edge. The longitudinal velocity
component increased at the same time as the water depth decreased. Typical results are presented in Figures 5, 6 and 7.
Figure 5 presents some free-surface measurements at x = 6 and 10.5 m; both the ensemble-median, the difference
between maximum and minimum water depths (dmax-dmin) and the difference between the 3rd and 1st quartiles (d75-d25)
are presented. Figures 6 and 7 show some velocity measurements at x = 10.5 m and x = 6 m respectively. Each graph
includes the ensemble-median water depth, the median velocity components and difference between the 3rd and 1st
quartiles (V75-V25).
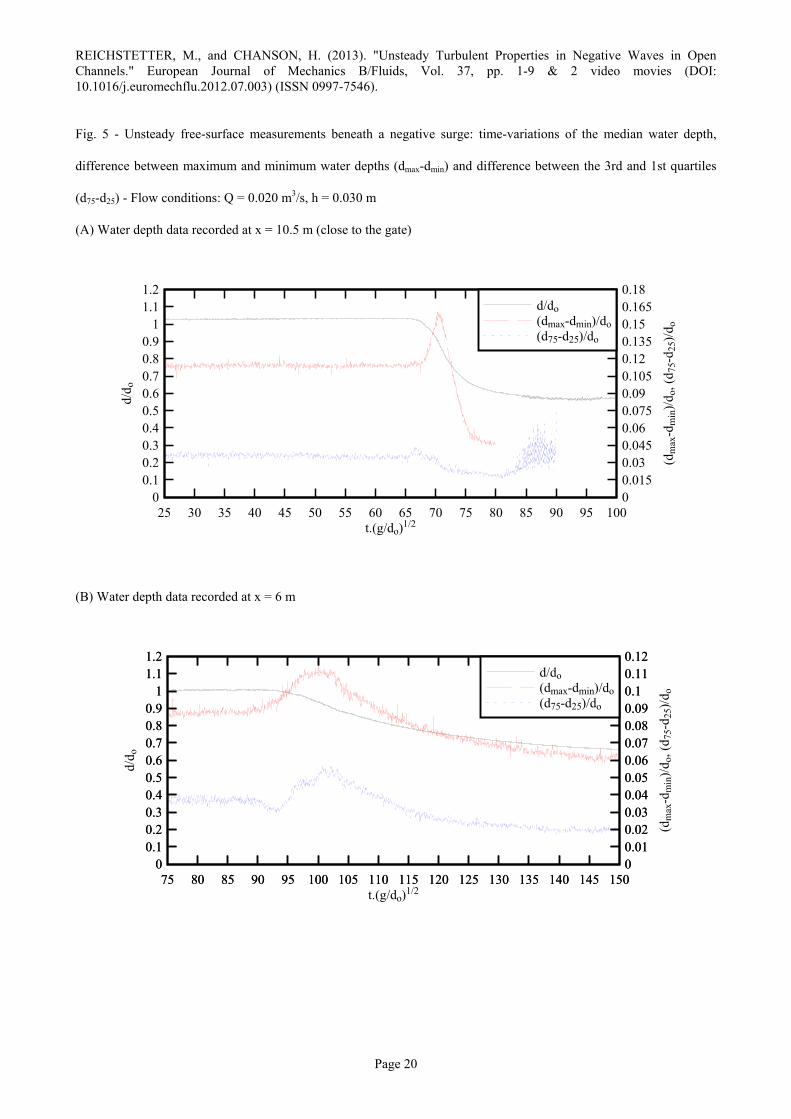
The free-surface data highlighted the gentle free-surface profile at the leading edge of the negative wave (Fig. 5). Some
large fluctuations in free-surface elevations were observed briefly behind the negative wave leading edge: e.g., for
t(g/do)1/2 = 70 to 75 and 95 to 105 in Figures 5A and 5B respectively. The free-surface curvature and slope were larger
close to the gate (x = 10.5 m) than further upstream (x = 6 m) (Fig. 5). Based upon the maximum free-surface curvature
observations at the wave leading edge, the vertical pressure distributions were calculated using a solution of the
Boussinesq equation (Montes and Chanson 1998) and summarised in Table 2. Table 2 includes the radius of curvature
of free-surface and deviation from hydrostatic pressure where the free-surface curvature is maximum (Table 2, columns
6 & 7). The results implied that the smallest radius of curvature was large: |(Rs)min| = 7 m and 49 m at 0.65 and 5.15 m
upstream of the gate respectively (i.e. x = 10.5 & 6 m). Simply the pressure distributions at the leading edge were
quasi-hydrostatic within the approximations of the theoretical model.
The unsteady velocity measurements were performed at four vertical elevations: z/do = 0.027, 0.104, 0.516 and 0.563.
The results highlighted a number of basic features throughout the water column beneath the negative surge. The
longitudinal velocity measurements showed an acceleration of the flow during the drawdown of the free-surface (Fig. 6
& 7). This was associated with some increase in all velocity component fluctuations, compared to the steady state and
to the final flow conditions (not shown herein). For example, for t(g/do)1/2 = 65 to 75 and 90 to 120 in Figures 6 and 7

REICHSTETTER, M., and CHANSON, H. (2013). "Unsteady Turbulent Properties in Negative Waves in Open Channels." European Journal of Mechanics B/Fluids, Vol. 37, pp. 1-9 & 2 video movies (DOI: 10.1016/j.euromechflu.2012.07.003) (ISSN 0997-7546).
Page 7
respectively. Figures 6 and 7 show the time-variations of the instantaneous velocity components for the same run
(Series 2, Table 1) at two different longitudinal locations: i.e., x = 10.5 m close to the gate (Fig. 6) and x = 6 m (Fig. 7).
The magnitude of the difference between 3rd and 1st quartiles (V75-V25) was about similar at both locations (x = 6 &
10.5 m) as illustrated in Figures 6 and 7 drawn with the same horizontal and vertical scales.
The transverse velocity component Vy showed quantitatively lesser fluctuations before, during and after surge
formation than in the horizontal and vertical directions. Close to the free-surface (e.g. z/do = 0.62), the vertical velocity
component was negative on average and its magnitude was comparable to the maximum vertical velocity of the free-
surface: that is, (d/z)max/Vo = -1.7 and -0.25 at x = 10.5 and 6 m respectively.
Overall the present data indicated that the negative wave flow was an unsteady three-dimensional turbulent process.
5. UNSTEADY TURBULENT SHEAR STRESSES
5.1 Presentation
A series of twenty five instantaneous free-surface and velocity records were repeated, and the data were synchronised.
The ensemble average (EA) technique was applied and the turbulent velocity fluctuation v was calculated as:
VVv (4)
where V is the instantaneous velocity and V is the ensemble median.
In a turbulent flow, the flux of x-momentum in the y-direction induces a shear stress term in the x-direction: i.e., the
turbulent stress vxvy. The turbulent stress tensor is a transport effect resulting from turbulent motion induced by
velocity fluctuations with the subsequent increase of momentum exchange and of mixing (Piquet 1999). In the present
study, the turbulent shear stresses were calculated based upon an ensemble-median technique (median value of 25 runs)
as Chanson and Docherty (2012). Some typical results are presented in Figure 8.
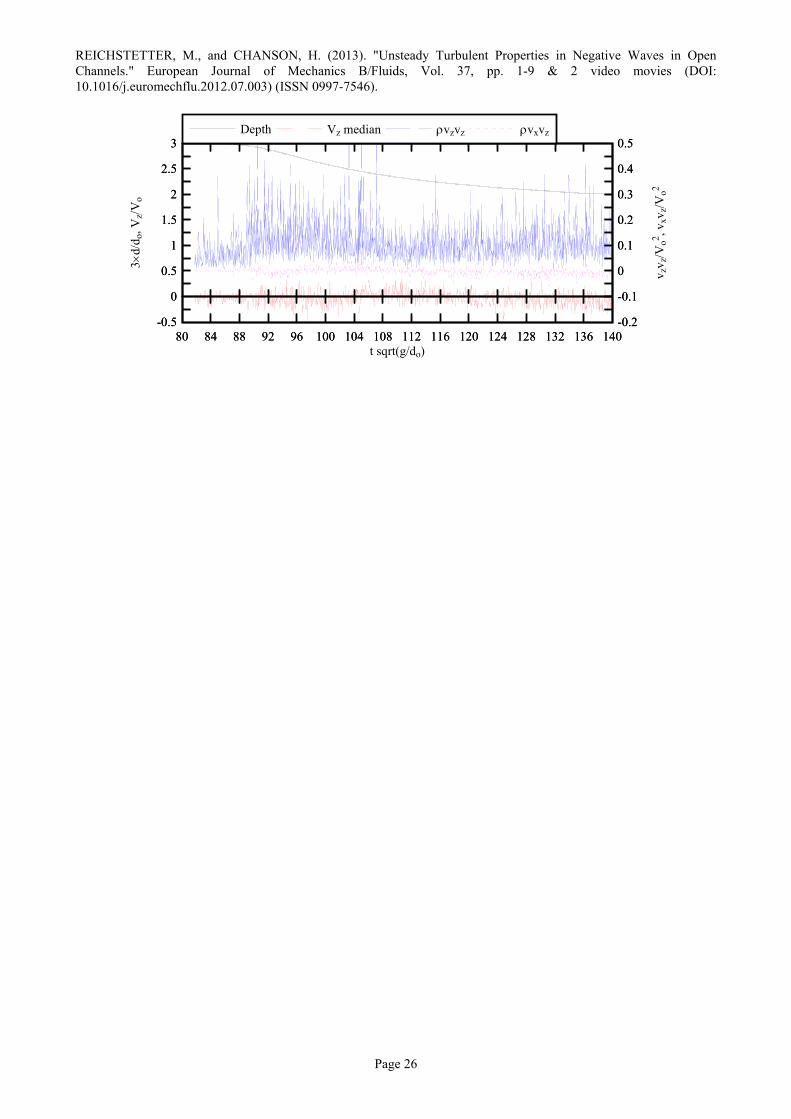
The experimental results showed a number of basic properties. Overall the turbulent stress data indicated that the
passage of a negative surge was associated with large turbulent stresses and turbulent stress fluctuations at all vertical
elevations. That is, the magnitude of turbulent Reynolds stress components was significantly larger than in the initially
steady flow and than in the final flow after the passage of the wave. This was observed with all Reynolds stress
components at both x = 6 and 10.5 m. Although the boundary shear stress in an accelerating flow is lower than that in a
steady flow for the same velocity and depth (Johnson 1991, He et al. 2011), the present data highlighted large
fluctuations of all velocity components as well as large turbulent stress components in the accelerating flow beneath the

REICHSTETTER, M., and CHANSON, H. (2013). "Unsteady Turbulent Properties in Negative Waves in Open Channels." European Journal of Mechanics B/Fluids, Vol. 37, pp. 1-9 & 2 video movies (DOI: 10.1016/j.euromechflu.2012.07.003) (ISSN 0997-7546).
Page 8
negative wave (Fig. 8). The unsteady Reynolds stress components were significantly larger in the initially steady and
final flow motions. The results implied that negative surges have some potential to induce some significant turbulent
mixing and to scour natural beds.
5.2 Discussion
Some large magnitude and rapid fluctuations of turbulent Reynolds stresses were observed at all vertical elevations. For
a non-cohesive sediment material, the Shields diagram gives a critical shear stress for sediment bed load motion about
(τo)c = 0.1 to 0.5 Pa for fine sand particles with sizes between 0.1 and 1 mm (Graf 1971, Julien 1995). Herein the
instantaneous turbulent shear stress magnitudes ranged up to more than 5 Pa (i.e. v2/Vo2 > 0.18). The Reynolds stress
levels were an order of magnitude larger than the critical threshold for sediment motion and transport. For the same fine
sand particles with sizes between 0.1 and 1 mm, the ratio of shear velocity to particle fall velocity V*/wo ranged from 5
down to 0.5 and may be compared with the threshold for onset of sediment suspension: (V*/wo)c > 0.2 to 2 (van Rijn
1984, Chanson 1999). The present data implied that the negative surge motion could scour relatively fine sediment
particles and advect these in suspension during the drawdown process. This comparison has some limitations however.
The validity of the Shields diagram, critical shear stress estimate and suspension threshold is debatable in a rapidly-
varied flow such as a negative wave.
6. CONCLUSION
The unsteady turbulence beneath a negative wave was investigated physically in a series of new experiments conducted
in a large rectangular channel with high temporal and spatial resolution. Both the unsteady free-surface profile and
turbulence characteristics were measured for a negative surge propagating upstream against an initially steady flow.
The velocity measurements were based upon acoustic Doppler velocimetry (ADV) sampled at (200 Hz), and the free-
surface elevations were recorded using non-intrusive acoustic displacement meters (ADM) and video imagery. For one
set of flow conditions, the experiments were repeated 25 times at two longitudinal locations and four vertical
elevations, and the results were ensemble-averaged.
The wave leading edge propagated upstream with a speed which was a function of with time and space. Immediately
after the gate opening, the surge leading edge accelerated and its speed increased with time for x' < 4do. Further
upstream, the negative wave propagated in a gentle with a very flat leading edge which was barely perceptible. The
velocity data showed that the upstream propagation of the negative wave was associated with an acceleration of the

REICHSTETTER, M., and CHANSON, H. (2013). "Unsteady Turbulent Properties in Negative Waves in Open Channels." European Journal of Mechanics B/Fluids, Vol. 37, pp. 1-9 & 2 video movies (DOI: 10.1016/j.euromechflu.2012.07.003) (ISSN 0997-7546).
Page 9
flow, while some increased turbulence occurred beneath the wave associated with large velocity fluctuations and large
Reynolds stress components. The velocity fluctuations and turbulent stresses were significantly larger than in the
initially steady flow and in the final flow motion.
The present results suggested that the negative wave remains a challenging topic and that the unsteady turbulence
properties are complicated.
7. ACKNOWLEDGMENTS
The authors acknowledge the technical assistance of Graham Illidge, Ahmed Ibrahim and Clive Booth (The University
of Queensland). The authors thank further Professor Fabian Bombardelli (University of California Davis), Dr Luke
Toombes (Aurecon, Australia), Professor John Fenton (Technical University Vienna) and Dr Pierre Lubin (University
of Bordeaux) for their helpful advice. The helpful comments of the reviewers are acknowledged. The financial support
of the Australian Research Council (Grants DP0878922 & DP120100481) is acknowledged.
10. APPENDIX A - SUPPLEMENTARY VIDEO DATA
Detailed experimental measurements were conducted in a negative wave propagating upstream against an initially
steady open channel flow. A series of short movies were further taken during the experiments using a digital video
camera PanasonicTM NV-GS300 (25 fps). The digital appendix includes two movie files (Table 3). The first movie
shows the generation of the negative wave resulting from the rapid gate opening and the following rapidly varied flow
motion. The second movie shows the upstream wave propagation about x = 6 m (i.e. about 5.15 m upstream of the
gate). The leading edge of the surge is barely perceptible. The list of the movies is detailed in Table 3, including the
filenames, file format, and a description of each video. In each movie, the initially steady flow direction is from right to
left while the negative wave propagates upstream from left to right.
9. REFERENCES
Bradshaw, P. (1971). "An Introduction to Turbulence and its Measurement." Pergamon Press, Oxford, UK, The
Commonwealth and International Library of Science and technology Engineering and Liberal Studies,
Thermodynamics and Fluid Mechanics Division, 218 pages.
Chanson, H. (1999). "The Hydraulics of Open Channel Flow: An Introduction." Edward Arnold, London, UK, 512
pages.

REICHSTETTER, M., and CHANSON, H. (2013). "Unsteady Turbulent Properties in Negative Waves in Open Channels." European Journal of Mechanics B/Fluids, Vol. 37, pp. 1-9 & 2 video movies (DOI: 10.1016/j.euromechflu.2012.07.003) (ISSN 0997-7546).
Page 10
Chanson, H. (2004). "The Hydraulics of Open Channel Flow: An Introduction." Butterworth-Heinemann, 2nd edition,
Oxford, UK, 630 pages.
Chanson, H., and Docherty, N.J. (2012). "Turbulent Velocity Measurements in Open Channel Bores." European
Journal of Mechanics B/Fluids, Vol. 32, pp. 52-58 (DOI 10.1016/j.euromechflu.2011.10.001).
Favre, H. (1935). "Etude Théorique et Expérimentale des Ondes de Translation dans les Canaux Découverts."
('Theoretical and Experimental Study of Travelling Surges in Open Channels.') Dunod, Paris, France (in French).
Graf, W.H. (1971). "Hydraulics of Sediment Transport". McGraw-Hill, New York, USA.
He, S., Ariyaratne, C., and Vardy, A.E. (2011). "Wall shear stress in accelerating turbulent pipe flow." Jl Fluid Mech.,
Vol. 685, pp. 440-460 (DOI: 10.1017/jfm.2011.328).
Henderson, F.M. (1966). "Open Channel Flow." MacMillan Company, New York, USA.
Johnson, T.V. (1991). "The Study of Unsteady Pipe Flow and Non-Uniform Channel Flow by the Use of Laser Doppler
Anemometry." Ph.D. thesis, Dept of Civil Engineering, The University of Queensland, Brisbane, Australia.
Julien, P.Y. (1995). "Erosion and Sedimentation." Cambridge University Press, Cambridge, UK, 280 pages.
Koch, C., and Chanson, H. (2009). "Turbulence Measurements in Positive Surges and Bores." Journal of Hydraulic
Research, IAHR, Vol. 47, No. 1, pp. 29-40 (DOI: 10.3826/jhr.2009.2954).
Lauber, G. (1997). "Experimente zur Talsperrenbruchwelle im glatten geneigten Rechteckkanal." ('Dam Break Wave
Experiments in Rectangular Channels.') Ph.D. thesis, VAW-ETH, Zürich, Switzerland (in German). (also
Mitteilungen der Versuchsanstalt fur Wasserbau, Hydrologie und Glaziologie, ETH-Zurich, Switzerland, No. 152).
Liggett, J.A. (1994). "Fluid Mechanics." McGraw-Hill, New York, USA.
Lighthill, J. (1978). "Waves in Fluids." Cambridge University Press, Cambridge, UK, 504 pages.
Montes, J.S. (1998). "Hydraulics of Open Channel Flow." ASCE Press, New-York, USA, 697 pages.
Montes, J.S., and Chanson, H. (1998). "Characteristics of Undular Hydraulic Jumps. Results and Calculations." Journal
of Hydraulic Engineering, ASCE, Vol. 124, No. 2, pp. 192-205.
Piquet, J. (1999). "Turbulent Flows. Models and Physics." Springer, Berlin, Germany, 761 pages.
Reichstetter, M., and Chanson, H. (2011). "Physical and Numerical Modelling of Negative Surges in Open Channels."
Hydraulic Model Report No. CH84/11, School of Civil Engineering, The University of Queensland, Brisbane,
Australia, 79 pages.
Rijn, L.C. van (1984). "Sediment transport, Part II: Suspended load transport." Journal of Hydraulic Engineering,
ASCE, Vol. 110, No. 11, pp. 1613–1641.
REICHSTETTER, M., and CHANSON, H. (2013). "Unsteady Turbulent Properties in Negative Waves in Open Channels." European Journal of Mechanics B/Fluids, Vol. 37, pp. 1-9 & 2 video movies (DOI: 10.1016/j.euromechflu.2012.07.003) (ISSN 0997-7546).
Page 11

REICHSTETTER, M., and CHANSON, H. (2013). "Unsteady Turbulent Properties in Negative Waves in Open Channels." European Journal of Mechanics B/Fluids, Vol. 37, pp. 1-9 & 2 video movies (DOI: 10.1016/j.euromechflu.2012.07.003) (ISSN 0997-7546).
Page 12
Table 1 - Physical investigation of negative surges: experimental flow conditions
Ref. Q h do U Instrumentation
(m3/s) (m) (m) (m/s) (1) (2) (3) (4) (5) (6)
Series 1 0.020 & 0.030
0.030 to 0.050
0.10 to 0.26
0.25 to 0.91
Video imagery.
Series 2 0.020 0.030 0.24 0.91 Acoustic displacement meters and ADV (z/do = 0.027, 0.104, 0.516, 0.563).
Notes: do: initial flow depth measured at x = 6 m; h: undershoot gate height before sudden opening; Q: initially steady
discharge; U: celerity of the negative surge measured at x = 6 m; x: longitudinal distance from the channel upstream
end; z: vertical elevation above the bed.
Table 2 - Maximum free-surface curvature at the leading surge of the negative surge
Q
(m3/s) h
(m) x
(m) (2d/t2)max
(m/s2) d/t (m/s)
(Rs)min (m)
g
z/P1 max
(1) (s) (3) (4) (5) (6) (7) 0.020 0.030 6.0 -0.017 -0.007 -48.6 (+) 6×10⁻⁵ (+)
10.5 -0.143 -0.066 -6.9 (+) 5.3×10⁻⁴ (+)
Notes: Rs: radius of curvature; (+): calculations based upon the Boussinesq equation solution of Montes & Chanson
(1998).
Table 3 - Video movies of negative waves propagating upstream in an open channel
Filename Format Description
23_03_2010_1_short.AVI AVI Negative wave generation by the rapid gate opening and upstream propagation next to the gate - Duration: 13 s. Run 20100323_1, Q= 0.020 m3/s, do = 0.24 m, So = 0.
2010-05-05 13.41.43 ns5.a_very_short. AVI AVI Negative wave propagating upstream about x = 6 m - Duration: 11 s. Run 20100505, Q= 0.020 m3/s, do = 0.24 m, So = 0.

REICHSTETTER, M., and CHANSON, H. (2013). "Unsteady Turbulent Properties in Negative Waves in Open Channels." European Journal of Mechanics B/Fluids, Vol. 37, pp. 1-9 & 2 video movies (DOI: 10.1016/j.euromechflu.2012.07.003) (ISSN 0997-7546).
Page 13
FIGURE CAPTION
Fig. 1 - Definition sketch of a negative wave propagating upstream in an open channel
Fig. 2 - Initial steady flow free-surface profile prior to negative surge and final free-surface profile after gate opening -
Flow conditions: Q = 0.020 m3/s, h = 0.030 m, steady flow direction from right to left - Comparison between physical
data (recorded with acoustic displacement meters) and backwater calculations
Fig. 3 - Instantaneous free-surface profiles during the negative wave generation and propagation - Initial flow
conditions: Q = 0.030 m3/s, h = 0.040 m, do = 0.26 m - Negative wave propagation from left to right - The legend
indicates the video frame number
(A) Immediately upstream of the gate (10.48 < x < 11.2 m)
(B) About x = 6 m (5.8 < x < 6.3 m)
Fig. 4 - Dimensionless celerity of the negative wave as a function of the longitudinal distance for Q = 0.020 m3/s, h =
0.030 m, do = 0.24 m - Error bars are included
Fig. 5 - Unsteady free-surface measurements beneath a negative surge: time-variations of the median water depth,
difference between maximum and minimum water depths (dmax-dmin) and difference between the 3rd and 1st quartiles
(d75-d25) - Flow conditions: Q = 0.020 m3/s, h = 0.030 m
(A) Water depth data recorded at x = 10.5 m (close to the gate)
(B) Water depth data recorded at x = 6 m
Fig. 6 - Free-surface and velocity data beneath a negative surge at x = 10.5 m (0.65 m upstream of gate): ensemble-
median water depth dmedian, median velocity components and difference between the 3rd and 1st quartiles (V75-V25) -
Flow conditions: Q = 0.020 m3/s, h = 0.030 m, x = 10.5 m - Data truncated when ADV unit was out of water
(A) Longitudinal velocity component Vx at z/do = 0.615
(B) Transverse velocity component Vy at z/do = 0.615
(C) Vertical velocity component Vz at z/do = 0.615

REICHSTETTER, M., and CHANSON, H. (2013). "Unsteady Turbulent Properties in Negative Waves in Open Channels." European Journal of Mechanics B/Fluids, Vol. 37, pp. 1-9 & 2 video movies (DOI: 10.1016/j.euromechflu.2012.07.003) (ISSN 0997-7546).
Page 14
Fig. 7 - Free-surface and velocity data beneath a negative surge at x = 6 m (5.15 m upstream of gate): ensemble-median
water depth dmedian, median velocity components and difference between the 3rd and 1st quartiles (V75-V25) - Flow
conditions: Q = 0.020 m3/s, h = 0.030 m, x = 6.0 m
(A) Longitudinal velocity component Vx at z/do = 0.563
(B) Transverse velocity component Vy at z/do = 0.563
(C) Vertical velocity component Vz at z/do = 0.563
Fig. 8 - Ensemble-median water depth dmedian and velocity components, and median turbulent Reynolds stress tensor
components beneath a negative surge at x = 6 m (5.15 m upstream of gate) and z/do = 0.030 - Flow conditions: Q =
0.020 m3/s, h = 0.030 m, x = 6.0 m, z = 0.0067 m, z/do = 0.030
(A) Reynolds stress tensor components vx2 and vxvy
(B) Reynolds stress tensor components vy2 and vyvz
(C) Reynolds stress tensor components vz2 and vxvz

REICHSTETTER, M., and CHANSON, H. (2013). "Unsteady Turbulent Properties in Negative Waves in Open Channels." European Journal of Mechanics B/Fluids, Vol. 37, pp. 1-9 & 2 video movies (DOI: 10.1016/j.euromechflu.2012.07.003) (ISSN 0997-7546).
Page 15
CAPTION FOR THE SUPPLEMENTARY MATERIAL
23_03_2010_1_short.AVI: Negative wave generation caused by by the rapid gate opening and its upstream
propagation in the vicinity of the gate (Duration: 13 s) - Run 20100323_1, Q= 0.020 m3/s, do = 0.24 m, So = 0
2010-05-05 13.41.43 ns5.a_very_short. AVI: Negative wave propagating upstream about x = 6 m (Duration: 11 s) -
Run 20100505, Q= 0.020 m3/s, do = 0.24 m, So = 0

REICHSTETTER, M., and CHANSON, H. (2013). "Unsteady Turbulent Properties in Negative Waves in Open Channels." European Journal of Mechanics B/Fluids, Vol. 37, pp. 1-9 & 2 video movies (DOI: 10.1016/j.euromechflu.2012.07.003) (ISSN 0997-7546).
Page 16
Fig. 1 - Definition sketch of a negative wave propagating upstream in an open channel

REICHSTETTER, M., and CHANSON, H. (2013). "Unsteady Turbulent Properties in Negative Waves in Open Channels." European Journal of Mechanics B/Fluids, Vol. 37, pp. 1-9 & 2 video movies (DOI: 10.1016/j.euromechflu.2012.07.003) (ISSN 0997-7546).
Page 17
Fig. 2 - Initial steady flow free-surface profile prior to negative surge and final free-surface profile after gate opening -
Flow conditions: Q = 0.020 m3/s, h = 0.030 m, steady flow direction from right to left - Comparison between physical
data (recorded with acoustic displacement meters) and backwater calculations
x (m)
d (m
)
11 10.5 10 9.5 9 8.5 8 7.5 7 6.5 6 5.5 50
0.025
0.05
0.075
0.1
0.125
0.15
0.175
0.2
0.225
0.25
Initial steady flow (data)Initial steady flow (backwater)Final flow (data)Final flow (backwater)

REICHSTETTER, M., and CHANSON, H. (2013). "Unsteady Turbulent Properties in Negative Waves in Open Channels." European Journal of Mechanics B/Fluids, Vol. 37, pp. 1-9 & 2 video movies (DOI: 10.1016/j.euromechflu.2012.07.003) (ISSN 0997-7546).
Page 18
Fig. 3 - Instantaneous free-surface profiles during the negative wave generation and propagation - Initial flow
conditions: Q = 0.030 m3/s, h = 0.040 m, do = 0.26 m - Negative wave propagation from left to right - The legend
indicates the video frame number
(A) Immediately upstream of the gate (10.48 < x < 11.2 m)
x'/do
d/d o
0 0.2 0.4 0.6 0.8 1 1.2 1.4 1.6 1.8 2 2.2 2.4 2.60
0.2
0.4
0.6
0.8
1
1.2
1.4
12
34
56
78
910
1112
1314
1516
1718
1920
2122
2324
2526
(B) About x = 6 m (5.8 < x < 6.3 m)
x"/do
d/d o
0 0.3 0.6 0.9 1.2 1.5 1.8 2.1 2.40.7
0.8
0.9
1
1.1
1 5 10 15 20 25 30 35 40 45 50

REICHSTETTER, M., and CHANSON, H. (2013). "Unsteady Turbulent Properties in Negative Waves in Open Channels." European Journal of Mechanics B/Fluids, Vol. 37, pp. 1-9 & 2 video movies (DOI: 10.1016/j.euromechflu.2012.07.003) (ISSN 0997-7546).
Page 19
Fig. 4 - Dimensionless celerity of the negative wave as a function of the longitudinal distance for Q = 0.020 m3/s, h =
0.030 m, do = 0.24 m - Error bars are included
x'/d0
(U+
Vo)
/(g
d o)1/
2
0 3 6 9 12 15 18 21 240
0.10.20.30.40.50.60.70.80.9
11.11.21.31.4
Displacement metersVideo dataPhotographic data
REICHSTETTER, M., and CHANSON, H. (2013). "Unsteady Turbulent Properties in Negative Waves in Open Channels." European Journal of Mechanics B/Fluids, Vol. 37, pp. 1-9 & 2 video movies (DOI: 10.1016/j.euromechflu.2012.07.003) (ISSN 0997-7546).
Page 20
Fig. 5 - Unsteady free-surface measurements beneath a negative surge: time-variations of the median water depth,
difference between maximum and minimum water depths (dmax-dmin) and difference between the 3rd and 1st quartiles
(d75-d25) - Flow conditions: Q = 0.020 m3/s, h = 0.030 m
(A) Water depth data recorded at x = 10.5 m (close to the gate)
t.(g/do)1/2
d/d o
(dm
ax-d
min
)/d o
, (d 7
5-d 2
5)/d
o
25 30 35 40 45 50 55 60 65 70 75 80 85 90 95 1000 0
0.1 0.0150.2 0.030.3 0.0450.4 0.060.5 0.0750.6 0.090.7 0.1050.8 0.120.9 0.135
1 0.151.1 0.1651.2 0.18
d/do(dmax-dmin)/do(d75-d25)/do
(B) Water depth data recorded at x = 6 m
t.(g/do)1/2
d/d o
(dm
ax-d
min
)/d o
, (d 7
5-d 2
5)/d
o
75 80 85 90 95 100 105 110 115 120 125 130 135 140 145 1500 0
0.1 0.010.2 0.020.3 0.030.4 0.040.5 0.050.6 0.060.7 0.070.8 0.080.9 0.09
1 0.11.1 0.111.2 0.12
75 80 85 90 95 100 105 110 115 120 125 130 135 140 145 1500 0
0.1 0.010.2 0.020.3 0.030.4 0.040.5 0.050.6 0.060.7 0.070.8 0.080.9 0.09
1 0.11.1 0.111.2 0.12
d/do(dmax-dmin)/do(d75-d25)/do

REICHSTETTER, M., and CHANSON, H. (2013). "Unsteady Turbulent Properties in Negative Waves in Open Channels." European Journal of Mechanics B/Fluids, Vol. 37, pp. 1-9 & 2 video movies (DOI: 10.1016/j.euromechflu.2012.07.003) (ISSN 0997-7546).
Page 21
Fig. 6 - Free-surface and velocity data beneath a negative surge at x = 10.5 m (0.65 m upstream of gate): ensemble-
median water depth dmedian, median velocity components and difference between the 3rd and 1st quartiles (V75-V25) -
Flow conditions: Q = 0.020 m3/s, h = 0.030 m, x = 10.5 m - Data truncated when ADV unit was out of water
(A) Longitudinal velocity component Vx at z/do = 0.615
t (g/do)1/2
3d/
d o, V
x/V
o
(V75
-V25
)/V
o
50 55 60 65 70 75 80 85 90 95 100 105 1100 0
0.5 0.12
1 0.24
1.5 0.36
2 0.48
2.5 0.6
3 0.72
3.5 0.84
4 0.96
4.5 1.08
d medianVx run 1Vx medianV75-V25
(B) Transverse velocity component Vy at z/do = 0.615
t (g/do)1/2
3d/
d o, V
y/V
o
(V75
-V25
)/V
o
50 55 60 65 70 75 80 85 90 95 100 105 110-2 0
-1.2 0.04
-0.4 0.08
0.4 0.12
1.2 0.16
2 0.2
2.8 0.24
3.6 0.28
50 55 60 65 70 75 80 85 90 95 100 105 110-2 0
-1.2 0.04
-0.4 0.08
0.4 0.12
1.2 0.16
2 0.2
2.8 0.24
3.6 0.28
d medianVy run 1Vy medianV75-V25
(C) Vertical velocity component Vz at z/do = 0.615

REICHSTETTER, M., and CHANSON, H. (2013). "Unsteady Turbulent Properties in Negative Waves in Open Channels." European Journal of Mechanics B/Fluids, Vol. 37, pp. 1-9 & 2 video movies (DOI: 10.1016/j.euromechflu.2012.07.003) (ISSN 0997-7546).
Page 22
t (g/do)1/2
3d/
d o, V
z/V
o
(V75
-V25
)/V
o
50 55 60 65 70 75 80 85 90 95 100 105 110-2 0
-1.2 0.4
-0.4 0.8
0.4 1.2
1.2 1.6
2 2
2.8 2.4
3.6 2.8
50 55 60 65 70 75 80 85 90 95 100 105 110-2 0
-1.2 0.4
-0.4 0.8
0.4 1.2
1.2 1.6
2 2
2.8 2.4
3.6 2.8
d medianVz run 1Vz medianV75-V25

REICHSTETTER, M., and CHANSON, H. (2013). "Unsteady Turbulent Properties in Negative Waves in Open Channels." European Journal of Mechanics B/Fluids, Vol. 37, pp. 1-9 & 2 video movies (DOI: 10.1016/j.euromechflu.2012.07.003) (ISSN 0997-7546).
Page 23
Fig. 7 - Free-surface and velocity data beneath a negative surge at x = 6 m (5.15 m upstream of gate): ensemble-median
water depth dmedian, median velocity components and difference between the 3rd and 1st quartiles (V75-V25) - Flow
conditions: Q = 0.020 m3/s, h = 0.030 m, x = 6.0 m
(A) Longitudinal velocity component Vx at z/do = 0.563
t sqrt(g/do)
4d/
d o, V
x/V
o
(V75
-V25
)/V
o
80 84 88 92 96 100 104 108 112 116 120 124 128 132 136 1400 0
0.5 0.12
1 0.24
1.5 0.36
2 0.48
2.5 0.6
3 0.72
3.5 0.84
4 0.96
4.5 1.08
d medianVx run 1Vx medianV75-V25
(B) Transverse velocity component Vy at z/do = 0.563
t sqrt(g/do)
4d/
d o, V
y/V
o
(V75
-V25
)/V
o
80 84 88 92 96 100 104 108 112 116 120 124 128 132 136 140-2 0
-1.2 0.04
-0.4 0.08
0.4 0.12
1.2 0.16
2 0.2
2.8 0.24
3.6 0.28
80 84 88 92 96 100 104 108 112 116 120 124 128 132 136 140-2 0
-1.2 0.04
-0.4 0.08
0.4 0.12
1.2 0.16
2 0.2
2.8 0.24
3.6 0.28
d medianVy run 1Vy medianV75-V25
(C) Vertical velocity component Vz at z/do = 0.563

REICHSTETTER, M., and CHANSON, H. (2013). "Unsteady Turbulent Properties in Negative Waves in Open Channels." European Journal of Mechanics B/Fluids, Vol. 37, pp. 1-9 & 2 video movies (DOI: 10.1016/j.euromechflu.2012.07.003) (ISSN 0997-7546).
Page 24
t sqrt(g/do)
4d/
d o, V
z/V
o
(V75
-V25
)/V
o
80 84 88 92 96 100 104 108 112 116 120 124 128 132 136 140-2 0
-1.2 0.4
-0.4 0.8
0.4 1.2
1.2 1.6
2 2
2.8 2.4
3.6 2.8
80 84 88 92 96 100 104 108 112 116 120 124 128 132 136 140-2 0
-1.2 0.4
-0.4 0.8
0.4 1.2
1.2 1.6
2 2
2.8 2.4
3.6 2.8d medianVz run 1Vz medianV75-V25

REICHSTETTER, M., and CHANSON, H. (2013). "Unsteady Turbulent Properties in Negative Waves in Open Channels." European Journal of Mechanics B/Fluids, Vol. 37, pp. 1-9 & 2 video movies (DOI: 10.1016/j.euromechflu.2012.07.003) (ISSN 0997-7546).
Page 25
Fig. 8 - Ensemble-median water depth dmedian and velocity components, and median turbulent Reynolds stress tensor
components beneath a negative surge at x = 6 m (5.15 m upstream of gate) and z/do = 0.030 - Flow conditions: Q =
0.020 m3/s, h = 0.030 m, x = 6.0 m, z = 0.0067 m, z/do = 0.030
(A) Reynolds stress tensor components vx2 and vxvy
t sqrt(g/do)
3d/
d o, V
x/V
o
v xv x
/Vo2 , v
xvy/
Vo2
80 84 88 92 96 100 104 108 112 116 120 124 128 132 136 1400.5 -0.045
1 -0.015
1.5 0.015
2 0.045
2.5 0.075
3 0.105
3.5 0.135
4 0.165
80 84 88 92 96 100 104 108 112 116 120 124 128 132 136 1400.5 -0.045
1 -0.015
1.5 0.015
2 0.045
2.5 0.075
3 0.105
3.5 0.135
4 0.165Depth Vx median vxvx vxvy
(B) Reynolds stress tensor components vy2 and vyvz
t sqrt(g/do)
3d/
d o, V
y/V
o
v yv y
/Vo2 , v
yvz/
Vo2
80 84 88 92 96 100 104 108 112 116 120 124 128 132 136 140-0.25 -0.008
0.25 0
0.75 0.008
1.25 0.016
1.75 0.024
2.25 0.032
2.75 0.04
80 84 88 92 96 100 104 108 112 116 120 124 128 132 136 140-0.25 -0.008
0.25 0
0.75 0.008
1.25 0.016
1.75 0.024
2.25 0.032
2.75 0.04
Depth Vy median vyvy vyvz
(C) Reynolds stress tensor components vz2 and vxvz
REICHSTETTER, M., and CHANSON, H. (2013). "Unsteady Turbulent Properties in Negative Waves in Open Channels." European Journal of Mechanics B/Fluids, Vol. 37, pp. 1-9 & 2 video movies (DOI: 10.1016/j.euromechflu.2012.07.003) (ISSN 0997-7546).
Page 26
t sqrt(g/do)
3d/
d o, V
z/V
o
v zv z
/Vo2 , v
xvz/
Vo2
80 84 88 92 96 100 104 108 112 116 120 124 128 132 136 140-0.5 -0.2
0 -0.1
0.5 0
1 0.1
1.5 0.2
2 0.3
2.5 0.4
3 0.5
80 84 88 92 96 100 104 108 112 116 120 124 128 132 136 140-0.5 -0.2
0 -0.1
0.5 0
1 0.1
1.5 0.2
2 0.3
2.5 0.4
3 0.5Depth Vz median vzvz vxvz