Embed Size (px)
Citation preview

UNIVERSITY OF GOTHENBURG Department of Earth Sciences Geovetarcentrum/Earth Science Centre
ISSN 1400-3821 B 615 Bachelor of Science thesis Göteborg 2010
Mailing address Address Telephone Telefax Geovetarcentrum Geovetarcentrum Geovetarcentrum 031-786 19 56 031-786 19 86 Göteborg University S 405 30 Göteborg Guldhedsgatan 5A S-405 30 Göteborg SWEDEN
Origin of hornblendites in the Routevare Anorthosite
Complex, Northern Scandinavian Caledonides
Fredrik Schenholm

Origin of hornblendites in the Routevare Anorthosite Complex, Northern Scandinavian Caledonides.
Fredrik Schenholm, Gothenburg University, Department of Earth Science, Geology, Box 460, SE-405 30
Göteborg
Abstract
Since the discovery of the anorthosites, no proposed theory of its origin has been widely accepted. It is called
“the anorthosite problem”. This bachelor thesis focused on the crystallization sequence and origin of the
enclosed hornblendite body in the Swedish Routevare Anorthosite Complex, but it could also improve the
understanding of “the anorthosite problem”. Three samples from the hornblendite body were closely examined at
the Geovetarcenturm in Gothenburg using optical microscope, scanning electron microscope and geochemical
data. The samples showed variation in composition and the rock types were determined to hornblendite and
pyroxene hornblendite. Oikiocrystic and poikilitic textures as well as the absence of deformation textures
indicate magmatic origin with a crystallization sequence of the most representative minerals: Pyroxene and
spinels →High Ti- hornblende→Ti free- hornblende and opaque minerals. Alteration and secondary minerals are
frequent, most likely representing retrograded metamorphose. The mineral assemblage of clinopyroxens and
spinels suggest a minimum crystallization pressure and temperature of 1440° and 3Gpa to 1480° and 2 Gpa. The
aluminum and titanium content in the hornblende were used as a geothermobarometer suggesting exsolvation of
ilmenite “needles” as the pressure decreased from pressure decreased from ~1.1 Ga to ~0.9 Ga and the
temperature increased from ~700ºC to ~925ºC. Areas with decreasing pressures and increasing temperatures are
observed in subduction related mantle wedge regions.
Key words: Routevare Anorthosite Complex, hornblende, hornblendite, optical microscopy, aluminium/titanium-
geothermobarometer
ISSN 1400-3821 B615 2010

Hornblenditers ursprung i Routevare Anorthosite Complex, norra delen av skandinaviska
Kaledoniderna.
Fredrik Schenholm, Göteborgs Universitet, Instutitionen för Geovetenskaper, Geologi, Box 460, 405 30
Göteborg
Sammanfattning
Det finns ingen accepterad teori om anortositerna ursprung. Detta kallas för ”det anortositiska problemet”.
Denna kandidatuppsats har fokuserat på kristallisationssekvensen och ursprunget av en innesluten
hornblenditkropp från svenska Routevare Anorthosite Complex, men kan möjligen också öka förståelsen för
anortositernas ursprung. Tre prover från hornblenditkroppen undersöktes på Geovetarcentrum i Göteborg med
hjälp av optiskt mikroskop, elektronmikroskop och geokemisk data. Proverna varierade i sammansättning och
bergarterna klassificerades till hornblendit och pyroxen hornblendit. Oikocrystiska och poikilitiska texturer samt
frånvaron av deformationstexturer tyder på ett magmatsikt ursprung. Kristallisationssekvens av
huvudmineralerna är: Pyroxen och spinel → Ti-rikt hornblend→Ti- fattigt hornblend och opaka mineraler.
Metamorfa mineraler är vanliga vilket mest sannolikt tyder på en retrograd metamorfos. Mineralerna
clinopyroxen och spinel indikerar en kristallisationsminimum temperatur och tryck på 1440° och 3Gpa till 1480°
och 2 Gpa. Aluminium- och titaninnehållet i hornblendet användes som en geotermobarometer där utfällningen
av illmenite nålar förmodligen skedde vid tryckminskningen ~1.1 Ga till ~0.9 Ga och temperatursökningen från
~700ºC to ~925ºC. Områden med fallande tryck och stigande temperatur är observerade i mantelkilzoner i
subduktionsmiljöer.
Nyckelord: Routevare Anorthosite Complex, hornblende, hornblendit, optiskt mikroskopering, aluminium/titan-
geotermobarometer
ISSN 1400-3821 B615 2010
2
Table of content 1. Introduction 3
2. Geological setting 3
2.1 Proterozoic Massive Type Anorthosites 3
2.2 The Routevare Anorthosite Complex 3
2.2.1 The anorthosite of RAC 4
2.2.2 The hornblendite body of the RAC 4
2.2.3 The gabbro body of the RAC 5
2.2.4 The peridotite body of the RAC 5
3. Methods 6
3.1 Collecting samples in field 6
3.2 GCD-kit 6
3.3 Optical microscopy 7
3.4 Preparation for Scanning Electrom Microscope 7
3.5 SEM 7
3.6 Mineral formula recalculation 7
3.7 Pressures and temperatures 7
4. Results 8
4.1 Description of hand samples 8
4.2 Rock classification 8
4.3 Alteration diagram 9
4.4 Spider- and REE diagram 10
4.5 Thin section texture description in optical microscope 12
4.5.1 L78:79 13
4.5.2 L84:25 14
4.5.3 L78:81 16
4.6 Rock types 17
4.7 SEM and mineral formula recalculation 17
4.8 Pressures and temperatures 20
4.9 Crystallization sequence and P/T path 21
5. Discussion 23
5.1 Rock type 23
5.2 Magmatic origin 23
5.3 Crystallization sequence 23
5.4 Tectonic setting 24
5.5 Pressures and temperatures 24
5.6 Further investigations 25
6. Conclusion 26
7. Acknowledgment 26
8. References 27
Appendix

3
1. Introduction The Routevare Anorthosite Complex (RAC) in the Northern part of the Swedish Caledonides
hosts several isolated bodies of pyroxenite, peridotite, gabbro and hornblendite (Björklund,
1994). The aim of this study is to investigate samples from the isolated hornblendite body to
answer questions as:
- What is the rock type of the hornblendite body?
- What is the crystallization sequence of the samples?
- What is the origin and tectonic setting of the hornblendite body?
2. Geological setting 2.1 Proterozioc Massive Type Anorthosites
Proterozioc massif type anothosites (PMTA) comprises the most voluminous anorthosites on
Earth. The origin, petrogenesis and tectonic setting of PMTAs have been suggested for many
localities such as Greenville Province and Eastern Ghats of India. Ashwal (1993) presents a
plausible model based on available data, clues and ideas from earlier models regarding the
PMTAs petrogenisis. A basaltic melt goes through fractional crystallization and ponds up
deep in the crust. The mafic silicates sink and the crystallized plagioclases forms flotation
cumulates ascending through the crust as buoyant anorthositic mushes. Massifs forms in the
upper crust due to the ascending plagioclase- rich diapirs that coalesce together, to form an
anorthosite complex.
The tectonic settings of the PMTA’s are unknown, although there are several proposed
feasible models. It is likely that anorthosites are a product of basaltic magmatism making
many of today’s tectonic settings a potential source of origin and formation. Data indicates
subduction related tectonic settings such as; continental collisions, subduction, back arc
extension, ridge subduction and rifts, but any of these settings are to a varying degree
compatible with existing data (Ashwal, 1993).
2.2 The Routevare Anorthosite Complex
The Routevare Anorthosite Complex (RAC) is a Fe- Ti PMTA differentiated complex located
in the Swedish part of the Caledonian orogenic belt occupying an area of 76km2
north of
Kvikkjokk (Björklund, pers. com.). RAC is a part of Tielma Magmatic Complex (TMC)
(Rehnström, 2003).TMC shows similar lithologies, trace element composition and rare earth
element patterns as the AMCG (anorthosite- mangerite- charnockite- granite)- suite of the
Lofoten Complex which could indicate a common source and/or process of formation. U-Pb
age determinations on zircons of syenite samples constrain the timing of the magmatic
activity in the TMC to between ~1.78- 1.76 Ga (Rehnström, 2003).
During the formation of the Caledonian orogenic belt, around 420 Ma, major nappe
complexes were thrusted in a general easterly to south-easterly direction over the Baltica
craton as a consequence of continent-continent collision between Baltica and Laurentia
(Rehnström, 2003). The tectonostratigraphy of the Scandinavian Caledonides is traditionally
divided into four major allochthons; the Lower, Middle, Upper (Seve and Köli Nappe
Complexes) and Uppermost Allochthons (Fredén, 2002), in increasing order of thrust
distance.
The RAC is located along the base of the Seve Nappe Complex where several isolated bodies
of layered gabbro, peridotite and hornblendite occur within the main anorthosite complex (fig
1). These rocks restores to the pre- collisional western margin of Baltica. The primary
mineralogy is to a varying degree regionally altered to amphibolite grade, and along the

4
Caledonian main thrusts and local shear zones retrograded to greenschist grade (Björklund,
1994).
Fig 1. The location of the hornblendite body. Reproduced from Björklund (1994).
2.2.1 The anorthisite of the RAC
The anorthosite varies in modal composition, from gabbroic anorthosite composed of 40%
mafic minerals to pure anorthosite almost devoid of mafic minerals. The pure anorthosite is
characterized by the white color due to the seriticized large plagioclase crystals. When
sheared, these rocks show a foliated, mylonitic and fine grained texture.
2.2.2 The hornblendite body of the RAC
An elongated body, 3.000 m long and up to 500 m wide, of black hornblendite strikes from
WNW to ESE, completely enclosed by anorthosite. The body is bone-shaped with a narrow
centre and wider ends. The centre shows foliation due to deformation while the ends show

5
“massive”, primary texture, a homogenous texture without preferred crystal orientation or
stratification. Plagioclase occurs only very locally and subordinately within the hornblendite
body, which thus classifies as ultramafite. The composition varies between hornblendite and
pyroxene hornblendite but will hereby be referred as the hornblendite body.
2.2.3 The gabbro bodies of the RAC
Several bodies of gabbroic composition, with a maximum length of 1.000 m and width of 800
m, occur as isolated lensoids. The bodies show felsic to mafic composition, partly with modal
rhythmic layering cut by pyroxenite and syenite intrusions.
2.2.4 The peridotite body of the RAC
An elongated body, 1.700 m long and up to 200 m wide, of olivine- rich peridotite strikes in
the same direction as the hornblendite body from WNW to ESE. The peridotite body is
located 7 km NW of the hornblendite body.

6
3. Methods 3.1 Collecting samples in the field
In 1978, Geological Survey of Sweden (SGU) employed Lennart Björklund, to sample the
anorthosite in the Routevare area to investigate the possibility of leaching Aluminum. The
area appeared to be of interest for science and Mr Björklund made complementary sampling
including the mafic rocks in 1984 and 1985.
The samples, named hornblendite, were collected in situ with a sledge hammer weighing 6 kg.
The sample sites were critically chosen with the least amount of visible deformation and
metamorphic imprint as possible. This often correlates with the central parts of the mafic
bodies.
The hornblendite samples used for analyses were L78:79, L78:81 and L84:25. Samples
L78:79 and L84:25 were collected from the north- western part of the hornblendite body,
sample L78:81 from the south -eastern part (fig 2).
Fig 2. Sample locations from the hornblendite body in the Routevare area. Figure 1 shows a more detailed map
regarding the bedrock in the area. Reproduced from Björklund (1994).
3.2 GCD-kit
To classify the different rock types and to identify a possible tectonic setting of the samples,
the software GCD-kit version 2.3 was used. Geochemical data were available (Björklund,
7
pers. com) (appendix 1), both for the hornblendite samples as well as additional samples from
the other rocks of the RAC.
3.3 Optical microscopy
Optical microscopy was carried out at Geovetarcentrum (GVC) in Gothenborg using a Leica
DMLP microscope in combination with an Olympus DP71 camera and the software Cell B.
The mineralogy of the samples were determined by using plane and crossed polarized light,
pleochrosim, extinction angles, interference color charts and opaque microscopy. Special care
was taken mapping the minerals textural spatial relations, the alteration grade and to
distinguish primary and secondary minerals.
3.4 Preparation for the Scanning Electron Microscope
To make orientation easier in the Scanning Electron Microscope (SEM), the areas of interest
were marked on the thin section samples while working with the optical microscopy. Before
starting the SEM analyses the thin sections were scanned and printed on paper to make the
orientation in the SEM easier. As a final step the thin section were coated with coal.
3.5 SEM
Mineral microchemistry was determined at the GVC, using a Hitachi SEM. The specimen
current was set to approximately 3.5 nA, the accelerating current to 20kV and the EDS
detector dead time of approximately 50%. The SEM-EDS offers the possibility to determine
the actual composition of crystals, to confirm the optical microscopy observations, to
determine the compositions of the exsolved lamellas in the pyroxenes, the opaque mineral
assemblages, and the Fe-Ti needle shaped assemblages along the crystal structure of the
hornblendes.
3.6 Mineral formula recalculation
To calculate mineral formulas from the chemical analyses, spreadsheets for mineral formula
calculations were used. Mostly for historic reasons, the chemical analyses of silica minerals
are often reported in weight percentages of the oxides of the elements determined. The
calculations follow four steps (serc.carleton.edu, 2009):
1) Dividing the wt% of each oxide by the formula wt% of that oxide.
2) Multiplying the resulting “mole number” of each oxide by the number of oxygen in the
oxide formula.
3) Multiply the resulting “oxygen number” of each oxide by a normalization constant.
4) Multiply the “normalized oxygen number” of each oxide by the number of cation per
oxygen in the oxide formula.
3.7 Pressure and temperature
To determine a possible pressure and temperature of the magmatic/metamorphic origin of the
samples, known pressure/temperature (P/T) stability fields were used for contents of
coexisiting elements as well as coexisiting minerals.
8
4. Results 4.1 Description of hand samples
Only small fragments of the samples remain. They show a blackish color with gray pyroxene
grains enclosed in larger oikocrysts of hornblende. No indications of foliations are observed
and from certain angles the samples show schiller- like reflections similar to labradorescence.
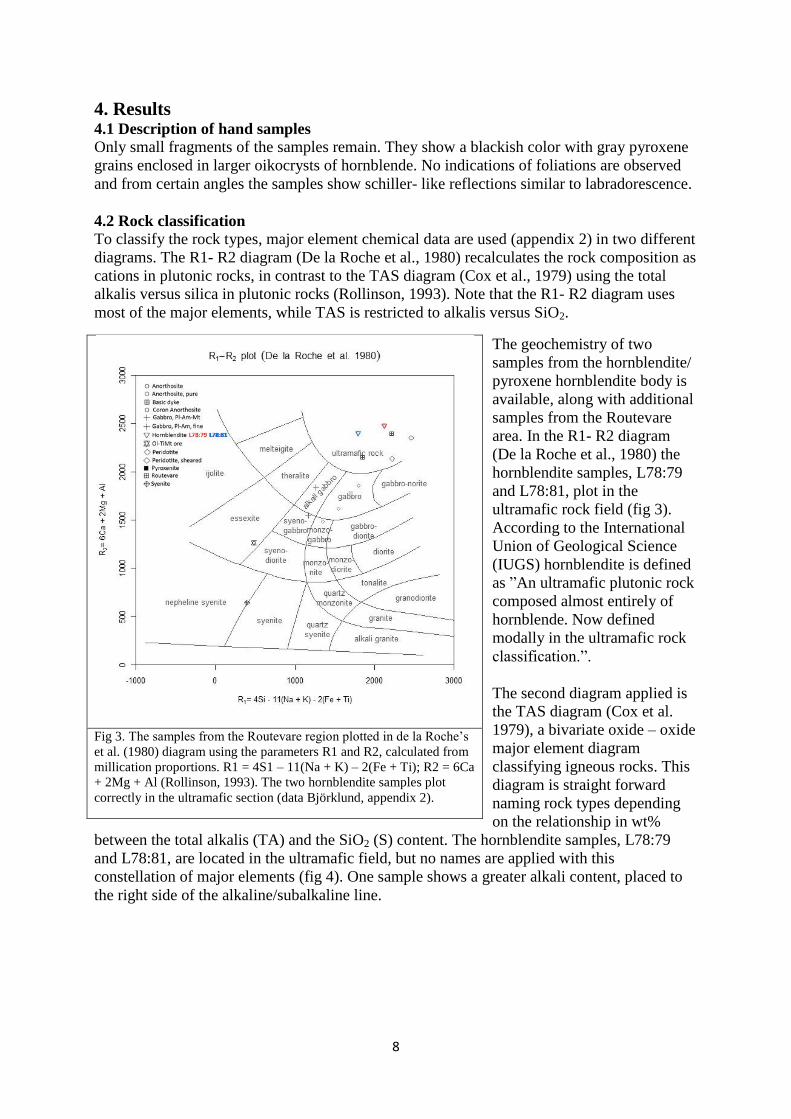
4.2 Rock classification
To classify the rock types, major element chemical data are used (appendix 2) in two different
diagrams. The R1- R2 diagram (De la Roche et al., 1980) recalculates the rock composition as
cations in plutonic rocks, in contrast to the TAS diagram (Cox et al., 1979) using the total
alkalis versus silica in plutonic rocks (Rollinson, 1993). Note that the R1- R2 diagram uses
most of the major elements, while TAS is restricted to alkalis versus SiO2.
The geochemistry of two
samples from the hornblendite/
pyroxene hornblendite body is
available, along with additional
samples from the Routevare
area. In the R1- R2 diagram
(De la Roche et al., 1980) the
hornblendite samples, L78:79
and L78:81, plot in the
ultramafic rock field (fig 3).
According to the International
Union of Geological Science
(IUGS) hornblendite is defined
as ”An ultramafic plutonic rock
composed almost entirely of
hornblende. Now defined
modally in the ultramafic rock
classification.”.
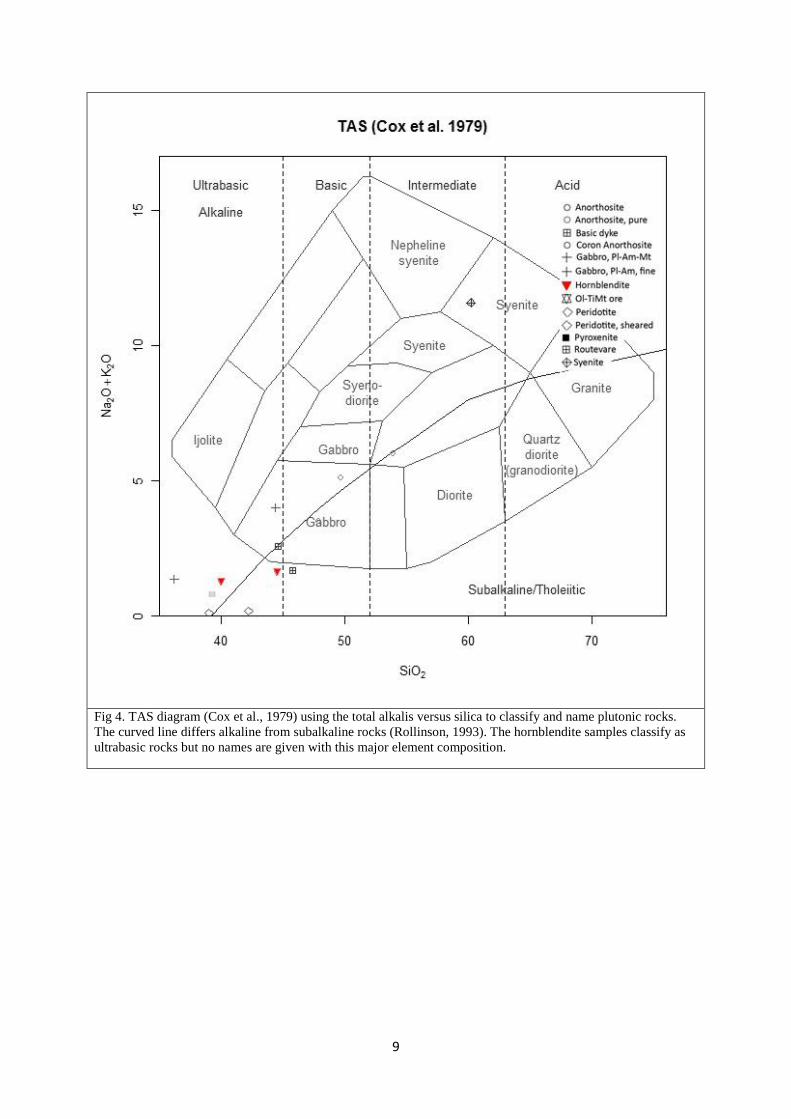
The second diagram applied is
the TAS diagram (Cox et al.
1979), a bivariate oxide – oxide
major element diagram
classifying igneous rocks. This
diagram is straight forward
naming rock types depending
on the relationship in wt%
between the total alkalis (TA) and the SiO2 (S) content. The hornblendite samples, L78:79
and L78:81, are located in the ultramafic field, but no names are applied with this
constellation of major elements (fig 4). One sample shows a greater alkali content, placed to
the right side of the alkaline/subalkaline line.
Fig 3. The samples from the Routevare region plotted in de la Roche’s
et al. (1980) diagram using the parameters R1 and R2, calculated from
millication proportions. R1 = 4S1 – 11(Na + K) – 2(Fe + Ti); R2 = 6Ca
+ 2Mg + Al (Rollinson, 1993). The two hornblendite samples plot
correctly in the ultramafic section (data Björklund, appendix 2).
9
Fig 4. TAS diagram (Cox et al., 1979) using the total alkalis versus silica to classify and name plutonic rocks.
The curved line differs alkaline from subalkaline rocks (Rollinson, 1993). The hornblendite samples classify as
ultrabasic rocks but no names are given with this major element composition.

10
4.3 Alteration diagram
To examine chemical alteration of igneous samples Hughes diagram (1972) was used. The
two samples, L78:79 and L78:81, plot in the mildly K-altered field (fig 5). Plots involving
mobile elements such as K need to be interpreted accordingly.
Fig 5. Hughes diagram (1972) show alteration regarding Na/K. Both hornblendite samples show an alteration of
K.
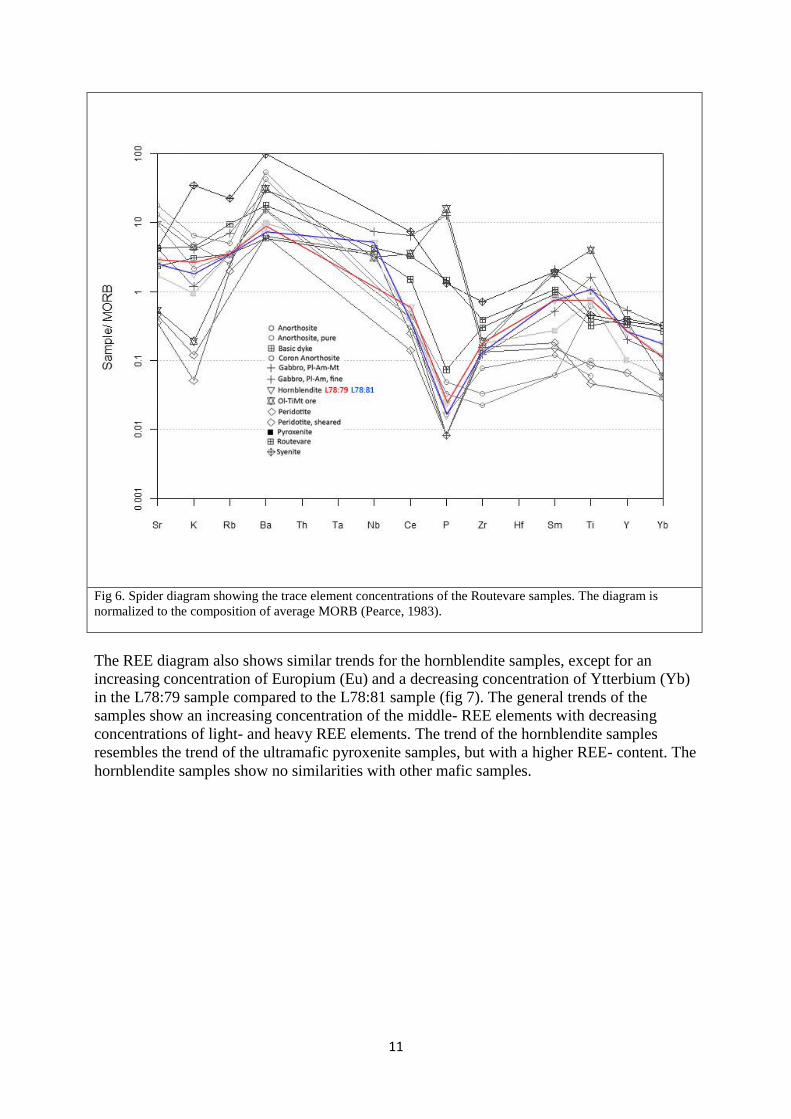
4.4 Spider- and REE diagram
Possible source environments of magmas or indication of magma mixing or magma
fractionation, may be distinguished by patterns of trace element concentrations in Spider- and
REE diagrams (Blatt et al., 2006). In the Spider diagram the two hornblendite samples,
L78:79 and L78:81, show similar trends for the mobile elements (LIL- elements = Sr- Ba) as
in the immobile elements (HFS- elements = Th- Yb), except for a higher concentration of
Niobium (Nb) in the L78:81 sample compared to the L78:79 sample. Characteristic for both
samples are the depletion in Phosphorus (P) (fig 6), in contrast to other mafic samples as
samples “Gabbro, Pl-Am-Mt” and “Ol- Ti- Mt ore”. The general trend of enrichment of the
LIL- elements compared to the HFS- elements could indicate a subduction zone magma
generated by the transport of fluid- soluble elements into the mantle wedge region (Tatsumi et
al., 1995).
11
Fig 6. Spider diagram showing the trace element concentrations of the Routevare samples. The diagram is
normalized to the composition of average MORB (Pearce, 1983).
The REE diagram also shows similar trends for the hornblendite samples, except for an
increasing concentration of Europium (Eu) and a decreasing concentration of Ytterbium (Yb)
in the L78:79 sample compared to the L78:81 sample (fig 7). The general trends of the
samples show an increasing concentration of the middle- REE elements with decreasing
concentrations of light- and heavy REE elements. The trend of the hornblendite samples
resembles the trend of the ultramafic pyroxenite samples, but with a higher REE- content. The
hornblendite samples show no similarities with other mafic samples.

12
Fig 7: REE diagram normalized to REE chondrite (Boynton, 1984). The hornblendite samples show the same
trends with increasing concentrations of middle- REE and decreasing concentrations of the light- and heavy
REE.
4.5 Thin section texture descriptions in optical microscopy
Three thin sections; L78:79, L84:25 and L78:81 from the hornblendite body are described
below based on optical microscopy observations (table 1).
L78:79 L84:25 L78:81
50- 90% Hornblende Hornblende Hornblende
<50% Clinopyroxene Clinopyroxene Clinopyroxene
Orthoyroxene Orthopyroxene Orthopyroxene
<5% Opaque minerals Opaque minerals Opaque minerals
<1% Garnet
Apatite
Biotite
Calcite
Chlorite
Serpentine
Spinel
Chlorite
Relict Garnet
Spinel
Table 1. A summary of the mineral assemblages of the thin sections.
13
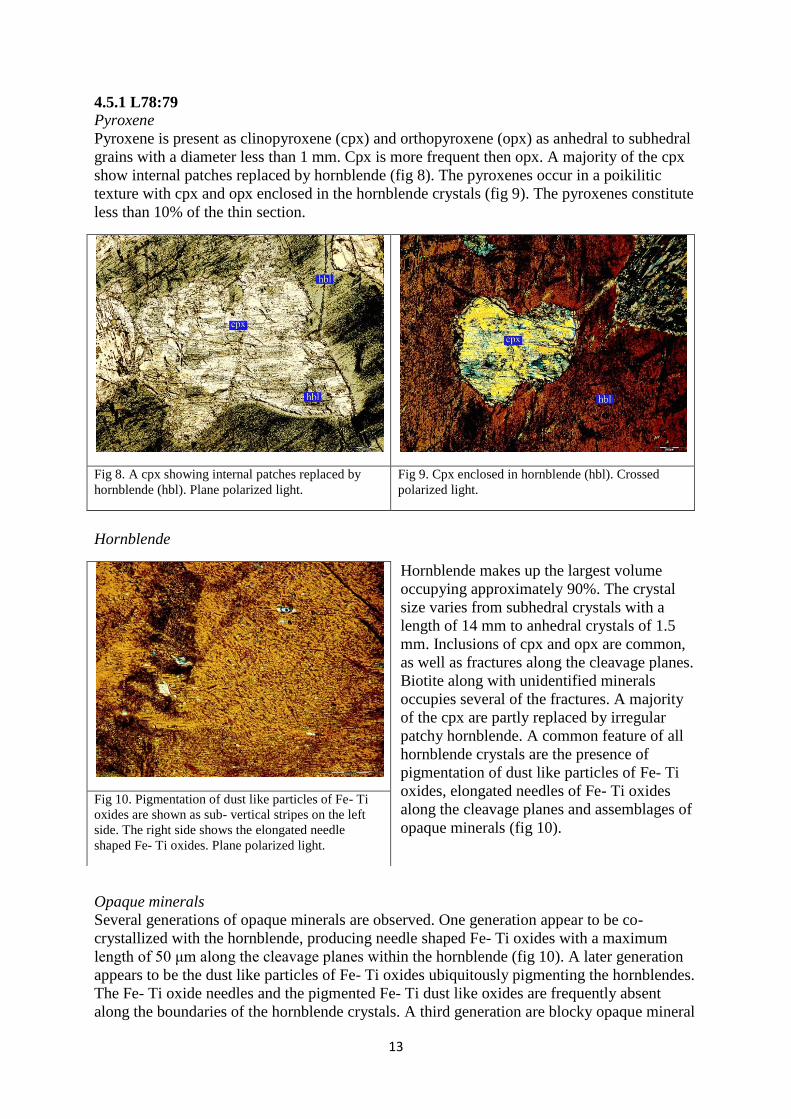
4.5.1 L78:79
Pyroxene
Pyroxene is present as clinopyroxene (cpx) and orthopyroxene (opx) as anhedral to subhedral
grains with a diameter less than 1 mm. Cpx is more frequent then opx. A majority of the cpx
show internal patches replaced by hornblende (fig 8). The pyroxenes occur in a poikilitic
texture with cpx and opx enclosed in the hornblende crystals (fig 9). The pyroxenes constitute
less than 10% of the thin section.
Fig 8. A cpx showing internal patches replaced by
hornblende (hbl). Plane polarized light. Fig 9. Cpx enclosed in hornblende (hbl). Crossed
polarized light.
Hornblende
Hornblende makes up the largest volume
occupying approximately 90%. The crystal
size varies from subhedral crystals with a
length of 14 mm to anhedral crystals of 1.5
mm. Inclusions of cpx and opx are common,
as well as fractures along the cleavage planes.
Biotite along with unidentified minerals
occupies several of the fractures. A majority
of the cpx are partly replaced by irregular
patchy hornblende. A common feature of all
hornblende crystals are the presence of
pigmentation of dust like particles of Fe- Ti
oxides, elongated needles of Fe- Ti oxides
along the cleavage planes and assemblages of
opaque minerals (fig 10).
Opaque minerals
Several generations of opaque minerals are observed. One generation appear to be co-
crystallized with the hornblende, producing needle shaped Fe- Ti oxides with a maximum
length of 50 μm along the cleavage planes within the hornblende (fig 10). A later generation
appears to be the dust like particles of Fe- Ti oxides ubiquitously pigmenting the hornblendes.
The Fe- Ti oxide needles and the pigmented Fe- Ti dust like oxides are frequently absent
along the boundaries of the hornblende crystals. A third generation are blocky opaque mineral
Fig 10. Pigmentation of dust like particles of Fe- Ti
oxides are shown as sub- vertical stripes on the left
side. The right side shows the elongated needle
shaped Fe- Ti oxides. Plane polarized light.

14
assemblages enclosed and/or exsolved in the hornblende. A red, unidentified mineral is
associated with the opaque minerals.
Biotite
Subhedral biotite grains with a maximum length of 0.4 mm are located in fractures along the
cleavage planes within the hornblende. Minor amounts of biotite are also observed in larger
fractures between hornblende crystals. Biotite is an accessory mineral.
Apatite
Minor amounts of apatite crystals are enclosed in the hornblende. Apatite is an accessory
mineral.
Calcite
Calcite is an accessory mineral located along fractures in the hornblende grain boundaries.
Serpentinite
Serpentinite is an accessory mineral in fractures along hornblende grain boundaries.
Interpreted crystallization sequence
Pyroxenes were the first minerals to crystallize suggested from the poikilitic texture. Second
mineral to crystallize were the hornblende, indicated by the oikocrystic texture. Three
generations of opaque minerals are observed, with the Fe- Ti needle shaped oxides as the first
generation, exsolved along the hornblende’s cleavage planes. The second generation is the
pigmented Fe- Ti dust like oxides. Clear margins occasionally embrace the blocky Fe- Ti
oxides. This could indicate that these blocky assemblages originate from the Fe- Ti needles
and Fe- Ti pigmentation, making this the third generation. Calcite and serpentinite suggests
being metamorphic minerals due to retrograded metamorphose.
4.5.2 L84:25
Pyroxene
Pyroxene is present as cpx and opx. The
anhedral crystals with a maximum length of 4
mm are strongly altered to chlorite and
epidote, both within and along the crystal
boundaries. Internal patches within the
crystals are partly replaced by hornblende.
Pyroxenes are often mantled and corroded by
hornblende (fig 11). Fractures are common,
often exhibiting replacement by hydrous
minerals such as chlorite and hornblende.
Spinel
Green spinel is closely associated with the
opaque mineral assemblages, easily observed
in plane polarized light showing the
characteristic green colour (Fig 12). An
estimated occurrence is a minimum of 1%. The maximum size of the crystals 0,8 mm in
length. The intensity of the green colour varies in the spinels. Some of the crystals show black
lamellas.
Fig 11. Hornblende (hbl) mantling and corroding cpx
and opaque mineral assemblages (oma). Crossed
polarized light.

15
Hornblende
Anhedral hornblende are frequently mantling and entwining the pyroxenes, and inclusions of
opaque mineral assemblages are common. Several of the pyroxenes show internal patches
replaced by hornblende (Fig 8). More frequent compared to sample L78:79 is the dark
pigmentation of dust like particles of Fe- Ti oxides as well as elongated needles of opaque Fe-
Ti oxides along the cleavage planes. Some grain boundaries are altered to needle shaped
chlorite as well as along several crystal surfaces.
Opaque minerals
Opaque mineral assemblages, with a maximum diameter of 1 mm are common, making up
about 5% of the volume. The assemblages are frequently surrounded by a rim of chlorite
along with unidentified minerals (fig 13). These chlorite rimmed opaque mineral assemblages
commonly occur as inclusions in the hornblende. Another textural generation of opaque
minerals, similar to the L78:79 sample, occur as pigmented dust like particles of Fe- Ti oxides
as well as elongated needles of Fe- Ti oxides along the cleavage planes of hornblende.
Fig 12. Green spinel (sp) enclosed in an opaque
mineral assemblage. The red streak in the centre is a
microscopic refractive error. Plane polarized light.
Fig 13. Chlorite (chl) rimming the opaque mineral
assemblage (oma). Needle shaped chl visible on the
right side of the rim. Crossed polarized light.
Garnet
Garnet is enclosed in the hornblende. The
crystals are commonly strongly altered to
magnetite within the structure while the
borders are altered to calcite and chlorite (fig
14). Garnet is an accessory mineral.
Chlorite
Chlorite is a common secondary product as
rims around the opaque mineral assemblages
(fig 13), along grain boundaries of hornblende
and pyroxene and in fractures of pyroxenes.
Interpreted crystallization sequence
The pyroxenes were the first mineral to
crystallize suggested by hornblendes post-
crystallization texture of the mantling and
corroding of the pyroxenes. Enclosed spinels in the hornblende also suggest pre- hornblende
Fig 14. A garnet (gar) exposed to secondary
processes producing magnetite, calcite and chlorite.
Plane polarized light.

16
crystallization. Out of the three observed generations of Fe- Ti oxides, it is likely the first
generation of Fe- Ti oxides exsolved from the hornblende as needle shaped crystals. The
second generation of the pigmentation of dust like Fe- Ti oxide is suggested to be followed by
the third generation of the Fe- Ti oxide assemblages. Chlorite is an alteration product of
hornblende (Nesse, 2000), most likely from retrograde metamorphism.
4.5.3 L78:81
Pyroxene
A variety of cpx and opx are enclosed in hornblende oikocrysts, mainly as subhedral crystals
with a homogenous size of 2-3 mm. The pyroxenes make up 40% of the volume. Lamellas
and twinning structures are frequent in the cpx (fig 15). The cpx occasionally show alteration
and secondary growth of chlorite along the crystal margins. Fe- Ti oxides are more common
along the cleavage planes and as pigmentation on the crystal structure, compared to the
pyroxenes in previous samples. Cpx is more frequent then opx.
Spinel
Green spinel is typically associated with the opaque mineral assemblages. These assemblages
are enclosed in the hornblende oikocrysts. Some of the crystals show black lamellas. Spinel is
an accessory, but characteristic mineral.
Hornblende
Two large optically continuous oikocrysts of hornblende, making up about 50% of the
volume, enclose the other crystals mainly consisting of cpx, opx and opaque mineral
assemblages. As in samples L78:81 and L84:25, the hornblende is darkened by ubiquitous
pigmented dust like particles of Fe- Ti oxides as well as elongated needles of Fe- Ti oxides
along the cleavage planes. Another generation of Fe- Ti free hornblende is occasionally
observed as anhedral crystals along the boundaries of the pyroxenes (fig 16).
Fig 15. A twinned cpx enclosed in hornblende (hbl).
The dark colour of the hbl is a result of Fe- Ti oxides.
Crossed polarized light.
Fig 16. Fe- Ti free hornblende (hbl) along the grain
boundary of an altered cpx. Plane polarized light.

17
Opaque minerals
As in samples L78:79 and L84:25, several
generations of opaque minerals occur, making
up approximately 10% of the volume. The
hornblende crystals are entirely filled with
elongated needles of Fe- Ti oxides along the
cleavage planes as well as pigmentation of
dust like particles of Fe- Ti oxides. Opaque
mineral assemblages are commonly enclosed
in the hornblende oikocrysts. Inclusions of
spinel and unidentified minerals are common
within these assemblages. Clear margins are
frequently surrounding the assemblages
within the hornblende oikocrysts (fig 17).
Interpreted crystallization sequence
Considering the oikocrystic texture of the
hornblende enclosing the pyroxenes, pyroxenes are likely to have crystallized first, followed
by co- or pre pyroxene crystallized spinels and hornblende. Three generations of opaque
minerals are observed, with the Fe- Ti needle shaped oxides as the first generation, exsolved
along the hornblende’s cleavage planes. The second generation is the pigmented Fe- Ti dust
like oxides. The frequently clear margins embracing the blocky Fe- Ti oxides could indicate
that these blocky assemblages originate from the Fe- Ti needles and Fe- Ti pigmentation,
making this the third generation. The spinels are closely associated with the blocky Fe- Ti
oxide assemblages.
4.6 Rock types
Based on the optical microscopy described above, two rock types are classified. Samples
L78:79 and L84:25, both sampled from the North- west corner of the hornblendite body,
contains 90% respectively 80% of hornblende making L78:79 the only sample classifying as
hornblendite, according to the rock class definition of International Union of Geological
Science. Sample L78:81 is sampled from the North- east corner of the hornblendite body
containing 50% of hornblende. The high proportions of pyroxenes therefore classify samples
L78:81 and L84:25 as pyroxene hornblendite.
4.7 SEM and mineral formula recalculation
Pyroxene
The most representative and frequent cpx is diopside, occasionally showing lamellas of
exsolved hypersthene (table 2)(appendix 1, site 21 and 21). Hornblende commonly hosts the
cleavage planes of the diopside (fig 18).
Wollastonite Enstatite Ferrosilite
Diopside L78:81 55,13% 41,59% 3,27%
Hypersthene lamella L78:81 3,44% 69,15% 27.41%
Table 2. Mineral formulae recalculation of a single pyroxene’s chemical analyses from the SEM, showing the wt%
end member compositions of diopside and hypersthene.
Fig 17. Two opaque mineral assemblages (oma)
showing the characteristic clear margins. Crossed
polarized light.

18
Hornblende
The hornblende shows little chemical variation in composition in all samples (appendix 1, site
12 and 29). Exsolution of needle shaped ilmenite is common and less common but still
frequent are exsolutions of rutile and titanite. Lamellas of hornblende with slightly higher
aluminium content are observed within the pyroxenes (appendix 1, site 35, spectrum 3), often
together with the needle shaped ilmenite, and occasionally green spinel (fig 18).
Fig 18. A backscattered image of lamellas within a cpx (cpx, spectrum 2). Exsolved spinel (sp, spectrum 1) is clearly
visible as a white strip within the dark grey hornblende lamella (hbl, spectrum 3). Two diagonal cutting grey stripes of
opx/cpx (opx/cpx, spectrum 4) are shown on the right side of the image. As the hornblende and opx/cpx lamellas are
observed along the crystal planes of the cpx, they are interpreted to be post- cpx crystallization. The hornblende lamellas
are cutting the opx/cpx lamellas, suggesting a post opx/cpx- crystallization. The spinels are located as exsolution minerals
within the hornblende, suggesting post- hornblende crystallization. Spectrum compositions are posted in appendix 1 as
Site 35 and spectrum 1 to 4.
There are several members of the hornblende group, and to describe the RAC’s hornblende, a
comparison was made to 206 other known hornblende members with similar chemical
composition (Deer et al, 1997). RAC’s hornblende show greatest similarities to the
hornblende group member hastingsite (appendix 3)

19
Spinel
Two different types of characteristic spinels,
named spinel 1 and spinel 2, were examined
with similar essential chemical composition of
Fe, Mg, Al, O. Spinel 2 has a higher Ti-
content compared to spinel 1 (appendix 1, site
26 and 27) and these two spinels are
distinguished by rounded
inclusions/exsolutions within the crystals of
spinel 1. The spinels typically occur in
assemblages of magnetite, hematite and
corundum, and rarely in hornblende lamellas
within the pyroxenes.
To classify spinel 1 and spinel 2, a “spinel
prism” is used, based on the chemical analysis
(fig 19). Both spinel 1 and spinel 2 classifies
as ferroan spinel types. Spinel 1 is a pure solid
solution between spinel and hercynite, but
with a larger contribution of hercynite, and classifies as a Mg- rich hercynite. Spinel 2 is more
complex, as it is a solid solution between spinel, hercynite, magnesioferrite and magnetite/
ulvöspinel. It classifies as a Ti- poor/Mg- rich hercynite.
Magnetite and Hematite
Magnetite and hematite are common in the opaque mineral assemblages closely associated
with spinel and corundum. Exsolved Fe- oxides occur in hornblende and pyroxene as
“needles” along the cleavage planes and as rounded inclusions.
Titanite
Exsolved needle shaped titanite is common in the hornblende, as well as exsolved illmenite
within the titanites.
Ilmenite
Ilmenite is more frequent than titanite or
rutile, as exsolved needle shaped crystal
within the hornblende (fig 20).
Rutile
Rutile occur, analogous to titanite, but less
commonly, as exsolved needles in
hornblende.
Corundum
Corundum is frequent along the borders of
spinel and magnetite in the opaque mineral
assemblages.
Fig 19. Nomenclature for members of the spinel
group based on chemical composition. Spinel 1 and 2
classifies as ferroan spinel types, based on two
measurements.
Fig 20. Exsolved ilmenite “needles” within a
hornblende crystal in sample L78:81 as a back
scattered image from the SEM. The purple square
shows the area measuring the hornblende and ilmenite
composition.

20
4.8 Pressure and temperatures
Known pressure/temperature (P/T) stability fields for mineral assemblages are used as an
indicator of the P/T environment the hornblendite could have originated from. Hornblende’s
stability field in a subduction environment ranges from 1000°C at 1 GPa to 550°C at 2.7 GPa,
while the pyroxenes stability field include a higher temperature and greater pressure
environment (fig 21) (Ashwal, 1993). Orlando et al (2000) experimental studies of basanites
hosting similar clinopyroxenes and spinels as in the investigated samples L84:25 and L78:81
show a stability field ranging from 1440° C and 3 GPa to 1480°C and 2 GPa (fig 22).
Fig 21. P/T stability field for minerals in a subduction zone
environment according to Ashwal (1993).
Fix 22. P/T stability field for an assemblage of clinopyroxene and
spinel in an experimental phase relation study of basanite. The
heavier line represents liquidus curve. Reproduced from Orlando et
al (2000).

21
The TiO2- and Al2O3 content (wt%) of hornblende reflects a possible P/T environment for
hornblende to form in. The TiO2 content correlates to the temperature but is nearly
independent of the pressure. But in combination with the Al2O3 content a useful
geothermobarometer is provided (Ernst et al, 1998). Two values are used (appendix 1, site 12
and 19), the first value is measured on a pure hornblende, clear of exsolved ilmenite
“needles”. The second value is measured over a large area, including both hornblende and
ilmenite “needles”, to produce an integrated mean bulk composition of the hornblende before
the ilmenite needles were exsolved. This composition suggests reflecting the original
composition of the hornblende. With an increasing temperature, and a decreasing pressure,
hornblende cannot host TiO2 resulting in exsolution of ilmenite lamellas (fig 23).
Fig 23. Isopleths of Al2O3 and TiO2, in weight percent, based on synthetic Ca- amphiboles as a function of P and
T (Ernst et al, 1998). As the pressure decreases from ~1.1 GPa to ~0.9 GPa and the temperature increases from
~700ºC to ~925ºC ilmenite “needles” are suggested to exsolve from the hornblende in sample L79:81. This
exsolution could indicate an upward migration of the hornblendite magma.
4.9 Crystallization sequence and P/T path
The crystallization sequence presented in figure 24 is based on the results from microscopy
observations and chemical analysis. Figure 25 shows a speculative P/T path, based on the
crystallization sequence from figure 24 in combination with the established P/T path
presented in figure 23.

22
Fig 24. A possible crystallization sequence for the hornblendite (L78:79) and the pyroxene hornblendite (L78:81
and L84:25) samples. Primary crystallized minerals are marked 1 – 5 and the later metamorphic minerals 6.
Fig. 25. A speculative P/T path of the hornblendite samples. Number 1 to 3 suggests the crystallization of opx,
cpx, spinels and the exsolved hypersthene lamellas. Number 4 and 5 show the established stability fields for the
Fe- Ti rich hornblende and the hornblende with the exsolved ilmenite “needles” (fig 22). Note that Fe- Ti rich
hornblende might originate from greater pressures and temperatures. Number 6 shows a possible P/T path for the
minerals with a later metamorphic origin.

23
5. Discussion 5.1 Rock types
Trace element data of two samples, L78:79 and L78:81, from the hornblendite body in the
RAC are available to geochemically determine the rock type. The classification diagrams R1-
R2 (De la Roche et al., 1980) and TAS (Cox et al., 1979) are used, both indicating ultramafic
composition (fig 3 and fig 4). The R1-R2 diagram is based on the more immobile elements Ti,
Mg and Fe making this diagram more reliable compared to the TAS diagram based on Na, K
and Si considering the K – alteration in the Hughes diagram (1972) of the samples (fig 5). The
ultramafic composition from both classification diagrams R1-R2 (De la Roche et al., 1980)
and TAS (Cox et al., 1979) correlates with the rock types determined with the optical
microscopy; L78:79 as hornblendite and L78:81 and L84:25 as pyroxene hornblendite.
5.2 Magmatic origin
Hornblende is a common mineral in both metamorphic and igneous originated rocks (Wenk et
al, 2004), and may form in a fluid rich magma or in prograde/retrograde metamorphic
environments due to the influence of hydrous fluids. Field observations show no indication of
foliation or preferred mineral orientation, indicating no deformation metamorphism has
occurred. The samples show a poikilitic texture of hornblende oikicrysts, with a maximum
length of 7 cm, enclosing pyroxenes. This is confirmed in optical microscopy and SEM and
could indicate an order of crystallization with pyroxene as the first mineral to crystallize. This
is best observed in samples L78:79 and 78:81. But this assumption should according to
Shelley (1993) be taken with care, when examples of simultaneous crystallization of poikilitic
textures exist.
Magmatism is still the most likely source, due to the characteristic igneous textures (Blatt et
al, 2006) of the hornblende oikocrysts and the poikilitic pyroxenes. The massive and
undeformed texture observed in the hand samples further support the suggestion of a
magmatic origin.
5.3 Crystallization sequence
Textural relations indicate that the most likely minerals to first crystallize are the pyroxenes
and the Fe, Mg, Al- spinels, frequently enclosed by hornblende. Orthopyroxenes are observed
in optical microscopy, and if Bowen’s reaction series is applied, orthopyroxene would be the
first to crystallize followed by the clinopyroxene diopside. This sequence could not be
determined from textural relations in optical microscopy or SEM. Occasionally the diopside
shows lamellas of hypersthene, indicating post diopside crystallization. Ilmenite, titanite and
rutile “needles” are common along the cleavage planes of the hornblende, most likely caused
by Fe- Ti exsolution due to a cooling history of the hornblende (Mongkoltip et al, 1983).
Ilmenite is exsolved within titanite suggesting post titanite crystallization sequence. The
hornblendes show enclosed inclusions of the frequently appearing green Fe, Mg, Al- spinel
indicating pre hornblende crystallization. The spinels are often part of an opaque mineral
assemblage, containing hematite, magnetite, minor amounts of sulphides and corundum.
These assemblages are repeatedly enclosed in the Fe- Ti “needle” rich hornblendes showing a
clear rim of Fe- Ti “needle”- free hornblende. A possible origin of these opaque mineral
assemblages is the Ti- Fe components from the hornblende, suggesting post hornblende
exsolution. A relict garnet altered to chlorite, magnetite and calcite is a strong indicator of
metamorphism and secondary processes as well as the alteration products of chlorite,
serpentinite and epidote related to pyroxenes and hornblende.

24
5.4 Tectonic setting
A general trend can be distinguished in the enrichment of the LIL- elements compared to the
HFS- elements in the spider diagram (fig 6). This could indicate a subduction zone magma
generated by the transport of fluid- soluble elements into the mantle wedge region (Tatsumi et
al., 1995). But the enrichment of Ta and Nb do not fit this interpretation. Phosphorous is an
incompatible element in mantle mineralogy, and will during partial melting quickly partition
to the melt (Rollinson, 1993). The depletion of phosphorous may well indicate mantle origin.
According to Rehnström (2003), the syenite instrusions are the oldest components within the
TMC where the magmatic activity is constrained to ~1.78- 1.76 Ga based on U- Pb zircon
dating on syenite samples. But in the RAC, observations are made (Björklund, pers. com.) of
syenite intrusions cutting mafic intrusions such as gabbros suggesting post- gabbro activity.
Rehnström’s (2003) zircon dating is slightly younger than the magmatic activity in the
Lofoten complex, ~1.8 Ga (Markl et al., 1998). Considering the long lived magmatic activity,
and Björklund’s (pers. com.) observations, same tectonic source is still likely.
It is possible the anorthosite of the RAC is of similar age as the anorthosite of the AMCG
Lofoten Complex, and considering the enclosed appearance of the hornblendite/ pyroxene
hornblendite body within the RAC’s anorthosite, this body likely intruded in the “active”
anorthosite. This would indicate similar ages of hornblendite body and the anorthosite,
making the post- sveconfennian orogen a potential source of origin. This could correlate with
the weak connection to a subduction environment in the spider diagram.
5.5 Pressure and Temperatures
The only indicator of a possible tectonic setting is a subduction environment based on the
Spider diagram (fig 6). Supporting evidence for this is the high Fe- Ti hornblende’s P/T
stability field in a subduction environment ranging from 1000°C at 1 Gpa to 550°C at 2,7
Gpa. In the Ernst et al (1998) isopleth Al2O3 and TiO2- diagram (fig 23) the samples plot
within this stability field. A suggestion would be, as the pressure decreases from ~1.1 GPa to
~0.9 GPa and the temperature increases from ~700ºC to ~925ºC, the ilmenite “needles”
exsolve from the hornblende when TiO2 no longer fit in the hornblende crystal structure (fig
25, number 4 and 5). Environments with decreasing pressures and increasing temperatures are
observed in the mantle wedge of subduction zone environments (fig 26), and could therefore
indicate an upward migration of the crystallizing of the hornblendite magma within this
environment (Tatsumi et al., 1995). But according to Tatsumi et al (1995) the temperature
range of ~700ºC to ~925ºC are at greater pressure than ~1.1 GPa to ~0.9 GPa. However, as
the isopleth Al2O3 and TiO2- diagram suggests minimum pressures and temperatures,
hornblende could have formed at an earlier stage, in greater pressures and temperatures. The
P/T paths for the pyroxenes (number 1-3) and the metamorphic minerals (number 6) shown in
figure 25 are based on microscopy- and SEM observations, with no actual
geothermobarometry calculations.
According to Shelley (1993), poikilitic textures do not always show the order of
crystallization. Tatsumi et al (1995) indicate another possible scenario where pyroxenes
crystallize after hornblende. Subducted lithosphere sometimes produce a dehydrated reaction
were amphibole, especially hornblende, releases water to form clinopyroxene and garnet. The
released water form buoyancy “hydrous curtains” which in a later stage are a part in the
formation of the trench side volcano chains. This reaction takes place at a maximum pressure
of 3.5 Gpa. But this scenario cannot be excluded even though it does not fit into the
established crystallization sequence described in chapter 5.3.

25
Fig 26. A simplified illustration of a subduction zone environment. The orange to red area illustrate the mantle
wedge region. An area similar to this, with slightly different temperature intervals in the mantle wedge region,
could possibly have been the host for an upward migration of hornblendite magma in the Proterozoic eon.
Illustration reproduced from Tatsumi et al., 1995.
5.6 Further investigations
Considering the low number of investigated samples in this thesis, future work should include
a greater number of samples to achieve more satisfying conclusions. Additional and more
thorough work in the SEM could result in well calculated geothermometers and
geobarometers of the pyroxenes. This would be of great interest regarding the origin of the
samples. Additional work in the SEM, as well as a greater number of samples, would also
give a more accurate statistical result than presented in this thesis.

26
6. Conclusion Three samples were collected from a hornblendite body in the Routevare Anorthosite
Complex (RAC) located in the Northern part of the Swedish Caledonides. The samples are of
ultramafic composition and can be classified as hornblendite (L78:79) and pyroxene
hornblendite (L78:81 and L84:25). Considering the undeformed and massive texture,
observed both in hand samples and microscopy, magmatic origin is very likely. The
established crystallization sequence (fig 23) generally agreeing with Bowen’s reaction series
is mainly based on observations of enclosed minerals and exsolution textures. Secondary
minerals suggest later retrogressive metamorphic event/events.
Results from the spider diagram indicate a possible tectonic setting of a subduction zone
magma generated by the transport of fluid- soluble elements into the mantle wedge region, but
this assumption should be taken with great care due to the deviating concentrations of Ta and
Nb.
The mineral assemblage of clinopyroxenes and spinels indicate a minimum crystallization
temperature and pressure of 1440° and 3Gpa to 1480° and 2 Gpa.
Exsolution of ilmenite ”needles” in the hornblende suggest decreasing pressures ~1.1 to ~0.9
GPa and increasing temperatures ~700ºC to ~925ºC. Areas with decreasing pressures and
increasing temperatures, just like the hornblendite magma mentioned above, are observed in
subduction related mantle wedge regions.
7. Acknowledgment I especially would like to thank my supervisor, Associate Professor Lennart Björklund for
samples, guidance and support. Ali Froozan and PhD Karin Appelqvist made the SEM-work
possible, thank you for your patience. My eyes and brain spent many hours examining thin
sections and I had several interesting and giving discussions with PhD Johan Hogland and
Professor Rob Hellingwerf in the optical microscopy facility. Finally I would like to thank
Linn Karlsson for her patience and support.
27
8. References Ashwal D., 1993, Anorthosites., Springer Verlag, 350pp
Blatt H., Tracy R.J., Owens B.E., 2006, Petrology – Igneous, Sedimentary and Metamorphic,
Third edition., W.H. Freeman and Company New York, 530pp.
Björklund L., 1994, The Routevare Anorthosite Complex a Fe-Ti massif type differentiated
complex, N. Swedish Caledonides. Abstr. 21:a Nordiska Geologiska Vintermötet, Luleå 1994
Björklund L., Stigh J., 1992, The Routevare Anorthosite Complex - a Fe-Ti massif type
differentiated complex, N. Swedish Caledonides. Abstr. IGCP-290 Conference 1-6 June 1992
in Rogaland, Norway. C.E.R.M., Université du Québec à Chicoutimi, Second Newsletter -
Summer 1992, 4.
Björklund L., Personal comments.
Boynton W.V., 1984, Geochemistry of the rare earth elements: meteorite studies. In:
Henderson P. (ed), Rare earth element geochemistry. Elsevier, pp. 63-114.
Cox K.G., Bell J.D. and Pankhurst R.J., 1979, The interpretation of igneous rocks. George.
Allen and Unwin, London, 450pp.
De la Roche H., Leterrier J., Grande Claude P. and Marchal M., 1980, A classification of
volcanic and plutonic rocks using R1-R2 diagrams and major element analyses – its
relationships and current nomenclature. Chemical Geology, 29, 183-210.
Deer W.A., Howie R.A., J. Zussman., 1997, Rock Forming Minerals, Double Chain Silicates
– Second edition. The Geological Society, Vol 2B, 234, 242-269.
Ernst W.G., Liu J., 1998, Experimental phase – equalibrium study of Al – and Ti – contents of
calcic amphibole in MORB – A semiquantitative thermobarometer, American Mineralogist,
Vol 68, 952-969.
Farbtafel nach Michel-Levy, herausgegeben von Carl Zeiss
Fredén K., 2002, Berg och Jord – Sveriges Nationalatlas. Kartförlaget., 22
www.serc.carleton.edu/research_education/equilibria/mineralformulaerecalculation.html,
2009-05-14
Le Maitre R.W., 1989, A classification of igneous rocks and glossary of terms. Blackwell
Scientific Publications., 193pp.
Markl G., Frost R.B., Bucher K., 1998, The origin of Anorthosites and Related Rocks from
the Lofoten Islands, Northern Norway: I. Filed Relations and Estimations of Intrinsic
Variables, Journal of Petrology, Vol 39, 1425-1452.
Mongkoltip P., Ashworth J.R., 1983, Exsolution of ilmenite and rutile in hornblende,
American Mineralogist, Vol 68, 143-155.

28
Nesse W.D., 2000, Introduction to Mineralogy, Oxford University Press, 442pp.
Orlando A., Conticelli S., Armienti P., Borrini D., 2000, Experimental study on a basanite
from the McMuro Volcanic Group, Antarctica: inference on its mantle source, Antarctic
Science, Vol 12 (1), 105-116
Pearce J.A., 1983, Role of sub-continental lithosphere in magma genesis at active continental
margins. In: Hawkesworth C.J. and Norray M.J. (eds.), Continental basalts and mantle
xenoliths. Shiva, Nantwich, 230-249
Rehnström E.F., 2003, Geochronology and petrology of the Tielma Magmatic Complex,
northern Swedish Caledonides – results and tectonic implications. Norwegian Journal of
Geology, Vol. 83, 243-257.
Roberts D. & Gee D.G., 1985, An introduction to the structure of the Scandinavian
Caledonides. In D. G. Gee & B. A. Sturt (eds.): The Caledonide Orogen — Scandinavia and
Related Areas. John Wiley & Sons, Chichester., 55-68.
Rollinson H., 1993, Using geochemical data – evaluation, presentation, interpretation.
Pearson Educational Limited., 352pp.
Shelley D., 1993, Igneous and Metamorphic rocks under the microscope. Chapman and Hall.,
445pp.
Tatsumi Y., Ehhins S., 1995, Subduction zone magmatism., Blackwell Science,135pp.
Wenk H.R., Bulakh A., 2004, Minerals – Their constitution and origin., Cambridge
University Press, 646pp.
Wilson M., 1989, Igneous Petrogenisis – A Global tectonic approach., Kluwer Academic
Publishers, 466pp.

Appendix 1
Geochemical data from SEM, major elements, all values in wt%
Pyroxene
Site 21
P.Lamell
Site 21
Hbl
Site
12
Hbl+
ilmenite
Site 19
Spinel
1 Site
26
Spinel
2 Site
27
Hbl
Site
29
Hbl+
ilmenite
Site 29
Ilmenite
Site 19
Spinel
Site 35
Specturm
1
Cpx Site
35
Specturm
2
Hbl Site
35
Spectrum
3
Opx/cpx
Site 35
Spectrum
4
Hbl Site
48
Spectrum
1
Ilmenite
Site 48
Spectrum
2
Titanite
Site 48
Spectrum
3
Na2O 0,37 0,15 1,83 2,13 1,40 0,71 2,12 2,06 0,25 0,82 0,43 2,09 0,26 2,10 0 0
MgO 12,84 21,55 13,23 13,5 11,30 8,22 13,25 13,13 2,61 10,31 13,90 13,87 19,41 12,62 0,31 0
Al2O3 7,07 5,54 11,36 14,34 57,11 56,19 14,74 13,62 1,07 53,66 5,22 14,95 4,87 12,91 0 0,93
SiO2 46,65 48,19 42,86 39,81 0 0,12 39,58 38,64 2,3 3,74 48,06 41,57 49,43 40,97 1,09 29,16
P2O5 0 0 0 0 0 0,19 0 0 0 0 0 0 0 0 0 0
SO3 0 0 0 0 0 0 0 0,13 0 0 0 0 0 0 0 0
K2O 0 0 0,62 0,75 0 0 0,69 0,73 0 0 0 0,06 0 0,79 0 0
CaO 23,68 1,5 13,25 12,37 0 0 12,34 11,89 1,02 1,39 23,43 13,8 10,58 11,85 1,79 28,23
TiO2 1,07 0,11 0,82 2,82 0 6,72 0,82 2,82 48,66 0 0,7 0,38 0,31 0,83 48,53 38,90
CrO3 0 0 0,22 0 0,21 0,11 0 0 0 0,67 0 0 0 0,13 0 0
MnO 0 0,67 0,17 0 0,33 0,2 0,11 0,15 0,87 0,34 0,14 0,11 0,53 0,19 1,26 0
Fe2O3 6,95 21,94 12,82 12,97 27,06 24,58 12,03 12,91 48,01 29,09 3,03 10,29 16,31 13,15 50,70 0,75
Total 98,63 99,75 97,18 98,69 97,06 97,05 95,69 96,09 104,8 100,03 97,93 97,12 101,69 95,54 103,68 97,96

Appendix 2
Whole rock analysis, all values in wt%
SiO2 TiO2 Al2O3 FeO Fe2O3 MnO MgO CaO Na2O K2O P2O5 CO2 F S
L78:79 44.5 1.12 9.05 2.51 7.37 0.15 12.5 15.7 1.26 0.4 0.003 0 0 2.54
L78:81 40.0 1.55 13.3 6.52 8.35 0.15 11.4 14.7 1.04 0.27 0.002 0 0 1.0

Appendix 3
Hornblende comparisons, all values in wt%