Embed Size (px)
Citation preview

(12) United States PatentSridhar et al.
(54) AIR TRAFFIC MANAGEMENT EVALUATIONTOOL
(75) Inventors: Banavar Sridhar, Los Altos, CA (US);Kapil S. Sheth, Campbell, CA (US);Gano Broto Chatterji, Sunnyvale, CA(US); Karl D. Bilimoria, San Jose, CA(US); Shon Grabble, San Jose, CA (US);John E. Schipper, Palo Alto, CA (US)
(73) Assignee: The United States of America asrepresented by the NationalAeronautics and Space Administration(NASA), Washington, DC (US)
(*) Notice: Subject to any disclaimer, the term of thispatent is extended or adjusted under 35U.S.C. 154(b) by 1314 days.
(21) Appl. No.: 10/914,783
(22) Filed: Jul. 30, 2004
(51) Int. Cl.G05D 1108 (2006.01)
G06G 7/70 (2006.01)G05D 1106 (2006.01)
(52) U.S. Cl . ....................... 701/4; 701/3; 701/5; 701/6;701/8; 701/14; 701/15; 701/16; 701/18
(58) Field of Classification Search ..................... 701/3,701/120, 121, 122, 300, 301
See application file for complete search history.
(56) References Cited
U.S. PATENT DOCUMENTS
2004/0024528 Al * 2/2004 Patera et al . ................ 701/301
OTHER PUBLICATIONS
Bilimoria, et al., FACET: Future ATM Concepts Evaluation Tool, 3rdUSA/Europe Air Traffic Management R & D Seminar, Jun. 13-16,2000, 1-10, Napoli, Italy.
(lo) Patent No.: US 7,702,427 B1(45) Date of Patent: Apr. 20, 2010
Bilimoria, A Geometric Optimization Approach to Aircraft ConflictResolution, AIAA Guidance, Navigation and Control Conferenceand Exhibits, Aug. 14-17, 2000, 1-11, Denver, Colorado.
Bilimoria, et al, Performance Evaluation of Airborne SeparationAssurance for Free Flight, AIAA Guidance, Navigation, and ControlConference and Exhibits, Aug. 14-17, 2000, 1-9, Denver, Colorado.
Bilimoria, et al., FACET: Future ATM Concepts Evaluation Tool, AirTraffic Control Quarterly, 2001, 1-20, 9-1.
Chatterji, et al., En-route Trajectory Prediction for Conflict Avoid-ance and Traffic Management, AIAA, Guidance, Navigation andControl Conference, Jul. 29-31, 1996, San Diego California, AIAA,Inc.
(Continued)
Primary Examiner Khoi TranAssistant Examiner Bhavesh V Amin(74) Attorney, Agent, or Firm John F. Schipper; Robert M.Padilla
(57) ABSTRACT
Method and system for evaluating and implementing air traf-fic management tools and approaches for managing andavoiding an air traffic incident before the incident occurs. Theinvention provides flight plan routing and direct routing orwind optimal routing, using great circle navigation andspherical Earth geometry. The invention provides for aircraftdynamics effects, such as wind effects at each altitude, alti-tude changes, airspeed changes and aircraft turns to providepredictions of aircraft trajectory (and, optionally, aircraft fueluse). A second system provides several aviation applicationsusing the first system. These applications include conflictdetection and resolution, miles-in trail or minutes -in-trail air-craft separation, flight arrival management, flight re-routing,weather prediction and analysis and interpolation of weathervariables based upon sparse measurements.
12 Claims, 12 Drawing Sheets
WEATHER
^n
FLIGHT DECK-
^11
N.O.AA. BASEDCON"& BANK ANGLE LIMITS LATITUDE LONGITUDEDEFECTIONAND RESOLUTION 31 33 41 43
HEADING
21AND TRAJECTORY WIND ROUTE COMMAND HEADING HEADING LATITUDE d LONGITUDE GRAI
MODELER DATA NAVIGATION DYNAMICS KINEMATICS(LLK) INFLIGHT
PLANS ANDDIRECT-TOROUTING COORDINATES OF;
POSITIONS 13 DESTINATION POINT (DR) FLIGHT-PATHE.T.MS. AIRSPEED ALTITUDE OR ANGLEWAYPOINT(FPR)
23 47 AIRSPEED ALTITUDE 49
C^)
35 37 DYNAMICS KINEMATICSAIR AND SPACE
CLIMBUISE,
TRAFFIC DIRECT DESTINATION FLIGHT PLAN FLIGHT PLAN AlRSPEED ALTITUDEAIRC SCEND
15 INTEGRATION ROUTING ROUTINGMAND
COMMAND COMMANDaAPERFORD
FPRAND COMPERE.
DATA39 40 DIRECT ROUTING
LIMITS LIMITS
INTERFACE DATABASEOPTION
OR AIRCRAFT25 EVUATIOEVALUATION LOGIC FLIGHT PLAN ROUTING PERFORMANCE
CENTERS, AIRCRAFT TYPESECTORS, 17 AND
FLIGHTAIRWAYSAIRPORT§
PLANNEDALTITUDE
ADAPTATION SYSTEM-WIDE TRACK, PERFORMANCEDATABASE
OPTIMIZATION FLIGHT PLANAND
Z7SC HEDULE
DATA
https://ntrs.nasa.gov/search.jsp?R=20100024505 2018-06-30T23:17:19+00:00Z

US 7,702,427 B1Page 2
OTHER PUBLICATIONS
Erzberger, et al., Direct-To Tool for En Route Controllers, IEEEWorkshop on Advance Technologies and Their Impact on Air TrafficManagement in the 21 st Century, Sep. 26-30, 1999, 1-14, Capri, Italy.Sridhar, et al Airspace Complexity and its Application in Air TrafficManagement, 2nd USA/Europe Air Traffic Management R & DSeminar, Dec. 1-4, 1998, Orlando, Florida.Sridhar, et al., Benefits of Direct-To Tool in National Airspace Sys-tem, AIAA Guidance Navigation, and Control conference and Exhib-its, Aug. 14-17, 2000, Denver Colorado, AIAA.
Sridhar, et al., Benefits of Direct-to-Tool in National Airspace Sys-tem, IEEE Transactions on Intelligent Transportation Systems, Dec.2000, 190-198, 1-4, IEEE.Sridhar, et al., Integration of Traffic Flow Management Decisions,AIAA Guidance, Navigation, and Control Conference and Exhibit,Aug. 5-8, 2002, Monterey, California, AIAA, Inc.Sridhar, Facet-Future ATM Concepts Evaluation Tool, NASA on theWeb, www.asc.nasa.gov/aatt;facet.htn 1, Oct. 2003.
* cited by examiner
21
N.O.AA.
E.T.M.S.
WEATHER
ROUTE PARSER'AND TRAJECTORY
MODELERFLIGHT
PLANS ANDPOSITIONS 13
FLIGHT DECK-BASED CONFLICT
DETECTIONAND RESOLUTION
DIRECT-TOROUTING
USERINTERFACE
17
AIR AND SPACETRAFFIC
INTEGRATION
PLAY BOOKEVALUATION
SYSTEM-WIDEOPTIMIZATION
CLIMB,
AIRCRAFTCRUISE,
DESCENDPERFORMANCE
DATABASE
25
CENTERS,SECTORS,AIRWAYS,
FLIGHT AIRPORTSADAPTATION
U.S. Patent Apr. 20, 2010
Sheet 1 of 12
US 7,702,427 B1
A/,--11
TRAFFICANALYZER
27
Fig. 1
c7
g C7z
Z MMILFE M w
LL.CD O
^^Jaw
ZQ ° _Od LL-
S st
C7JLL z
O^O O
QzF-w rnO M
'
rLLwzw
^ < wwv -1Oz^Op Q U Qr^W
Q Y .e1
U_W
dU Z}
Q°C3 C)
WQWF_q- ga
QOOZ
WhULZ Z
^QU OQw
a-
W
W °CL MF--
LL Qg<0°WU ZZQ g
a
U.S. Patent Apr. 20, 2010 Sheet 2 of 12 US 7,702,427 B1
OW ^° W O Z_
QZof 0^O -^
OaQ
M Oz0 . XO C) in
F_ <P= LLI ° Z00 -
Cif Q
Z
wWwM UQ ^U ^= Wd ~
W z°
F=-O
UZOJ
W°E-
cn W
J M YJ
Z vO cnJ H
^2S Qwg°wF— Y
Z
W —
J cnZJ Z°Q ^QYZ
oQ0
WU WZ N^mOwo
z WQ J
U ~ z W Qg m Q U °U
W°HJQ
SF-
a^SZC7 QJW
°WWdcnwQ
Z H Ur W WN ^o wF amM Wo°
LL
°^ ao
U.S. Patent Apr. 20, 2010 Sheet 3 of 12
US 7,702,427 B1
Y
'b
It
FIG. 3
-Va,uncomp. -Va, co m p
_vW
5 Ow0 c,comp
^l
North
X
FIG. 4
U.S. Patent Apr. 20, 2010 Sheet 4 of 12 US 7,702,427 B1
A,
^ kA
1
$ - N rOf
^ - • 'jam •^ '
^' LL1
-' 514
^' r

Fig. 6
U.S. Patent Apr. 20, 2010 Sheet 5 of 12 US 7,702,427 B1
+ v (t-t1)r1,2 +v 1,2(t-t1)
Fig. 7
ral+ _vol(t-to)r 02+ V 02 (t-to)
Fig. 8
U.S. Patent Apr. 20, 2010 Sheet 6 of 12 US 7,702,427 B1
x LOS Fig. 9
3
Fig. 10
U.S. Patent Apr. 20, 2010 Sheet 7 of 12 US 7,702,427 B1
FIG. 11
FIG. 12
U.S. Patent
Apr. 20, 2010 Sheet 8 of 12 US 7,702,427 B1
En Route o 0Sectors to ^
Congested oN\
o\`-_ ______________ O Q
olo <0000
110000 X000
400012000 `,
1000 ,2000
0000 8000
30
28
L0 26C-
a)
°- 24
Of 222LCU 20
° 180
a 16014
12
1010 12 14 16 18 20 22 24 26 28 30
EWR Airport Departure Rate (per hour)
Fig. 13
U.S. Patent Apr. 20, 2010 Sheet 9 of 12 US 7,702,427 B1
141RECORD DATA
ActiveFlight PlansTracks
Pr000sed
Flight Plans ^-
145
RFDB
151
2
1
NAS Constraints
PlaybookGS/GDPMIT/MINIT
Local RerouteSectorizationDep. Restriction
Select147 Yes
Live Mode NoSimulation Playback?Playback
149
Modi
RouteDep. TimeSpeed 1
HeadingAltitudeDestination
5^152
ModiNAS onstraints
Fig. 14A
4
6
3
U.S. Patent Apr. 20, 2010 Sheet 10 of 12 US 7,702,427 B1
00q:zl-r
LL
C"r' C
O
U 'a N
1-- cacv to
EM2 0 o C7 ^ f-0^1
L M
NNT
(/) ^ 0
co
co 0T
cu
00C"U
io
Ua)^i allo
i
cn L- E^
d LC6
OL dOp0a
V(0
TOca¢a0
Ud-
LL
U.S. Patent Apr. 20, 2010 Sheet 11 of 12
US 7,702,427 B1
OCDT
T Wi000 C 0
CS U^+ c v v C) Q d O
cc o 00UUca -c^ E (
0
UU^QQ
0 i u-UF- d
CUUcuCL CL CC
o c-aQ Q ^
c
m 0U_
^ Z o n9 a`"i?^^-off
.7L^J(n0
cn ^
r-A coT C
0 0
CL 10 c -'Z'A
^0U)3:<0
T

6
201
Additional YesFlights NeedModification ?
No
Modify
RouteDep. TimeSubstitute FlightCancel Flight
U.S. Patent
Apr. 20, 2010
Sheet 12 of 12
US 7,702,427 B1
GenerateUser Decision 9Data ^
No
203
AdditionalYesNAS Constraints
NeedModification ?
Fig. 14D
Propose ModifiedNAS Constraints 10
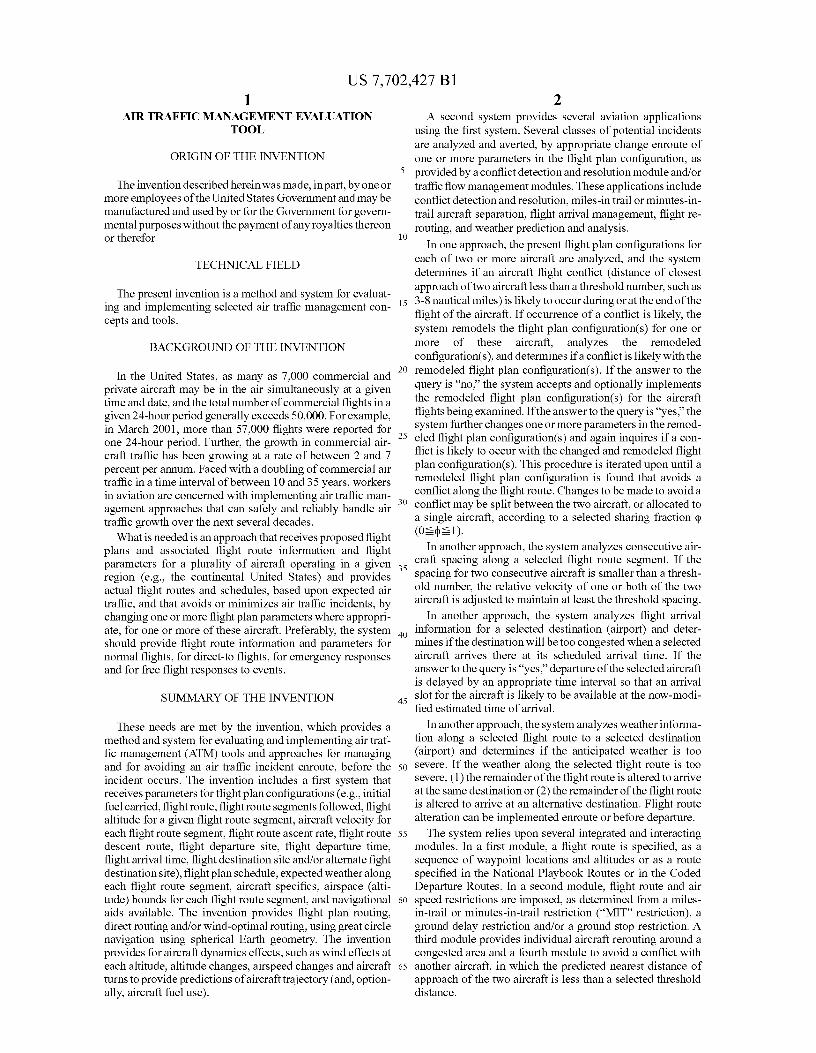
US 7,702,427 B11
AIR TRAFFIC MANAGEMENT EVALUATIONTOOL
ORIGIN OF THE INVENTION
The invention described herein was made, inpart, by one ormore employees of the United States Government and may bemanufactured and used by or for the Government for govern-mental purposes without the payment of any royalties thereonor therefor.
TECHNICAL FIELD
The present invention is a method and system for evaluat-ing and implementing selected air traffic management con-cepts and tools.
BACKGROUND OF THE INVENTION
In the United States, as many as 7,000 commercial andprivate aircraft may be in the air simultaneously at a giventime and date, and the total number of commercial flights in agiven 24-hour period generally exceeds 50,000. For example,in March 2001, more than 57,000 flights were reported forone 24-hour period. Further, the growth in commercial air-craft traffic has been growing at a rate of between 2 and 7percent per annum. Faced with a doubling of commercial airtraffic in a time interval of between 10 and 35 years, workersin aviation are concerned with implementing air traffic man-agement approaches that can safely and reliably handle airtraffic growth over the next several decades.
What is needed is an approach that receives proposed flightplans and associated flight route information and flightparameters for a plurality of aircraft operating in a givenregion (e.g., the continental United States) and providesactual flight routes and schedules, based upon expected airtraffic, and that avoids or minimizes air traffic incidents, bychanging one or more flight plan parameters where appropri-ate, for one or more of these aircraft. Preferably, the systemshould provide flight route information and parameters fornormal flights, for direct-to flights, for emergency responsesand for free flight responses to events.
SUMMARY OF THE INVENTION
These needs are met by the invention, which provides amethod and system for evaluating and implementing air traf-fic management (ATM) tools and approaches for managingand for avoiding an air traffic incident enroute, before theincident occurs. The invention includes a first system thatreceives parameters for flight plan configurations (e.g., initialfuel carried, flight route, flight route segments followed, flightaltitude for a given flight route segment, aircraft velocity foreach flight route segment, flight route ascent rate, flight routedescent route, flight departure site, flight departure time,flight arrival time, flight destination site and/or alternate fightdestination site), flight plan schedule, expected weather alongeach flight route segment, aircraft specifics, airspace (alti-tude) bounds for each flight route segment, and navigationalaids available. The invention provides flight plan routing,direct routing and/or wind-optimal routing, using great circlenavigation using spherical Earth geometry. The inventionprovides for aircraft dynamics effects, such as wind effects ateach altitude, altitude changes, airspeed changes and aircraftturns to provide predictions of aircraft trajectory (and, option-ally, aircraft fuel use).
2A second system provides several aviation applications
using the first system. Several classes of potential incidentsare analyzed and averted, by appropriate change enroute ofone or more parameters in the flight plan configuration, as
5 provided by a conflict detection and resolution module and/ortraffic flow management modules. These applications includeconflict detection and resolution, miles-in trail or minutes-in-trail aircraft separation, flight arrival management, flight re-
to routing, and weather prediction and analysis.In one approach, the present flight plan configurations for
each of two or more aircraft are analyzed, and the systemdetermines if an aircraft flight conflict (distance of closestapproach of two aircraft less than a threshold number, such as
15 3-8 nautical miles) is likely to occur during or at the end of theflight of the aircraft. If occurrence of a conflict is likely, thesystem remodels the flight plan configuration(s) for one ormore of these aircraft, analyzes the remodeledconfiguration(s), and determines if a conflict is likely with the
20 remodeled flight plan configuration(s). If the answer to thequery is "no," the system accepts and optionally implementsthe remodeled flight plan configurations) for the aircraftflights being examined. If the answer to the query is "yes," thesystem further changes one or more parameters in the remod-
25 eled flight plan configurations) and again inquires if a con-flict is likely to occur with the changed and remodeled flightplan configuration(s). This procedure is iterated upon until aremodeled flight plan configuration is found that avoids aconflict along the flight route. Changes to be made to avoid a
30 conflict may be split between the two aircraft, or allocated toa single aircraft, according to a selected sharing fraction(0 _1)-
In another approach, the system analyzes consecutive air-craft spacing along a selected flight route segment. If the
35 spacing for two consecutive aircraft is smaller than a thresh-old number, the relative velocity of one or both of the twoaircraft is adjusted to maintain at least the threshold spacing.
In another approach, the system analyzes flight arrival
40 information for a selected destination (airport) and deter-mines if the destination will be too congested when a selectedaircraft arrives there at its scheduled arrival time. If theanswer to the query is "yes," departure of the selected aircraftis delayed by an appropriate time interval so that an arrival
45 slot for the aircraft is likely to be available at the now-modi-lied estimated time of arrival.
In another approach, the system analyzes weather informa-tion along a selected flight route to a selected destination(airport) and determines if the anticipated weather is too
50 severe. If the weather along the selected flight route is toosevere, (1) the remainder of the flight route is altered to arriveat the same destination or (2) the remainder of the flight routeis altered to arrive at an alternative destination. Flight routealteration can be implemented enroute or before departure.
55 The system relies upon several integrated and interactingmodules. In a first module, a flight route is specified, as asequence of waypoint locations and altitudes or as a routespecified in the National Playbook Routes or in the CodedDeparture Routes. In a second module, flight route and air
60 speed restrictions are imposed, as determined from a miles-in-trail or minutes-in-trail restriction ("MIT" restriction), aground delay restriction and/or a ground stop restriction. Athird module provides individual aircraft rerouting around acongested area and a fourth module to avoid a conflict with
65 another aircraft, in which the predicted nearest distance ofapproach of the two aircraft is less than a selected thresholddistance.
US 7,702,427 B13
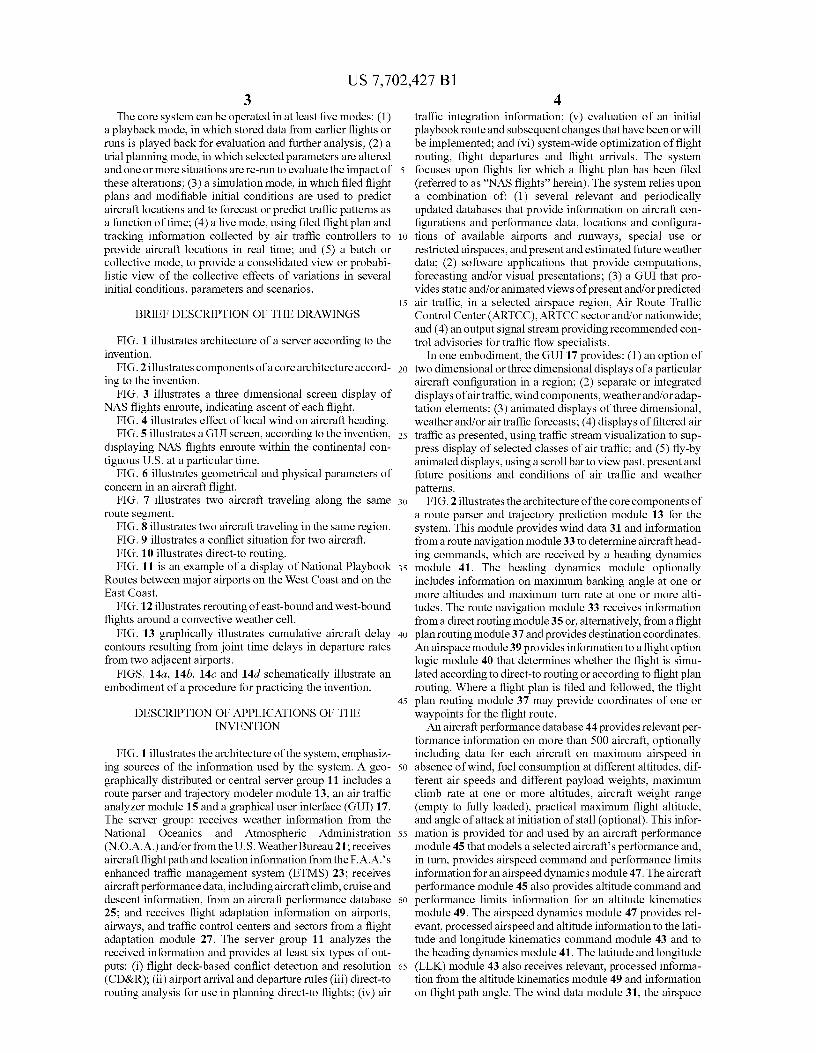
4The core system can be operated in at least five modes: (1)
traffic integration information; (v) evaluation of an initial
a playback mode, in which stored data from earlier flights or playbookroute and subsequent changes that have been or willruns is played back for evaluation and further analysis; (2) a
be implemented; and (vi) system-wide optimization of flight
trial planning mode, in which selected parameters are altered
routing, flight departures and flight arrivals. The systemand one or more situations are re-run to evaluate the impact of 5 focuses upon flights for which a flight plan has been filedthese alterations; (3) a simulation mode, in which filed flight
(referred to as "NAS flights" herein). The system relies upon
plans and modifiable initial conditions are used to predict a combination of: (1) several relevant and periodicallyaircraft locations and to forecast or predict traffic patterns as updated databases that provide information on aircraft con-a function of time; (4) a live mode, using filed flight plan and
figurations and performance data, locations and configura-
tracking information collected by air traffic controllers to io tions of available airports and runways, special use orprovide aircraft locations in real time; and (5) a batch or restricted airspaces, and present and estimated future weathercollective mode, to provide a consolidated view or probabi- data; (2) software applications that provide computations,listic view of the collective effects of variations in several
forecasting and/or visual presentations; (3) a GUI that pro-
initial conditions, parameters and scenarios. vides static and/or animated views of present and/or predicted15 air traffic, in a selected airspace region, Air Route Traffic
BRIEF DESCRIPTION OF THE DRAWINGS
Control Center (ARTCC), ARTCC sector and/or nationwide;and (4) an output signal stream providing recommended con-
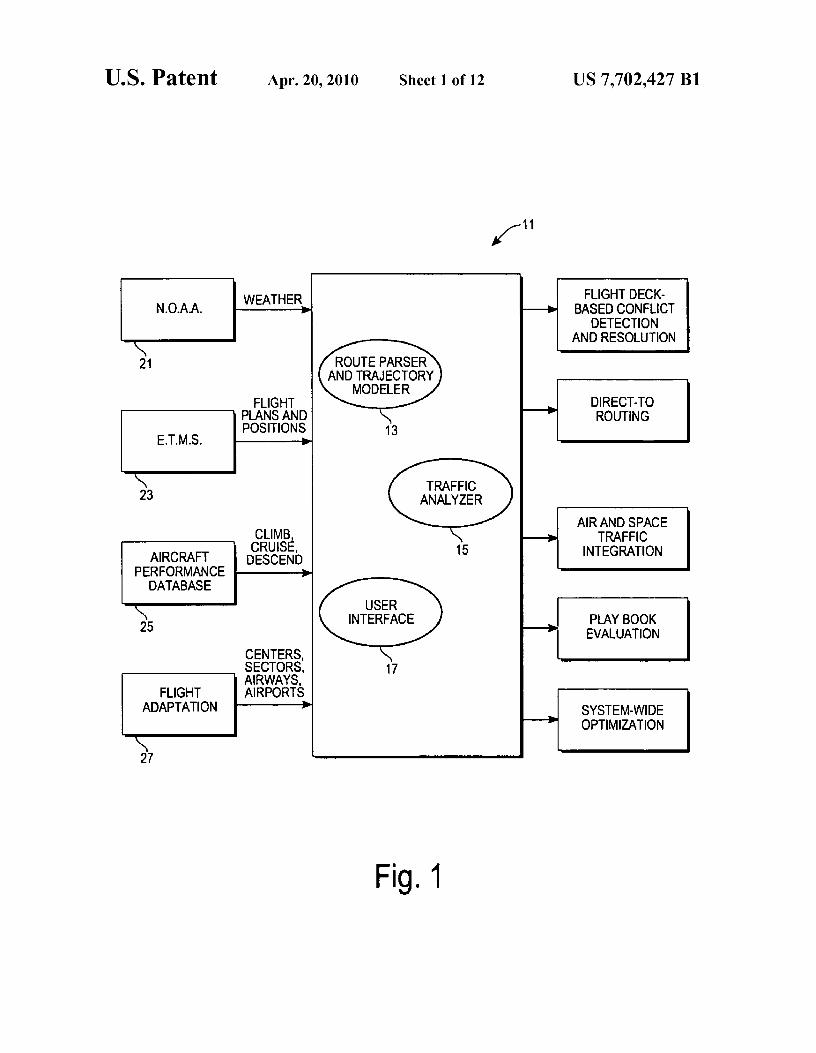
FIG. 1 illustrates architecture of a server according to the trol advisories for traffic flow specialists.invention. In one embodiment, the GUI 17 provides: (1) an option of
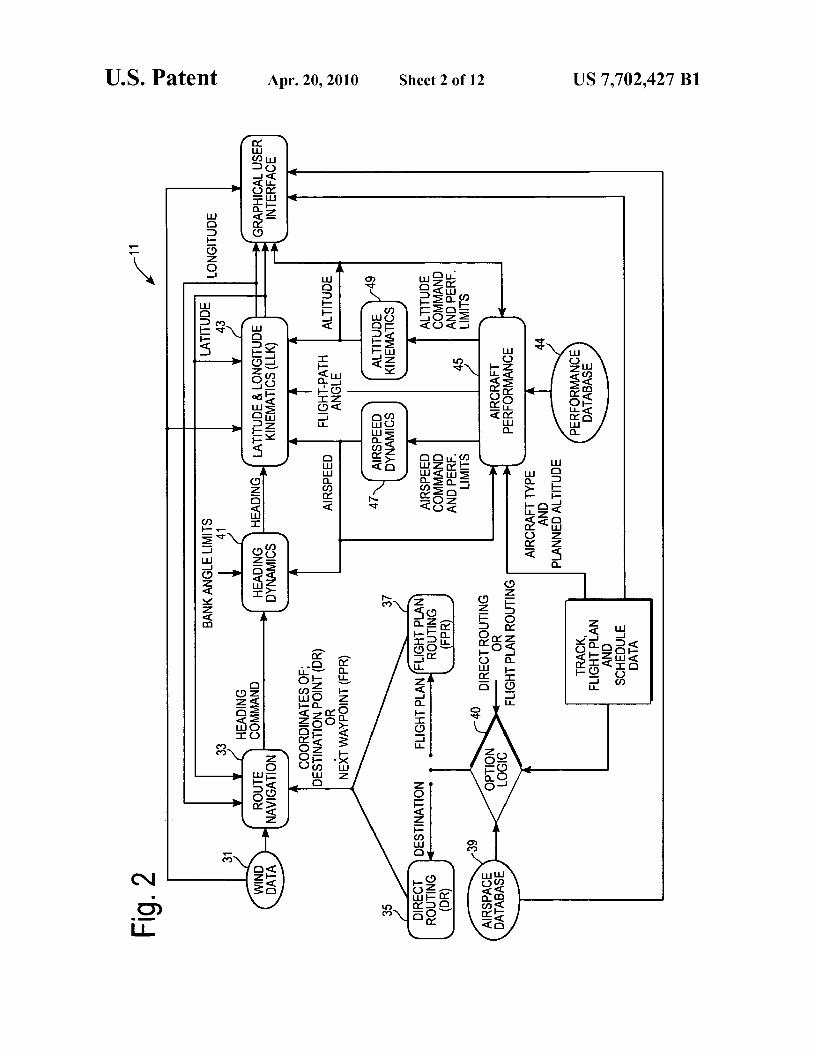
FIG. 2 illustrates components of a core architecture accord- 20 two dimensional or three dimensional displays of a particularing to the invention. aircraft configuration in a region; (2) separate or integrated
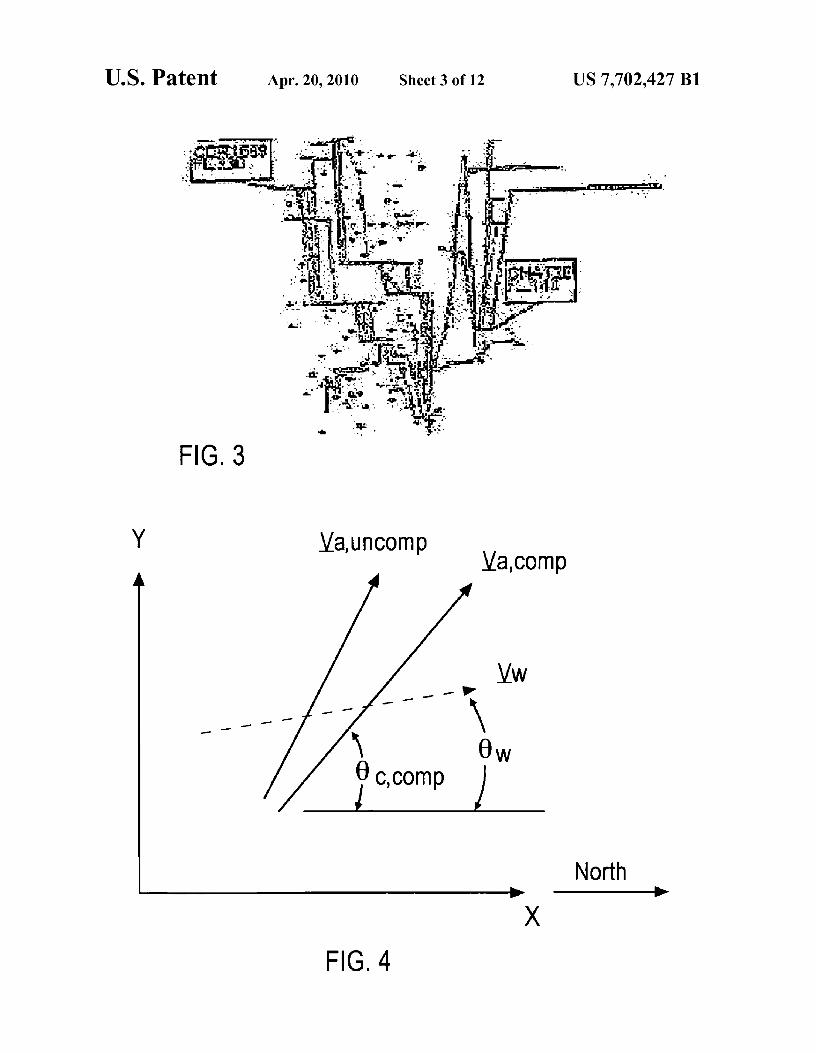
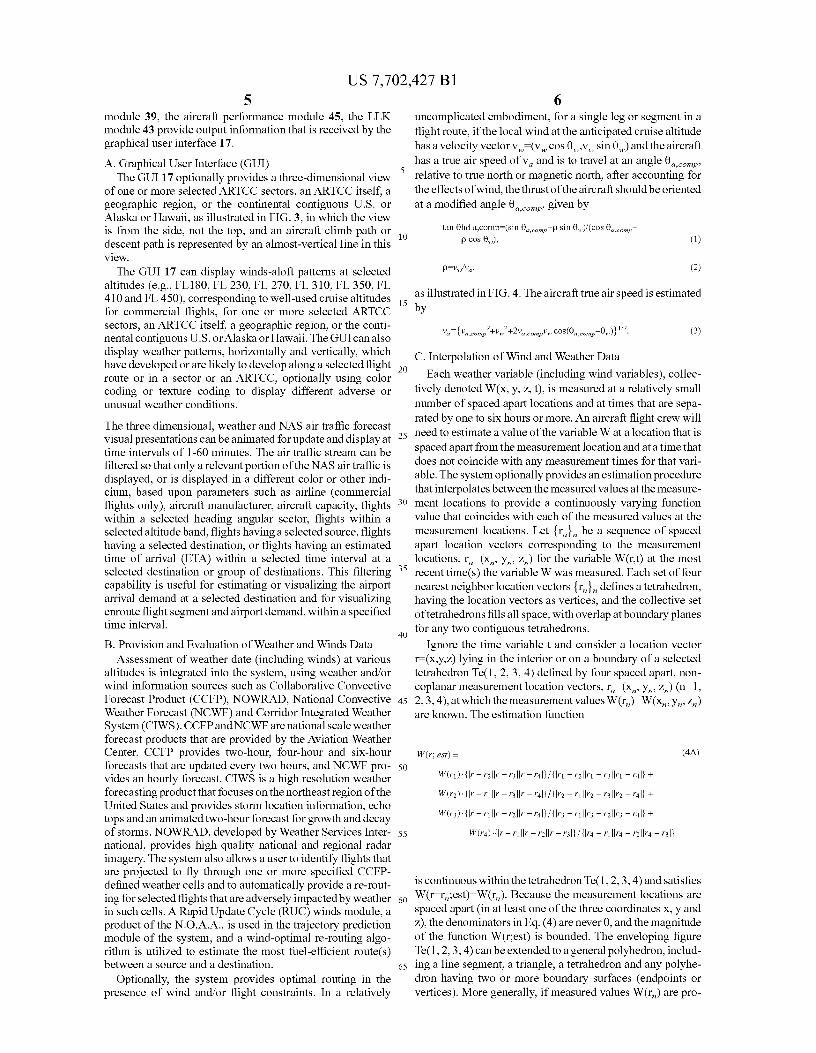
FIG. 3 illustrates a three dimensional screen display of
displays of air traffic, wind components, weather and/or adap-NAS flights enroute, indicating ascent of each flight. tation elements; (3) animated displays of three dimensional,
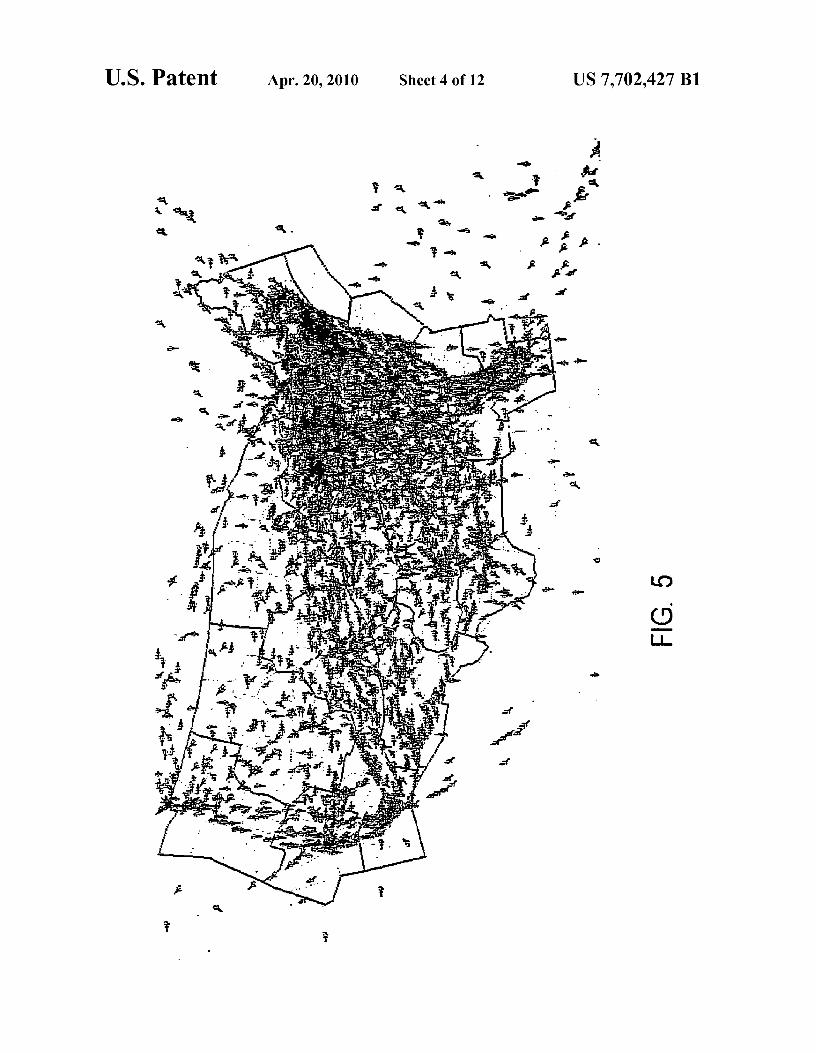
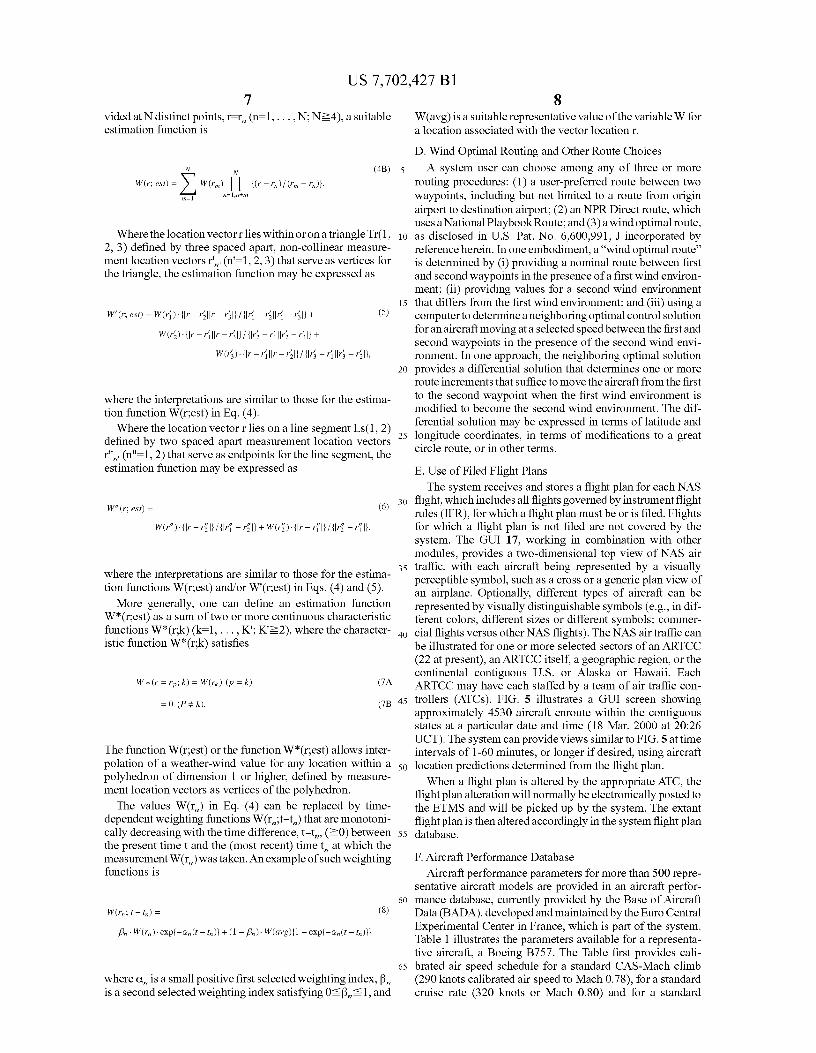
FIG. 4 illustrates effect of local wind on aircraft heading. weather and/or air traffic forecasts; (4) displays of filtered airFIG. 5 illustrates a GUI screen, according to the invention, 25 traffic as presented, using traffic stream visualization to sup-
displaying NAS flights enroute within the continental con- press display of selected classes of air traffic; and (5) fly-bytiguous U.S. at a particular time. animated displays, using a scroll bar to view past, present and
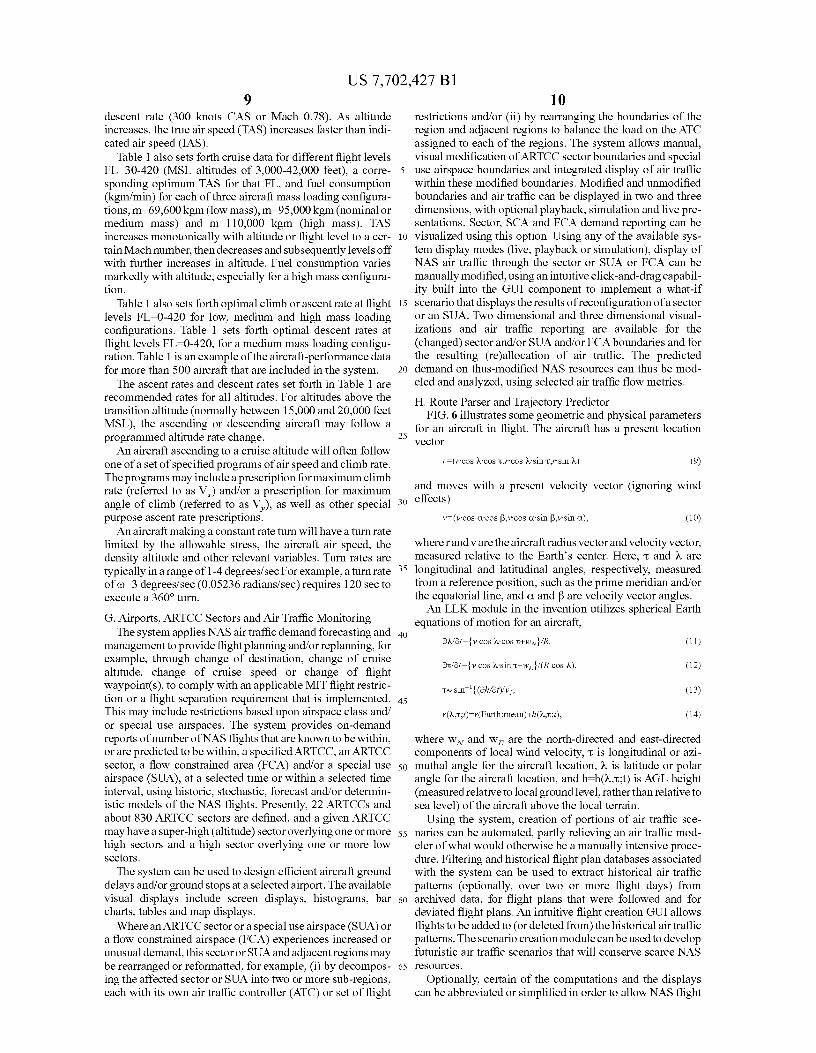
FIG. 6 illustrates geometrical and physical parameters of
future positions and conditions of air traffic and weatherconcern in an aircraft flight. patterns.
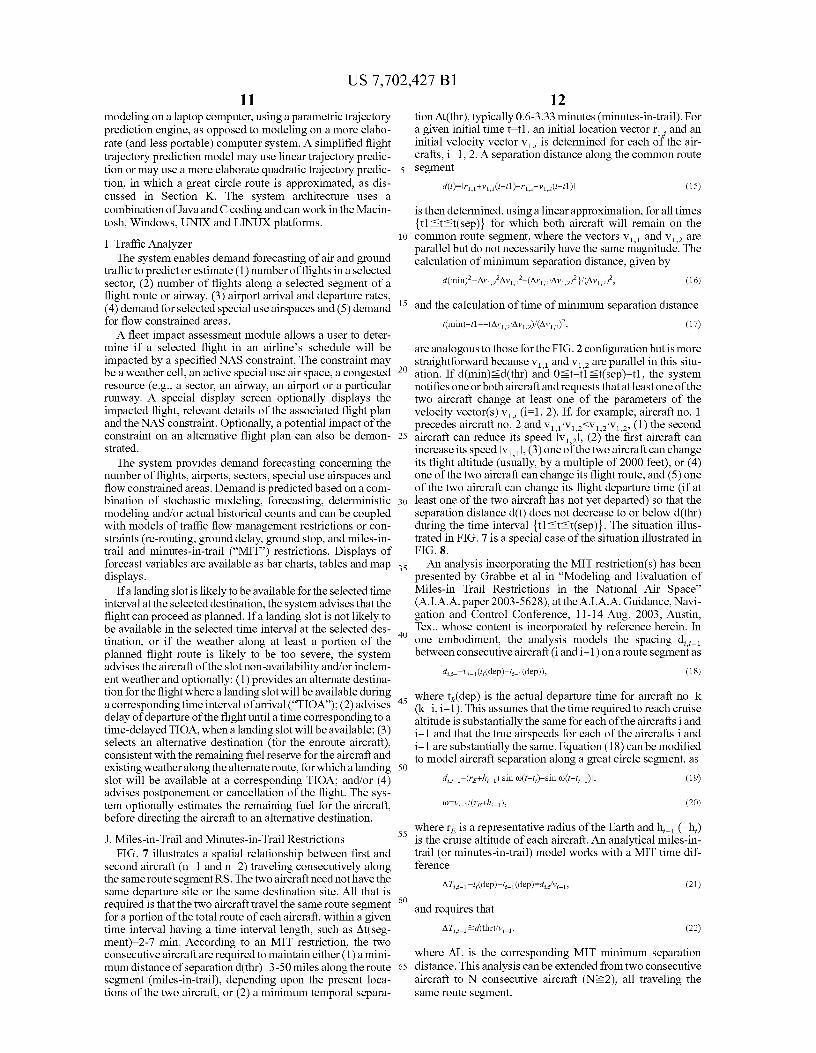
FIG. 7 illustrates two aircraft traveling along the same 30 FIG. 2 illustrates the architecture of the core components ofroute segment. a route parser and trajectory prediction module 13 for the
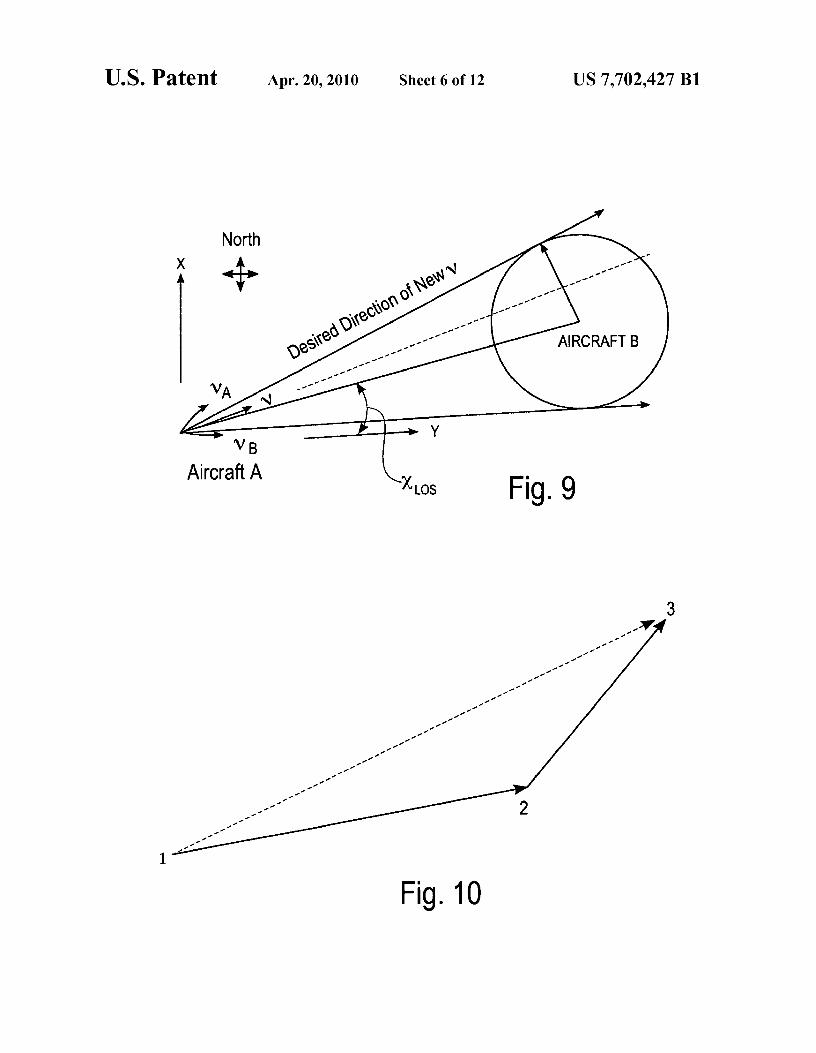
FIG. 8 illustrates two aircraft traveling in the same region. system. This module provides wind data 31 and informationFIG. 9 illustrates a conflict situation for two aircraft. from a route navigation module 33 to determine aircraft head-FIG. 10 illustrates direct-to routing. ing commands, which are received by a heading dynamicsFIG. 11 is an example of a display of National Playbook 35 module 41. The heading dynamics module optionally
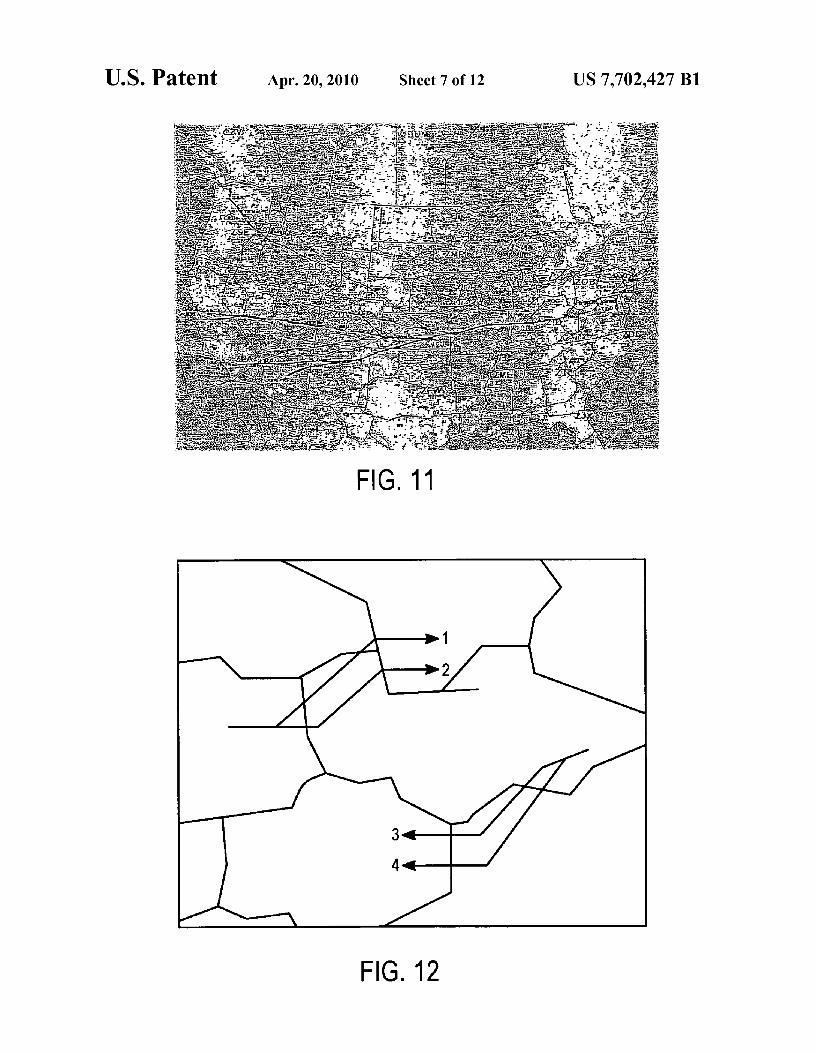
Routes between major airports on the West Coast and on the includes information on maximum banking angle at one orEast Coast. more altitudes and maximum turn rate at one or more alti-
FIG. 12 illustrates rerouting of east-bound and west-bound
tudes. The route navigation module 33 receives informationflights around a convective weather cell. from a direct routing module 35 or, alternatively, from a flight
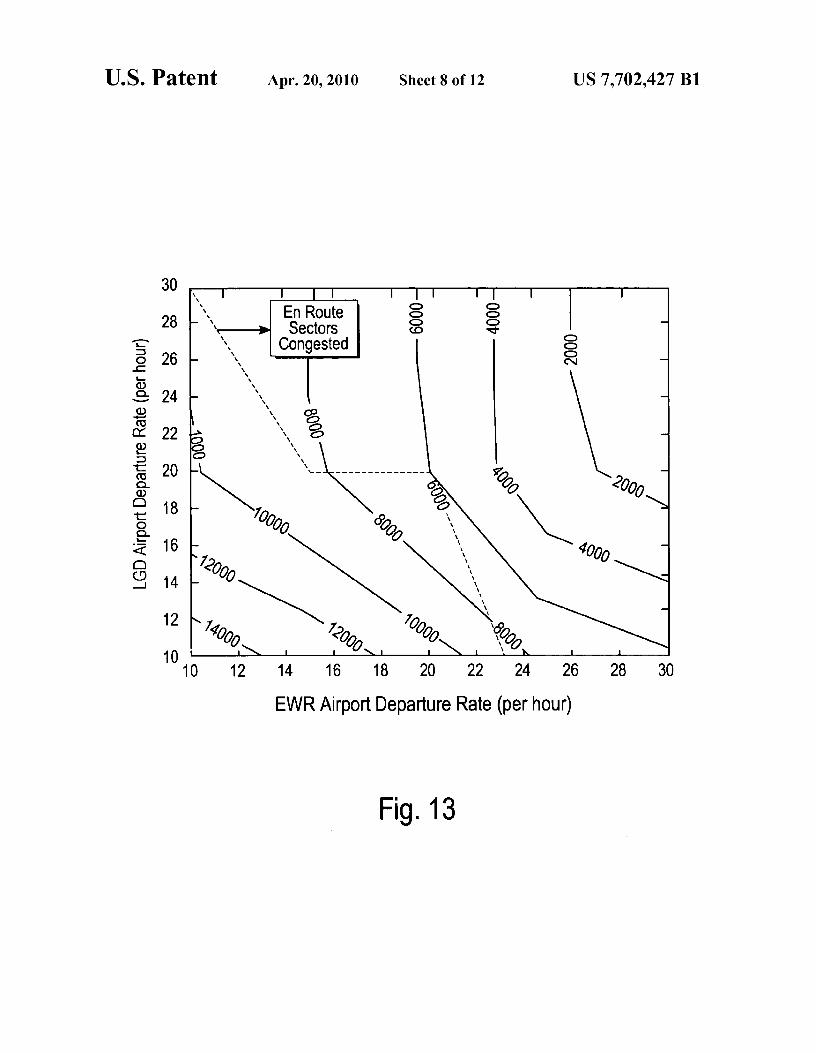
FIG. 13 graphically illustrates cumulative aircraft delay 40 plan routing module 37 and provides destination coordinates.contours resulting from joint time delays in departure rates An airspace module 39 provides informationto a flight optionfrom two adjacent airports. logic module 40 that determines whether the flight is simu-
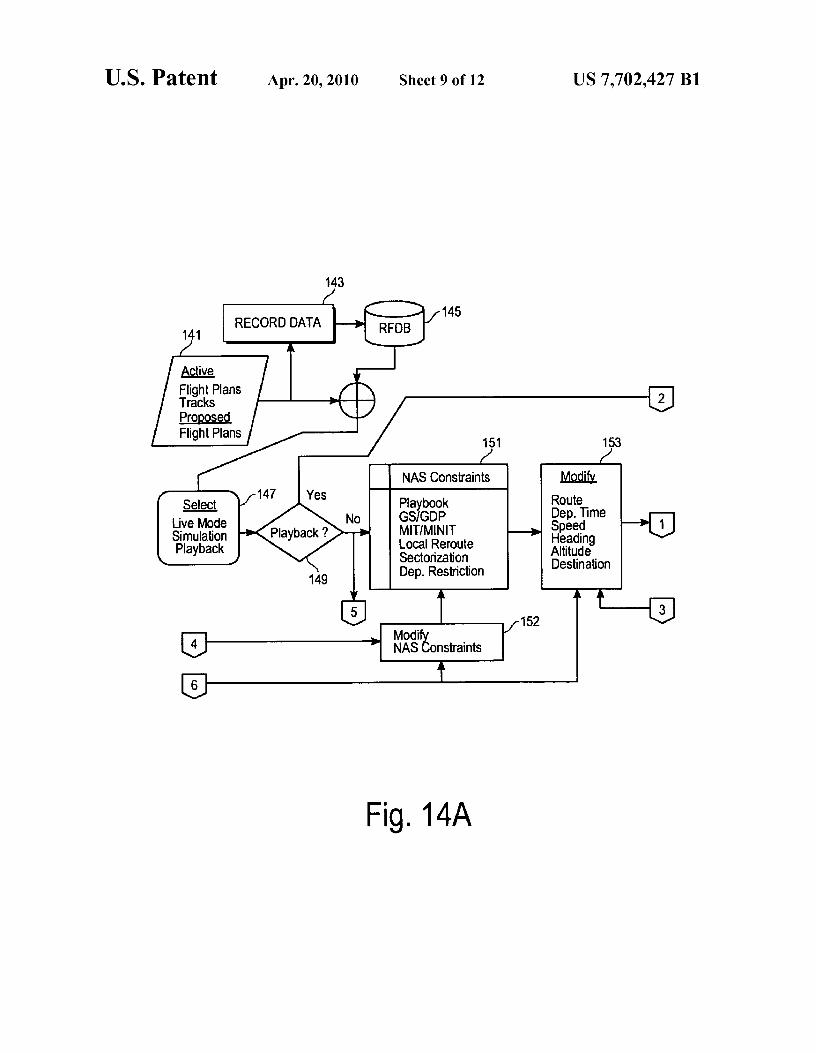
FIGS. 14a, 14b, 14c and 14d schematically illustrate an
lated according to direct-to routing or according to flight planembodiment of a procedure for practicing the invention. routing. Where a flight plan is filed and followed, the flight
45 plan routing module 37 may provide coordinates of one orDESCRIPTION OF APPLICATIONS OF THE waypoints for the flight route.
INVENTION
An aircraft performance database 44 provides relevant per-formance information on more than 500 aircraft, optionally
FIG.1 illustrates the architecture of the system, emphasiz- including data for each aircraft on maximum airspeed ining sources of the information used by the system. A geo- 5o absence of wind, fuel consumption at different altitudes, dif-graphically distributed or central server group 11 includes a
ferent air speeds and different payload weights, maximum
route parser and trajectory modeler module 13, an air traffic climb rate at one or more altitudes, aircraft weight rangeanalyzer module 15 and a graphical user interface (GUI) 17. (empty to fully loaded), practical maximum flight altitude,The server group: receives weather information from the and angle of attack at initiation of stall (optional). This infor-National Oceanics and Atmospheric Administration 55 mation is provided for and used by an aircraft performance(N.O.A.A.) and/or from the U.S. Weather Bureau 21; receives module 45 that models a selected aircraft's performance and,aircraft flight path and location information from the F.A.A.' s
in turn, provides airspeed command and performance limits
enhanced traffic management system (ETMS) 23; receives
information for an airspeed dynamics module 47. The aircraftaircraft performance data, including aircraft climb, cruise and
performance module 45 also provides altitude command and
descent information, from an aircraft performance database 60 performance limits information for an altitude kinematics25; and receives flight adaptation information on airports, module 49. The airspeed dynamics module 47 provides rel-airways, and traffic control centers and sectors from a flight evant, processed airspeed and altitude information to the lati-adaptation module 27. The server group 11 analyzes the tude and longitude kinematics command module 43 and toreceived information and provides at least six types of out- the heading dynamics module 41. The latitude and longitudeputs: (i) flight deck-based conflict detection and resolution 65 (LLK) module 43 also receives relevant, processed informa-(CD&R); (ii) airport arrival and departure rules (iii) direct-to tion from the altitude kinematics module 49 and informationrouting analysis for use in planning direct-to flights; (iv) air on flight path angle. The wind data module 31, the airspace
US 7,702,427 B15
module 39, the aircraft performance module 45, the LLKmodule 43 provide output information that is received by thegraphical user interface 17.
A. Graphical User Interface (GUI)The GUI 17 optionally provides a three-dimensional view
of one or more selected ARTCC sectors, an ARTCC itself, ageographic region, or the continental contiguous U.S. orAlaska or Hawaii, as illustrated in FIG. 3, in which the viewis from the side, not the top, and an aircraft climb path ordescent path is represented by an almost-vertical line in thisview.
The GUI 17 can display winds-aloft patterns at selectedaltitudes (e.g., FL180, FL 230, FL 270, FL 310, FL 350, FL410 and FL 450), corresponding to well-used cruise altitudesfor commercial flights, for one or more selected ARTCCsectors, an ARTCC itself, a geographic region, or the conti-nental contiguous U.S. orAlaska or Hawaii. The GUI can alsodisplay weather patterns, horizontally and vertically, whichhave developed or are likely to develop along a selected flightroute or in a sector or an ARTCC, optionally using colorcoding or texture coding to display different adverse orunusual weather conditions.
The three dimensional, weather and NAS air traffic forecastvisual presentations can be animated for update and display attime intervals of 1-60 minutes. The air traffic stream can befiltered so that only a relevant portion of the NAS air traffic isdisplayed, or is displayed in a different color or other indi-cium, based upon parameters such as airline (commercialflights only), aircraft manufacturer, aircraft capacity, flightswithin a selected heading angular sector, flights within aselected altitude band, flights having a selected source, flightshaving a selected destination, or flights having an estimatedtime of arrival (ETA) within a selected time interval at aselected destination or group of destinations. This filteringcapability is useful for estimating or visualizing the airportarrival demand at a selected destination and for visualizingenroute flight segment and airport demand, within a specifiedtime interval.
B. Provision and Evaluation of Weather and Winds DataAssessment of weather date (including winds) at various
altitudes is integrated into the system, using weather and/orwind information sources such as Collaborative ConvectiveForecast Product (CCFP), NOWRAD, National ConvectiveWeather Forecast (NCWF) and Corridor Integrated WeatherSystem (CIWS). CCFP and NCWF are national scale weatherforecast products that are provided by the Aviation WeatherCenter. CCFP provides two-hour, four-hour and six-hourforecasts that are updated every two hours, and NCWF pro-vides an hourly forecast. CIWS is a high resolution weatherforecasting product that focuses on the northeast region of theUnited States and provides storm location information, echotops and an animated two-hour forecast for growth and decayof storms. NOWRAD, developed by Weather Services Inter-national, provides high quality national and regional radarimagery. The system also allows a user to identify flights thatare projected to fly through one or more specified CCFP-defined weather cells and to automatically provide a re-rout-ing for selected flights that are adversely impacted by weatherin such cells. A Rapid Update Cycle (RUC) winds module, aproduct of the N.O.A.A., is used in the trajectory predictionmodule of the system, and a wind-optimal re-routing algo-rithm is utilized to estimate the most fuel-efficient route(s)between a source and a destination.
Optionally, the system provides optimal routing in thepresence of wind and/or flight constraints. In a relatively
6uncomplicated embodiment, for a single leg or segment in aflight route, if the local wind at the anticipated cruise altitudehas a velocity vector vw(vw cos 0_,vw sin 0_) and the aircrafthas a true air speed of va and is to travel at an angle 0,,,omP,
5 relative to true north or magnetic north, after accounting forthe effects of wind, the thrust of the aircraft shouldbe orientedat a modified angle 0, ,,omP, given by
tan 0hd a,comp=(sin 0a,oPp sin 0w)/(cos 0a,,10 p Cos 0w), (1)
vv„ /V_ (2)
as illustrated in FIG. 4. The aircraft true air speed is estimated15 by
v,— f va,,o P'+vw'+2va,, ,,, v_ cos(0a, , 0w)] " (3)
C. Interpolation of Wind and Weather Data
20 Each weather variable (including wind variables), collectively denoted W(x, y, z, t), is measured at a relatively smallnumber of spaced apart locations and at times that are sepa-rated by one to six hours or more. An aircraft flight crew will
25 need to estimate a value of the variable W at a location that isspaced apart from the measurement location and at a time thatdoes not coincide with any measurement times for that vari-able. The system optionally provides an estimation procedurethat interpolates between the measured values at the measure-
30 ment locations to provide a continuously varying functionvalue that coincides with each of the measured values at themeasurement locations. Let jr, 1, be a sequence of spacedapart location vectors corresponding to the measurementlocations, r„-(x,,, y,,, z„) for the variable W(r t) at the most
35 recent time(s) the variable W was measured. Each set of fournearest neighbor location vectors jr, 1, defines a tetrahedron,having the location vectors as vertices, and the collective setof tetrahedrons fills all space, with overlap at boundary planes
40 for any two contiguous tetrahedrons
Ignore the time variable t and consider a location vectorr--(x,y,z) lying in the interior or on a boundary of a selectedtetrahedron Te(1, 2, 3, 4) defined by four spaced apart, non-coplanar measurement location vectors, r,-(x,, y,,, z„) (n=1,
45 2, 3, 4), at which the measurement values W(r„)=W(x,,, y,,, z„)are known. The estimation function
W (r; est) _ (4A)
50W(r&I r—rzll r—rsll r—ral}/IJr, —rzll rt —rsll rt —ral}+
W(r2).Ilr-rtllr-r3llr—r41}/Ilr2-rtllr2—r3llr2-r41I+
W (rs)-IIr—rtll r—rzll r—ral}/Il rs — rtll rs —rzll rs — ral}+
55 W(ra)'Ilr—rtllr—rdlr—r3lIIIlr4—rtllr4—r211r4—rslt
is continuous within the tetrahedron Te(1, 2, 3, 4) and satisfies60 W(r--r,,;est)=W(r„). Because the measurement locations are
spaced apart (in at least one of the three coordinates x, y andz), the denominators in Eq. (4) are never 0, and the magnitudeof the function W(r;est) is bounded. The enveloping figureTe(1, 2, 3, 4) can be extended to a general polyhedron, includ-
65 ing a line segment, a triangle, a tetrahedron and any polyhe-dron having two or more boundary surfaces (endpoints orvertices). More generally, if measured values W(r„) are pro-
US 7,702,427 B17
8vided at N distinct points, r--r, (n=1, ... , N; N?4), a suitable W(avg) is a suitable representative value of the variable W forestimation function is a location associated with the vector location r.
D. Wind Optimal Routing and Other Route ChoicesN N (4B)
W(r;est)=^W(rm) „^^ ^,"gym
Where the location vector r lies within or on a triangle Tr(1,2, 3) defined by three spaced apart, non-collinear measure-ment location vectors r',,. (n'=1, 2, 3) that serve as vertices forthe triangle, the estimation function may be expressed as
W(r;est)=W(ri),IIr—r211r—r311/{Iri
—rzllri—r31}+ (5)
W(32)'{Ir — rillr— r31 1/{ I 32—rill 32—r311+
W (rs)- {lr —rill r— r211111r3 —ri ll r3 —rz11,
where the interpretations are similar to those for the estima-tion function W(r;est) in Eq. (4).
Where the location vector r lies on a line segment Ls(1, 2)defined by two spaced apart measurement location vectorsr",,, (n"=1, 2) that serve as endpoints for the line segment, theestimation function may be expressed as
W" (r; est) _ (6)
W(ri)-Ilr-rz11/{ I ri - rzl1 +W (3z)-II r - ri11 /{I rz - ri11,
where the interpretations are similar to those for the estima-tion functions W(r;est) and/or W'(r;est) in Eqs. (4) and (5).
More generally, one can define an estimation functionW*(r;est) as a sum of two or more continuous characteristicfunctions W*(r;k) (k=1, ... , K; K'?2), where the character-istic function W*(r;k) satisfies
The function W(r;est) or the function W*(r;est) allows inter-polation of a weather-wind value for any location within apolyhedron of dimension 1 or higher, defined by measure-ment location vectors as vertices of the polyhedron.
The values W(r„) in Eq. (4) can be replaced by time-dependent weighting functions W(r,,;t-t„) that are monotoni-cally decreasing with the time difference, t-t,,, (?0) betweenthe present time t and the (most recent) time t„ at which themeasurement W(r„) was taken. An example of such weightingfunctions is
W (r ; t — n) = (8)
/3„ - W (r„) - exp{—a„ (t—t,))+(1 — /3) W (avg){1 — exp{—a„ (t — t„)11
where o„ is a small positive first selected weighting index, Rnis a second selected weighting index satisfying 0-_:^ (3 1, and
5 A system user can choose among any of three or morerouting procedures: (1) a user-preferred route between twowaypoints, including but not limited to a route from originairport to destination airport; (2) an NPR Direct route, whichuses a National Playbook Route; and (3) a wind optimal route,
io as disclosed in U.S. Pat. No. 6,600,991, 7 incorporated byreference herein. In one embodiment, a "wind optimal route"is determined by (i) providing a nominal route between firstand second waypoints in the presence of a first wind environ-ment; (ii) providing values for a second wind environment
15 that differs from the first wind environment; and (iii) using acomputer to determine a neighboring optimal control solutionfor an aircraft moving at a selected speed between the first andsecond waypoints in the presence of the second wind envi-ronment. In one approach, the neighboring optimal solution
20 provides a differential solution that determines one or moreroute increments that suffice to move the aircraft from the firstto the second waypoint when the first wind environment ismodified to become the second wind environment. The dif-ferential solution may be expressed in terms of latitude and
25 longitude coordinates, in terms of modifications to a greatcircle route, or in other terms.
E. Use of Filed Flight PlansThe system receives and stores a flight plan for each NAS
30 flight, which includes all flights governed by instrument flightrules (IFR), for which a flight plan must be or is filed. Flightsfor which a flight plan is not filed are not covered by thesystem. The GUI 17, working in combination with othermodules, provides a two-dimensional top view of NAS air
35 traffic, with each aircraft being represented by a visuallyperceptible symbol, such as a cross or a generic plan view ofan airplane. Optionally, different types of aircraft can berepresented by visually distinguishable symbols (e.g., in dif-ferent colors, different sizes or different symbols; commer-
40 cial flights versus other NAS flights). The NAS air traffic canbe illustrated for one or more selected sectors of an ARTCC(22 at present), an ARTCC itself, a geographic region, or thecontinental contiguous U.S. or Alaska or Hawaii. EachARTCC may have each staffed by a team of air traffic con-
45 trollers (ATCs). FIG. 5 illustrates a GUI screen showingapproximately 4530 aircraft enroute within the contiguousstates at a particular date and time (18 Mar. 2000 at 20:26UCT). The system can provide views similar to FIG. 5 at timeintervals of 1-60 minutes, or longer if desired, using aircraft
50 location predictions determined from the flight plan.When a flight plan is altered by the appropriate ATC, the
flight plan alteration will normally be electronically posted tothe ETMS and will be picked up by the system. The extantflight plan is then altered accordingly in the system flight plan
55 database.
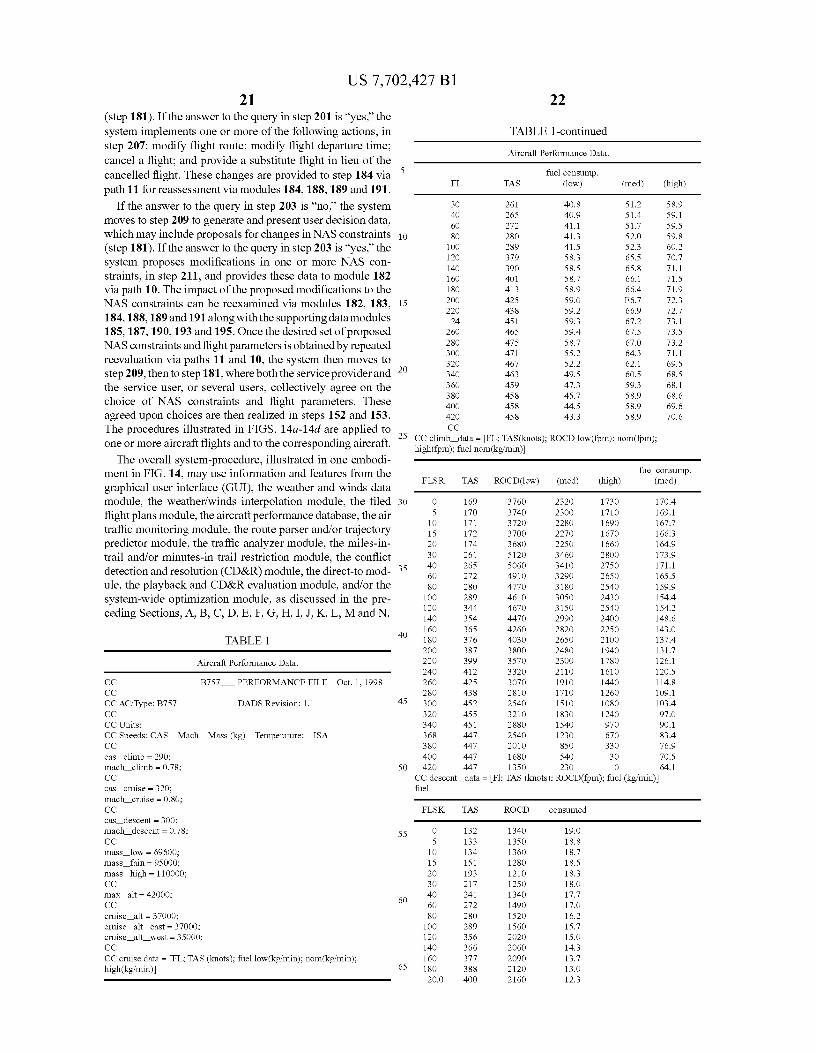
F.Aircraft Performance DatabaseAircraft performance parameters for more than 500 repre-
sentative aircraft models are provided in an aircraft perfor-60 mane database, currently provided by the Base of Aircraft
Data (BADA), developed and maintained by the Euro CentralExperimental Center in France, which is part of the system.Table 1 illustrates the parameters available for a representa-tive aircraft, a Boeing B757. The Table first provides cali-
65 brated air speed schedule for a standard CAS-Mach climb(290 knots calibrated air speed to Mach 0.78), for a standardcruise rate (320 knots or Mach 0.80) and for a standard
W * (r = rv; k) = W (rk) (P = k) (7A
=0 (P * k). (7B
US 7,702,427 B19
descent rate (300 knots CAS or Mach 0.78). As altitudeincreases, the true air speed (TAS) increases faster than indi-cated air speed (IAS).
Table 1 also sets forth cruise data for different flight levelsFL=30-420 (MSL altitudes of 3,000-42,000 feet), a corre-sponding optimum TAS for that FL, and fuel consumption(kgm/min) for each of three aircraft mass loading configura-tions, m=69,600 kgm (low mass), m=95,000 kgm (nominal ormedium mass) and m=110,000 kgm (high mass). TASincreases monotonically with altitude or flight level to a cer-tain Mach number, then decreases and subsequently levels offwith further increases in altitude. Fuel consumption variesmarkedly with altitude, especially for a high mass configura-tion.
Table 1 also sets forth optimal climb or ascent rate at flightlevels FL-0-420 for low, medium and high mass loadingconfigurations. Table 1 sets forth optimal descent rates atflight levels FL-0-420, for a medium mass loading configu-ration. Table 1 is an example of the aircraft-performance datafor more than 500 aircraft that are included in the system.
The ascent rates and descent rates set forth in Table 1 arerecommended rates for all altitudes. For altitudes above thetransition altitude (normally between 15,000 and 20,000 feetMSL), the ascending or descending aircraft may follow aprogrammed altitude rate change.
An aircraft ascending to a cruise altitude will often followone of a set of specified programs of air speed and climb rate.The programs may include a prescription for maximum climbrate (referred to as V,) and/or a prescription for maximumangle of climb (referred to as V,), as well as other specialpurpose ascent rate prescriptions.
An aircraft making a constant rate turn will have a turn ratelimited by the allowable stress, the aircraft air speed, thedensity altitude and other relevant variables. Turn rates aretypically in a range of 1-4 degrees/sec For example, a turn rateof w=3 degrees/sec (0.05236 radians/sec) requires 120 sec toexecute a 360° turn.
G. Airports, ARTCC Sectors and Air Traffic MonitoringThe system applies NAS air traffic demand forecasting and
management to provide flight planning and/or replanning, forexample, through change of destination, change of cruisealtitude, change of cruise speed or change of flightwaypoint(s), to comply with an applicable MIT flight restric-tion or a flight separation requirement that is implemented.This may include restrictions based upon airspace class and/or special use airspaces. The system provides on-demandreports of number of NAS flights that are known to be within,or are predicted to be within, a specified ARTCC, an ARTCCsector, a flow constrained area (FCA) and/or a special useairspace (SUA), at a selected time or within a selected timeinterval, using historic, stochastic, forecast and/or determin-istic models of the NAS flights. Presently, 22 ARTCCs andabout 830 ARTCC sectors are defined, and a given ARTCCmay have a super-high (altitude) sector overlying one or morehigh sectors and a high sector overlying one or more lowsectors.
The system can be used to design efficient aircraft grounddelays and/or ground stops at a selected airport. The availablevisual displays include screen displays, histograms, barcharts, tables and map displays.
Where anARTCC sector or a special use airspace (SUA) ora flow constrained airspace (FCA) experiences increased orunusual demand, this sector or SUA and adjacent regions maybe rearranged or reformatted, for example, (i) by decompos-ing the affected sector or SUA into two or more sub-regions,each with its own air traffic controller (ATC) or set of flight
10restrictions and/or (ii) by rearranging the boundaries of theregion and adjacent regions to balance the load on the ATCassigned to each of the regions. The system allows manual,visual modification of ARTCC sector boundaries and special
5 use airspace boundaries and integrated display of air trafficwithin these modified boundaries. Modified and unmodifiedboundaries and air traffic can be displayed in two and threedimensions, with optional playback, simulation and live pre-sentations. Sector, SCA and FCA demand reporting can be
io visualized using this option. Using any of the available sys-tem display modes (live, playback or simulation), display ofNAS air traffic through the sector or SUA or FCA can bemanually modified, using an intuitive click-and-drag capabil-ity built into the GUI component to implement a what-if
15 scenario that displays the results of reconfiguration of a sectoror an SUA. Two dimensional and three dimensional visual-izations and air traffic reporting are available for the(changed) sector and/or SUA and/or FCA boundaries and forthe resulting (re)allocation of air traffic. The predicted
20 demand on thus-modified NAS resources can thus be mod-eled and analyzed, using selected air traffic flow metrics.
H. Route Parser and Trajectory PredictorFIG. 6 illustrates some geometric and physical parameters
25 for an aircraft in flight. The aircraft has a present locationvector
r=(r-oos krcos t,r-oos krsin t,r-sin k) (9)
and moves with a present velocity vector (ignoring wind30 effects)
v=(rcos a-cos P,rcos a-sin P,vsin a), (10)
where rand v are the aircraft radius vector and velocity vector,measured relative to the Earth's center. Here, ti and X are
35 longitudinal and latitudinal angles, respectively, measuredfrom a reference position, such as the prime meridian and/orthe equatorial line, and a and R are velocity vector angles.
An LLK module in the invention utilizes spherical Earthequations of motion for an aircraft,
40ckJCt={v cos locos t+wr,}/R, (11)
Bt/ct=[v cos krsin t+WE]/(R cos k), (12)
T— sin i{(ah/ct)/v}, (13)45
r(k,t;t)=r(Earth;mean)+h(k,t;t), (14)
where w, , and wE are the north-directed and east-directedcomponents of local wind velocity, ti is longitudinal or azi-
50 muthal angle for the aircraft location, X is latitude or polarangle for the aircraft location, and h=h(X,ti;t) is AGL height(measured relative to local ground level, rather than relative tosea level) of the aircraft above the local terrain.
Using the system, creation of portions of air traffic sce-55 narios can be automated, partly relieving an air traffic mod-
eler of what would otherwise be a manually intensive proce-dure. Filtering and historical flight plan databases associatedwith the system can be used to extract historical air trafficpatterns (optionally, over two or more flight days) from
6o archived data, for flight plans that were followed and fordeviated flight plans. An intuitive flight creation GUI allowsflights to be added to (or deleted from) the historical air trafficpatterns. The scenario creation module can be used to developfuturistic air traffic scenarios that will conserve scarce NAS
65 resources.Optionally, certain of the computations and the displays
can be abbreviated or simplified in order to allow NAS flight
US 7,702,427 B111
modeling on a laptop computer, using a parametric trajectoryprediction engine, as opposed to modeling on a more elabo-rate (and less portable) computer system. A simplified flighttrajectory prediction model may use linear trajectory predic-tion or may use a more elaborate quadratic trajectory predic-tion, in which a great circle route is approximated, as dis-cussed in Section K. The system architecture uses acombination of Java and C coding and can work in the Macin-tosh, Windows, UNIX and LINUX platforms.
I. Traffic AnalyzerThe system enables demand forecasting of air and ground
traffic to predict or estimate (1) number of flights in a selectedsector, (2) number of flights along a selected segment of aflight route or airway, (3) airport arrival and departure rates,(4) demand for selected special use airspaces and (5) demandfor flow constrained areas.
A fleet impact assessment module allows a user to deter-mine if a selected flight in an airline's schedule will beimpacted by a specified NAS constraint. The constraint maybe a weather cell, an active special use air space, a congestedresource (e.g., a sector, an airway, an airport or a particularrunway. A special display screen optionally displays theimpacted flight, relevant details of the associated flight planand the NAS constraint. Optionally, a potential impact of theconstraint on an alternative flight plan can also be demon-strated.
The system provides demand forecasting concerning thenumber of flights, airports, sectors, special use airspaces andflow constrained areas. Demand is predicted based on a com-bination of stochastic modeling, forecasting, deterministicmodeling and/or actual historical counts and can be coupledwith models of traffic flow management restrictions or con-straints (re-routing, ground delay, ground stop, and miles-in-trail and minutes-in-trail ("MIT") restrictions. Displays offorecast variables are available as bar charts, tables and mapdisplays.
If a landing slot is likely to be available for the selected timeinterval at the selected destination, the system advises that theflight can proceed as planned. If a landing slot is not likely tobe available in the selected time interval at the selected des-tination, or if the weather along at least a portion of theplanned flight route is likely to be too severe, the systemadvises the aircraft of the slot non-availability and/or inclem-ent weather and optionally: (1) provides an alternate destina-tion for the flight where a landing slot will be available duringa corresponding time interval of arrival ("TIOA"); (2) advisesdelay of departure of the flight until a time corresponding to atime-delayed TIOA, when a landing slot will be available; (3)selects an alternative destination (for the enroute aircraft),consistent with the remaining fuel reserve for the aircraft andexisting weather along the alternate route, for which a landingslot will be available at a corresponding TIOA; and/or (4)advises postponement or cancellation of the flight. The sys-tem optionally estimates the remaining fuel for the aircraft,before directing the aircraft to an alternative destination.
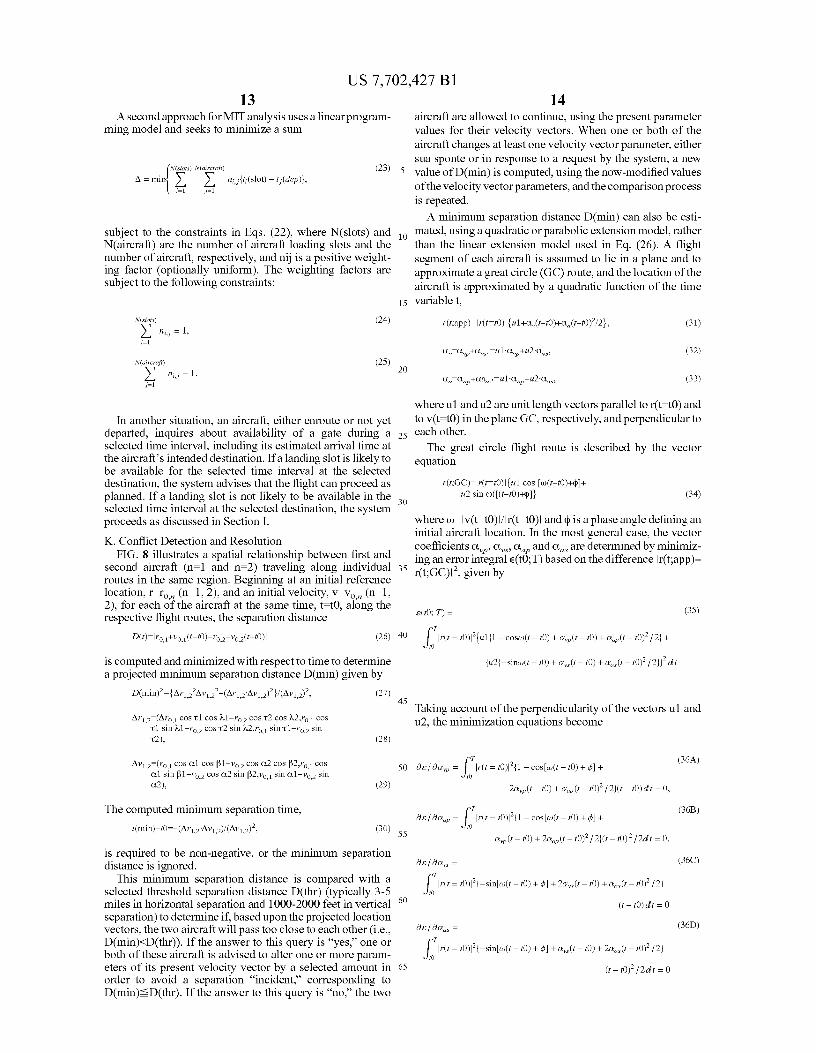
J. Miles-in-Trail and Minutes-in-Trail RestrictionsFIG. 7 illustrates a spatial relationship between first and
second aircraft (n=1 and n=2) traveling consecutively alongthe same route segment RS. The two aircraft need not have thesame departure site or the same destination site. All that isrequired is that the two aircraft travel the same route segmentfor a portion of the total route of each aircraft, within a giventime interval having a time interval length, such as At(seg-ment)=2-7 min. According to an MIT restriction, the twoconsecutive aircraft are required to maintain either (1) a mini-mum distance of separation d(thr)=3-50 miles along the routesegment (miles-in-trail), depending upon the present loca-tions of the two aircraft, or (2) a minimum temporal separa-
12tion At(thr), typically 0.6-3.33 minutes (minutes-in-trail). Fora given initial time t=t1, an initial location vector r 1 and aninitial velocity vector v 1,, is determined for each of the air-crafts, i=1, 2. A separation distance along the common route
5 segment
d(t)= 1r 1 1 +v t 1 (t-11)-r te v i,2 (t-tl)1 (15)
is then determined, using a linear approximation, for all times{tl -t_t(sep)} for which both aircraft will remain on the
10 common route segment, where the vectors v1,1 and V1,2 areparallel but do not necessarily have the same magnitude. Thecalculation of minimum separation distance, given by
d(min)2=4r i,224v i,22-(4r i,2 ,4v i,2 )2}/(4v 1,2)2 , (16)
15 and the calculation of time of minimum separation distance
t(min)-t1=(Ar1,2 -Av1,2)/(Av 1 )2 , (17)
are analogous to those forthe FIG. 2 configuration but is morestraightforward because v1,1 and V1,2 are parallel in this situ-
20 ation. If d(min)-^ : d(thr) and O-t-tl -t(sep)-tl, the systemnotifies one or both aircraft andrequests that at least one of thetwo aircraft change at least one of the parameters of thevelocity vector(s) v 1,, (i=1, 2). If, for example, aircraft no. 1precedes aircraft no. 2 and V 1 ,1 *V l 2<v l 2 .V 1 2, (1) the second
25 aircraft can reduce its speed Iv 1,2 1 1 (2) the first aircraft canincrease its speed v 1,1 1, (3) one of the two aircraft can changeits flight altitude (usually, by a multiple of 2000 feet), or (4)one of the two aircraft can change its flight route, and (5) oneof the two aircraft can change its flight departure time (if at
30 least one of the two aircraft has not yet departed) so that theseparation distance d(t) does not decrease to or below d(thr)during the time interval {tl -t_t(sep)}. The situation illus-trated in FIG. 7 is a special case of the situation illustrated inFIG. 8.
35 An analysis incorporating the MIT restrictions) has beenpresented by Grabbe et al in "Modeling and Evaluation ofMiles -in Trail Restrictions in the National Air Space"(A.I.A.A. paper 2003-5628), at theA.I.A.A. Guidance, Navi-gation and Control Conference, 11-14 Aug. 2003, Austin,
40 Tex., whose content is incorporated by reference herein. Inone embodiment, the analysis models the spacing d,,,-1between consecutive aircraft (i and i-1) on a route segment as
ds,=- vi-1(t(dep)-t.-1(dep)), (18)
45 where tk(dep) is the actual departure time for aircraft no. k(k-i, i-1). This assumes that the time required to reach cruisealtitude is substantially the same for each of the aircrafts i andi-1 and that the true airspeeds for each of the aircrafts i andi-1 are substantially the same. Equation (18) can be modified
50 to model aircraft separation along a great circle segment, as
d,,,_i (rE+hi_1)Isin w(t-ti)-sin w(t-ti_1 )1, (19)
w=vi_1 1(rE+hi-1 ), (20)
55 where rE is a representative radius of the Earth and h , _ 1 (=h )is the cruise altitude of each aircraft. An analytical miles-in-trail (or minutes-in-trail) model works with a MIT time dif-ference
AT,i_1 =t (dep)- ti-1(dep)=di/vs-1, (21)
60and requires that
AT,,_1 -d(thr)/v,_1, (22)
where AL is the corresponding MIT minimum separation65 distance. This analysis can be extended from two consecutive
aircraft to N consecutive aircraft (N?2), all traveling thesame route segment.
(24)N(,I,.)Y, nij = 1,t=1
r(t;app)=1 r(t=t0)1 {ul+a„(t-t0)+aa(t-t0)2/2}, (31)
av a P+a „l-a P+u2-a„„ (32)
N(,; ..aft)
Y, nij-1.j=1
(25)20
as a,+aa_^ ul-a,+u2-a_ (33)
US 7,702,427 B113
A second approach for MIT analysis uses a linear program-ming model and seeks to minimize a sum
N(sdots) N(aircr h) (23)0=m ^ nij{t; (slot) -tj(dep)},
i=1 j=1
subject to the constraints in Eqs. (22), where N(slots) andN(aircraft) are the number of aircraft loading slots and thenumber of aircraft, respectively, and nij is a positive weight-ing factor (optionally uniform). The weighting factors aresubject to the following constraints:
14aircraft are allowed to continue, using the present parametervalues for their velocity vectors. When one or both of theaircraft changes at least one velocity vector parameter, eithersua sponte or in response to a request by the system, a new
5 value of D(min) is computed, using the now-modified valuesof the velocity vector parameters, and the comparison processis repeated.
A minimum separation distance D(min) can also be esti-10 mated, using a quadratic or parabolic extension model, rather
than the linear extension model used in Eq. (26). A flightsegment of each aircraft is assumed to lie in a plane and toapproximate a great circle (GC) route, and the location of theaircraft is approximated by a quadratic function of the time
15 variable t,
In another situation, an aircraft, either enroute or not yetdeparted, inquires about availability of a gate during aselected time interval, including its estimated arrival time atthe aircraft's intended destination. If a landing slot is likely tobe available for the selected time interval at the selected
destination, the system advises that the flight can proceed asplanned. If a landing slot is not likely to be available in theselected time interval at the selected destination, the systemproceeds as discussed in Section I.
K. Conflict Detection and ResolutionFIG. 8 illustrates a spatial relationship between first and
second aircraft (n=1 and n=2) traveling along individualroutes in the same region. Beginning at an initial referencelocation, r ro (n=1, 2), and an initial velocity, v=v, „ (n=1,2), for each of the aircraft at the same time, t=tO, along therespective flight routes, the separation distance
where ul and u2 are unit length vectors parallel to r(t=tO) andto v(t=tO) in the plane GC, respectively, and perpendicular to
25 each other.The great circle flight route is described by the vector
equation
r(t;GQ-1 r(t=t0)1{u1 cos [0)(t-t0)+(P]+
u2 sin w([(t- t0)+(p]} (34)30
where w-1v(t=tO)1/Ir(t=tO)1 and ^ is a phase angle defining aninitial aircraft location. In the most general case, the vectorcoefficients a P, oL_, a P and aas are determined by minimiz-ing an error integral e(tO;T) based on the difference Ir(t;app)-
35 r(t;GC)1 2, given by
-(t0; T) _ (35)
(TD(t)-Irol+vo,1(t—to)-ro,2- vo,2(t- t0) 1 (26) 40 J Ir(t=to)h{ul{1-cosm(t- to) +T"(t- to) +a"(t-t0)2/2}+
t0
is computed and minimized with respect to time to determinea projected minimum separation distance D(min) given by
D(min)2- (Art'224v1,22— (4r1,2 -4v 1,2 )2}/(4v 1,2 )2, (27)
Or1,2_ (Or0 1 cos tl cos k ' _F0,2 cos T2 cos k2,r0 1 costl sin T1-r0, cos T2 sin k2,r0 1 sin tl-r0,2 sinT2), (28)
Av11(r0 1 cos al cos P1 — V0,2 cos a2 cos P2,r0 1 cosal sin P1 — V0,2 cos a2 sin P2,vo 1 sin al — vo,2 sina2), (29)
{u2{ - sinto(r - t0) + T" (r - to) + CT" (r - to)2 / 21 12 d t
45 Taking account of the perpendicularity of the vectors ul andu2, the minimization equations become
50 de /ea, = f T Ir(t=t0)12 {1-cos[to(t- to) +0]+
(36A)
t0
2a„ p (t - to) + a" (t - t0)2 /21(t- t0) cat = 0,
The computed minimum separation time,
t(min)-t0= (4r1,2 -4v 1,2)/(4v 1,2 )2,aC /6'T" = f T
Ir(t=t0)12 {1-cos[to(t- to) +0]+(36B)
(30) o55 a, (t - to) + 2a, (t - t0)2 / 2}(t - to) 2 / 2dt = 0,
is required to be non-negative, or the minimum separationdistance is ignored.
This minimum separation distance is compared with aselected threshold separation distance D(thr) (typically 3-5miles in horizontal separation and 1000-2000 feet in verticalseparation) to determine if, based upon the projected locationvectors, the two aircraft will pass too close to each other (i.e.,D(min)<D(thr)). If the answer to this query is "yes," one orboth of these aircraft is advised to alter one or more param-eters of its present velocity vector by a selected amount inorder to avoid a separation "incident," corresponding toD(min)-D(thr). If the answer to this query is "no," the two
de/8a,,, _ (36c)
fT jr(t= t0)1 2{-sin[to(t- to) +0]+2a,,,(t- to) + CT"(t -to)2/2}
to60 (r- to) dr=o
ate/0CT_ _ (36D)
fT jr(t = t0)1 2 1- sin[m(t - to) + 0] + a,,,(t - t0) + 2aa,(t - to)2 /21
to65 (t - t0)2 / 2 d t = 0

US 7,702,427 B115
Equations (36A)-(36D) provide two pairs of coupled equa-tions:
16dimensions, centered at B and having a radius D(thr), asillustrated in FIG. 9. This conflict condition is expressed as
D(min)-rLOslsin(xyos X_1)I<D(thr), (40)
A l 1111 " I = C1 (37A) 5 {( a- A z z 112
rms x x ) +(Ys-YA) } (41)A2 B21 l a, I=1c21
V", I = {vA2+V"22vA v,, COS (X 12 (42)A3 B3 ays = C3 (37B)A4 B4 aas = C4 YLOS- 1 [0Ys YYAx,, xA)} (43)
10
Al ft071r(t=t0)12(2(t-t0)2}dt,
A2 ft071r(t=t0)12(2(t-t0)2/2}dt,
A3 ft071r(t=t0)12[2(t-t0)2]dt,
A4 ft071r(t=t0)12{(t-t0)312}dt,
B ft071r(t=t0)12{(t-t0)3/2}dt,
B2 ft071r(t=t0)12{(t-t0)4}dt,
B3 ft071r(t=t0)12{(t-t0)3/2}dt,
B4 ft071r(t=t0)12{(t-t0)4}dt,
C1 ft0 71r(t= t0)1 2{1-c0s [w(t-t0)+(P]}(t-t0)dt,
C2 ft0 71r(t=t0)1 2{1-c0s [0)(t-t0)+(p](t-t0)2dt/2,
C3 ft0 71r(t=t0)1 2 (-sin [w(t- t0)+(p](t-t0)dt,
C4 ft0 71r(t=t0)1 2{-sin [0)(t-t0)+(p](t-t0)2dt/2. (37C)
The minimum separation distance D(min) for two aircraft(numbered k=1, 2), whose location vectors are approximatedas in Eq. (31), is determined by solving a cubic equation in thevariable t-t0, namely
X,,,-t--1 {(v, sin X,-v,, sin Xj )/{(vA cos yA -vB cosXZ,* (44)
This conflict can be avoided by (1) changing the relative15 heading angle Z_ of A relative to B to a modified value
x*,er YLos'sine{D(thr)/rtos}, (45)
corresponding to the relative trajectory of A being tangent tothe sphere S(B) at one or two surface points, as indicated in
20 FIG. 9. Where a conflict is present, the relative headingchange,
AX,,-X*_ x,e, (46)
is a fundamental parameter, a measure of the change in at least25 one trajectory parameter forA and/or B to avoid the predicted
conflict.The conflict can be avoided (1) by relative heading change,
(2) by change of the relative velocity vector v_,, (3) by changeof a combination of relative heading and relative velocity
30 vector, (4) by change of altitude of one or both aircraft and/or(5) by a change in aircraft ascent rate or descent rate. Whererelative heading is to be changed, aircraftA and aircraft B canbe assigned fractional contributions, fA and fB, with fA +fB 1,to the total relative heading change x*,.et, according to a
35 selected assignment rule. The corresponding fractionalchanges in relative heading become
x,era e+fA(x*,e x,,), (47A)
2Ar-Av+2 (Av-Av+2Ar-Aa} (t-t0)+6Av-Aa (t-t0)2+4Aa-Av(t-t0)3_0, (38) 40 x erg etfa(x*,e x e)
(47B)
where Ar, Av and Aa are the vector differences for the locationr, velocity v and acceleration a for the two aircraft at t=t0,determined using Eqs. (31)-(33). Several straightforward andsimple methods are available for solving cubic equations,such as Eq. (38). A numerical solution (t-t0=tsoi) is insertedinto an error term
e(min)=1 Ar+Avt_ 1+Aa . (t"1)2 h, (39)
and this error term is compared with a threshold value D(thr)2to determine if a conflict of the two aircraft is predicted tooccur. This great circle approximation can also be used fortrajectory prediction.
K. D. Bilimoria, in A Geometric Optimization Approachto Aircraft Conflict Resolution" (A.I.A.A. Paper 2000-4265),A.I.A.A. Guidance, Navigation and Control Conference,14-17 Aug. 2000, Denver, Colo., sets forth an optimizedmethod for resolution of an aircraft "conflict," defined as asituation in which two aircraft moving in a common (hori-zontal) plane, are projectedto pass within a threshold distanceD(thr) of each other. The content of this article is incorporatedby reference herein. Conflict detection may use linear ornonlinear trajectory prediction. Given two aircraft, A and B,spaced apart by a distance rLos, and a velocity v_, of Arelative to B, a conflict is predicted to occur if the predictedrelative trajectory of A (A moving relative to B) will passthrough at least one point of a sphere S(B), or circle in two
Where a relative heading change is to be made only foraircraft A, the corresponding new heading angle is deter-mined to be
45 x.A_.*,e1.4-sine{(v,,/vA)sin(y*-1,4-0)11)}, (48)
assuming that the magnitude of the argument of the inversesine function in Eq. (47) is no greater than 1.
Where a speed change only is to be implemented, the50 modified air speed for aircraft A is determined by
v*A =vB {sin(y*Y ,-X,,)/sin(y*-I-XA)}, (49)
which is an implicit nonlinear relation between v* A, vB, y,and yB . Equation (49) has two solutions, corresponding to the
55 two surface tangent points indicated in FIG. 9. Bilimoria alsodevelops an optimal change involving both heading changeand velocity change.
L. Direct-to Routing60 Direct-to routing is incorporated as an option, to avoid use
of dog leg route segments between flight route waypoints 1, 2and 3, as illustrated in FIG. 10, when a direct flight fromwaypoint 1 to waypoint 3 is predicted to save at least athreshold amount of time At(DTR). Where direct-to routing is
65 activated, the system estimates the time required for the air-craft to travel from waypoint 1 to waypoint 2 to waypoint 3,taking account of the local weather, applicable wind field,
US 7,702,427 B117
18airspace restrictions and aircraft performance data ("flightconstraints"). The system then estimates the time required totravel from waypoint 1 directly to waypoint 3 (the direct-toroute), incorporating the corresponding flight constraints andcompare the estimated times. If the time required to travel theconventional route segments (1 to 2 to 3) is at least a selectedthreshold increment At(DTR) (e.g., 60 sec) greater than thetime required to travel the direct-to route segment (1 to 3), theconventional route segments are replaced by the direct-toroute segment. Otherwise, the flight continues along the con-ventional route segments. For each three consecutive way-points, this process is optionally repeated. Direct-to routing isdiscussed in H. Erzberger et al, Direct-To Tool for En routeControllers," Proc. IEE Workshop onAdvanced Technologiesand their Impact on Air Traffic Management in the 21 st Cen-tury," Capri, Italy, 26-30 Sep. 1999 and in B. Sridhar et al, in"Benefits of Direct-To Tool in National Airspace System,"I.E.E.E. Trans. on Intelligent Transportation Systems, vol. 1(2000). The content of these references is incorporated byreference herein. The Sridhar et al article applies theErzberger et al model to a particular CTAS site (Fort WorthARTCC), and subsequently to all ARTCC in the NAS, reap-plies a modified direst-to routing procedure that is not ascomplex as the CTAS model, and compares the results withthe corresponding CTAS results. The two models agreeclosely. The modified direct-to routing procedure is part ofthe system disclosed here.
M. Playbook and CDR Route Evaluation ToolsThe F.A.A. has put together, and continues to revise, a set
of National Playbook Routes (NPRs), including specifiedwaypoints, for a flight between any two of a major East Coastairport, a major Midwest airport, a major Southern airport anda major West Coast airport. FIG. 11 illustrates a sequence ofwaypoints between several West Coast airports (LAX, SFO,SEA, etc.) and several East Coast airports (JFK, BOS, etc.).An NPR route can be specified in a flight plan and used whensevere weather does not permit a more direct flight by anotherroute. For example, a flight from Seattle to Boston that mustavoid severe weather across the North Central Plains mightuse an NPR route illustrated in FIG. 11.
Another series of flight routes between a source or originairport and a destination airport is provided by the F.A.A.'sCoded Departure Routes (CDRs), provided by the Air TrafficControl System Command Center as a sequence of waypointsbetween the source and destination. An example of a CDRroute between JFK Airport and O'Hare Airport is shown inTable 2. The CDRs may cover a larger number of airports thandoes the NPR system, and each ARTCC that is traversed by aCDR flight route is indicated in this Table.
The invention allows (1) addition of an aircraft on an NPRor CDR and (2) analysis and prediction of NAS-wide impactof use of such a route.
N. System-Wide OptimizationThe system-wide optimization capabilities of the invention
can be used to calculate an optimal combination of restric-tions (i.e. miles-in-trail, minute-in-trail, reroutes, grounddelay programs and ground stops), which minimize airlinedelays while ensuring that the capacity of scarce NASresources, such as sectors, airports and airways, is met. Toaccomplish this task, detailed models of each of the afore-mentioned restrictions are implemented in the invention, forexample, in connection with miles-in-trail (or minutes-in-trail) and rerouting capabilities of the system. The system-wide optimization capability can be used in either a "what-if'mode or a "simulation" mode to perform both real-timeplan-ning or post-operations analysis studies.
In calculating the optimal combinations of restrictions toimpose, applicable constraints are included to ensure that allsolutions are equitable from the perspectives of the air carrierand the air traffic service provider. In a first example, when
5 rerouting east-bound traffic around a convective weather cell,illustrated in FIG. 12, the invention ensures that traffic isequally distributed between the two available routes, labeled1 and 2, to ensure that the underlying sectors are not con-gested. At the same time, the invention also ensures that no
io single airline is forced to fly predominantly along the longerand less optimal of the two available routes.
A second example of the system-wide optimization capa-bilities of the invention is illustrated in FIG. 13, where thesimulation capabilities are used to calculate the NAS-wide
15 impact of varying the departure rates from La GuardiaAirport(LGA) and Newark Liberty International Airport (EWR) toother airports. Because the LGA and EWR airports are adja-cent to each other, the cumulative enroute time delays forthese two airports are not independent of each other. The
20 dashed line FIG. 13 represents a boundary between thoseairport departure rates that lead to NAS congestion and thosedeparture rates that do not. Based on the results presented inFIG. 13, the optimal departure rates from LGA and EWR are20 and 21 (departures per hour), respectively. This combina-
25 tion of departure rates ensures that NAS-wide congestion isavoided or minimized, while limiting the cumulative airlinedelay to a maximum of 6000 sec. Similar results can begenerated looking at any combination of restrictions thatroutinely impact congestion and other effects on the NAS.
30O. Overall Procedure
FIGS. 14a, 14b, 14c and 14d illustrate a procedure for flowof information according to an embodiment of the invention.FIGS. 14a and 14b describe the flow of information from air
35 traffic service provider's decision-making, and FIGS.14c and14d describe the flow of information from air traffic serviceuser's decision making. The system first determines, in step141, for a given flight or given group of flights, whether theflight(s) is active and has a current track and a flight plan or is
40 based upon a proposed flight plan, which is expected tobecome active at a future time. These data consisting oftracks, active flight plans and proposed flight plans arerecorded, in step 143, and stored in the recorded flight data-base (RFDB), in step 145, for use at a later date. Real-time
45 data from step 141 or historical data from the RFDB are usedfor further processing. The user selects (i) live mode or (ii)simulation mode or (iii) playback mode for the flight(s), asdefined in step 147. In step 149, the system determines if theuser has selected playback mode. Because only recorded data
50 can be played back, the playback mode uses data from RFDB.If the answer to the query in step 149 is "no," in step 151 the
system moves along path 1 and determines, in step 151, if thisflight(s) is impacted by NAS constraints including one ormore of the following constraints: playbook routes; GS/GDP
55 constraints; MIT constraints; local re-routing constraints; (re)sectorization constraints; and departure restrictions. In step152, the system allows modification of one or more NASconstraints provided in step 151. The system also movesalong path 5 and provides real-time flight data from step 141
60 or recorded flight data from RFDB (step 145) to step 182 toenable decision-making from air traffic service user's per-spective (discussed in the following).
One or more defining flight parameters (flight route; depar-ture time; flight altitude; flight speed; flight heading; and
65 destination airport) are modified in step 153 to comply withthe NAS constraints in step 151. These defining flight param-eters are also altered via path 6, as discussed in the following,

US 7,702,427 B119
based on the outcome of collaborative decision-makingbetween the air traffic service provider and the air trafficservice user in step 181 (FIG. 14c). The system then movesvia path 1 to step 155 to predict flight trajectories (locations atfuture times) of both active aircraft and proposed aircraft,using flight parameters from step 153, rapid update cycle(RUC) wind velocity forecast data (step 157) and informationfrom an aircraft performance database (step 159) containingnominal performance data for different types of aircraft. Thesystem uses the predicted trajectories to forecast the demandfor airspace and airport resources, in step 161, where one ormore of the following quantitative measures of flight activityare estimated: traffic count in one or more selected sectors(sector count); traffic count over one or more fixes (fix count);arrival counts at selected airports; departure counts at aselected airports; FCA traffic counts; and/or special use air-space traffic counts for selected SUAs. Step 161 relies ongeometric information from an airspace adaptation database,provided in step 162.
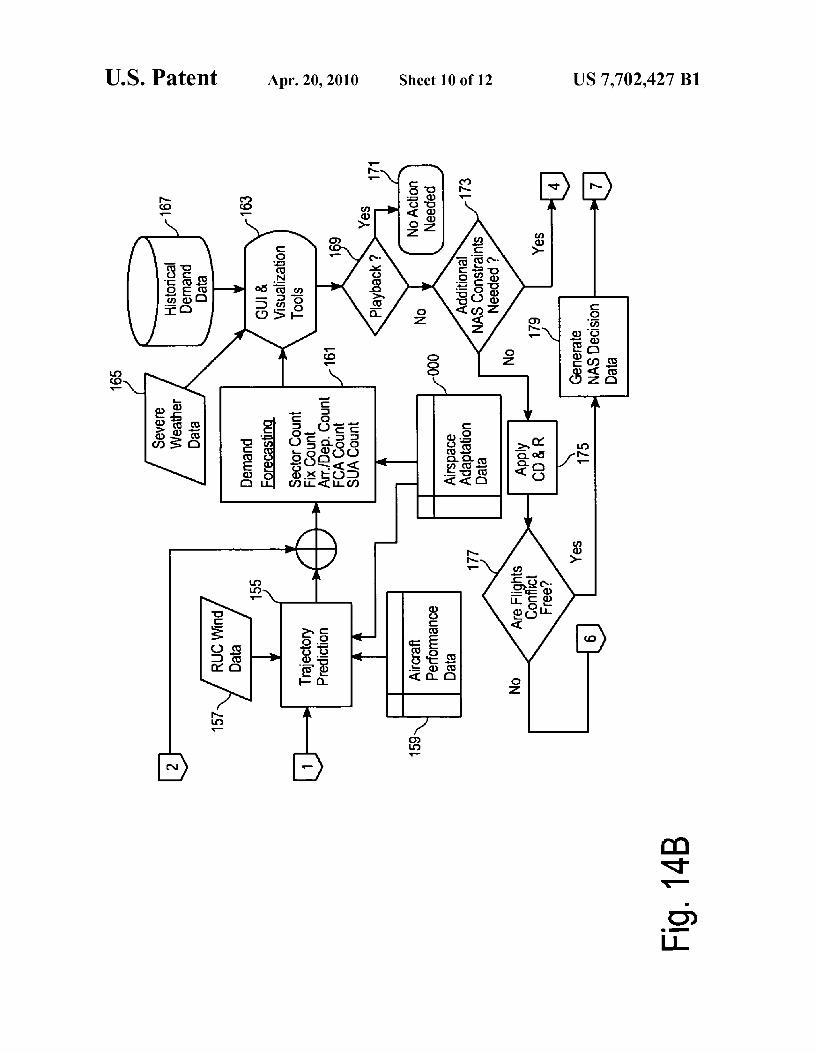
If the answer to the query in step 149 is "yes" so thatplayback mode is desired, the system obtains relevant trajec-tory information directly from the RFDB (step 145) and fol-lows path 2, circumventing the trajectory prediction step in155, to forecast demand (step 161).
Irrespective of the answer to the query in step 149, thesystem then moves to step 163, where a graphical user inter-face (GUI) and visualization tools module provide relevant,visually perceptible illustrations of aircraft location, flightroute, severe weather data (step 165), computed demand esti-mates (step 161) and demand estimates from an historicaldatabase (step 167). The system then determines, in step 169,if a playback mode was requested earlier in step 149. If theanswer to the query in step 149 is "yes," playback is provided,based on the presently assembled information, and no furtheraction is required (step 171).
If the answer to the query in step 169 is "no" so that a livemode or simulation mode is specified, the system moves tostep 173 and determines if additional NAS constraints areneeded for mitigating imbalances between demand for, andthe available capacities of, the airspace and airport resources,in order to manage air traffic. If the answer to the query in step173 is "no," the system applies a conflict detection and reso-lution (CD&R) analysis and response to the active and pro-posed flights, in step 175, and determines, in step 177,whether the flights are conflict-free after application of theCD&R analysis and response.
If the answer to the query in step 173 is "yes," the systemfollows path 4 and determines one or more of the NAS con-straints that need modification (step 152), changes the NASconstraints accordingly in step 151, determines which flightsare impacted by these new NAS constraints in step 151,changes one or more of the selected route parameters tocomply with the new constraints (step 153), and continuesalong path 1 as before.
If the answer to the query in step 177 is "no," the systemmoves along path 3 to step 153 and modifies at least one of thefollowing flight parameters: flight route; departure time;flight speed; altitude; flight heading; and destination airport.After step 153, the system again proceeds along path 1.
If the answer to the query in step 177 is "yes," the systemfollows path 7 and generates NAS decision data from theservice provider's perspective (optionally including a new setof NAS constraints and flight parameter changes), in step 179.The system continues along path 7 to step 181, where col-laborative decision-making between the air traffic serviceprovider and the air traffic service user occurs. The system
20proceeds along path 6 to steps 152 and 153, depending uponthe results of collaborative decision-making and proceedsagain along path 1.
Service providers such as the Federal Aviation Adminis-5 tration (FAA) in the United States would typically perform
the procedures in steps 141 through 179 in FIGS. 14a-14b.The users of air traffic services are typically commercialaviation, business aviation, general aviation, military andindividual pilots. Both air traffic service providers and air
io traffic service users (collectively referredto as "users" herein)can use the system.
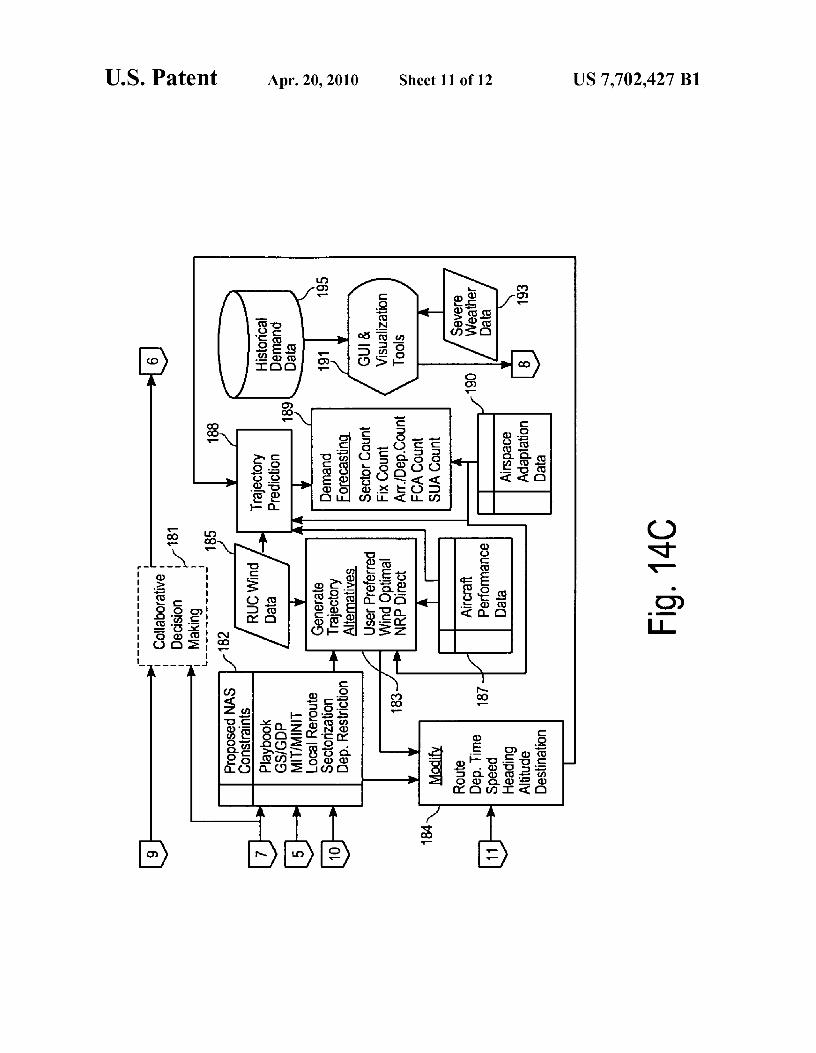
Along path 7, the system proceeds to step 181, collabora-tive decision making and, in parallel, to step 182, where it isdetermined if the air traffic service user's flights are impacted
15 by NAS constraints. Step 182 uses real-time data from step141 or historical data from step 145, received via path 5.Desired modifications to NAS constraints in step 211 (FIG.14d) are also received in step 182 via path 10. Step 182 issubstantially similar to step 151.
20 One or more trajectory alternatives are generated in step183, including wind optimal routes and NPR routes and user-preferred routes to mitigate the impact of NAS constraints onuser's flights. The alternative trajectory generation step 183utilizes RUC wind data (step 185) and aircraft performance
25 data (step 187) that is generic (as in step 159) or is specific touser's particular fleet of aircraft.
Flight parameters including flight route; departure time;flight altitude; flight speed; flight heading; and destinationairport are modified in step 184 to comply with the proposed
so NAS constraints provided in step 182 and to realize the alter-native trajectories generated via step 183. Trajectories of bothactive and proposed aircraft are predicted in step 188 usingthe flight parameters specified in step 184, RUC wind velocityforecast (step 185) and aircraft performance data (step 187).
35 The collaborative decision making step often involvesnegotiation between the service provider and the service userconcerning modification of NAS constraints (step 152) andthe resulting defining flight parameters (step 153). If, as aresult of such negotiation, one or more NAS constraints and/
40 or one or more defining flight parameters are changed, theprocedures of steps 151 through 179 are repeated.
From step 188, the system moves to step 189, demandforecasting using aircraft adaptation data (step 190), whereone or more of the following quantitative measures of flight
45 activity are estimated: traffic count in one or more selectedsectors (sector count); traffic count over one or more fixes (fixcount); arrival counts at selected airports; departure counts ata selected airports; FCA traffic counts; and/or special useairspace traffic counts for selected SUAs. The procedures in
50 steps 161 and 189 are substantially identicalThe system then moves to step 191, where a graphical user
interface and visualization tools module provides relevant,visually perceptible illustrations of aircraft location, flightroute, severe weather data from step 193, computed demand
55 estimates from step 189 and/or historical airspace demanddata from database in step 195. The procedures in steps 163and step 191 may be substantially the same, or step 191 mayinclude additional illustrations especially tailored from theairspace service user's perspective.
60 The system then moves along path 8 in the following man-ner: (1) to step 201 and determines if one or more flights needadditional modification; and (in parallel) (2) to step 203 anddetermines if one or more of the NAS constraints need addi-tional modification. If the answer to the query in step 201 is
65 "no" so that no additional modifications are needed), thesystem generates user decision data, in step 209, which mayinclude proposals for changes in defining flight parameters
US 7,702,427 B121
(step 181). If the answer to the query in step 201 is "yes," thesystem implements one or more of the following actions, instep 207: modify flight route; modify flight departure time;cancel a flight; and provide a substitute flight in lieu of thecancelled flight. These changes are provided to step 184 viapath 11 for reassessment via modules 184, 188,189 and 191.
If the answer to the query in step 203 is "no," the systemmoves to step 209 to generate and present user decision data,which may include proposals for changes in NAS constraints(step 181). If the answer to the query in step 203 is "yes," thesystem proposes modifications in one or more NAS con-straints, in step 211, and provides these data to module 182via path 10. The impact of the proposed modifications to theNAS constraints can be reexamined via modules 182, 183,184,188,189 and 191 along with the supporting data modules185, 187, 190, 193 and 195. Once the desired set of proposedNAS constraints and flight parameters is obtainedby repeatedreevaluation via paths 11 and 10, the system then moves tostep 209, then to step 181, where boththe service provider andthe service user, or several users, collectively agree on thechoice of NAS constraints and flight parameters. Theseagreed upon choices are then realized in steps 152 and 153.The procedures illustrated in FIGS. 14a-14d are applied toone or more aircraft flights and to the corresponding aircraft.
The overall system-procedure, illustrated in one embodi-ment in FIG. 14, may use information and features from thegraphical user interface (GUI), the weather and winds datamodule, the weather/winds interpolation module, the filedflight plans module, the aircraft performance database, the airtraffic monitoring module, the route parser and/or trajectorypredictor module, the traffic analyzer module, the miles-in-trail and/or minutes-in trail restriction module, the conflictdetection and resolution (CD&R) module, the direct-to mod-ule, the playback and CD&R evaluation module, and/or thesystem-wide optimization module, as discussed in the pre-ceding Sections, A, B, C, D, E, F, G, H, I, 7, K, L, M and N.
TABLE 1
Aircraft Performance Data
CC B757 PERFORMANCE FILE Oct. 1, 1998CCCCAC/Type: 13757 DADS Revision: 1.1CCCC Units:CC Speeds: CAS Mach Mass (kg) Temperature: ISACCcasclimb = 290;mach climb = 0.78;CCcas cruise = 320;mach cruise = 0.80;CCcasdescent = 300;mach descent = 0.78;CCmass _low= 69600;mass fain = 95000;mass high=110000;CCmax-alt = 42000;CCcruise-alt = 37000;cruise-aft-east = 37000;cruise-aft-west=35000;CCCC cruise data = [FL; TAS (knots); fuel low(kg/min); nom(kg/min);high(kg/min)]
22
TABLE 1-continued
Aircraft Performance Data.
5 fuel consump.FL TAS (low) (med) (high)
30 261 40.8 51.2 58.940 265 40.9 51.4 59.160 272 41.1 51.7 59.5
10 80 280 41.3 52.0 59.8100 289 41.5 52.3 60.2120 379 58.3 65.5 70.7140 390 58.5 65.8 71.1160 401 58.7 66.1 71.5180 413 58.9 66.4 71.9
15 200 425 59.0 E6.7 72.3220 438 59.2 66.9 72.7
24 451 59.3 67.2 73.1260 465 59.4 67.5 73.5280 475 58.7 67.0 73.2300 471 55.2 64.3 71.1
20320 467 52.2 62.1 69.5340 463 49.5 60.5 68.5360 459 47.3 59.3 68.1380 458 45.7 58.9 68.6400 458 44.5 58.9 69.6420 458 43.3 58.9 70.6CC
25 CC climb-data = [FL; TAS(knots); ROCD low(fpm); nom(fpm);high(fpm); fuel nom(kg/min)]
fuel consump.FLSR TAS ROCD(low) (med) (high) (med)
30 0 169 3760 2320 1730 170.45 170 3740 2300 1710 169.1
10 171 3720 2280 1690 167.715 172 3700 2270 1670 166.320 174 3680 2250 1660 164.930 261 5120 3460 2800 173.9
35 40 265 5060 3410 2750 171.160 272 4910 3290 2650 165.580 280 4770 3180 2540 159.9
100 289 4610 3050 2430 154.4120 344 4670 3150 2540 154.2140 354 4470 2990 2400 148.6160 365 4260 2820 2250 143.0
40 180 376 4030 2650 2100 137.4200 387 3800 2480 1940 131.7220 399 3570 2300 1780 126.1240 412 3320 2110 1610 120.5260 425 3070 1910 1440 114.8280 438 2810 1710 1260 109.1
45 300 452 2540 1510 1080 103.4320 455 3210 1830 1240 97.0340 451 2880 1540 970 90.1368 447 2540 1230 670 83.4380 447 2010 850 330 76.9400 447 1680 540 30 70.5
50 420 447 1350 230 0 64.1CC descent data = [Fl; TAS (knots); ROCD(fpm); fuel (kg/min)]fuel
FLSK TAS ROCD consumed
0 132 1340 19.0555 133 1350 18.8
10 134 1360 18.715 151 1280 18.520 193 1210 18.330 217 1250 18.040 241 1340 17.7
60 60 272 1490 17.080 280 1520 16.2
100 289 1560 15.7120 356 2020 15.0140 366 2060 14.3160 377 2090 13.7
65 180 388 2120 13.020.0 400 2160 12.3
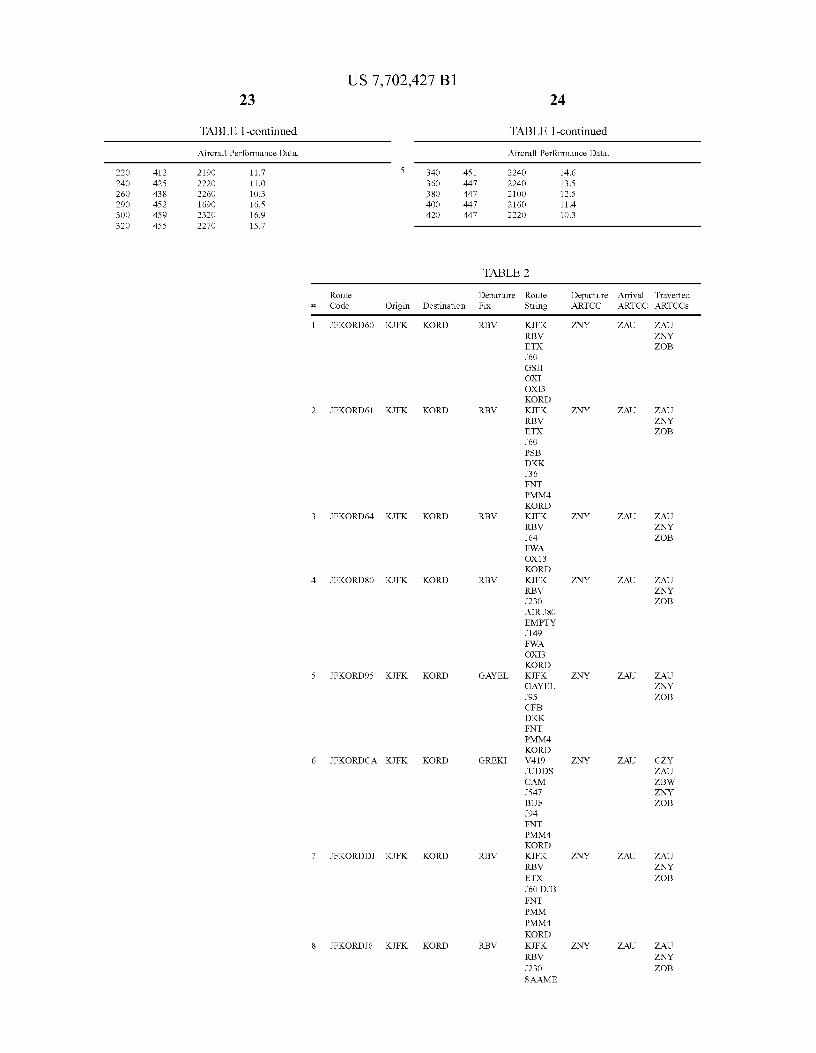
US 7,702,427 B123
24
TABLE 1-continued
TABLE 1-continued
Aircraft Performance Data. Aircraft Performance Data.
220 412 2190 11.7 5 340 451 2240 14.6240 425 2220 11.0 360 447 2240 13.5260 438 2260 10.3 380 447 2100 12.5290 452 1690 16.5 400 447 2160 11.4300 459 2320 16.9 420 447 2220 10.3320 455 2270 15.7
TABLE 2
Route# Code Origin Destination
DepartureFix
RouteString
DepartureARTCC
Arrival TravertedARTCC ARTCCs
1 JFKORD60 KJFK KORD RBV KJFK ZNY ZAU ZAURBV ZNYETX ZOBJ60GSHOXIOXI3KORD
2 JFKORD61 KJFK KORD RBV KJFK ZNY ZAU ZAURBV ZNYETX ZOBJ60PSBDKKJ36ENTPMM4KORD
3 JFKORD64 KJFK KORD RBV KJFK ZNY ZAU ZAURBV ZNYJ64 ZOBFWAOX 13KORD
4 JFKORD80 KJFK KORD RBV KJFK ZNY ZAU ZAURBV ZNYJ230 ZOBAIR J80EMPTYJ149FWAOXI3KORD
5 JFKORD95 KJFK KORD GAYEL KJFK ZNY ZAU ZAUGAYEL ZNYJ95 ZOBCFBDKKENTPMM4KORD
6 JFKORDCA KJFK KORD GREKI V419 ZNY ZAU CZYJUDDS ZAUCAM ZBWJ547 ZNYBUT ZOBJ94ENTPMM4KORD
7 JFKORDDJ KJFK KORD RBV KJFK ZNY ZAU ZAURBV ZNYETX ZOBJ60 DJBENTPMMPMM4KORD
8 JFKORDJ6 KJFK KORD RBV KJFK ZNY ZAU ZAURBV ZNYJ230 ZOBSAAME
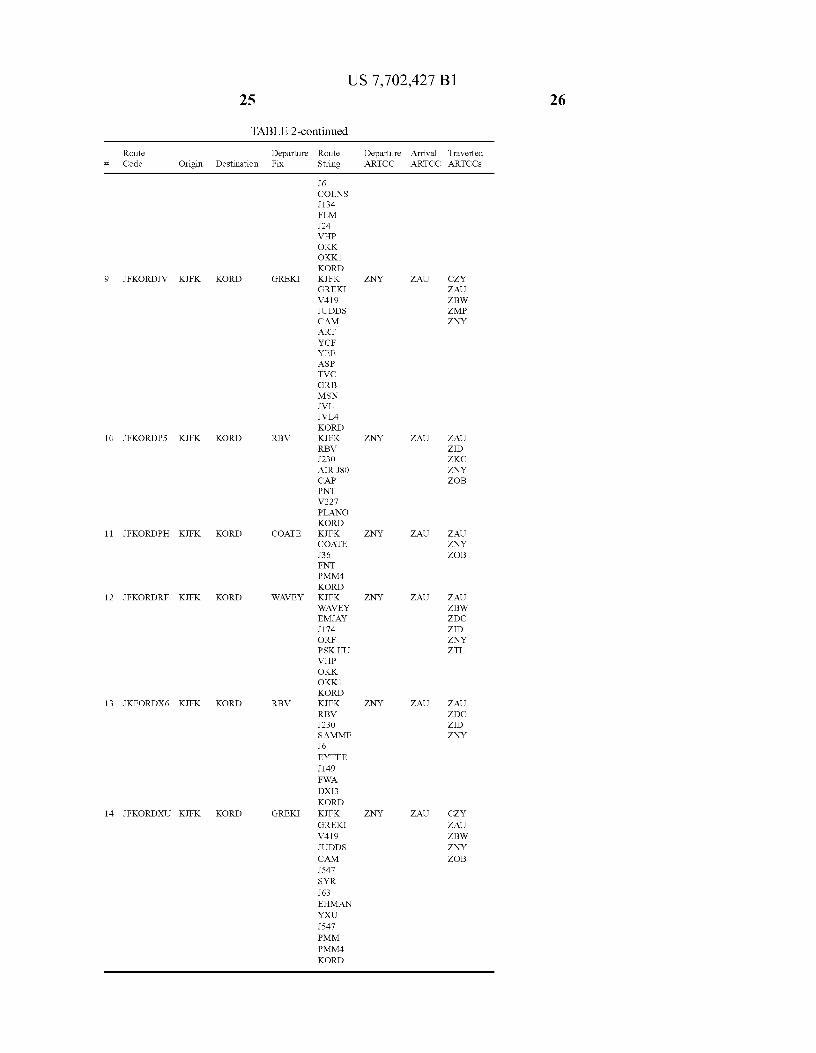
US 7,702,427 B125
26
TABLE 2-continued
Route Departure Route Departure Arrival Traverted
# Code Origin Destination Fix String ARTCC ARTCC ARTCCs
J6COLNSJ134FLMJ24VHPOKKOKK1KORD
9 JFKORDJV KJFK KORD GREKI KJFK ZNY ZAU CZYGREKI ZAUV419 ZBWJUDDS ZMPCAM ZNYARTYCFYEEASPTVCGRBMSNJVLJVL4KORD
10 JFKORDPS KJFK KORD RBV KJFK ZNY ZAU ZAURBV ZID,J230 ZKCAIR J80 ZNYCAP ZOBPNTV227PLANOKORD
11 JFKORDPH KJFK KORD COATE KJFK ZNY ZAU ZAUCOATE ZNYJ36 ZOBENTPMM4KORD
12 JFKORDRF KJFK KORD WAVEY KJFK ZNY ZAU ZAUWAVEY ZBWEMJAY ZDCJ174 ZIDORE ZNYPSK IIU ZTLVHPOKKOKK1KORD
13 JKFORDX6 KJFK KORD RBV KJFK ZNY ZAU ZAURBV ZDCJ230 ZIDSAMME ZNYJ6EYTEEJ149TWADXI3KORD
14 JFKORDXU KJFK KORD GREKI KJFK ZNY ZAU CZYGREKI ZAUV419 ZBWJUDDS ZNYCAM ZOBJ547SYRJ63EHMANYXUJ547PMMPMM4KORD

US 7,702,427 B127
What is claimed is:1. A method for estimating a minimum distance of
approach of two aircraft that are airborne, the method com-prising:
providing information on an initial location vector r0(t=tl;n), on an initial velocity vector rl(t=tl;n) and on aninitial acceleration vector r2(t=tl;n) at a selected timet=t 1, for each of N aircraft, numbered n=1, ... , N (N?2)that are airborne;
approximating said location vector r(t;n) for aircrafts num-ber n=n1 and n=n2 (nl;-n2) over a selected time interval[tl,t2] by quadratic vector functions of time,
r(t,-nl;app)=r0(nl)+rl (nl)- (t-tl)+r2(n1) . (t-tl)2,
r(t,-n2;app)=r0(n2)+rl (n2)- (t-tl)+r2(n2) - (t-tl)2,
Ar(t;app)=r(t,-n I; app)-r(t,-n2;app)=4r0+4r1(t-tl)+4r2(t-tl)2,
respectively, where t is a selected time within a selected timeinterval [T1,T2], each of the location vectors r(t;nl;app) andr(t;n2;app) substantially describes motion on a great circle ina plane, and the vector coefficients r0;nl), rl(nl), rl(nl),r0(n2), rl (n2) and r2(n2) are chosen to optimally match thevector functions r(t;nl;app) and r(t;n2;app) in the selectedtime interval [T1,T2]; and
estimating a minimum distance of approach d(min) for amagnitude Ir(t;nl)-r(t;n2)1 of a vector difference, byidentifying at least one real time t(min) for which a timederivative of the quantity Ir(t;nl)-r(t;n2)1 2 is zero,
2Ar0Ar1+ (Art -Art +2Ar0-Ar2)(t-tl)+6Ar1-4r2(t-tl)2+4Ar2.Ar2(t-tl)3=0,
and by interpreting the vector magnitude Ir(t=t(min);nl)-r(t=t(min);n2)1 as the minimum distance d(min).
2. A method for managing aircraft traffic, the method com-prising:
providing information on location vector r„ (t=tm) andvelocity vector v„ (t=tm) for each of N aircraft, num-bered n=1, ... , N (N?2) that are airborne and arelocated within a selected air route traffic control center(ARTCC), for at least one selected time t=tm, whereeach of the N aircraft is assigned to at least one ARTCCsector, numbered s=1, ... , S (S?2) in the selectedARTCC;
at a time, t=tm'>tm, altering at least one boundary of eachof at least two selected adjacent ARTCC sectors, num-bered s=s1 and s=s2 (sl;-s2), within the selectedARTCC to provide altered sectors, numbered s=s1' ands=s2', respectively, where the union of the at least twoselected adjacent sectors encloses the union of the atleast two altered sectors; and
providing information on location vector r„ (t=tm') andvelocity vector v„ (t=tm') for each of the N aircraft, that isairborne and is located within the selected ARTCC, forthe time t=tm', where each of the N aircraft is assigned toat least one ARTCC sector, numbered s=1, ... , S (S?2)in the selected ARTCC.
3.A method for managing aircraft traffic, the method com-prising:
providing information on an initial location vector ro„(t=t0) and an initial velocity vector vo„(t=t0) for each ofN aircraft, numbered n=1, ... , N (N?2) that are air-borne;
approximating the location vector r(t;n) for the aircraftnumber n=n1 and for the aircraft n=n2 (nl;-n2; nl,n2--: N) by vector functions that are at least quadratic ina time variable t,
28respectively, relative to a selected initial time t0, where eachof the location vectors r(t;nl) and r(t;n2) substantiallydescribes motion on a great circle in a plane, and the vectorcoefficients r0(t;nl), rl(t;nl), r2(t;nl), r0(t;n2), rl(t;n2) and
5 r2(t;n2) are chosen to optimally match the vector functionsr(t;nl) and r(t;n2) in a selected time interval [tl,t2]; and
determining a descent-start location at which the aircraftshould begin its descent toward a destination airportalong a substantially linear descent path, where an alti-
10 tude descent rate experiencedby the aircraft is a selectedfraction f (0<f;^1) of a maximum altitude descent rate.
4.A method for managing aircraft traffic, the method com-prising:
providing information on an initial location vector ro„(t=t0) and an initial velocity vector vo„ (t=t0) for each of
15 N aircraft, numbered n=1, ... , N (N?2) that are air-borne;
approximating the location vector r(t;n) for the aircraftnumber n=n1 and for the aircraft n=n2 (nl;-n2; nl,n2^N by vector functions that are quadratic in a time
20 variable t,
r(t,-nl;app)-r0(t,-nl)+rl(t,-n1)-(t-t0)+r2(t,-nl).(t-t0)2,
r(t,-n2;app)-r0(t,-n2)+rl(t,-n2)-(t-t0)+r2(t,-n2)(t-t0)2,
25 respectively, relative to a selected initial time t0, where eachof the location vectors r(t;nl) and r(t;n2) substantiallydescribes motion on a great circle in a plane, and the vectorcoefficients r0(t;nl), rl(t;nl), r2(t;nl), r0(t;n2), rl(t;n2) andr2(t;n2) are chosen to optimally match the vector functions
30 r(t;nl) and r(t;n2) in a selected time interval [tl,t2];providing an estimate of a wind velocity vector vw(v w cos
0w,vw sin 0w) at a specified location, where vw is anestimated magnitude of the wind velocity vector and 0wis an angle of the wind velocity vector measured relativeto a selected reference line or reference plane;
35 providing an estimate of a desired angle O de, of travel ofsaid aircraft in an environment including the estimatedwind velocity vector; and
orienting a velocity vector associated with said aircraft atan angle 0,,_p relative to the reference line or plane,
40 where 0__P is determined by
tan 0,, {vde5 sin ode-V, sin 6,,,Hvde5 cos 6ae5vw scos 0w}.
5.A method for managing aircraft traffic, the method com-45 prising:
providing information on an initial location vector ro„(t=t0) and an initial velocity vector vo„ (t=t0) for each ofN aircraft, numbered n=1, ... , N (N?2) that are air-borne;
50 approximating the location vector r(t;n) for the aircraftnumber n=n1 and for the aircraft n=n2 (nl;-n2; nl,n2- : N) by vector functions that are quadratic in a timevariable t,
r(t,-nl;app)-r0(t,-nl)+rl(t,-n1)-(t-t0)+r2(t,-nl).(t-t0)2,55
r(t,-n2;app)-r0(t,-n2)+rl(t,-n2)-(t-t0)+r2(t,-n2)(t-t0)2,
respectively, relative to a selected initial time t0, where eachof the location vectors r(t;nl) and r(t;n2) substantiallydescribes motion on a great circle in a plane, and the vector
60 coefficients r0(t;nl), rl(t;nl), r2(t;nl), r0(t;n2), rl(t;n2) andr2(t;n2) are chosen to optimally match the vector functionsr(t;nl) and r(t;n2) in a selected time interval [tl,t2];
providing an estimate of a wind velocity vector vw(v w cos0w,vw sin 0w) at a specified location, where vw is an
65 estimated magnitude of the wind velocity vector and 0wis an angle of the wind velocity vector measured relativeto a selected reference line or reference plane;
r(t,-nl;app)=r0(t,-nl)+rl (t,-nl)-(t-t0)+r2(t,-n I)(t-t0)2,
r(t,-n2;app)=r0(t,-n2)+rl (t,-n2) . (t-t0)+r2(t,-n2)(t-t0)2,
US 7,702,427 B129
providing an estimate of a desired angle O de, of travel and adesired magnitude of velocity of travel v,,, of said air-craft;
providing an estimate of a desired magnitude of velocity oftravel v,,, in an environment including the estimatedwind velocity vector; and
providing said aircraft with an associated magnitude ofaircraft velocity v—P, in the absence of said wind veloc-ity vector, that is given by
v^o P={vae^^+vw^-2vae^,»„ cos (8ae_
aw)}iiz
6.A method for managing aircraft traffic, the method com-prising:
receiving and storing in a database an estimated locationvector for a sequence of times over a time interval thatincludes at least at two flight days; and
using information in the database to estimate a number offlights in a selected region, including at least one iden-tified ARTCC sector, for at least one prediction time thatis not included in the at least two flight days;
estimating a number of aircraft that will be located in theselected region at each of a second selected sequence oftimes; and
when the at least one identifiedARTCC sector will containmore than a selected threshold number of the aircraft atan identified time among the second sequence of times,changing at least one boundary between the at least oneidentifiedARTCC sector and an adjacent ARTCC sectorto reduce the number of aircraft contained in the at leastone identified ARTCC sector at a time preceding theidentified time; and
displaying a selected area including the selected region,
after the at least one boundary is changed, in a visuallydistinguishable format, when the selected region willcontain no more than the selected threshold number ofthe aircraft at the identified time.
7.A method for managing aircraft traffic, the method com-prising:
receiving and storing in a database an estimated locationvector and estimated velocity vector for each of N air-craft (Ni_- 2) at each of a selected sequence of times overa time interval that includes at least at two flight days;
using information in the database to estimate a number offlights within an identified ARTCC sector, including aselected airport at which the N aircraft are expected toland, for at least one prediction time that is not includedin the at least two flight days;
estimating a number of the N aircraft that will descend andland at the selected airport within each of a selectedsequence of time intervals; and
estimating a demand on at least one of (i) at least onerunway at the selected airport and (ii) a selected group ofarrival-departure gates at the selected airport.
8.A method for managing aircraft traffic, the method com-prising:
receiving and storing in a database an estimated locationvector and estimated velocity vector for each of N air-craft (Ni_- 2) at each of a selected sequence of times overa time interval that includes at least at two flight days;
using information in the database to estimate a number offlights within an identified ARTCC sector, including aselected airport at which the N aircraft are initiallylocated, for at least one prediction time that is notincluded in the at least two flight days;
estimating a number of the N aircraft that will take off andascend from the selected airport within each of aselected sequence of time intervals;
30estimating a demand on at least one of (i) at least one
runway at the selected airport and (ii) a selected group ofarrival-departure gates at the selected airport;
providing information on an initial location vector to,5 (t=t0) and an initial velocity vector vo„(t=t0) for each of
N aircraft, numbered n=1, ... , N (N?2) that are air-borne;
aircraft at a time t(est) that is displaced from an initial timet0 by approximate time increments Arm, numbered m-
101, ... , M (M?2), where 0<Atl<Ar2^ ... <AtM; and
where the magnitude r0,-r02 1 of the difference of the loca-tion vectors of aircrafts number n=1 and n=2 is esti-mated to be less than a selected difference value for atleast one of the time increments Arm, assigning a con-flict avoidance response to at least one of the aircrafts
15 number n=1 and n=2 so that, with the conflict avoidanceresponse implemented, the magnitude of the differenceof the location vectors of aircrafts number n=1 and n=2for each of the time increments Arm is no less than theselected difference value.
20 9. A method for estimating a minimum distance ofapproach of two aircraft that are airborne, the method com-prising:
providing information on an initial location vector r0(n)=r(t=tl ;n) and an initial velocity vector v0(n)=v(t=t l ;n) for
25 each of N aircraft, numbered n=1, ... , N (N?2) that areairborne;
estimating a location separation vector Ar(t;n) for each of atleast two aircraft, number n=n1 and n=n2 (nl ;-n2), asAr(tn)=r0(n)+v0(n)(t-tl) for a selected reference time
30tl;
estimating a time at which a minimum distance of separa-tion occurs for the aircraft, n=n1 and n=n2, to be aboutAt(min)=tl-(Ar, ,2 •Av,2 )/(Av, ,2)2,whereAr, ,2=r0(nl)-r0(n2) and Av, ,2=v0(nl)-v0(n2); and
estimating a minimum distance of separation to be about35 IAr(min)I={Ari z 2Av i 22 -Ari z •Avi z)}/(Avi z)2.
10. The method of claim 1, further comprising:when said minimum distance of approach is less than a
selected threshold number for a value of said time t=t(min) within said selected time interval [tl,t2], advising
40 at least one of said aircraft number nl and number n2interpreting this condition as indicating that an aircraftconflict is likely to occur between said aircrafts n=n1and n=n2 within said selected time interval; and
when an aircraft conflict is determined to be likely to occur,45 allowing at least one of said aircraft number n=n1 and
n=n2 to adopt a conflict avoidance response from agroup of avoidance responses comprising: (1) changinga heading angle for said at least one of said aircraftsnumber n=1 and n=2; (2) changing a velocity vector forsaid at least one of said aircrafts number n=1 and n=2;
So (3) changing a magnitude of at least one of said initialvelocity vectors vol and v02 ; (4) changing an altitude offlight for said at least one of said aircrafts number n=1and n=2; and (5) changing at least one of an aircraftascent rate and an aircraft descent rate for at least one of
55 said aircrafts number n=1 and n=2.11. The method of claim 1, further comprising providing a
desired route for at least one aircraft that is substantially atleast one of a wind-optimal route and an NPR route.
12. The method of claim 1, further comprising choosing60 said selected difference value to lie in a range of 3-5 nautical
miles in a horizontal direction and 1000-2000 feet in a verticaldirection.
![, Allen, C., & Rendall, T. (2019). Efficient Aero-Structural Wing AIAA Scitech … · In AIAA Scitech 2019 Forum [AIAA 2019-1701] (AIAA Scitech 2019 Forum). American Institute of](https://img.pdfslide.us/doc/110x75/6089b44b26d0b4646a6cbe59/-allen-c-rendall-t-2019-efficient-aero-structural-wing-aiaa-scitech.jpg)