Embed Size (px)
Citation preview
1 ©Grossman Yanak & Ford LLP 2019
SUMMER 2019
Grossman Yanak & Ford LLP
Business Valuation & Litigation Support Group
United States
Economic Outlook
©Grossman Yanak & Ford LLP 2019
1 ©Grossman Yanak & Ford LLP 2019
Federal Reserve – Current Economic Conditions Commentary
The Federal Reserve publishes a report (known as
the Beige Book) eight times per year that
summarizes current economic conditions
throughout the twelve Federal Reserve Districts in
the United States. The most recent Beige Book
publication was released on June 5, 2019. In the
publication, it was noted that economic activity
expanded at a modest pace from April through mid-
may, a slight improvement over the previous
period.1 The publication described the outlook for
the coming months as “solidly positive but
modest”2. Specifically, the publication indicates
positive trends in manufacturing, residential
construction and real estate, consumer spending,
and tourism activity. However, while the report
indicates manufacturing was generally positive,
several districts did note signs of slowing and a more
uncertain outlook. Furthermore, agricultural
conditions reportedly remained weak, although few
districts reported some improvements.
Employment
In terms of Employment and Wages, the most
recent Beige Book reported a general increase in job
growth, constrained by tight labor markets:
“Employment continued to increase nationwide,
with most Districts reporting modest or moderate
job growth and others reporting slight growth, an
assessment similar to the previous reporting period.
Solid hiring demand was noted for retail, business
services, technical, manufacturing, and construction
jobs and by
staffing agencies in general. However, stronger
employment growth continued to be constrained by
tight labor markets, with Districts citing shortages of
both high- and low-skill workers. Competition for
workers reportedly applied some wage pressures
across a wide range of occupations and induced
improvements in benefits to attract more workers
and to improve retention of existing employees,
according to several Districts. However, overall
wage pressures remained relatively subdued given
low unemployment rates; a majority of Districts
reported modest or moderate wage growth.”3
1 Beige Book – June 5, 2019, Board of Governors of the Federal Reserve System. Internet: https://www.federalreserve.gov/monetarypolicy/beige-book-default.htm
2 Ibid. 3 Ibid.
2 ©Grossman Yanak & Ford LLP 2019
Federal Open Market Committee – Monetary Policy Commentary
The Federal Open Market Committee (“FOMC” or
the “Committee”) acts as the monetary
policymaking body of the Federal Reserve System
and makes all decisions regarding open market
operations, which affect the federal funds rate (rate
at which depository institutions lend to each other),
the size of the Federal Reserve’s asset holdings, and
public communication regarding the likely course of
future monetary policy.4 Information received by
the FOMC since they last met in May indicated that:5
The labor market remains strong but that
growth of economic activity is rising at a
moderate rate;
Job gains have been solid, on average, in
recent months, and the unemployment rate
has remained low;
Although growth of household spending
appears to have picked up from earlier in
the year, indicators of business fixed
investment have been soft;
On a 12-month basis, overall inflation and
inflation for items other than food and
energy are running below two percent; and
Market-based measures of inflation
compensation have declined, however
survey-based measures of longer-term
inflation expectations are little changed.
Moreover, it was noted that in the FOMC’s desire to
foster maximum employment and price stability,
“…the Committee decided to maintain the target
range for the federal funds rate at 2.25 to 2.50
percent. The Committee continues to view sustained
expansion of economic activity, strong labor market
conditions, and inflation near the Committee's
symmetric 2 percent objective as the most likely
outcomes, but uncertainties about this outlook have
increased. In light of these uncertainties and muted
inflation pressures, the Committee will closely
monitor the implications of incoming information
for the economic outlook and will act as appropriate
to sustain the expansion, with a strong labor market
and inflation near its symmetric 2 percent
objective.”6
The FOMC further noted that in determining the
size of future adjustments to the target range for
the federal funds rate, the FOMC “…will assess
realized and expected economic conditions relative
to its maximum employment objective and its
symmetric 2 percent inflation objective. This
assessment will take into account a wide range of
information, including measures of labor market
conditions, indicators of inflation pressures and
inflation expectations, and readings on financial and
international developments.”7
4 Structure of the Federal Reserve System, Federal Open Market Committee. Internet: https://www.federalreserve.gov/aboutthefed/structure-federal-open-market-committee.htm
5 Board of Governors of the Federal Reserve System, Press Release. June 19, 2019. Internet. 6 Ibid. 7 Ibid.
3 ©Grossman Yanak & Ford LLP 2019
Trade Conflict
The world is facing increased trade conflict in 2019,
and escalating trade tensions are widely considered
to be the largest threat to the global economy at this
time. The U.S. trade deficit is widening as imports
are increasing faster than foreign demand for
American products and services. President Trump
tends to regard the U.S. trade deficit as evidence of
foreign misconduct. However, additional tariffs
could harm both trading partners and American
consumers.
The U.S. has imposed tariffs on Chinese imports
worth $250 billion, and threatens tariffs of 25
percent on $300 billion more. In retaliation, China
has set tariffs on $100 billion worth of U.S. goods,
and is threatening to implement qualitative
measures that would impact U.S. businesses
operating in China.
Many experts anticipate this will have an overall
negative impact on the U.S. economy. The tariffs
have the potential to raise input prices for American
business, raise headline CPI inflation, and reduce
U.S. economic output, incomes and employment
opportunities. Currently, President Trump and
Chinese President Xi Jinping are working towards
negotiations, however, neither has been willing to
back down. The largest concern is now that this will
turn into a full blow trade war, a huge threat to the
global economy. Overall, tariffs and the uncertainty
over trade tensions and could hamper economic
growth in the near term.
Brexit Consequences for the US
On June 23, 2016, the United Kingdom voted to
leave the European Union. The day after the Brexit
vote, the Dow fell 610.32 points.8 This event, known
as Brexit, has thrown the U.K. economy into turmoil
as they struggle to structure and negotiate terms of
the withdrawal with the EU.
On March 29, 2017, the U.K.’s Prime Minister,
Theresa May, submitted the withdrawal notification
to the EU, which gave the U.K. and EU until March
29, 2019 to negotiate an agreement. However, after
several failed attempts at departure, the U.K. was
granted an extension by the European Union on
leaving the EU. The new deadline is now set for
October 31st, 2019. Over three years have now
passed since the vote and the possibility of a no-deal
8 Brexit Consequences for the UK, the EU, and the United States. The Balance. Kimberly Amadeo. December 27, 2018.
Brexit increases every day. Many believe a no-deal
Brexit could be devastating to the global economy.
The effect Brexit will have on the U.S. economy will
depend on what form the departure takes and how
closely the U.K. stays aligned with the EU, as well as
to what extent this impacts trade relationships. The
United States is the U.K.’s largest single-country
trading partner, as U.S. goods and services trade
with United Kingdom totaled an estimated $262.3
billion in 2018, with exports at $141.1 billion and
imports at $121.2 billion. The uncertainty
surrounding the Brexit withdrawal coupled with the
current trade tensions in the global market is cause
for concern for many U.S. economists.
Furthermore, Brexit dampens business growth for
companies that operate in Europe. U.S. businesses
4 ©Grossman Yanak & Ford LLP 2019
are the most significant investors in Great Britain,
investing billions of dollars and employing more
than a million people. These companies use the U.K.
as the gateway to free trade with the 28 EU nations.
Moreover, Britain has a substantial investment in
the U.S., and the instability caused by Brexit could
impact up to two million U.S./British jobs. Overall,
the uncertainty over their future could impede
growth in the coming period.
Current Employment Conditions
The Bureau of Labor Statistics (BLS) reported that
the unemployment rate was unchanged at 3.7
percent in June 2019.9 Total nonfarm payroll
employment increased by 224,000 in June 2019
with notable job gains in professional and business
services, healthcare, and in transportation and
warehousing.10 Employment growth averaged
172,000 per month in the first half of 2019,
compared with 223,000 per month in 2018.11
In March, the number of long-term unemployed,
defined as those jobless for 27 weeks or more, was
essentially unchanged at 1.4 million. This accounts
for 23.7 percent of the total unemployed. The labor
force participation rate at 62.9 percent has shown
little change over the past twelve months. The study
provides the additional detail by sector:12
Professional and business services added
51,000 jobs in June, following little
employment change in May (+24,000).
Employment growth in the industry has
averaged 35,000 per month in the first half
of 2019, compared with an average
monthly gain of 47,000 in 2018.
Employment in health care increased by
35,000 over the month and by 403,000 over
the past 12 months. In June, job growth
occurred in ambulatory health care services
(+19,000) and hospitals (+11,000).
9 The Employment Situation – June 2019. Bureau of Labor Statistics. News Release, July 5, 2019. 10 Ibid.
Transportation and warehousing added
24,000 jobs over the month and 158,000
over the past 12 months. In June, job gains
occurred among couriers and messengers
(+7,000) and in air transportation (+3,000).
Construction employment continued to
trend up in June (+21,000), in line with its
average monthly gain over the prior 12
months.
Manufacturing employment edged up in
June (+17,000), following 4 months of little
change. So far this year, job growth in the
industry has averaged 8,000 per month,
compared with an average of 22,000 per
month in 2018. In June, employment rose in
computer and electronic products (+7,000)
and in plastics and rubber products
(+4,000).
Employment in other major industries,
including mining, wholesale trade, retail
trade, information, financial activities,
leisure and hospitality, and government,
showed little change over the month.
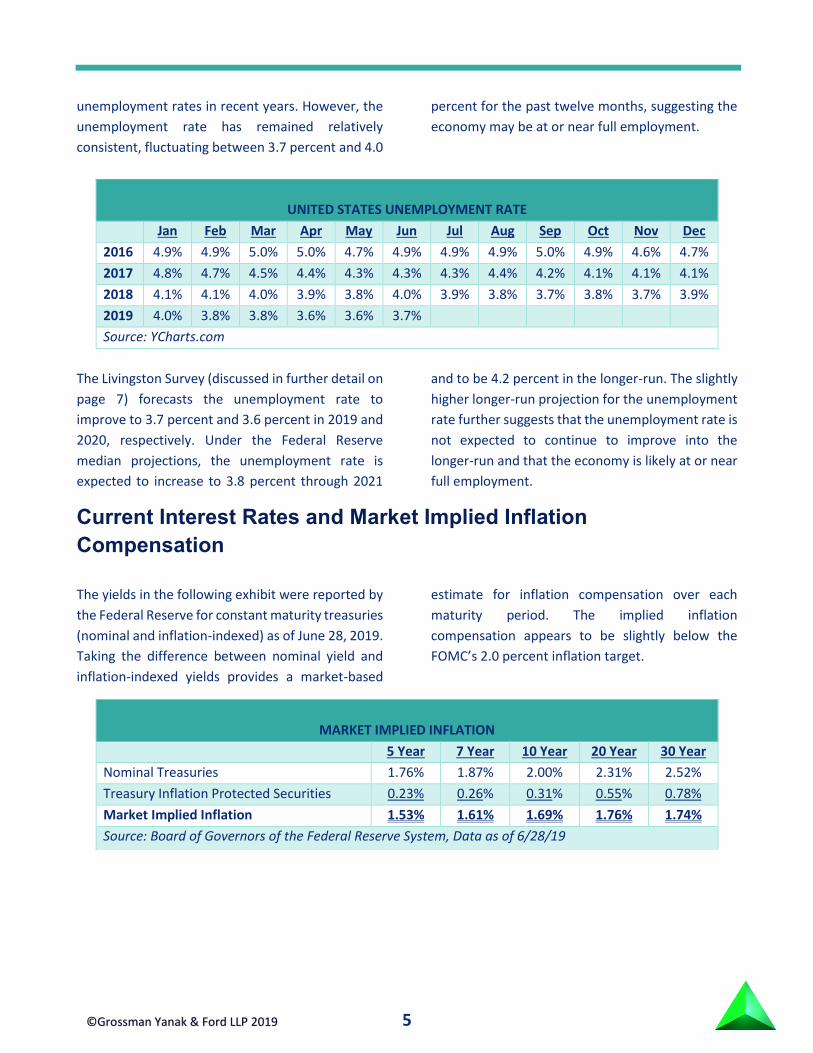
The following table contains historical
unemployment rates for the United States,
indicating a clear trend of decreasing
11 Ibid. 12 Ibid.
5 ©Grossman Yanak & Ford LLP 2019
unemployment rates in recent years. However, the
unemployment rate has remained relatively
consistent, fluctuating between 3.7 percent and 4.0
percent for the past twelve months, suggesting the
economy may be at or near full employment.
UNITED STATES UNEMPLOYMENT RATE
Jan Feb Mar Apr May Jun Jul Aug Sep Oct Nov Dec
2016 4.9% 4.9% 5.0% 5.0% 4.7% 4.9% 4.9% 4.9% 5.0% 4.9% 4.6% 4.7%
2017 4.8% 4.7% 4.5% 4.4% 4.3% 4.3% 4.3% 4.4% 4.2% 4.1% 4.1% 4.1%
2018 4.1% 4.1% 4.0% 3.9% 3.8% 4.0% 3.9% 3.8% 3.7% 3.8% 3.7% 3.9%
2019 4.0% 3.8% 3.8% 3.6% 3.6% 3.7%
Source: YCharts.com
The Livingston Survey (discussed in further detail on
page 7) forecasts the unemployment rate to
improve to 3.7 percent and 3.6 percent in 2019 and
2020, respectively. Under the Federal Reserve
median projections, the unemployment rate is
expected to increase to 3.8 percent through 2021
and to be 4.2 percent in the longer-run. The slightly
higher longer-run projection for the unemployment
rate further suggests that the unemployment rate is
not expected to continue to improve into the
longer-run and that the economy is likely at or near
full employment.
Current Interest Rates and Market Implied Inflation
Compensation
The yields in the following exhibit were reported by
the Federal Reserve for constant maturity treasuries
(nominal and inflation-indexed) as of June 28, 2019.
Taking the difference between nominal yield and
inflation-indexed yields provides a market-based
estimate for inflation compensation over each
maturity period. The implied inflation
compensation appears to be slightly below the
FOMC’s 2.0 percent inflation target.
MARKET IMPLIED INFLATION
5 Year 7 Year 10 Year 20 Year 30 Year
Nominal Treasuries 1.76% 1.87% 2.00% 2.31% 2.52%
Treasury Inflation Protected Securities 0.23% 0.26% 0.31% 0.55% 0.78%
Market Implied Inflation 1.53% 1.61% 1.69% 1.76% 1.74%
Source: Board of Governors of the Federal Reserve System, Data as of 6/28/19
6 ©Grossman Yanak & Ford LLP 2019
Government Spending – United States Deficit and Outlook
A source of volatility in the economic outlook for the
United States lies in government spending the
current level of debt held by the United States. The
Congressional Budget Office (“CBO”) publishes
reports presenting projections that indicate what
federal deficits, debt, revenues, and spending, and
the economic path underlying them, would be for
the current year and next ten years if existing laws
governing taxes and spending generally remain
unchanged.13
In the May 2019 edition of the CBO’s projections,
the federal budget deficit is projected at $896 billion
for 2019 and would grow to $1.3 trillion by 2029.14
The deficits that the CBO projects would average 4.3
percent of gross domestic product (“GDP”) over
2020 to 2029. Other than the period immediately
after World War II, the only other time the average
deficit has been so large over so many years was
after the 2007 to 2009 recession.15 Over the past 50
years, deficits have averaged 2.9 percent of GDP.16
The CBO notes persistently large deficits would lead
to significant growth in debt held by the public.
Under current law, the federal government is
projected to borrow an additional $12.7 trillion
from the end of 2018 through 2029, increasing the
debt held by the public to $28.5 trillion, or 92
percent of GDP, by the end of the period, an
increase of 78 percent over the current level.17
The CBO cautions that beyond 2029, if current laws
remained in place, deficits would grow, driving debt
to its highest levels in the nation’s history. Those
large deficits would arise because outlays,
particularly for Social Security, Medicare, and
interest on the debt, would rise steadily under
current law, and revenues would not keep pace with
the growth in spending.
The CBO also provides a discussion of revenues and
GDP for the projection period. Following a decline in
revenues as a percentage of GDP between 2017 and
2018, the CBO projects revenues to grow slightly
relative to the size of the economy in 2019, to just
over 16.5 percent of GDP.18 This reflects an amount
below the average of 17.4 percent of GDP recorded
over the past 50 years.19 The CBO attributes the
decline in revenues in 2018 to the enactment of the
2017 Tax Cuts and Jobs Act, which made significant
changes to the individual and corporate tax systems
that lowered taxes owed by most individuals and
businesses.
The CBO projects federal revenues will rise from
16.5 percent of GDP in 2019 to 17.4 percent in 2025,
then grow more rapidly, reaching 18.3 percent of
GDP in 2029.20 The CBO attributes the growth after
2025 to the scheduled expiration of nearly all of the
individual income tax provisions of the 2017 Tax
Cuts and Jobs Act. Meanwhile, federal outlays are
projected to climb from 20.7 percent of GDP in 2019
to 22.8 percent in 2029. Overall, the CBO’s
projections show a persistent gap between
revenues and outlays, even though both
components of the federal budget grow faster than
GDP.
13 Updated Budget Projections: 2019 to 2029. Congressional Budget Office. May 2, 2019. 14 Ibid. 15 Ibid. 16 Ibid.
17 Ibid. 18 Ibid. 19 Ibid. 20 Ibid.
7 ©Grossman Yanak & Ford LLP 2019
Economic Forecast – Major Indicators
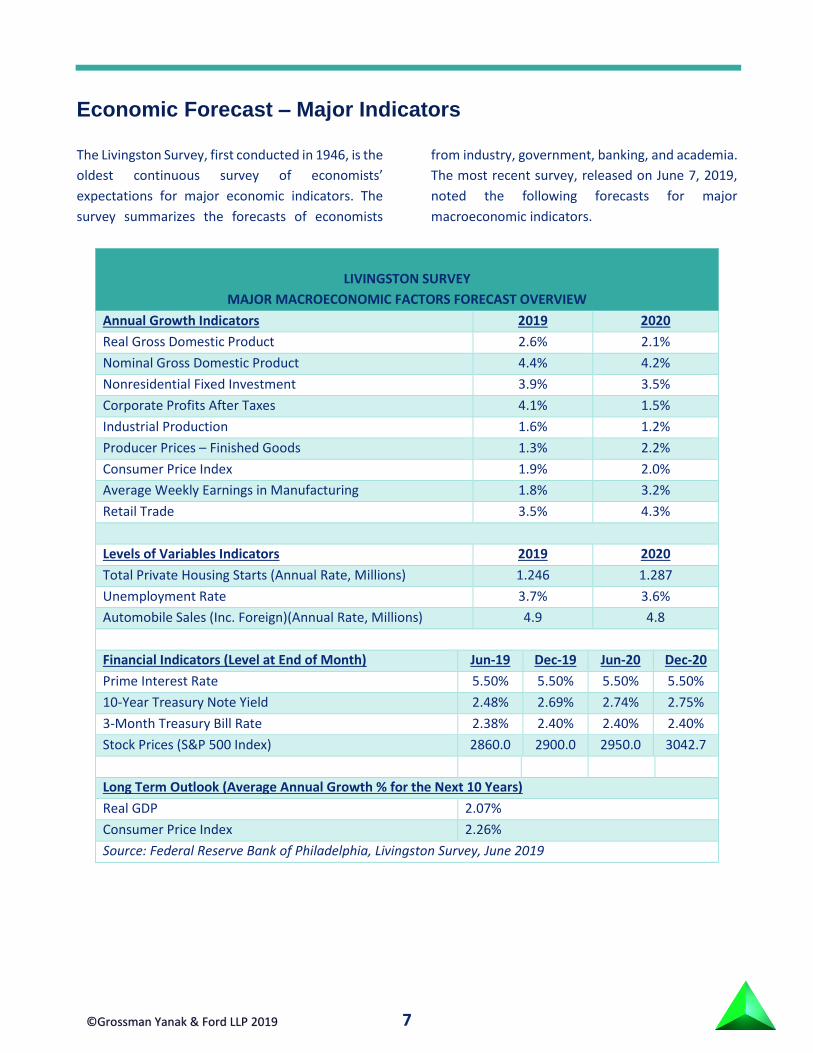
The Livingston Survey, first conducted in 1946, is the
oldest continuous survey of economists’
expectations for major economic indicators. The
survey summarizes the forecasts of economists
from industry, government, banking, and academia.
The most recent survey, released on June 7, 2019,
noted the following forecasts for major
macroeconomic indicators.
LIVINGSTON SURVEY
MAJOR MACROECONOMIC FACTORS FORECAST OVERVIEW
Annual Growth Indicators 2019 2020
Real Gross Domestic Product 2.6% 2.1%
Nominal Gross Domestic Product 4.4% 4.2%
Nonresidential Fixed Investment 3.9% 3.5%
Corporate Profits After Taxes 4.1% 1.5%
Industrial Production 1.6% 1.2%
Producer Prices – Finished Goods 1.3% 2.2%
Consumer Price Index 1.9% 2.0%
Average Weekly Earnings in Manufacturing 1.8% 3.2%
Retail Trade 3.5% 4.3%
Levels of Variables Indicators 2019 2020
Total Private Housing Starts (Annual Rate, Millions) 1.246 1.287
Unemployment Rate 3.7% 3.6%
Automobile Sales (Inc. Foreign)(Annual Rate, Millions) 4.9 4.8
Financial Indicators (Level at End of Month) Jun-19 Dec-19 Jun-20 Dec-20
Prime Interest Rate 5.50% 5.50% 5.50% 5.50%
10-Year Treasury Note Yield 2.48% 2.69% 2.74% 2.75%
3-Month Treasury Bill Rate 2.38% 2.40% 2.40% 2.40%
Stock Prices (S&P 500 Index) 2860.0 2900.0 2950.0 3042.7
Long Term Outlook (Average Annual Growth % for the Next 10 Years)
Real GDP 2.07%
Consumer Price Index 2.26%
Source: Federal Reserve Bank of Philadelphia, Livingston Survey, June 2019
8 ©Grossman Yanak & Ford LLP 2019
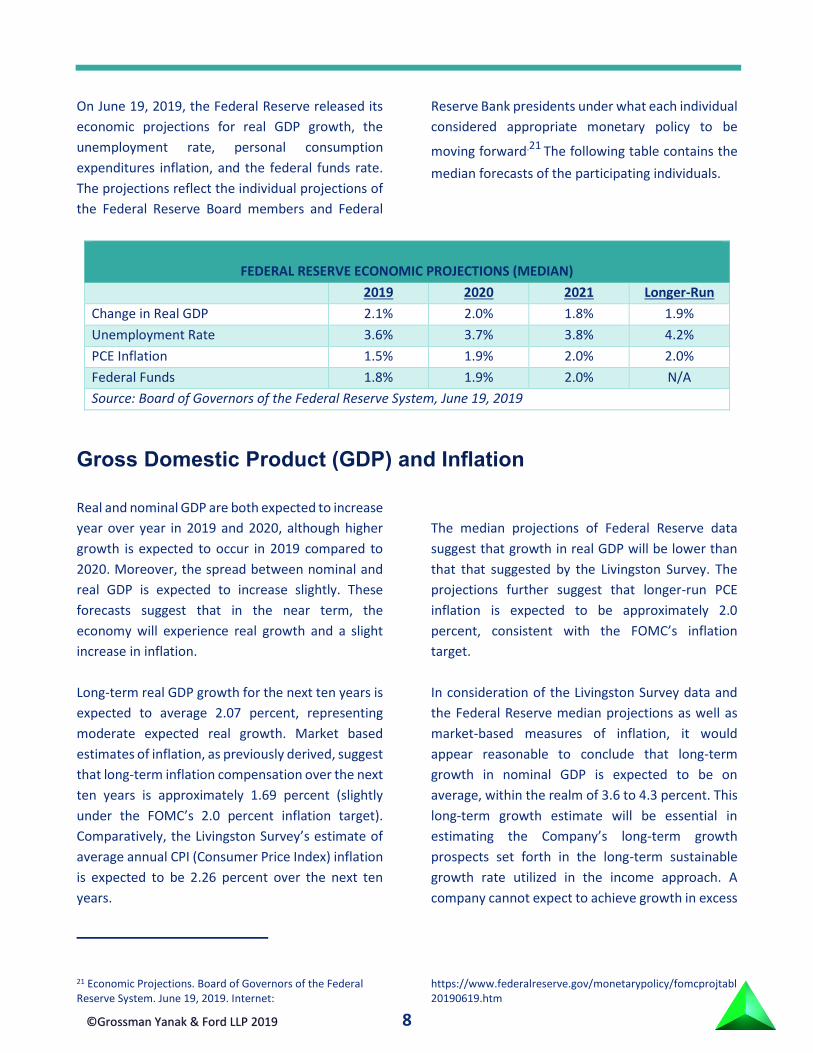
On June 19, 2019, the Federal Reserve released its
economic projections for real GDP growth, the
unemployment rate, personal consumption
expenditures inflation, and the federal funds rate.
The projections reflect the individual projections of
the Federal Reserve Board members and Federal
Reserve Bank presidents under what each individual
considered appropriate monetary policy to be
moving forward.21 The following table contains the
median forecasts of the participating individuals.
FEDERAL RESERVE ECONOMIC PROJECTIONS (MEDIAN)
2019 2020 2021 Longer-Run
Change in Real GDP 2.1% 2.0% 1.8% 1.9%
Unemployment Rate 3.6% 3.7% 3.8% 4.2%
PCE Inflation 1.5% 1.9% 2.0% 2.0%
Federal Funds 1.8% 1.9% 2.0% N/A
Source: Board of Governors of the Federal Reserve System, June 19, 2019
Gross Domestic Product (GDP) and Inflation
Real and nominal GDP are both expected to increase
year over year in 2019 and 2020, although higher
growth is expected to occur in 2019 compared to
2020. Moreover, the spread between nominal and
real GDP is expected to increase slightly. These
forecasts suggest that in the near term, the
economy will experience real growth and a slight
increase in inflation.
Long-term real GDP growth for the next ten years is
expected to average 2.07 percent, representing
moderate expected real growth. Market based
estimates of inflation, as previously derived, suggest
that long-term inflation compensation over the next
ten years is approximately 1.69 percent (slightly
under the FOMC’s 2.0 percent inflation target).
Comparatively, the Livingston Survey’s estimate of
average annual CPI (Consumer Price Index) inflation
is expected to be 2.26 percent over the next ten
years.
21 Economic Projections. Board of Governors of the Federal Reserve System. June 19, 2019. Internet:
The median projections of Federal Reserve data
suggest that growth in real GDP will be lower than
that that suggested by the Livingston Survey. The
projections further suggest that longer-run PCE
inflation is expected to be approximately 2.0
percent, consistent with the FOMC’s inflation
target.
In consideration of the Livingston Survey data and
the Federal Reserve median projections as well as
market-based measures of inflation, it would
appear reasonable to conclude that long-term
growth in nominal GDP is expected to be on
average, within the realm of 3.6 to 4.3 percent. This
long-term growth estimate will be essential in
estimating the Company’s long-term growth
prospects set forth in the long-term sustainable
growth rate utilized in the income approach. A
company cannot expect to achieve growth in excess
https://www.federalreserve.gov/monetarypolicy/fomcprojtabl20190619.htm
9 ©Grossman Yanak & Ford LLP 2019
of that achieved by the economy in which it
operates into perpetuity (as implied by the terminal
value/capitalization of free cash flow methodology
calculation utilized under the income approach).
The estimated long-term growth rate for the United
States economy will serve as a ceiling for what the
Company can expect to achieve in the long-term.
Industrial Production and Manufacturing
Under the Livingston Survey forecasts, industrial
production (manufacturing, mining, and electric and
gas utilities) is expected to grow by 1.6 percent in
2019 and 1.2 percent in 2020. Moreover, average
weekly earnings in manufacturing is expected to
grow by 1.8 and 3.2 percent in 2019 and 2020,
respectively. Overall, these forecasts suggest that
growth in industrial production is expected to
continue, but slowdown in the next two years, while
overall earnings, however, are expected to increase.
The Institute for Supply Management’s (ISM)
Purchasing Managers Index (PMI) can be used as an
indication as to whether or not the manufacturing
sector of the economy is expanding or contracting.22
A PMI above 50.0 percent indicates that the
manufacturing economy is generally expanding
while a reading below 50.0 percent indicates that it
is generally contracting.23 The PMI decreased 0.4
percentage points to 51.7 percent in June of 2019
compared to May 2019, indicating growth in the
manufacturing economy for the 34th consecutive
month. 24 However this is the lowest reading since
October 2016.25 Overall, comments reflect
continued expanding business strength, but at soft
levels; June was the third straight month with
slowing PMI expansion.26 During June, demand
expansion ended, while consumption continued to
expand, and prices contracted for the first time
since February. Inputs were lower this month due to
inventory contraction and suppliers continuing to
deliver faster. Overall, inputs indicate supply chains
are responding faster and supply mangers are again
closely watching inventories.27
In general, a PMI above 42.9 percent, over a period
of time, generally indicates an expansion of the
overall economy. Therefore, the June PMI indicates
growth for the 122nd consecutive month in the
overall economy, as well as the 34th straight month
of growth in the manufacturing sector. The past
relationship between the PMI and the overall
economy indicates that the PMI for June
corresponds to a 2.6 percent increase in real gross
domestic product on an annualized basis.28
Corporate Profits and Retail Trade
The Livingston Survey forecasts corporate profits
after taxes to increase substantially in 2019 by 4.1
percent followed by modest expected growth of 1.5
percent in 2020.
Retail trade is anticipated to experience continued
growth in coming years with expected growth of
3.5 percent and 4.3 percent in 2019 and 2020,
respectively.
22June 2019 ISM Report On Business. Institute for Supply Management. July 1, 2019. 23 Ibid. 24 Ibid.
25 Ibid. 26 Ibid. 27 Ibid. 28 Ibid.
10 ©Grossman Yanak & Ford LLP 2019
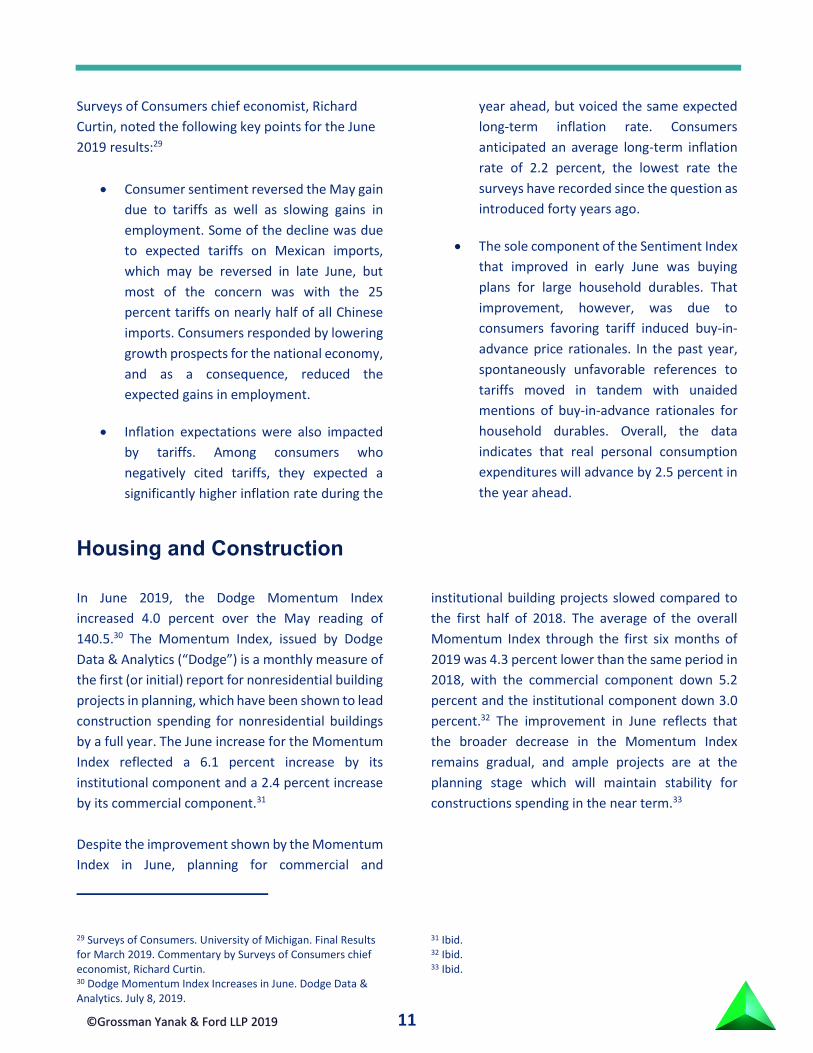
Consumer Confidence
The backbone of the United States economy is its
consumer base. Consumers influence the outlook
for the United States economy immensely through
their spending and savings decisions. As such,
measures of consumer confidence and sentiment
may provide valuable information in discerning the
expected outlook of the economy. The University of
Michigan’s June 2019 Surveys of Consumers
reported the following results:
UNIVERSITY OF MICHIGAN SURVEYS OF CONSUMERS
Jun-19 May-19 Jun-18 M-M Change Y-Y Change
Index of Consumer Sentiment 97.9 100.0 98.2 -2.1% -0.3%
Current Economic Conditions Index 112.5 110.0 116.5 +2.5% -4.0%
Index of Consumer Expectations 88.6 93.5 86.3 -4.9% +2.3%
Source: University of Michigan, Surveys of Consumers, Preliminary Results for June 2019
The above metrics primarily indicate a decrease in consumer confidence when compared to both May 2019 and
June 2018.
11 ©Grossman Yanak & Ford LLP 2019
Surveys of Consumers chief economist, Richard
Curtin, noted the following key points for the June
2019 results:29
Consumer sentiment reversed the May gain
due to tariffs as well as slowing gains in
employment. Some of the decline was due
to expected tariffs on Mexican imports,
which may be reversed in late June, but
most of the concern was with the 25
percent tariffs on nearly half of all Chinese
imports. Consumers responded by lowering
growth prospects for the national economy,
and as a consequence, reduced the
expected gains in employment.
Inflation expectations were also impacted
by tariffs. Among consumers who
negatively cited tariffs, they expected a
significantly higher inflation rate during the
year ahead, but voiced the same expected
long-term inflation rate. Consumers
anticipated an average long-term inflation
rate of 2.2 percent, the lowest rate the
surveys have recorded since the question as
introduced forty years ago.
The sole component of the Sentiment Index
that improved in early June was buying
plans for large household durables. That
improvement, however, was due to
consumers favoring tariff induced buy-in-
advance price rationales. In the past year,
spontaneously unfavorable references to
tariffs moved in tandem with unaided
mentions of buy-in-advance rationales for
household durables. Overall, the data
indicates that real personal consumption
expenditures will advance by 2.5 percent in
the year ahead.
Housing and Construction
In June 2019, the Dodge Momentum Index
increased 4.0 percent over the May reading of
140.5.30 The Momentum Index, issued by Dodge
Data & Analytics (“Dodge”) is a monthly measure of
the first (or initial) report for nonresidential building
projects in planning, which have been shown to lead
construction spending for nonresidential buildings
by a full year. The June increase for the Momentum
Index reflected a 6.1 percent increase by its
institutional component and a 2.4 percent increase
by its commercial component.31
Despite the improvement shown by the Momentum
Index in June, planning for commercial and
29 Surveys of Consumers. University of Michigan. Final Results for March 2019. Commentary by Surveys of Consumers chief economist, Richard Curtin. 30 Dodge Momentum Index Increases in June. Dodge Data & Analytics. July 8, 2019.
institutional building projects slowed compared to
the first half of 2018. The average of the overall
Momentum Index through the first six months of
2019 was 4.3 percent lower than the same period in
2018, with the commercial component down 5.2
percent and the institutional component down 3.0
percent.32 The improvement in June reflects that
the broader decrease in the Momentum Index
remains gradual, and ample projects are at the
planning stage which will maintain stability for
constructions spending in the near term.33
31 Ibid. 32 Ibid. 33 Ibid.
12 ©Grossman Yanak & Ford LLP 2019
Interest Rates
The Livingston Survey forecasts that interest rates
will rise over the course of 2019 and 2020, noting
expected increases in the 10-year Treasury note
yield, and 3-month Treasury bill rate. However, the
Livingston Survey forecasts no change in the prime
rate over the two year period.
As of June 28, 2019, the prime interest rate is 5.5
percent.34 The prime rate is posted by a majority of
the top 25 (by assets in domestic offices) insured
U.S. chartered commercial banks and is one of the
several base rates used by banks to price short-term
business loans.35 While the Federal Reserve does
not control the prime rate, many banks base their
prime rates partly on the target level of the federal
funds rate (the rate that banks charge each other for
short-term loans) as established by the FOMC.36 As
previously noted, in determining the size of future
adjustments to the target range for the federal
funds rate, the FOMC “…will assess realized and
expected economic conditions relative to its
maximum employment objective and its symmetric
2 percent inflation objective. This assessment will
take into account a wide range of information,
including measures of labor market conditions,
indicators of inflation pressures and inflation
expectations, and readings on financial and
international developments.”37 It is reasonable to
believe if the Committee elects to increase the
federal funds rate, the prime rate will also increase.
The expected increase in the 10-year Treasury note
yield and 3-month Treasury bill rate suggest that the
risk free rate is expected to increase in coming
years. The risk free rate is a key component of the
cost of equity as derived under various
methodologies discussed within the income
approach section of this report. Keeping everything
else constant, both the forecasted increase in the
prime interest rate and risk free rate suggest that
the cost of capital (discussed in detail within the
income approach section of this report) will be
higher in the future. A higher cost of capital will
decrease the present value of expected future cash
flows, thereby decreasing the present value of an
asset.
However, in public markets, asset prices continually
change with changes in future expectations. Thus,
the impact on publicly traded equity valuations is
focused not necessarily on the trend of higher
future interest rates, but rather, whether or not the
current expectations are higher or lower than
previous estimates.
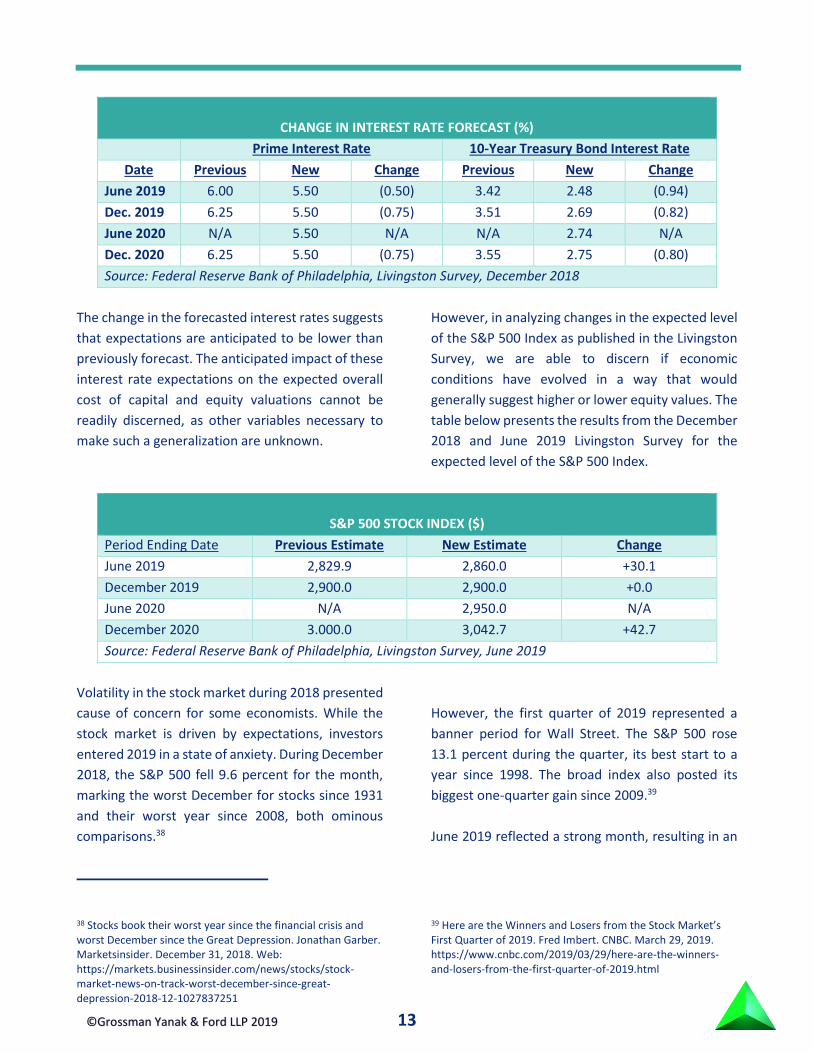
The following table compares key interest rate
estimates from the previous Livingston Survey
(December 2018) to the June 2019 survey results.
34 Board of Governors of the Federal Reserve System, Select Interest Rates, Bank Prime Loan. Internet: https://www.federalreserve.gov/releases/h15/ 35 Ibid. 36 “What is the prime rate and does the Federal Reserve set the prime rate?” Board of Governors of the Federal Reserve
System, Current FAQs. Internet: https://www.federalreserve.gov/faqs/credit_12846.htm 37 Board of Governors of the Federal Reserve System, Press Release. June 19, 2019. Internet.
13 ©Grossman Yanak & Ford LLP 2019
CHANGE IN INTEREST RATE FORECAST (%)
Prime Interest Rate 10-Year Treasury Bond Interest Rate
Date Previous New Change Previous New Change
June 2019 6.00 5.50 (0.50) 3.42 2.48 (0.94)
Dec. 2019 6.25 5.50 (0.75) 3.51 2.69 (0.82)
June 2020 N/A 5.50 N/A N/A 2.74 N/A
Dec. 2020 6.25 5.50 (0.75) 3.55 2.75 (0.80)
Source: Federal Reserve Bank of Philadelphia, Livingston Survey, December 2018
The change in the forecasted interest rates suggests
that expectations are anticipated to be lower than
previously forecast. The anticipated impact of these
interest rate expectations on the expected overall
cost of capital and equity valuations cannot be
readily discerned, as other variables necessary to
make such a generalization are unknown.
However, in analyzing changes in the expected level
of the S&P 500 Index as published in the Livingston
Survey, we are able to discern if economic
conditions have evolved in a way that would
generally suggest higher or lower equity values. The
table below presents the results from the December
2018 and June 2019 Livingston Survey for the
expected level of the S&P 500 Index.
S&P 500 STOCK INDEX ($)
Period Ending Date Previous Estimate New Estimate Change
June 2019 2,829.9 2,860.0 +30.1
December 2019 2,900.0 2,900.0 +0.0
June 2020 N/A 2,950.0 N/A
December 2020 3.000.0 3,042.7 +42.7
Source: Federal Reserve Bank of Philadelphia, Livingston Survey, June 2019
Volatility in the stock market during 2018 presented
cause of concern for some economists. While the
stock market is driven by expectations, investors
entered 2019 in a state of anxiety. During December
2018, the S&P 500 fell 9.6 percent for the month,
marking the worst December for stocks since 1931
and their worst year since 2008, both ominous
comparisons.38
38 Stocks book their worst year since the financial crisis and worst December since the Great Depression. Jonathan Garber. Marketsinsider. December 31, 2018. Web: https://markets.businessinsider.com/news/stocks/stock-market-news-on-track-worst-december-since-great-depression-2018-12-1027837251
However, the first quarter of 2019 represented a
banner period for Wall Street. The S&P 500 rose
13.1 percent during the quarter, its best start to a
year since 1998. The broad index also posted its
biggest one-quarter gain since 2009.39
June 2019 reflected a strong month, resulting in an
39 Here are the Winners and Losers from the Stock Market’s First Quarter of 2019. Fred Imbert. CNBC. March 29, 2019. https://www.cnbc.com/2019/03/29/here-are-the-winners-and-losers-from-the-first-quarter-of-2019.html
14 ©Grossman Yanak & Ford LLP 2019
overall strong first half of 2019. All three indexes are
up on the year, with the S&P 500 climbing 17
percent in the first six months, the Dow Jones
industrial average registering a 14 percent gain and
the technology-heavy NASDAQ composite index
leading everybody with 20 percent.40 All three are
close to their all-time highs on a June bounce
following remarks from Federal Reserve Chair
Jerome H. Powell that “we will act as appropriate to
sustain the expansion.”41
The Dow closed in June at 26,599, reflecting a gain
of 7.1 percent – the best first half since 1999 and
best June since 1938, when it surged 24 percent.42
The S&P 500 closed at 2,941, up 6.89 percent for
June, reflecting its best first half since 1997and the
best June since 1955, when it climbed 8.2 percent.43
The NASDAQ composite finished June at 8,006,
reflecting an increase of 7.4 percent, and the
NASDAQ’s best June since 2000, when it gained 16.6
percent.44
Recent estimates from the Livingston Survey reflect
increased expectations over those produced in
December 2018, as forecasters expect stock prices
to increase over the next two years, with the index
rising to 3,042.7 by the end of 2020. Overall, this
suggests that in aggregate, economic conditions are
expected to be favorable to equity valuations in
general.
Conclusion
During the first half of 2019, economic activity in the
United States continued to expand at a modest
pace. While the labor market has remained strong,
the economy is likely at or near full employment,
thus labor markets have been tight across a broad
range of occupations, and as a result, wage growth
has been moderate. The tightening labor market is
expected to continue in the near term.
Industrial production and average weekly earnings
in manufacturing is expected to grow in 2019 and
2020. The overall perception of the economic
conditions are that growth in industrial production
is expected to continue, but slowdown in the next
two years, while overall earnings, however, are
expected to increase.
40 Stocks finish best June in decades, capping strong first half of 2019. The Washington Post. June 28, 2019. Thomas Heath. https://www.washingtonpost.com/business/2019/06/28/stocks-finish-best-june-decades-capping-strong-first-half/?noredirect=on&utm_term=.fd26aff2ea3e
Furthermore, global factors are creating concern for
investors, as the world is facing increased trade
conflict in 2019, which many consider the biggest
risk facing the global economy in 2019. As the U.S.
government works with China on negotiations for a
trade deal, the recently imposed tariffs on Chinese
imports are expected to have an overall negative
impact on the U.S. economy. Moreover, as the
Brexit deadline, although extended to October, still
looms, questions arise regarding the uncertainty of
economic conditions in Europe and their impact on
the U.S. in the near term.
Volatility in the stock market during the end of 2018
was a cause of concern for investors, as December
2018 marked the worst December for stocks since
1931, and the worst year since 2008. However, the
first half of 2019 represented a banner period, with
41 Ibid. 42 Ibid. 43 Ibid. 44 Ibid.
15 ©Grossman Yanak & Ford LLP 2019
JOIN US TO EARN COMPLIMENTARY CONTINUING EDUCATION CREDITS
We are pleased to continue our CLE series in 2019. Enjoy networking over breakfast and earn two hours of complimentary CLE and
CPE credit. We will be hosting the following Fall sessions:
October 3 - Butler County: Pittsburgh Marriot North, Cranberry Township October 10 - Allegheny County: Rivers Club, Pittsburgh October 17 - Washington County: Hilton Garden Inn/Southpointe, Cannonsburg October 31 - Westmoreland County: St. Vincent College, Latrobe
For more information or to register, please contact Carissa Janczewski at 412-338-9300 or [email protected]
the Dow, NASDAQ and S&P 500 close to their all-
time highest levels. Furthermore, forecasters
expect stock prices to increase over the next two
years, which would suggest that in aggregate,
economic conditions are expected to be favorable
to equity valuations.
Finally, measures of consumer confidence, which
provide valuable information in discerning the
expected outlook of the economy, indicate a
decrease in consumer confidence in June 2019
compared to May, and a decrease from this time
last year, indicating an overall decrease in consumer
confidence. The decrease in consumer confidence
was primarily driven by the aforementioned tariffs,
which has caused consumers to anticipate lower
growth prospects for the national economy and as a
result, fewer gains in employment.
Overall, the United States economy appears to be
firmly positioned for modest growth, however,
uncertainty continues to exist amongst investors in
their assessment of what the future economy has in
store, particularly due to factors such as tariffs,
Brexit, and the U.S. deficit. Though for now, the
overall outlook remains positive.
Grossman Yanak & Ford LLP
GYF was founded on the idea that the keys to providing
proactive accounting assistance are a true commitment
to developing a relationship with our clients and a
dedication to a high level of service. We believe that
quality service is driven by active involvement of
seasoned professionals on a continuing basis.
GYF professionals focus their time in distinct service
areas to provide specialized expertise to clients. Further,
our professionals work as a team to integrate our
services, allowing you to use a single firm to handle all
of your accounting and consulting needs.
To learn more, read about our Services and Industries
to find out why so many individuals and organizations
choose GYF for their accounting and business consulting
services.
Grossman Yanak & Ford LLP is a
Pittsburgh-based CPA firm that provides
a full range of accounting and consulting
services, including:
Þ Audit and Assurance
Þ Tax Advisory and Compliance
Þ Business Advisory
Þ Business Valuation and Litigation
Support
Þ ERP Solutions
For more information on our service
offerings, please visit www.gyf.com