Embed Size (px)
Citation preview
Copyright © 2015 United Launch Alliance, LLC. Unpublished Work. All Rights Reserved.
United Launch Alliance CAV-2015
Matthew Bloom
Extracted FTC Controlled Data. Warning: This document may contain Extracted Boeing Spacecraft Proprietary Data. This data is protected by the Atlas Program FTC Firewall. This data is marked by a change bar and in the HEADER and FOOTER. Access to this data is limited to those ULA employees who have been briefed on FTC Firewall practices and procedures and have signed the briefing statement (Need-To-Know Employees). This data must be stored in a container when not in use.
4 October 2015 | 2
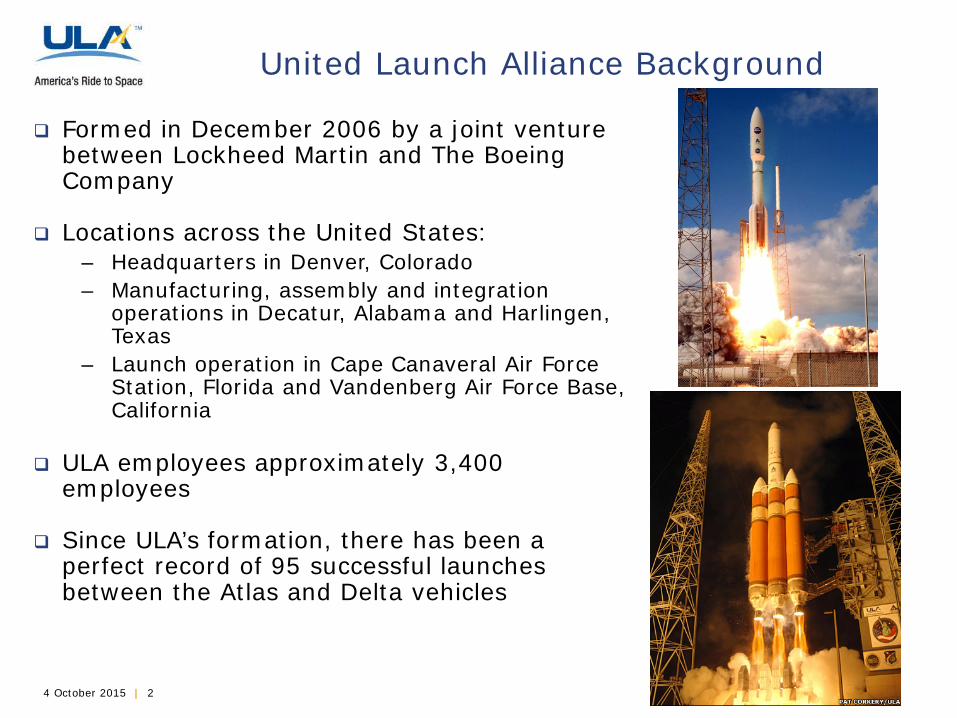
Formed in December 2006 by a joint venture between Lockheed Martin and The Boeing Company
Locations across the United States: – Headquarters in Denver, Colorado – Manufacturing, assembly and integration
operations in Decatur, Alabama and Harlingen, Texas
– Launch operation in Cape Canaveral Air Force Station, Florida and Vandenberg Air Force Base, California
ULA employees approximately 3,400 employees
Since ULA’s formation, there has been a perfect record of 95 successful launches between the Atlas and Delta vehicles
United Launch Alliance Background
4 October 2015 | 3
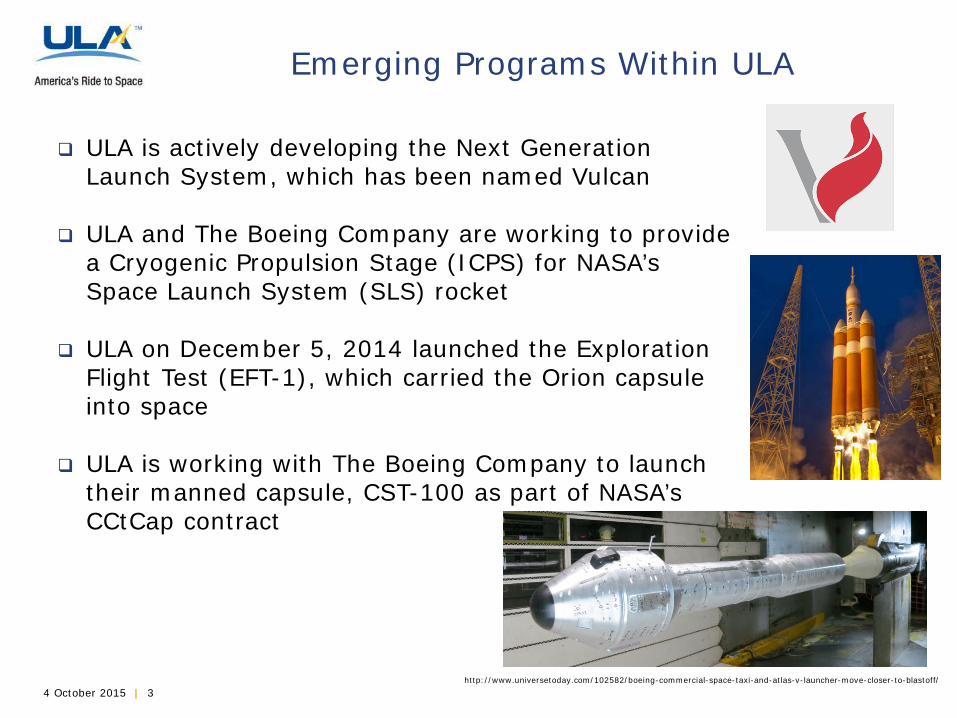
ULA is actively developing the Next Generation Launch System, which has been named Vulcan
ULA and The Boeing Company are working to provide a Cryogenic Propulsion Stage (ICPS) for NASA’s Space Launch System (SLS) rocket
ULA on December 5, 2014 launched the Exploration Flight Test (EFT-1), which carried the Orion capsule into space
ULA is working with The Boeing Company to launch their manned capsule, CST-100 as part of NASA’s CCtCap contract
Emerging Programs Within ULA
http://www.universetoday.com/102582/boeing-commercial-space-taxi-and-atlas-v-launcher-move-closer-to-blastoff/
4 October 2015 | 4
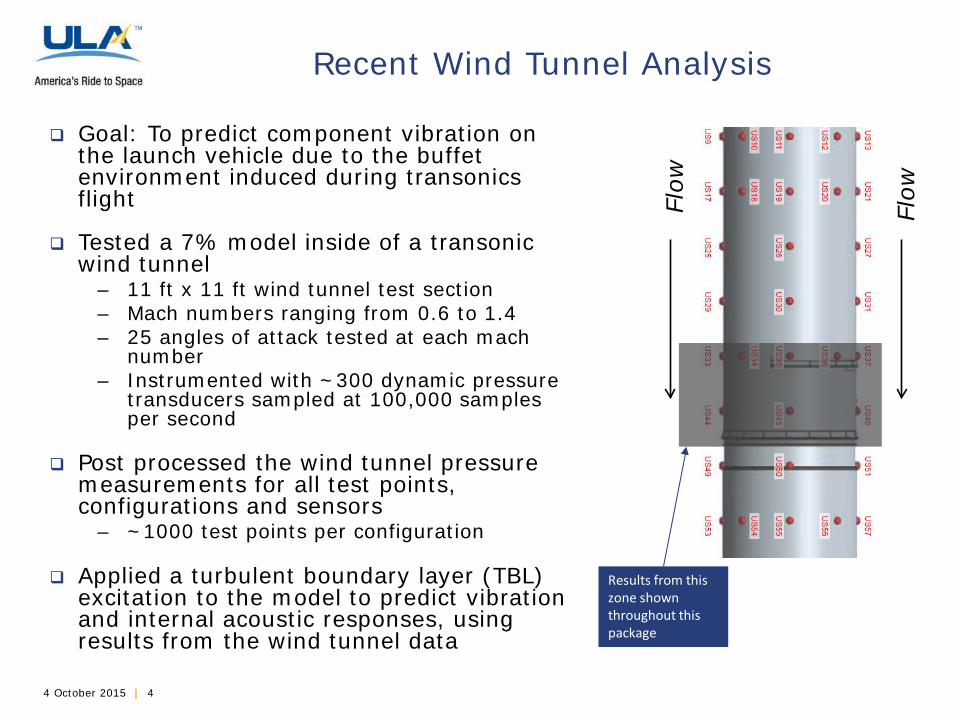
Goal: To predict component vibration on the launch vehicle due to the buffet environment induced during transonics flight
Tested a 7% model inside of a transonic wind tunnel
– 11 ft x 11 ft wind tunnel test section – Mach numbers ranging from 0.6 to 1.4 – 25 angles of attack tested at each mach
number – Instrumented with ~300 dynamic pressure
transducers sampled at 100,000 samples per second
Post processed the wind tunnel pressure measurements for all test points, configurations and sensors
– ~1000 test points per configuration
Applied a turbulent boundary layer (TBL) excitation to the model to predict vibration and internal acoustic responses, using results from the wind tunnel data
Recent Wind Tunnel Analysis
Flow
Flow
Results from this zone shown throughout this package
4 October 2015 | 5
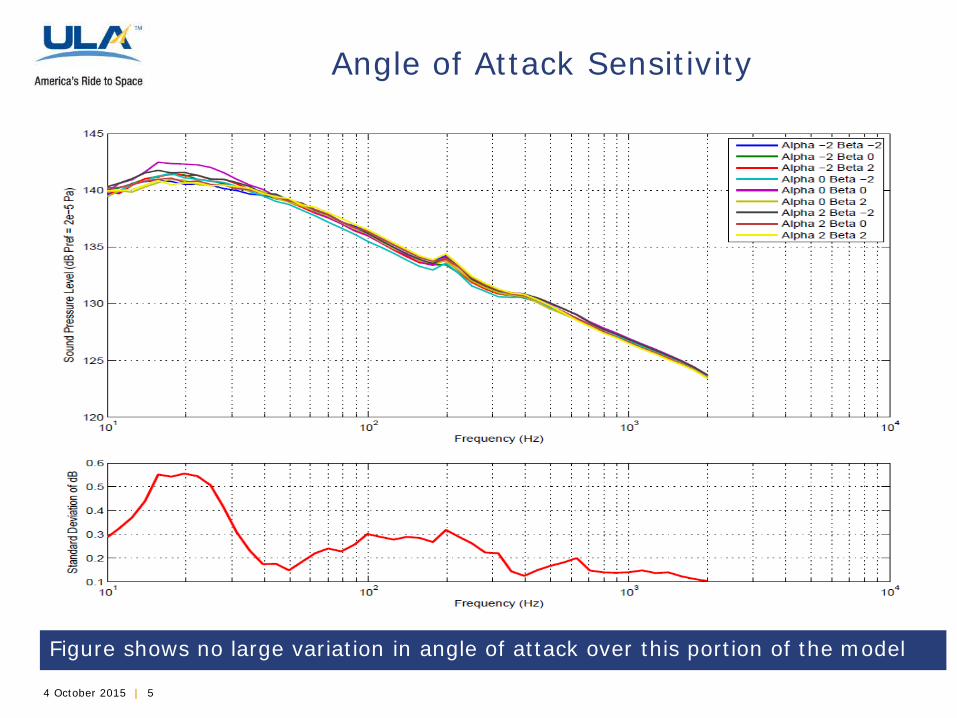
Angle of Attack Sensitivity
Figure shows no large variation in angle of attack over this portion of the model
4 October 2015 | 6
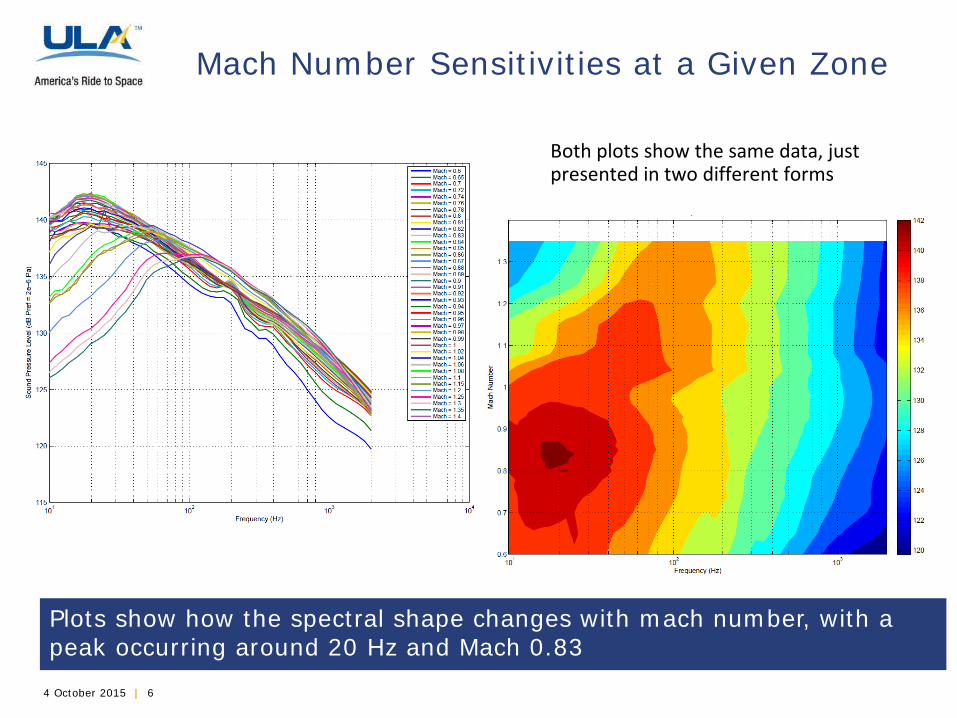
Mach Number Sensitivities at a Given Zone
Plots show how the spectral shape changes with mach number, with a peak occurring around 20 Hz and Mach 0.83
Both plots show the same data, just presented in two different forms
4 October 2015 | 7
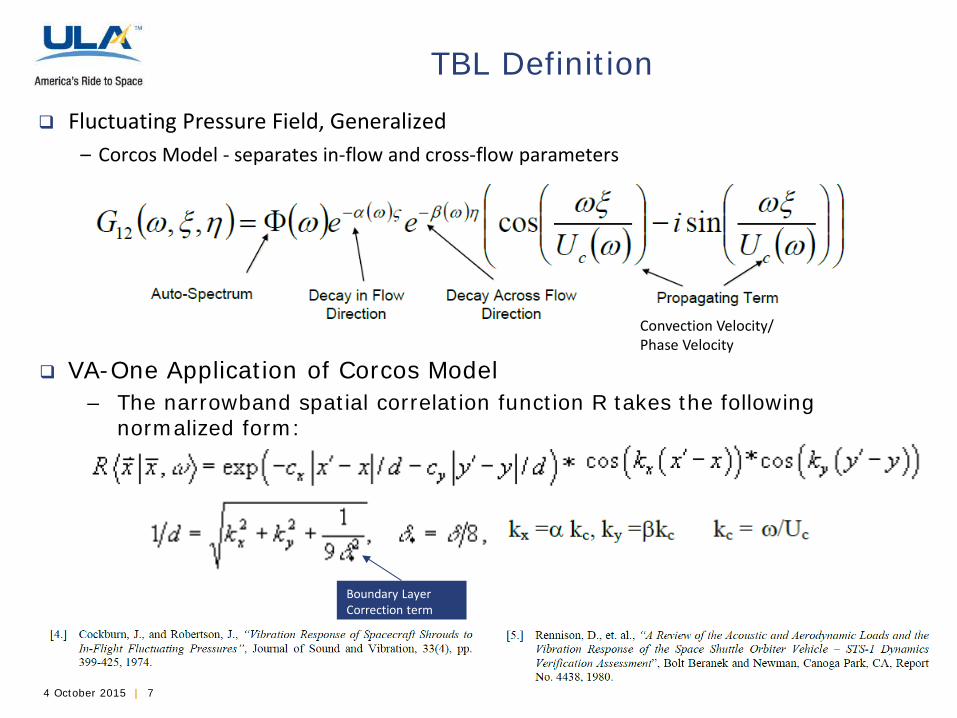
TBL Definition
VA-One Application of Corcos Model – The narrowband spatial correlation function R takes the following
normalized form:
Boundary Layer Correction term
Fluctuating Pressure Field, Generalized – Corcos Model - separates in-flow and cross-flow parameters
Convection Velocity/ Phase Velocity
4 October 2015 | 8
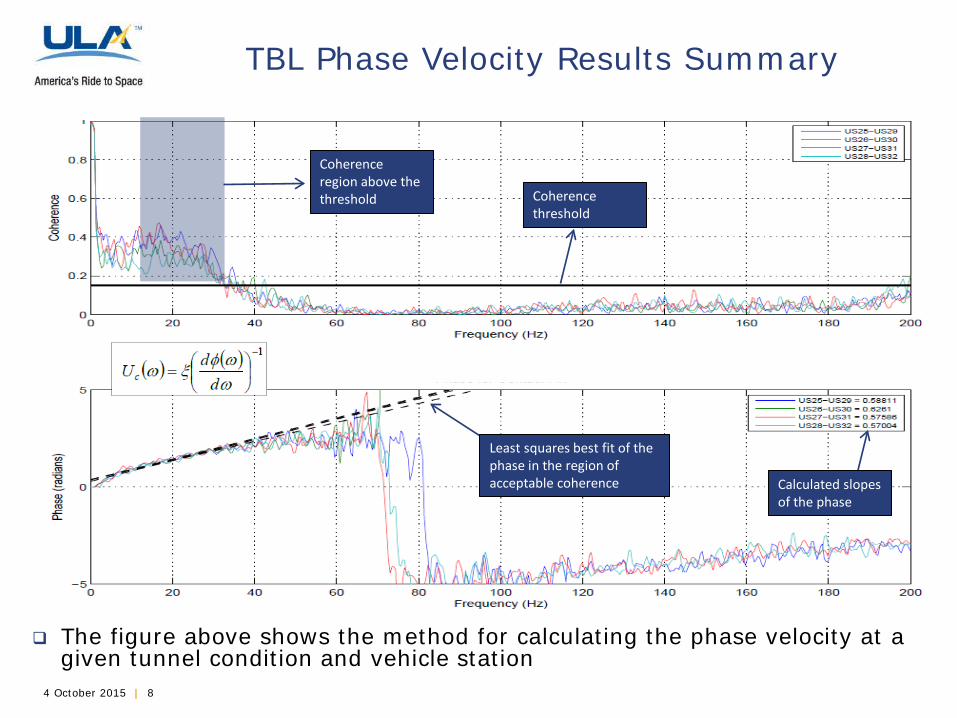
TBL Phase Velocity Results Summary
The figure above shows the method for calculating the phase velocity at a given tunnel condition and vehicle station
Coherence threshold
Coherence region above the threshold
Calculated slopes of the phase
Least squares best fit of the phase in the region of acceptable coherence
4 October 2015 | 9
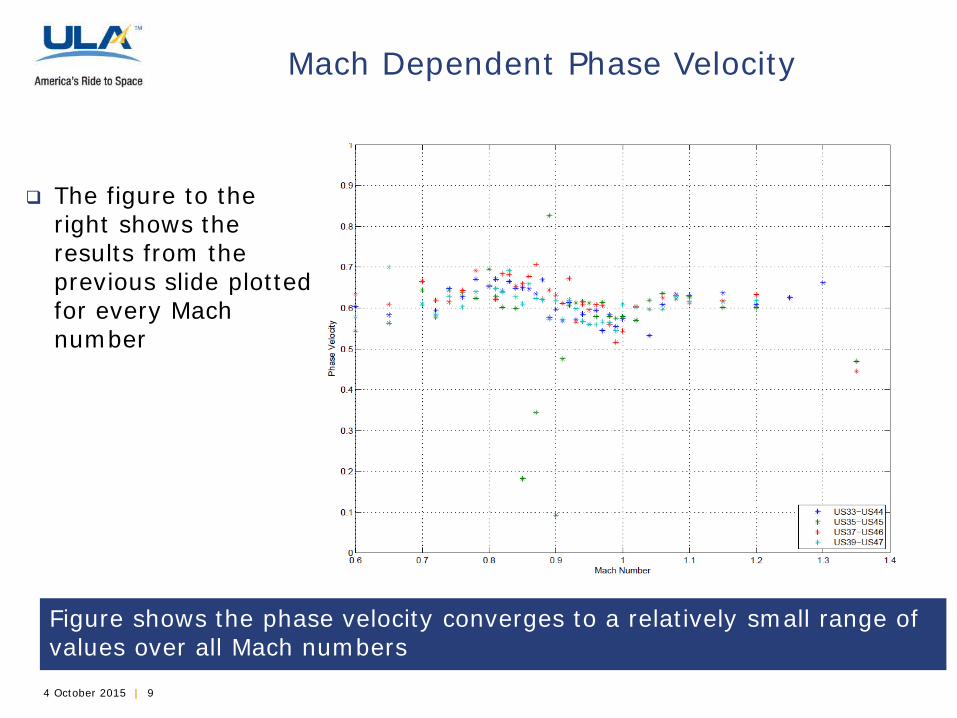
Mach Dependent Phase Velocity
The figure to the right shows the results from the previous slide plotted for every Mach number
Figure shows the phase velocity converges to a relatively small range of values over all Mach numbers
4 October 2015 | 10
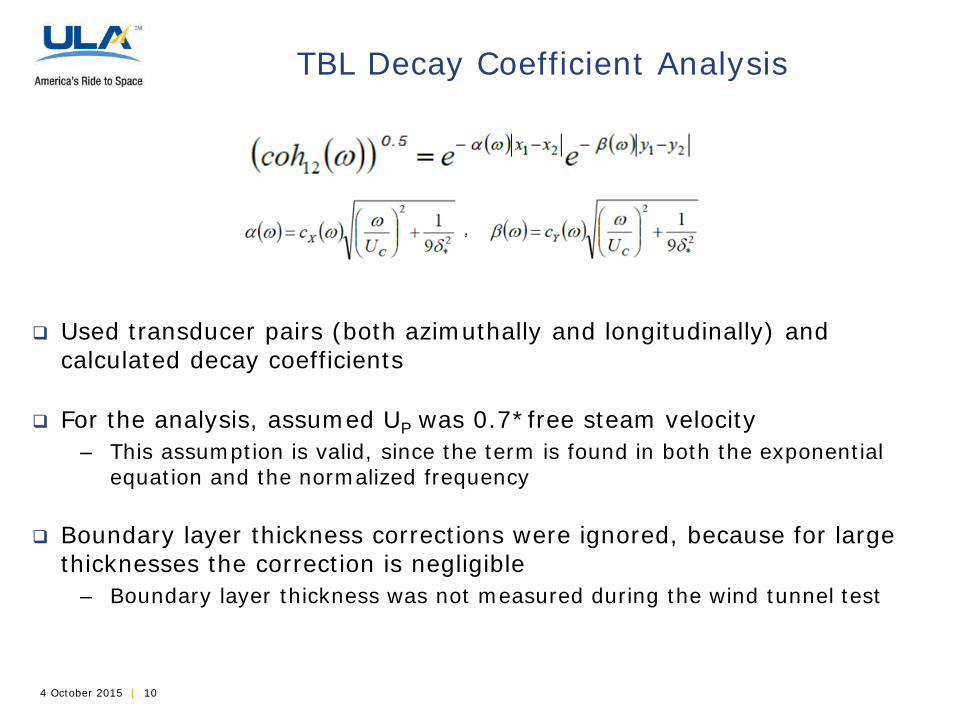
TBL Decay Coefficient Analysis
Used transducer pairs (both azimuthally and longitudinally) and calculated decay coefficients
For the analysis, assumed UP was 0.7*free steam velocity
– This assumption is valid, since the term is found in both the exponential equation and the normalized frequency
Boundary layer thickness corrections were ignored, because for large thicknesses the correction is negligible
– Boundary layer thickness was not measured during the wind tunnel test
4 October 2015 | 11
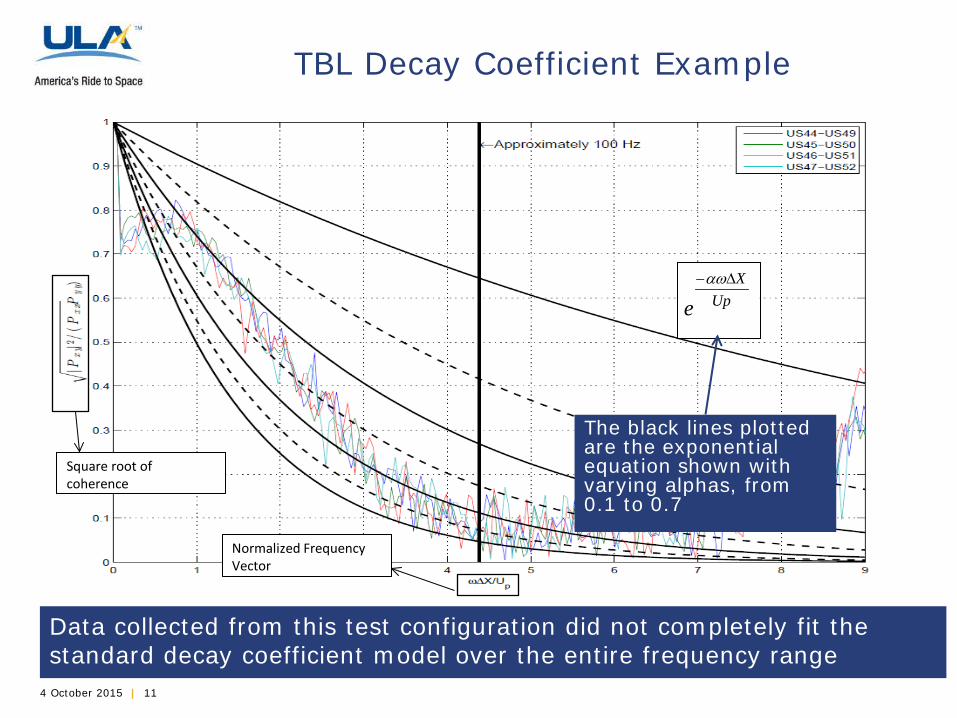
TBL Decay Coefficient Example
Up
X
e
∆−αω
Square root of coherence
Normalized Frequency Vector
The black lines plotted are the exponential equation shown with varying alphas, from 0.1 to 0.7
Data collected from this test configuration did not completely fit the standard decay coefficient model over the entire frequency range
4 October 2015 | 12
Determining a better mathematical fit to the decay coefficients
Expanding the frequency range where the TBL parameters are applicable
Studying predicted model vibration sensitivities due to variations in the defined TBL parameters
Collecting more closely spaced transducer data from wind tunnel tests to better understand the TBL coefficients
Continuing Work on this Topic