Embed Size (px)
Citation preview

United Kingdom contribution to the EMEP assessment 2004
David Fowler, Rognvald I Smith and Jennifer Muller CEH Edinburgh
Summary
• While the EMEP model in its various forms has provided an invaluable basis for the negotiation of Protocols to control transboundary pollution, its ability to accurately represent wet deposition fields in the UK is limited by the absence of orographic enhancement within the model. As a result the spatial pattern of wet deposition produced by EMEP differs dramatically from UK estimates leading to an underestimation of deposition to the most sensitive regions of the UK.
• The model performs well for some parameters, e.g. SO2 dry deposition (budget and spatial pattern), and the total Sulphur and reduced Nitrogen (budgets only).
• However, the UK total oxidized deposition budget modelled by EMEP is substantially smaller (40%) than the measurement based estimate. The difference is due not only to orographic enhancement of wet deposition, but also a measured HNO3 concentration field which shows much larger concentrations than the EMEP model.
• It is clear that on a sub-national scale the EMEP model outputs differ from UK deposition fields derived from measurements. While further investigation of the cause of these differences is recommended, there is also a need to assess how significant they are to policy development in the EMEP region.
Introduction The focus of this report is a comparison between the EMEP Eulerian model and UK measurement based estimates of the deposition totals and spatial distribution of the major contributors to acidification and eutrophication in the UK. A much wider discussion of long-range transport of pollutants and the effects on terrestrial ecosystems in the UK can be found within the report of the National Expert Group on Transboundary Air Pollution (NEGTAP, 2001 http://www.nbu.ac.uk/negtap/). There are many different approaches to estimate deposition and methods for comparing models and measurements, and the range of different models applied to estimate deposition in the UK during the last decade is large. However, the focus for the UNECE assessment of the problems of acidification and eutrophication in Europe, and the review of existing protocols now relies primarily on the EMEP Eulerian model. This model described in detail by Simpson et al. (2003), provides concentration and deposition fields for the entire EMEP domain with a spatial resolution of 50km x 50km. The assessment of effects on terrestrial ecosystems is largely based on estimates of exceedance of critical loads and critical levels, and requires spatial information on ecosystem sensitivity, which typically is applied at a much finer scale than the spatial resolution of the EMEP Eulerian model. For example, in the UK, the critical loads ecosystem sensitivity information for soil acidification is based on data with a spatial resolution of 1 km x 1km (NEGTAP 2001). Deposition data with a spatial resolution of 50 km x 50 km is coarse relative to the spatial variability in ecosystem sensitivity and, more importantly, there are processes generating substantial spatial variability in deposition at a much finer scale than 50 km. These processes include orographic enhancement of wet deposition (Fowler et al 1988), and the effect of large local gradients in the concentrations of the gaseous species contributing the majority of dry deposition (notably SO2 and NH3). There is also a relationship between the processes generating the spatial variability in ecosystem sensitivity and the variability in deposition, further complicating the assessment. The estimates of both wet and dry deposition in the UK for the assessment of current and historical environmental effects is based on measured concentration fields of the ions in precipitation and in orographic cloud, and measured concentration fields for the primary and secondary pollutants
EMEP Assessment Report – Part II
234
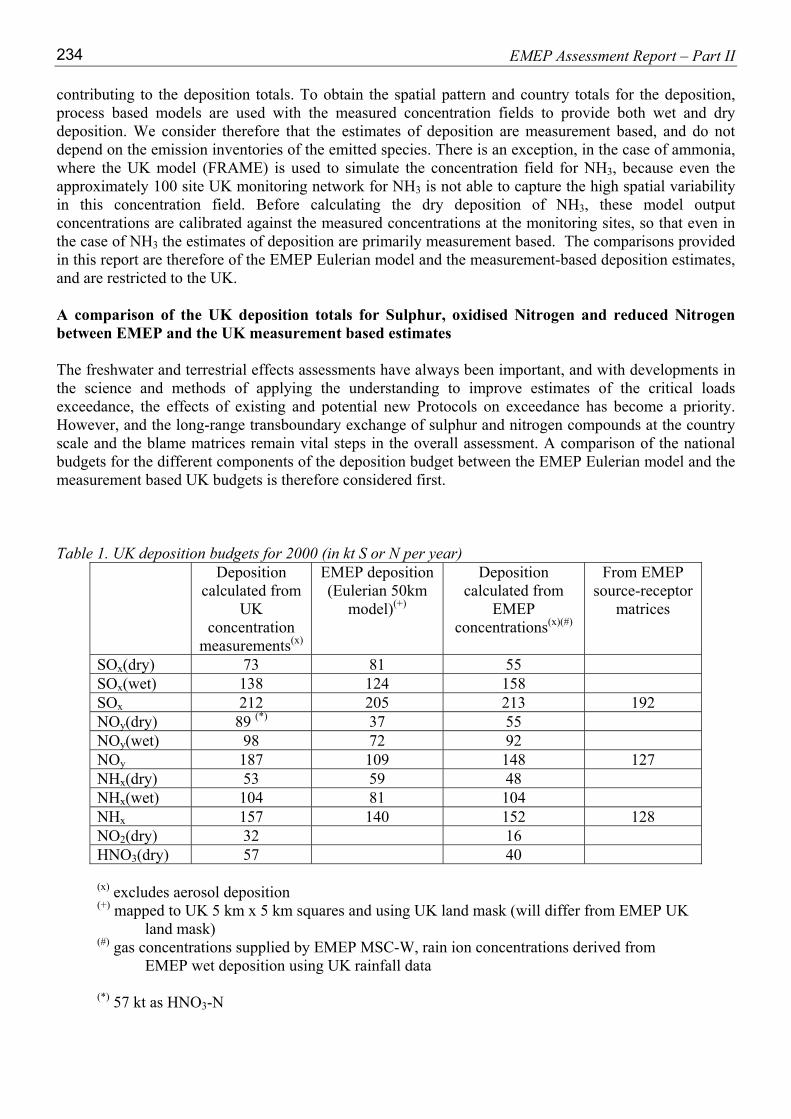
contributing to the deposition totals. To obtain the spatial pattern and country totals for the deposition, process based models are used with the measured concentration fields to provide both wet and dry deposition. We consider therefore that the estimates of deposition are measurement based, and do not depend on the emission inventories of the emitted species. There is an exception, in the case of ammonia, where the UK model (FRAME) is used to simulate the concentration field for NH3, because even the approximately 100 site UK monitoring network for NH3 is not able to capture the high spatial variability in this concentration field. Before calculating the dry deposition of NH3, these model output concentrations are calibrated against the measured concentrations at the monitoring sites, so that even in the case of NH3 the estimates of deposition are primarily measurement based. The comparisons provided in this report are therefore of the EMEP Eulerian model and the measurement-based deposition estimates, and are restricted to the UK. A comparison of the UK deposition totals for Sulphur, oxidised Nitrogen and reduced Nitrogen between EMEP and the UK measurement based estimates The freshwater and terrestrial effects assessments have always been important, and with developments in the science and methods of applying the understanding to improve estimates of the critical loads exceedance, the effects of existing and potential new Protocols on exceedance has become a priority. However, and the long-range transboundary exchange of sulphur and nitrogen compounds at the country scale and the blame matrices remain vital steps in the overall assessment. A comparison of the national budgets for the different components of the deposition budget between the EMEP Eulerian model and the measurement based UK budgets is therefore considered first. Table 1. UK deposition budgets for 2000 (in kt S or N per year)
Deposition calculated from
UK concentration
measurements(x)
EMEP deposition (Eulerian 50km
model)(+)
Deposition calculated from
EMEP concentrations(x)(#)
From EMEP source-receptor
matrices
SOx(dry) 73 81 55 SOx(wet) 138 124 158 SOx 212 205 213 192 NOy(dry) 89 (*) 37 55 NOy(wet) 98 72 92 NOy 187 109 148 127 NHx(dry) 53 59 48 NHx(wet) 104 81 104 NHx 157 140 152 128 NO2(dry) 32 16 HNO3(dry) 57 40 (x) excludes aerosol deposition
(+) mapped to UK 5 km x 5 km squares and using UK land mask (will differ from EMEP UK land mask)
(#) gas concentrations supplied by EMEP MSC-W, rain ion concentrations derived from EMEP wet deposition using UK rainfall data
(*) 57 kt as HNO3-N
Contribution from: the United Kingdom
235
Table 1 provides, for Sulphur, oxidized and reduced Nitrogen, the wet and dry deposition totals for the year 2000 for the 24 x 106 ha of the UK in kT S or N. The measurement-based values do not include dry deposition of aerosol SO4
2-, NO3- or NH4
+. A new measurement network for aerosol concentrations throughout the UK has been operating since 2000 and will be used to estimate aerosol deposition to the UK for inclusion in the totals by January 2005. Sulphur
Dry Deposition The dry deposition from measured concentration fields, (hereafter referred to as UKm) at 73 kT S, is smaller than the EMEPe (Eulerian) model estimate of 81 kT S, by 10% and so is in reasonable agreement (10-20%). The EMEPe model provides the concentration field for SO2, and thus it is possible to examine differences in the dry deposition models between EMEPe and UKm, labelled ‘Deposition calculated from EMEP concentrations' in Table 1. The dry deposition of SO2 from EMEPe concentrations is substantially smaller (>20% different) than the UKm value implying larger deposition velocities in the EMEPe modelling process, most likely from different formulations in the surface resistance component.
Wet deposition Wet deposition of sulphur from the EMEPe model of 124 kT S is smaller than the UKm value of 138 kT S by 10% in reasonable agreement. A rain ion concentration field for SO4 was derived from the EMEPe wet deposition of oxidised Sulphur using the UK rainfall data to estimate the rainfall in the 50 km x 50 km EMEP square. When this concentration was used with the UK orographic wet deposition procedure, the budget wet deposition becomes 158 kT S, suggesting that the EMEPe concentration of SO4 within the model is larger than the UKm concentration field.
Total S deposition The EMEPe (Eulerian) total of 205 kT S, is in very good agreement (<5% different) with the UKm estimate of 212 kT S. Using the EMEPe concentrations and the UKm deposition models gives a budget of 213 kT S, a total in excellent agreement (<1% different). However this comes from compensating factors of lower gas concentration against higher dry deposition velocity, and higher rain ion concentration against lower wet deposition rate when comparing the EMEPe to the UKm procedures. The total S deposition for the UK from the EMEP source–receptor matrices (Tarrason et al 2003) was 192 kT S, smaller than the UKm and EMEPe values by 9%. Oxidized Nitrogen
Dry deposition The UKm dry deposition of oxidized nitrogen is 89kTN, larger than the EMEPe estimate of 37 kT N by nearly a factor of 3 and very different in pattern. The difference is mainly due to HNO3, which in the UKm is based on a measured concentration field. Without the HNO3 the UKm estimate of 32 kT N is in reasonable agreement with the EMEPe estimate of oxidised N (including HNO3) within 15%. This shows both the value in having HNO3 concentration fields from direct measurements and the weakness in the EMEPe model for HNO3. Taking the EMEPe concentration fields for NO2 and HNO3 and applying the UK dry deposition model yields a larger deposition of oxidised N at 55 kT N, somewhat nearer to the 89 kT N in the UKm. It seems likely that the deposition velocities for NO2 and HNO3 used in the UKm approach are significantly larger than those used in the EMEPe model. Wet deposition Wet deposition of NO3
- by UKm at 98 kT N is larger than EMEPe (72 kT N) by 26%, and substantially different. (20 to 30 %). The main cause of the difference is the orographic enhancement within the UKm estimate as seen by examining columns 2 and 4 where the EMEPe concentration field with the UK orographic enhancement model estimates wet deposition as 92 kT N, is in good agreement (5 to 10 %) with the UKm estimates, (difference 6%). Total NOy deposition The UKm estimate of 187 kT N for total NOy deposition is very much larger than the EMEPe estimate of 109 kT N, a difference of 40%, due to the large HNO3 deposition in the UKm value and the effects of orographic enhancement. The EMEP source-receptor matrix value of 127 kT N, is also smaller, the difference from the UKm value being 32%. The contributions to the differences as a consequence of orographic effects and larger deposition velocities for NO2 in the UK approach can be seen in column 4 with the deposition calculated from EMEP concentration fields and UKm models of dry deposition and orographic enhancement reducing the UKm-EMEPe differences to 21%.
EMEP Assessment Report – Part II
236
Reduced Nitrogen
Dry deposition The dry deposition from UKm of 53 kT N is in reasonable agreement with the EMEPe value of 59 kT N. The difference (11%) is surprisingly small and represents a notable achievement by the EMEPe model because the UKm approach has the advantage of much greater spatial resolution (5 k x 5 km versus 50 km x 50 km) and calibration against a 100 site UK network of NH3 samplers. Given the spatial and vertical resolution of the EMEPe model, it is surprising that the dry deposition is not substantially smaller than the UKm value and it would be useful to explore the processes within the EMEPe model which generate this good result. Interestingly, the application of the EMEP concentration field with the dry deposition scheme used within the UKm process, yields a good estimate of dry NH3 deposition, at 48 kT N, within 10% of the UKm value.
Wet deposition Wet deposition of reduced nitrogen, as with oxidized nitrogen is larger in the UKm data than the EMEPe, due largely to the lack of orographic enhancement in the estimates from EMEPe which are 22% smaller then the UKm value. This is well illustrated by the deposition estimated from EMEP wet deposition data converted to a concentration field and then used to recalculate wet deposition according to the methods of the UKm approach, which are identical to the UKm data.
Total reduced Nitrogen deposition The total reduced Nitrogen estimates from EMEPe at 140 kT N are 11% smaller than the UKm value, and in reasonable agreement. The smaller deposition total from EMEPe is largely due to the lack of orographic enhancement effects in the model. However, given the uncertainties in reduced nitrogen as a consequence of the very patchy concentration field, it is a notable achievement for the EMEPe model to approach the deposition total of the much higher resolution UKm methodology. Comparing the EMEP and UK spatial distributions of Sulphur and Nitrogen deposition in the UK
Introduction The major focus of the assessment of inter-country exchange of pollutants in Europe lies in the quantification of the blame matrix, and the above comparisons help to test the quality of the EMEP model. However, the pattern of deposition within each country is very important for the assessment of environmental risk. In this section of the report we compare the mapped deposition of Sulphur, oxidized and reduced Nitrogen from the EMEP Eulerian model (EMEPe) against the measurement based estimates (UKm). For some of the comparisons, we present comparisons as three maps, UKm, EMEPe and EMEPconc (deposition of the EMEPe concentration field using the deposition scheme of the UKm). The latter map is presented to help to identify the source of differences between the UKm and EMEPe maps.

Contribution from: the United Kingdom
237
Sulphur
Figure 1. EMEPe dry deposition of oxidised sulphur
Figure 2. UKm dry deposition of oxidised sulphur
Figure 3. EMEPconc dry deposition of oxidised sulphur
Dry deposition The spatial resolutions of the two approaches are clear, with UKm at 5 km x 5 km and EMEPe at 50 km x 50 km, and as this is an obvious feature of the two methods it will not be commented on further. The geographical patterns of the two models are similar, with the two areas of large deposition, in the East Midlands and SE of England, well identified by both models. It is notable that the areas of large deposition in the NE of England and in Scotland are not well identified by the EMEP model. In fact for Scotland, the EMEPe dry deposition pattern differs considerably from the measurement based map, and the large conurbation of Glasgow and Strathclyde seems to be missing from the EMEPe map. It is worth considering whether the emission map for Scotland as used by EMEPe is correct. There is also an area of SE Wales, and western England where the EMEPe map seems to have significantly overestimated the dry deposition of SO2.
The Third map, (Fig 3) applying the UKm deposition scheme to the EMEPe concentration field is useful in pointing the most likely cause of the differences noted above as the concentration field, rather than the deposition scheme.

EMEP Assessment Report – Part II
238
Figure 4. UKm wet deposition of oxidised non-seasalt sulphur
Figure 5. EMEPe wet deposition of oxidised ns sulphur
Figure 6. EMEPconc wet deposition of oxidised ns sulphur
Wet deposition of Sulphur The UKm map (Fig 4) shows the wet deposition hotspots to be the areas receiving the greatest rainfall, the uplands, predominantly in the north and west of the country. The EMEPe model shows the wet deposition to be largest in the East Midlands of England and East Anglia. These maps could hardly be more different. One of the main causes of the difference can easily be seen when the deposition data from EMEPe are used to derive a concentration field for SO4
2- and this is used to calculate wet deposition in the same way as in UKm, the result being shown in Fig 6. This does not explain all the differences in the pattern in Wales and Scotland, the two areas of the UK subject to the greatest effects of freshwater acidification. If the data for EMEPe were correct there would probably not have been a problem of sulphur deposition in these acid sensitive areas of upland Britain. An extensive programme of research on orographic scavenging of pollutants in upland areas of the UK has provided the basis for the UKm wet deposition scheme and has shown that it is necessary to explicitly simulate these orographic processes to capture the pattern of deposition in upland UK. In short the EMEPe model is unsatisfactory for wet deposition of Sulphur in the UK.

Contribution from: the United Kingdom
239
Oxidized nitrogen
Figure 7. UKm dry deposition of oxidised nitrogen
Figure 8. EMEPe dry deposition of oxidised nitrogen
Figure 9. EMEPconc dry deposition of oxidised N
Dry deposition The dry deposition of
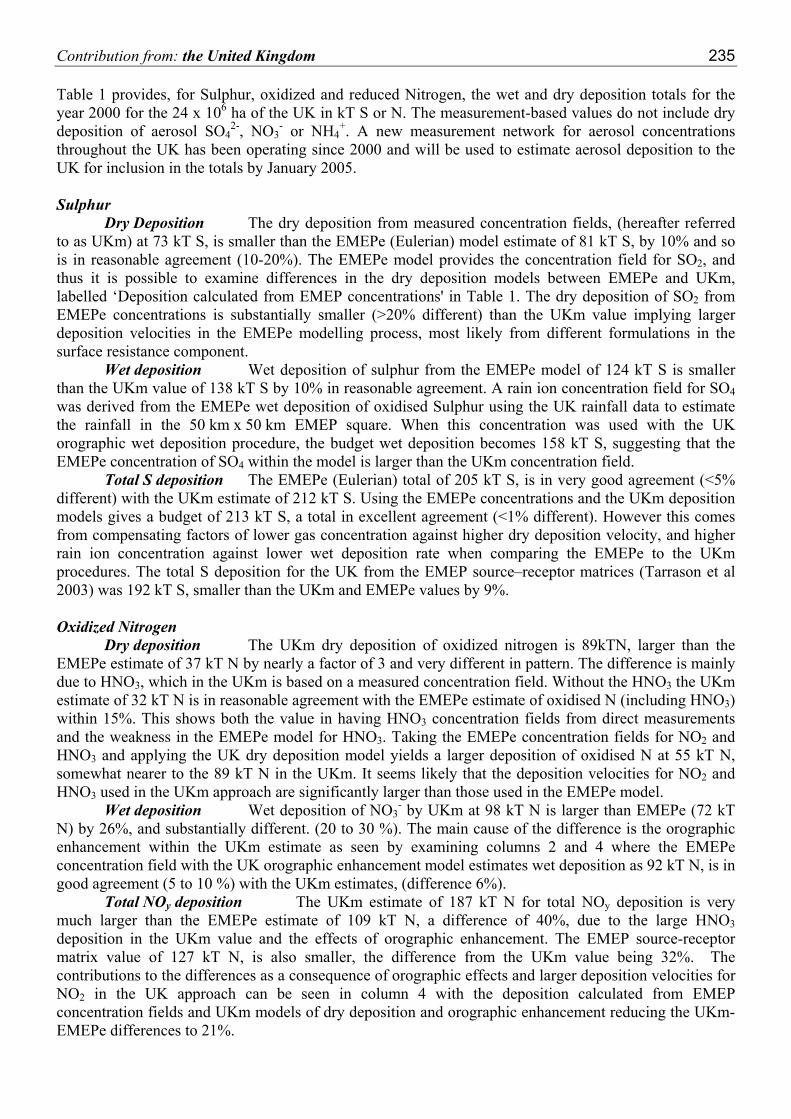
oxidized nitrogen from UKm (Fig7) shows a pattern of deposition linked closely to the distribution of the UK population, but with an emphasis towards the SE of the country, due to the spatial pattern in HNO3 deposition (Fig 10). The EMEPe map (Fig 8) shows a similar overall pattern but with much smaller values, due to the very much smaller HNO3 and smaller NO2 concentrations (Fig 12 and 13) and deposition in the EMEPe model.
Figures 10 and 11 show respectively the dry deposition of HNO3 from UKm and from a concentration field from EMEPe, dry deposited according to UKm. There are similarities but EMEPe values are much smaller and the largest values are restricted to the south coast of England.
EMEP Assessment Report – Part II
240
Figure 10. UKm dry deposition of nitric acid
Figure11. EMEPconc dry deposition of nitric acid
Figure 12. UKm dry deposition of nitrogen dioxide
Figure 13. EMEPconc dry deposition of nitrogen dioxide

Contribution from: the United Kingdom
241
Figure 14. UKm wet deposition of oxidised nitrogen
Figure 15. EMEPe wet deposition of oxidised nitrogen
Figure 16. EMEPconc wet deposition of oxidised nitrogen
Wet deposition of oxidized Nitrogen The wet deposition of oxidized nitrogen in the UKm map (Figure 14) show the largest values in the upland areas with large precipitation. The EMEPe wet deposition pattern (Fig 15) shows the largest values in the east of England and shows no similarities with the pattern of the UKm map. As in the case of wet deposition of SO4
2-, a map derived from a concentration field of NO3
- in precipitation derived from the EMEPe data has been used to create a deposition field using the UKm methods, and is shown in Fig 16. The mapping approach does create more deposition in the uplands of England and to some extent Wales and Scotland, but there are substantial differences in the absolute values in the two maps and there is more wet deposition in the SE of England than in the UKm map
EMEP Assessment Report – Part II
242
Reduced Nitrogen
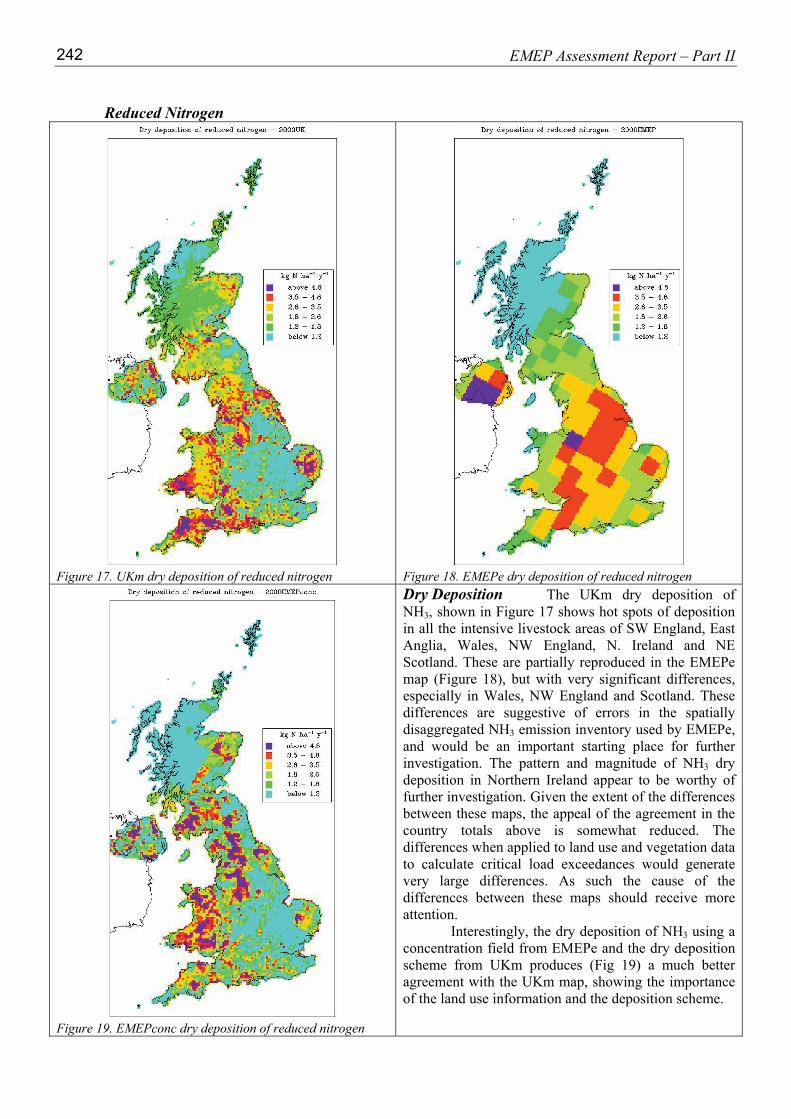
Figure 17. UKm dry deposition of reduced nitrogen
Figure 18. EMEPe dry deposition of reduced nitrogen
Figure 19. EMEPconc dry deposition of reduced nitrogen
Dry Deposition The UKm dry deposition of NH3, shown in Figure 17 shows hot spots of deposition in all the intensive livestock areas of SW England, East Anglia, Wales, NW England, N. Ireland and NE Scotland. These are partially reproduced in the EMEPe map (Figure 18), but with very significant differences, especially in Wales, NW England and Scotland. These differences are suggestive of errors in the spatially disaggregated NH3 emission inventory used by EMEPe, and would be an important starting place for further investigation. The pattern and magnitude of NH3 dry deposition in Northern Ireland appear to be worthy of further investigation. Given the extent of the differences between these maps, the appeal of the agreement in the country totals above is somewhat reduced. The differences when applied to land use and vegetation data to calculate critical load exceedances would generate very large differences. As such the cause of the differences between these maps should receive more attention.
Interestingly, the dry deposition of NH3 using a concentration field from EMEPe and the dry deposition scheme from UKm produces (Fig 19) a much better agreement with the UKm map, showing the importance of the land use information and the deposition scheme.
Contribution from: the United Kingdom
243
243
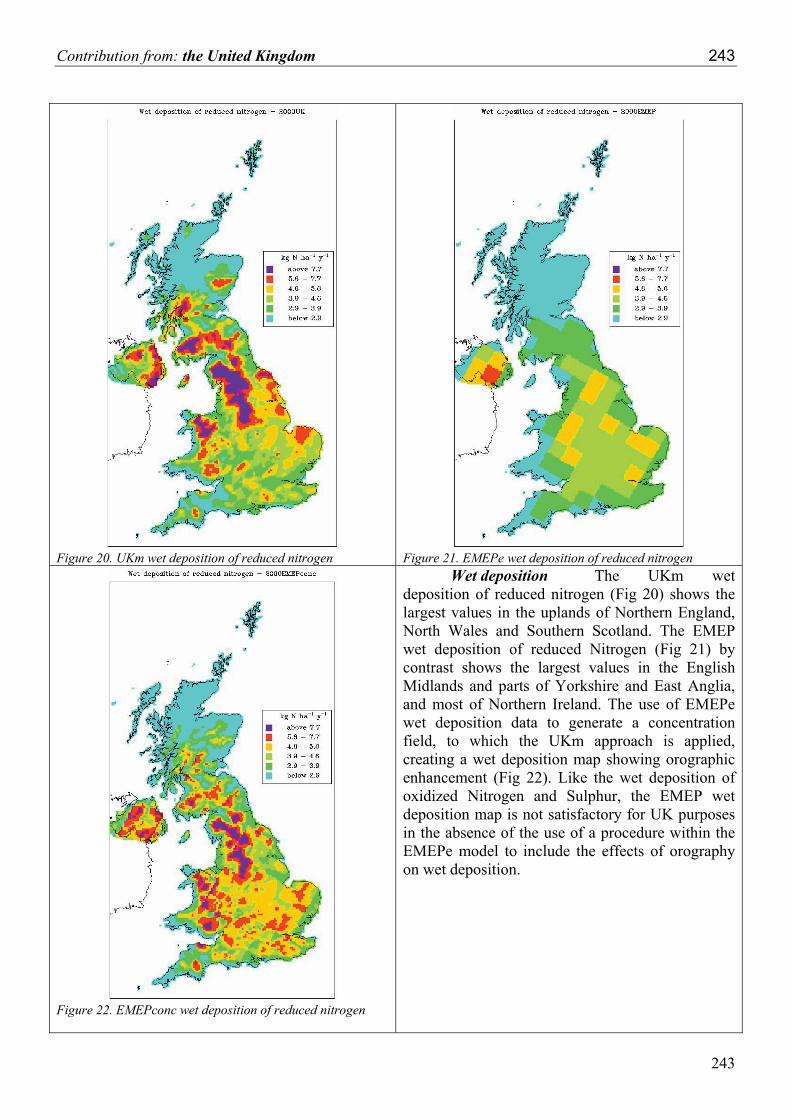
Figure 20. UKm wet deposition of reduced nitrogen
Figure 21. EMEPe wet deposition of reduced nitrogen
Figure 22. EMEPconc wet deposition of reduced nitrogen
Wet deposition The UKm wet deposition of reduced nitrogen (Fig 20) shows the largest values in the uplands of Northern England, North Wales and Southern Scotland. The EMEP wet deposition of reduced Nitrogen (Fig 21) by contrast shows the largest values in the English Midlands and parts of Yorkshire and East Anglia, and most of Northern Ireland. The use of EMEPe wet deposition data to generate a concentration field, to which the UKm approach is applied, creating a wet deposition map showing orographic enhancement (Fig 22). Like the wet deposition of oxidized Nitrogen and Sulphur, the EMEP wet deposition map is not satisfactory for UK purposes in the absence of the use of a procedure within the EMEPe model to include the effects of orography on wet deposition.

EMEP Assessment Report – Part II
244
The above comparison highlights the broad agreement of the UK total budgets for Sulphur and reduced Nitrogen and the substantially smaller oxidized Nitrogen budget for the UK in the EMEP model. The most important differences between the measurement based UK deposition estimates for the UK and those from the EMEPe model are the mapped depositions for Sulphur, and oxidized and reduced Nitrogen. These differences become very important in assessing the potential for environmental effects as the deposited pollutant is matched spatially with ecosystem sensitivity data. There are several contributors to the differences between the two sets of maps, but the orographic enhancement of wet deposition is clearly one of the most important processes for the deposition of pollutants in upland UK. The EMEP model does not simulate the wet deposition in the uplands of the UK adequately. The other major contributors to the difference between EMEPe and the UKm maps are due to HNO3 and NO2 concentrations in the EMEP model being much smaller than the measured concentrations in the UK, on which the UKm maps are based. References Fowler D., Cape, J.N., Leith, I.D., Choularton, T.W., Gay, M.J. and Jones, A. (1988). The influence of altitude on rainfall composition at Great Dun Fell. Atmospheric Environment, 22(7), 1355-1362. NEGTAP (2001). “Transboundary Air Pollution: Acidification, Eutrophication and Ground-Level Ozone in the UK”, Report of the National Expert Group on Transboundary Air Pollution (NEGTAP) for the UK Department for Environment, Food and Rural Affairs, Scottish Excecutive, the National Assembly for Wales/Cynulliad Cenedlaethol Cymru and the Department of the Environment for Northern Ireland, CEH-Edinburgh. 314 pp. Simpson, D., Fagerli, H., Jonson, J.E., Tsyro, S., Wind, P. and Tuovinen, J-P. Transboundary acidification and eutrophication and ground level ozone in Europe. Part 1. Unified EMEP model description. In EMEP Status Report 1/03 Part I (2003), EMEP/MSC-W Report, Norwegian Meteorological Institute, Oslo, Norway