Embed Size (px)
Citation preview

Born in Belgium
Georgia Tech
Total research career in logistics, material
handling, facilities design, supply chains
Material Handling Research Center & CICMHE
Supply Chain Engineering (Springer 2011)
Educational interactive software (TSP, VRPB,
block layout)
Soccer, tennis, photography, beer & wine
Instructor Information
2

Storage Policies Overview:
Introduction
Introduction to Storage Policies
5

7-Aug-13
Warehouse Operations
Flow Path Schematic (FFN)
Sharp et al. 1991 Receiving
Cross Docking
Storage
Case PickingFull Pallet
PickingItem Picking
Sortation
Packaging
Shipping
Definitions
Storage Policy
Set of rules that determine where to store arriving
SKUs in a warehousing system
Unit Load
A collection of materials that can be transported,
stored, and controlled (managed) as a single unit
• Examples
• Vast majority of discrete goods
7
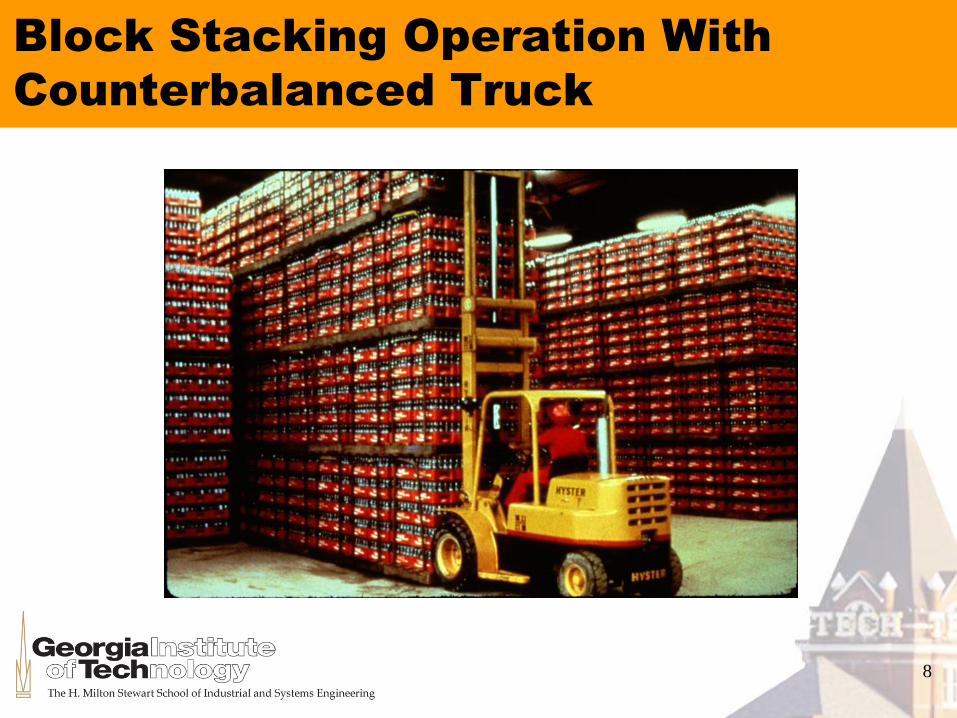
Block Stacking Operation With
Counterbalanced Truck
8

Sainsbury’s Grocery
Distribution Center
10

Example: Walmart DC Pallet
Rack
7-Aug-13

Forward-Reserve:
Restocking with Reach Truck
7-Aug-13
Forward
Reserve with
Unit Load
Replenishment
Restock:
Person
remains on
floor,
forklift &
reach truck

Forward Reserve:
Order Picking on Higher Levels
7-Aug-13
Order Picking:
Person in cab
travels up,
Order picking
truck

Empty Single-Deep Pallet Rack
with Four Levels
15

ASRS Pallet Unit Load High-Rise
Storage
16

Volkswagen Automated Finished
Goods (Cars) Warehouse
17

Handling Units Example:
Collapsible Pallet
18

Wine Barrels in a Rack
19

Container Port Overview
(Hamburg Port Altenwerder)
20

Twin Yard Cranes (Hamburg
Port Altenwerder Quay)
21

Amazon Forward Reserve
Warehouse
7-Aug-13
SKUs (Products) Classification
Bulk Storage
Liquids , gases, dry bulk
Discrete Units Storage
Unit Loads
• Free standing
• Rack supported
Loads of different sizes
25

Warehousing Storage Objectives:
Back to Basics
Minimize the expected travel time & cost
for given input-output operations
Minimize MH equipment and personnel
Variable (marginal) costs
Minimize the required storage space for
given stored inventory
Minimize capital investment
Fixed costs
28

Storage Policies Overview:
Unit Load Storage Policies
Introduction to Storage Policies
Unit Load Storage Policies
29

Unit Load Main Principle to
Maximize Storage Capacity
Use the “Cube” by
utilizing the height
of the warehouse
and keeping it
filled
33

Unit Load Main Principle to
Minimize Travel Time
Place unit loads that
generate the
highest frequency
of access
in locations
with the lowest
expected access
time
34

Warehousing Storage
Objectives
Minimize the Expected Travel Time
Minimize MH Equipment and Personnel
Minimize the Required Storage
Space
Minimize Capital Investment
Min f tj jj
Min N
36
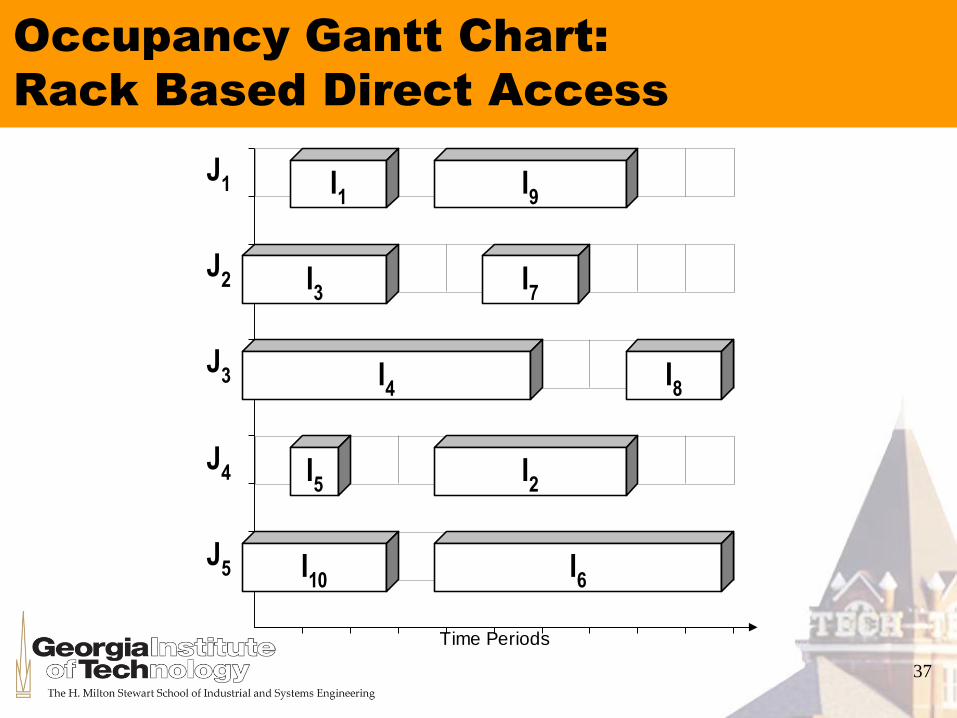
Occupancy Gantt Chart:
Rack Based Direct Access
Time Periods
J1
J2
J3
J4
J5 I
6
I1
I9
I3
I7
I4
I8
I2
I10
I5
37

Unit Load Storage Formulation
Single command, Direct Access
min
. .
{ , }
c x
s t x i
b x j
x
ij ijj
N
i
M
ijj
N
i iji
M
ij
11
1
1
1
1
0 1
38

Occupancy and Constraint
Matrices
B bi
L
NMMM
O
QPPP
[ ]
1 1 1 0 0
0 1 1 1 0
0 0 1 1 1
A
I I I I
B
B
B
L
N
MMMMMM
O
Q
PPPPPP
..
..
..
.. .. .. .. ..
..
0 0 0
0 0 0
0 0 0
39

Vector Assignment Formulation
Neither AP nor 3DAP nor BPP
Consecutive ones in occupancy matrix B
Block diagonal structure of constraint
matrix
Integrality property not satisfied
41

VAP Conclusions
Very large integer optimization problem
Very tight LP relaxation
Efficient sub problem and problem size
indicate decomposition
Very small gap for Lagrangean relaxation
upper bound
Highly primal and dual degenerate
Acceptable penalty for primal heuristic
44

Dedicated vs. Shared Storage
Policies: Product Dedicated
Product Dedicated Storage Policies
Static
Simple
Space inefficient (maximum)
Unconstrained replenishment
maxDED p p pt MAX
tp p
N q si I N
45
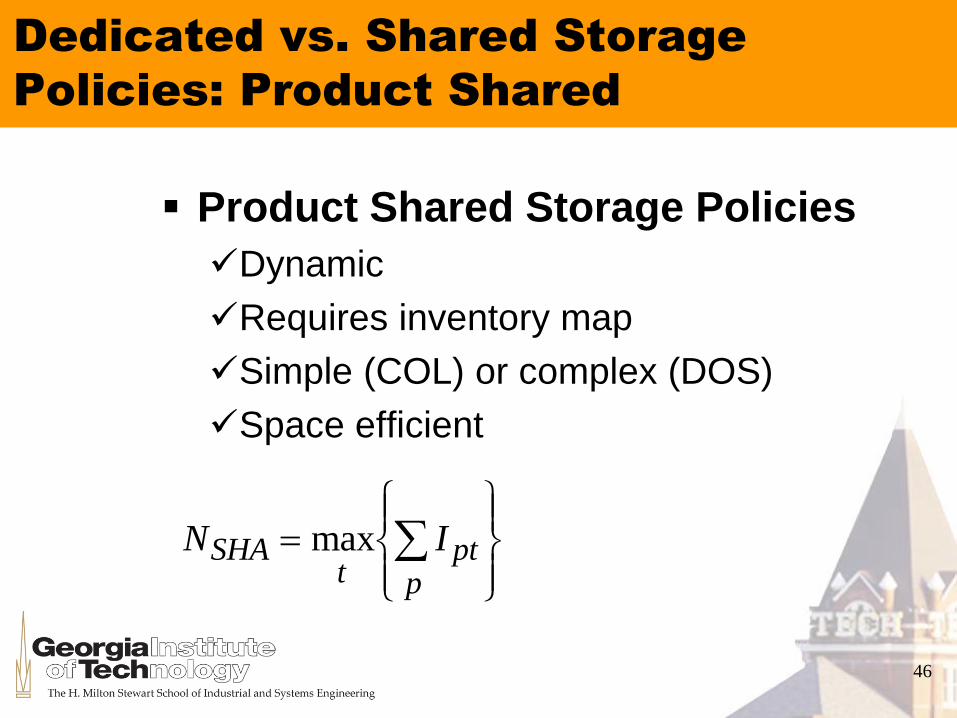
Dedicated vs. Shared Storage
Policies: Product Shared
Product Shared Storage Policies
Dynamic
Requires inventory map
Simple (COL) or complex (DOS)
Space efficient
N ISHAt
ptp
RS|T|UV|W|
max
46

Unbalanced Warehouse Size for
Various Policies
0
2
4
6
8
10
12
14
16
18
1 6 11 16 21 26 31 36 41 46 51 56
A
B
C
D
All
Ded
Sha
47

Storage Policy Size Ratio
Storage Policy Size Ratio
a
N
NDED
051. ,
49

Storage Policy Size Ratio
18, 16
160.89
18
DED SHAN N
a
51

Perfectly Balanced Warehouse
Size for Various Policies
0
2
4
6
8
10
12
14
16
1 6 11 16 21 26 31 36 41 46 51 56
A
B
C
D
All
Ded
52

Perfect Balanced Storage Space
Ratio for Shared Storage Policies
16, 10
100.625
16
DED SHAN N
a
54
Storage Policies Overview:
Unit Load Storage Policies
Introduction to Storage Policies
Unit Load Storage Policies
Product Based Storage Policies
56

Unit Load Warehouse
1 2
P1
3 4 5 6
7
13
19 20 21 22 23 24
8
14
9
15
10 11 12
16 17 18
P2
P3
57
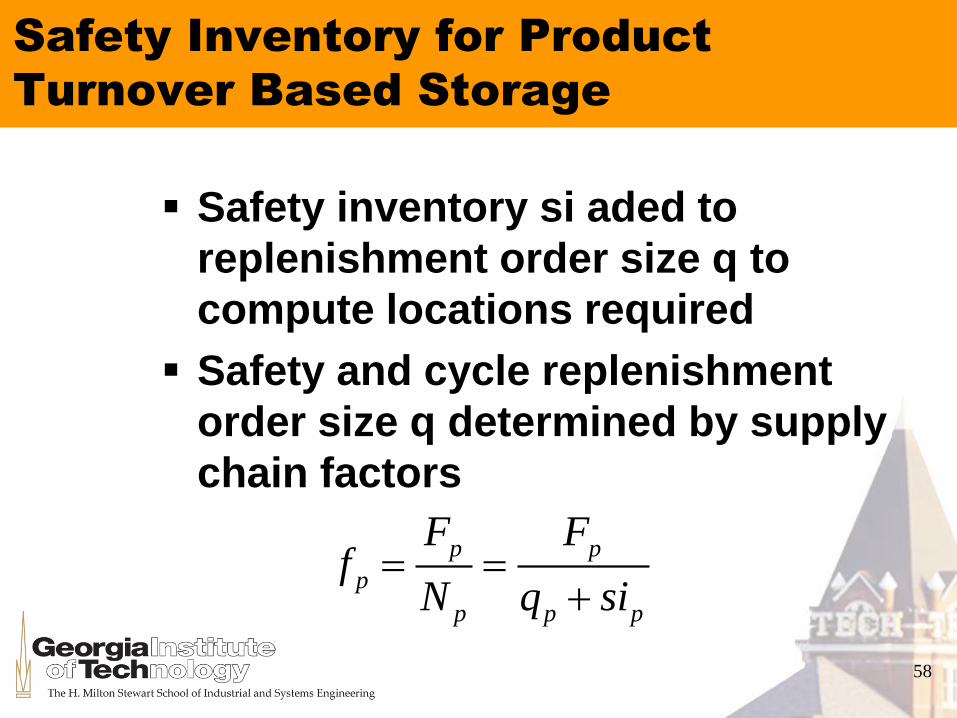
Safety Inventory for Product
Turnover Based Storage
Safety inventory si aded to
replenishment order size q to
compute locations required
Safety and cycle replenishment
order size q determined by supply
chain factors
p p
p
p p p
F Ff
N q si
58
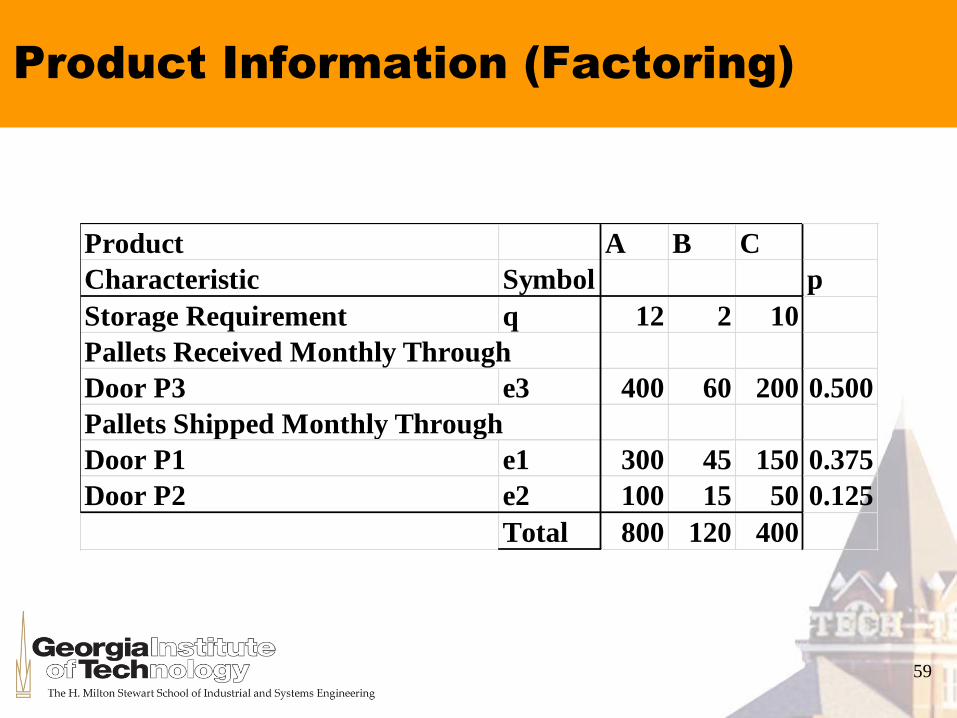
Product Information (Factoring)
Product A B C
Characteristic Symbol p
Storage Requirement q 12 2 10
Pallets Received Monthly Through
Door P3 e3 400 60 200 0.500
Pallets Shipped Monthly Through
Door P1 e1 300 45 150 0.375
Door P2 e2 100 15 50 0.125
Total 800 120 400
59
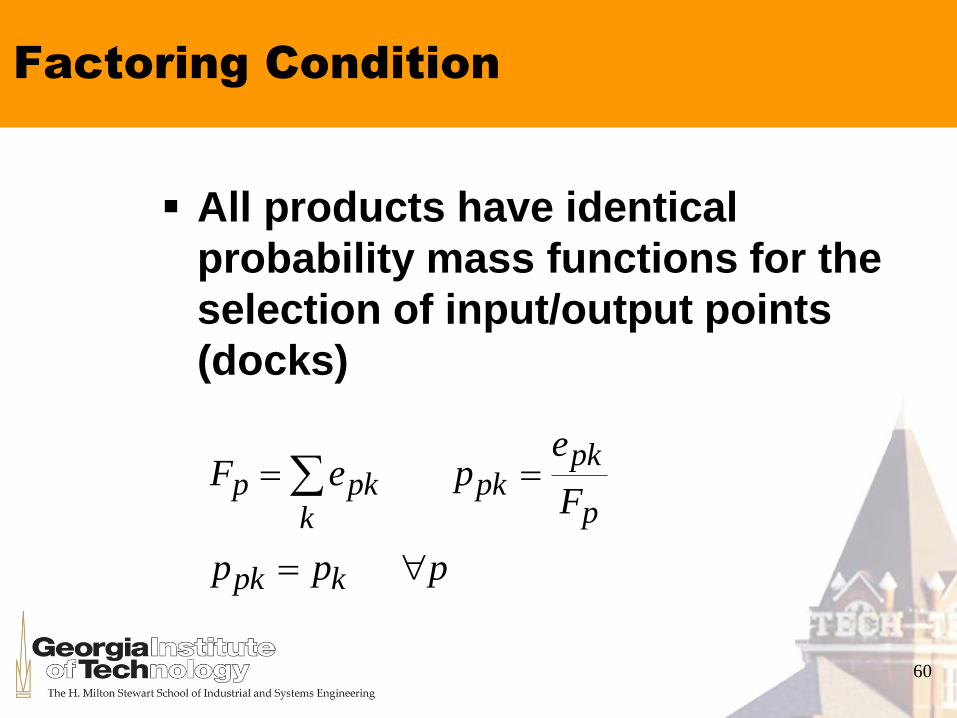
Factoring Condition
All products have identical
probability mass functions for the
selection of input/output points
(docks)
F e pe
Fp pk
kpk
pk
p
p p ppk k
60

Travel Independence
If factoring condition is satisfied:
expected travel time is independent
of the product stored in location
g1 = 0.375*80+0.125*60+0.500*25 = 50
g13 = 0.375*60+0.125*80+0.500*15 = 40
g p dj k kjk
61
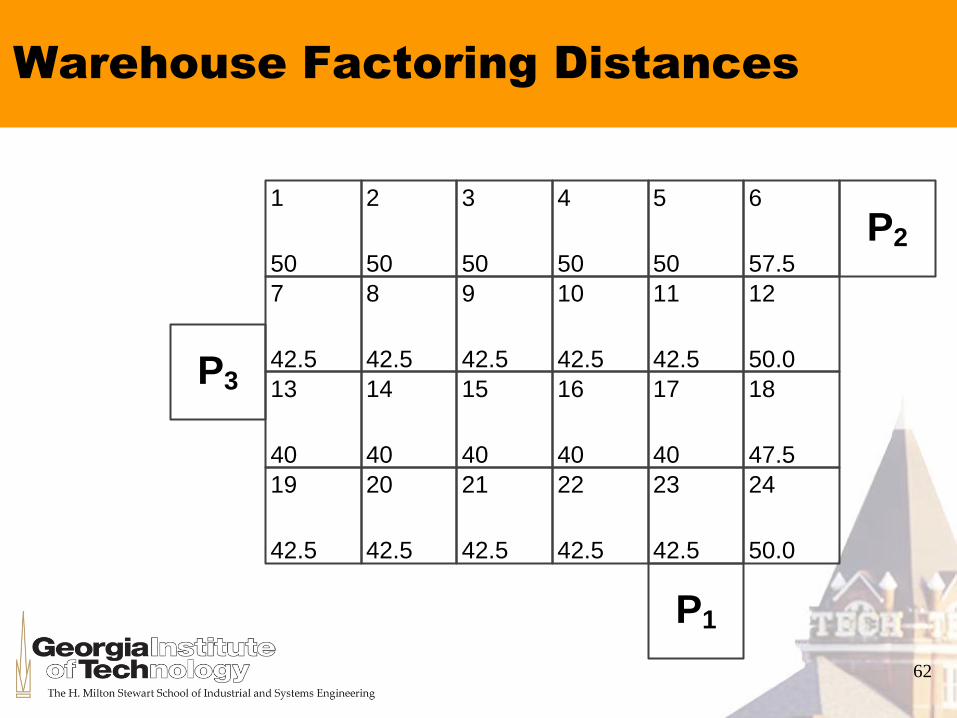
Warehouse Factoring Distances
1
50
2
50
P1
3
50
4
50
5
50
6
57.5
7
42.5
13
40
19
42.5
20
42.5
21
42.5
22
42.5
23
42.5
24
50.0
8
42.5
14
40
9
42.5
15
40
10
42.5
11
42.5
12
50.0
16
40
17
40
18
47.5
P2
P3
62
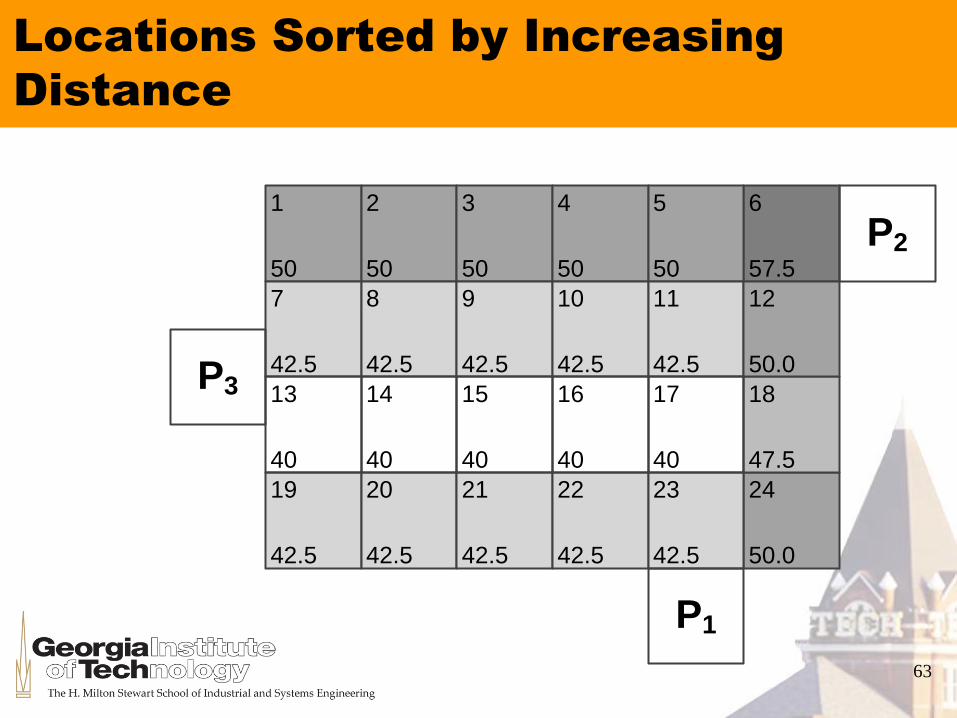
Locations Sorted by Increasing
Distance
1
50
2
50
P1
3
50
4
50
5
50
6
57.5
7
42.5
13
40
19
42.5
20
42.5
21
42.5
22
42.5
23
42.5
24
50.0
8
42.5
14
40
9
42.5
15
40
10
42.5
11
42.5
12
50.0
16
40
17
40
18
47.5
P2
P3
63

Three Dedicated Storage
Policies
Fast and furious
“Fast movers closest to the door”
Small is beautiful
“Small inventory closest to the door”
But higher turns beats them all
Frequency of access ratio of demand
rate divided by maximum inventory
“Fastest turning closest to the door”
“Short stays closest to the door”
64

Demand Based Layout
Commonly Called “Place Fast
Movers Closest to the Door”
Products Ranked by Decreasing
Demand or Operations
FA = 800, FC = 400, FB = 120
Assigned to Locations by
Increasing Expected Travel Time
65

Demand Based Layout
1
50
C2
50
C
P1
3
50
C4
50
C5
50
C6
57.5
B
7
42.5
A
13
40
A
19
42.5
A20
42.5
A21
42.5
A22
42.5
A23
42.5
A24
50.0
C
8
42.5
A
14
40
A
9
42.5
C
15
40
A
10
42.5
C11
42.5
C12
50.0
B
16
40
A17
40
A18
47.5
C
P2
P3
66

Total Travel Time for Demand
Based Layout
Total Travel = Sum of Product
Travels
TA = 2·800·41.46 = 66,333
TB = 2·120·53.75 = 12,900
TC = 2·400·47.50 = 38,000
T = 66,333+12,900+38,000 = 117,233
%T = 0.8 % over 116,333
67
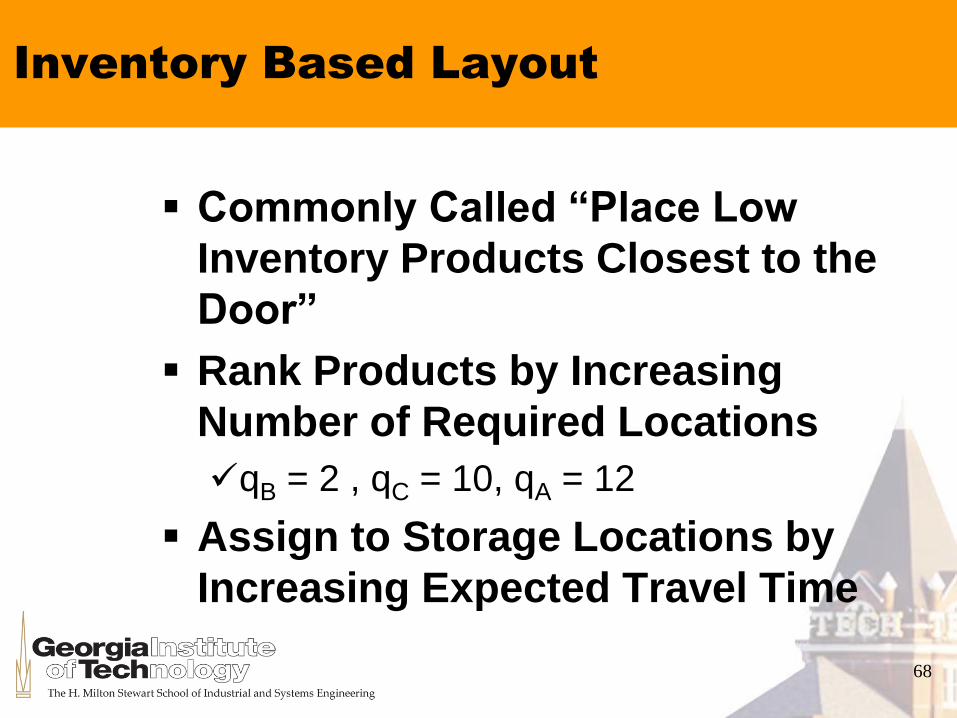
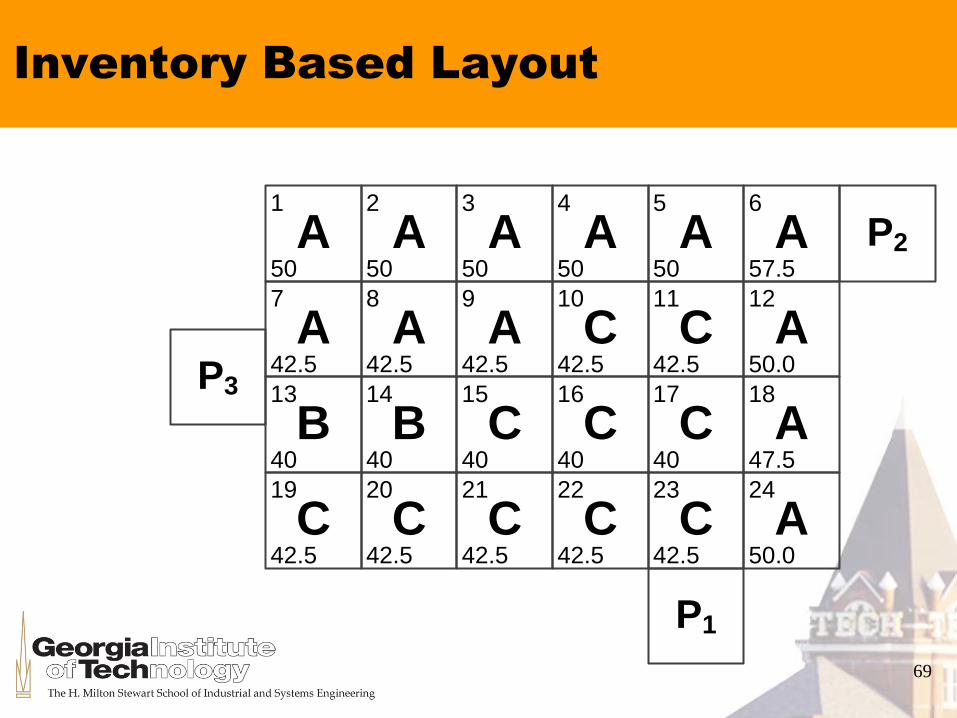
Inventory Based Layout
Commonly Called “Place Low
Inventory Products Closest to the
Door”
Rank Products by Increasing
Number of Required Locations
qB = 2 , qC = 10, qA = 12
Assign to Storage Locations by
Increasing Expected Travel Time
68
Inventory Based Layout
1
50
A2
50
A
P1
3
50
A4
50
A5
50
A6
57.5
A
7
42.5
A
13
40
B
19
42.5
C20
42.5
C21
42.5
C22
42.5
C23
42.5
C24
50.0
A
8
42.5
A
14
40
B
9
42.5
A
15
40
C
10
42.5
C11
42.5
C12
50.0
A
16
40
C17
40
C18
47.5
A
P2
P3
69
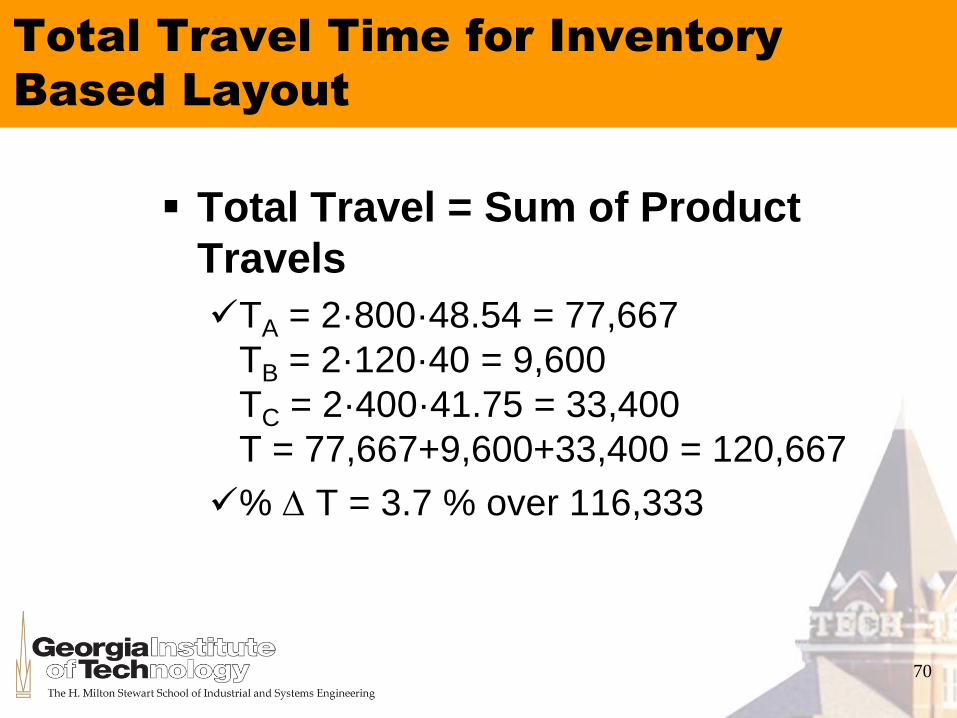
Total Travel Time for Inventory
Based Layout
Total Travel = Sum of Product
Travels
TA = 2·800·48.54 = 77,667
TB = 2·120·40 = 9,600
TC = 2·400·41.75 = 33,400
T = 77,667+9,600+33,400 = 120,667
% T = 3.7 % over 116,333
70

Frequency of Access
Sort and Locate Products by
Decreasing Frequency of Access to
Locations with Expected Distance
fA = 800/12 = 66.66
fB = 120/2 = 60
fC = 400/10 = 40
p p
p
p p p
F Ff
N q si
71

Product Turnover Dedicated
Storage Layout (Factoring)
1
50
C2
50
C
P1
3
50
C4
50
C5
50
C6
57.5
C
7
42.5
A
13
40
A
19
42.5
A20
42.5
A21
42.5
A22
42.5
A23
42.5
A24
50.0
C
8
42.5
A
14
40
A
9
42.5
B
15
40
A
10
42.5
B11
42.5
C12
50.0
C
16
40
A17
40
A18
47.5
C
P2
P3
72

Total Travel (Factoring)
Total travel = sum of product
travels
TA = 2*800*41.46 = 66,333
TB = 2*120*42.5 = 10,200
TC = 2*400*49.75 = 39,800
T = 66,333+10,200+39,800 = 116,333
2
2 2 2p
p
p
p p p p j p p
p p j Z p
T T
f q g f g F g
73

Product Information
(Non-Factoring)
Product A B C
Characteristic Symbol
Storage Requirement q 12 2 10
Pallets Handled Monthly Through
Door P1 e1 300 6 100
Door P2 e2 100 24 240
Door P3 e3 400 90 60
Total 800 120 400
75

Product-Door Probabilities
(Non-Factoring)
Product A B C
Characteristic Symbol
Storage Requirement q 12 2 10
Pallets Handled Monthly Through
Door P1 e1 0.375 0.050 0.250
Door P2 e2 0.125 0.200 0.600
Door P3 e3 0.500 0.750 0.150
76
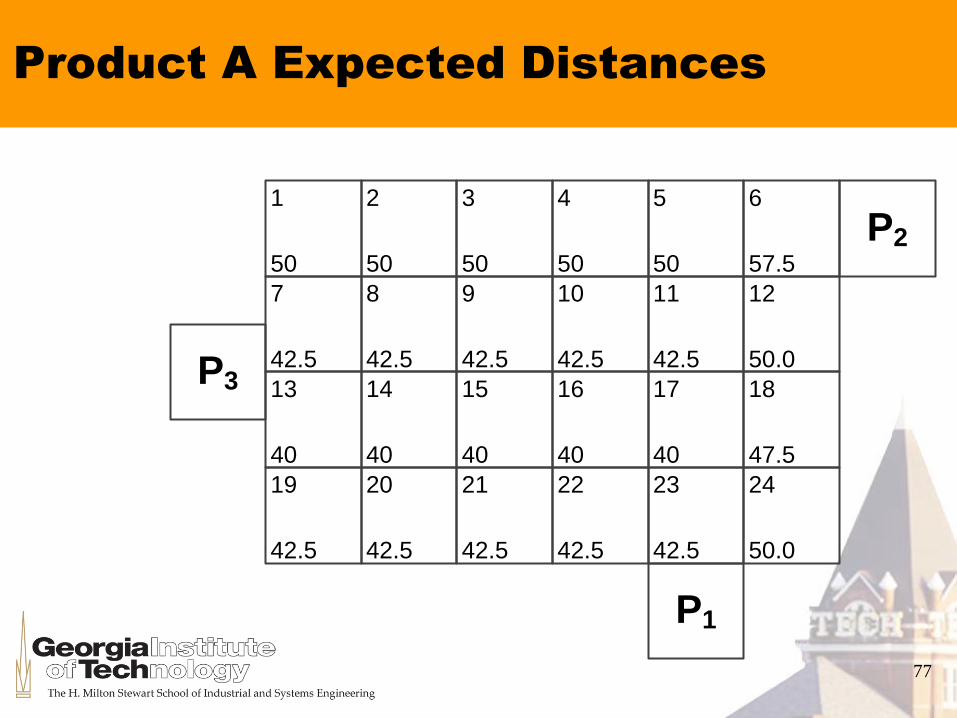
Product A Expected Distances
1
50
2
50
P1
3
50
4
50
5
50
6
57.5
7
42.5
13
40
19
42.5
20
42.5
21
42.5
22
42.5
23
42.5
24
50.0
8
42.5
14
40
9
42.5
15
40
10
42.5
11
42.5
12
50.0
16
40
17
40
18
47.5
P2
P3
77

Product B Expected Distances
1
34.75
2
39.75
P1
3
44.75
4
49.75
5
54.75
6
60.75
7
28.75
13
30.25
19
39.25
20
44.25
21
49.25
22
54.25
23
59.25
24
65.25
8
33.75
14
35.25
9
38.75
15
40.25
10
43.75
11
48.75
12
54.75
16
45.25
17
50.25
18
56.25
P2
P3
78
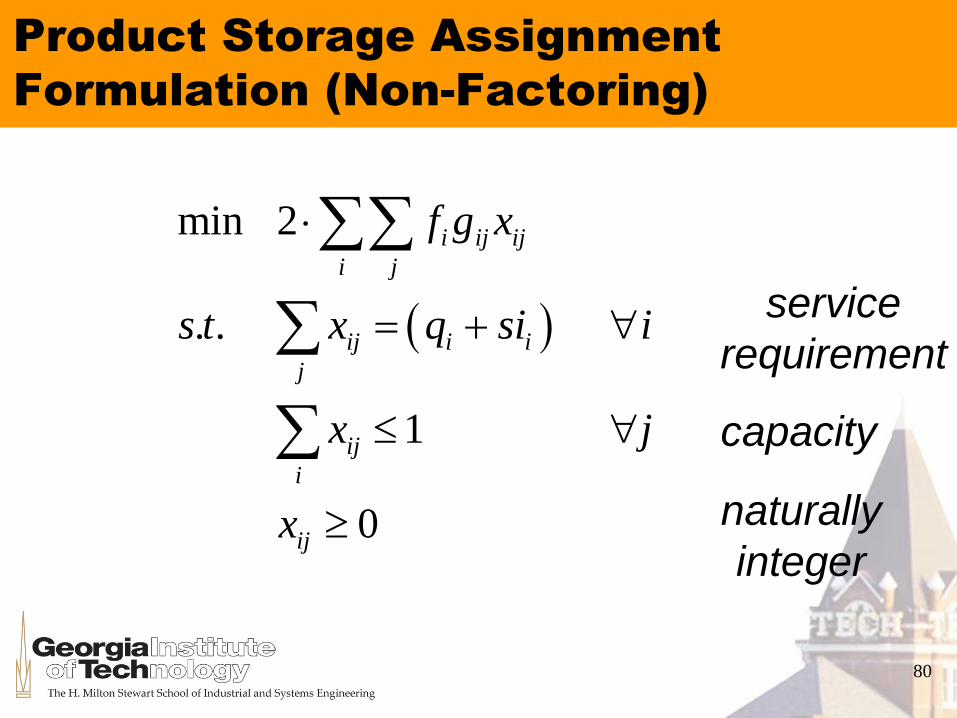
Product Storage Assignment
Formulation (Non-Factoring)
min 2
. .
1
0
i ij ij
i j
ij i i
j
ij
i
ij
f g x
s t x q si i
x j
x
capacity
service
requirement
naturally
integer
80

Product Turnover Dedicated
Storage Layout (Non-Factoring)
1
34.75
B2
52.75
C
P1
3
45.75
C4
38.75
C5
31.75
C6
29.75
C
7
28.75
B
13
40
A
19
42.5
A20
42.5
A21
42.5
A22
42.5
A23
42.5
A24
40.25
C
8
42.5
A
14
40
A
9
42.5
A
15
40
A
10
40.75
C11
33.75
C12
31.75
C
16
40
A17
40
A18
35.25
C
P2
P3
81
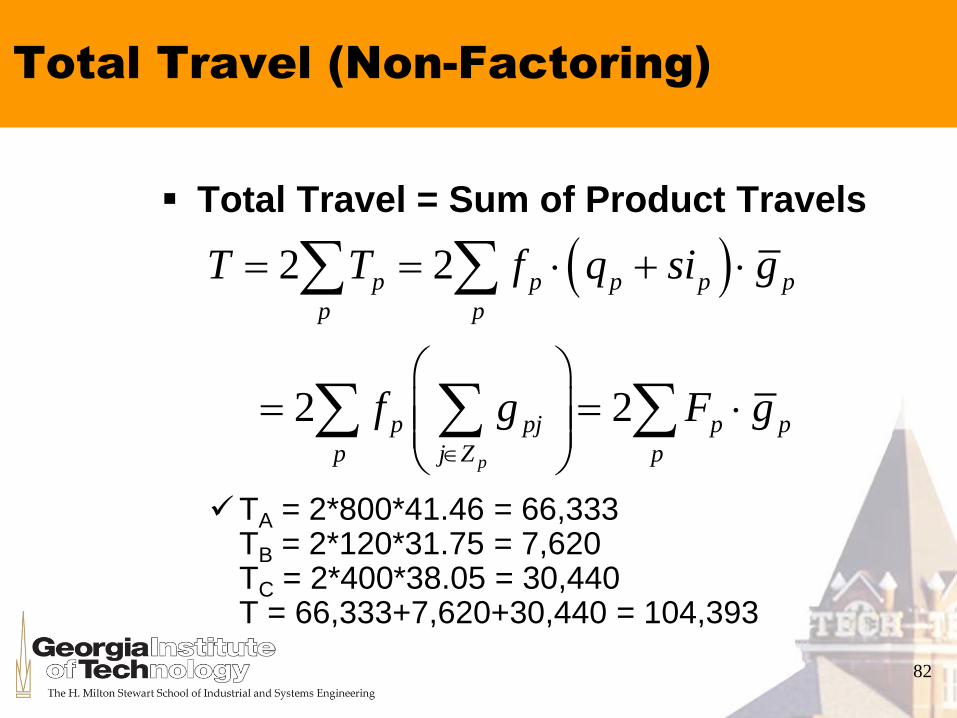
Total Travel (Non-Factoring)
Total Travel = Sum of Product Travels
TA = 2*800*41.46 = 66,333 TB = 2*120*31.75 = 7,620 TC = 2*400*38.05 = 30,440 T = 66,333+7,620+30,440 = 104,393
2 2
2 2p
p p p p p
p p
p pj p p
p j Z p
T T f q si g
f g F g
82

Product Turnover Class Based
Storage
Pure product dedicated is very
space inefficient
3 to 5 classes based on frequency
of access
Dedicated space for each class
Inside class use random (RAN) or
closest open location (COL)
Shared storage policy inside a class
83

Turnover Based Class Storage
Policy
Class space determined by
simulation
Class space estimated based on
service level statistics
84

Classes based on Frequency of
Access
Sort and aggregate products by
decreasing Frequency-of-Access
fA = 800/12 = 66.66
fB = 120/2 = 60 sequence[A,B,C]
fC = 400/10 = 40
2 classes {{A,B},{C}}, but {{A},{B,C}} may
be better alternative
p p
p
p p p
F Ff
N q si
85

Inventory Measures and
Relationships
Safety
Inventory
Inv
en
tory
Time
Average
Cycle
Inventory
Average
Cycle
Inventory
iq=ci+si
ci=q/2
miq=2ci+si=q+si
86

Inventory Distribution
Middle of Period Withdrawal
Probability of i units of inventory is
distributed [0,q]+si, nearly uniformly
except two extreme periods
2
2
2
2
12
2
12
ii
i
i
qE i si
qVar i
q
Inventory
Time
q
1
87

Zone K Size Determination
Based on Service Level a
2
2
2
2
12
p
K p p
p K p K
p
K p
p K p K
qI I si
q
Z I z
Px x
z
K K K
LNM
OQP
a
91

Average Zone Size Calculations
1
2
[12,2,10] 24
2
6,1,5 , 12
, 6 1 7
5
MAX DED
K p p p
p K p K
p
A B
C
q N N
I I q si
I I
I I A B I I
I I C I
92

Standard Deviation Zone Size
Calculations
2 2
2 2
2 22 2
2
2 2
1
2
2
12,2,10
2 12 2, 12.167,
12 12
2 2 10 20.5, 8.500
12 12
,
12.167 0.500 12.667 3.559
8.500 2.915
ii A
B C
K p
p K
A B
C
q
q
93
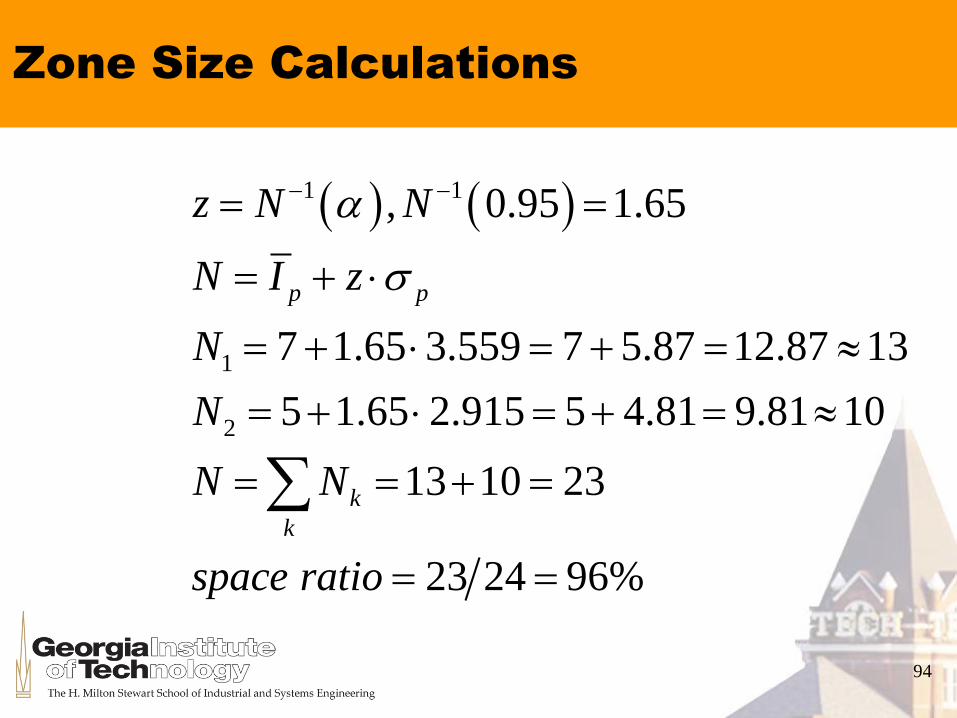
Zone Size Calculations
1 1
1
2
, 0.95 1.65
7 1.65 3.559 7 5.87 12.87 13
5 1.65 2.915 5 4.81 9.81 10
13 10 23
23 24 96%
p p
k
k
z N N
N I z
N
N
N N
space ratio
a
94

2-Class Layout
1
50
22
50
2
P1
3
50
24
50
25
50
26
57.5
7
42.5
1
13
40
1
19
42.5
120
42.5
121
42.5
122
42.5
223
42.5
224
50.0
2
8
42.5
1
14
40
1
9
42.5
1
15
40
1
10
42.5
111
42.5
112
50.0
2
16
40
117
40
118
47.5
2
P2
P3
95
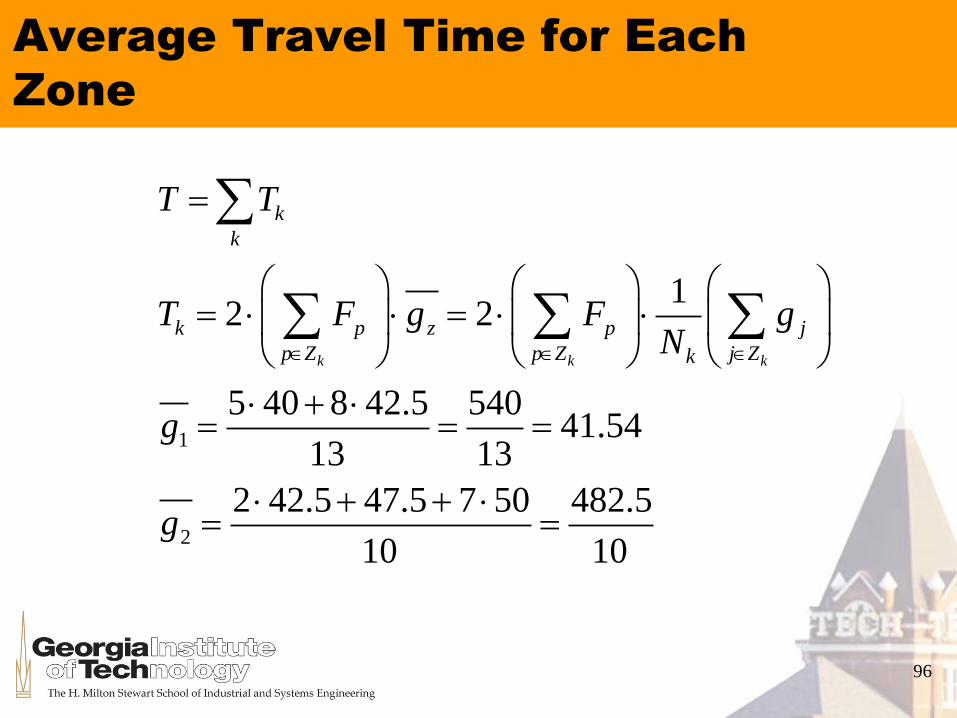
Average Travel Time for Each
Zone
1
2
12 2
5 40 8 42.5 54041.54
13 13
2 42.5 47.5 7 50 482.5
10 10
k k k
k
k
k p z p j
p Z p Z j Zk
T T
T F g F gN
g
g
96
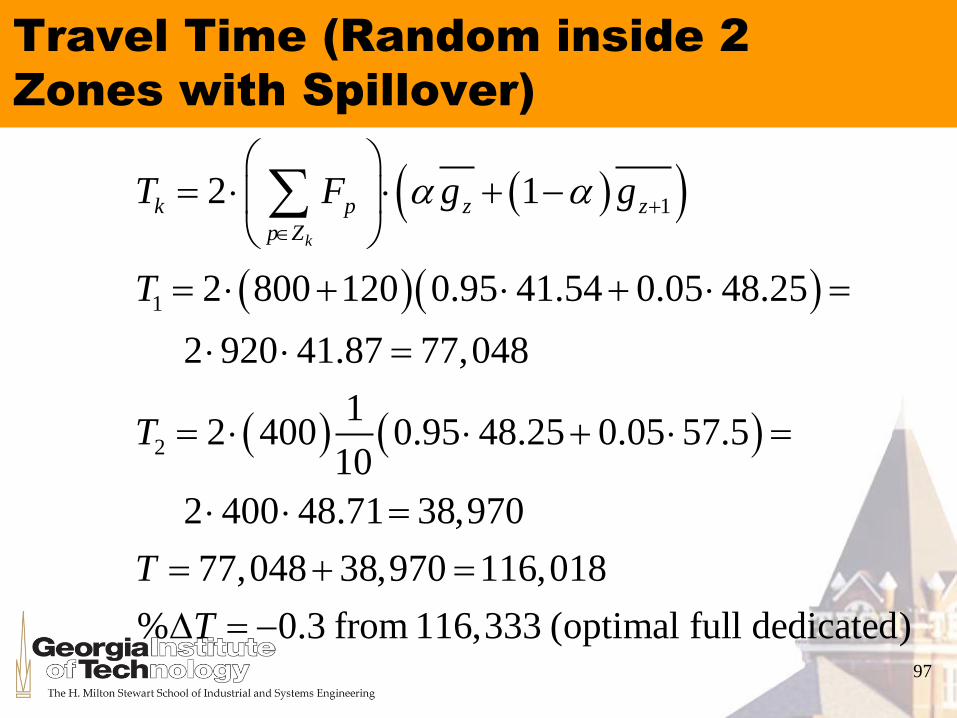
Travel Time (Random inside 2
Zones with Spillover)
1
1
2
2 1
2 800 120 0.95 41.54 0.05 48.25
2 920 41.87 77,048
12 400 0.95 48.25 0.05 57.5
10
2 400 48.71 38,970
77,048 38,970 116,018
% 0.3 from 116,333 (optimal full dedicated)
k
k p z z
p Z
T F g g
T
T
T
T
a a
97

Modeling Extensions
(Research)
Number of classes and product
partitions
Skewness of the frequency of access
(turnover) distribution
Dual command
Quadratic programming
Warehouse layout/configuration
Problem size (10K SKUs, 20K unit
locations) and dynamic (8 periods) 98
Storage Policies Overview:
Unit Load Storage Policies
Introduction to Storage Policies
Unit Load Storage Policies
Product Based Storage Policies
Unit Load Based Storage
Policies
99

Shared Storage Example:
Frequency of Access Distribution
0
0.1
0.2
0.3
0.4
0.5
0.6
0.7
0.8
0.9
1
Fre
qu
en
cy o
f A
ccess
1 2 3 4 5 6 7 8 9 10 11 12 13 14 15 16
Location
DOS
COL
DED
111

Duration of Stay Shared
Storage Observations
Exploits that first and last unit load
in batch are different
Cross docking (DOS = 0)
Minimizes both storage space and
travel time for a perfectly balanced
warehouse
Very constrained perfectly
balanced replenishment pattern
np(t) 114

Perfectly Balanced Warehouse
Balanced = Minimum Space
Perfectly Balanced = Minimum
Space and Minimum Time
n t n t p t p
z n i
p p
p pi
p
( ) ( ) ,
( )
1
n t n t tin out( ) ( )
115
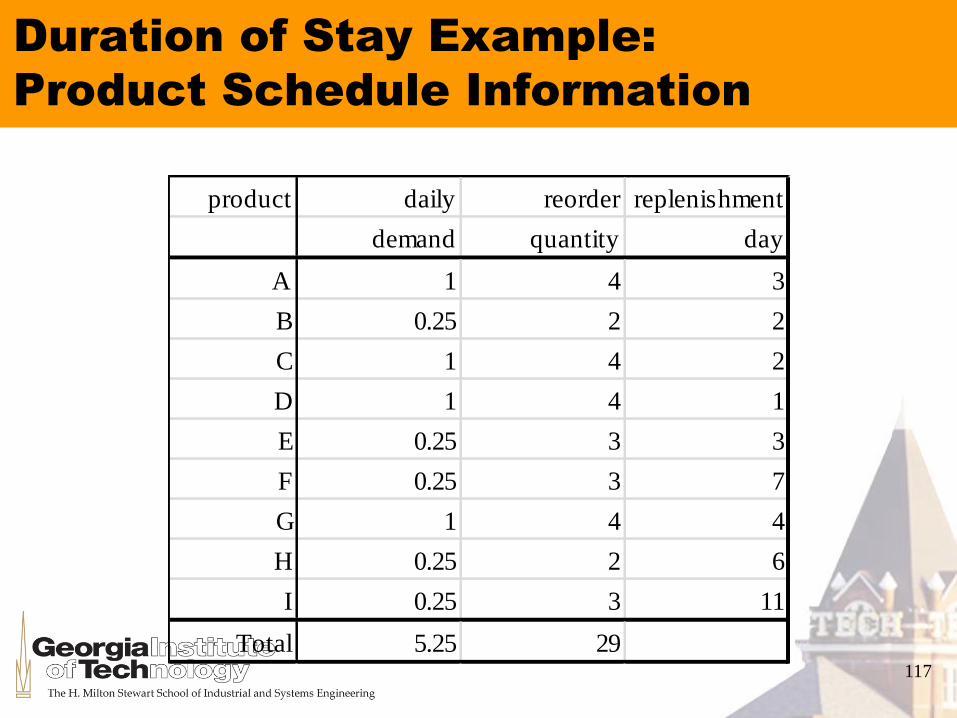
Duration of Stay Example:
Product Schedule Information
product daily reorder replenishment
demand quantity day
A 1 4 3
B 0.25 2 2
C 1 4 2
D 1 4 1
E 0.25 3 3
F 0.25 3 7
G 1 4 4
H 0.25 2 6
I 0.25 3 11
Total 5.25 29117

Duration of Stay Example:
Statistics
Product dedicated required storage
space = 29
Total daily demand rate = 5.25
Warehouse size = 24 locations
118
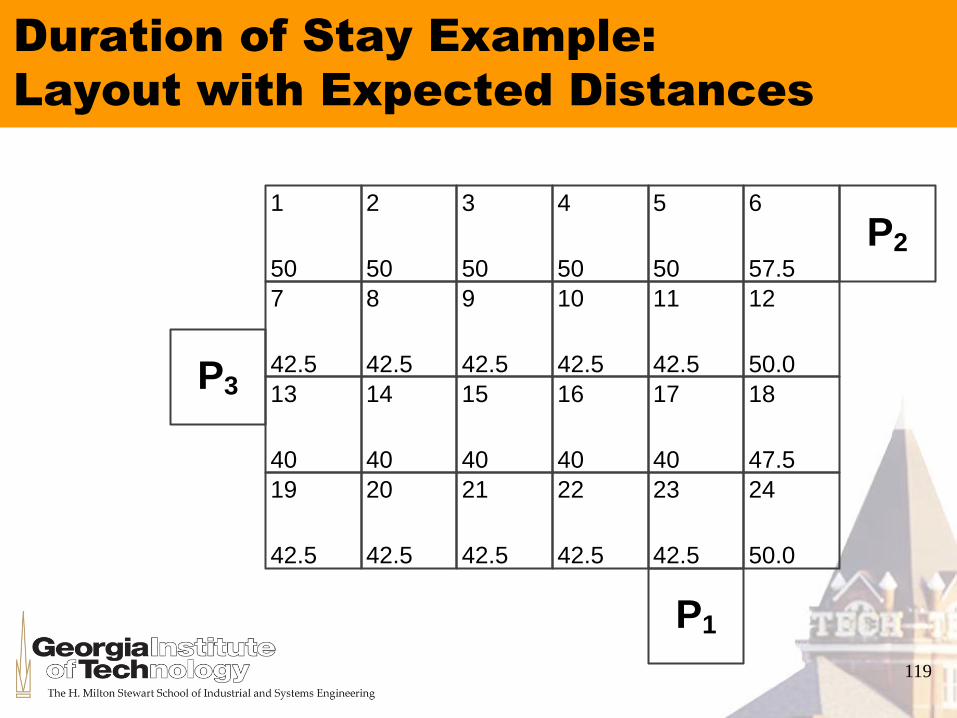
Duration of Stay Example:
Layout with Expected Distances
1
50
2
50
P1
3
50
4
50
5
50
6
57.5
7
42.5
13
40
19
42.5
20
42.5
21
42.5
22
42.5
23
42.5
24
50.0
8
42.5
14
40
9
42.5
15
40
10
42.5
11
42.5
12
50.0
16
40
17
40
18
47.5
P2
P3
119

Balanced Inventory Pattern
Product
Period A B C D E F G H I Total
1 2 1 1 4 1 2 3 2 3 19
2 1 2 4 3 1 2 2 1 3 19
3 4 2 3 2 3 1 1 1 2 19
4 3 2 2 1 3 1 4 1 2 19
5 2 2 1 4 3 1 3 1 2 19
6 1 1 4 3 3 1 2 2 2 19
7 4 1 3 2 2 3 1 2 1 19
8 3 1 2 1 2 3 4 2 1 19
9 2 1 1 4 2 3 3 2 1 19
10 1 2 4 3 2 3 2 1 1 19
11 4 2 3 2 1 2 1 1 3 19
12 3 2 2 1 1 2 4 1 3 19
120

Duration of Stay Example:
Unit Load Duration of Stay
Arrival Period
1 2 3 4 5 6 7 8 9 10 11 12 zone
1 D C A G 1
2 D C A G 2
3 D C A G 3
4 D C, B A, E G H F I 6
5 0
6 0
7 0
8 B E H F I 4
9 0
10 0
11 0
12 E F I 3
Total 19
Dura
tion o
f S
tay
121

Unit Load Duration of Stay
Shared Storage Layout
1
50
122
50
P1
3
50
4
50
5
50
6
57.5
7
42.5
4
13
40
1
19
42.5
420
42.5
421
42.5
422
42.5
423
42.5
324
50.0
12
8
42.5
4
14
40
2
9
42.5
8
15
40
2
10
42.5
811
42.5
812
50.0
12
16
40
317
40
318
47.5
8
P2
P3
122

Duration of Stay Example:
Total Travel (Duration-Of-Stay)
Total Travel = sum of Duration-Of-
Stay zone travels
Frequency of Access (FOA)
2 * for storage and withdrawal access
4 * for withdrawal access (1/p) only
T T f z gp
gpp
p p pp
jj Zp p
FHGGIKJJ
2 41
123

Duration of Stay Example:
Total Travel (Duration-Of-Stay)
DOS z FOA g Travel
1 1 1.0000 40.00 160.00
2 2 0.5000 40.00 160.00
3 3 0.3333 40.83 163.33
4 6 0.2500 42.50 255.00
5 0 0.2000 0 0.00
6 0 0.1667 0 0.00
7 0 0.1429 0 0.00
8 4 0.1250 43.75 87.50
9 0 0.1111 0 0.00
10 0 0.1000 0 0.00
11 0 0.0909 0 0.00
12 3 0.0833 50.00 50.00
Total 875.83 124
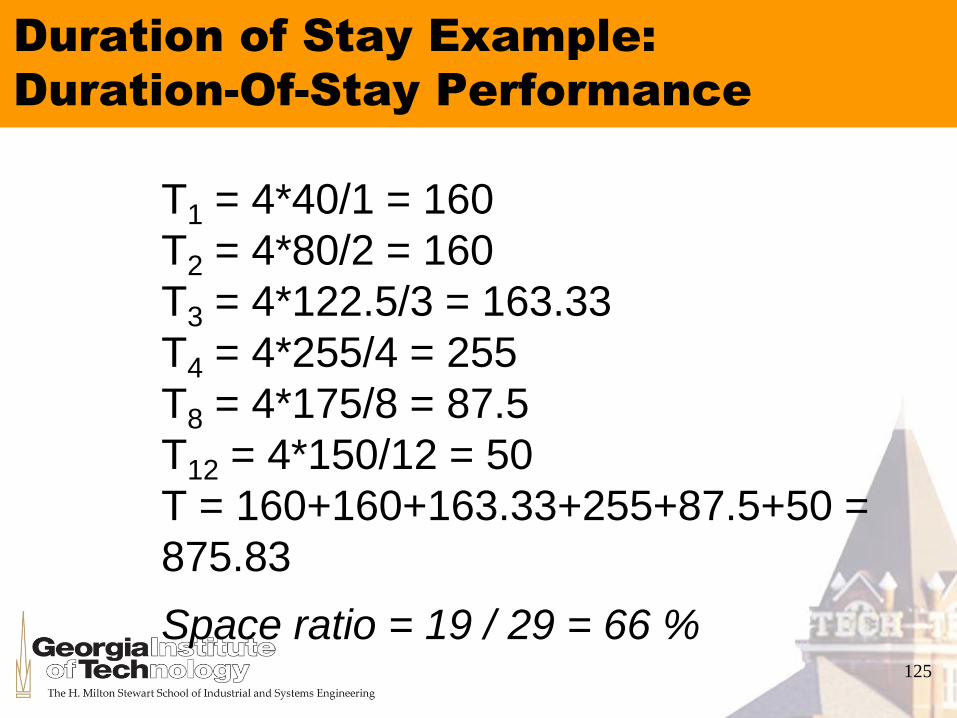
Duration of Stay Example:
Duration-Of-Stay Performance
T1 = 4*40/1 = 160
T2 = 4*80/2 = 160
T3 = 4*122.5/3 = 163.33
T4 = 4*255/4 = 255
T8 = 4*175/8 = 87.5
T12 = 4*150/12 = 50
T = 160+160+163.33+255+87.5+50 =
875.83
Space ratio = 19 / 29 = 66 % 125

Closest-Open-Location (COL)
Storage
Only 19 best locations
1 1 1
1
1
1 1 1 1 1
1
1
1
1
1 1
1 1 1
1
50
2
50
P1
3
50
4
50
5
50
6
57.5
7
42.5
13
40
19
42.5
20
42.5
21
42.5
22
42.5
23
42.5
24
50.0
8
42.5
14
40
9
42.5
15
40
10
42.5
11
42.5
12
50.0
16
40
17
40
18
47.5
P2
P3
126

Closest-Open-Location Travel
Time
Random access to any used location
Overall expected travel distance
1
4 4 4N
i i i i i i j
i j
T T T gf q r g r g N
(5 40 10 42.5 47.5 3 50) /19
822.5 /19 43.29
4 43.29 (4 1 5 0.25) 909.08
3.8% 875.83
g
T
T vs DOS
127
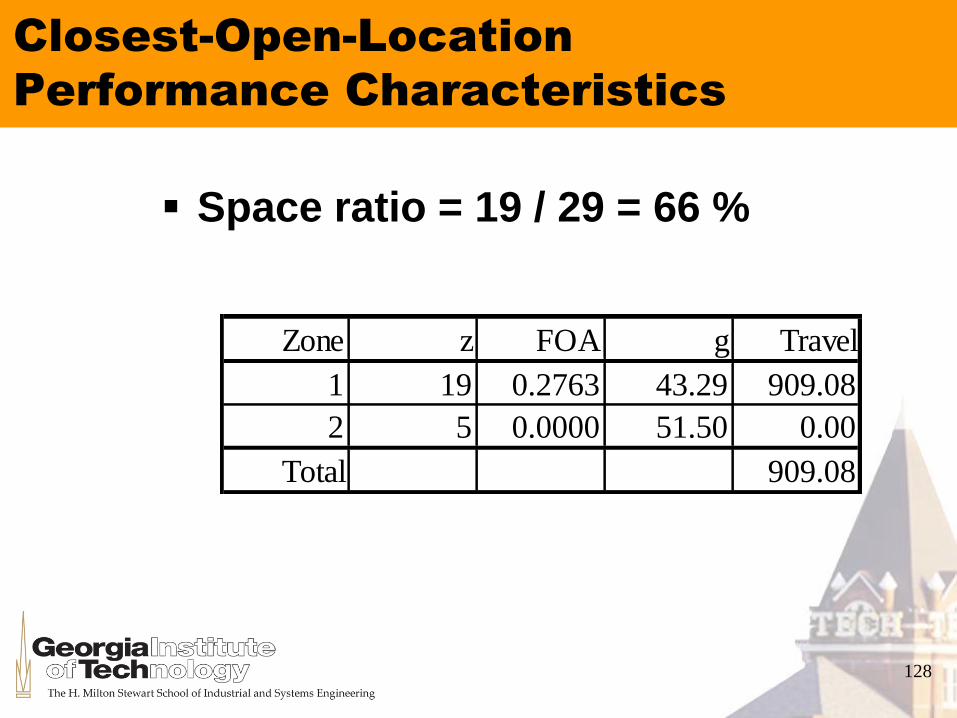
Closest-Open-Location
Performance Characteristics
Space ratio = 19 / 29 = 66 %
Zone z FOA g Travel
1 19 0.2763 43.29 909.08
2 5 0.0000 51.50 0.00
Total 909.08
128

Duration of Stay Example:
Two Class Product Turnover
Product turnovers
Product classes{{A,C,D,G},{B,H,E,F,I}}
1 1 1 1 1 1 1 1 1, , , , , , , ,
4 8 4 4 12 12 4 8 12pf
1
2 2
2
1
1
4 4 2 8
4 2 12 1.50
4 6 2.45
8 1.65 2.45 8 4.04 12.04 13
A
A
I
N
129
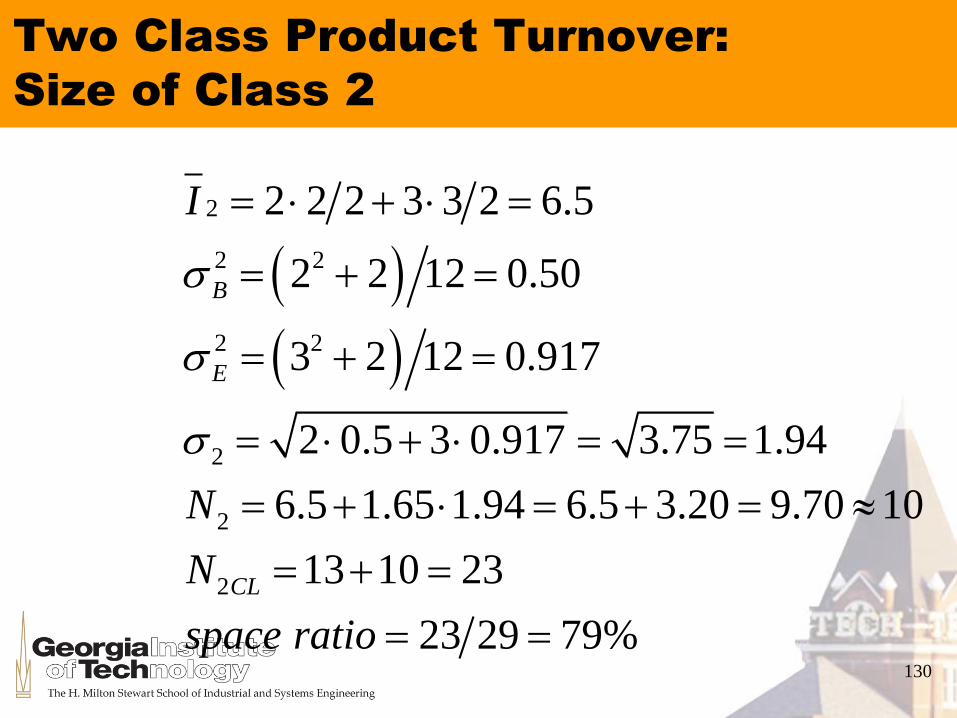
Two Class Product Turnover:
Size of Class 2
2
2 2
2 2
2
2
2
2 2 2 3 3 2 6.5
2 2 12 0.50
3 2 12 0.917
2 0.5 3 0.917 3.75 1.94
6.5 1.65 1.94 6.5 3.20 9.70 10
13 10 23
23 29 79%
B
E
CL
I
N
N
space ratio
130
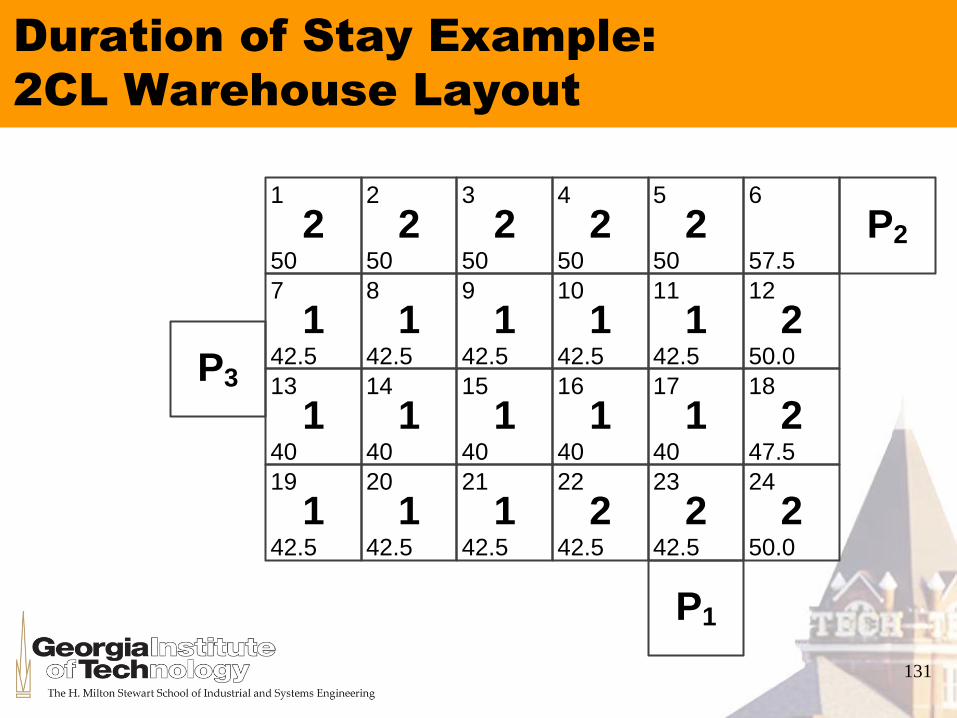
Duration of Stay Example:
2CL Warehouse Layout
1
50
22
50
2
P1
3
50
24
50
25
50
26
57.5
7
42.5
1
13
40
1
19
42.5
120
42.5
121
42.5
122
42.5
223
42.5
224
50.0
2
8
42.5
1
14
40
1
9
42.5
1
15
40
1
10
42.5
111
42.5
112
50.0
2
16
40
117
40
118
47.5
2
P2
P3
131

Duration of Stay Example:
2CL Expected Travel
1
2
1
2
5 40 8 42.5 13 540 13 41.54
2 42.5 47.5 7 50 10 482.5 10 48.25
4 4 0.95 41.54 0.05 48.25
4 4 41.87 669.98
4 1.25 0.95 48.25 0.05 57.5
4 1.25 48.71 243.56
669.98 243.56 913.55
4.3% 875.83
g
g
T
T
T
T vs DOS
132

2 Class Performance
a 0.95
Zone z f g g(a) Travel
1 10 0.4000 41.54 41.87 669.98
2 13 0.0962 48.25 48.71 243.56
3 1 0.0000 57.50 0.00
Total 23 913.55
Space ratio = 23 / 29 = 79 %
133

Shared Storage Policies:
Comparison Summary
Comparison criteria
Space, travel time, information
requirements, implementation simplicity
Policy Space Space Travel Time Time
DOS 19 875.83
COL 19 0% 909.08 3.8%
2CL 23 21% 913.55 4.3%
134
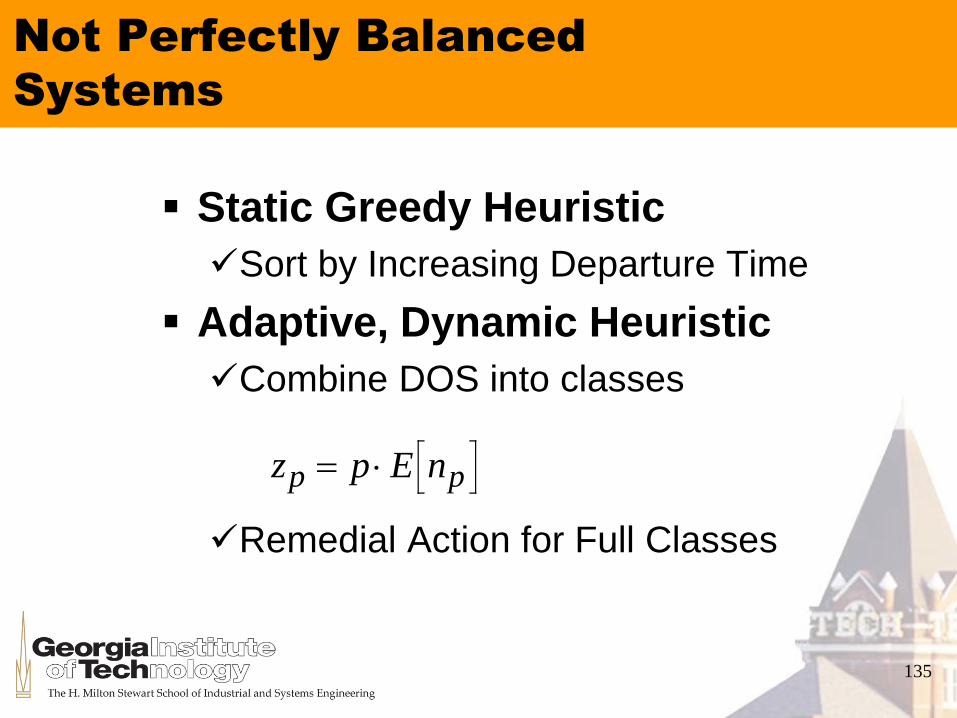
Not Perfectly Balanced
Systems
Static Greedy Heuristic
Sort by Increasing Departure Time
Adaptive, Dynamic Heuristic
Combine DOS into classes
Remedial Action for Full Classes
z p E np p
135

Storage Policies Overview:
Unit Load Storage Policies
Introduction to Storage Policies
Unit Load Storage Policies
Product Based Storage Policies
Unit Load Based Storage Policies
Experimental Comparison
Conclusions
137
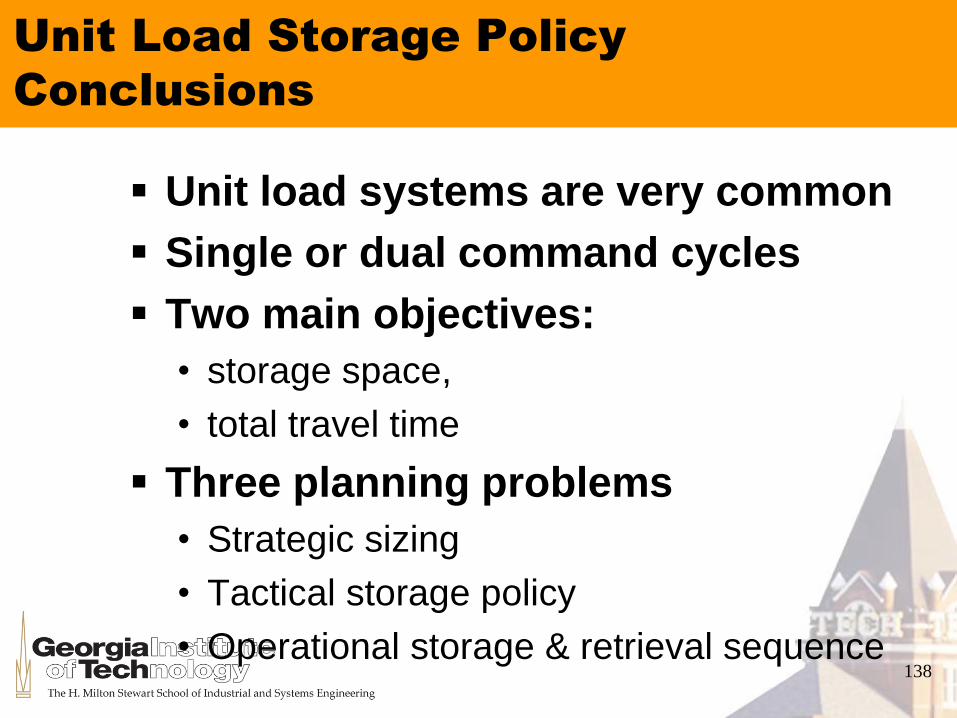
Unit Load Storage Policy
Conclusions
Unit load systems are very common
Single or dual command cycles
Two main objectives:
• storage space,
• total travel time
Three planning problems
• Strategic sizing
• Tactical storage policy
• Operational storage & retrieval sequence 138

Conclusions (2):
Three Types of Storage Policies
No information (RAN, COL)
• Space efficient, simple storage, retrieval with inventory
map, medium travel efficiency
Product Turnover Information (DED, 2CL, 3CL)
• DED: space inefficient, simple
• xCL: good tradeoff between space, travel, and
simplicity
Unit Load Time Information (DOS, 2TZ, 3TZ)
• DOS: theoretical best, but not practical
• xTZ: tradeoff not as good as xCL in practice
139

Easier
Do more than three classes make a difference?
Does dual command make a difference?
Do aisle configurations make a difference?
Harder
Does this apply to deep lane, block stacking (not
rack supported) ?
When to relocate?
Extensions to container ports
Research Questions
140
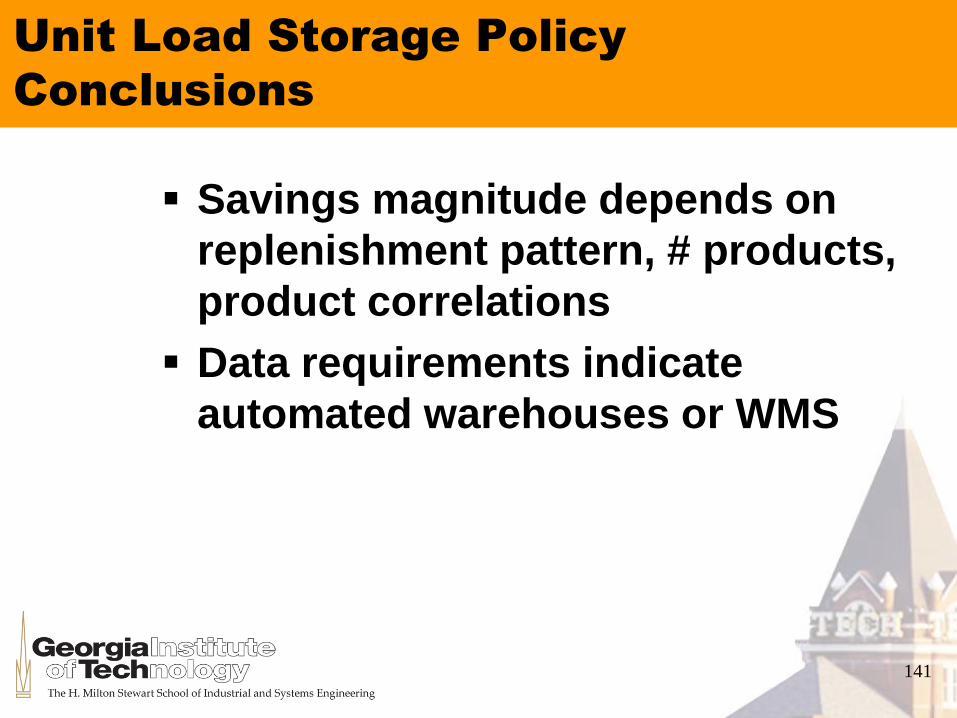
Unit Load Storage Policy
Conclusions
Savings magnitude depends on
replenishment pattern, # products,
product correlations
Data requirements indicate
automated warehouses or WMS
141

May I answer any questions?
142

![€¦ · Web viewNorthwest EndodonticsCore Policies [page 1] Northwest Endodontics. Core Policies [page 1] Northwest EndodonticsCore Policies [page 10] Northwest Endodontics. Core](https://img.pdfslide.us/doc/110x75/5e90c68a873af37602518b64/web-view-northwest-endodonticscore-policies-page-1-northwest-endodontics-core.jpg)


![Load Planning and Load Control Manual[1]](https://img.pdfslide.us/doc/110x75/551f9d3a4a795970108b4f6f/load-planning-and-load-control-manual1.jpg)

![Load Design Chart[1]](https://img.pdfslide.us/doc/110x75/577d252c1a28ab4e1e9e332e/load-design-chart1.jpg)
![37mm Load Data[1]](https://img.pdfslide.us/doc/110x75/547ee711b4af9fd3158b583f/37mm-load-data1.jpg)

![Combat load presentation[1]](https://img.pdfslide.us/doc/110x75/5492a61fb47959744d8b466e/combat-load-presentation1.jpg)

![[XLS]'BEAMANAL' Program - Treasure Trove of Construction ... · Web viewSpan #1: For Full Uniform Load, w Span #1: For Distributed Load #1 Span #1: For Distributed Load #2 Span #1:](https://img.pdfslide.us/doc/110x75/5b45df757f8b9aaa208b4c61/xlsbeamanal-program-treasure-trove-of-construction-web-viewspan-1.jpg)