Embed Size (px)
Citation preview
1
Efficient Server Provisioning and OffloadingPolicies for Internet Datacenters with Dynamic
Load-DemandDan Xu, Xin Liu, and Bin Fan
Abstract—In datacenters, traffic demand varies in both large and small timescales. A datacenter with dynamic traffic often needs to over-provision active serversto meet the peak demand, which incurs significant energy cost. In this paper, ourgoal is to reduce energy cost of a set of distributed Internet datacenters (IDCs)while maintaining the quality of service of the dynamic traffic. In particular, weconsider the outage probability as the QoS metric, where outage is defined as servicedemand exceeding the capacity. We require the outage probability at each IDC tobe smaller than a predefined threshold. Our goal is thus to minimize total energycost over all IDCs, subject to the outage probability constraint. We achieve the goalby dynamically adjusting server capacity and performing load shifting in differenttime scales. We propose three different load-shifting and joint capacity allocationschemes with different complexity and performance. Our schemes leverage bothstochastic multiplexing gain and electricity-price diversity. Thus, improving overprior work, our schemes reduce energy consumption/cost even when all IDCs havethe same electricity price. We use both simulated load traces and real traffic traces toevaluate the performance of the proposed schemes. Results show that our proposedschemes are efficient in reducing energy cost, and robust in QoS provisioning.
Index Terms—data center, energy efficiency, dynamic traffic,convex optimization, stochastic multiplexing, electricity pricediversity
I. INTRODUCTION
Cloud computing is considered as a promising newparadigm of Internet services. Internet companies, such asGoogle, Microsoft, Yahoo!, and Amazon, are providing anexpanding range of cloud services, including computing, stor-age, searching, content-delivery, online-shopping, and socialnetworking. The popularity of cloud services results in thefast growth of data center development, both nationwide andworldwide. We refer to such distributed Internet-scale datacenters as IDCs (Internet datacenters). A commercial IDCoften farms hundreds of thousands servers and consumes anenormous amount of electricity. Thus, it is important for IDCoperators to reduce IDC energy consumption and cost.
On one hand, reducing energy consumption often requiresturning off as many servers as possible. On the other hand,providing satisfactory Internet services requires enough num-ber of active servers. Thus, much research has been focusedon designing load-aware server provisioning schemes, e.g., in[16][17][18][30]. The basic idea is to dynamically control thenumber of active servers based on the load. Designing efficientload-aware server provisioning schemes is challenging.
In datacenters, traffic, i.e, volume of service requests, variesin time, in both large and small temporal scales. In Fig. 1, weplot traffic, which is considered as the total received packet
Dan Xu and Xin Liu are with the Department of Computer Science,University of California, Davis. Email: {danxu, xinliu}@ucdavis.edu.
Bin Fan is with the Department of Computer Science, Carnegie MellonUniversity. Email: [email protected].
The work is partially supported by NSF Grant 1147930 and 0917251, anda Fujitsu Research Grant.
size from Hadoop Distributed File System (HDFS) log ofa real datacenter1 in two time resolutions. Fig. 1(a) showsone-second traffic variation over three-minutes, and Fig. 1(b)shows ten-minute traffic variation in a day. In both time scales,we observe that traffic varies significantly. One can also referto [1] and [17] for the large-time-scale and the small-time-scale traffic variations of Microsoft datacenters, respectively.Time-varying traffic variations result in dynamic load-demand,which challenges server provisioning.
The current load-aware server provisioning schemes onlycapture the large-time-scale variation of load-demand. Forexample, in [17], the authors use statistical models to predictthe future load, in a time scale about half an hour. In [18],the authors consider a large time interval, and estimate thecurrent load level at the beginning of each time interval. Thesmall-time-scale load-demand variation is rarely consideredfor the following reasons. First, booting up a server to theactive state needs a considerable amount of time, up toseveral minutes [41], which is slower than the small-time-scale load variation; second, frequently turning on/off serversis not desirable in practice, which incurs additional operationcosts [18] and affects long term system reliability [16]. Thus,one cannot provision servers dynamically according to thesmall-time-scale load-demand variation. However, most cloudcomputing services, like search and web browsering, areresource demanding and require a small service delay. Failingin provisioning servers to meet service requirements in evena small time scale can result in poor user experience (Thisis probably one important reason that current operators arereluctant to turn off servers.). Consequently, an IDC has to pre-allocate enough active servers to meet the peak load-demand,which results in idle servers and energy waste if the demandis low. Thus, we are motivated to improve energy efficiencyof IDCs with dynamic load-demand, with both the large-time-scale and small-time-scale load-demand variations considered.
In this paper, our goal is to reduce energy cost of a setof distributed IDCs while guaranteeing the the performancerequirement of dynamic traffic. In particular, we considerthe outage probability as the QoS metric, where outage isdefined as service demand exceeding the available capacity ofa datacenter. We require the outage probability at each IDC tobe smaller than some predefined threshold. Our goal is thusto minimize total energy cost over all IDCs, subject to the
1The datacenter is operated by a major cloud computing service providerin U.S.
2
0
100
200
300
400
500
600
700
800
900
1000
1 7
13
19
25
31
37
43
49
55
61
67
73
79
85
91
97
103
109
115
121
127
133
139
145
151
157
163
169
175
Traf
fic si
ze (M
bit)
(a) Time (in second, three minutes snapshot)
1 second traffic
0
50
100
150
200
250
300
350
400
450
500
1 6 11 16 21 26 31 36 41 46 51 56 61 66 71 76 81 86 91 96 101
106
111
116
121
126
131
136
141
Traf
fic si
ze (G
bit)
(b) Time (every 10 minutes of one day)
10 minutes traffic
Fig. 1: Traffic (received packet size from HDFS log) variationFig. 1: Traffic (received packet size from HDFS log) variationin a small time scale (1 sec) and a large time scale (10 mins).
QoS constraint. We achieve the goal by dynamically adjustingserver capacity and performing load shifting in different timescales. First, since booting up or shutting down servers needsa considerable amount of time, we determine the number ofactive servers for each IDC in a relatively long time scale, i.e.,on the order of tens of minutes, to capture traffic variation inthe large time scale. This is referred to as server provisioning.Second, since current inter-IDC load shifting incurs negligibletime, up to tens of milliseconds [33], we design intelligentload shifting schemes among IDCs in a short time scale, i.e.,on the order of hundreds of milliseconds to seconds, to capturetraffic variation in the small time scale. In summary, we makethe following contributions:
• We investigate the problem of reducing energy con-sumption and electricity cost for distributed IDCs withdynamic load-demand. We address this problem throughjoint server provisioning and load shifting in both thelarge and the small time scales. In addition, dynamicspeed scaling is also exploited to satisfy the instanta-neous load-demand at each IDC. Our schemes leverageboth stochastic multiplexing gain and electricity-pricediversity. Thus, improving over prior work, our schemesreduce energy consumption/cost even when all IDCs havethe same electricity price.
• We propose three distributed load-shifting schemes: ratio-based load swapping (RBLS), ratio-based offloading(RBO), and threshold-based offloading (TBO). The op-timal configuration of each load shifting scheme coupledwith server provisioning is determined in a large timescale by a convex optimization model. In the optimizationmodels, we minimize the total energy cost subject tooutage probability constraint at each IDC. We modeloutage probability with both heavy-tailed and non heavy-tailed load distributions, including Gaussian, exponential,and heavy-tailed Weibull distributions. Each datacenterfollows the optimal configuration to shift the load in-stantaneously and independently. The three load shiftingschemes have different complexity and performance.
• We use both simulated load traces and real traffic tracesto evaluate the performance of the proposed schemes.In particular, simulation results show that the proposedTBO scheme is efficient in reducing the energy cost androbust in QoS provisioning. When using historic load
statistics, a simple local capacity adjustment scheme (i.e.,DCP proposed in Section V-D) helps TBO achieve thedesirable performance, which is close to that in the caseof using accurate load statistics.
The rest of paper is organized as follows. In Section II,we survey related work. In Section III, we introduce thesystem models. In Section IV, we present ratio-based loadswapping scheme. We further propose ratio-based offloadingand threshold-based offloading, and discuss implementationissues in Section V. We evaluate our proposed schemes inSection VI, and discuss the efficiency of our schemes insection VII, followed by conclusions in Section VIII.
II. RELATED WORK
Datacenter energy efficiency has been extensively studied,with solutions ranging from processor-level to cross-datacenterlevel. We briefly review the most related ones here.
Dynamic speed/voltage scaling (DVS) reduces processorpower consumption by adjusting the frequency based on theinstantaneous load demand, e.g., in [2]-[13]. DVS worksfor the small-time-scale load variation, it takes only tens ofmicroseconds to charge processor frequency [9][14]. But itmay not be sufficient by itself for power management in adatacenter-level, where it is important to turn off as manyservers as possible due to the significant power consumptionof a server in the idle state.
Power management for a datacenter with dynamic loadhas been studied, e.g., in [15]-[28]. An important idea is todesign load-aware power/server provisioning schemes [15]-[23], where the capacity is controlled dynamically accordingto load variation. For example, in [15], the authors present adatacenter architecture where loads are concentrated on a poolof active servers with dynamic scale. In [16][17], the authorsuse prediction methods for dynamic server provisioning. In[18], the authors consider a large time interval, and estimatethe load at the beginning of each time interval. Capacityallocation is performed according to the current load, withserver switching cost (the cost of turning on/off servers)considered. In [19], the authors design an online algorithmfor dynamic server provisioning, where job queue informationis leveraged and Lyapunov optimization is used to establish theperformance of the algorithm. In [20], the authors develop anonline algorithm that optimally exploits energy storage devicesto minimize the average electricity cost, in dynamic load andprice environments. Virtualization and server consolidation,e.g., in [24], [25], [26], [27], [28], can reduce the trafficdynamics by consolidating applications, by which the numberof active servers can be reduced. Schemes in these studieseither only work for the large-time-scale traffic variation, orcan only be applied to a single datacenter operation
Most recently, cross-IDC power management has receivedsignificant attention, e.g., in [29]-[40]. One central idea forcross-IDC power management is to leverage the diversity ofgeolocation and the corresponding difference in electricityprice. One can route traffic to an IDC with a lower electricityprice [29]. Server provisioning is often jointly performedwith load shifting or dispatching. For example, in [30], the
3
TABLE I: Main Notations
N Number of IDCski Number of active servers of IDC i (main control variable)Ki Total number of servers of IDC is Normalized server speed, 0 ≤ s ≤ 1Di Capacity demand of IDC i (before load shifting)µi Mean of Di, i.e., µi = E(Di) (main input)
σi Standard deviation of Di, i.e., σi = [Var(Di)]12 (main input)
Di Capacity demand of IDC i (after load shifting)µi Mean of Di, i.e., µi=E(Di)Dij Load shifted from IDC i to IDC j (random variable)ηij Load shifting constraint from IDC i to IDC jδi Outage probability constraint at IDC iν Power consumption ratio of a server in the idle stateP Normalized power consumption of a server (a function of s)Pi Expected power consumption of IDC i (a function of ki & µi)αi Electricity price at the location of IDC irij Load splitting ratio at IDC i to IDC j (control variable)
authors consider a model where frontend portals allocate loadto IDCs. They minimize the sum of IDCs energy cost as afunction of number of active servers, subject to a response timerequirement. They consider a fixed arriving rate of requestsat each frontend. A similar delay constraint is considered in[32]. In [33], the authors propose a distributed load balancingand dynamic speed scaling algorithm to minimize the totalenergy cost of a number of distributed processor clusters. In[34], the authors minimize the energy and load shifting costof geographically distributed IDCs by designing distributedcapacity and load shifting algorithms. The authors extendtheir work to the case with renewable energy and limitedenergy storage devices [37]. In [35], the authors proposeonline job migration algorithms for delay-tolerant jobs amongdatacenters, which capture the fundamental tradeoff betweenthe energy cost and load shifting cost. In all the above work,the small-time-scale traffic variation is not considered. Inour work, both the large-time-scale and the small-time-scaletraffic dynamics are explicitly considered. In [38], a jointdesign of ISP and content provider through load distributionis shown to reduce energy consumption subject to a user delayconstraint. In [39], machine learning techniques are used forload distribution among IDCs that consider both utilizationand weather forecast. In [40], the authors propose to developISP-controlled nano-scale data centers (i.e., home gateways)to reduce energy consumptions.
There are also some other interesting studies on IDC powermanagement, such as workload decomposition [41], optimalpower allocation for servers with total power budget [42],and other techniques [43][44]. See [47][48] for discussionsof related challenges and prior work.
Our schemes differ from prior work in that 1) we jointlydesign server capacity allocation and load shifting schemes; 2)we consider both large-time-scale and small-time-scale trafficvariations; 3) we explicitly leverage stochastic multiplexinggain in a cross-datacenter level. A brief introduction to thework was presented in [54].
III. SYSTEM MODELS
In this section, we describe our system models, includingIDC and server speed model, IDC load and load shiftingmodel, and power consumption and cost model. We also
introduce the outage probability and formulate a generaloptimization problem. We list the main notations used in thispaper in Table I.
A. IDC and server model
Consider an operator with N IDCs located in differentgeographic areas. It is typical for an operator to have morethan 10 IDCs. IDC i has Ki servers and ki of them areturned on, i.e., being in the active state. The remaining Ki−kiservers are in the off/sleep state, which has negligible powerconsumption. Clearly, ki is a control variable that balancesthe tradeoff of service performance and energy consumption.Since we consider a service provider operating the N IDCs,we assume there is a decision-maker to determine ki for eachIDC i.
Dynamic speed scaling is considered. To elaborate, an activeserver runs at a normalized CPU speed s, where 0 ≤ s ≤ 1,and 0 represents the idle state, and 1 means the maximumCPU frequency [7][9][33]. In this paper, we assume servers arehomogenous for simplicity. That is, all servers have the samemaximum speed and the same power consumption model asspecified later. Note that in the idle state a server does have aconsiderable power consumption, as discussed in detail later.We will incorporate heterogenous servers into our models inthe future work. We further assume that the capacity of anIDC is the sum of the speed of all active servers. Then, ifeach server has the same speed s, the total capacity is kis.The maximum capacity of ki active servers is ki. Note thatscaling up/down the speed s of an active server only takesseveral microseconds [9][14], which is negligible.
B. Load model
An IDC has different types of requests, coarsely classifiedas delay sensitive jobs and delay tolerant jobs. Search, websurfing, and email login are examples of the first class,which requires a small service latency. On the other hand,background or analytical jobs are often delay tolerant, suchas data backup, MapReduce, and index generation for websearching, which can tolerate a relatively large delay. Trafficof different types of requests (i.e., the number of requests persecond) is dynamic over time and thus results in a time-varyingcapacity demand. In this paper, we use Di to denote the totalload or capacity demand at IDC i. Note that in this paper, weuse capacity-demand and load-demand alternatively, which aredifferent from the notion of traffic. Capacity or load demandhas the same physical meaning of the processor speed s, whiletraffic is the number of requests per second as mentionedabove. Di is a random variable, which changes in a smalltime scale (e.g., in subseconds). We further assume capacitydemands of different datacenters are independent, although notnecessarily identically distributed. Let µi and σ2
i denote themean and variance of Di, respectively. The variation of µi
and σ2i describe the load dynamics in the large time scale.
µi and σ2i are the main input parameters of our proposed
schemes. µi and σ2i can be obtained by load prediction or
estimation, or using historic information. In our simulations,we will evaluate the impact of using recent historic information

4
as input. In our proposed offloading schemes, we assume thatDi follows a certain distribution. Specifically, we considerGaussian distribution, exponential distribution, and Weibulldistribution, respectively.
The decision-maker receives updates of µi and σ2i from each
IDC i, and does not need to know Di in any specific time.Hence the communication overhead between the decision-maker and each IDC is negligible.
The decision-maker uses the load statistics to determinethe optimal configurations for server provisioning and loadingshifting. An IDC does not need to know the load informationof others. Each IDC shifts load in an independent and dis-tributed manner, following a policy configured by the decision-maker. Let Dij denote the load shifted from IDC i to IDC j,which is also a random variable. We use Di to denote theload of IDC i after load shifting. The mean and variance ofDi is denoted by µi and σi
2, respectively. To prevent excessiveload transfer delay or cost, we constrain the average shiftedload from IDC i to IDC j, i.e., E(Dij), by a threshold ηij .The value of ηij is determined by the available bandwidth andtransfer speed between IDC i and j. For certain IDC pairs, ifthe distance is a concern (due to transmission delay), we cansimply set ηij=0 to prevent load shifting between the two. Wenote that it is more desirable to shift the load of the delay-tolerant jobs, since those jobs are less sensitive to the loadshifting delay.
Load shifting incurs costs. In practice, some major IDC op-erators such as Google and Microsoft have their own backbonenetworks to interconnect the IDCs [49]. Load shifting costis thus mainly incurred during the construction phase. Someother IDC operators do not have their own backbone networksto connect IDCs and need to pay ISPs for the traffic shifted. Inthis case, bandwidth fees are typically charged proportionallyto the shifted traffic volume [35][46]. In addition, load shiftingincurs additional delay, which can result in revenue loss [34].In this paper, since we consider load shifting constraints, wedo not formally formulate the shifting cost in our optimizationmodels. If desired, load shifting cost can be easily incorporatedinto the problem formulation, e.g., by a linear or convex costfunction as in [35]. In our simulations, we will relax the loadshifting constraints and study the impact of load shifting costson our proposed schemes.
C. Power consumption model
According to [7][9], the normalized power consumption ofa server (processor) running at a speed s ∈ [0, 1] is
P (s) = ν + (1− ν)sϵ, (1)
where the exponent ϵ ≥ 1, with a typical value of 2 [9], andν is the power consumption ratio in the idle state, which isaround 0.6, and hardly lower than 0.5 [17]. This reflects thehigh energy consumption of idle servers, which is the mainmotivation for efficient server provisioning.
We next find the power consumption of ki active servers.When the load Di is smaller than ki, assuming homogeneousservers, each server should work with speed s = Di
kito
minimize total power consumption. Note that here we make
an assumption that the load can be arbitrarily divided amongservers. When Di ≥ ki, each server works with speed s = 1.Given the probability density function (PDF) of Di, denotedby fi(·), the total expected power consumption of the kiservers is
Pi = ki
{∫ ki
0
[ν + (1− ν)
(diki
)ϵ]fi(di)ddi+∫ ∞
ki
fi(di)ddi
},
(2)
where∫∞ki
fi(d)ddi is the expected power consumption of aserver when di ≥ ki.
To find an explicit and simple model of Pi, we numericallystudy the properties of Pi. We choose different mean andvariance of Di, and different distributions, including Gaussian,exponential, and Weibull distributions. From our numericalexperiments, it appears that Pi can be closely approximatedby a piecewise linear function:
Pi = Pi(µi, ki) ≈{
ki, if ki ≤ µi;(1− ν)µi + νki, if ki > µi.
(3)
The intuition of (3) is as follows. When ki is less than µi,each server is likely to be fully loaded, then each server hasa power consumption approximated by 1. When ki increases,power consumption of all servers increases linearly with kiand µi. When ki is much larger than µi, servers are almostidle, i.e., s is small, by which the total power is approximatedby νki.
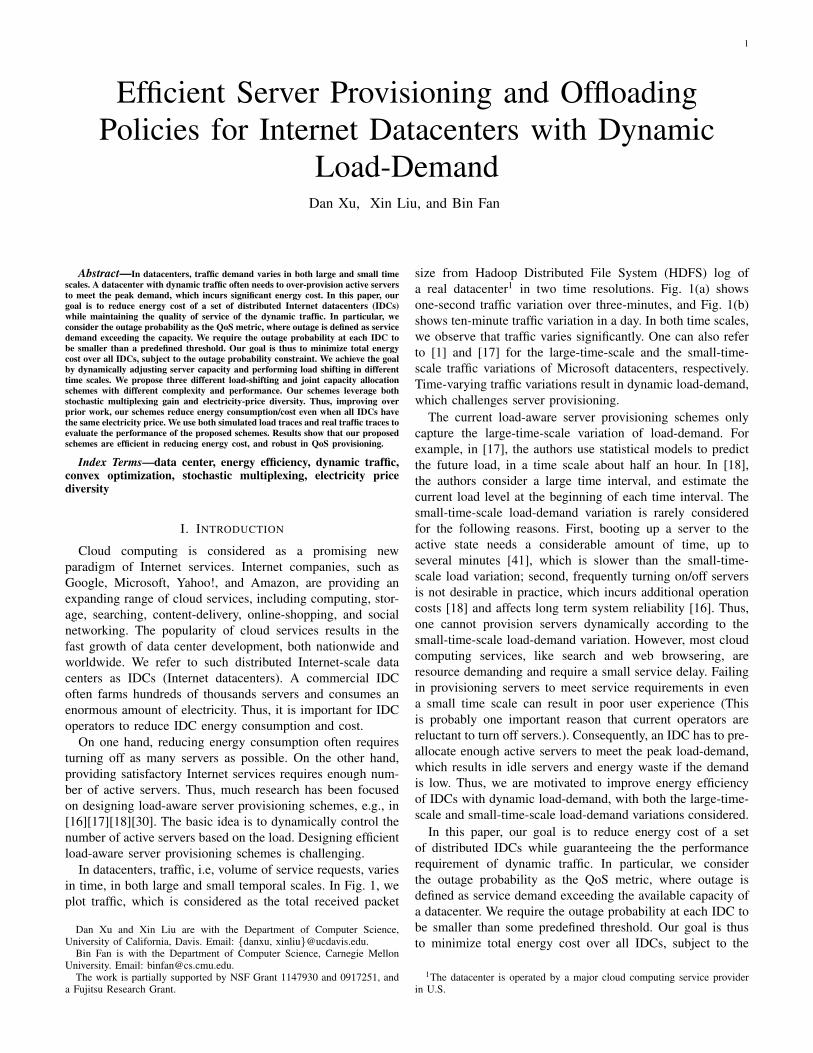
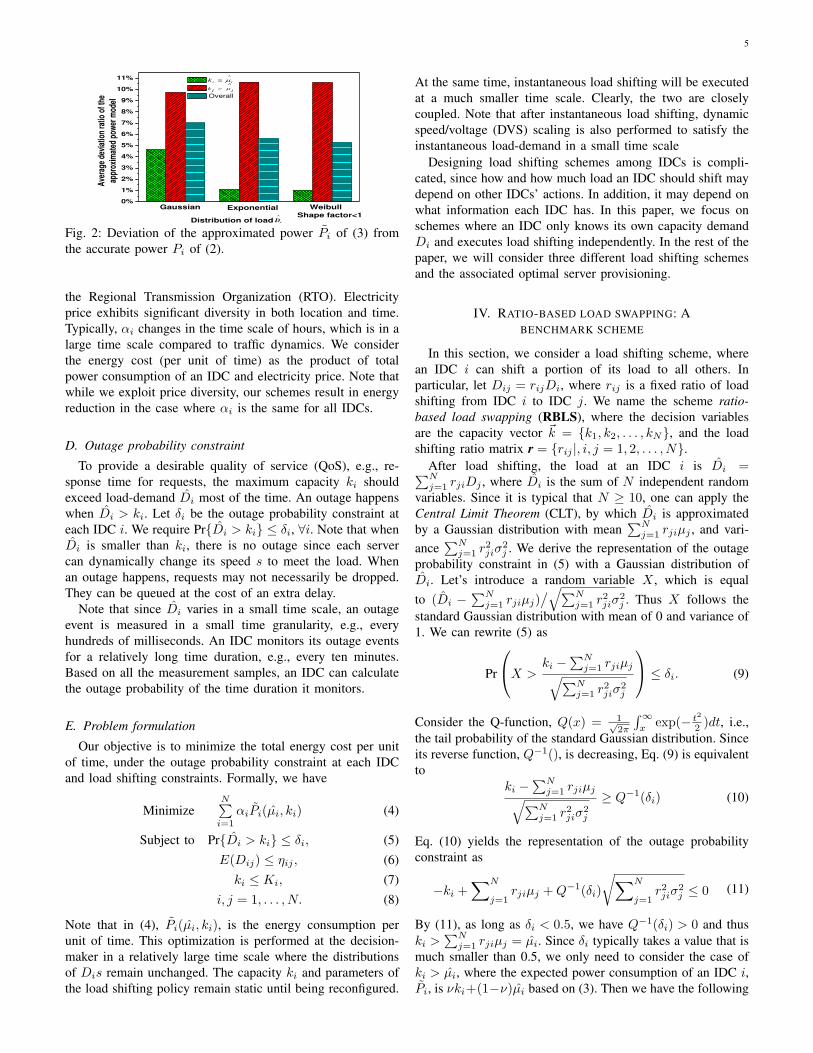
In Fig. 2, we present results of the deviation of Pi from Pi
(i.e., by (2)) under the three distributions of Di mentionedabove. Note that we consider Weibull distributions with ashape factor smaller than 1, which are thus heavy-tailed. Thedeviation is evaluated by a metric named deviation ratio,which is defined as |Pi−Pi|/Pi. For each type of distribution,we randomly generate 1000 different pairs of µi and σi. Foreach pair of µi and σi, we further randomly generated differentvalues of ki. We consider both the cases of ki ≤ µi andki > µi. For the case of ki > µi, we constrain ki by 2µi,which is conservative since Pi is closer to Pi with a larger ki(larger than 2µi) in the case of ki > µi. By Fig. 2, we observethat the deviation ratio is very small in the case of ki ≤ µi,especially for exponential distributions and heavy-tail Weibulldistributions. When ki > µi, the deviation ratio is roughly10% for each type of distribution. Note that in this case, thedeviation ratio gets smaller if we choose kis larger than 2µi.Overall, the deviation ratio is around 5%. Results in Fig. 2indicate that Pi is close to Pi. In addition, in our numericalstudy, we found Pi is larger than Pi in almost all cases, whichimplies that Pi is an conservative upper bound.
Other equipments in an IDC, e.g., cooling systems, alsocontribute to the total power consumption, which is roughlyproportional to that of the servers [50][51]. Thus the totalpower consumption of an IDC can be obtained by scalingup Pi by a constant factor. For notation brevity, we absorbthis constant factor into the electricity price αi at IDC i.Typically, the electricity price of a consumer (IDC operatorin this case) is determined hourly by a bilateral contract with
5
0%
1%
2%
3%
4%
5%
6%
7%
8%
9%
10%
11%^
iik
^
iik
^
iD
Weibull
Shape factor<1Exponential
Ave
rage
dev
iatio
n ra
tio o
f the
appr
oxim
ated
pow
er m
odel
Overall
Gaussian
Distribution of load
Fig. 2: Deviation of the approximated power Pi of (3) fromthe accurate power Pi of (2).
the Regional Transmission Organization (RTO). Electricityprice exhibits significant diversity in both location and time.Typically, αi changes in the time scale of hours, which is in alarge time scale compared to traffic dynamics. We considerthe energy cost (per unit of time) as the product of totalpower consumption of an IDC and electricity price. Note thatwhile we exploit price diversity, our schemes result in energyreduction in the case where αi is the same for all IDCs.
D. Outage probability constraint
To provide a desirable quality of service (QoS), e.g., re-sponse time for requests, the maximum capacity ki shouldexceed load-demand Di most of the time. An outage happenswhen Di > ki. Let δi be the outage probability constraint ateach IDC i. We require Pr{Di > ki} ≤ δi, ∀i. Note that whenDi is smaller than ki, there is no outage since each servercan dynamically change its speed s to meet the load. Whenan outage happens, requests may not necessarily be dropped.They can be queued at the cost of an extra delay.
Note that since Di varies in a small time scale, an outageevent is measured in a small time granularity, e.g., everyhundreds of milliseconds. An IDC monitors its outage eventsfor a relatively long time duration, e.g., every ten minutes.Based on all the measurement samples, an IDC can calculatethe outage probability of the time duration it monitors.
E. Problem formulation
Our objective is to minimize the total energy cost per unitof time, under the outage probability constraint at each IDCand load shifting constraints. Formally, we have
MinimizeN∑i=1
αiPi(µi, ki) (4)
Subject to Pr{Di > ki} ≤ δi, (5)E(Dij) ≤ ηij , (6)
ki ≤ Ki, (7)i, j = 1, . . . , N. (8)
Note that in (4), Pi(µi, ki), is the energy consumption perunit of time. This optimization is performed at the decision-maker in a relatively large time scale where the distributionsof Dis remain unchanged. The capacity ki and parameters ofthe load shifting policy remain static until being reconfigured.
At the same time, instantaneous load shifting will be executedat a much smaller time scale. Clearly, the two are closelycoupled. Note that after instantaneous load shifting, dynamicspeed/voltage (DVS) scaling is also performed to satisfy theinstantaneous load-demand in a small time scale
Designing load shifting schemes among IDCs is compli-cated, since how and how much load an IDC should shift maydepend on other IDCs’ actions. In addition, it may depend onwhat information each IDC has. In this paper, we focus onschemes where an IDC only knows its own capacity demandDi and executes load shifting independently. In the rest of thepaper, we will consider three different load shifting schemesand the associated optimal server provisioning.
IV. RATIO-BASED LOAD SWAPPING: ABENCHMARK SCHEME
In this section, we consider a load shifting scheme, wherean IDC i can shift a portion of its load to all others. Inparticular, let Dij = rijDi, where rij is a fixed ratio of loadshifting from IDC i to IDC j. We name the scheme ratio-based load swapping (RBLS), where the decision variablesare the capacity vector k = {k1, k2, . . . , kN}, and the loadshifting ratio matrix r = {rij |, i, j = 1, 2, . . . , N}.
After load shifting, the load at an IDC i is Di =∑Nj=1 rjiDj , where Di is the sum of N independent random
variables. Since it is typical that N ≥ 10, one can apply theCentral Limit Theorem (CLT), by which Di is approximatedby a Gaussian distribution with mean
∑Nj=1 rjiµj , and vari-
ance∑N
j=1 r2jiσ
2j . We derive the representation of the outage
probability constraint in (5) with a Gaussian distribution ofDi. Let’s introduce a random variable X , which is equalto (Di −
∑Nj=1 rjiµj)
/√∑Nj=1 r
2jiσ
2j . Thus X follows the
standard Gaussian distribution with mean of 0 and variance of1. We can rewrite (5) as
Pr
X >ki −
∑Nj=1 rjiµj√∑N
j=1 r2jiσ
2j
≤ δi. (9)
Consider the Q-function, Q(x) = 1√2π
∫∞x
exp(− t2
2 )dt, i.e.,the tail probability of the standard Gaussian distribution. Sinceits reverse function, Q−1(), is decreasing, Eq. (9) is equivalentto
ki −∑N
j=1 rjiµj√∑Nj=1 r
2jiσ
2j
≥ Q−1(δi) (10)
Eq. (10) yields the representation of the outage probabilityconstraint as
−ki +∑N
j=1rjiµj +Q−1(δi)
√∑N
j=1r2jiσ
2j ≤ 0 (11)
By (11), as long as δi < 0.5, we have Q−1(δi) > 0 and thuski >
∑Nj=1 rjiµj = µi. Since δi typically takes a value that is
much smaller than 0.5, we only need to consider the case ofki > µi, where the expected power consumption of an IDC i,Pi, is νki+(1−ν)µi based on (3). Then we have the following
6
optimization problem for RBLS.
min(k,r)∑N
i=1 αi
[νki + (1− ν)
∑Nj=1 rjiµj
](12)
s. t. − ki +N∑j=1
rjiµj +Q−1(δi)
√N∑j=1
r2jiσ2j ≤ 0, (13)∑N
j=1 rij = 1, (14)rijµi ≤ ηij , (15)ki ≤ Ki, (16)
i, j = 1, 2 . . . , N. (17)
We next show that the problem formulated in (12)-(17) is aconvex optimization problem.
Because the functions in (12)(14)(15)(16) are all affineon (k, r) and thus convex, we only need to show theconstraint function in (13) is also convex on (k, r). Since−ki+
∑Nj=1 rjiµj is affine, we focus on the function I(k, r) =√∑N
j=1 r2jiσ
2j . We can decompose I(k, r) to two functions.
The first one is V (k, r) = (V1, . . . , VN ), where Vj = rjiσj ,j = 1, . . . , N . The second is a Euclidian norm, i.e., U(V ) =√V1
2 + V22, . . . , VN
2. The function U is a convex functionof V , and it is also non-decreasing for each Vj . Second, Vj ,j = 1, 2 . . . , N , is an affine and therefore convex functionof (k, r). Therefore, according to [53], the compound functionI(k, r) = U(V (k, r)) is a convex function of (k, r). Then (12)-(15) is a convex optimization problem.
Now we present a simple example to highlight how RBLSreduces energy consumption. Consider homogenous IDCs withthe same load statistics, electricity price, and outage probabil-ity constraint, and omit the constraints in (15) and (16). Letµi = µ, σi = σ, and δi = δ, ∀i. We consider a solution wherer = rij , j = i, i.e., an IDC shifts the same portion of load toall the others. We have rii = 1− (N − 1)r.
By (11), we can obtain
ki = µ+Q−1(δ)σ√(1− (N − 1)r)2 + (N − 1)r2, (18)
where 0 < r < 1N−1 . We further have
ki =
{µ+Q−1(δ)σ, r = 0 (No load shifting);µ+ Q−1(δ)σ√
N, r = 1
N (RBLS).(19)
By (19), it is clear that RBLS reduces the capacity provisioningat each IDC, and thus lowers energy cost even in the caseof homogenous αi. RBLS can reduce energy consumptionbecause it utilizes stochastic multiplexing to reduce the vari-ance in capacity demand in each IDC (the
√N term in the
denominator). In addition, RBLS can also reduce energy costby shifting more load to an IDC with a lower price αi, or witha larger capacity limit.
Problem (12)-(17) can be solved efficiently. However, inpractice, it may be expensive to implement this solution. Thisis because by the solution, any two IDCs may have a loadswap. That is, RBLS results in Θ(N2) load shifting for NIDCs. When N goes large, the operation becomes complex.For this reason, we next consider an offloader-based modelwhere each IDC only shifts load to one selected offloader.The complexity of load shifting is therefore Θ(N), in which
case the operation is much simpler. We take RBLS as abenchmark scheme to evaluate the performance of offloaderbased schemes. Moreover, as shown later, we also use RBLSto select the offloader. Note that an offloader is also an IDCwhich also has its own load.
V. OFFLOADER-BASED LOAD SHIFTING
In this section, we consider offloader-based load shiftingschemes. We focus on the case where there is one IDCas an offloader. Without losing generality, we assume thatIDC 1 is selected as the offloader. IDC i, i = 2, ...N ,shifts load to the offloader. Note that the offloader has itsown load. We explore two offloading structures, i.e., ratio-based offloading and threshold-based offloading. We will thenconsider offloader selection and discuss the case of multipleoffloaders. Last, we will consider implementation issues, inparticular, we sketch a dynamic capacity provisioning schemeto handle the discrepancy between assumed load distributionand real IDC load pattern.
A. Ratio-based offloading
In ratio-based offloading (RBO), an IDC i transfers riportion of the load to the offloader. The control variable is(k, r), where k = (k1, . . . kN ), r = (r1, . . . rN ), and r1 = 1.
At the offloader, the load from other IDCs and itself isaggregated and can be approximated by Gaussian distribution.The outage probability constraint is similar to (13). But at eachIDC, the load left, i.e., Di = (1 − ri)Di, follows the same,but scaled down, distribution as Di. To explicitly obtain theoutage probability for each IDC, we need to assume specificdistributions for Di in our optimization model. To overcomethe discrepancy between the assumed distribution and realload pattern, we later propose a dynamic scheme that an IDCscales up or down the capacity allocated by the solutionsderived from the optimization models. Generally speaking, ifthe assumed distribution is not heavy-tailed, and the real loaddistribution is heavy-tailed, the capacity probably needs to betuned up, and vice versa.
We next consider three distributions: Gaussian, exponential,and Weibull. We choose these three because Gaussian distribu-tion is not heavy-tailed, Weibull distribution with shape factorsmaller than 1 is heavy-tailed, and exponential distributionis at the boundary of being heavy-tailed. In practice, otherdistributions can be chosen based on measurement. Similar to(12)-(17), we have the following optimization model for RBO.
a) Gaussian:
min(k,r)
∑Ni=1 αiνki + (1− ν)
[∑Ni=1 αiµi
+∑N
i=2(α1 − αi)riµi
](20)
s. t. −k1 +N∑i=1
riµi +Q−1(δ1)
√N∑i=1
r2i σ2i ≤ 0, (21)
−ki + (1− ri)[µi +Q−1(δi)σi] ≤ 0, i = 1, (22)riµi ≤ ηi1, i = 1, (23)
ki ≤ Ki, (24)i = 1, 2 . . . , N. (25)
7
In (20), Pi= νki + (1 − ν)µi, because we have ki > µi by(21) and (22), i = 0, 1, . . . , N . Similar to (12)-(17), (20)-(25)is also a convex optimization problem.
b) Exponential: We have Di ∼λie−λi(di−τi), where τi
is the minimum value of Di. The outage probability constraintfor an IDC i, which replaces (22), is
−ki + (1− ri)
(τi +
ln 1δi
λi
)≤ 0. (26)
c) Heavy-tailed Weibull: We have Di ∼ λiρ[λi(di −τi)]
ρ−1e[−λi(di−τi)]ρ
, where ρ is the shape factor. When ρ < 1,a Weibull distribution is heavy-tailed. In this case, the outageprobability constraint function in (22) is replaced by
−ki + (1− ri)
[τi +
(ln 1δi)
1ρ
λi
]≤ 0. (27)
Clearly, the optimization problem for RBO is still convex ifwe replace (22) by either (26) or (27).
By RBO, the load left at each IDC is still random andfollows the same distribution (although scaled down) as theoriginal load. The role of the offloader is mainly to reduce theload burden for each IDC. Therefore, an IDC i may still needto reserve extra servers to handle the load dynamics, especiallywhen the QoS constraint δi is small, or when Di followsa heavy-tailed distribution. To overcome this drawback, weconsider a different offloading structure, named threshold-based offloading.
B. Threshold based offloading
In threshold-based offloading (TBO), an IDC i sets itscapacity ki as the threshold. If the load Di is larger than ki,IDC i shifts the excessive load, Di − ki, to the offloader. IfDi is no larger than ki, no load is shifted to the offloader.Therefore, in each IDC, the capacity always meets the demandwith load shifting. Hence the outage probability is 0. The loadshifted from IDC i to the offloader is Di1=max{Di − ki, 0},denoted by (Di − ki)
+. The value of (Di − ki)+ depends on
the distribution of Di. To study the properties of TBO and toobtain a closed-form representation, we assume that Di fol-lows an exponential distribution, with a PDF of λie
−λi(di−τi).Remark: We choose exponential distribution because it lies
at the boundary of heavy-tail and non heavy-tail distributions.Furthermore, measurement study in [52], as well as the clustertraces we use in simulation, shows that the load at a data centeris more likely non heavy-tailed. In this case, the capacity allo-cation based on exponential distribution is more conservative,which provides robust performance for real IDC load. Last,we use exponential distribution to present an optimizationmodel, based on which we will design the dynamic capacityprovisioning scheme to handle the discrepancy between theassumed load distribution and the real one.
We now derive the mean and variance of (Di−ki)+. Since
we have (Di − ki)+ = 0 when Di ≤ ki, and (Di − ki)
+ =
Di − ki when Di > ki, there is
E[(Di − ki)+] =0 ∗
∫ ki
τi
λie−λi(di−τi)ddi
+
∫ ∞
ki
λie−λi(di−τi)(di − ki)ddi
=e−λi(ki−τi)
λi,
(28)
Further, there is
Var[(Di − ki)+] =
2e−λi(ki−τi) − e−3λi(ki−τi)
λ2i
. (29)
At the offloader, the aggregated load is
D1 = D1 +∑N
i=2(Di − ki)
+. (30)
We still apply CLT to approximate the distribution of D1 asGaussian, with mean 1
λ1+ τ1+
∑Ni=2
e−λi(ki−τi)
λiand variance
1λ21
+∑N
i=22e−λi(ki−τi)−e−3λi(ki−τi)
λ2i
. Note that µ1 = 1λ1
+ τ1.At the offloader, similar to (13), the outage probability con-straint Pr{k1 ≥ D1} ≤ δ1 can be written as
− k1 +1
λ1+ τ1 +
N∑i=2
e−λi(ki−τi)
λi+
Q−1(δ1)
[1
λ21
+N∑i=2
2e−λi(ki−τi) − e−3λi(ki−τi)
λ2i
] 12
≤ 0.
(31)
Our objective is to determine k = (k1, . . . , kN ) efficientlythrough convex optimization. The LHS of (31) is not necessar-ily a convex function of k. To address this issue, we make animportant observation here that e−3λi(ki−τi)≪2e−λi(ki−τi).Thus we can simplify (31) to
− k1 +1
λ1+ τ1 +
N∑i=2
e−λi(ki−τi)
λi+
Q−1(δ1)
[1
λ21
+
N∑i=2
2e−λi(ki−τi)
λ2i
] 12
≤ 0.
(32)
Clearly, −k1+1λ1
+ τ1+∑N
i=2e−λi(ki−τi)
λiis the sum of a set
of convex functions of k, and thus also a convex function of
k.[
1λ21+∑N
i=22e−λi(ki−τi)
λ2i
] 12
is a Euclidian norm function
of [ 1λ1,√2e−
λi(ki−τi)2
λi, i = 2, . . . , N ]. Since
√2e−
λi(ki−τi)2
λiis
a convex function of k,[
1λ21+∑N
i=22e−λi(ki−τi)
λ2i
] 12
is also
a convex function of k. Thus the LHS of (32) is a convexfunction of k. Meanwhile, a solution of k that satisfies (32)must also satisfy (31).
Now we consider the power consumption at the offloaderand each IDC. First, by (32), we have k1 > µ1. Then theexpected power consumption at the offloader is
P1 = νk1 + (1− ν)
[1
λ1+ τ1 +
N∑i=2
e−λi(k1−τ1)
λi
]. (33)
8
We next determine the expected power consumption Pi foreach IDC i, i = 1. By TBO, power consumption at an IDCi after load shifting is the same as that before load shifting,i.e., Pi(ki, µi). This is because when there is load shifted, i.e.,Di > ki, speed s of each server is 1,
∫∞ki
fi(di)ddi in (2) stillholds.
A key question here is whether ki is larger or smaller thanµi in (3). Note the function (3) is concave on ki over theentire range. To obtain a convex power function on ki, wefirst assume ki ≥ µi. Later we will propose a suboptimalalgorithm that incorporates the case where ki < µi. We thenhave Pi = νki+(1−ν)µi, where µi =
1λi
+τi, i = 2, . . . , N .We further have the following optimization problem for TBO
mink
N∑i=1
αi
[νki + (1− ν)
(1λi
+ τi
)]+
α1(1− ν)N∑i=2
e−λi(ki−τi)
λi(34)
s. t. −k1 +1λ1
+ τ1 +∑N
i=2e−λi(ki−τi)
λi+
Q−1(δ1)[
1λ21+∑N
i=22e−λi(ki−τi)
λ2i
] 12 ≤ 0, (35)
e−λi(ki−τi)
λi≤ ηi1, i = 1, (36)
µi ≤ ki ≤ Ki, (37)i = 1, . . . , N. (38)
Clearly, (34)-(38) is a convex function of k, since both theobjective function and all constraint functions are convex ofk. In order to extend the result to the whole range of ki, wepropose Algorithm 1 that relaxes the requirement of ki ≥ µi
for some IDCs. Our basic idea is to let IDCs with a higherprice consider the option of ki < µi. In Step 3 of Algorithm1, we let j to index the IDC (currently with µj ≤ kj ≤ Kj)with the largest electricity price. We set its power consumptionfunction as Pj = kj in (34), and replace the constraint ofµj ≤ kj ≤ Kj in (37) by 0 ≤ kj < µj . If total energycost reduces by this setting, we then consider the option ofki < µi for the IDC with second highest electricity price. Wekeep doing it until energy cost does not decrease anymore.
Intuitively, by TBO, for all non-offloader IDCs, load (aftershifting) is bounded by the capacity. All “excess” load isaggregated at the offloader. A higher stochastic multiplexinggain is expected globally. In addition, the QoS constraint onlyaffects the offloader, and thus renders TBO less sensitive toboth the variation of QoS constraint and load distributions.
Algorithm 1 Relax the constraint of ki ≥ µi for TBO.1: Computes k by (34)-(38) with the constraint ki ≥ µi, ∀i. Let k = k.2: Sort the price vector {αi}.3: Choose the IDC with the largest price. Index it by j. Replace νkj +(1−ν)( 1
λj+
τj) in (34) by kj , and µj ≤ kj ≤ Kj in (37) by 0 ≤ kj < µj .4: Recomputes k by (34)-(38) with Pj = kj and 0 ≤ kj < µj .5: if Total energy cost reduces then6: Let k = k. Remove αj from {αi}. Goto 3.7: else8: Output k as the capacity allocation solution.9: end if
C. Offloader selection
Our offloading schemes assume a given offloader. In prac-tice, it is also important to decide which IDCs should be theoffloaders. As stated, a major IDC operator may have over100 datacenters worldwide. Then IDCs can be clustered andeach cluster can be served by a selected offloader. In practice,an offloader may need to copy the background data from theIDCs served. For example, to shift windows messenger loginrequests, the offloader first needs to copy the correspondinguser profile information from the source IDCs. Moreover, it isdesirable for the offloader to be near to the IDCs it served, toreduce the load shifting delay and other costs. Thus, mission-similar or geographic adjacent IDCs may be good candidatesto form an offloading clustering. In this paper, we do notaddress how to cluster IDCs. We mainly consider two issues.The first is that how many offloaders is proper given a numberof IDCs. The second is how to select an offloader given a setof IDCs in an offloading cluster.
The more offloaders, the less IDCs each offloader servers.Thus, we study the first issue by considering how many IDCsan offloader should serve. Intuitively, if the offloader has alarger capacity limit, it can serve more IDCs to exploit a largermultiplexing gain. If the load shifting constraint between theoffloader and IDCs is small, it may also be desirable for theoffloader to serve a larger number of IDCs to fully utilize thecapacity. Finding the optimal number of IDCs served by oneIDC is difficult. We will study this issue by simulations inSection VI, under different offloading schemes.
Given a set of IDCs, one can search the optimal offloaderby considering every IDC and selecting the one with the bestperformance, which is referred to optimal offloader selection.However, when there are a large number of candidate IDCs,e.g., over 10, there might be an innegligible time overheadin selecting offloader by the scheme. We thus explore analternative approach. There are several factors in choosing agood offloader. A candidate may have a lower electricity price,more available network bandwidth for load shifting from otherIDCs, and a larger capacity limit. To comprehensively considerthe factors, we rely on RBLS to choose the offloader. Theoptimization model (12)-(17) incorporates all these aspects.Its solution allows us to calculate the average amount of loadeach IDC absorbs from other IDCs, which is denoted byAi. We have Ai =
∑j,j =i rjiµj . The IDC with the largest
Ai is chosen as the offloader. We refer to this scheme asRBLS-based offloader selection, which is suboptimal but hasa smaller time overhead. We will compare this scheme to theoptimal offloader selection scheme in the simulations. Notethat different IDCs may be selected as the offloader at differenttime. The variation of electric price and load statistics cantrigger the reselection of the offloader.
D. Implementation considerations
In all the proposed schemes, RBLS, RBO, and TBO, thedecision is made in a relatively large time scale, based onstatistics of load-demand. To apply them, there are severalpractical issues to be addressed.
9
To obtain load statistics, i.e., µi and σ2i , one can use instan-
taneous measurements, e.g., applying a sliding window, or usehistoric data. To update the load statistics with the decision-maker, an IDC can follow either predetermined schedule,or on-demand update, where an update is triggered if thecurrent load statistics differ from the previous values by certainthresholds. Note that the communication overhead betweeneach IDC and the decision-maker is low since updating thedecision-maker is performed in a large time scale.
Since our analytical models are based on certain load dis-tributions, there is potential discrepancy between the assumedload patterns (e.g., based on measurements) and the real loaddistribution. As a consequence, our scheme may result inover- or under-provisioning of capacity. To address this issue,we consider a dynamic capacity/server provisioning (DCP)scheme. DCP complements the optimization model basedserver provisioning by performing local adjustment based onthe QoS measurement. In particular, each IDC monitors itsown outage probability. It increases (decreases) its local activeserver number if the outage probability is higher (lower) thanthe desired value. Techniques from stochastic approximationand adaptive algorithms can be readily applied here. In thiscontext, a good starting point is provided by the optimalsolution determined by the decision-maker with assumptionson load distribution. Note the notion of DCP is different fromdynamic turning on/off servers according to instantaneousload-demand, which is usually impractical because of delay. Itworks with the proposed analytical schemes to better guaranteeQoS in a relatively large time scale, e.g., tens of minutes toa hour. We also note that DCP is different from the notationof dynamic speed/voltage scaling (DVS), which is to adjustserver speed instead of the number of active servers. We willevaluate our proposed static schemes, i.e., RBO and TBO, withthe DCP in Section VI.
VI. PERFORMANCE EVALUATION
In this section, we evaluate the performance of the proposedload shifting schemes. We first compare RBLS, RBO, andTBO based on synthetic load generated with a certain distri-bution. We then use real traffic traces to study the performanceof RBO and TBO.
A. Comparing RBLS, RBO and TBO using simulated traces
1) Simulation setup: We consider N = 15 IDCs. Each IDCi has a capacity limit Ki of 100. We conduct 100 rounds ofsimulations. In each round, we generate load for each IDCindependently following a certain distribution. We considerGaussian, exponential, and Weibull distribution with a shapefactor of 0.5 (heavy-tailed setting), respectively. We let themean of load, µi, and variance σ2
i for each IDC i, be 10 and25, respectively. Electricity price αi is randomly generatedin the range from 1 to 5 2. Load shifting constraint ηij isset as the product of µi and a coefficient randomly chosenfrom (0, 0.5]. We consider each IDC has the same outageprobability constraint δ, which takes values in [0.0005, 0.001,
2In Davis, the ratio of peak and valley of electricity price is roughly 5.
200
300
400
500
600
700
800
900
1000
1100
1200
Relax load shifting constraint
Gaussian distributed load
20015010050105210.5
Tota
l cos
t
Shifting cost per unit of load
RBO
TBO
RBLS
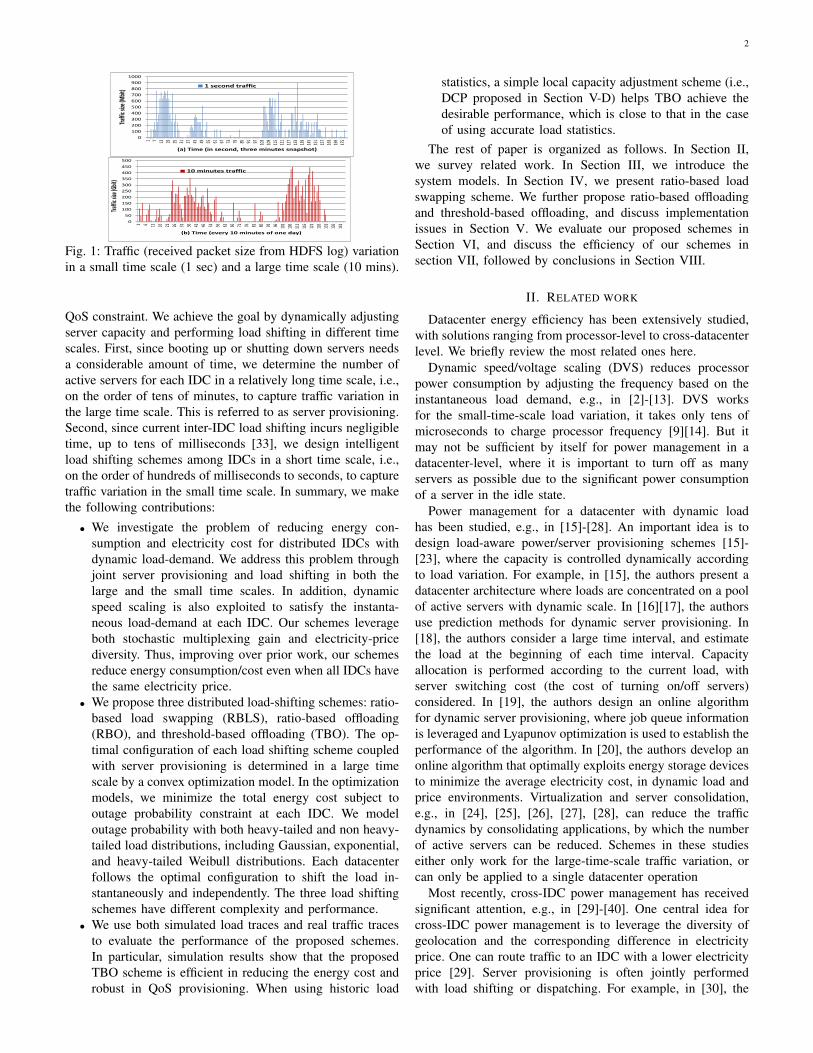
Fig. 5: The impact of load shift cost on RBLS, RBO and TBO.
0.005, 0.01, 0.05, 0.1, 0.15, 0.2]. We consider the idle statepower consumption ratio ν of 0.6. The performance metricis the total energy cost of IDCs. We use Pi of (2) as powerconsumption of each server in simulation, and Pi of (3) aspower of an IDC in analysis. Note that among the 15 IDCs,there is an offloader selected by the RBLS-based offloaderselection scheme in each simulation round, in both the casesof RBO and TBO.
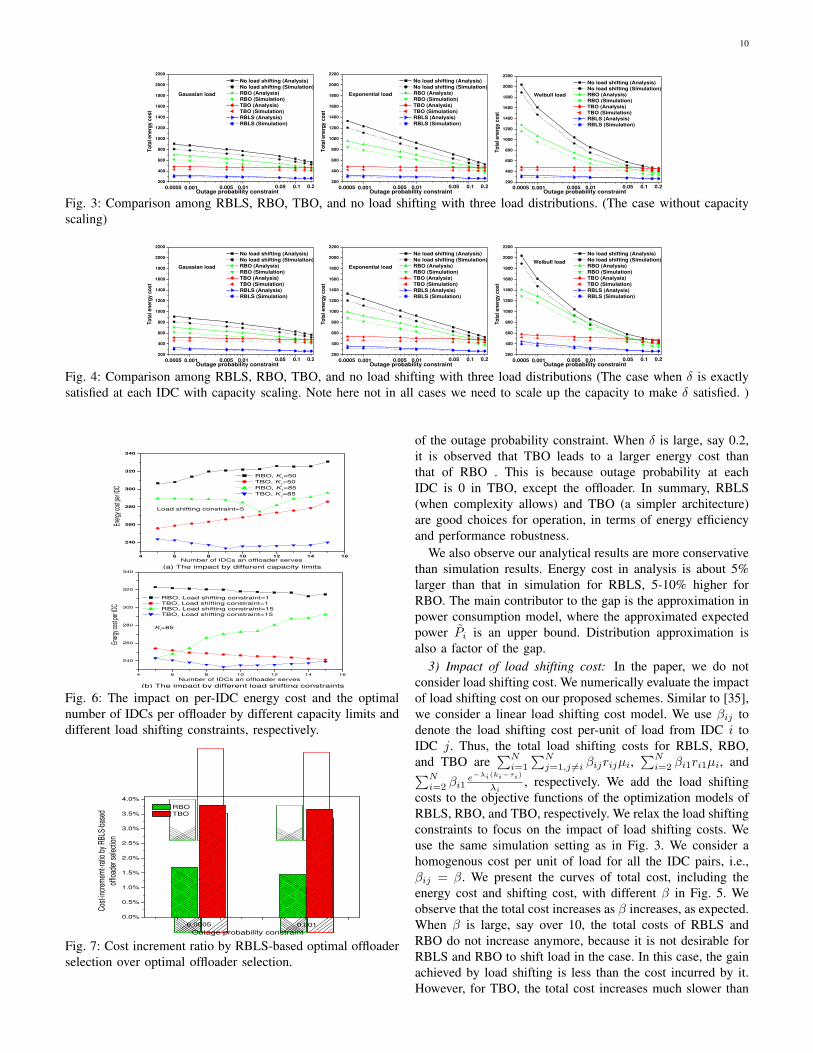
2) Performance of RBLS, RBO and TBO: We compare theperformance of RBLS, TBO, RBO, and no-load-shifting. Be-cause of the approximation and assumptions on distributions,the proposed schemes (without capacity scaling) do not alwayssatisfy the outage constraint. To remedy the discrepancy in δ,we scale up/down the local server capacity for each scheme sothat the outage probability constraint is satisfied with equality.Curves of the energy cost of different schemes without andwith capacity scaling, are plotted in Fig. 3 and Fig. 4,respectively. Comparing Fig. 3 and Fig. 4, we observe thatwith Gaussian distribution, there is virtually no differencebetween capacity scaling and without scaling because theoutage probability constraint is mostly satisfied in all schemes.A slightly larger difference is observed for exponential dis-tribution, especially when δ is small. The largest differenceoccurs in Weibull distribution, and especially with a small δ.Therefore, in practice, the capacity scaling or dynamic serverprovisioning as proposed in last section is needed when loadis heavy-tailed and when the QoS constraint is tight. In othercases, i.e., the QoS constraint is loose and load is non heavy-tailed, our analytical results can be directly applied. Note thatcapacity scaling here only remedies the discrepancy of theassumed or approximated load distribution by our analyticalresults, while accurate load statistics, i.e., mean and variance,are the input in this simulation. In next part where simulationis based on real cluster traces, we use historic load statisticsas the input instead of accurate load statistics. Therefore, weneed dynamic capacity/server provisioning (DCP) proposedin Section V-D to remedy the gap between historic loadstatistics and accurate load statistics, and the discrepancy bythe assumed or approximated load distribution as well.
We observe from both Fig. 3 and Fig. 4 that RBLS resultsin by far the lowest energy cost in all three load distributions,followed by TBO. No-load-shifting has the highest energy costin most cases. The energy costs of RBLS and TBO increaseslowly with δ, and those of RBO and no-load-shifting increasemuch faster, in particular under Weibull distribution. Thisobservation indicates that TBO is insensitive to the variation
10
200
400
600
800
1000
1200
1400
1600
1800
2000
2200
Gaussian load
0.20.10.050.010.0050.0005 0.001
To
tal en
erg
y c
ost
Outage probability constraint
No load shifting (Analysis)
No load shifting (Simulation)
RBO (Analysis)
RBO (Simulation)
TBO (Analysis)
TBO (Simulation)
RBLS (Analysis)
RBLS (Simulation)
200
400
600
800
1000
1200
1400
1600
1800
2000
2200
Exponential load
0.20.10.050.010.0050.0005 0.001
To
tal en
erg
y c
ost
Outage probability constraint
No load shifting (Analysis)
No load shifting (Simulation)
RBO (Analysis)
RBO (Simulation)
TBO (Analysis)
TBO (Simulation)
RBLS (Analysis)
RBLS (Simulation)
200
400
600
800
1000
1200
1400
1600
1800
2000
2200
Weibull load
0.20.10.050.010.0050.0005 0.001
To
tal en
erg
y c
ost
Outage probability constraint
No load shifting (Analysis)
No load shifting (Simulation)
RBO (Analysis)
RBO (Simulation)
TBO (Analysis)
TBO (Simulation)
RBLS (Analysis)
RBLS (Simulation)
Fig. 3: Comparison among RBLS, RBO, TBO, and no load shifting with three load distributions. (The case without capacityscaling)
200
400
600
800
1000
1200
1400
1600
1800
2000
2200
Gaussian load
0.20.10.050.010.0050.0005 0.001
To
tal en
erg
y c
ost
Outage probability constraint
No load shifting (Analysis)
No load shifting (Simulation)
RBO (Analysis)
RBO (Simulation)
TBO (Analysis)
TBO (Simulation)
RBLS (Analysis)
RBLS (Simulation)
200
400
600
800
1000
1200
1400
1600
1800
2000
2200
Exponential load
0.20.10.050.010.0050.0005 0.001
To
tal en
erg
y c
ost
Outage probability constraint
No load shifting (Analysis)
No load shifting (Simulation)
RBO (Analysis)
RBO (Simulation)
TBO (Analysis)
TBO (Simulation)
RBLS (Analysis)
RBLS (Simulation)
200
400
600
800
1000
1200
1400
1600
1800
2000
2200
Weibull load
0.20.10.050.010.0050.0005 0.001
To
tal en
erg
y c
ost
Outage probability constraint
No load shifting (Analysis)
No load shifting (Simulation)
RBO (Analysis)
RBO (Simulation)
TBO (Analysis)
TBO (Simulation)
RBLS (Analysis)
RBLS (Simulation)
Fig. 4: Comparison among RBLS, RBO, TBO, and no load shifting with three load distributions (The case when δ is exactlysatisfied at each IDC with capacity scaling. Note here not in all cases we need to scale up the capacity to make δ satisfied. )
4 6 8 10 12 14 16
240
260
280
300
320
340
(a) The impact by different capacity limits
Load shifting constraint=5
RBO, K1=50
TBO, K1=50
RBO, K1=85
TBO, K1=85
Ener
gy co
st pe
r IDC
Number of IDCs an offloader serves
4 6 8 10 12 14 16
240
260
280
300
320
340
(b) The impact by different load shifting constraints
Ki=85
RBO, Load shifting constraint=1
TBO, Load shifting constraint=1
RBO, Load shifting constraint=15
TBO, Load shifting constraint=15
Ener
gy co
st pe
r IDC
Number of IDCs an offloader serves
Fig. 6: The impact on per-IDC energy cost and the optimalFig. 6: The impact on per-IDC energy cost and the optimalnumber of IDCs per offloader by different capacity limits anddifferent load shifting constraints, respectively.
0.0%
0.5%
1.0%
1.5%
2.0%
2.5%
3.0%
3.5%
4.0%
0.001
Cos
t-inc
rem
emt-r
atio
by
RBL
S-ba
sed
offlo
ader
sel
ectio
n
Outage probability constraint
RBO
TBO
0.0005
Fig. 7: Cost increment ratio by RBLS-based optimal offloaderselection over optimal offloader selection.
of the outage probability constraint. When δ is large, say 0.2,it is observed that TBO leads to a larger energy cost thanthat of RBO . This is because outage probability at eachIDC is 0 in TBO, except the offloader. In summary, RBLS(when complexity allows) and TBO (a simpler architecture)are good choices for operation, in terms of energy efficiencyand performance robustness.
We also observe our analytical results are more conservativethan simulation results. Energy cost in analysis is about 5%larger than that in simulation for RBLS, 5-10% higher forRBO. The main contributor to the gap is the approximation inpower consumption model, where the approximated expectedpower Pi is an upper bound. Distribution approximation isalso a factor of the gap.
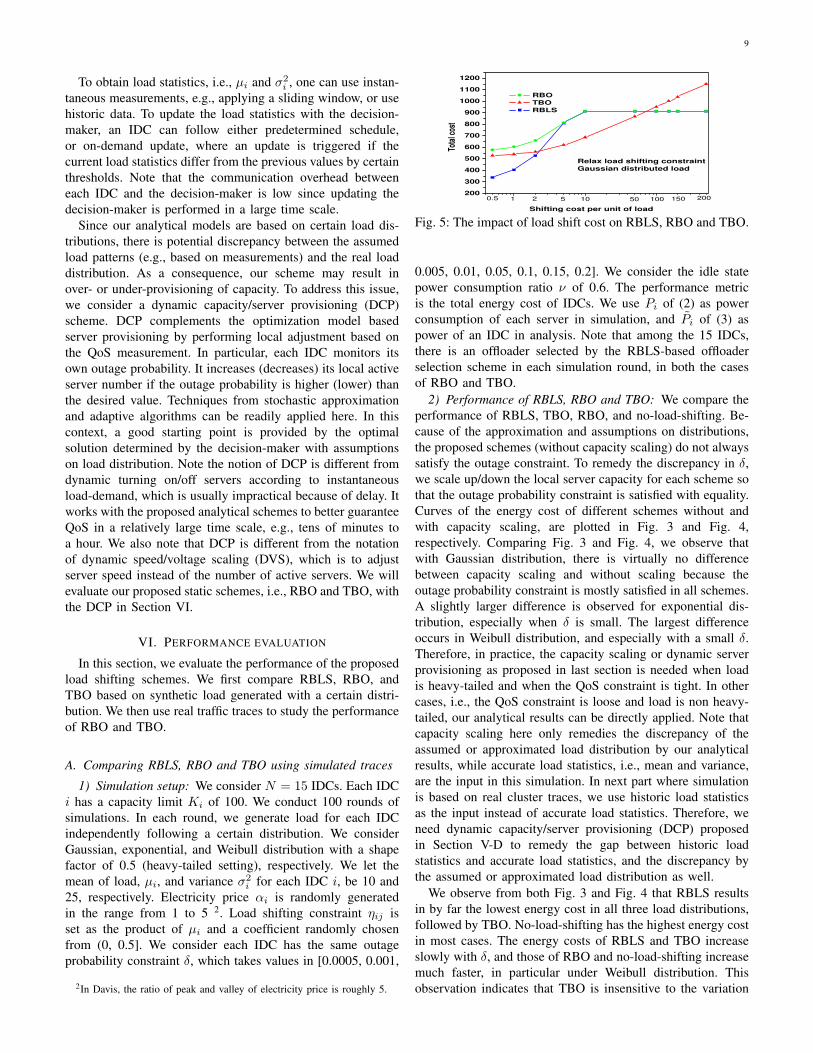
3) Impact of load shifting cost: In the paper, we do notconsider load shifting cost. We numerically evaluate the impactof load shifting cost on our proposed schemes. Similar to [35],we consider a linear load shifting cost model. We use βij todenote the load shifting cost per-unit of load from IDC i toIDC j. Thus, the total load shifting costs for RBLS, RBO,and TBO are
∑Ni=1
∑Nj=1,j =i βijrijµi,
∑Ni=2 βi1ri1µi, and∑N
i=2 βi1e−λi(ki−τi)
λi, respectively. We add the load shifting
costs to the objective functions of the optimization models ofRBLS, RBO, and TBO, respectively. We relax the load shiftingconstraints to focus on the impact of load shifting costs. Weuse the same simulation setting as in Fig. 3. We consider ahomogenous cost per unit of load for all the IDC pairs, i.e.,βij = β. We present the curves of total cost, including theenergy cost and shifting cost, with different β in Fig. 5. Weobserve that the total cost increases as β increases, as expected.When β is large, say over 10, the total costs of RBLS andRBO do not increase anymore, because it is not desirable forRBLS and RBO to shift load in the case. In this case, the gainachieved by load shifting is less than the cost incurred by it.However, for TBO, the total cost increases much slower than
11
that of RBLS and RBO when β < 10. When β is between3 or 70, the total cost of TBO is even smaller than that ofRBLS. This is an interesting finding, which is different fromFig. 3 that shows RBLS has a smaller cost than TBO. Thereason that RBLS achieves the smallest cost in the setting ofFig. 3 is it has the largest amount of load shifted among IDCs.But in terms of cost reduction achieved by per unit of loadshifted, RBLS is worse than TBO since it is a ratio-basedscheme. In other words, RBLS is less efficient in reducingenergy cost per unit of load shifted than TBO. Thus, whenthe shifting cost of per unit of load is large, i.e., 10, RBLSstops shifting load, while TBO still exploits load shifting toreduce energy cost. We also observe that the total cost of TBOis larger than RBLS and RBO when β is larger than 60 andkeeps increasing with β. This is because, when β gets larger,by TBO, each IDC i has to tune a larger ki to reduce theload shifted. The larger β, the larger ki and thus the total(energy) cost. Results of Fig. 5 indicate that when there is aload shifting cost, RBLS, RBO and TBO need to be carefullycompared. There is a threshold beyond which TBO is evenbetter than RBLS due to its efficiency in reducing energy costper unit of load. There is also a larger threshold beyond whichTBO is even worse than RBO (i.e., no-load-shifting in thiscase). Note that Fig. 5 is based on Gaussian distributed load.We have the same conclusions with other load distributions.
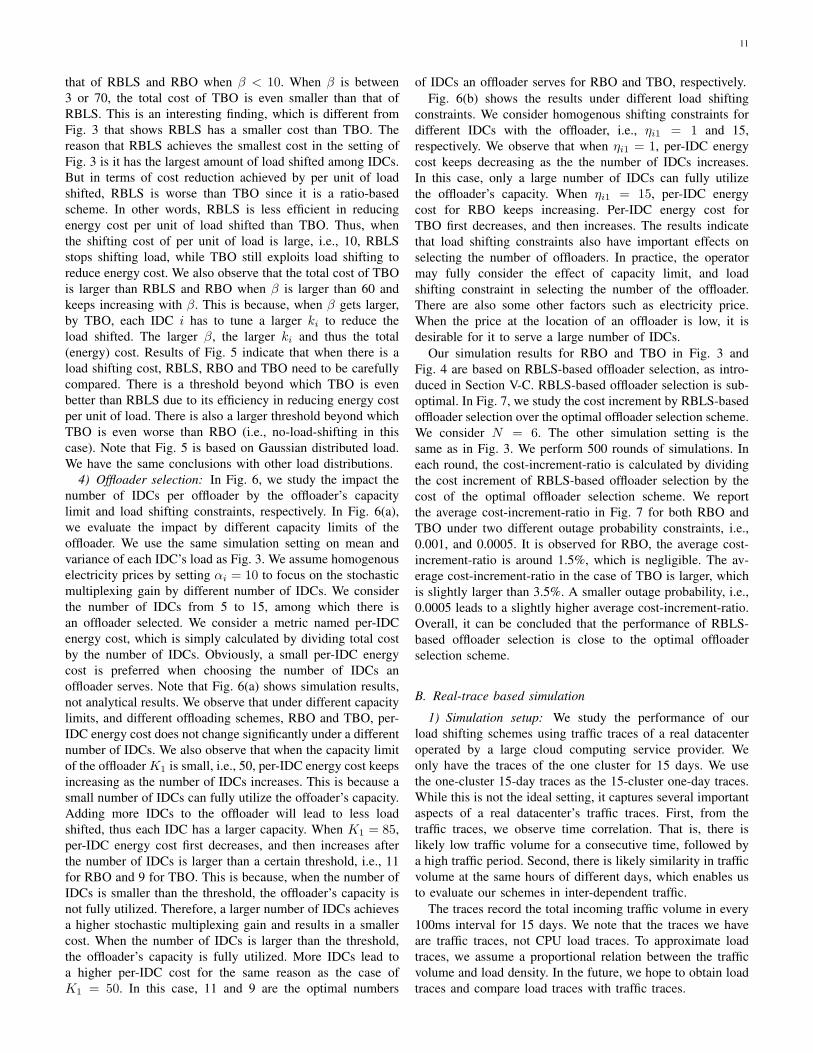
4) Offloader selection: In Fig. 6, we study the impact thenumber of IDCs per offloader by the offloader’s capacitylimit and load shifting constraints, respectively. In Fig. 6(a),we evaluate the impact by different capacity limits of theoffloader. We use the same simulation setting on mean andvariance of each IDC’s load as Fig. 3. We assume homogenouselectricity prices by setting αi = 10 to focus on the stochasticmultiplexing gain by different number of IDCs. We considerthe number of IDCs from 5 to 15, among which there isan offloader selected. We consider a metric named per-IDCenergy cost, which is simply calculated by dividing total costby the number of IDCs. Obviously, a small per-IDC energycost is preferred when choosing the number of IDCs anoffloader serves. Note that Fig. 6(a) shows simulation results,not analytical results. We observe that under different capacitylimits, and different offloading schemes, RBO and TBO, per-IDC energy cost does not change significantly under a differentnumber of IDCs. We also observe that when the capacity limitof the offloader K1 is small, i.e., 50, per-IDC energy cost keepsincreasing as the number of IDCs increases. This is because asmall number of IDCs can fully utilize the offoader’s capacity.Adding more IDCs to the offloader will lead to less loadshifted, thus each IDC has a larger capacity. When K1 = 85,per-IDC energy cost first decreases, and then increases afterthe number of IDCs is larger than a certain threshold, i.e., 11for RBO and 9 for TBO. This is because, when the number ofIDCs is smaller than the threshold, the offloader’s capacity isnot fully utilized. Therefore, a larger number of IDCs achievesa higher stochastic multiplexing gain and results in a smallercost. When the number of IDCs is larger than the threshold,the offloader’s capacity is fully utilized. More IDCs lead toa higher per-IDC cost for the same reason as the case ofK1 = 50. In this case, 11 and 9 are the optimal numbers
of IDCs an offloader serves for RBO and TBO, respectively.Fig. 6(b) shows the results under different load shifting
constraints. We consider homogenous shifting constraints fordifferent IDCs with the offloader, i.e., ηi1 = 1 and 15,respectively. We observe that when ηi1 = 1, per-IDC energycost keeps decreasing as the the number of IDCs increases.In this case, only a large number of IDCs can fully utilizethe offloader’s capacity. When ηi1 = 15, per-IDC energycost for RBO keeps increasing. Per-IDC energy cost forTBO first decreases, and then increases. The results indicatethat load shifting constraints also have important effects onselecting the number of offloaders. In practice, the operatormay fully consider the effect of capacity limit, and loadshifting constraint in selecting the number of the offloader.There are also some other factors such as electricity price.When the price at the location of an offloader is low, it isdesirable for it to serve a large number of IDCs.
Our simulation results for RBO and TBO in Fig. 3 andFig. 4 are based on RBLS-based offloader selection, as intro-duced in Section V-C. RBLS-based offloader selection is sub-optimal. In Fig. 7, we study the cost increment by RBLS-basedoffloader selection over the optimal offloader selection scheme.We consider N = 6. The other simulation setting is thesame as in Fig. 3. We perform 500 rounds of simulations. Ineach round, the cost-increment-ratio is calculated by dividingthe cost increment of RBLS-based offloader selection by thecost of the optimal offloader selection scheme. We reportthe average cost-increment-ratio in Fig. 7 for both RBO andTBO under two different outage probability constraints, i.e.,0.001, and 0.0005. It is observed for RBO, the average cost-increment-ratio is around 1.5%, which is negligible. The av-erage cost-increment-ratio in the case of TBO is larger, whichis slightly larger than 3.5%. A smaller outage probability, i.e.,0.0005 leads to a slightly higher average cost-increment-ratio.Overall, it can be concluded that the performance of RBLS-based offloader selection is close to the optimal offloaderselection scheme.
B. Real-trace based simulation
1) Simulation setup: We study the performance of ourload shifting schemes using traffic traces of a real datacenteroperated by a large cloud computing service provider. Weonly have the traces of the one cluster for 15 days. We usethe one-cluster 15-day traces as the 15-cluster one-day traces.While this is not the ideal setting, it captures several importantaspects of a real datacenter’s traffic traces. First, from thetraffic traces, we observe time correlation. That is, there islikely low traffic volume for a consecutive time, followed bya high traffic period. Second, there is likely similarity in trafficvolume at the same hours of different days, which enables usto evaluate our schemes in inter-dependent traffic.
The traces record the total incoming traffic volume in every100ms interval for 15 days. We note that the traces we haveare traffic traces, not CPU load traces. To approximate loadtraces, we assume a proportional relation between the trafficvolume and load density. In the future, we hope to obtain loadtraces and compare load traces with traffic traces.
12
0
500
1000
1500
2000
2500
3000
(a) Energy cost per second
Using historic
load statistics
Using accurate
load statistics
En
erg
y co
st p
er s
eco
nd
(ave
rag
e o
ver
the
day
tim
e h
ou
rs)
DCP-only
RBO-only
TBO-only
RBO+DCP
TBO+DCP
DCP only
0.00
0.05
0.10
0.15
0.20
(b) Average maximum outage probability
Using historic
load statistics
Using accurate
load statistics
Max
imu
m o
uta
ge
pro
bab
ility
am
on
g a
ll ID
Cs
(ave
rag
e o
ver
the
day
tim
e h
ou
rs)
DCP-only
RBO-only
TBO-only
RBO+DCP
TBO+DCP
DCP only0.00
0.02
0.04
0.06
0.08
0.10
0.12
(c) Standard deviation of maximum outage probability
Using historic
load statisticsUsing accurate
load statistics
Sta
nd
ard
de
via
tio
n o
f m
ax
imu
m o
uta
ge
pro
ba
bil
ity
ov
er
the
da
yti
me
ho
urs
DCP-only
RBO-only
TBO-only
RBO+DCP
TBO+DCP
DCP only
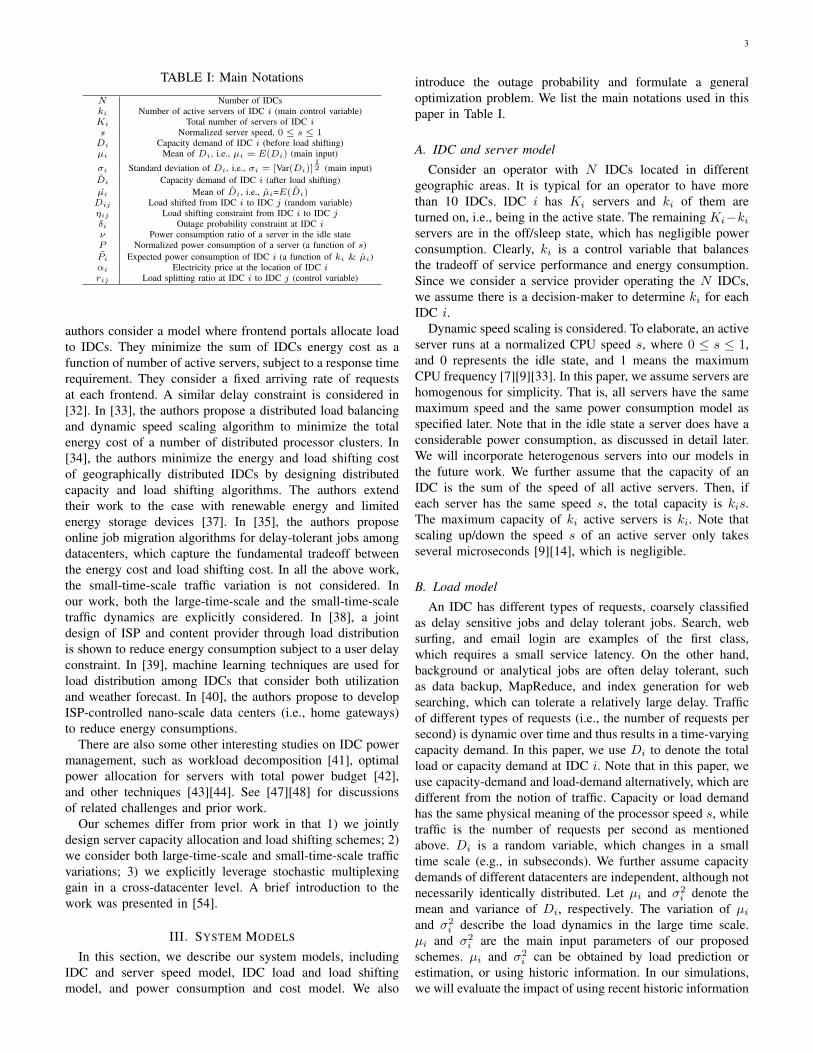
Fig. 8: Performance of RBO, TBO, RBO+TCP, TBO+DCP with the real traffic trace.Fig. 8: Performance of RBO, TBO, RBO+TCP, TBO+DCP with the real traffic trace.
Our basic observation on the traces is that the traffic doesnot change smoothly. There are many idle periods followedby a busy period with large traffic volume in each timeinterval. Thus, our static schemes of RBO and TBO may not besufficient. Thus we also combine them with the DCP schemeconsidered in Section V-D, and compare the performance ofthe combined schemes to RBO and TBO only. In DCP, eachIDC monitors load density in every interval (a 0.1 sec timegranularity) for 200 seconds and uses the total 2000 mea-surement samples to calculate the current outage probability.Each IDC then adjusts its capacity based on the ratio of recentoutage probability and QoS constraint δ. For example, if thecurrent outage probability is 2δ, we turn on 1 time moreservers, with a constraint of the total number of servers of anIDC. We assume that it takes 120 seconds for a sever to bootup. In the case of no load shifting, each IDC independentlyimplements DCP. We note that more sophisticated DCP canbe implemented, such as using regression and historical datato better estimate the outage probability and predict load. Wehope to develop better DCP schemes in the future.
Another important problem is that RBO and TBO needload statistics, i.e., µi and σi as the input. As the real traffic(assumed to be proportional to load) is not smooth, it isdifficult to obtain accurate load statistics. We use the historicload statistics as the input. In the simulation, we determinethe capacity of each IDC and load shifting parameters everyhalf an hour from 8AM to 8PM. Load statistics of the pasthalf hour is used as the input. For example, the capacityallocation by RBO and TBO at 9AM is based on the loadstatistics between 8:30AM and 9AM. Then, energy cost andoutage probability from 9AM to 9:30AM (based on thecapacity allocation at 9AM) is collected at 9:29:59:900AM(hour:minutes:seconds:milliseconds). We will also comparethe performance of using historic load statistics to that inthe ideal (not practical) setting where accurate load statisticsinformation is available (i.e., load statistics between 9AM to9:30AM in the example).
Our simulation is limited due to the data set available. Priceand load shifting constraint are set the same as in the lastsubsection. We evaluate the performance in terms of boththe energy cost and the outage probability. Energy cost isconsidered as the average value per second over the wholeday. We consider the outage probability as the maximumone among all the 15 IDCs for every half an hour. Wethen obtain the average maximum outage probability over thedaytime hours (8AM to 8PM) and the standard deviation of
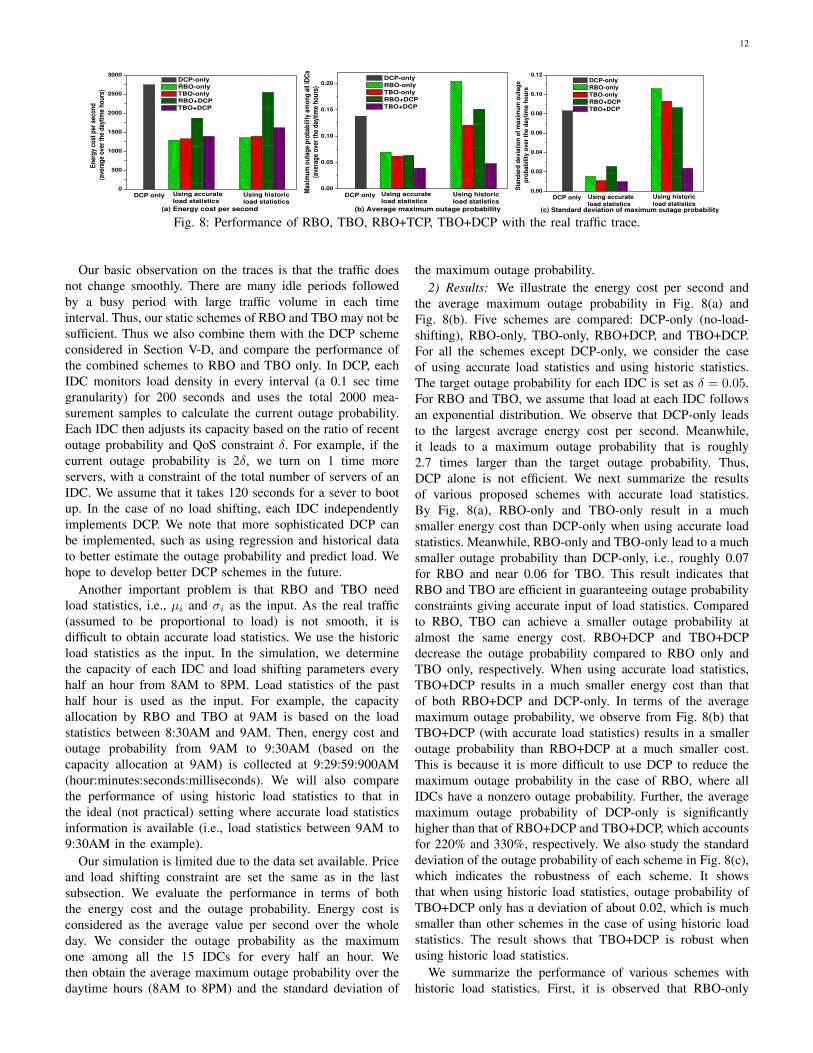
the maximum outage probability.2) Results: We illustrate the energy cost per second and
the average maximum outage probability in Fig. 8(a) andFig. 8(b). Five schemes are compared: DCP-only (no-load-shifting), RBO-only, TBO-only, RBO+DCP, and TBO+DCP.For all the schemes except DCP-only, we consider the caseof using accurate load statistics and using historic statistics.The target outage probability for each IDC is set as δ = 0.05.For RBO and TBO, we assume that load at each IDC followsan exponential distribution. We observe that DCP-only leadsto the largest average energy cost per second. Meanwhile,it leads to a maximum outage probability that is roughly2.7 times larger than the target outage probability. Thus,DCP alone is not efficient. We next summarize the resultsof various proposed schemes with accurate load statistics.By Fig. 8(a), RBO-only and TBO-only result in a muchsmaller energy cost than DCP-only when using accurate loadstatistics. Meanwhile, RBO-only and TBO-only lead to a muchsmaller outage probability than DCP-only, i.e., roughly 0.07for RBO and near 0.06 for TBO. This result indicates thatRBO and TBO are efficient in guaranteeing outage probabilityconstraints giving accurate input of load statistics. Comparedto RBO, TBO can achieve a smaller outage probability atalmost the same energy cost. RBO+DCP and TBO+DCPdecrease the outage probability compared to RBO only andTBO only, respectively. When using accurate load statistics,TBO+DCP results in a much smaller energy cost than thatof both RBO+DCP and DCP-only. In terms of the averagemaximum outage probability, we observe from Fig. 8(b) thatTBO+DCP (with accurate load statistics) results in a smalleroutage probability than RBO+DCP at a much smaller cost.This is because it is more difficult to use DCP to reduce themaximum outage probability in the case of RBO, where allIDCs have a nonzero outage probability. Further, the averagemaximum outage probability of DCP-only is significantlyhigher than that of RBO+DCP and TBO+DCP, which accountsfor 220% and 330%, respectively. We also study the standarddeviation of the outage probability of each scheme in Fig. 8(c),which indicates the robustness of each scheme. It showsthat when using historic load statistics, outage probability ofTBO+DCP only has a deviation of about 0.02, which is muchsmaller than other schemes in the case of using historic loadstatistics. The result shows that TBO+DCP is robust whenusing historic load statistics.
We summarize the performance of various schemes withhistoric load statistics. First, it is observed that RBO-only
13
has an average maximum outage probability of 0.2, whichimplies that RBO-only cannot guarantee the QoS with historicload statistics. TBO-only results in a better outage probability,which is about 0.12. But it is still larger than the targetvalue. Thus, DCP is needed for both RBO and TBO whenusing historic load statistics. We observe RBO+DCP has anaverage maximum outage probability about 0.15, which ismuch smaller than that of RBO-only but still much larger thanthe target value. This result implies that it is difficult to useDCP to reduce the maximum outage probability for RBO. ForTBO+DCP, the average maximum outage probability is almostthe same as the target value, i.e., 0.05, while the energy cost ismuch smaller than both RBO+DCP and DCP-only. Comparedto the case of using accurate load statistics, TBO+DCP leadto a larger energy cost and a larger outage probability whenusing historic load statistics. But the gaps are not significant.These results imply that DCP works well with TBO, sinceonly the offloader needs to scale up its capacity to remedy thegap between the historic load statistics and the accurate ones.
In summary, RBO- and TBO-only require accurate trafficstatistics to achieve the desired outage probability. When suchinformation has to be estimated, e.g., the past half an hourstatistics in our case, the RBO+DCP and TBO+DCP workbetter. In addition, TBO+DCP performs significantly betterthan RBO+DCP and DCP-only in both energy cost and outageprobability, in the case of estimated traffic statistics, and is thusthe most desirable scheme.
VII. DISCUSSIONS
Our proposed RBLS, RBO and TBO are model based.But they have practical implications and are efficient, as thefollowing discussions.
A. Practicality of the proposed schemes
Our schemes include three phases: 1) inputs gathering, 2)computations, and 3) executions.
The inputs of our schemes are simple. Load demand statis-tics are almost the only inputs needed in our schemes. Notethat load statistics are widely considered as the input informa-tion in existing proposed schemes, e.g., in [18][34][45]. It ispractical to estimate or predict load statistics since IDC trafficdemand is usually similar for the same hour in different days.For example, traffic of requests is usually higher in daytimethan in the night. In [17], it shows that traffic of a Microsoftdatacenter fluctuates over day and night times and has thesame patterns in the same hours during different days. Loadestimation may have errors, which may affect the efficiency ofour schemes. We will discuss the impact of estimation error innext subsection. As discussed in Section V-D, input gatheringtakes little time between each IDC and the decision-maker.
Computation of each of our schemes is simply to solve aconvex optimization problem, which incurs little time over-head. Note that the convex optimization models formulatedmake our schemes easy to implement.
Our schemes have three components: server provisioning,load shifting, and dynamic speed scaling. All of them are prac-tical techniques in datacenter operation. Server provisioning is
performed every tens of minutes, which is much larger than thelatency of turning on a server. Load shifting is also practicalin distributed IDC operation, e.g., data backup or servicerequest redirect, which incurs little transmission overhead dueto fiber connection among IDCs [33]. After instantaneous loadshifting, dynamic speed scaling is leveraged to adjust activeserver capacity. Dynamic speed scaling is widely consideredin existing literatures. It incurs negligible time overhead andcan thus be performed instantaneously in a small time scale.
Thus, different phases of our schemes are simple andpractical. We next discuss the efficiency of our proposedschemes, especially on TBO+DCP.
B. Efficiency of the proposed schemes
Our schemes, especially TBO, are efficient since they lever-age both electricity price diversity gain and load stochasticmultiplexing gain. The former one has been well exhibited byprevious literatures, e.g., up to 40% energy saving by the pio-neering work of [29], 10%-40% cost reduction by the proposeddistributed load balancing scheme in [33], Our schemes bringadditional cost reduction by exploiting stochastic multiplexinggain. As showed in Section IV, exploiting load stochasticmultiplexing gain leads to Θ(N) reduction in number of activeservers. Our extensive simulations in Section VI also indicatessignificant energy cost reduction by our proposed scheme, e.g.,TBO vs no-load-shifting.
The efficiency of our schemes is mainly discounted by thedeviation of real load statistics and distribution discrepancy.As discussed, the estimation of load statistics may haveerrors. Moreover, the assumption of load distribution, e.g.,exponential distribution in TBO, may have discrepancy fromreal load distribution. It shows that using historic load statisticscan lead to a higher energy cost and outage probability thanusing accurate load statistics, i.e. in Fig. 8(a) and Fig. 8(b).However, with DCP, our proposed TBO is shown to have aenergy cost and outage probability that is close to the case ofusing accurate load statistics, and is much better than DCPonly, i.e., near 40% energy cost reduction and 60% outageprobability decrease at the same time. DCP is efficient for TBOto address load statistics and distribution discrepancy becauseonly at the offloader needs to perform capacity adjustment.Outage probability of all other IDCs is always 0 and nocapacity adjustment is needed.
Thus, our proposed TBO is efficient given the implementa-tion of DCP or when load estimation is accurate. Moreover,our schemes are discounted by load shifting cost, which ismainly the revenue loss by extra delay as discussed in SectionIII.B. Thus the efficiency of our schemes can be improvedwhen more delay-tolerant jobs instead of delay-sensitive jobsare offloaded.
VIII. CONCLUSIONS
In this paper, our objective is to reduce energy cost ofdistributed IDCs with dynamic load-demand. We design jointcapacity allocation and load shifting schemes that minimizetotal cost under the outage probability constraint. We proposethree load shifting schemes, i.e., ratio-based load swapping,
14
ratio-based offloading, and threshold-based offloading. Weobserve that ratio-based load swapping achieves the lowestcost, because it best exploits the multiplexing gain, electricprice difference, and load balancing. For a simpler architecturewith one offloader, we observe that TBO performs well — itachieves good energy efficiency and is robust to traffic vari-ations and estimation errors. Simulations from both syntheticdata and real traffic traces demonstrate significant performanceimprovement of the proposed schemes, in particular, RBLSand TBO, over the non-load-shifting scheme. Simulations alsosuggest that DCP plays an important role in satisfying the QoSconstraint. With DCP, using recent historic load statistics asinput leads to desirable performance compared to the case withaccurate load statistics. Furthermore, load distributions affectperformance. In general, heavy-tailed distributions result inhigher energy cost. Therefore, better understanding of IDCload will improve the design of IDC operations.
IX. ACKNOWLEDGEMENTS
We thank the editor and all the reviewers for their commentsand suggestions, which significantly improved the quality ofthe paper. We also thank Professor Charles U. Martel atUniversity of California, Davis, for his help on the revisionof the paper.
REFERENCES
[1] T. Benson, A. Akella and D. Maltz, “Network Traffic Characteristics of Data Centers in the Wild,” in Proceedingsof the Internet Measurement Conference (IMC), 2010.
[2] M. Weiser, B. Welch, and A. Demers, S. Shenker, “Scheduling for Reduced CPU Energy,” in USENIX OSDI, 1994.[3] F. F Yao, A. Demers, S. Shenker, “A Scheduling Model for Reduced CPU Energy,” in IEEE FOCS, 1995.[4] J. R. Lorch and A. J. Smith, “Improving Dynamic Voltage Scaling Algorithms with PACE,” in ACM SIGMETRICS,
2001.[5] D. Grunwald, P. Levis, K. I. Farkas, C. B. Morrey III, and M. Neufeld, “Policies for Dynamic Clock Scheduling,”
in USENIX Symposium on Operating Systems Design and Implementation (OSDI), 2000.[6] Y. Zhu and F. Mueller, “Feedback EDF Scheduling of Real-time Tasks Exploiting Dynamic Voltage Scaling,” in
Real-Time Systems Journal, Vol. 31, No. 1-3, pages 33-63, Dec 2005.[7] N. Bansal, K. Pruhs, and C. Steins, “Speed Scaling for Weighted Flow times,” in ACM-SIAM SODA, 2007.[8] N. Bansal, T. Kimbrel, and K. Pruhs, “Speed scaling to manage energy and temperature,” in Journal of the ACM,
Volume 54, Issue 1, March 2007.[9] A. Wierman, L. L. H. Andrew, and A. Tang, “Power-Aware Speed Scaling in Processor Sharing Systems,” in IEEE
INFOCOM, 2009.[10] T. Horvath, T. Abdelzaher, K. Skadron, and X. Liu., “Dynamic Voltage Scaling in Multitier Web Servers with
End-to-End Delay Control,” in IEEE Transactions on Computers, Volume 56 , Issue 4, April 2007.[11] L. L. H. Andrew, M. Lin, and A. Wierman, “Optimality, fairness, and robustness in speed scaling designs,” in ACM
SIGMETRICS, 2010.[12] C. Lim and A Tang, “Dynamic Speed Scaling and Load Balancing of Interconnected Queues,” in ITA Workshop,
2011.[13] L. Chen, N. Li, and S. H. Low, “On the Interaction between Load Balancing and Speed Scaling,” ITA Workshop,
2011.[14] O. S. Unsal and I. Koren, “System-level power aware design techniques in real-time system,” in Proc. of IEEE,
vol. 91, no. 7, 2003.[15] J. S. Chase, D. C. Anderson, P. N. Thakar, and A. M. Vahdat, “Managing energy and server resources in hosting
centers,” in ACM SOSP, 2001.[16] Y. Y. Chen, et al., “Managing Server Energy and Operational Costs in Hosting Centers,” in ACMSIGMETRICS,
2005.[17] G. Chen, W. He, J. Liu, S. Nath, L. Rigas, L. Xiao, and F. Zhao, “Energy-Aware Server Provisioning and Load
Dispatching for Connection-Intensive Internet Services,” in USENIX NSDI, 2008.[18] M. Lin, A. Wierman, L. L.H. Andrew, and E. Thereska, “Dynamic right-sizing for power-proportional data centers,”
in IEEE INFOCOM, 2011.[19] R. Urgaonkar, U. C. Kozat, K. Igarashi, M. J. Neely, “Dynamic Resource Allocation and Power Management in
Virtualized Data Centers,” in IEEE NOMS 2010.[20] R. Urgaonkar, B. Urgaonkar, M. J. Neely, A. Sivasubramaniam, “Optimal Power Cost Management Using Stored
Energy in Data Centers,” in ACM SIGMETRICS, 2011.[21] C. Lim and A Tang, “Dynamic Speed Scaling and Load Balancing of Interconnected Queues,” in ITA Workshop,
2011.[22] H. Lim, A. Kansal, and J. Liu, “Power Budgeting for Virtualized Data Centers,” in USENIX ATC, 2011.[23] Q. Zhu, Z. Chen, L. Tan, Y. Zhou, K. Keeton, and J. Wikes, “Hibernator: Helping Disk Arrays Sleep through the
Winter,” in ACM SOSP, 2005.[24] J. Torres, D. Carrera, K. Hogan, R. Gavald, V. Beltran, and N. Poggi, “Reducing Wasted Resources to Help Achieve
Green Data Centers,” in IEEE IPDPS, 2008.[25] R. Nathuji and K. Schwan, “VirtualPower: Coordinated Power Management in Virtualized Enterprise Systems,” in
ACM SOSP, 2007.[26] S. Srikantaiah, A. Kansal, and F. Zhao, “Energy Aware Consolidation for Cloud Computing,” in USENIX HotPower,
2008.[27] X. Meng, C. Isci, J. Kephart, L. Zhang, E. Bouillet, and D. Pendarakis, “Efficient resource provisioning in compute
clouds via VM multiplexing,” in ICAC, 2010.[28] M. Wang, X. Meng, and L. Zhang, “Consolidating Virtual Machines with Dynamic Bandwidth Demand in Data
Centers,” in IEEE INFOCOM, 2011.[29] A. Qureshi, R. Weber, H. Balakrishnan, J. Guttag, and B. Maggs, “Cutting the Electric Bill for Internet-Scale
Systems,” in ACM SIGCOMM, 2009.[30] L. Rao, X. Liu, L, Xie, and W. Liu., “Minimizing Electricity Cost: Optimization of Distributed Internet Data
Centers in a Multi-Electricity-Market Environment,” in IEEE INFOCOM, 2010.[31] L. Rao, X. Liu, M. Ilic, and J. Liu, “MEC-IDC: Joint Load Balancing and Power Control for Distributed Internet
Data Centers,” in the First ACM/IEEE International Conference on Cyber-Physical Systems (ICCPS), 2010.[32] A. Narayan S, S. Sharangi, A. Fedorova, “Global Cost Diversity Aware Dispatch Algorithm for Heterogeneous
Data Centers,” in ICPE, 2011.[33] R. Stanojevic and R. Shorten, “Distributed dynamic speed scaling,” in IEEE INFOCOM, 2010.
[34] Z. Liu, M. Lin, A. Wierman, S. Low, and L. L.H. Andrew, “Greening geographical load balancing,” in ACMSIGMETRICS, 2011.
[35] N. Buchbinder, N. Jain, and I. Menache, “Online Job-Migration for Reducing the Electricity Bill in the Cloud,” inIFIP NETWORKING, 2011.
[36] K. Le, R. Bianchiniy, M. Martonosiz, and T. D. Nguyeny, “Cost- and Energy-Aware Load Distribution Across DataCenters,” in USENIX HotPower, 2009.
[37] Z. Liu, M. Lin, A. Wierman, S. Low, and L. L.H. Andrew, “Geographical load balancing with renewables,” inGreenMetrics, 2011.
[38] L. Chiaraviglio and I. Matta, “reenCoop: cooperative green routing with energy-efficient servers,” in the 1stInternational Conference on Energy-Efficient Computing and Networking (e-Energy), 2010.
[39] K. Schroder, D. Schlitt, M. Hoyer, and W. Nebel, “Power and cost aware distributed load management,” in the 1stInternational Conference on Energy-Efficient Computing and Networking (e-Energy), 2010.
[40] V. Valancius, N. Laoutaris, L. Massouli, C. Diot, and P. Rodriguez, “Greening the internet with nano data centers,”in the 5th international conference on Emerging networking experiments and technologies (CoNext ), 2009.
[41] L. Lu and P. Varman, “Workload Decomposition for Power Efficient Storage Systems,” in USENIX HotPower,2008.
[42] A. Gandhi, M. Harchol-Balter, R. Das, and C. Lefurgy, “Optimal Power Allocation in Server Farms,” in ACMSIGMETRICS, 2009.
[43] C. Stewart and K. Shen, “Some Joules Are More Precious Than Others: Managing Renewable Energy in theDatacenter,” in USENIX HotPower, 2009.
[44] X. Fan, W. D. Weber, and L. A. Barroso, “Power Provisioning for a Warehouse-sized Computer,” in ISCA, 2007.[45] D. Niu, C. Feng, B. Li, “Pricing Cloud Bandwidth Reservations under Demand Uncertainty,” in ACM SIGMETRICS,
2012.[46] Windows Azure Platform, http://www.azure.com[47] J. Liu, F. Zhao, X. Liu, and W. He, “Challenges Towards Elastic Power Management in Internet Data Centers,” in
the 29th IEEE International Conference on Distributed Computing Systems Workshops (ICDCSW), 2009.[48] James Hamilton, “Where Does the Power Go in High-Scale Data Centers,” http://www.mvdirona.com/jrh/work/.[49] Z. Zhang, M. Zhang, A. Greenberg, Y. C. Hu, R. Mahajan, and B. Christian, “Optimizing Cost and Performance
in Online Service Provider Networks,” in USENIX NSDI, 2010.[50] S. Pelley, D. Meisner, T. F. Wenisch, and J. W. VanGilder, “Understanding and Abstracting Total Data Center
Power,” in ISCA 2009: Workshop on Energy Efficient Design (WEED)[51] N. Rasmussen, “Electrical Efficiency Modeling for Data Centers,” White paper No. 113.[52] A. Greenberg, J. R. Hamilton, N. Jain, S. Kandula, C. Kim, P. Lahiri, D. A. Maltz, P. Patel, and Sudipta Sengupta,
“VL2: A Scalable and Flexible Data Center Network,” in ACM SIGCOMM, 2009.[53] S. Boyd and L. Vandenberghe, “Convex Optimization,” Cambridge University Press.[54] D. Xu, X. Liu, and B. Fan, “Minimizing Energy Cost for Internet-scale Datacenters with Dynamic Traffic,” in
Poster session of IEEE IWQOS, 2011.
PLACEPHOTOHERE
Dan Xu received his Ph.D. degree in ComputerScience from University of California, Davis, in2011. He is currently a Senior Member of TechnicalStaff at AT&T Labs, San Ramon. His research inter-ests are in the areas of network resource allocationoptimization, specifically in data center networks,and cognitive radio networks.
PLACEPHOTOHERE
Xin Liu received the PhD degree in electrical en-gineering from Purdue University in 2002. She iscurrently an associate professor in the ComputerScience Department at the University of California,Davis. Her research is on wireless communicationnetworks. She received the Best Paper of Year Awardfrom the Computer Networks Journal in 2003. Shereceived the US National Science Foundation CA-REER Award in 2005. She received the OutstandingEngineering Junior Faculty Award from the Collegeof Engineering, UC Davis, in 2005. She has been a
Chancellor’s Fellow since 2011.
PLACEPHOTOHERE
Bin Fan is currently a Ph.D. student at ComputerScience Department in Carnegie Mellon University.His research interests are in computer networks anddistributed systems. Before coming to CMU, He wasa M.Phil. student (2004-2006) and then a researchassistant (2006-2007) in the Chinese University ofHong Kong. He received a bachelors degree inComputer Science from the University of Scienceand Technology of China(USTC) in 2004


![Decentralized Computation Offloading Game For Mobile Cloud ... · arXiv:1404.3200v5 [cs.NI] 26 Mar 2015 Decentralized Computation Offloading Game For Mobile Cloud Computing Xu Chen,](https://img.pdfslide.us/doc/110x75/5af9ea727f8b9a32348d013c/decentralized-computation-ofoading-game-for-mobile-cloud-14043200v5-csni.jpg)