Embed Size (px)
Citation preview

UNIFIED MODELLING LANGUAGE (UML) An Overview of Diagram Types used in the Standard Object Modeling Language UML 2.0

What is UML?
• Standard general-‐purpose modeling language designed for OO soFware engineering
• Used to create visual models of object-‐oriented soFware-‐intensive systems
• Developed by the Object Management Group (OMG) and added to official technologies in 1997
• It fuses mulOple methodologies into one common modeling language

Prior to UML:
Several popular techniques: – The Booch method (Booch, 1993) – The Object-‐Modeling Technique (OMT) (Rumbaugh et al, 1991)
– Object-‐Oriented SoFware Engineering (OOSE) (Jacobson, 1992)
– “The Three Amigos” led an internaOonal consorOum, UML Partners, in development of UML 1.1 (November 1997)

UML 1.x
• The best ideas from the Three Amigos and the internaOonal consorOum were combined into one standardized form
• Concepts from other OO methodologies were also incorporated to create a broad set of modeling methods and graphical tools
• UML is an internaOonal standard ISO/IEC19501:2005
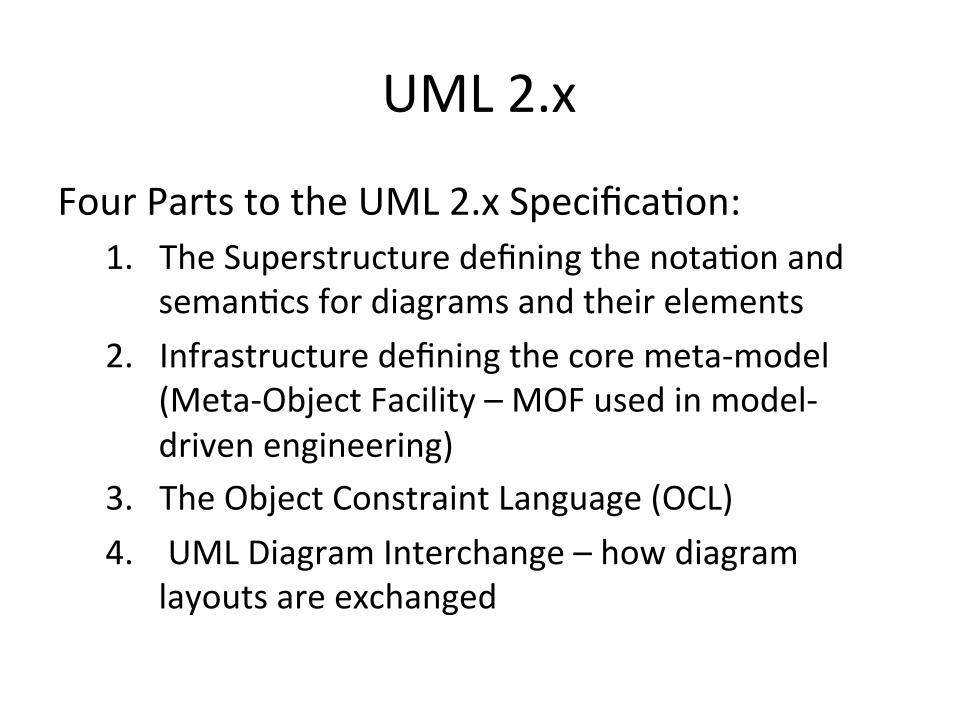
UML 2.x
Four Parts to the UML 2.x SpecificaOon: 1. The Superstructure defining the notaOon and
semanOcs for diagrams and their elements 2. Infrastructure defining the core meta-‐model
(Meta-‐Object Facility – MOF used in model-‐driven engineering)
3. The Object Constraint Language (OCL) 4. UML Diagram Interchange – how diagram
layouts are exchanged

Diagram Types
• There are 13 official diagram types • Two Conceptual Views: – Structural (staOc): descripOon of system architecture underlying the design
– Behavioral (dynamic): descripOon of how the pieces of the system interact with each other
• Most Commonly Used – The Class Diagram (staOc/structural) – The Sequence Diagram (dynamic/behavioral)

Diagram Types

Class Diagram (structural)
Describes the types of objects in a system and the relaOonships
between them

Class Diagram
• Most common diagram with the widest range of variaOon from simple to complex
• It can be used as simple high level overview to a detailed definiOon including afributes/methods
• Because we have already covered this in lecture, I am only going to provide a summary of notaOon
• Much of the class notaOon is used in other diagram types


Package Diagram (structural)
Structural overview of how the components of a system are
organized into higher-‐level units

Package Diagrams
• Allows you to group any set of UML components into higher-‐level units
• Most commonly used to show how classes are organized into packages
• Hierarchical structure allows packages to be broken down into sub-‐packages and classes
• They are denoted using “::” to separate levels of the hierarchy (e.g. java::uOl::Date

Package NotaOon

Package Diagrams • Primarily used to show packages and their dependencies
• Ideally, this package dependency diagram is generated by the system itself so that you can view an accurate representaOon of dependencies
• Good package structure has a clear flow of dependencies
• Circular dependencies are not recommended and should be minimized
• The more dependencies coming into a package, the more stable the package interface should be

Package Diagram

Composite Structure Diagram (structural)
Allows complex objects to be broken down into run-‐Ome groupings

Composite Structures
• New feature for UML 2.0 • Allows you to take a complex object and break it into parts
• The difference between packages and composite structures – Packages are compile Ome groupings – Composite structures are run-‐Ome groupings
• This feature is new and so there isn’t much informaOon yet about how useful this is

Composite Structure Example
This example shows run-‐Ome components of a classic Fibonacci sequence:

Component Diagram (structural)
Diagram showing the structural relaOonships between the logical
components of a system

Component Diagrams • Main purpose is to show structural relaOonships between logical components of a system
• It has more to do with analyzing customer expectaOons & markeOng decisions than the actual technology
• Customers oFen want to purchase or upgrade logical enOOes in a system separately
• Component: a logical unit connected through implemented and required interfaces
• They are integrated into the standard structure of the class diagram and oFen uOlize notaOon from composite structure diagrams

Do Components Exist? This quote sums up confusion among technologists about what components are and suggests how component diagrams are used as part of the design: Components are not a technology. Technology people seem to find this hard to understand. Components are about how customers want to relate to so9ware. They want to be able to buy their so9ware a piece at a :me, and to be able to upgrade it just like they can upgrade their stereo. They want new pieces to work seamlessly with their old pieces, and to be able to upgrade on their own schedule, not the manufacturer’s schedule. They want to be able to mix and match pieces from various manufacturers. This is a very reasonable requirement. It is just hard to sa:sfy. Ralph Johnson hfp://www.cs.com/cgi/wiki?DoComponentsExist

Component NotaOon/Example

Deployment Diagram (structural)
Shows the physical layout of the hardware and soFware in a running
system

Deployment Diagrams
• It contains nodes connected by communicaOon paths
• Nodes are either specific hardware or execuOon environments that host the soFware
• ArOfacts contained on nodes include: executables, libraries, data files, configuraOon files, HTML Documents…
• Including an arOfact in the node indicates that it is part of the deployment in a working system

Deployment Diagram

Object Diagram (structural)
Diagram showing an overview of objects at a parOcular point in Ome – it is an example instanOaOon derived
from the class diagram

Object Diagram
• Commonly referred to as an “instance diagram”
• Useful to show sample configuraOons of objects in the working system and clarifying the class diagram
• Uses instance notaOon: Instance name : class name

Object Diagram

Sequence Diagram (behavioral)
A graphical descripOon of the main success scenario described in the use
cases for the system

Sequence Diagram • Captures how objects interact with one another in a parOcular system scenario
• InteracOons are shown along a lifeline that runs verOcally from top to bofom
• It shows the instanOaOon of objects used in the scenario and the messages that are exchanged between them
• CreaOon of the object is indicated with an arrow along the Omeline poinOng to the box
• DeleOon is indicated by an “X” crossbar when the object gets deleted

Overview of Basic NotaOon

When to Use Sequence Diagrams
• Useful for looking at how objects interact in a single scenario
• It provides a broad picture of interacOons, but does not provide detailed definiOon of specific behavior within the interacOon
• If you want to look at details of complex behavior or interacOons across mulOple scenarios, sequence diagrams will NOT work well.

Use Case Diagram (behavioral)
A graphical descripOon of the main success scenario described in the use
cases for the system

What is a Use Case? • Use cases depict a set of scenarios organized around a common user goal
• Scenario: a sequence of steps describing an interacOon between the user and the system
• Each step in the use case is a simple statement that clearly defines who is carrying out the step
• There can be mulOple actors parOcipaOng in a single use case (human or technological)
• Too lifle informaOon is preferable to too much detail • Overly detailed use cases don’t get read whereas simple use cases & use case diagrams are useful for discussion

Example Use Case
Content: Submit Work Report Goal Level: Sea Level Main Success Scenario: 1. Create a new account (if new volunteer) 2. Login 3. Create Report
1. Enter detail fields 2. Upload photo (opOonal)
4. Submit Report 5. Forward Copy to Team mates
Extensions: 1a: Review and consent to volunteer agreement
Descrip<on: • Title • Detail Level • High level steps in common success
scenario • Lower level detail worth noOng

What is a Use Case Diagram?
• A graphical representaOon of the main success scenario(s)
• It acts as a table of contents for the use case set or a high level picture of the individual use case
• A. Cockburn: WriOng EffecOve Use Cases (2001) suggests scheme for defining level of use cases: – Sea Level: Primary High Level Overview Level – Fish Level: Detailed definiOon below Sea Level – Kite Level: How use cases fit into broader business level interacOons

Example Use Case Diagram
• Three actors – 2 human – 1 system

State Machine Diagram (behavioral)
In OO state machine diagrams are used for a single class to show the lifeOme behavior of an object
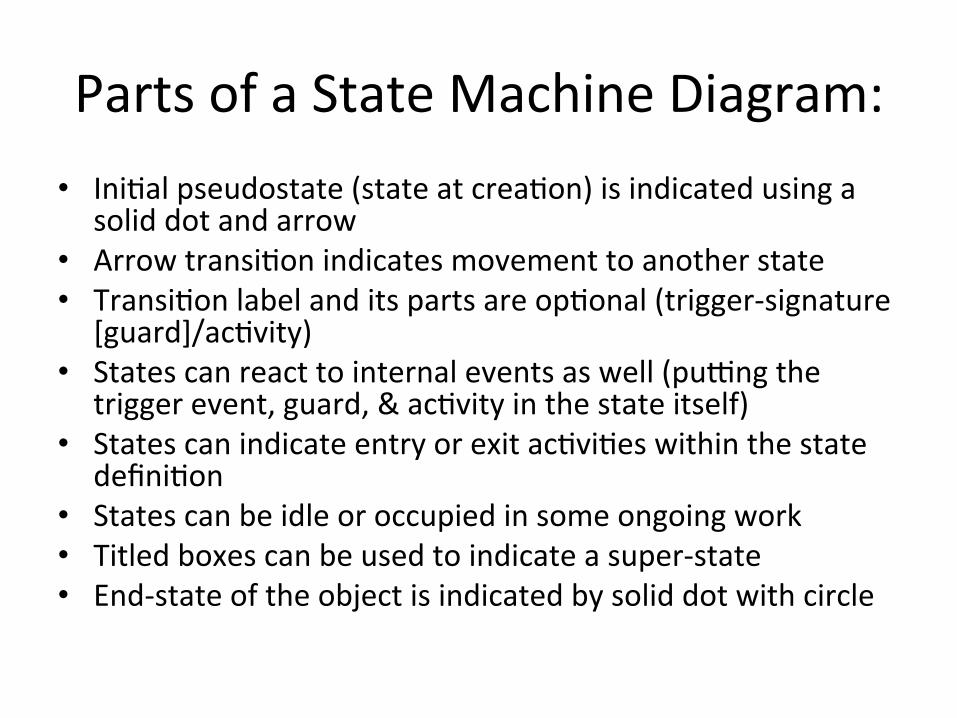
Parts of a State Machine Diagram: • IniOal pseudostate (state at creaOon) is indicated using a
solid dot and arrow • Arrow transiOon indicates movement to another state • TransiOon label and its parts are opOonal (trigger-‐signature
[guard]/acOvity) • States can react to internal events as well (purng the
trigger event, guard, & acOvity in the state itself) • States can indicate entry or exit acOviOes within the state
definiOon • States can be idle or occupied in some ongoing work • Titled boxes can be used to indicate a super-‐state • End-‐state of the object is indicated by solid dot with circle

Example State Diagram

Example with Super-‐state
Enrollment: Super-‐state definiOon

When to Use State Diagrams
• Useful for describing the behavior or an object across several use cases
• It is useful for showing the lifecycle of an individual object
• It is NOT useful for describing objects that collaborate with one another
• It can be combined with interacOon and acOvity diagrams to provide useful detail

AcOvity Diagram(behavioral)
Used to describe procedural logic, business process, and work flow. They are parOcularly useful for documenOng
parallel behavior
AcOvity Diagram -‐ Overview
• Significantly extended and modified between UML 1.x and UML 2.x
• In UML 1.x they were posiOoned as a special case of a state diagram, In UML 2.0 this disOncOon was removed
• It is parOcularly useful for documenOng concurrent algorithms and parallel processing
• They aren’t used much, but may be parOcularly useful where there are instances of parallel processing
• They are someOmes used to document use cases, but they may not be the best way to communicate with domain experts

AcOvity Diagram – Components
• AcOon: each box in acOvity diagram represents an acOon
• IniOal node: indicated with the dot/arrow notaOon of state diagrams
• Fork: one incoming flow and several outgoing flows • Join: used to synchronize flow when parallel acOons are complete
• Decision: condiOonal behavior delineated by the decision
• Merge: marks the end of the condiOonal behavior

Example AcOvity Diagram

Par<<ons (Swim Lanes) ParOOons can be used to show the distribuOons of acOviOes across mulOple actors The can be a lifle more difficult to read, but useful if the purpose of the diagram is to show who specifically does what acOon

AddiOonal features
• Hourglass symbol can be used to indicate Oming elements such as dates or Omers
• Send Signals (e.g. exit robot)
• AcOviOes can be broken down into sub-‐acOviOes using box notaOon (e.g. ShudownRobot)

InteracOon Overview Diagram (behavioral/interacOon) A merging of acOvity diagrams and
sequence diagrams AcOvity boxes replaced by sequence diagrams where more detail is needed

Example of InteracOon Overview:

CommunicaOon Diagram (behavioral/interacOon)
Emphasizes the data links between parOcipants in a parOcular
interacOon

CommunicaOon Diagram • Similar to sequence diagrams without lifeline and sequence of messages
• CommunicaOon diagrams use simple line notaOon and numbering scheme to show sequence
• Transient links can be noted using <<local>>, <<parameter>> and <<global>> (not in UML2, but sOll in common usage)
• Most people prefer sequence diagrams, but useful for simple white-‐board discussion or when you want to focus on links

Example CommunicaOon Diagram

Timing Diagram (behavioral/interacOon)
Diagram focusing on Oming constraints for one or a group of
related objects

Example Timing Diagram
Crossed lines indicate a change of state Timing diagrams are not commonly used

AddiOonal Resources for UML and Object-‐Oriented Design:
Fowler, M. UML DisOlled (Third EdiOon, 2004) – good overview of UML language Larman, C. Applying UML and Paferns (2d ed 2001) Rumbaugh, J., Jacobson, I. and G. Booch The Unified Modeling Language Reference Manual (1999) Dennis, A., Wixon, B. H., and D. Tegarden System Analysis Design: UML Version 2.0 An Object Oriented Approach (2009)


![UML1 EER vs. UML Terminology EER Diagram Entity Type Entity Attribute Domain Composite Attribute ~ [Derived Attribute] Relationship Type Relationship Instance](https://img.pdfslide.us/doc/110x75/56649dba5503460f94aaa962/uml1-eer-vs-uml-terminology-eer-diagram-entity-type-entity-attribute-domain.jpg)