Embed Size (px)
Citation preview

Page 1 of 20
<<< UML Diagram >>>
The UML specification doesn't say where these diagrams should be used in any particular methodology – we're free to use whichever we think is appropriate at any stage.
� Use case diagrams categorize the ways in which a system is used.
� Class diagrams show classes and how they can be fitted together (they can also show objects).
� Object diagrams show only objects and how they can be fitted together.
� Activity diagrams show activity by humans or objects in a similar way to a flow chart.
� State machine diagrams show the various states of any object with an interesting or complicated life cycle.
� Communication diagrams show the messages sent between objects in some scenario.
� Sequence diagrams show similar information to communication diagrams, but emphasizing sequences rather than connections.
� Package diagrams show how related classes are grouped together, for the benefit of developers.
� Deployment diagrams show machines, processes and deployed artifacts for a finished system.
� Component diagrams show reusable components (objects or subsystems) and their interfaces.
� Interaction overview diagrams show individual steps of an activity using sequence diagrams.
� Timing diagrams show precise timing constraints for messages and object states.
� Composite structure diagrams show how objects fit together in an aggregation or composition, showing interfaces and collaborating objects.

Page 2 of 20
Structure diagrams emphasize what things must be in the system being modeled:
• Class diagram
• Component diagram
• Composite structure diagram (added in UML 2.x)
• Deployment diagram
• Object diagram • Package diagram
Behavior diagrams emphasize what must happen in the system being modeled:
• Activity diagram
• State Machine diagram
• Use case diagram
Interaction diagrams, a subset of behavior diagrams, emphasize the flow of control and data among the things in the system being modeled:
• Communication diagram
• Interaction overview diagram (added in UML 2.x)
• Sequence diagram
• Timing Diagram (added in UML 2.x)
1. Structure Diagrams: Emphasize what things must be in the system being modeled:
1.1. Class Diagram
Class diagram is a type of static structure diagram that describes the structure of a
system by showing the system's classes, their attributes, and the relationships
between the classes.
In some UML documents the class diagram is divided in two different diagrams as follow:
- Analysis Level Class diagram: In this level ONLY the classes with their relations will be explained. See below for detail:

Page 3 of 20
- Design Level Class diagram: In this level the relation between classes, class properties and class methods will be explained. See below for detail:
Relationships
A relationship is a general term covering the specific types of logical connections found on class and objects diagrams. UML shows the following relationships:
Instance-Level Relationships
Link
A Link is the basic relationship among objects. It is represented as a line
connecting two or more object boxes. It can be shown on an object diagram or
class diagram. A link is an instance of an association.
Association
Class diagram example of association between two classes
An Association represents a family of links. Binary associations (with two ends) are
normally represented as a line, with each end connected to a class box. Higher
order associations can be drawn with more than two ends. In such cases, the ends
are connected to a central diamond.
An association can be named, and the ends of an association can be adorned with
role names, ownership indicators, multiplicity, visibility, and other properties. There
are five different types of association. Bi-directional and uni-directional associations

Page 4 of 20
are the most common ones. For instance, a flight class is associated with a plane class bi-directionally. Associations can only be shown on class diagrams.
Example: "department offers courses", is an association relationship.
Aggregation {Author: Subhash}
Class diagram showing Aggregation between two classes
Aggregation is a variant of the "has a" or association relationship; aggregation is
more specific than association. As a type of association, an aggregation can be
named and have the same adornments that an association can. However, an aggregation may not involve more than two classes.
Aggregation can occur when a class is a collection or container of other classes, but
where the contained classes do not have a strong life cycle dependency on the
container--essentially, if the container is destroyed, its contents are not.
In UML, it is graphically represented as a clear diamond shape on the containing
class end of the tree of lines that connect contained class(es) to the containing class.
Composition
Composition is a stronger variant of the "has a" or association relationship;
composition is more specific than aggregation. It is represented with solid diamond shape.
Composition has a strong life cycle dependency between instances of the container
class and instances of the contained class(es): If the container is destroyed, every instance that it contains is destroyed as well.
The UML graphical representation of a composition relationship is a filled diamond
shape on the containing class end of the tree of lines that connect contained class(es) to the containing class.
Page 5 of 20
Differences between Composition and Aggregation
The whole of a composition must have a multiplicity of 0..1 or 1, indicating that a
part must be for only one whole. The whole of an aggregation may have any multiplicity.
When attempting to represent real-world whole-part relationships, e.g., an engine
is part of a car, the composition relationship is most appropriate. However, when
representing a software or database relationship, e.g., car model engine ENG01 is
part of a car model CM01, an aggregation relationship is best, as the engine,
ENG01 may be also part of a different car model, CM02. This is often called a
"catalog" relationship
1.2. Component Diagram
Component diagrams are particularly useful with larger teams. Your initial
architectural modeling efforts during cycle 0 should focus on identifying the initial
architectural landscape for your system. UML component diagrams are great for
doing this as they enable you to model the high-level software components, and
more importantly the interfaces to those components. Once the interfaces are
defined, and agreed to by your team, it makes it much easier to organize the
development effort between sub-teams. You will discover the need to evolve the
interfaces to reflect new requirements or changes to your design as your project
progresses, changes that need to be negotiated between the sub-teams and then implemented appropriately.
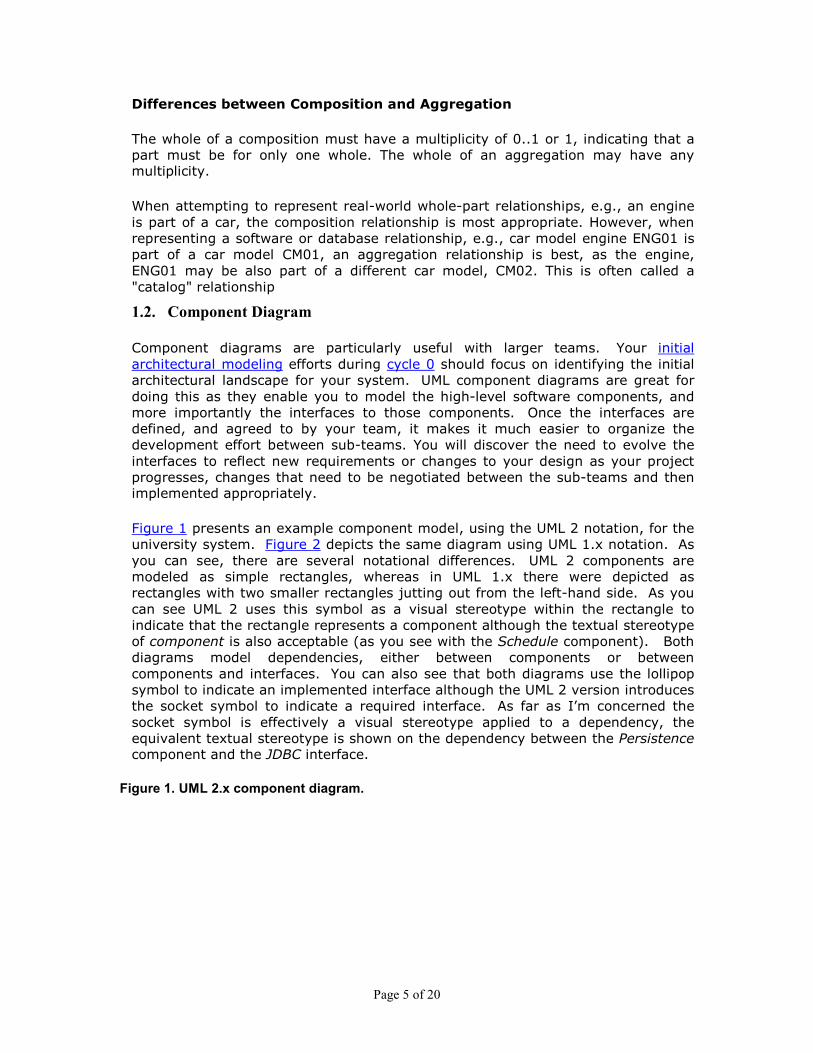
Figure 1 presents an example component model, using the UML 2 notation, for the
university system. Figure 2 depicts the same diagram using UML 1.x notation. As
you can see, there are several notational differences. UML 2 components are
modeled as simple rectangles, whereas in UML 1.x there were depicted as
rectangles with two smaller rectangles jutting out from the left-hand side. As you
can see UML 2 uses this symbol as a visual stereotype within the rectangle to
indicate that the rectangle represents a component although the textual stereotype
of component is also acceptable (as you see with the Schedule component). Both
diagrams model dependencies, either between components or between
components and interfaces. You can also see that both diagrams use the lollipop
symbol to indicate an implemented interface although the UML 2 version introduces
the socket symbol to indicate a required interface. As far as I’m concerned the
socket symbol is effectively a visual stereotype applied to a dependency, the
equivalent textual stereotype is shown on the dependency between the Persistence component and the JDBC interface.
Figure 1. UML 2.x component diagram.

Page 6 of 20
Figure 2. UML 1.x component diagram.
1.3. Composite Structure Diagram
1.4. Deployment Diagram
In the Unified Modeling Language, a deployment diagram serves to model the
hardware used in system implementations, the components deployed on the
hardware, and the associations between those components. The elements used in
deployment diagrams are nodes (shown as a cube), components (shown as a
rectangular box, with two rectangles protruding from the left side) and
associations.

Page 7 of 20
In UML 2.0 components are not placed in nodes. Instead artifacts and nodes are
placed in nodes. An artifact is something like a file, program, library, or data base
constructed or modified in a project. These artifacts implement collections of
components. The inner nodes indicate execution environments rather than
hardware. Examples of execution environments include language interpreters, operating systems, and servlet / EJB containers.
Workstation
Web Server
Database Server
Web browser
User
Keyboard/
Monitor
HTTP/HTTPS connection
Presentation Layer (Web Interface)
Log fileDatabase Interface
DB
Deployment Diagram
1.5. Object Diagram
An object diagram is a diagram that shows a complete or partial view of the
structure of a modeled system at a specific time. This snapshot focuses on some
particular set of object instances and attributes, and the links between the
instances. A correlated set of object diagrams provides insight into how an
arbitrary view of a system is expected to evolve over time. Object diagrams are
more concrete than class diagrams, and are often used to provide examples, or act
as test cases for the class diagrams. Only those aspects of a model that are of current interest need be shown on an object diagram

Page 8 of 20
1.6. Package Diagram
A package diagram depicts how a system is split up into logical groupings by
showing the dependencies among these groupings. As a package is typically
thought of as a directory, package diagrams provide a logical hierarchical
decomposition of a system.
Packages are usually organized to maximize internal coherence within each
package and to minimize external coupling among packages. With these guidelines
in place, the packages are good management elements. Each package can be
assigned to an individual or team, and the dependencies among them indicate the required development order
2. Behavior Diagrams: Emphasize what must happen in the system being modeled
2.1. Activity Diagram

Page 9 of 20
In the Unified Modeling Language, an activity diagram represents the business
and operational step-by-step workflows of components in a system. An activity
diagram shows the overall flow of control.
In SysML the activity diagram has been extended to indicate flows among steps
that convey physical element (e.g., gasoline) or energy (e.g., torque, pressure).
Additional changes allow the diagram to better support continuous behaviors and continuous data flows.
2.2. State Machine Diagram
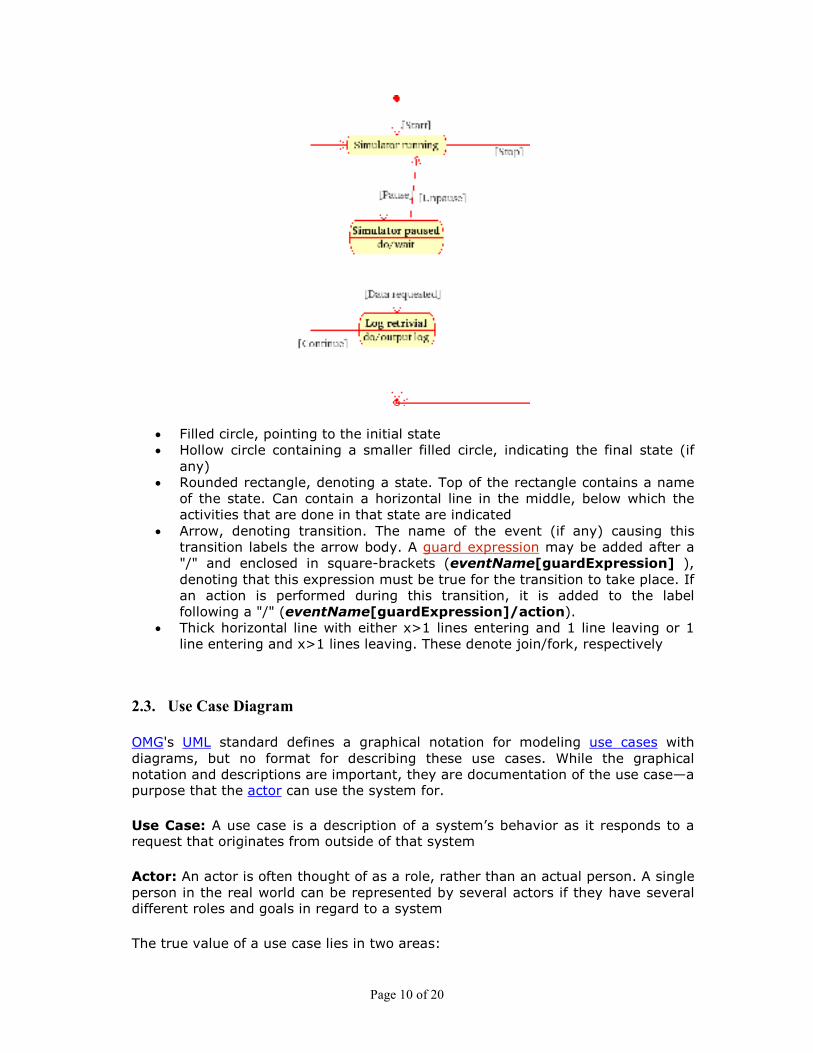
The Unified Modeling Language (UML) state diagram is essentially a Harel
statechart with standardized notation, which can describe a lot of things, from
computer programs to business processes. The following are the basic notational elements that can be used to make up a diagram:
Page 10 of 20
• Filled circle, pointing to the initial state
• Hollow circle containing a smaller filled circle, indicating the final state (if
any)
• Rounded rectangle, denoting a state. Top of the rectangle contains a name
of the state. Can contain a horizontal line in the middle, below which the
activities that are done in that state are indicated
• Arrow, denoting transition. The name of the event (if any) causing this
transition labels the arrow body. A guard expression may be added after a
"/" and enclosed in square-brackets (eventName[guardExpression] ),
denoting that this expression must be true for the transition to take place. If
an action is performed during this transition, it is added to the label
following a "/" (eventName[guardExpression]/action).
• Thick horizontal line with either x>1 lines entering and 1 line leaving or 1
line entering and x>1 lines leaving. These denote join/fork, respectively
2.3. Use Case Diagram
OMG's UML standard defines a graphical notation for modeling use cases with
diagrams, but no format for describing these use cases. While the graphical
notation and descriptions are important, they are documentation of the use case—a purpose that the actor can use the system for.
Use Case: A use case is a description of a system’s behavior as it responds to a request that originates from outside of that system
Actor: An actor is often thought of as a role, rather than an actual person. A single
person in the real world can be represented by several actors if they have several different roles and goals in regard to a system
The true value of a use case lies in two areas:

Page 11 of 20
• The written description of system behavior regarding a business task or
requirement. This description focuses on the value provided by the system
to external entities such as human users or other systems.
• The position or context of the use case among other use cases. As an
organizing mechanism, a set of consistent, coherent use cases promotes a
useful picture of system behavior, a common understanding between the customer/owner/user and the development team.
This diagram describes the functionality of a simplistic Restaurant System. Use
cases are represented by ovals and the actors are represented by stick figures. The
Patron actor can Eat Food, Pay for Food, or Drink Wine. Only the Chef actor can
Prepare Food. Note that both the Patron and the Cashier are involved in the Pay for
Food use case. The box defines the boundaries of the Restaurant System, i.e., the use cases shown are part of the system being modelled, the actors are not.
Interaction among actors is not shown on the use case diagram. If this interaction
is essential to a coherent description of the desired behavior, perhaps the system
or use case boundaries should be re-examined. Alternatively, interaction among actors can be part of the assumptions used in the use case.
Actor Generalization
The only relationship allowed between actors is generalization. This is useful in
defining overlapping roles between actors. The notation is a solid line ending in a
hollow triangle drawn from the specialized to the more general actor.

Page 12 of 20
Actor inheritance
Use Case Relationships
Three relationships among use cases are supported by the UML standard, which describes graphical notation for these relationships.
Use case relationships
Uses
In one form of interaction, a given use case uses another. The first use case often
depends on the outcome of the included use case (Hamid: in this case the Process
Transaction depends on the Validate User use case therefore, on the above graph
the “ ----->” shows that Process Transaction depends on the Validate User use
Page 13 of 20
case). This is useful for extracting truly common behaviors from multiple use cases
into a single description. The notation is a dashed arrow from the including to the
included use case (Hamid: in this case Validate User is an included use case), with
the label "«include»". This usage resembles a macro expansion where the included
use case behavior is placed inline in the base use case behavior. There are no parameters or return values.
Extend
In another form of interaction, a given use case (the extension) may extend
another. This relationship indicates that the behavior of the extension use case
may be inserted in the extended use case under some conditions. The notation is a
dashed arrow from the extension to the extended use case, with the label
'«'extend'»'. This can be useful for dealing with special cases (when A extends B,
A is a special case of B), or in accommodating new requirements during system maintenance and extension.
To make the points at which extension may occur explicit extension points may be defined in a use case which are listed in a compartment below the use case.
Generalization
In the third form of relationship among use cases, a generalization/specialization
relationship exists. A given use case may be a specialized form of an existing use
case. The notation is a solid line ending in a hollow triangle drawn from the
specialized to the more general use case. This resembles the object-oriented
concept of sub-classing, in practice it can be both useful and effective to factor
common behaviors, constraints and assumptions to the general use case, describe
them once, and deal same as except details in the specialized cases
3. Interaction Diagrams: A subset of behavior diagram, emphasize the flow of control and data among the things in the system being modeled
3.1. Communication Diagram
Communication diagrams show the message flow between objects in an OO
application and also imply the basic associations (relationships) between classes.
Figure 1 presents a simplified collaboration diagram for displaying a seminar details
screen or page. The rectangles represent the various objects involved that make
up the application. The lines between the classes represent the relationships
(associations, composition, dependencies, or inheritance) between them. The same
notation for classes and objects used on UML sequence diagrams are used on UML
communication diagrams, another example of the consistency of the UML. The
details of your associations, such as their multiplicities, are not modeled because
this information is contained on your UML class diagrams: remember, each UML
diagram has its own specific purpose and no single diagram is sufficient on its own.
Messages are depicted as a labeled arrow that indicates the direction of the message, using a notation similar to that used on sequence diagrams.

Page 14 of 20
Optionally, you may indicate the sequence number in which the message is sent,
indicate an optional return value, and indicate the method name and the
parameters (if any) passed to it. Sequence numbers should be in the format
A.B.C.D to indicate the order in which the messages where sent. In Figure 1
message 1 is sent to the Seminar object which in turn sends messages 1.1 and
then 1.2 to the Course object. Message 5 is sent to the Seminar object, which
sends message 5.1 to enrollment, which in turn sends message 5.1.1 to student,
and it finally sends message 5.1.1.1 to itself. Notice how a recursive connection,
or a self connection, is required so that student can do this.
Note: Although Figure 1 applies sequence numbers to the messages, my
experience is if you feel the need to use sequence numbers on communication
diagrams this is a good indication you should be using sequence diagrams instead.
The main difference between communication diagrams and sequence diagrams is
that sequence diagrams are good at showing sequential logic but not that good at
giving you a “big picture view” whereas communication diagrams are the exact opposite.
3.2. Interaction Overview Diagram
Interaction overview diagrams are variants on UML activity diagrams which
overview control flow. Figure 1 depicts an interaction overview diagram for
enrolling in a seminar. The nodes within the diagram are frames instead of the
normal activities which you would see on an activity diagram. There are two types
of frame shown: interaction frames which depict any type of UML interaction
diagram (sequence diagram, communication diagram, timing diagram, interaction
overview diagram) or interaction occurrence frames which indicate an activity or

Page 15 of 20
operation to invoke. There are two interaction frames in the diagram, one which
depicts a sequence diagram for determining whether a student is eligible to enroll
in a seminar and a communication diagram to determine if a seat is available in a
seminar. These frames indicate the type of diagram (sd for sequence diagrams, cd
for communication diagrams, td for timing diagrams, and iod for interaction
overview diagrams) and optionally the name of the diagram. The interaction
occurrence frames are of type ref and typically are anonymous as the name of the
activity or operation to be invoked should make it clear what is happening (otherwise you need to rethink your naming strategy).
Although interaction overview diagrams are an interesting concept I doubt that
they’ll be used in practice. Interaction frames are virtually useless due to a lack of
space – the diagrams that you can depict within the frames will be too small to be
of value. My suspicion is that interaction overview diagrams will be abandoned
within the marketplace in favor of UML activity diagrams because they don’t work
well on whiteboards and the CASE tool vendors can simply allow you to use other
diagrams to describe the details of activities. Perhaps I’m wrong about this, time will tell.
3.3. Sequence Diagram
The Message Sequence Chart technique has been incorporated into the Unified
Modeling Language (UML) diagram under the name of Sequence Diagram. A

Page 16 of 20
sequence diagram shows, as parallel vertical lines, different processes or objects
that live simultaneously, and, as horizontal arrows, the messages exchanged
between them, in the order in which they occur. This allows the specification of simple runtime scenarios in a graphical manner.
Simple Restaurant Sequence Diagram
For instance, the UML 1.x diagram on the right describes the sequences of
messages of a (simple) Restaurant System. This diagram represents a Patron
ordering food and wine, drinking wine then eating the food, and finally paying for
the food. The dotted lines extending downwards indicate the timeline, time flows
from top to bottom. The arrows represent messages (stimuli) from an actor or
object to other objects. For example, the Patron sends message 'pay' to the Cashier. Half arrows indicate asynchronous method calls.
The UML 2.0 Sequence Diagram supports similar notation to the UML 1.x Sequence Diagram with added support for modeling variations to the standard flow of events.
If the lifeline is that of an object, it is underlined (if not it is a role). Note that
leaving the instance name blank can represent anonymous and unnamed
instances.
In order to display interaction, messages are used. These are horizontal arrows
with the message name written above them. Solid arrows with full heads are
synchronous calls, solid arrows with stick heads are asynchronous calls and dashed
arrows with stick heads are return messages. This definition is true as of UML 2,
considerably different from UML 1.x.

Page 17 of 20
UML 2
Activation boxes, or method-call boxes, are opaque rectangles drawn on top of
lifelines to represent that processes are being performed in response to the
message.
Objects calling methods on themselves use messages and add new activation boxes on top of any others to indicate a further level of processing.
When an object is destroyed (removed from memory), an X is drawn on top of the
lifeline, and the dashed line ceases to be drawn below it (this is not the case in the
first example though). It should be the result of a message, either from the object
itself, or another.
A message sent from outside the diagram can be represented by a message originating from a filled-in circle.
A UML diagram may perform a series of steps, called a superstep, in response to only one external stimulus.
Usage and limitations of Sequence Diagram
Some systems have simple dynamic behavior that can be expressed in terms of
specific sequences of messages between a small, fixed number of objects or
processes. In such cases sequence diagrams can completely specify the system's
behavior. Often, behavior is more complex, e.g. when the set of communicating
objects is large or highly variable, when there are many branch points (e.g.
exceptions), when there are complex iterations, or synchronization issues such as
resource contention. In such cases, sequence diagrams cannot completely describe
Page 18 of 20
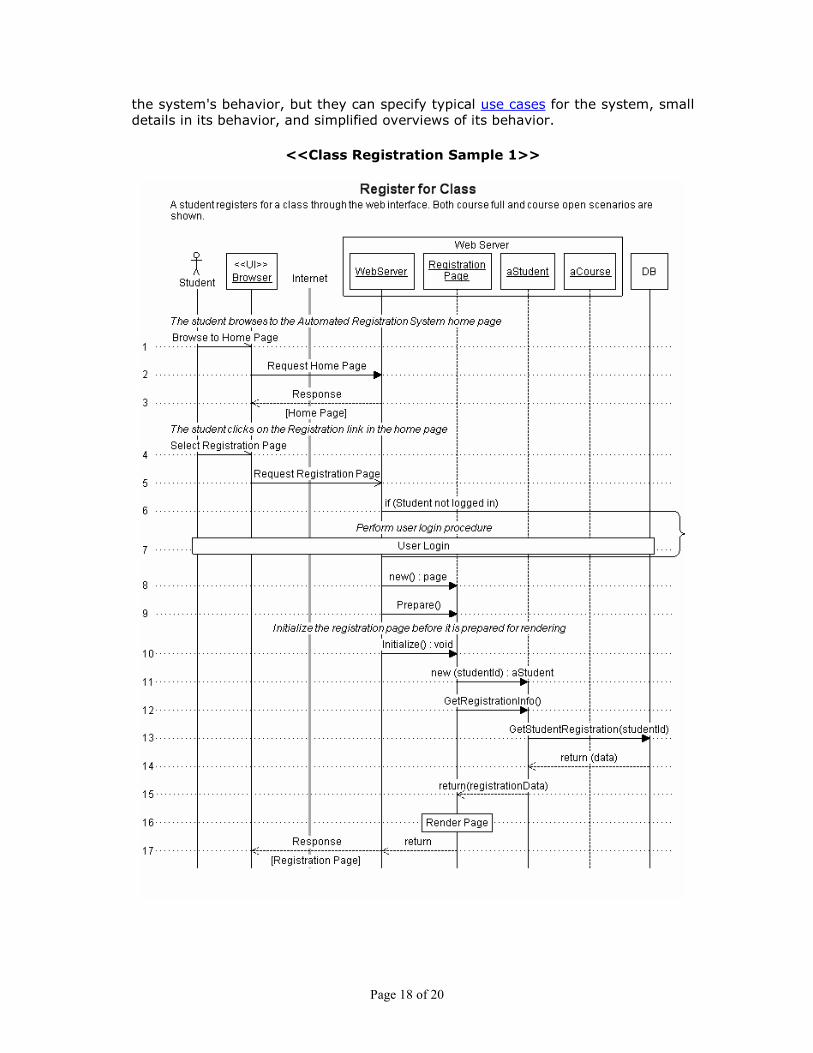
the system's behavior, but they can specify typical use cases for the system, small details in its behavior, and simplified overviews of its behavior.
<<Class Registration Sample 1>>
Page 19 of 20
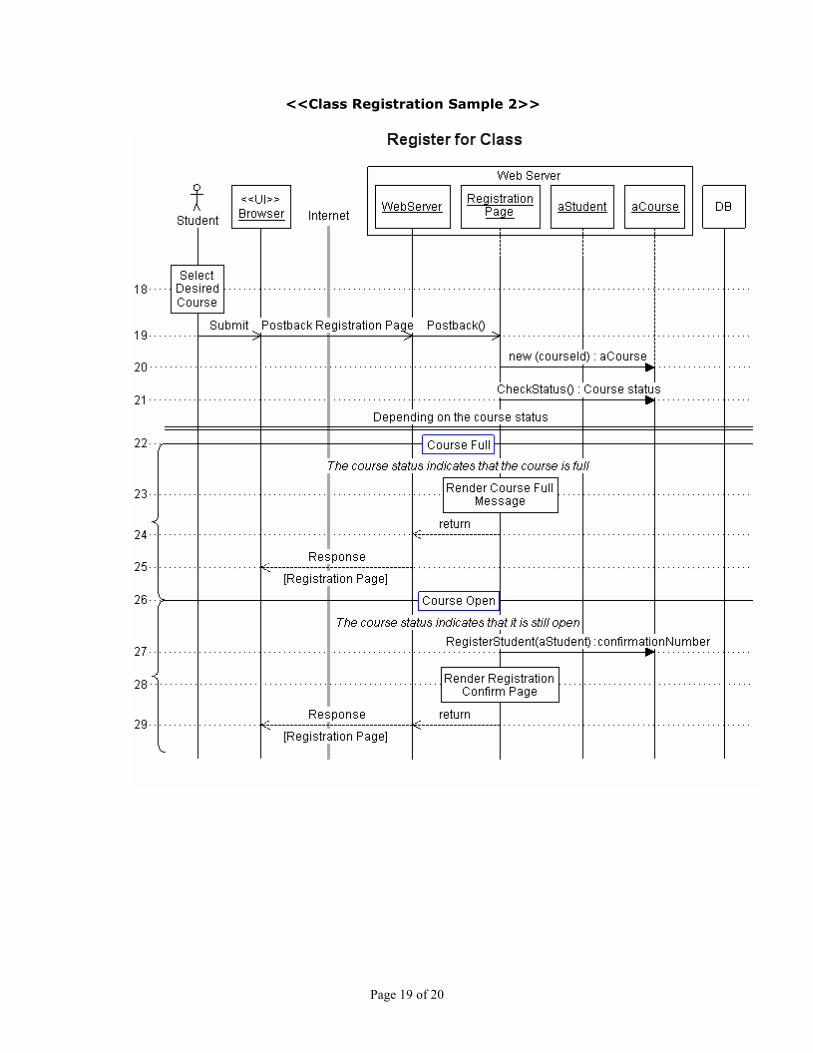
<<Class Registration Sample 2>>
Page 20 of 20
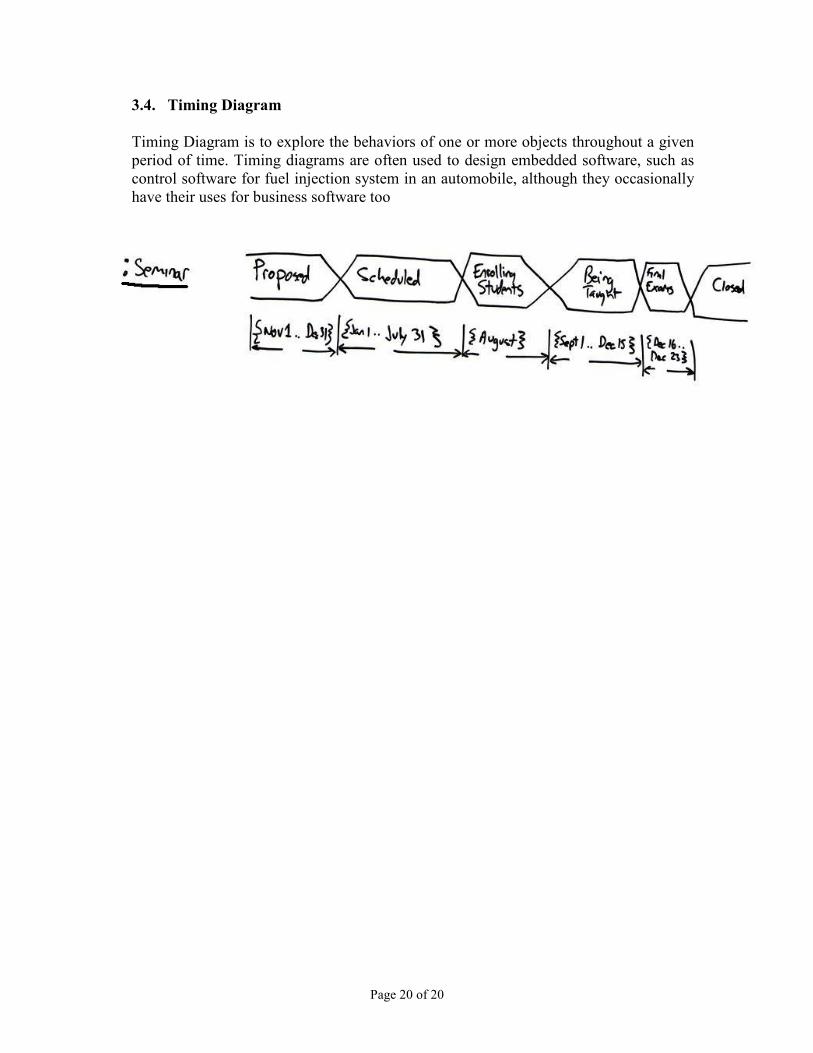
3.4. Timing Diagram
Timing Diagram is to explore the behaviors of one or more objects throughout a given
period of time. Timing diagrams are often used to design embedded software, such as
control software for fuel injection system in an automobile, although they occasionally
have their uses for business software too