Embed Size (px)
Citation preview
SO
UT
H–E
AS
T E
UR
OP
E
103
For most of South-East Europe,1 the closing decade of the
twentieth century was a time of sweeping changes and
turmoil, including such atrocities as regional and ethnic wars.
Today, the majority of states in the sub-region are still in the
throes of a radical transformation of their political, social and
economic systems set in motion by the fall of the Berlin wall
in 1989. One of them, Yugoslavia, has even disintegrated
into five new states. For all the countries in transition, the
past decade has been marked by economic weakness and
grave social problems. Only Slovenia has managed to sail
through the transitional period, even succeeding in becom-
ing a Member of the European Union (EU) in May 2004. In
a reflection of its new status, Slovenia straddles both the pres-
ent chapter and that on the EU (see page 87). Greece, for its
part, has escaped unscathed from this period of turmoil,
thanks to its political stability and membership of the EU.
The science and technology (S&T) systems of the coun-
tries in the region have similarly been subjected to far-reach-
ing and unprecedented changes. Economic difficulties have
led to chronic underfunding of S&T activities, the collapse of
the knowledge-producing system and a gradual disengage-
ment by both governments and society. Prior to the transition
period, institutes performing applied research and develop-
ment (R&D) had enjoyed close ties with local industry; in
some cases, they had been part of economic blocs like the
former COMECON (Bulgaria and Romania). In the 1990s,
these ties were broken. Cooperation with industry ceased for
the majority of R&D units, which were incapable of building
new relationships. Today, R&D funding comes mainly from
government and, more particularly, from one prevailing
source, the Ministry of Science. There are no incentives for
the private sector to support R&D, since the national
economies are import-oriented. A common problem for all
countries is an intensive external ‘brain drain’ and, even
more preoccupying, an internal brain drain, phenomena
which demoralize researchers and diminish the inflow to
science.
Under such unfavourable socio-economic conditions, the
role international and intergovernmental organizations and
initiatives play in revitalizing and transforming national S&T
systems becomes very important. Some of these bodies aim
at an overall stabilization of the region, whereas others are
more specialized in rebuilding and reintegrating knowledge-
producing and innovation systems. These initiatives create
favourable conditions for cooperation in research both
among the South-East European countries themselves and
between them and the rest of Europe. Some of these bodies
encompass only some countries of the region; others, like
UNESCO with its global mandate, involve them all.
Since the adoption of the Stability Pact for South-East
Europe (Cologne, 1999), the role of regional cooperation
has been enhanced through multilateral and bilateral
agreements and a better economic and political framework
for R&D. The main objective of the Stability Pact is to
bolster the efforts of countries in South-East Europe to
foster peace, democracy, respect for human rights and
economic prosperity, in order to achieve stability
throughout the region. A comprehensive and coherent
approach has been elaborated to achieve these objectives,
involving the United Nations, the EU, the Organization for
Security and Co-operation in Europe (OSCE), the Council
of Europe, the North Atlantic Treaty Organization (NATO)
and the Organisation for Economic Co-operation and
Development (OECD), among others.
The EU’s policy for South-East Europe is anchored in
two strategies: accession to the EU, involving Bulgaria,
Croatia, Romania and Turkey; and the Stabilization and
Association Process for Albania, Bosnia and Herzegovina,
UNESCO Science Report 2005 - ISBN 92-3-103967-9 - © UNESCO 2005
South-East Europe
GEORGI ANGELOV, KOSTADINKA SIMEONOVA and IVO SLAUS
1 The countries in this region are: Albania (area of 28 748 km2, population of 3.4 million), Bosnia and Herzegovina (52 280 km2,4.3 million), Bulgaria (110 993 km2, 7.9 million), Croatia (56 542 km2, 4.4 million), Greece (131 940 km2, 10.9 million), FYR Macedonia (25 713 km2, 2.0 million), Romania (237 502 km2, 21.7 million), Serbia and Montenegro (Serbia: 88 361 km2, 7.5 million (excludingKosovo: 10 877 km2, approx. 2 million); Montenegro: 13 812 km2, 0.7 million), Slovenia (20 273 km2, 2.0 million), Turkey (814 578 km2,67.8 million). All figures are taken from official government webpages in 2004. The aforementioned countries are also referred to asSouth-East Europe, a region which sometimes includes Hungary and Moldova. In some political documents, Albania and the countriesfrom the former Yugoslavia (listed in Table 2 overleaf) are labelled West Balkan countries.
Serbia and Montenegro, and the Former Yugoslav Republic
(FYR) of Macedonia, to prepare for eventual membership
of the EU. Formal talks between Croatia and the EU were
scheduled to begin in December 2004 and between
Turkey and the EU in October 2005.
The Venice Process initiated by UNESCO, the European
Science Foundation (ESF) and Academia Europaea in
November 2000 consists in rebuilding scientific
cooperation both among South-East European countries
and between them and the rest of Europe. It has essentially
the same goals as the specific actions of the European
Commission and its successive Framework Programmes; it
does, however, lay greater emphasis on the regional aspect
by encouraging the creation of regional networks. The
latter approximate to centres of excellence or competence.
In the area of higher education, a pan-European process
was launched in 1999 with the adoption of the Bologna
Declaration. A pledge by 29 European countries to reform
the structure of higher education in their respective
countries in a convergent way, the Declaration reflects ‘a
search for a common European answer to common
European problems’. This document launched the Bologna
Process to create a European Higher Education Area by
2010. The process has three main goals: to simplify the
patchwork of higher education qualifications; to improve
mobility within Europe and attract students from around
the world; and to ensure high standards.
This chapter looks individually at Croatia, Bosnia and
Herzegovina (B&H), Serbia and Montenegro (S&MN) and
FYR Macedonia, before studying in turn Bulgaria, Romania,
Albania and Turkey. It then takes a closer look at the way in
which the EU and other international bodies are bolstering
the efforts of the South-East European countries to achieve
stability and prosperity through regional and international
cooperation.
CROATIA, BOSNIA AND HERZEGOVINA,FYR MACEDONIA, SERBIA AND MONTENEGROThe social contextEconomic and social indicators for Croatia, B&H, S&MN
and FYR Macedonia deteriorated from 1989 to 1999, as
illustrated in Tables 1 and 2. There have been sweeping
demographic changes linked to the drop in the fertility
rate and improvements in health. The population under
17 has decreased by 10% in Croatia, FYR Macedonia,
S&MN and Slovenia, and by as much as 30% in B&H. The
fertility rate in Croatia in 1999 was only 1.38. If, as
expected, it drops to 1.15, this will imply a population
decrease from 4.5 million today to 3.7 million in 2050.
Issues in human resourcesExternal and internal brain drain is rampant in each of
Croatia, B&H, S&MN and FYR Macedonia, with many
science and engineering graduates either leaving the
UNESCO SCIENCE REPORT 2005
TH
E S
TA
TE
OF
SC
IEN
CE
IN
TH
E W
OR
LD
104 UNESCO Science Report 2005 - ISBN 92-3-103967-9 - © UNESCO 2005
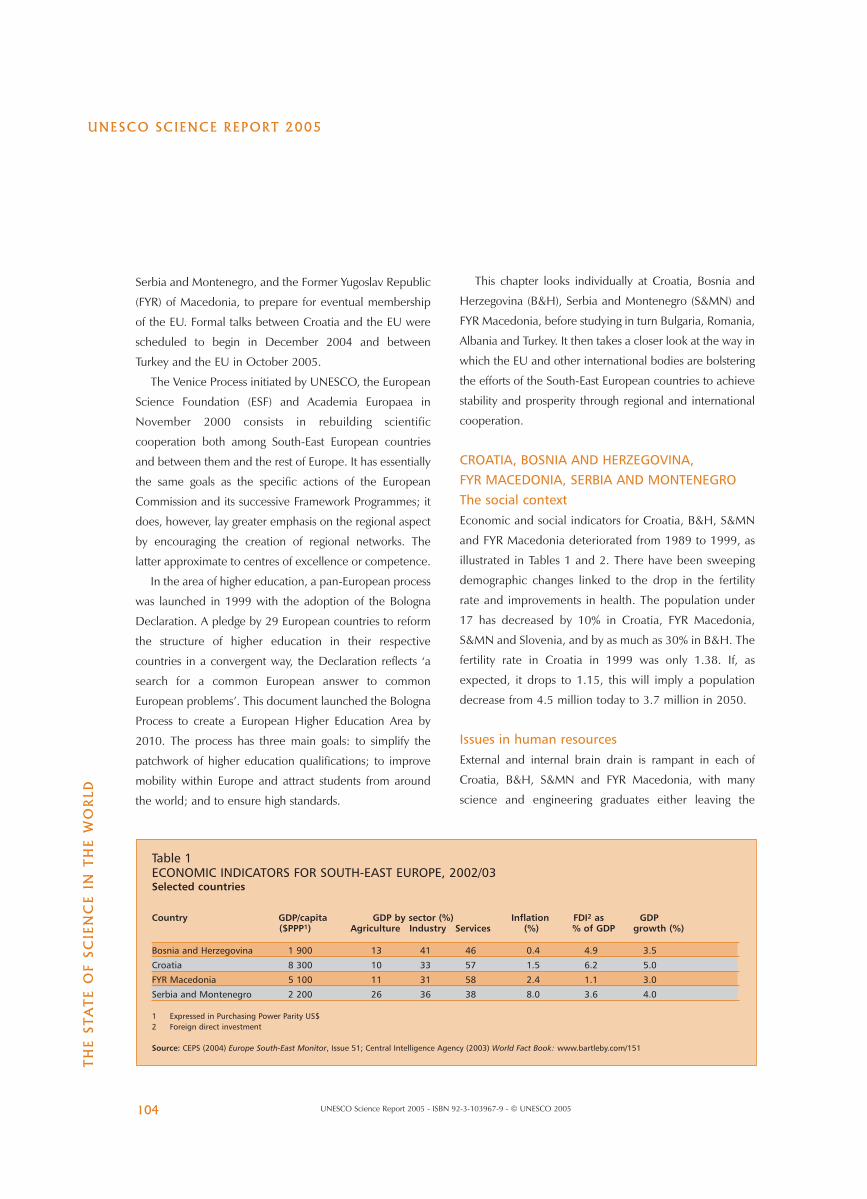
Table 1ECONOMIC INDICATORS FOR SOUTH-EAST EUROPE, 2002/03Selected countries
Country GDP/capita GDP by sector (%) Inflation FDI2 as GDP ($PPP1) Agriculture Industry Services (%) % of GDP growth (%)
Bosnia and Herzegovina 1 900 13 41 46 0.4 4.9 3.5
Croatia 8 300 10 33 57 1.5 6.2 5.0
FYR Macedonia 5 100 11 31 58 2.4 1.1 3.0
Serbia and Montenegro 2 200 26 36 38 8.0 3.6 4.0
1 Expressed in Purchasing Power Parity US$2 Foreign direct investment
Source: CEPS (2004) Europe South-East Monitor, Issue 51; Central Intelligence Agency (2003) World Fact Book: www.bartleby.com/151
country or pursuing a more lucrative career at home
outside their field of specialization. Brain waste is even
more serious than brain drain because it demoralizes both
researchers and those planning to become researchers. As
we shall see in a later section of the chapter, other countries
in South-East Europe, such as Romania and Albania, are
also suffering from this phenomenon.
There are also issues of concern in higher education.
Croatia, B&H and S&MN share a high drop-out rate and
drawn-out degrees. Each year in Serbia, for instance, 33 000
students enrol but only 12 000 are awarded their first degree.
There are also few interdisciplinary and inter-faculty studies.
The distribution of students shows a preference for social
sciences (30%) and engineering (24%).
The percentage of young people enrolled in higher
education varies greatly in the region. It hovers at 25 to 30%
in Croatia and S&MN, and at 15 to 20% in B&H and FYR
Macedonia, compared with a high of 50% in Slovenia. The
number of degree holders in the region is also low. In Serbia
and Croatia, for example, only 7% of the population hold a
university degree. Given the current low number of degree
holders, it is disturbing that efforts to improve adult education
are almost non-existent in all four countries.
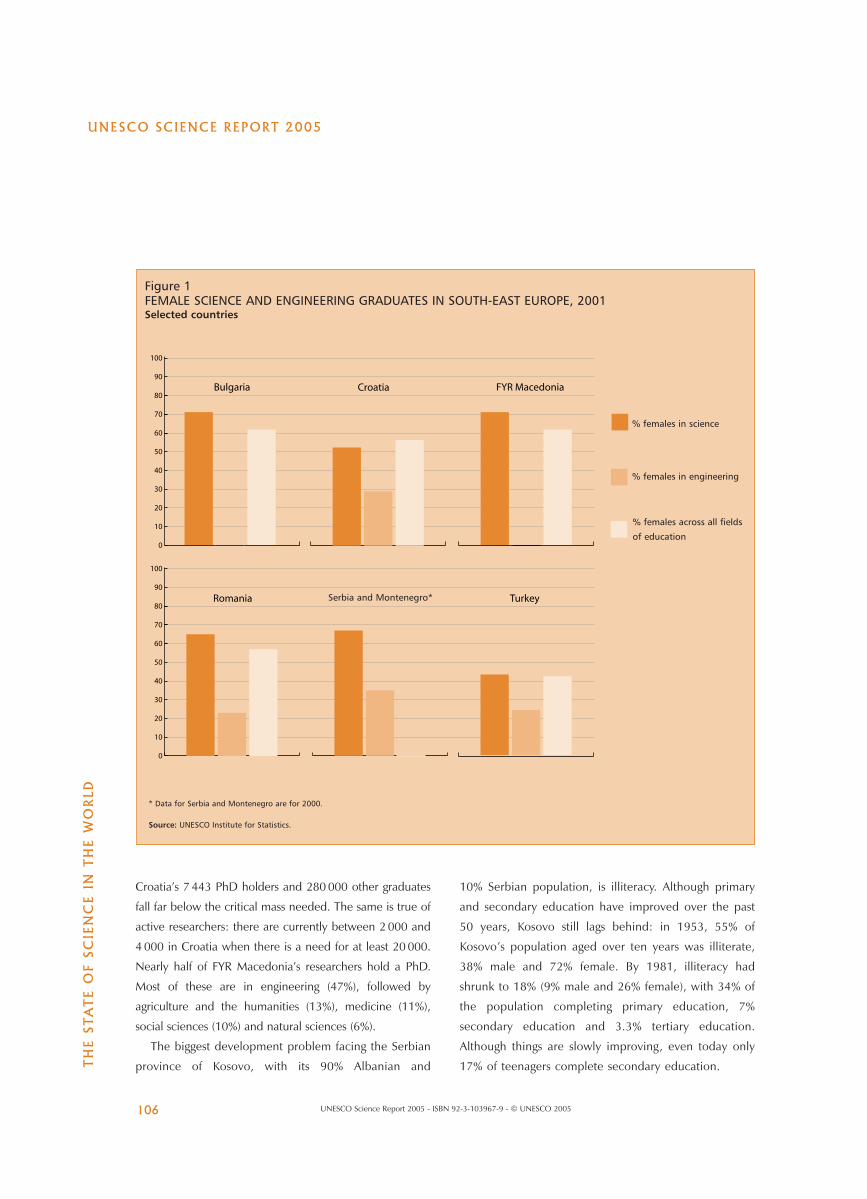
It is interesting to note that a gender balance in higher
education prevails throughout the region, with the
exception of Turkey (Figure 1). According to Eurostat,
Turkish women nevertheless represented 25% of graduates
in engineering, manufacturing and construction in 2001
and 44% of graduates in science fields (Table 13). In some
countries, there is even a gender imbalance in favour of
women; in B&H for example, women made up nearly two-
thirds of university graduates between 1998 and 2002,
according to the National Agency for Statistics.
Another trend common to many countries of the region
is the constant rise in tertiary enrolment, particularly among
women.
This rise in tertiary enrolment comes as good news at a
time when the research community in South-East Europe is
ageing. Of Croatia’s 7 433 PhD holders, for example, only
2 600 are younger than 50 (Table 4). Although most of these
PhD holders (6 504) are employed as researchers, 16.3% of
them did not publish a single paper from 1991 to 1998. The
most productive age group in Croatia appears to be those
aged 53 to 63. On the more positive side, the great majority
of PhDs obtained in 2001 were in the hard sciences. Medi-
cine dominated (26.7%), followed by engineering (22%),
natural sciences (20.8%), social sciences (12.5%), the
humanities (10.2%) and biotechnology (7.8%). The average
age of those receiving doctorates was 40 years.
The strength of the R&D potential in each of the four
countries of the former Yugoslavia is currently below the
threshold for achieving national priorities. For instance,
UNESCO SCIENCE REPORT 2005
SO
UT
H–E
AS
T E
UR
OP
E
105UNESCO Science Report 2005 - ISBN 92-3-103967-9 - © UNESCO 2005
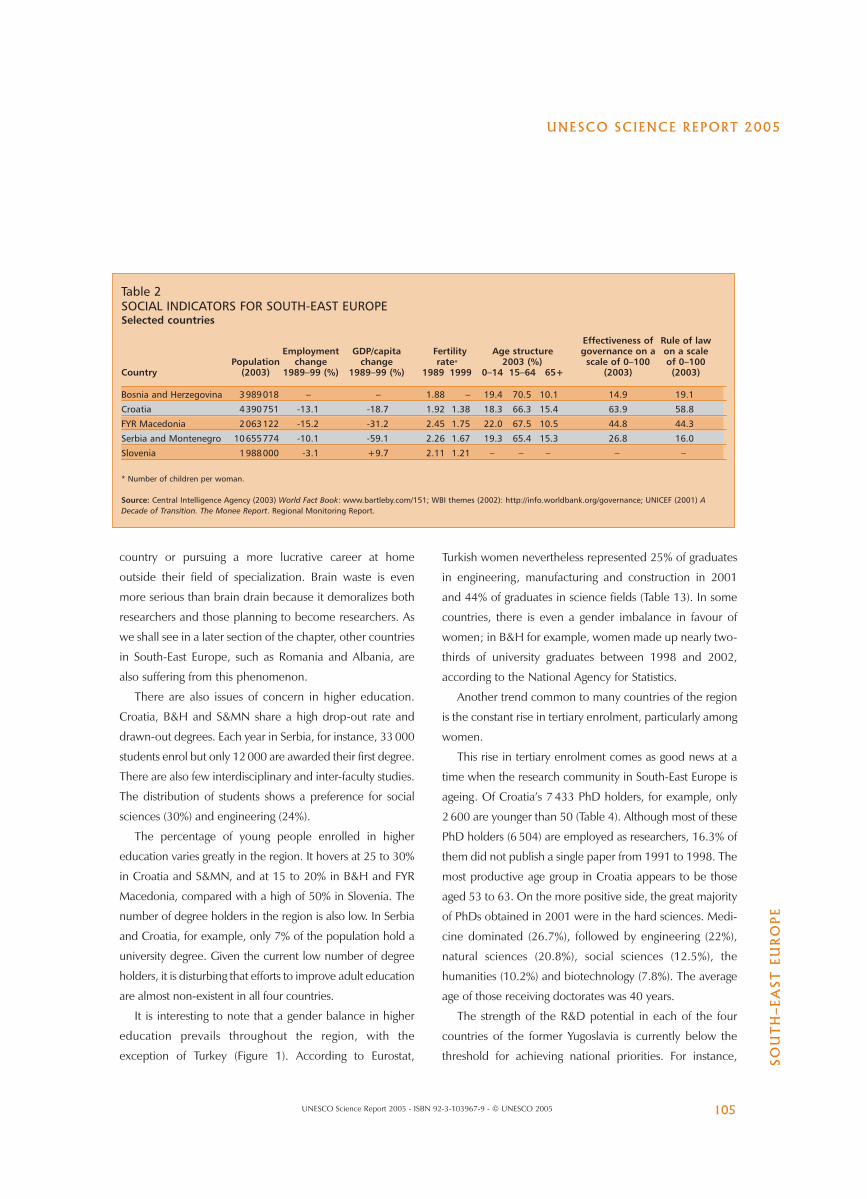
Table 2SOCIAL INDICATORS FOR SOUTH-EAST EUROPESelected countries
Effectiveness of Rule of lawEmployment GDP/capita Fertility Age structure governance on a on a scale
Population change change rate* 2003 (%) scale of 0–100 of 0–100Country (2003) 1989–99 (%) 1989–99 (%) 1989 1999 0–14 15–64 65+ (2003) (2003)
Bosnia and Herzegovina 3989018 – – 1.88 – 19.4 70.5 10.1 14.9 19.1
Croatia 4390751 -13.1 -18.7 1.92 1.38 18.3 66.3 15.4 63.9 58.8
FYR Macedonia 2063122 -15.2 -31.2 2.45 1.75 22.0 67.5 10.5 44.8 44.3
Serbia and Montenegro 10655774 -10.1 -59.1 2.26 1.67 19.3 65.4 15.3 26.8 16.0
Slovenia 1988000 -3.1 +9.7 2.11 1.21 – – – – –
* Number of children per woman.
Source: Central Intelligence Agency (2003) World Fact Book: www.bartleby.com/151; WBI themes (2002): http://info.worldbank.org/governance; UNICEF (2001) ADecade of Transition. The Monee Report. Regional Monitoring Report.
Croatia’s 7 443 PhD holders and 280 000 other graduates
fall far below the critical mass needed. The same is true of
active researchers: there are currently between 2 000 and
4 000 in Croatia when there is a need for at least 20 000.
Nearly half of FYR Macedonia’s researchers hold a PhD.
Most of these are in engineering (47%), followed by
agriculture and the humanities (13%), medicine (11%),
social sciences (10%) and natural sciences (6%).
The biggest development problem facing the Serbian
province of Kosovo, with its 90% Albanian and
10% Serbian population, is illiteracy. Although primary
and secondary education have improved over the past
50 years, Kosovo still lags behind: in 1953, 55% of
Kosovo’s population aged over ten years was illiterate,
38% male and 72% female. By 1981, illiteracy had
shrunk to 18% (9% male and 26% female), with 34% of
the population completing primary education, 7%
secondary education and 3.3% tertiary education.
Although things are slowly improving, even today only
17% of teenagers complete secondary education.
UNESCO SCIENCE REPORT 2005
TH
E S
TA
TE
OF
SC
IEN
CE
IN
TH
E W
OR
LD
106 UNESCO Science Report 2005 - ISBN 92-3-103967-9 - © UNESCO 2005
Figure 1FEMALE SCIENCE AND ENGINEERING GRADUATES IN SOUTH-EAST EUROPE, 2001Selected countries
70
80Bulgaria
% females in science
% females in engineering
% females across all fields of education
Croatia FYR Macedonia
Romania Serbia & Montenegro
0
10
20
30
40
50
60
90
100
70
80
0
10
20
30
40
50
60
90
100
Turkey
* Data for Serbia and Montenegro are for 2000.
Source: UNESCO Institute for Statistics.
Serbia and Montenegro*
% females in science
% females in engineering
% females across all fields
of education
The Bologna ProcessAll four countries under study have embraced the Bologna
Process, one of the goals of which is to ensure high
academic standards in tertiary education throughout
Europe.
A law on education reform recognizing the principles
and objectives of the Bologna Declaration (1999) was
endorsed by the Federation and the smaller Republica
Srpska which make up B&H and presented to the Peace
Implementation Council in Brussels on 21 November
2002. A majority of higher education institutions in B&H
have since adopted the plan of reforms and it is anticipated
that, by the year 2010, the Bologna Process will be applied
fully in B&H universities. The biggest university in the
country – Sarajevo University – has paradoxically also been
the slowest to implement the Bologna Process.
In 2000, Croatia initiated a process of reform of its R&D
and higher education systems as part of its move towards a
knowledge-based society. In May 2001, Croatia joined the
Bologna Process and, in turn, passed a law aligning higher
education with the Bologna Declaration.
As with Croatia, the Constitution of FYR Macedonia grants
autonomy to universities. In FYR Macedonia, there is a quota
whereby a certain percentage of university places is allo-
cated to ethnic minorities. FYR Macedonia ratified the
Lisbon Convention on the recognition of qualifications in
March 2003. All three Macedonian universities have devel-
oped programmes that fully implement the Bologna Process.
In February 2001, the Ministry of Education and Sport
of the Republic of Serbia defined its mission for estab-
lishing a modern higher education system in accordance
with the Bologna Process. A special problem in Serbia has
been the 1998 law governing universities which
cancelled the autonomy of institutions of higher educa-
tion. That law has resulted in the suspension of Serbian
universities from the Association of European Universi-
ties. Similarly inadequate laws and practices regulating
science in Croatia in the early 1990s have prevented
Croatia from being admitted to the European Science
Foundation.
The Ministry of Education and Science in Montenegro
made an unorthodox decision in 2003 to transfer higher
education reform and the drafting of a new law for higher
education to the University of Montenegro. Montenegro
plans to establish a Bologna Commission for coordinating,
supervising and monitoring the reform.
The R&D frameworkAll four countries have, on several occasions, declared R&D
to be a national priority. It must be said, however, that the
R&D potential is below the vital threshold for achieving any
national priorities. In all but Croatia, where industry supports
R&D to the tune of 0.5% of GDP, R&D funding comes from
a single source, the Ministry of Science. There are no
adequate centres of excellence or adequate support for inter-
nationally recognized scientific research, nor for international
cooperation, particularly when it comes to participating in
major international collaborative projects using international
research facilities. Support from the EU and the USA for vari-
ous collaborative projects in the 1980s was considerably
larger than current support through the EU’s Fifth
(1998–2002) and Sixth (2003–07) Framework Programmes.
In the 1970s, the scientific productivity of Yugoslavia
was comparable to that of Hungary, Spain, Ireland, Austria
UNESCO SCIENCE REPORT 2005
SO
UT
H–E
AS
T E
UR
OP
E
107UNESCO Science Report 2005 - ISBN 92-3-103967-9 - © UNESCO 2005
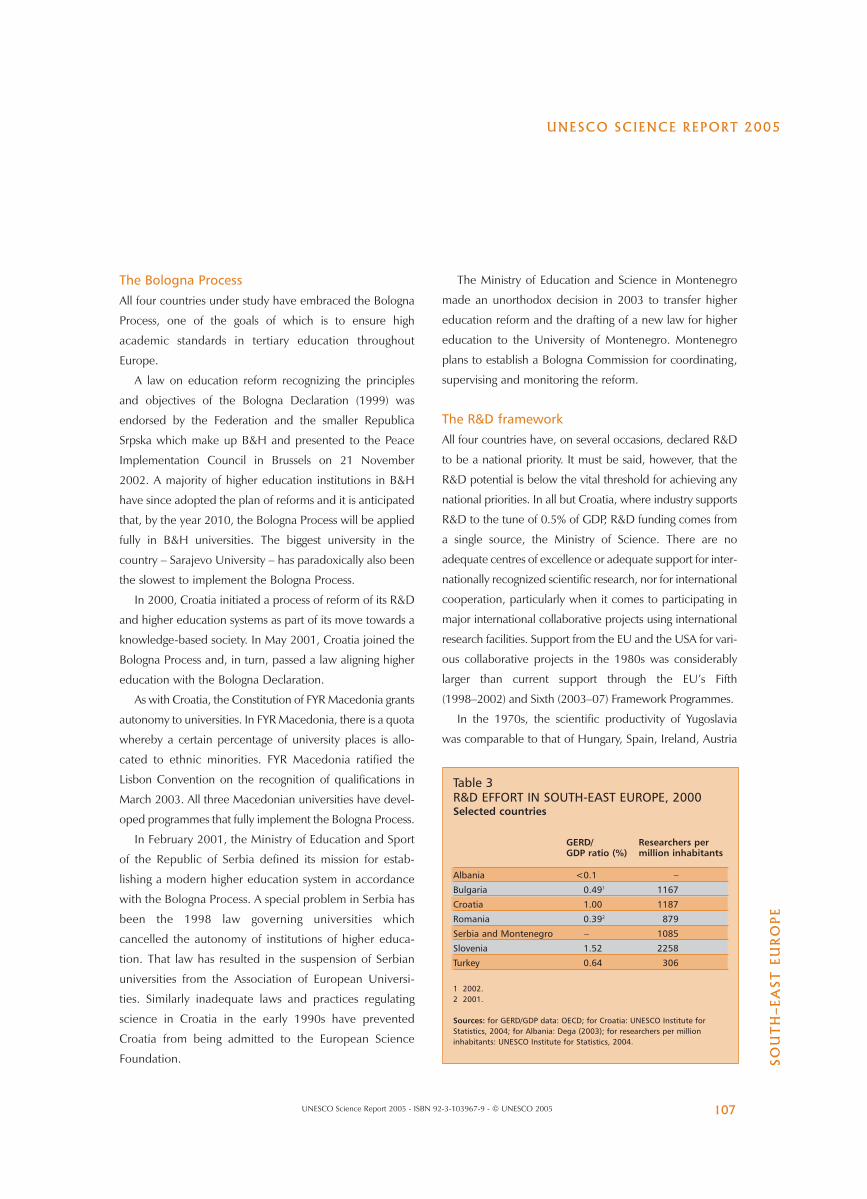
Table 3R&D EFFORT IN SOUTH-EAST EUROPE, 2000Selected countries
GERD/ Researchers per GDP ratio (%) million inhabitants
Albania <0.1 –
Bulgaria 0.491 1167
Croatia 1.00 1187
Romania 0.392 879
Serbia and Montenegro – 1085
Slovenia 1.52 2258
Turkey 0.64 306
1 2002.2 2001.
Sources: for GERD/GDP data: OECD; for Croatia: UNESCO Institute forStatistics, 2004; for Albania: Dega (2003); for researchers per millioninhabitants: UNESCO Institute for Statistics, 2004.
and Greece. According to the World Science Report 1998,
Yugoslavian productivity dropped in the 1980s to the point
where it was more comparable to that of Portugal, Romania
and Bulgaria.
Most R&D is performed by the university sector in each
of Croatia, B&H, S&MN and FYR Macedonia. Whereas
several universities could once boast of figuring on the list
of the world’s 500 leading universities, not a single one
appears on that list today.
R&D in Bosnia and HerzegovinaThere is a separate R&D system for each of the two entities
that make up B&H, the larger Federation and the
Republica Srpska. The Federation and its cantons invest
€ 2.7 million in R&D annually, of which € 1 million is set
aside for research projects.
In 1990, the population of B&H comprised 18% of the
Yugoslavian population and B&H produced 13.6% of
Yugoslav GDP, or US$ 10.5 billion. This contribution fell
dramatically during the war and only began to recover after
1995. By 2003, GDP had climbed back to 50% of its value
13 years earlier.
Whereas, in the late 1980s, 30% of exports were based
on domestic R&D, no company had a single product in this
category in January 2002. In 1990, B&H counted about
2 000 researchers who spent annually US$ 43.5 million, or
US$ 22 000 each. By the end of the 1990s, there were only
1 300 university professors and lecturers, which translated
into 650 full-time equivalent (FTE) researchers. A further
650 researchers were employed in industrial R&D centres.
In 1990, B&H spent 1.5% of GDP on civil R&D. The
government share represented two-thirds of the total, with
industry contributing the remainder. Still part of Yugoslavia
at the time, B&H received 40% of the government share
from Belgrade and 60% from local government, according
to a 2002 science policy report by the Academy of
Sciences and Arts of Bosnia and Herzegovina (ANUBiH),
which was founded in 1966. Military R&D represented an
additional 0.3% of GDP, bringing the total to 1.8% of GDP
or US$ 195 million.
The first phase of the policy proposed by ANUBiH
argued that the gross domestic expenditure on research
and development (GERD) of B&H should reach pre-1990
levels by 2003, with 30% coming from the Federation and
70% from cantons. The same was demanded of the
Republika Srpska. It is clear that this has not been achieved.
Today, there are 23 research institutes in the natural and
social sciences, including an Institute for Genetic Engi-
neering and Biotechnology, an Institute for Materials
Science, institutes for history and economics, the indus-
trial institutes of Energoinvest in the city of Sarajevo and
the Institute of Metallurgy at Zenica. Research is
conducted at centres of ANUBiH.
R&D in CroatiaMore than 50% of research in Croatia is performed in
the country’s universities, of which there are six. The
largest of Croatia’s 28 public research institutes is the
multidisciplinary Rudjer Boškovic Institute in Zagreb,
founded in 1950, which has 350 PhD holders
among its employees and accounts for over 30% of
Croatian scientific output. Other major research bodies
are the Institutes for Medical Research, Oceanography
and Fisheries, and Economics. Each was established
UNESCO SCIENCE REPORT 2005
TH
E S
TA
TE
OF
SC
IEN
CE
IN
TH
E W
OR
LD
108 UNESCO Science Report 2005 - ISBN 92-3-103967-9 - © UNESCO 2005
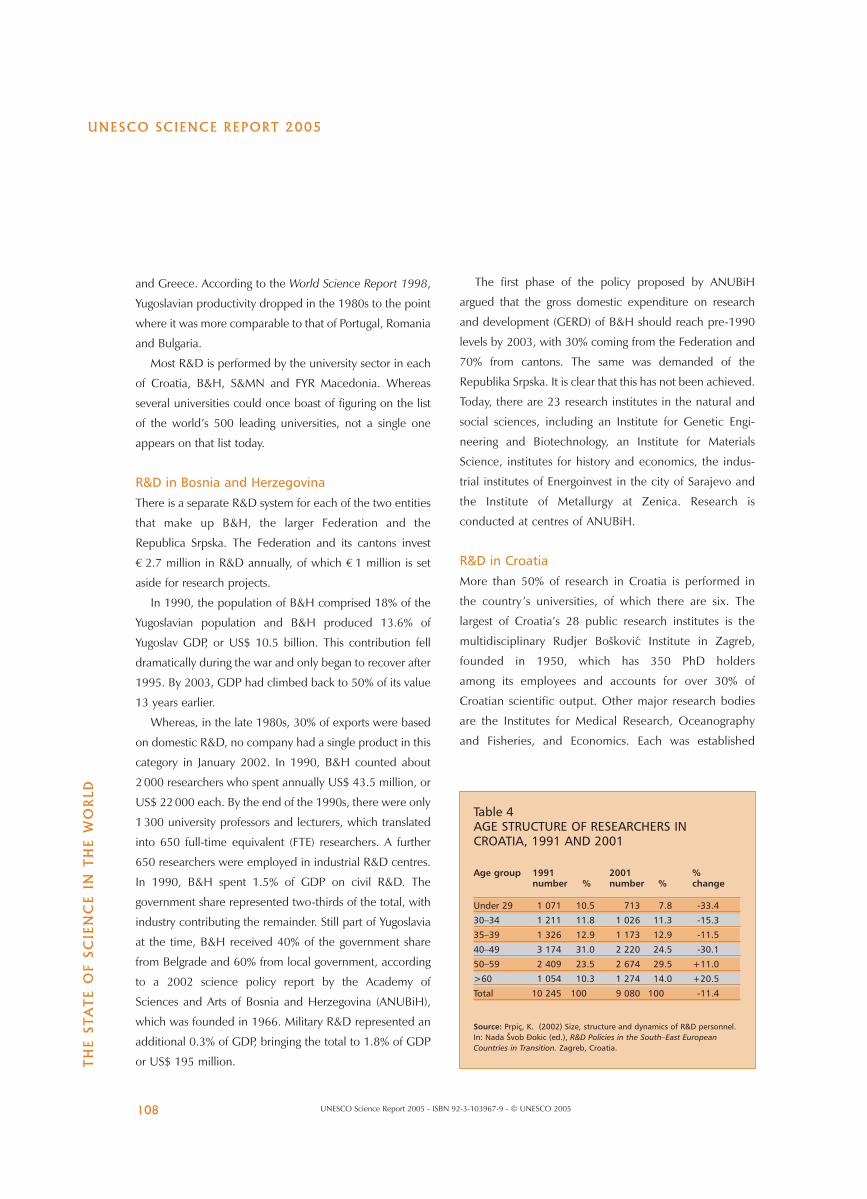
Table 4AGE STRUCTURE OF RESEARCHERS INCROATIA, 1991 AND 2001
Age group 1991 2001 %number % number % change
Under 29 1 071 10.5 713 7.8 -33.4
30–34 1 211 11.8 1 026 11.3 -15.3
35–39 1 326 12.9 1 173 12.9 -11.5
40–49 3 174 31.0 2 220 24.5 -30.1
50–59 2 409 23.5 2 674 29.5 +11.0
>60 1 054 10.3 1 274 14.0 +20.5
Total 10 245 100 9 080 100 -11.4
Source: Prpiç, K. (2002) Size, structure and dynamics of R&D personnel.In: Nada Švob Ðokic (ed.), R&D Policies in the South–East EuropeanCountries in Transition. Zagreb, Croatia.
more than 50 years ago and employs close to 100
individuals.
The Croatian Academy of Sciences and Arts in Zagreb is
a learned society of 150 fellows, with an equal share of
foreign fellows. The Academy hosts a research centre
employing over 100 researchers (see also international
cooperation).
Government expenditure on education in 1998
amounted to US$ 770.5 million, 90% of which covered
salaries. The remainder was invested in infrastructure.
Support for young researchers in 2003 accounted for 22%
of the Ministry of Science’s overall budget.
The Croatian Innovative Technological Development
Programme launched in 2000 to develop infrastructure has
led to the establishment of Croatian Business and Innovation
Centres and Technology Centres in Split, Zagreb, Rijeka and
Osijek. The TEST and RAZUM programmes fund the pre-
commercial R&D of companies on the cutting edge of their
field. Of more than 300 projects proposed for TEST funding,
just over half have been approved.
R&D in FYR MacedoniaFYR Macedonia’s annual budget for a total of 375
research projects amounts to US$850 000 or the
equivalent of 0.025% of GDP. As in Croatia, most
research is performed by universities, of which there are
three in FYR Macedonia. The number of researchers has
declined, from 3275 in 1998 to 2 838 four years later.
In 2002, just under half (1 300) of researchers held a
PhD: 47% in engineering, 13% in agriculture, 11% in
medicine, 6% in natural sciences and the remainder in
the social sciences and the humanities. For the
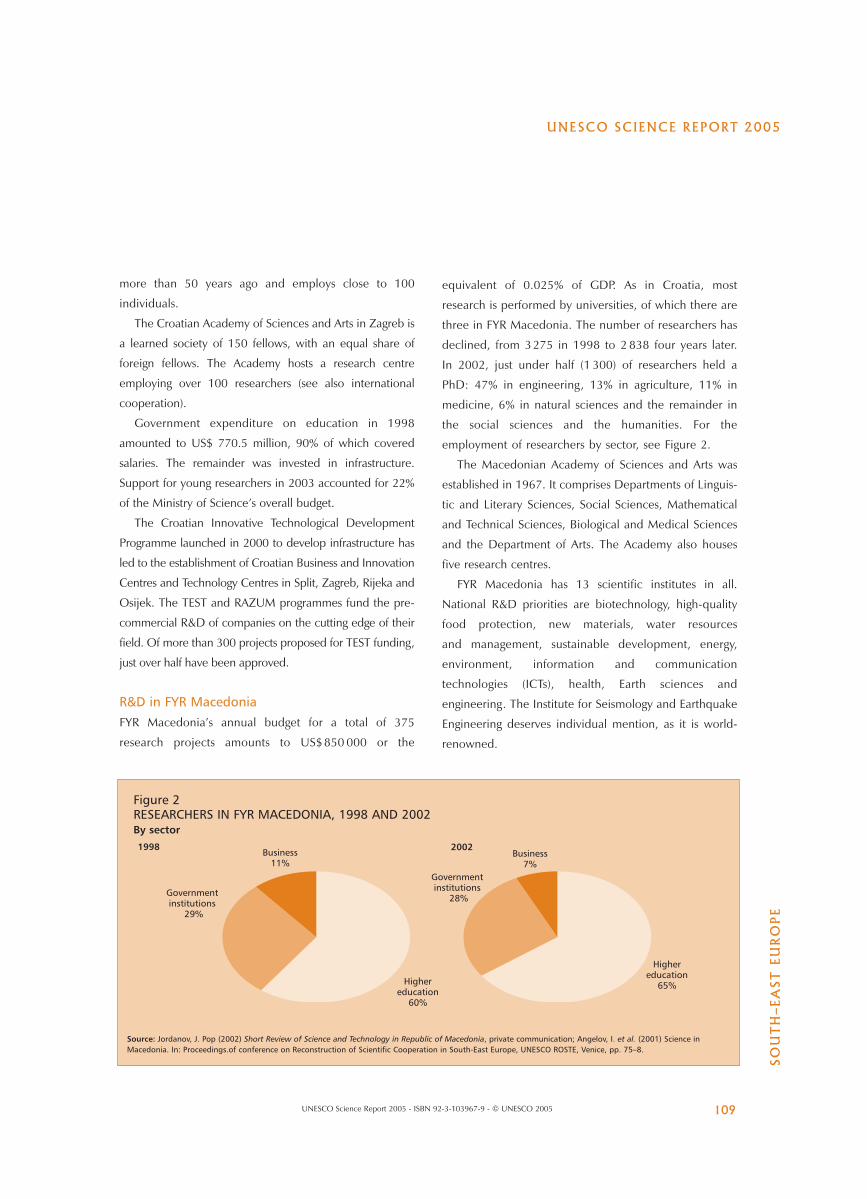
employment of researchers by sector, see Figure 2.
The Macedonian Academy of Sciences and Arts was
established in 1967. It comprises Departments of Linguis-
tic and Literary Sciences, Social Sciences, Mathematical
and Technical Sciences, Biological and Medical Sciences
and the Department of Arts. The Academy also houses
five research centres.
FYR Macedonia has 13 scientific institutes in all.
National R&D priorities are biotechnology, high-quality
food protection, new materials, water resources
and management, sustainable development, energy,
environment, information and communication
technologies (ICTs), health, Earth sciences and
engineering. The Institute for Seismology and Earthquake
Engineering deserves individual mention, as it is world-
renowned.
UNESCO SCIENCE REPORT 2005
SO
UT
H–E
AS
T E
UR
OP
E
109UNESCO Science Report 2005 - ISBN 92-3-103967-9 - © UNESCO 2005
Figure 2RESEARCHERS IN FYR MACEDONIA, 1998 AND 2002By sector
Source: Jordanov, J. Pop (2002) Short Review of Science and Technology in Republic of Macedonia, private communication; Angelov, I. et al. (2001) Science inMacedonia. In: Proceedings.of conference on Reconstruction of Scientific Cooperation in South-East Europe, UNESCO ROSTE, Venice, pp. 75–8.
1998 2002
Governmentinstitutions
29%
Governmentinstitutions
28%
Highereducation
60%
Highereducation
65%
Business11%
Business7%
R&D in Serbia and MontenegroThe R&D budget in S&MN amounted to just €13 million
in 2000. As elsewhere in South-East Europe, R&D is
performed mainly by the academic sector; the principal
universities in S&MN are those of Belgrade, Novi Sad, Nis,
Kragujevac, Montenegro and Pristina. The main body of
researchers works at the University of Belgrade and at the
largest of the country’s research centres, the Vinca Institute
for Nuclear Sciences in Belgrade.
The TESLA Scientific Centre was founded at the Vinca
Institute in 1996. The centre is the realization of a
longstanding project for a medium-energy accelerator for
nuclear, biomedical and material sciences research, and is
a hub for international cooperation, even though the
accelerator facility is not yet completed. There are plans to
split the Vinca Institute into four separate bodies, one each
for: basic research; applied R&D; the TESLA accelerator;
and supporting activities.
The Serbian Academy of Sciences and Arts was founded
in 1887 and the Montenegro Academy of Sciences and
Arts in 1976.
Social impact of scienceMajor breakthroughs are one measure of the social
impact of scientific activity in a country. For example,
Croatian scientists have made significant contributions to
particle and nuclear physics, in haematopoietic stem cell
transplantation; genetic elements in the pathogenesis of
cancer; in mineralized tissue and in environmental and
marine research. For their part, Macedonian scientists
are highly productive in sustainable energy research,
environment and earthquake engineering, molecular
biology and genetic engineering. Serbian and Monte-
negrin scientists are making key contributions to
UNESCO SCIENCE REPORT 2005
TH
E S
TA
TE
OF
SC
IEN
CE
IN
TH
E W
OR
LD
110 UNESCO Science Report 2005 - ISBN 92-3-103967-9 - © UNESCO 2005
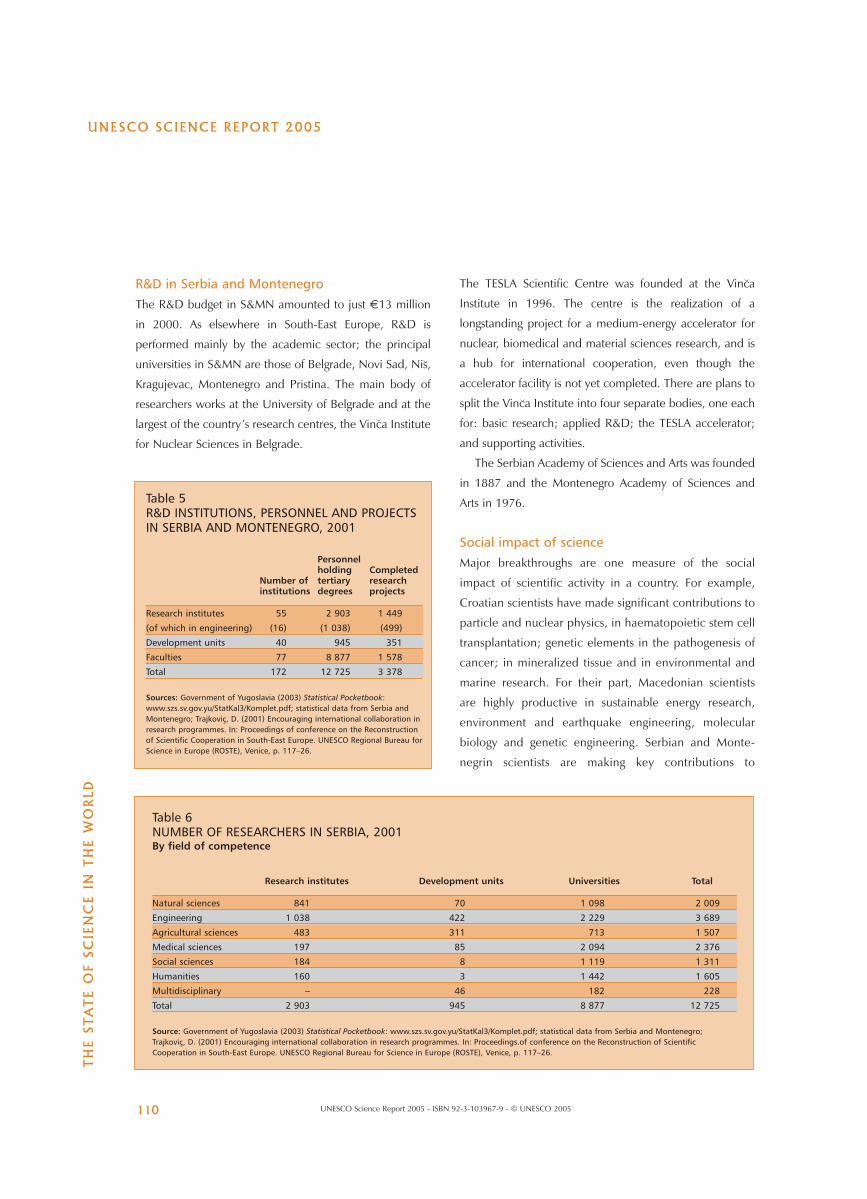
Table 5R&D INSTITUTIONS, PERSONNEL AND PROJECTSIN SERBIA AND MONTENEGRO, 2001
Personnel holding Completed
Number of tertiary research institutions degrees projects
Research institutes 55 2 903 1 449
(of which in engineering) (16) (1 038) (499)
Development units 40 945 351
Faculties 77 8 877 1 578
Total 172 12 725 3 378
Sources: Government of Yugoslavia (2003) Statistical Pocketbook:www.szs.sv.gov.yu/StatKal3/Komplet.pdf; statistical data from Serbia andMontenegro; Trajkoviç, D. (2001) Encouraging international collaboration inresearch programmes. In: Proceedings of conference on the Reconstructionof Scientific Cooperation in South-East Europe. UNESCO Regional Bureau forScience in Europe (ROSTE), Venice, p. 117–26.
Table 6NUMBER OF RESEARCHERS IN SERBIA, 2001By field of competence
Research institutes Development units Universities Total
Natural sciences 841 70 1 098 2 009
Engineering 1 038 422 2 229 3 689
Agricultural sciences 483 311 713 1 507
Medical sciences 197 85 2 094 2 376
Social sciences 184 8 1 119 1 311
Humanities 160 3 1 442 1 605
Multidisciplinary – 46 182 228
Total 2 903 945 8 877 12 725
Source: Government of Yugoslavia (2003) Statistical Pocketbook: www.szs.sv.gov.yu/StatKal3/Komplet.pdf; statistical data from Serbia and Montenegro;Trajkoviç, D. (2001) Encouraging international collaboration in research programmes. In: Proceedings.of conference on the Reconstruction of ScientificCooperation in South-East Europe. UNESCO Regional Bureau for Science in Europe (ROSTE), Venice, p. 117–26.
new materials and biotechnology; they have made
breakthroughs with regard to the molecular basis of
diseases and the development of new diagnostic and
therapeutic strategies.
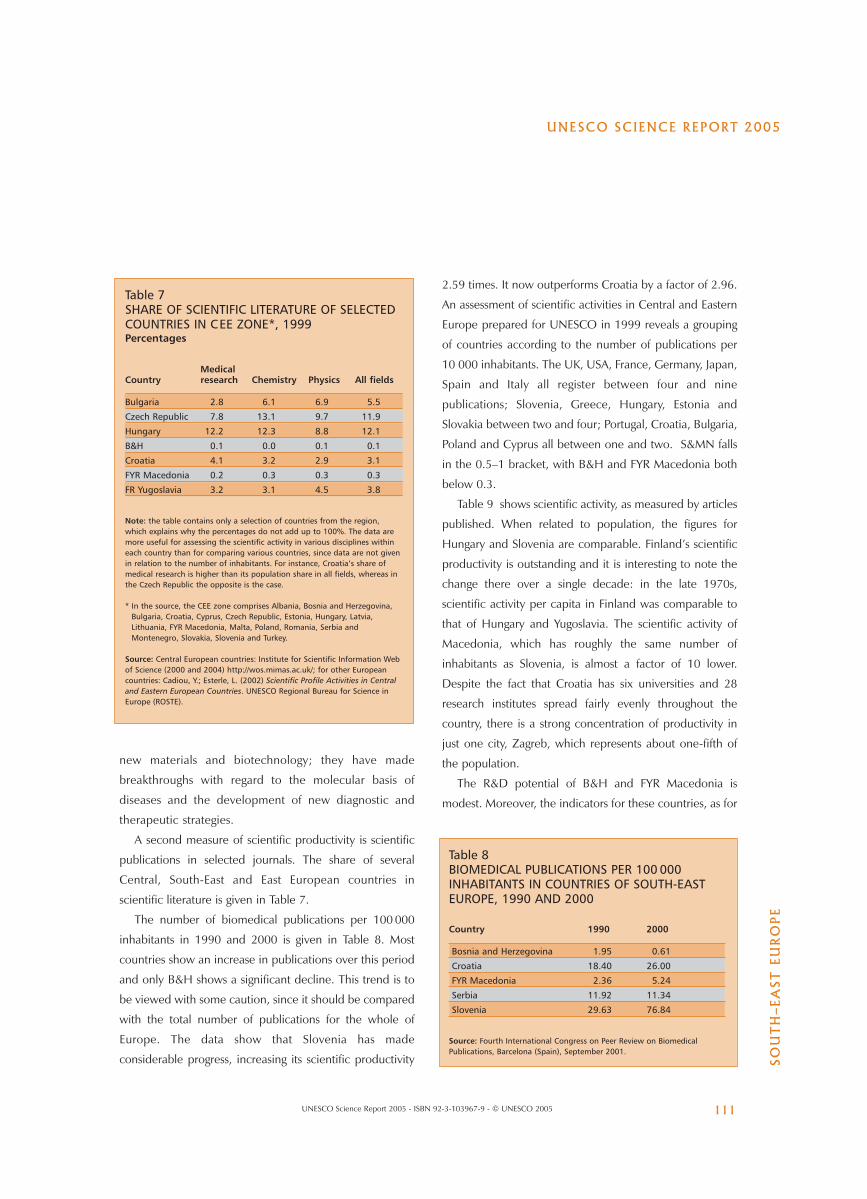
A second measure of scientific productivity is scientific
publications in selected journals. The share of several
Central, South-East and East European countries in
scientific literature is given in Table 7.
The number of biomedical publications per 100 000
inhabitants in 1990 and 2000 is given in Table 8. Most
countries show an increase in publications over this period
and only B&H shows a significant decline. This trend is to
be viewed with some caution, since it should be compared
with the total number of publications for the whole of
Europe. The data show that Slovenia has made
considerable progress, increasing its scientific productivity
2.59 times. It now outperforms Croatia by a factor of 2.96.
An assessment of scientific activities in Central and Eastern
Europe prepared for UNESCO in 1999 reveals a grouping
of countries according to the number of publications per
10 000 inhabitants. The UK, USA, France, Germany, Japan,
Spain and Italy all register between four and nine
publications; Slovenia, Greece, Hungary, Estonia and
Slovakia between two and four; Portugal, Croatia, Bulgaria,
Poland and Cyprus all between one and two. S&MN falls
in the 0.5–1 bracket, with B&H and FYR Macedonia both
below 0.3.
Table 9 shows scientific activity, as measured by articles
published. When related to population, the figures for
Hungary and Slovenia are comparable. Finland’s scientific
productivity is outstanding and it is interesting to note the
change there over a single decade: in the late 1970s,
scientific activity per capita in Finland was comparable to
that of Hungary and Yugoslavia. The scientific activity of
Macedonia, which has roughly the same number of
inhabitants as Slovenia, is almost a factor of 10 lower.
Despite the fact that Croatia has six universities and 28
research institutes spread fairly evenly throughout the
country, there is a strong concentration of productivity in
just one city, Zagreb, which represents about one-fifth of
the population.
The R&D potential of B&H and FYR Macedonia is
modest. Moreover, the indicators for these countries, as for
UNESCO SCIENCE REPORT 2005
SO
UT
H–E
AS
T E
UR
OP
E
111UNESCO Science Report 2005 - ISBN 92-3-103967-9 - © UNESCO 2005
Table 7SHARE OF SCIENTIFIC LITERATURE OF SELECTEDCOUNTRIES IN CEE ZONE*, 1999Percentages
MedicalCountry research Chemistry Physics All fields
Bulgaria 2.8 6.1 6.9 5.5
Czech Republic 7.8 13.1 9.7 11.9
Hungary 12.2 12.3 8.8 12.1
B&H 0.1 0.0 0.1 0.1
Croatia 4.1 3.2 2.9 3.1
FYR Macedonia 0.2 0.3 0.3 0.3
FR Yugoslavia 3.2 3.1 4.5 3.8
Note: the table contains only a selection of countries from the region,which explains why the percentages do not add up to 100%. The data aremore useful for assessing the scientific activity in various disciplines withineach country than for comparing various countries, since data are not givenin relation to the number of inhabitants. For instance, Croatia’s share ofmedical research is higher than its population share in all fields, whereas inthe Czech Republic the opposite is the case.
* In the source, the CEE zone comprises Albania, Bosnia and Herzegovina,Bulgaria, Croatia, Cyprus, Czech Republic, Estonia, Hungary, Latvia,Lithuania, FYR Macedonia, Malta, Poland, Romania, Serbia andMontenegro, Slovakia, Slovenia and Turkey.
Source: Central European countries: Institute for Scientific Information Webof Science (2000 and 2004) http://wos.mimas.ac.uk/; for other Europeancountries: Cadiou, Y.; Esterle, L. (2002) Scientific Profile Activities in Centraland Eastern European Countries. UNESCO Regional Bureau for Science inEurope (ROSTE).
Table 8BIOMEDICAL PUBLICATIONS PER 100 000INHABITANTS IN COUNTRIES OF SOUTH-EASTEUROPE, 1990 AND 2000
Country 1990 2000
Bosnia and Herzegovina 1.95 0.61
Croatia 18.40 26.00
FYR Macedonia 2.36 5.24
Serbia 11.92 11.34
Slovenia 29.63 76.84
Source: Fourth International Congress on Peer Review on BiomedicalPublications, Barcelona (Spain), September 2001.
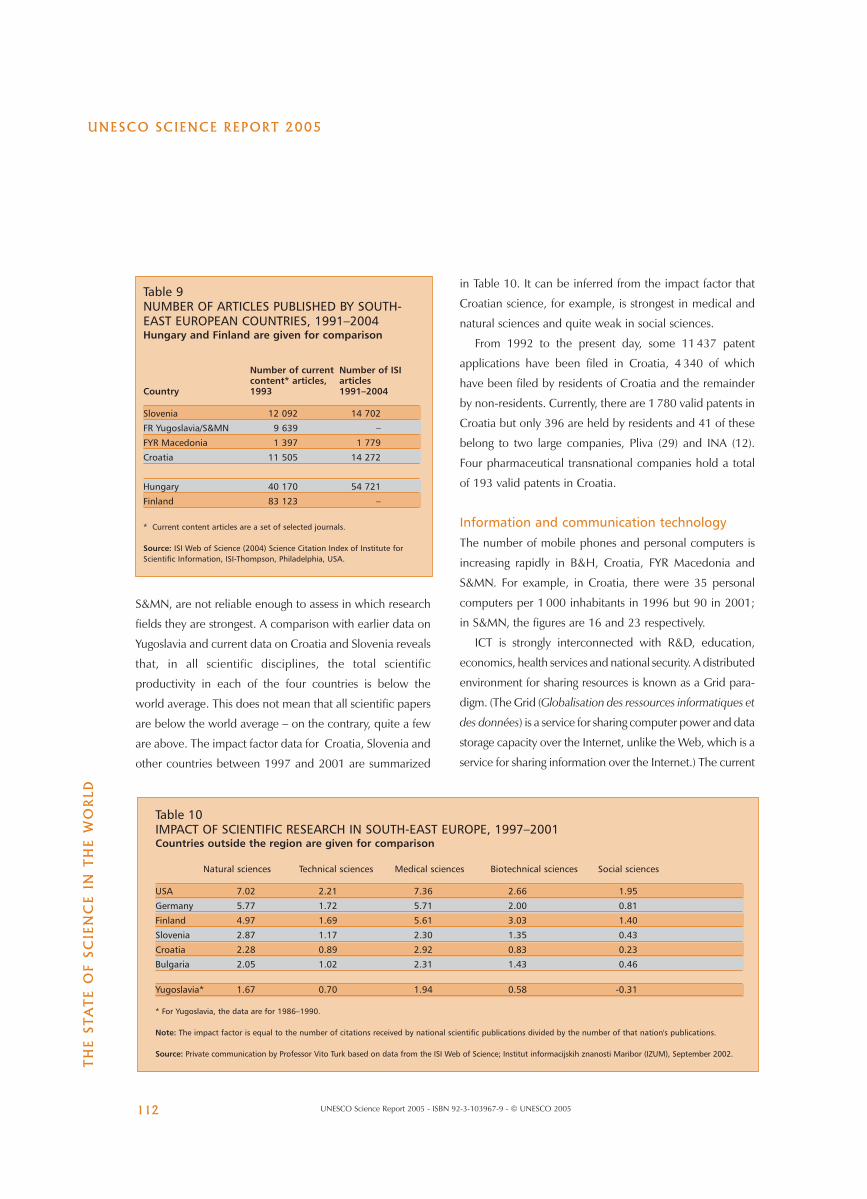
S&MN, are not reliable enough to assess in which research
fields they are strongest. A comparison with earlier data on
Yugoslavia and current data on Croatia and Slovenia reveals
that, in all scientific disciplines, the total scientific
productivity in each of the four countries is below the
world average. This does not mean that all scientific papers
are below the world average – on the contrary, quite a few
are above. The impact factor data for Croatia, Slovenia and
other countries between 1997 and 2001 are summarized
in Table 10. It can be inferred from the impact factor that
Croatian science, for example, is strongest in medical and
natural sciences and quite weak in social sciences.
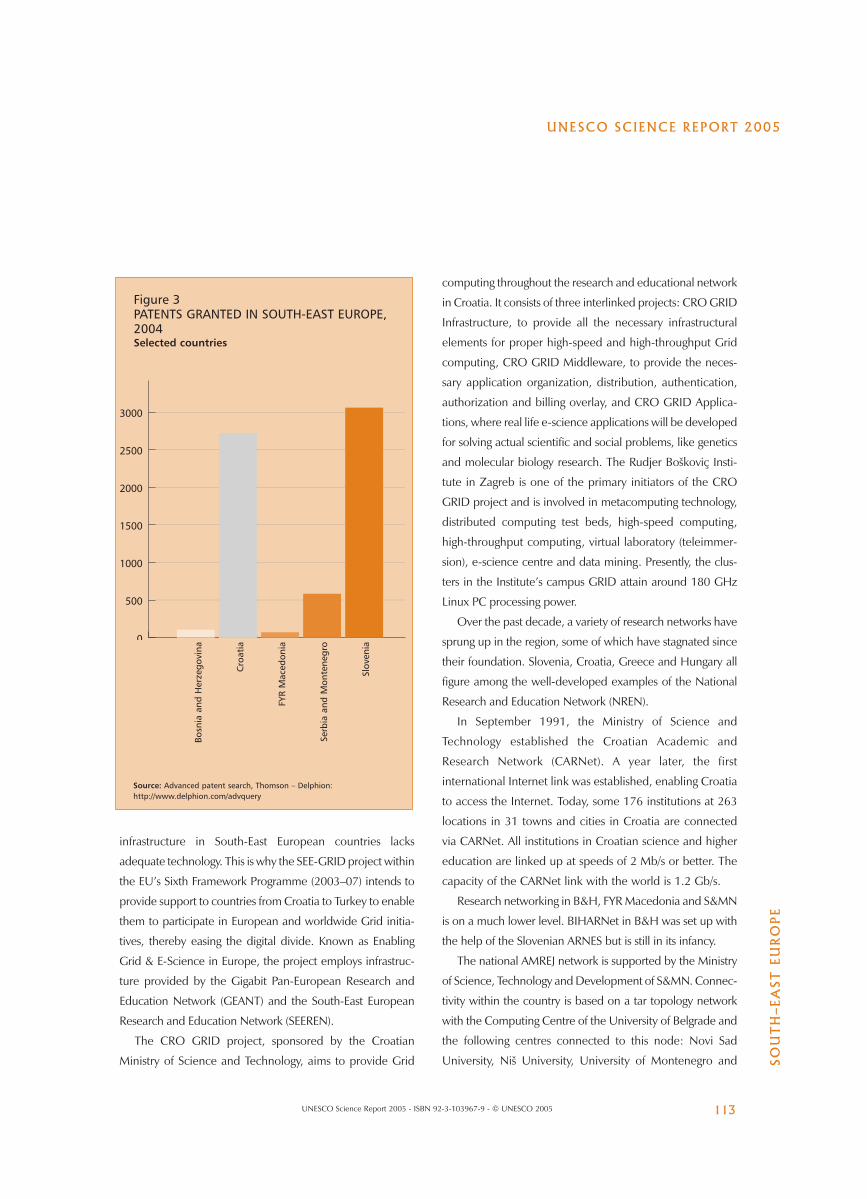
From 1992 to the present day, some 11 437 patent
applications have been filed in Croatia, 4 340 of which
have been filed by residents of Croatia and the remainder
by non-residents. Currently, there are 1 780 valid patents in
Croatia but only 396 are held by residents and 41 of these
belong to two large companies, Pliva (29) and INA (12).
Four pharmaceutical transnational companies hold a total
of 193 valid patents in Croatia.
Information and communication technologyThe number of mobile phones and personal computers is
increasing rapidly in B&H, Croatia, FYR Macedonia and
S&MN. For example, in Croatia, there were 35 personal
computers per 1 000 inhabitants in 1996 but 90 in 2001;
in S&MN, the figures are 16 and 23 respectively.
ICT is strongly interconnected with R&D, education,
economics, health services and national security. A distributed
environment for sharing resources is known as a Grid para-
digm. (The Grid (Globalisation des ressources informatiques et
des données) is a service for sharing computer power and data
storage capacity over the Internet, unlike the Web, which is a
service for sharing information over the Internet.) The current
UNESCO SCIENCE REPORT 2005
TH
E S
TA
TE
OF
SC
IEN
CE
IN
TH
E W
OR
LD
112 UNESCO Science Report 2005 - ISBN 92-3-103967-9 - © UNESCO 2005
Table 9NUMBER OF ARTICLES PUBLISHED BY SOUTH-EAST EUROPEAN COUNTRIES, 1991–2004Hungary and Finland are given for comparison
Number of current Number of ISI content* articles, articles
Country 1993 1991–2004
Slovenia 12 092 14 702
FR Yugoslavia/S&MN 9 639 –
FYR Macedonia 1 397 1 779
Croatia 11 505 14 272
Hungary 40 170 54 721
Finland 83 123 –
* Current content articles are a set of selected journals.
Source: ISI Web of Science (2004) Science Citation Index of Institute forScientific Information, ISI-Thompson, Philadelphia, USA.
Table 10IMPACT OF SCIENTIFIC RESEARCH IN SOUTH-EAST EUROPE, 1997–2001Countries outside the region are given for comparison
Natural sciences Technical sciences Medical sciences Biotechnical sciences Social sciences
USA 7.02 2.21 7.36 2.66 1.95
Germany 5.77 1.72 5.71 2.00 0.81
Finland 4.97 1.69 5.61 3.03 1.40
Slovenia 2.87 1.17 2.30 1.35 0.43
Croatia 2.28 0.89 2.92 0.83 0.23
Bulgaria 2.05 1.02 2.31 1.43 0.46
Yugoslavia* 1.67 0.70 1.94 0.58 -0.31
* For Yugoslavia, the data are for 1986–1990.
Note: The impact factor is equal to the number of citations received by national scientific publications divided by the number of that nation's publications.
Source: Private communication by Professor Vito Turk based on data from the ISI Web of Science; Institut informacijskih znanosti Maribor (IZUM), September 2002.
infrastructure in South-East European countries lacks
adequate technology. This is why the SEE-GRID project within
the EU’s Sixth Framework Programme (2003–07) intends to
provide support to countries from Croatia to Turkey to enable
them to participate in European and worldwide Grid initia-
tives, thereby easing the digital divide. Known as Enabling
Grid & E-Science in Europe, the project employs infrastruc-
ture provided by the Gigabit Pan-European Research and
Education Network (GEANT) and the South-East European
Research and Education Network (SEEREN).
The CRO GRID project, sponsored by the Croatian
Ministry of Science and Technology, aims to provide Grid
computing throughout the research and educational network
in Croatia. It consists of three interlinked projects: CRO GRID
Infrastructure, to provide all the necessary infrastructural
elements for proper high-speed and high-throughput Grid
computing, CRO GRID Middleware, to provide the neces-
sary application organization, distribution, authentication,
authorization and billing overlay, and CRO GRID Applica-
tions, where real life e-science applications will be developed
for solving actual scientific and social problems, like genetics
and molecular biology research. The Rudjer Boškoviç Insti-
tute in Zagreb is one of the primary initiators of the CRO
GRID project and is involved in metacomputing technology,
distributed computing test beds, high-speed computing,
high-throughput computing, virtual laboratory (teleimmer-
sion), e-science centre and data mining. Presently, the clus-
ters in the Institute’s campus GRID attain around 180 GHz
Linux PC processing power.
Over the past decade, a variety of research networks have
sprung up in the region, some of which have stagnated since
their foundation. Slovenia, Croatia, Greece and Hungary all
figure among the well-developed examples of the National
Research and Education Network (NREN).
In September 1991, the Ministry of Science and
Technology established the Croatian Academic and
Research Network (CARNet). A year later, the first
international Internet link was established, enabling Croatia
to access the Internet. Today, some 176 institutions at 263
locations in 31 towns and cities in Croatia are connected
via CARNet. All institutions in Croatian science and higher
education are linked up at speeds of 2 Mb/s or better. The
capacity of the CARNet link with the world is 1.2 Gb/s.
Research networking in B&H, FYR Macedonia and S&MN
is on a much lower level. BIHARNet in B&H was set up with
the help of the Slovenian ARNES but is still in its infancy.
The national AMREJ network is supported by the Ministry
of Science, Technology and Development of S&MN. Connec-
tivity within the country is based on a tar topology network
with the Computing Centre of the University of Belgrade and
the following centres connected to this node: Novi Sad
University, Niš University, University of Montenegro and
UNESCO SCIENCE REPORT 2005
SO
UT
H–E
AS
T E
UR
OP
E
113UNESCO Science Report 2005 - ISBN 92-3-103967-9 - © UNESCO 2005
Figure 3PATENTS GRANTED IN SOUTH-EAST EUROPE,2004Selected countries
Source: Advanced patent search, Thomson – Delphion:http://www.delphion.com/advquery
Bosn
ia a
nd H
erze
govi
na
Cro
atia
FYR
Mac
edon
ia
Serb
ia a
nd M
onte
negr
o
Slov
enia
0
500
1000
1500
2000
2500
3000
UNESCO SCIENCE REPORT 2005
TH
E S
TA
TE
OF
SC
IEN
CE
IN
TH
E W
OR
LD
114 UNESCO Science Report 2005 - ISBN 92-3-103967-9 - © UNESCO 2005
University of Kragujevac (2 Mb/s). AMREJ has international
connectivity to the Greek network (GRNet) of 2 Mb/s.
FYR Macedonia’s Academic and Research Network
(MARNet) at Ss. Cyril and Methodius University in Skopje
became operational within the NATO Science Programme
and GRNet in June 1995 at 64 Kb/s.
BULGARIAEconomic and political reforms in Bulgaria launched in
1990 were delayed throughout the decade by political
instability, with a turnover of seven governments and five
parliaments between 1990 and 1997 which made for a
discontinuity in economic and legislative measures.
Reforms in R&D likewise suffered.
Things began looking up for S&T in 1999. Bulgaria
entered a new phase of reform with the introduction of the
Currency Board, which brought both financial and political
stability. However, the most important factor has been the
enlargement of the EU. In 1999, Bulgaria began
negotiations to join the EU and to fulfil the requirements
for membership; this has had a considerable impact on the
country’s R&D system.
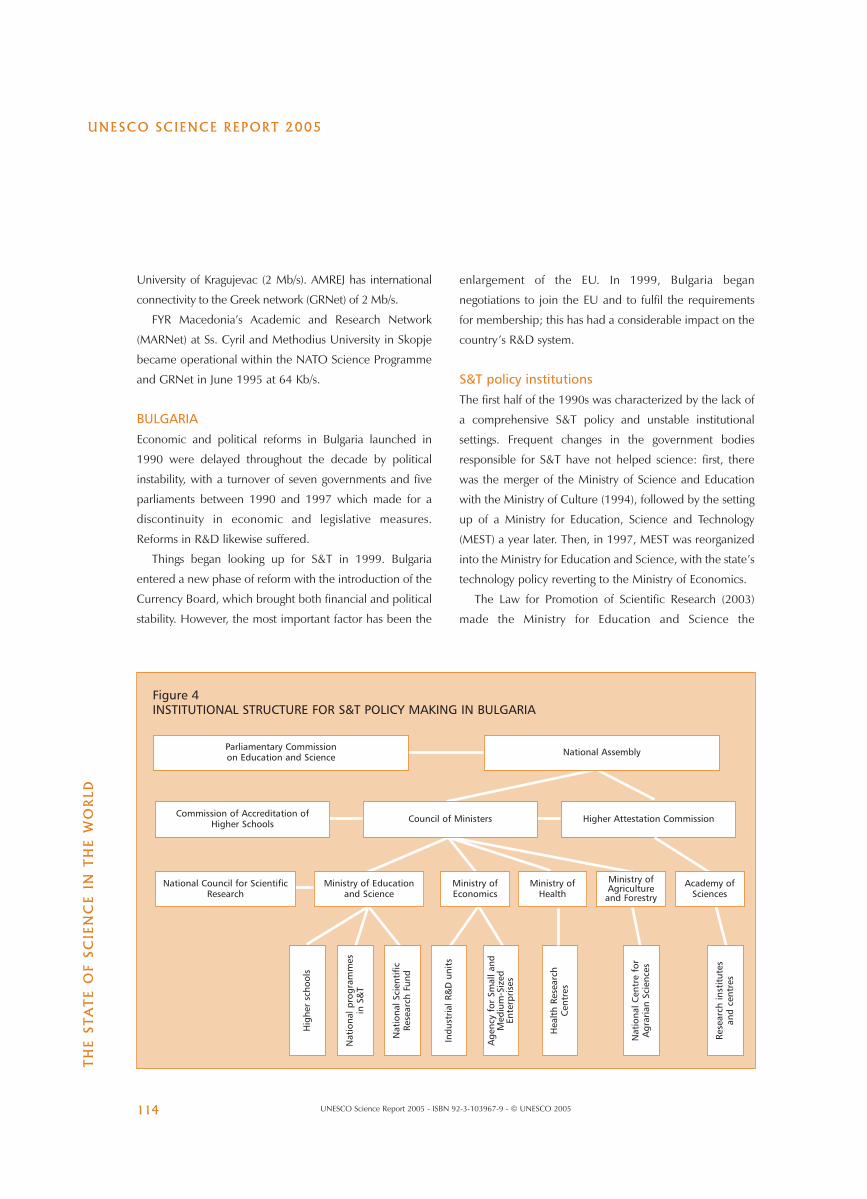
S&T policy institutionsThe first half of the 1990s was characterized by the lack of
a comprehensive S&T policy and unstable institutional
settings. Frequent changes in the government bodies
responsible for S&T have not helped science: first, there
was the merger of the Ministry of Science and Education
with the Ministry of Culture (1994), followed by the setting
up of a Ministry for Education, Science and Technology
(MEST) a year later. Then, in 1997, MEST was reorganized
into the Ministry for Education and Science, with the state’s
technology policy reverting to the Ministry of Economics.
The Law for Promotion of Scientific Research (2003)
made the Ministry for Education and Science the
Figure 4 INSTITUTIONAL STRUCTURE FOR S&T POLICY MAKING IN BULGARIA
Higher Attestation Commission
Hea
lth
Rese
arch
Cen
tres
Council of Ministers
Parliamentary Commissionon Education and Science
Ministry of Educationand Science
National Council for ScientificResearch
Hig
her
scho
ols
Nat
iona
l pro
gram
mes
in S
&T
Nat
iona
l Sci
enti
ficRe
sear
ch F
und
Indu
stri
al R
&D
unit
s
Age
ncy
for
Smal
l and
Med
ium
-Siz
edEn
terp
rise
s
Nat
iona
l Cen
tre
for
Agr
aria
n Sc
ienc
es
Rese
arch
inst
itut
es
and
cent
res
Ministry ofHealth
Ministry ofAgricultureand Forestry
Academy ofSciences
Commission of Accreditation ofHigher Schools
National Assembly
Ministry ofEconomics
Agriculture was abolished, has been tied to the Ministry of
Agriculture and Forestry, and the seven national research
centres set up to conduct medical research after the closure
of the Medical Academy are attached to the Ministry of
Health Care. In preparation of strategic decisions on
applied research, the respective ministries are involved.
In January 2003, the government adopted five priority
national programmes in S&T. These programmes are each
implemented by two or more ministries, with the Ministry
for Education and Science being responsible for
coordinating implementation. The five programmes are:
information society; genomics; nanotechnologies and new
materials; Bulgarian society – part of Europe and the world;
and space research, science and society, sustainable
development, global change and ecosystems.
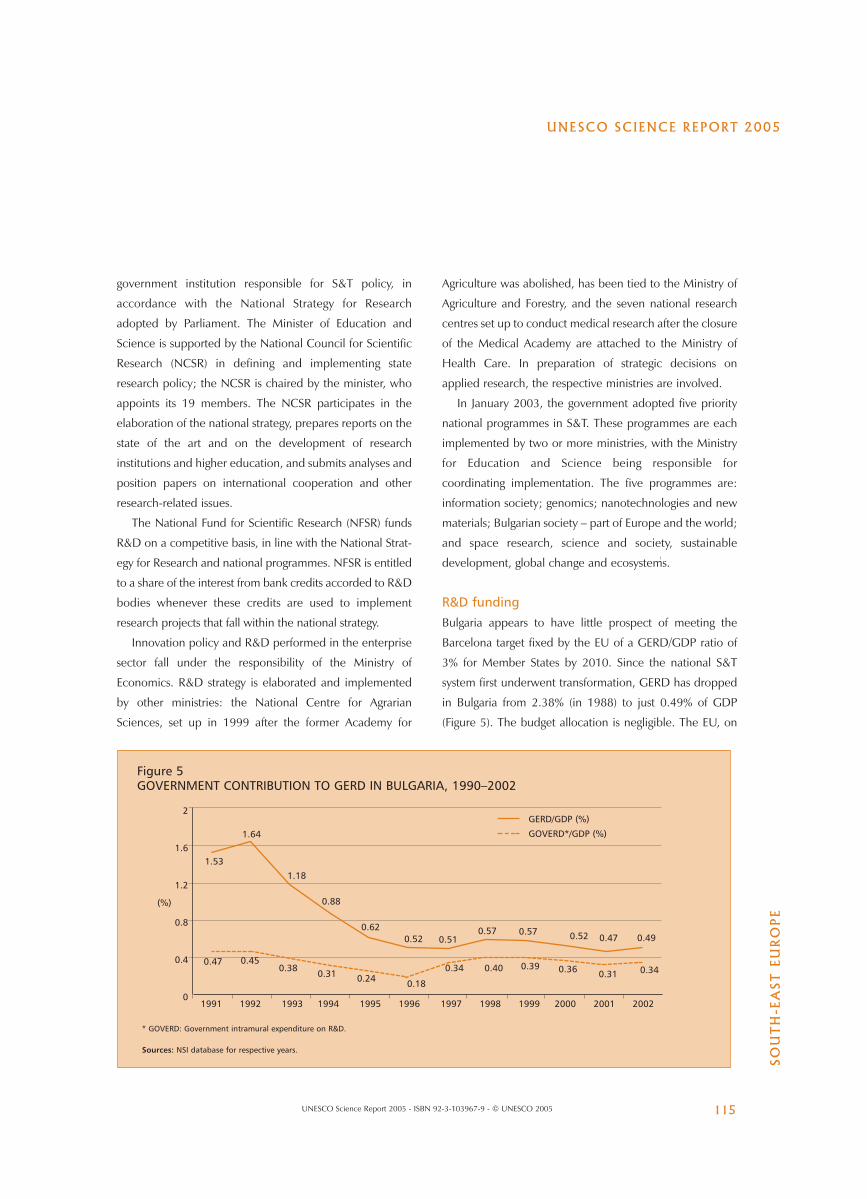
R&D fundingBulgaria appears to have little prospect of meeting the
Barcelona target fixed by the EU of a GERD/GDP ratio of
3% for Member States by 2010. Since the national S&T
system first underwent transformation, GERD has dropped
in Bulgaria from 2.38% (in 1988) to just 0.49% of GDP
(Figure 5). The budget allocation is negligible. The EU, on
government institution responsible for S&T policy, in
accordance with the National Strategy for Research
adopted by Parliament. The Minister of Education and
Science is supported by the National Council for Scientific
Research (NCSR) in defining and implementing state
research policy; the NCSR is chaired by the minister, who
appoints its 19 members. The NCSR participates in the
elaboration of the national strategy, prepares reports on the
state of the art and on the development of research
institutions and higher education, and submits analyses and
position papers on international cooperation and other
research-related issues.
The National Fund for Scientific Research (NFSR) funds
R&D on a competitive basis, in line with the National Strat-
egy for Research and national programmes. NFSR is entitled
to a share of the interest from bank credits accorded to R&D
bodies whenever these credits are used to implement
research projects that fall within the national strategy.
Innovation policy and R&D performed in the enterprise
sector fall under the responsibility of the Ministry of
Economics. R&D strategy is elaborated and implemented
by other ministries: the National Centre for Agrarian
Sciences, set up in 1999 after the former Academy for
Figure 5GOVERNMENT CONTRIBUTION TO GERD IN BULGARIA, 1990–2002
2
1.6
1.2
0.8
0.4
01991 1992 1993 1994 1995 1996 1997 1998 1999 2000 2001 2002
GERD/GDP (%)
GOVERD*/GDP (%)
1.53
0.47 0.450.38
0.31 0.24 0.18
0.34 0.40 0.39 0.36 0.31 0.34
1.64
1.18
0.88
0.620.52 0.51
0.57 0.57 0.52 0.47 0.49
* GOVERD: Government intramural expenditure on R&D.
Sources: NSI database for respective years.
UNESCO SCIENCE REPORT 2005
SO
UT
H-E
AS
T E
UR
OP
E
115UNESCO Science Report 2005 - ISBN 92-3-103967-9 - © UNESCO 2005
(%)
UNESCO SCIENCE REPORT 2005
TH
E S
TA
TE
OF
SC
IEN
CE
IN
TH
E W
OR
LD
116 UNESCO Science Report 2005 - ISBN 92-3-103967-9 - © UNESCO 2005
the other hand, already devotes 1.8% of GDP on average
to R&D (see page 87).
According to EUROSTAT, the proportion of business
expenditure on R&D (BERD) to total GERD amounted to
only 18.6% in 1998. This did not even match the level of
BERD in Bulgaria in the 1980s. For the knowledge base of
industry to broaden and for an innovation policy to take
shape, the share of BERD will need to rise. This does seem
to be happening: by 2001 BERD represented 24.4% of
total expenditure. For its part, government expenditure
dropped over the same period from as much as 76.2% of
GERD to 62.2% by 2001.
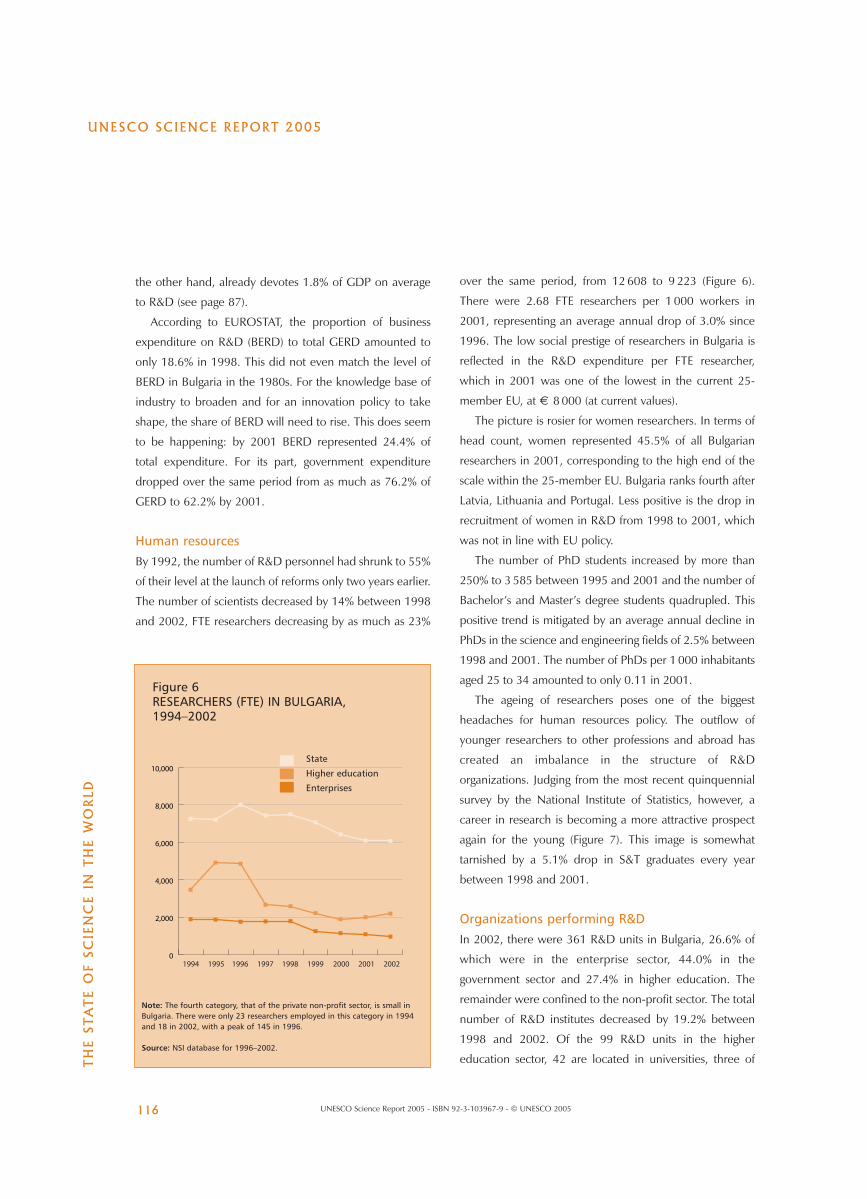
Human resourcesBy 1992, the number of R&D personnel had shrunk to 55%
of their level at the launch of reforms only two years earlier.
The number of scientists decreased by 14% between 1998
and 2002, FTE researchers decreasing by as much as 23%
over the same period, from 12 608 to 9 223 (Figure 6).
There were 2.68 FTE researchers per 1 000 workers in
2001, representing an average annual drop of 3.0% since
1996. The low social prestige of researchers in Bulgaria is
reflected in the R&D expenditure per FTE researcher,
which in 2001 was one of the lowest in the current 25-
member EU, at € 8 000 (at current values).
The picture is rosier for women researchers. In terms of
head count, women represented 45.5% of all Bulgarian
researchers in 2001, corresponding to the high end of the
scale within the 25-member EU. Bulgaria ranks fourth after
Latvia, Lithuania and Portugal. Less positive is the drop in
recruitment of women in R&D from 1998 to 2001, which
was not in line with EU policy.
The number of PhD students increased by more than
250% to 3 585 between 1995 and 2001 and the number of
Bachelor’s and Master’s degree students quadrupled. This
positive trend is mitigated by an average annual decline in
PhDs in the science and engineering fields of 2.5% between
1998 and 2001. The number of PhDs per 1 000 inhabitants
aged 25 to 34 amounted to only 0.11 in 2001.
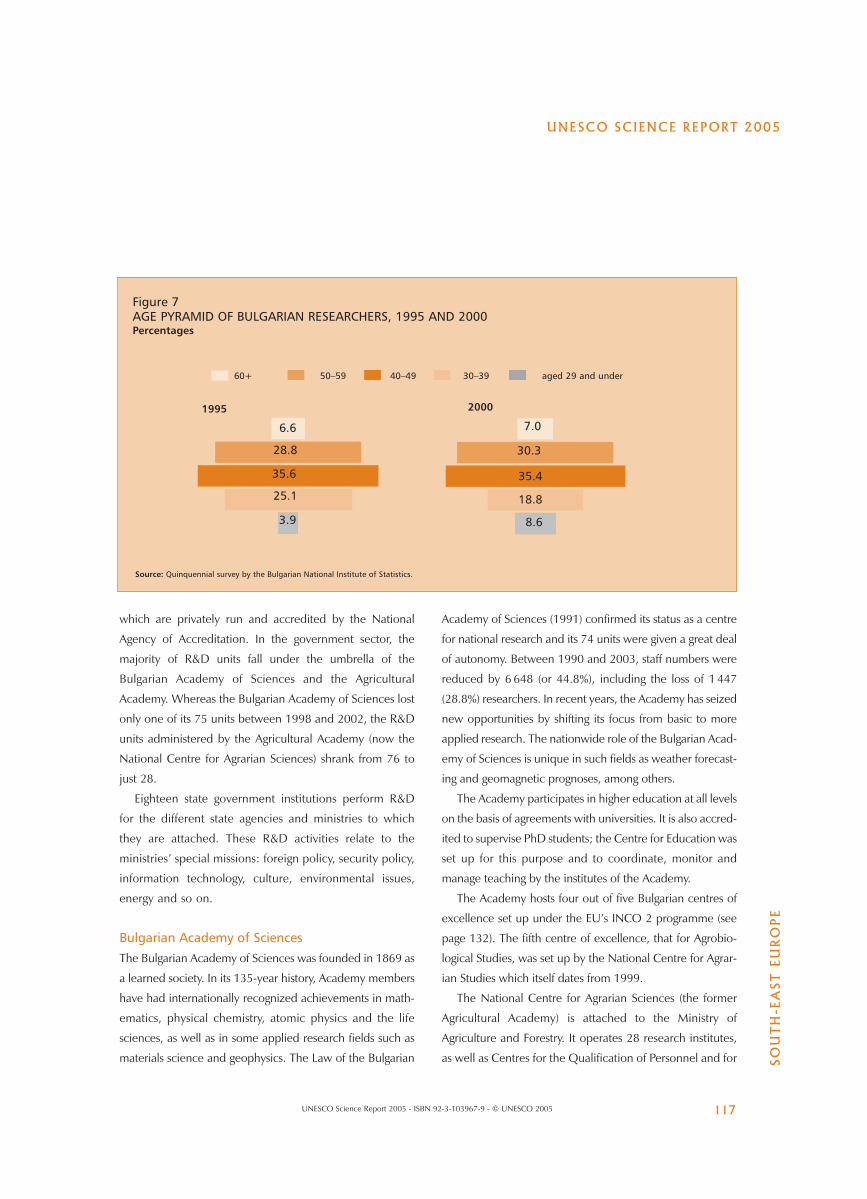
The ageing of researchers poses one of the biggest
headaches for human resources policy. The outflow of
younger researchers to other professions and abroad has
created an imbalance in the structure of R&D
organizations. Judging from the most recent quinquennial
survey by the National Institute of Statistics, however, a
career in research is becoming a more attractive prospect
again for the young (Figure 7). This image is somewhat
tarnished by a 5.1% drop in S&T graduates every year
between 1998 and 2001.
Organizations performing R&DIn 2002, there were 361 R&D units in Bulgaria, 26.6% of
which were in the enterprise sector, 44.0% in the
government sector and 27.4% in higher education. The
remainder were confined to the non-profit sector. The total
number of R&D institutes decreased by 19.2% between
1998 and 2002. Of the 99 R&D units in the higher
education sector, 42 are located in universities, three of
Figure 6RESEARCHERS (FTE) IN BULGARIA,1994–2002
Note: The fourth category, that of the private non-profit sector, is small inBulgaria. There were only 23 researchers employed in this category in 1994and 18 in 2002, with a peak of 145 in 1996.
Source: NSI database for 1996–2002.
0
2,000
4,000
6,000
8,000
10,000
1994 1995 1996 1997 1998 1999 2000 2001 2002
State
Higher education
Enterprises
UNESCO SCIENCE REPORT 2005
SO
UT
H-E
AS
T E
UR
OP
E
117UNESCO Science Report 2005 - ISBN 92-3-103967-9 - © UNESCO 2005
which are privately run and accredited by the National
Agency of Accreditation. In the government sector, the
majority of R&D units fall under the umbrella of the
Bulgarian Academy of Sciences and the Agricultural
Academy. Whereas the Bulgarian Academy of Sciences lost
only one of its 75 units between 1998 and 2002, the R&D
units administered by the Agricultural Academy (now the
National Centre for Agrarian Sciences) shrank from 76 to
just 28.
Eighteen state government institutions perform R&D
for the different state agencies and ministries to which
they are attached. These R&D activities relate to the
ministries’ special missions: foreign policy, security policy,
information technology, culture, environmental issues,
energy and so on.
Bulgarian Academy of SciencesThe Bulgarian Academy of Sciences was founded in 1869 as
a learned society. In its 135-year history, Academy members
have had internationally recognized achievements in math-
ematics, physical chemistry, atomic physics and the life
sciences, as well as in some applied research fields such as
materials science and geophysics. The Law of the Bulgarian
Academy of Sciences (1991) confirmed its status as a centre
for national research and its 74 units were given a great deal
of autonomy. Between 1990 and 2003, staff numbers were
reduced by 6 648 (or 44.8%), including the loss of 1 447
(28.8%) researchers. In recent years, the Academy has seized
new opportunities by shifting its focus from basic to more
applied research. The nationwide role of the Bulgarian Acad-
emy of Sciences is unique in such fields as weather forecast-
ing and geomagnetic prognoses, among others.
The Academy participates in higher education at all levels
on the basis of agreements with universities. It is also accred-
ited to supervise PhD students; the Centre for Education was
set up for this purpose and to coordinate, monitor and
manage teaching by the institutes of the Academy.
The Academy hosts four out of five Bulgarian centres of
excellence set up under the EU’s INCO 2 programme (see
page 132). The fifth centre of excellence, that for Agrobio-
logical Studies, was set up by the National Centre for Agrar-
ian Studies which itself dates from 1999.
The National Centre for Agrarian Sciences (the former
Agricultural Academy) is attached to the Ministry of
Agriculture and Forestry. It operates 28 research institutes,
as well as Centres for the Qualification of Personnel and for
Figure 7AGE PYRAMID OF BULGARIAN RESEARCHERS, 1995 AND 2000Percentages
Source: Quinquennial survey by the Bulgarian National Institute of Statistics.
60+ 50–59 40–49 30–39 aged 29 and under
6.6
28.8
35.6
25.1
3.9
7.0
30.3
35.4
18.8
8.6
1995 2000
UNESCO SCIENCE REPORT 2005
TH
E S
TA
TE
OF
SC
IEN
CE
IN
TH
E W
OR
LD
118 UNESCO Science Report 2005 - ISBN 92-3-103967-9 - © UNESCO 2005
Scientific and Technical Information, and the National
Museum of Agriculture.
Research outputThe share of Bulgarian authorship in international
publications has stabilized to approximately 0.2% of those
listed in the SCI database: in 1990 1 407 Bulgarian
publications were cited. Eight years later, the number was
still comparable but it dropped significantly in 2001.
Behind this decline lie the migration of productive
researchers and the removal of the one Bulgarian journal
that had been on the list used by the Institute for Scientific
Information in Philadelphia (USA). Recovery seems to have
begun in 2003 when 1 420 Bulgarian publications were
cited in the ISI database.
Since 1990, Bulgarian scientists have tended to co-
author publications with scientists from Germany, the USA,
France and Italy to the detriment of Russia. Russia has fallen
from being the primary partner to ranking fifth. The
geography of joint publications today extends to new
partners such as India, the Republic of Korea, Japan,
Canada and Australia. The Bulgarian Academy of Sciences
accounts for more than 60% of international publications
co-signed by Bulgarian authors.
Bulgaria’s specialization by field of research covers
applied physics, physical chemistry, materials science and
organic chemistry. Bulgaria’s share in international co-
authorship has increased in the biological sciences, physics,
chemistry and Earth sciences.
Patent activity has fallen off in the past decade. There
was an average of 16.4 patent applications per year to the
European Patent Office (EPO) in 1985–89 but this had
dropped to 7.2 by 1990–94. The US Patent and Trademark
Office (USPTO) granted 27 Bulgarian patents in 1990 but
only 1 in 1995. There is, however, a glimmer of hope:
patent applications to EPO amounted to 1.0 per million
inhabitants in 2000, representing a 5.7% growth rate
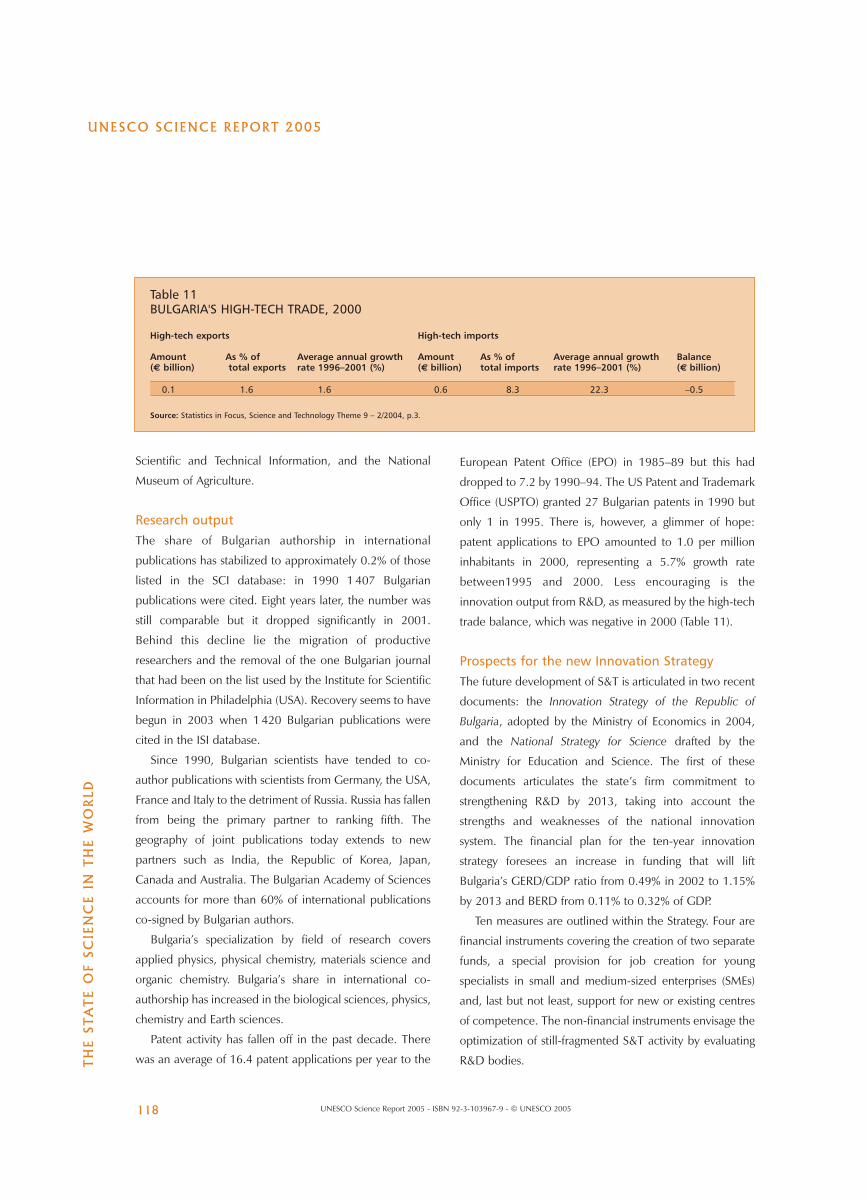
between1995 and 2000. Less encouraging is the
innovation output from R&D, as measured by the high-tech
trade balance, which was negative in 2000 (Table 11).
Prospects for the new Innovation StrategyThe future development of S&T is articulated in two recent
documents: the Innovation Strategy of the Republic of
Bulgaria, adopted by the Ministry of Economics in 2004,
and the National Strategy for Science drafted by the
Ministry for Education and Science. The first of these
documents articulates the state’s firm commitment to
strengthening R&D by 2013, taking into account the
strengths and weaknesses of the national innovation
system. The financial plan for the ten-year innovation
strategy foresees an increase in funding that will lift
Bulgaria’s GERD/GDP ratio from 0.49% in 2002 to 1.15%
by 2013 and BERD from 0.11% to 0.32% of GDP.
Ten measures are outlined within the Strategy. Four are
financial instruments covering the creation of two separate
funds, a special provision for job creation for young
specialists in small and medium-sized enterprises (SMEs)
and, last but not least, support for new or existing centres
of competence. The non-financial instruments envisage the
optimization of still-fragmented S&T activity by evaluating
R&D bodies.
Table 11BULGARIA'S HIGH-TECH TRADE, 2000
High-tech exports High-tech imports
Amount As % of Average annual growth Amount As % of Average annual growth Balance(€ billion) total exports rate 1996–2001 (%) (€ billion) total imports rate 1996–2001 (%) (€ billion)
0.1 1.6 1.6 0.6 8.3 22.3 –0.5
Source: Statistics in Focus, Science and Technology Theme 9 – 2/2004, p.3.
ROMANIAThe reforms of Romania’s science system follow much the
same pattern as in the other Central and Eastern European
countries. S&T policy has become more active in Romania
since 2001 as result of the invitation to negotiate
membership of the EU and the adoption of a number of
policy documents. These trends reflect the country’s
acceptance of the acquis communautaire about science
and research, which itself coincides with the strategic
reorganization of a number of government bodies
overseeing S&T.
Romania has set six strategic goals for S&T: to intensify
the economic and social impact of R&D in the public
sector; increase the amount of public and private funds
allotted to R&D and innovation; carry out institutional
reforms; develop the R&D infrastructure; stimulate
enterprise R&D; and integrate Romanian R&D into the
European Research Area.
National S&T policy institutionsThe Ministry of National Education and the National
Agency for Science, Technology and Innovation merged in
2001 to form the Ministry of Education and Research,
which was itself renamed the Ministry of Education,
Research and Youth (MERY) two years later. The mission of
the latter is to elaborate, apply, monitor and evaluate
policies for research, development and innovation. The
Ministry distributes 71% of the country’s total R&D
expenditure through three national programmes: the
National Plan for R&D, updated in 2001 and extended to
2005 (55% of total MERY funding); the Horizon 2000
Programme, extended to 2002 (40%); and the Grant
Programme for Scientific Research (5%).
The latest developments in science are the fruit of two
pieces of legislation, the Law on Scientific Research and Tech-
nological Development and the Law on the Status of Research
and Development Personnel, both adopted in 2002.
UNESCO SCIENCE REPORT 2005
SO
UT
H-E
AS
T E
UR
OP
E
119UNESCO Science Report 2005 - ISBN 92-3-103967-9 - © UNESCO 2005
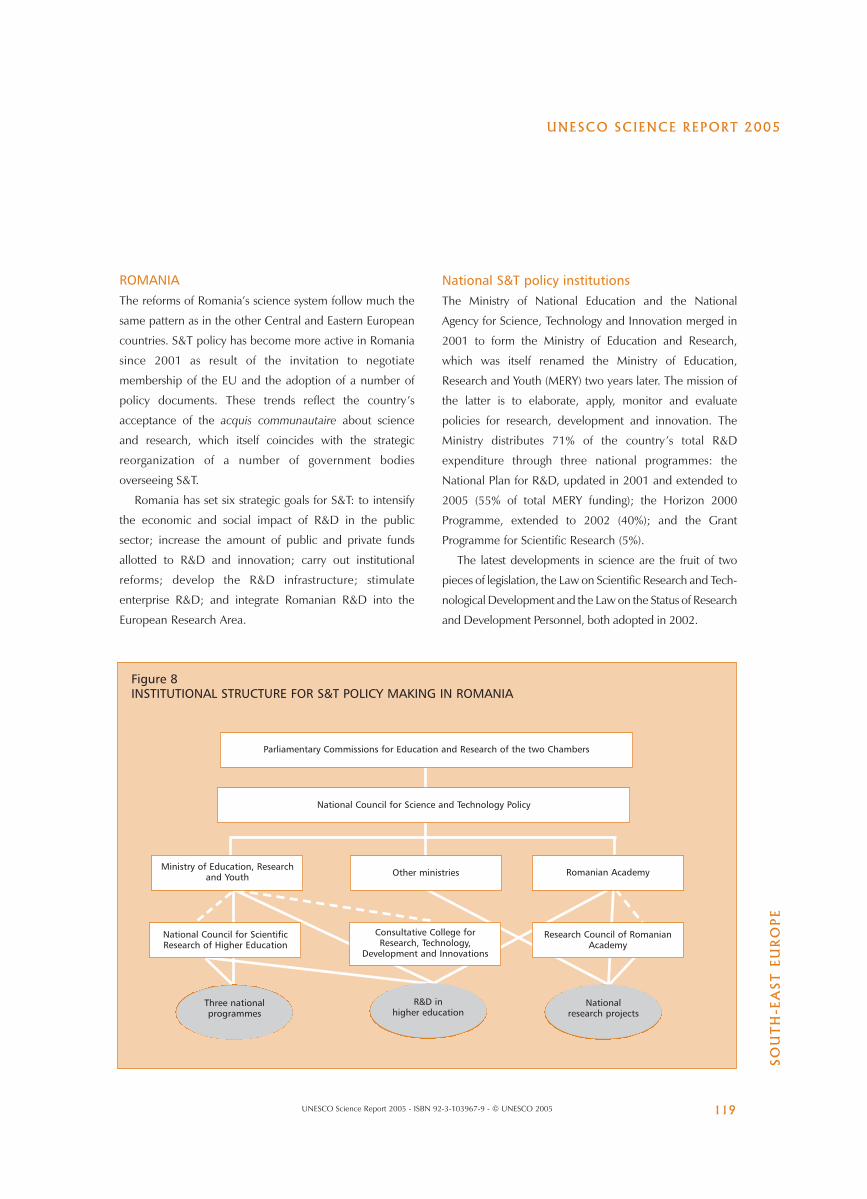
Figure 8INSTITUTIONAL STRUCTURE FOR S&T POLICY MAKING IN ROMANIA
National Council for ScientificResearch of Higher Education
Consultative College forResearch, Technology,
Development and Innovations
Research Council of RomanianAcademy
Other ministries Romanian AcademyMinistry of Education, Research
and Youth
R&D in higher education
Nationalresearch projects
Three national programmes
Parliamentary Commissions for Education and Research of the two Chambers
National Council for Science and Technology Policy
UNESCO SCIENCE REPORT 2005
TH
E S
TA
TE
OF
SC
IEN
CE
IN
TH
E W
OR
LD
120 UNESCO Science Report 2005 - ISBN 92-3-103967-9 - © UNESCO 2005
The main government body is the National Council for
Science and Technology Policy (CISTI). It is responsible for
setting strategic priorities in S&T and defining national R&D
policy. Within the new R&D policy, a range of important
institutions has been created: the National Centre for
Programme Management, subordinated to MERY; the
National Council for Research Certification, a unitary system
responsible for the country’s research institutes and staff
evaluation; and, last but not least, the Investment Company
for Technological Transfer, an organization mandated to take
the risks inherent in marketing the application of research
results, in both products and services.
The picture would not be complete without the
Romanian Academy, a long-standing body which performs
most of the country’s basic and applied research. The
Academy runs 68 R&D institutes active in natural sciences
and mathematics, technical sciences, life sciences, social
sciences and humanities. Of the Academy’s total staff of
approximately 4 000 employees, 2 600 are researchers,
including almost 2 000 certified researchers. The
Academy’s expenditure on R&D represents 18% of GERD.
The Romanian Academy coordinates two national
programmes: the Priority and Basic Research Projects and
the Grant Programme for Scientific Research mentioned
earlier.
Institutions performing R&DIn 2002, there were nearly 590 units performing R&D in
Romania: 34 national R&D institutes, 18 of which were
subordinated to MERY and the remainder to 7 other
ministries; 227 public institutions subordinated to MERY,
the Romanian Academy and the Academy for Agricultural
and Forestry Sciences; 15 R&D institutes operating on the
basis of a government decree from 1991, which were being
reorganized in 2004; and 310 joint-stock companies,
public or private companies with R&D as a main activity.
The sector of applied industrial research has been
restructured. From 1995 to 2000, changes in ownership in
the industrial R&D units brought about an increase in the
private sector’s role: private units rose from 64 out of 454
(14%) to 201 out of 439 (46%). By 1999, the private sector
accounted for 18.6% of total employment in R&D.
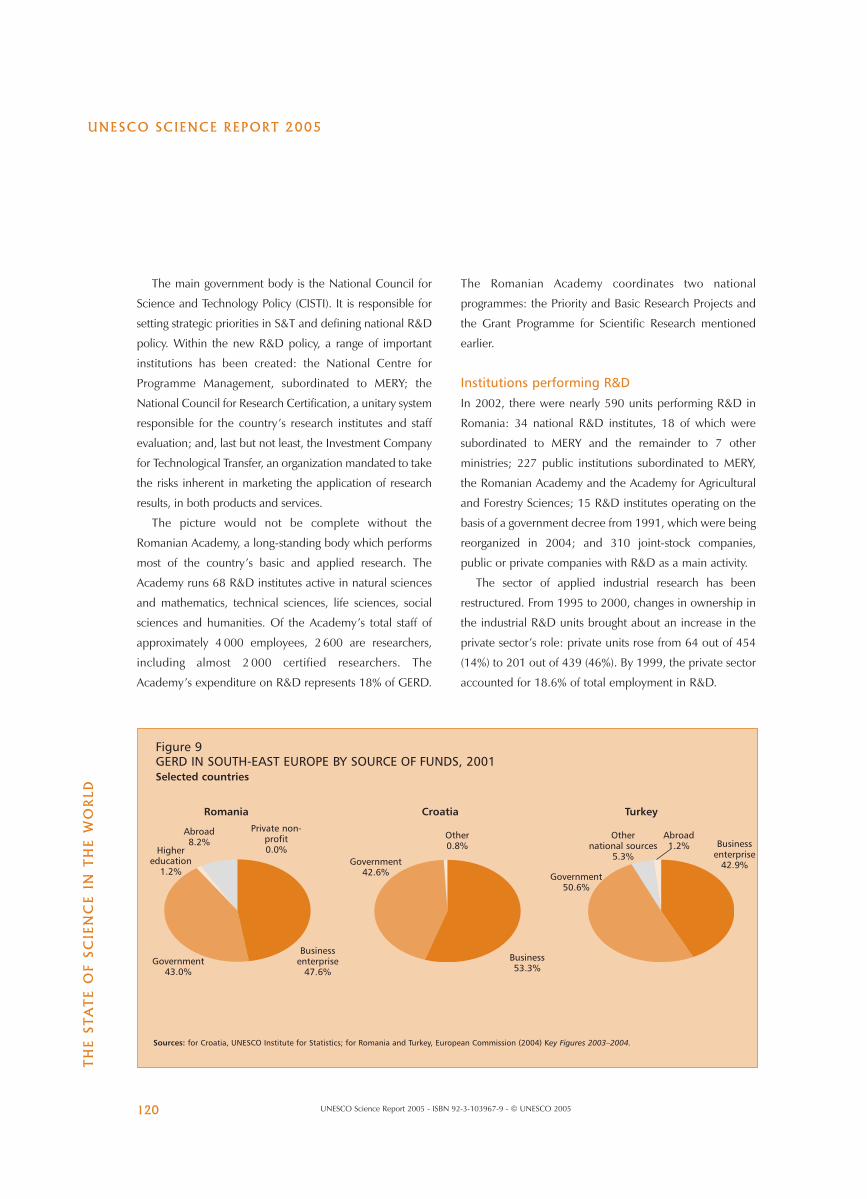
Figure 9GERD IN SOUTH-EAST EUROPE BY SOURCE OF FUNDS, 2001Selected countries
Sources: for Croatia, UNESCO Institute for Statistics; for Romania and Turkey, European Commission (2004) Key Figures 2003–2004.
Abroad8.2%
Abroad1.2%
Other0.8%
Othernational sources
5.3%
Private non-profit0.0%
Businessenterprise
47.6%
Businessenterprise
42.9%
Business53.3%
Government43.0%
Government42.6% Government
50.6%
Highereducation
1.2%
Romania Croatia Turkey
UNESCO SCIENCE REPORT 2005
SO
UT
H-E
AS
T E
UR
OP
E
121UNESCO Science Report 2005 - ISBN 92-3-103967-9 - © UNESCO 2005
The university sector includes 49 state and 68 private
institutions; 18 of the latter are accredited universities.
Funding of R&DSince 1990, GERD has shrunk in Romania, as in all
countries of the region. In 2001, Romania invested
€176.5 million in R&D, or the equivalent of 0.39% of GDP.
In 1997–2001, R&D fell on average by 9.2% each year. The
government budget allocation to R&D represented 0.17%
of GERD in 2003, a negligible amount, following annual
declines (of 6.0%) between 1997 and 2003.
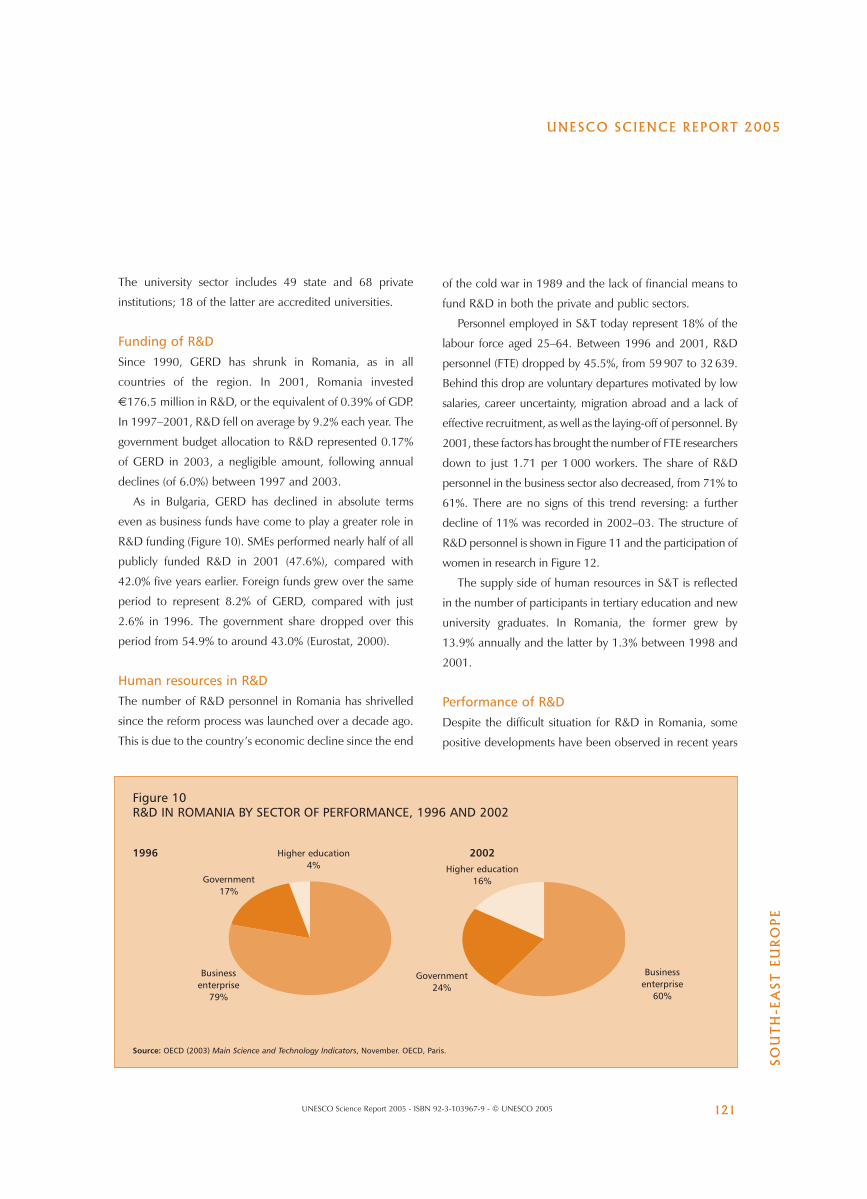
As in Bulgaria, GERD has declined in absolute terms
even as business funds have come to play a greater role in
R&D funding (Figure 10). SMEs performed nearly half of all
publicly funded R&D in 2001 (47.6%), compared with
42.0% five years earlier. Foreign funds grew over the same
period to represent 8.2% of GERD, compared with just
2.6% in 1996. The government share dropped over this
period from 54.9% to around 43.0% (Eurostat, 2000).
Human resources in R&DThe number of R&D personnel in Romania has shrivelled
since the reform process was launched over a decade ago.
This is due to the country’s economic decline since the end
of the cold war in 1989 and the lack of financial means to
fund R&D in both the private and public sectors.
Personnel employed in S&T today represent 18% of the
labour force aged 25–64. Between 1996 and 2001, R&D
personnel (FTE) dropped by 45.5%, from 59 907 to 32 639.
Behind this drop are voluntary departures motivated by low
salaries, career uncertainty, migration abroad and a lack of
effective recruitment, as well as the laying-off of personnel. By
2001, these factors has brought the number of FTE researchers
down to just 1.71 per 1 000 workers. The share of R&D
personnel in the business sector also decreased, from 71% to
61%. There are no signs of this trend reversing: a further
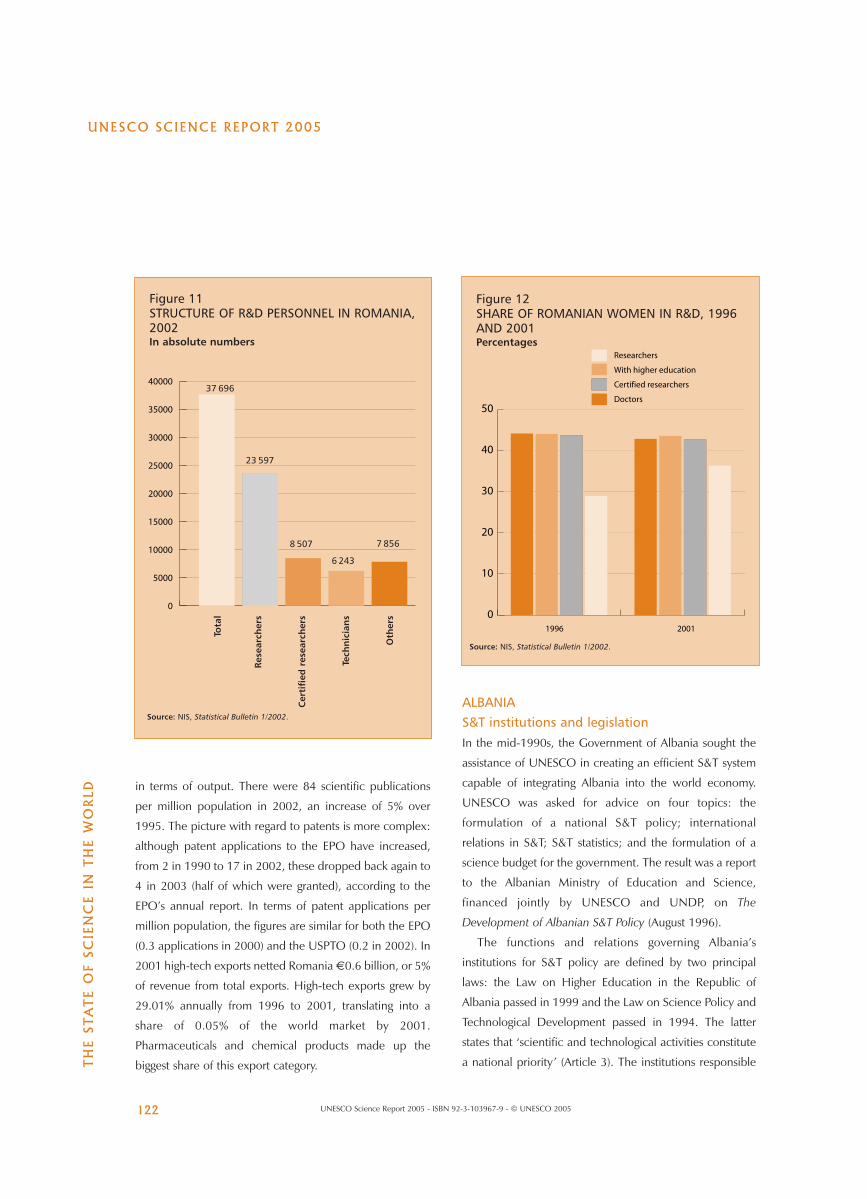
decline of 11% was recorded in 2002–03. The structure of
R&D personnel is shown in Figure 11 and the participation of
women in research in Figure 12.
The supply side of human resources in S&T is reflected
in the number of participants in tertiary education and new
university graduates. In Romania, the former grew by
13.9% annually and the latter by 1.3% between 1998 and
2001.
Performance of R&DDespite the difficult situation for R&D in Romania, some
positive developments have been observed in recent years
Figure 10R&D IN ROMANIA BY SECTOR OF PERFORMANCE, 1996 AND 2002
1996 2002
Source: OECD (2003) Main Science and Technology Indicators, November. OECD, Paris.
Businessenterprise
79%
Government17%
Higher education4% Higher education
16%
Government24%
Businessenterprise
60%
UNESCO SCIENCE REPORT 2005
TH
E S
TA
TE
OF
SC
IEN
CE
IN
TH
E W
OR
LD
122 UNESCO Science Report 2005 - ISBN 92-3-103967-9 - © UNESCO 2005
in terms of output. There were 84 scientific publications
per million population in 2002, an increase of 5% over
1995. The picture with regard to patents is more complex:
although patent applications to the EPO have increased,
from 2 in 1990 to 17 in 2002, these dropped back again to
4 in 2003 (half of which were granted), according to the
EPO’s annual report. In terms of patent applications per
million population, the figures are similar for both the EPO
(0.3 applications in 2000) and the USPTO (0.2 in 2002). In
2001 high-tech exports netted Romania €0.6 billion, or 5%
of revenue from total exports. High-tech exports grew by
29.01% annually from 1996 to 2001, translating into a
share of 0.05% of the world market by 2001.
Pharmaceuticals and chemical products made up the
biggest share of this export category.
Figure 11STRUCTURE OF R&D PERSONNEL IN ROMANIA,2002In absolute numbers
Source: NIS, Statistical Bulletin 1/2002.
Tota
l
Res
earc
her
s
Cer
tifi
ed r
esea
rch
ers
Tech
nic
ian
s
Oth
ers
0
5000
10000
15000
20000
25000
30000
35000
4000037 696
23 597
8 507
6 243
7 856
ALBANIAS&T institutions and legislationIn the mid-1990s, the Government of Albania sought the
assistance of UNESCO in creating an efficient S&T system
capable of integrating Albania into the world economy.
UNESCO was asked for advice on four topics: the
formulation of a national S&T policy; international
relations in S&T; S&T statistics; and the formulation of a
science budget for the government. The result was a report
to the Albanian Ministry of Education and Science,
financed jointly by UNESCO and UNDP, on The
Development of Albanian S&T Policy (August 1996).
The functions and relations governing Albania’s
institutions for S&T policy are defined by two principal
laws: the Law on Higher Education in the Republic of
Albania passed in 1999 and the Law on Science Policy and
Technological Development passed in 1994. The latter
states that ‘scientific and technological activities constitute
a national priority’ (Article 3). The institutions responsible
Figure 12 SHARE OF ROMANIAN WOMEN IN R&D, 1996AND 2001Percentages
Source: NIS, Statistical Bulletin 1/2002.
1996 2001
0
10
20
30
40
50
Researchers
With higher education
Certified researchers
Doctors
UNESCO SCIENCE REPORT 2005
SO
UT
H-E
AS
T E
UR
OP
E
123UNESCO Science Report 2005 - ISBN 92-3-103967-9 - © UNESCO 2005
The CSPTD approves the orientation and priorities of the
S&T policy and R&D programmes. It makes recomm-
endations and proposals concerning draft laws and
decisions on S&T activity and on priority research areas.
The Ministry of Education and Science (MoES) wears
two hats; it defines S&T policy and plays a coordination
role. The MoES has responsibility for administrating
national S&T programmes funded through the Public
Investment Programme. In this latter role, it supports S&T
programmes in other ministries, drafts national S&T policy
documents and prepares the total budget for R&D
programmes.
The ministries and the Academy of Sciences draft
sectoral S&T policy documents, administer the budget for
national R&D programmes and approve the financing of
their respective institutes. The various scientific institutes
come under the umbrella of the central Academy of
Sciences. The Academy is entrusted with conducting
scientific research, helping to open up new fields for
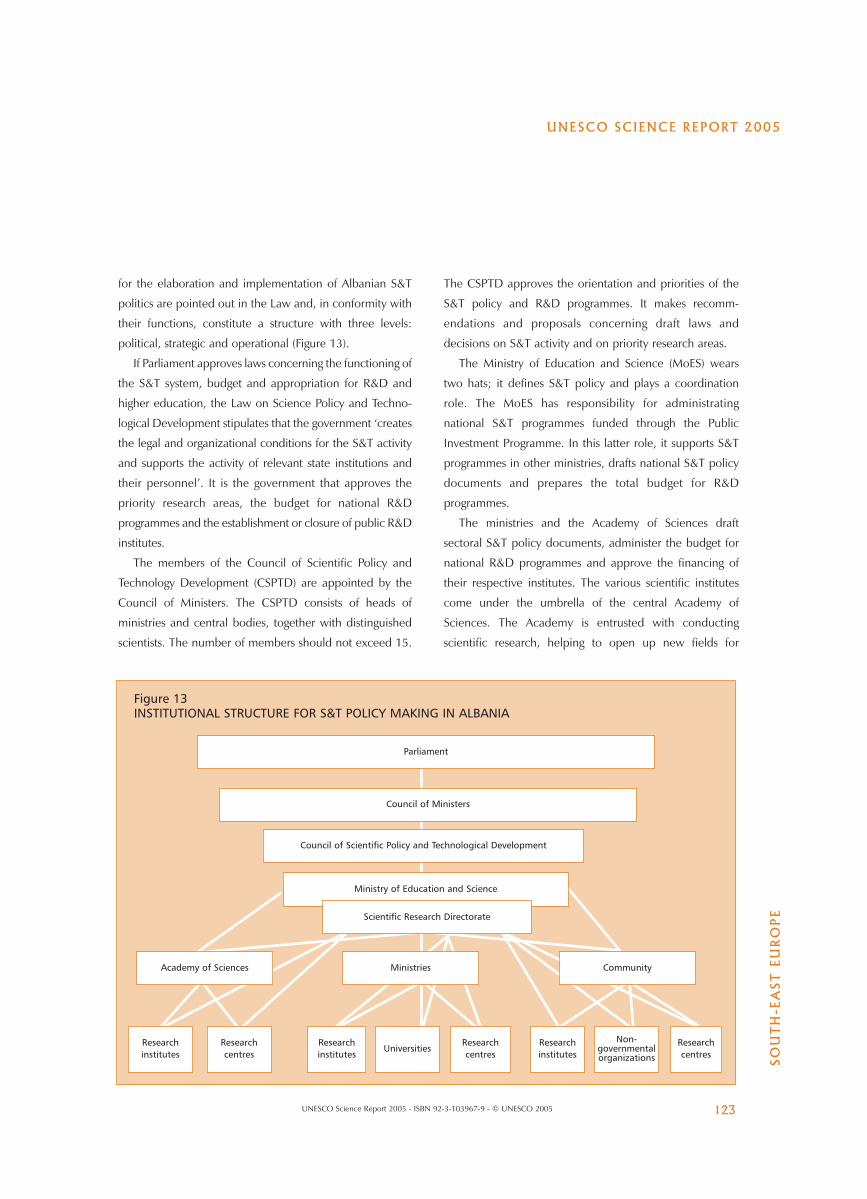
Figure 13INSTITUTIONAL STRUCTURE FOR S&T POLICY MAKING IN ALBANIA
Community
Researchcentres
Non-governmentalorganizations
Researchinstitutes
Researchcentres
Ministries
Ministry of Education and Science
Scientific Research Directorate
Council of Scientific Policy and Technological Development
Council of Ministers
Researchinstitutes
Academy of Sciences
Researchinstitutes
Researchcentres
Universities
Parliament
for the elaboration and implementation of Albanian S&T
politics are pointed out in the Law and, in conformity with
their functions, constitute a structure with three levels:
political, strategic and operational (Figure 13).
If Parliament approves laws concerning the functioning of
the S&T system, budget and appropriation for R&D and
higher education, the Law on Science Policy and Techno-
logical Development stipulates that the government ‘creates
the legal and organizational conditions for the S&T activity
and supports the activity of relevant state institutions and
their personnel’. It is the government that approves the
priority research areas, the budget for national R&D
programmes and the establishment or closure of public R&D
institutes.
The members of the Council of Scientific Policy and
Technology Development (CSPTD) are appointed by the
Council of Ministers. The CSPTD consists of heads of
ministries and central bodies, together with distinguished
scientists. The number of members should not exceed 15.
UNESCO SCIENCE REPORT 2005
TH
E S
TA
TE
OF
SC
IEN
CE
IN
TH
E W
OR
LD
124 UNESCO Science Report 2005 - ISBN 92-3-103967-9 - © UNESCO 2005
scientific research, petitioning the relevant government
authorities with important issues related to the situation of
R&D and, last but not least, working towards the
integration of Albanian science into world science.
Institutional mechanisms for R&DArticle 9 of the Law on Science Policy and Technological
Development states that the objectives of the country’s S&T
policy are to be attained through national R&D programmes.
These programmes identify R&D objectives in the relevant
field and the institutions and the scientific teams that will be
collaborating on the project, including possible foreign part-
ners; necessary improvements in infrastructure; the sources
of budgetary and, in some cases, extrabudgetary funding;
and expected results and time limits.
R&D activities are financed by the state budget in two
complementary ways, institutional and according to the
national R&D programmes. Institutional financing is given
directly to the central organizations to support the R&D
activities of their dependent institutions. Financing for
programmes takes place through state budget funds
designated for the R&D programmes and given directly to
the organizations that manage these programmes, and
through funds given to the Ministry of Education and
Science to finance different projects in a competitive way
following known and standard procedures. The role of
national R&D programmes is to finance from the state
budget ‘bottom-up’ initiatives for R&D.
Some of the drawbacks of projects run within the
national R&D programmes are that funds are always
allocated at the end of a fiscal year, making project
management difficult; the national R&D programmes also
offer few possibilities to pay in-house human resources.
In the first round (1995–98), 12 national programmes
were approved by the CSPTD. For the ensuing four-year
period, the list was half as long (Table 12). The six
programmes defined for the period 1998–2001 are still
ongoing because funding was interrupted in 2001.
Institutes of the Academy of Sciences take part in all but the
programme for agriculture and food.
Institutes involved in R&D activity are affiliated to the
Academy of Sciences or one of the government ministries.
Nearly 85% of Albania’s 46 research institutes are affiliated to
just three bodies. Those not listed in Table 12 are the Ministry
of Health (one institute), the Ministry of Culture, Youth and
Sports (two) and the Ministry of Construction (two).
The Academy of SciencesThe Academy of Sciences was founded in 1972 as an
autonomous institution funded by the state budget. It is the
most prestigious scientific institution in Albania. It
comprises eminent Albanian scientists (Academicians) and
13 research institutes and centres employing nearly 250
researchers. Institutes are grouped in two sections. The
Natural and Technical Section comprises hydraulic
research, nuclear physics, informatics and applied
mathematics, seismology, biological research, geographical
studies and hydrometeorology. The Section of Albanology
focuses on archaeology, linguistics and literature, art
studies, history and popular culture. One centre is devoted
to the Albanian Encyclopaedic Dictionary.
The Academy houses two large libraries: the Library of
the Academy of Sciences and the Library of History and
Linguistics. The administrative autonomy of research
institutes and centres enables these to participate more
easily in national and international projects. A considerable
proportion of academic researchers work part time as
teachers at universities. Besides R&D, some institutes host
a total of 80 students for hands-on and speciality training.
The R&D systemThe report prepared by UNESCO and the UNDP for the
Government of Albania (UNESCO 1996) stated that,
‘Although many of the Albanian institutes run by
government ministries describe themselves as research
institutes, it appears the bulk of their activities are scientific
and technical services. Thus, the Albanian national system
of innovation is, at present, primarily an S&T services
system (as defined by UNESCO).’ These institutes have staff
that vary from 10 to more than 40 researchers. Only some
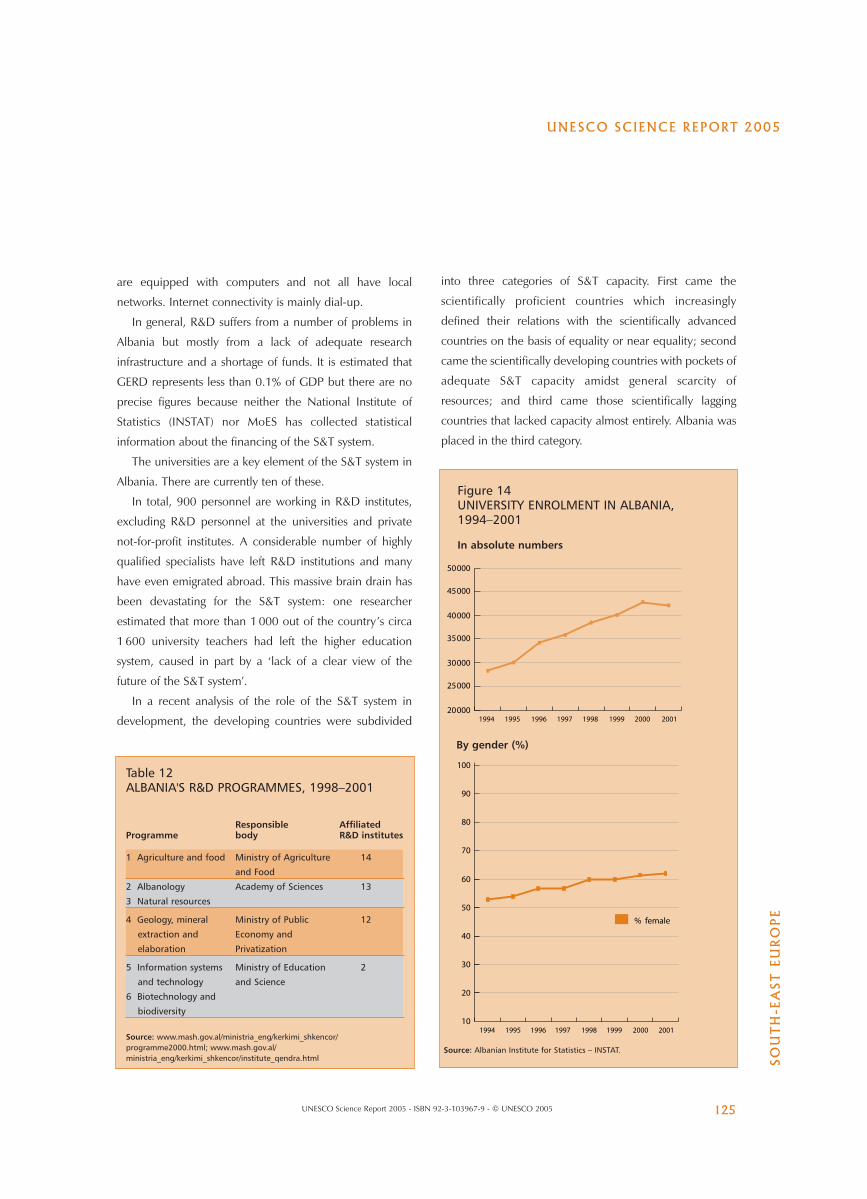
UNESCO SCIENCE REPORT 2005
SO
UT
H-E
AS
T E
UR
OP
E
125UNESCO Science Report 2005 - ISBN 92-3-103967-9 - © UNESCO 2005
are equipped with computers and not all have local
networks. Internet connectivity is mainly dial-up.
In general, R&D suffers from a number of problems in
Albania but mostly from a lack of adequate research
infrastructure and a shortage of funds. It is estimated that
GERD represents less than 0.1% of GDP but there are no
precise figures because neither the National Institute of
Statistics (INSTAT) nor MoES has collected statistical
information about the financing of the S&T system.
The universities are a key element of the S&T system in
Albania. There are currently ten of these.
In total, 900 personnel are working in R&D institutes,
excluding R&D personnel at the universities and private
not-for-profit institutes. A considerable number of highly
qualified specialists have left R&D institutions and many
have even emigrated abroad. This massive brain drain has
been devastating for the S&T system: one researcher
estimated that more than 1 000 out of the country’s circa
1 600 university teachers had left the higher education
system, caused in part by a ‘lack of a clear view of the
future of the S&T system’.
In a recent analysis of the role of the S&T system in
development, the developing countries were subdivided
into three categories of S&T capacity. First came the
scientifically proficient countries which increasingly
defined their relations with the scientifically advanced
countries on the basis of equality or near equality; second
came the scientifically developing countries with pockets of
adequate S&T capacity amidst general scarcity of
resources; and third came those scientifically lagging
countries that lacked capacity almost entirely. Albania was
placed in the third category.
Table 12ALBANIA'S R&D PROGRAMMES, 1998–2001
Responsible AffiliatedProgramme body R&D institutes
1 Agriculture and food Ministry of Agriculture 14
and Food
2 Albanology Academy of Sciences 13
3 Natural resources
4 Geology, mineral Ministry of Public 12
extraction and Economy and
elaboration Privatization
5 Information systems Ministry of Education 2
and technology and Science
6 Biotechnology and
biodiversity
Source: www.mash.gov.al/ministria_eng/kerkimi_shkencor/programme2000.html; www.mash.gov.al/ministria_eng/kerkimi_shkencor/institute_qendra.html
Figure 14UNIVERSITY ENROLMENT IN ALBANIA,1994–2001
In absolute numbers
Source: Albanian Institute for Statistics – INSTAT.
1994 1995 1996 1997 1998 1999 2000 200120000
30000
40000
50000
25000
35000
45000
By gender (%)
% female
1994 1995 1996 1997 1998 1999 2000 200110
20
70
80
90
100
30
40
50
60
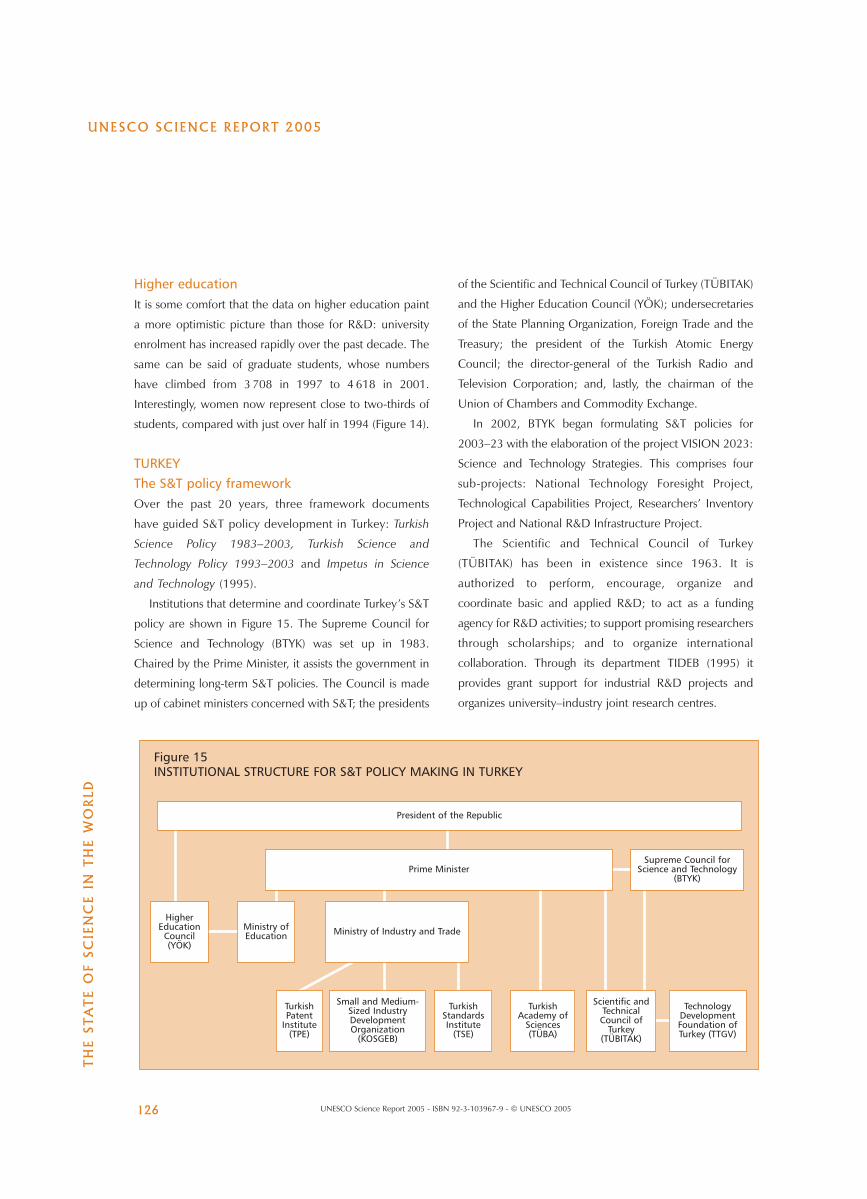
UNESCO SCIENCE REPORT 2005
TH
E S
TA
TE
OF
SC
IEN
CE
IN
TH
E W
OR
LD
126 UNESCO Science Report 2005 - ISBN 92-3-103967-9 - © UNESCO 2005
Figure 15INSTITUTIONAL STRUCTURE FOR S&T POLICY MAKING IN TURKEY
President of the Republic
Prime Minister
HigherEducation
Council(YÖK)
Ministry of Industry and Trade
TurkishPatent
Institute(TPE)
Small and Medium-Sized IndustryDevelopmentOrganization
(KOSGEB)
TurkishStandardsInstitute
(TSE)
TurkishAcademy of
Sciences(TÜBA)
Scientific andTechnicalCouncil of
Turkey(TÜBITAK)
TechnologyDevelopmentFoundation ofTurkey (TTGV)
Supreme Council forScience and Technology
(BTYK)
Ministry ofEducation
Higher educationIt is some comfort that the data on higher education paint
a more optimistic picture than those for R&D: university
enrolment has increased rapidly over the past decade. The
same can be said of graduate students, whose numbers
have climbed from 3 708 in 1997 to 4 618 in 2001.
Interestingly, women now represent close to two-thirds of
students, compared with just over half in 1994 (Figure 14).
TURKEYThe S&T policy frameworkOver the past 20 years, three framework documents
have guided S&T policy development in Turkey: Turkish
Science Policy 1983–2003, Turkish Science and
Technology Policy 1993–2003 and Impetus in Science
and Technology (1995).
Institutions that determine and coordinate Turkey’s S&T
policy are shown in Figure 15. The Supreme Council for
Science and Technology (BTYK) was set up in 1983.
Chaired by the Prime Minister, it assists the government in
determining long-term S&T policies. The Council is made
up of cabinet ministers concerned with S&T; the presidents
of the Scientific and Technical Council of Turkey (TÜBITAK)
and the Higher Education Council (YÖK); undersecretaries
of the State Planning Organization, Foreign Trade and the
Treasury; the president of the Turkish Atomic Energy
Council; the director-general of the Turkish Radio and
Television Corporation; and, lastly, the chairman of the
Union of Chambers and Commodity Exchange.
In 2002, BTYK began formulating S&T policies for
2003–23 with the elaboration of the project VISION 2023:
Science and Technology Strategies. This comprises four
sub-projects: National Technology Foresight Project,
Technological Capabilities Project, Researchers’ Inventory
Project and National R&D Infrastructure Project.
The Scientific and Technical Council of Turkey
(TÜBITAK) has been in existence since 1963. It is
authorized to perform, encourage, organize and
coordinate basic and applied R&D; to act as a funding
agency for R&D activities; to support promising researchers
through scholarships; and to organize international
collaboration. Through its department TIDEB (1995) it
provides grant support for industrial R&D projects and
organizes university–industry joint research centres.
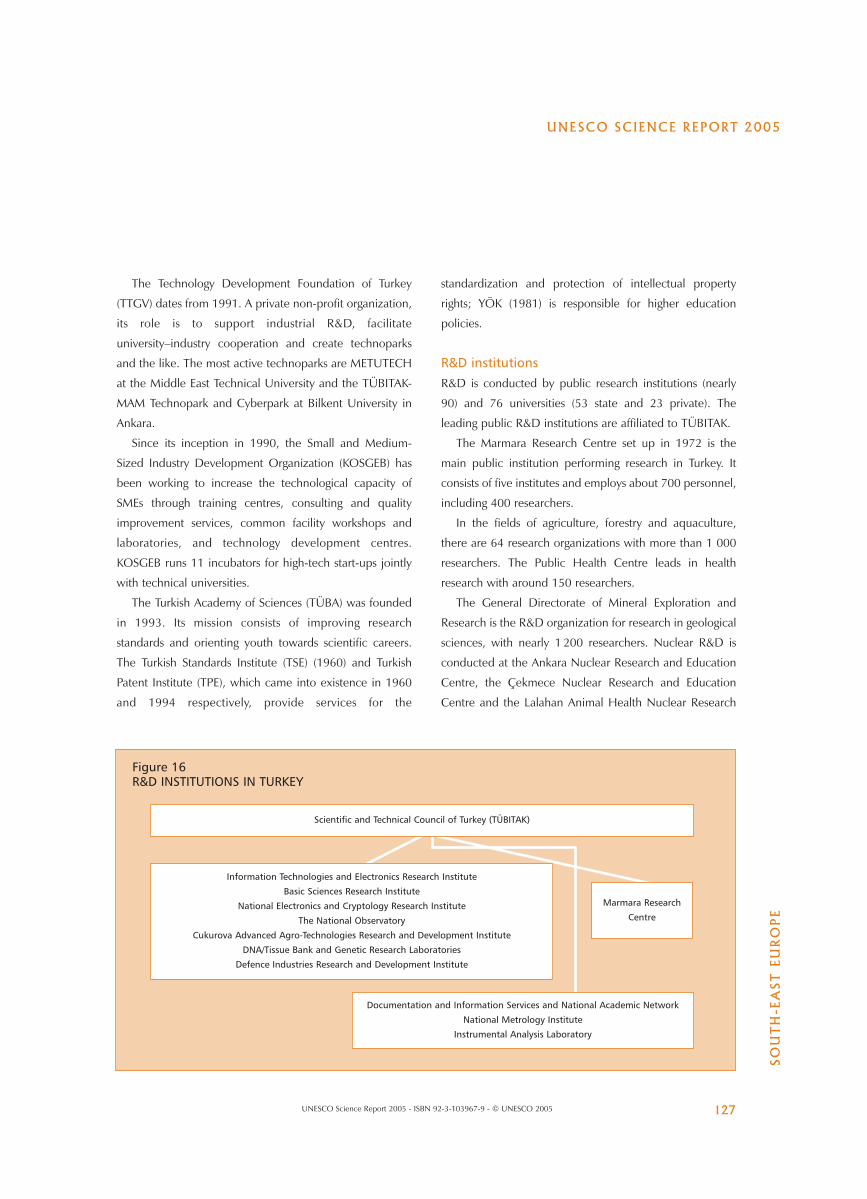
UNESCO SCIENCE REPORT 2005
SO
UT
H-E
AS
T E
UR
OP
E
127UNESCO Science Report 2005 - ISBN 92-3-103967-9 - © UNESCO 2005
The Technology Development Foundation of Turkey
(TTGV) dates from 1991. A private non-profit organization,
its role is to support industrial R&D, facilitate
university–industry cooperation and create technoparks
and the like. The most active technoparks are METUTECH
at the Middle East Technical University and the TÜBITAK-
MAM Technopark and Cyberpark at Bilkent University in
Ankara.
Since its inception in 1990, the Small and Medium-
Sized Industry Development Organization (KOSGEB) has
been working to increase the technological capacity of
SMEs through training centres, consulting and quality
improvement services, common facility workshops and
laboratories, and technology development centres.
KOSGEB runs 11 incubators for high-tech start-ups jointly
with technical universities.
The Turkish Academy of Sciences (TÜBA) was founded
in 1993. Its mission consists of improving research
standards and orienting youth towards scientific careers.
The Turkish Standards Institute (TSE) (1960) and Turkish
Patent Institute (TPE), which came into existence in 1960
and 1994 respectively, provide services for the
standardization and protection of intellectual property
rights; YÖK (1981) is responsible for higher education
policies.
R&D institutionsR&D is conducted by public research institutions (nearly
90) and 76 universities (53 state and 23 private). The
leading public R&D institutions are affiliated to TÜBITAK.
The Marmara Research Centre set up in 1972 is the
main public institution performing research in Turkey. It
consists of five institutes and employs about 700 personnel,
including 400 researchers.
In the fields of agriculture, forestry and aquaculture,
there are 64 research organizations with more than 1 000
researchers. The Public Health Centre leads in health
research with around 150 researchers.
The General Directorate of Mineral Exploration and
Research is the R&D organization for research in geological
sciences, with nearly 1 200 researchers. Nuclear R&D is
conducted at the Ankara Nuclear Research and Education
Centre, the Çekmece Nuclear Research and Education
Centre and the Lalahan Animal Health Nuclear Research
Figure 16R&D INSTITUTIONS IN TURKEY
Information Technologies and Electronics Research Institute
Basic Sciences Research Institute
National Electronics and Cryptology Research Institute
The National Observatory
Cukurova Advanced Agro-Technologies Research and Development Institute
DNA/Tissue Bank and Genetic Research Laboratories
Defence Industries Research and Development Institute
Scientific and Technical Council of Turkey (TÜBITAK)
Marmara Research
Centre
Documentation and Information Services and National Academic Network
National Metrology Institute
Instrumental Analysis Laboratory
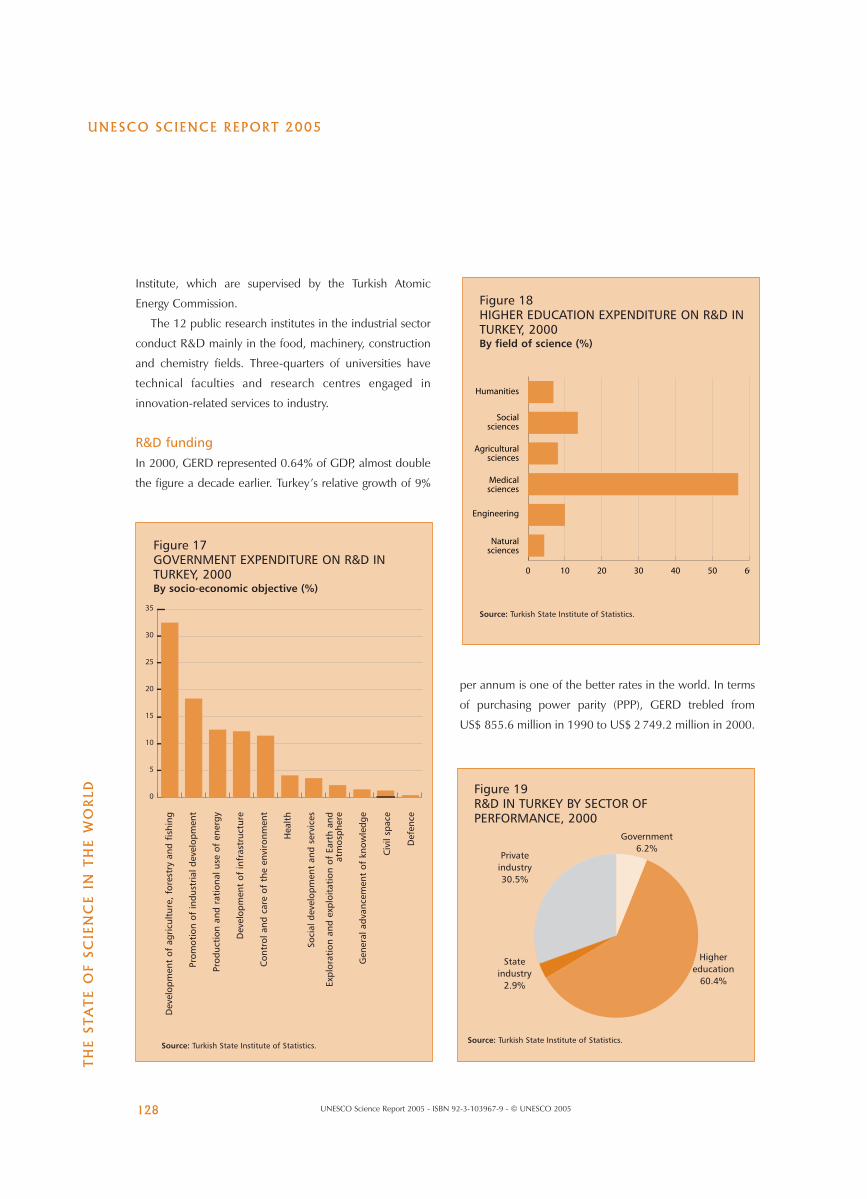
UNESCO SCIENCE REPORT 2005
TH
E S
TA
TE
OF
SC
IEN
CE
IN
TH
E W
OR
LD
128 UNESCO Science Report 2005 - ISBN 92-3-103967-9 - © UNESCO 2005
Figure 18HIGHER EDUCATION EXPENDITURE ON R&D INTURKEY, 2000By field of science (%)
Source: Turkish State Institute of Statistics.
0 10 20 30 40 50 60
Humanities
Socialsciences
Agriculturalsciences
Medicalsciences
Engineering
Naturalsciences
Institute, which are supervised by the Turkish Atomic
Energy Commission.
The 12 public research institutes in the industrial sector
conduct R&D mainly in the food, machinery, construction
and chemistry fields. Three-quarters of universities have
technical faculties and research centres engaged in
innovation-related services to industry.
R&D fundingIn 2000, GERD represented 0.64% of GDP, almost double
the figure a decade earlier. Turkey’s relative growth of 9%
per annum is one of the better rates in the world. In terms
of purchasing power parity (PPP), GERD trebled from
US$ 855.6 million in 1990 to US$ 2 749.2 million in 2000.
Figure 19R&D IN TURKEY BY SECTOR OFPERFORMANCE, 2000
Government6.2%
Highereducation
60.4%
Privateindustry30.5%
Stateindustry
2.9%
Source: Turkish State Institute of Statistics.
Figure 17GOVERNMENT EXPENDITURE ON R&D INTURKEY, 2000By socio-economic objective (%)
Dev
elop
men
t of
agr
icul
ture
, for
estr
y an
d fis
hing
Prom
otio
n of
indu
stri
al d
evel
opm
ent
Prod
ucti
on a
nd r
atio
nal u
se o
f en
ergy
Dev
elop
men
t of
infr
astr
uctu
re
Con
trol
and
car
e of
the
env
iron
men
t
Hea
lth
Soci
al d
evel
opm
ent
and
serv
ices
Expl
orat
ion
and
expl
oita
tion
of
Eart
h an
dat
mos
pher
e
Gen
eral
adv
ance
men
t of
kno
wle
dge
Civ
il sp
ace
Def
ence
0
5
10
15
20
25
30
35
Source: Turkish State Institute of Statistics.
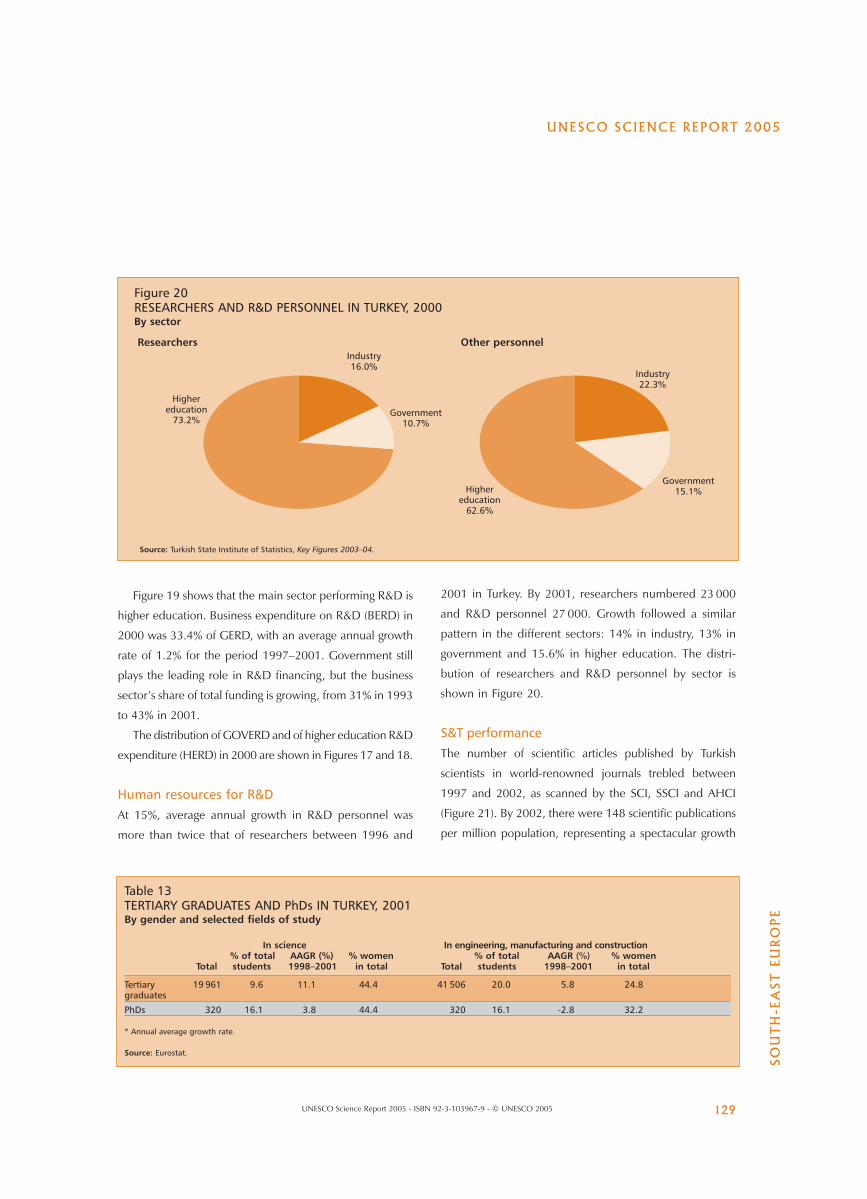
UNESCO SCIENCE REPORT 2005
SO
UT
H-E
AS
T E
UR
OP
E
129UNESCO Science Report 2005 - ISBN 92-3-103967-9 - © UNESCO 2005
Figure 19 shows that the main sector performing R&D is
higher education. Business expenditure on R&D (BERD) in
2000 was 33.4% of GERD, with an average annual growth
rate of 1.2% for the period 1997–2001. Government still
plays the leading role in R&D financing, but the business
sector’s share of total funding is growing, from 31% in 1993
to 43% in 2001.
The distribution of GOVERD and of higher education R&D
expenditure (HERD) in 2000 are shown in Figures 17 and 18.
Human resources for R&DAt 15%, average annual growth in R&D personnel was
more than twice that of researchers between 1996 and
2001 in Turkey. By 2001, researchers numbered 23 000
and R&D personnel 27 000. Growth followed a similar
pattern in the different sectors: 14% in industry, 13% in
government and 15.6% in higher education. The distri-
bution of researchers and R&D personnel by sector is
shown in Figure 20.
S&T performanceThe number of scientific articles published by Turkish
scientists in world-renowned journals trebled between
1997 and 2002, as scanned by the SCI, SSCI and AHCI
(Figure 21). By 2002, there were 148 scientific publications
per million population, representing a spectacular growth
Figure 20RESEARCHERS AND R&D PERSONNEL IN TURKEY, 2000 By sector
Source: Turkish State Institute of Statistics, Key Figures 2003–04.
Researchers Other personnel
Highereducation
73.2%
Industry16.0%
Government10.7%
Government15.1%
Industry22.3%
Highereducation
62.6%
Table 13TERTIARY GRADUATES AND PhDs IN TURKEY, 2001By gender and selected fields of study
In science In engineering, manufacturing and construction% of total AAGR (%) % women % of total AAGR (%) % women
Total students 1998–2001 in total Total students 1998–2001 in total
Tertiary 19 961 9.6 11.1 44.4 41 506 20.0 5.8 24.8graduates
PhDs 320 16.1 3.8 44.4 320 16.1 -2.8 32.2
* Annual average growth rate.
Source: Eurostat.
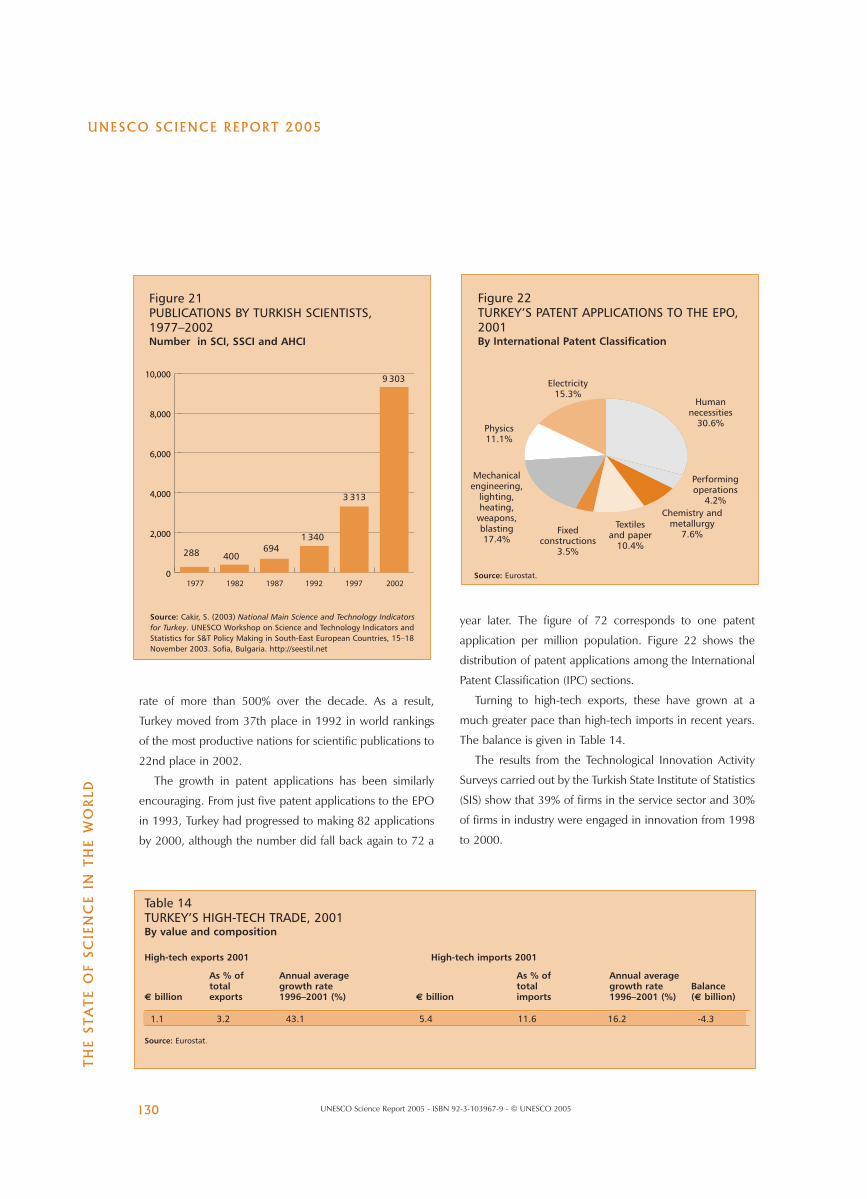
UNESCO SCIENCE REPORT 2005
TH
E S
TA
TE
OF
SC
IEN
CE
IN
TH
E W
OR
LD
130 UNESCO Science Report 2005 - ISBN 92-3-103967-9 - © UNESCO 2005
Figure 21PUBLICATIONS BY TURKISH SCIENTISTS,1977–2002Number in SCI, SSCI and AHCI
Source: Cakir, S. (2003) National Main Science and Technology Indicatorsfor Turkey. UNESCO Workshop on Science and Technology Indicators andStatistics for S&T Policy Making in South-East European Countries, 15–18November 2003. Sofia, Bulgaria. http://seestil.net
Figure 22TURKEY’S PATENT APPLICATIONS TO THE EPO,2001By International Patent Classification
Source: Eurostat.0
2,000
4,000
6,000
8,000
10,000
1977 1982 1987 1992 1997 2002
288 400694
1 340
3 313
9 303
Humannecessities
30.6%
Performing operations
4.2%Chemistry and
metallurgy7.6%
Textilesand paper
10.4%
Fixedconstructions
3.5%
Physics11.1%
Electricity15.3%
Mechanicalengineering,
lighting,heating,
weapons,blasting17.4%
rate of more than 500% over the decade. As a result,
Turkey moved from 37th place in 1992 in world rankings
of the most productive nations for scientific publications to
22nd place in 2002.
The growth in patent applications has been similarly
encouraging. From just five patent applications to the EPO
in 1993, Turkey had progressed to making 82 applications
by 2000, although the number did fall back again to 72 a
year later. The figure of 72 corresponds to one patent
application per million population. Figure 22 shows the
distribution of patent applications among the International
Patent Classification (IPC) sections.
Turning to high-tech exports, these have grown at a
much greater pace than high-tech imports in recent years.
The balance is given in Table 14.
The results from the Technological Innovation Activity
Surveys carried out by the Turkish State Institute of Statistics
(SIS) show that 39% of firms in the service sector and 30%
of firms in industry were engaged in innovation from 1998
to 2000.
Table 14TURKEY’S HIGH-TECH TRADE, 2001 By value and composition
High-tech exports 2001 High-tech imports 2001
As % of Annual average As % of Annual averagetotal growth rate total growth rate Balance
€ billion exports 1996–2001 (%) € billion imports 1996–2001 (%) (€ billion)
1.1 3.2 43.1 5.4 11.6 16.2 -4.3
Source: Eurostat.
UNESCO SCIENCE REPORT 2005
SO
UT
H-E
AS
T E
UR
OP
E
131UNESCO Science Report 2005 - ISBN 92-3-103967-9 - © UNESCO 2005
INTERNATIONAL COOPERATIONThe Venice ProcessThe Venice Process of rebuilding scientific cooperation both
among Balkan countries and between them and the rest of
Europe has essentially the same goals as the specific actions of
the European Commission and its successive Framework
Programmes. It does, however, lay greater emphasis on the
regional aspect by encouraging the creation of regional
networks, which should be centres of excellence or compe-
tence. The process was initiated by UNESCO, the ESF and
Academia Europaea in November 2000 and officially launched
at the Venice Conference of Experts on Reconstruction of
Scientific Co-operation in South-East Europe in March 2001.
UNESCO has a long tradition of encouraging
cooperation in the world’s regions and sub-regions as a
method for strengthening security and stimulating
development. Applied to the sciences, this approach once
again found a concrete expression at the World
Conference on Science held in Budapest (Hungary) in
1999. As a follow-up specifically targeting South-East
Europe, UNESCO’s Regional Bureau for Science in Europe
(ROSTE), located in Venice (Italy), launched the ‘Venice
Process’, with support from the Italian government.
The Venice Process was greeted with unanimous
approval by the ministers for science and technology of the
countries concerned at the Round Table organized on
24 October 2001 within the framework of UNESCO’s 31st
General Conference bringing together the organization’s
188 Member States. High-ranking representatives of EU
Member States and many supranational bodies, such as the
European Commission, participated, as did international
governmental and non-governmental bodies, among them
Euroscience. The process was reconfirmed by the ministers
or their representatives at the High-level Conference on
Strengthening Co-operation with South-East Europe held at
UNESCO headquarters on 4–5 April 2002.
Cooperation with the European UnionThe EU is by far the largest single donor to the countries of
the West Balkans. As already outlined in the introduction
to this chapter, the EU’s policy for South-East Europe is
two-pronged. On the one hand, it aims to prepare the
candidate countries of Bulgaria, Croatia, Romania and
Turkey for entry into the EU. On the other, the Stabiliza-
tion and Association Process aims to prepare Albania,
B&H, S&MN and FYR Macedonia for eventual member-
ship of the EU. At the Thessaloniki European Council in
June 2003, an Agenda for the Western Balkans was
adopted, enriching the current Stabilization and Associa-
tion Process through the provision of new European
Integration Partnerships.
All the countries of the western Balkans are involved in
the EU’s EUREKA, COST, TEMPUS-PHARE and Fifth
(1998–2002) and Sixth (2003–07) Framework
Programmes (see below for details). They also benefit
from the Community Assistance for Reconstruction,
Development and Stabilization (CARDS) programme,
which provides technical and financial support. In addi-
tion, Romania and Turkey are members of the
Organization for Black Sea Economic Cooperation.
The principal objective of the EU’s West Balkans
programme in preparation for the European Research Area
in 2010 is to increase the quantity and quality of
participation from the countries of the western Balkans in
the Sixth Framework Programme.
In July 1999, Romanian collaboration with the EU in R&D
entered a new phase with the start of the country’s full
participation in the Fifth Framework Programme and
EURATOM programmes. The report of the Romanian
Ministry of Education, Research and Youth (MERY) on the
results of the Fifth Framework Programme by the end of
2002 noted that 200 Romanian research institutes had been
involved in 187 projects benefiting from European Commis-
sion funding in excess of € 18 million. A further 220
contracts had been signed for a total value of € 20 million.
Romanian participation proved greatest in the following
thematic programmes: Energy, Environment and Sustainable
Development (85 projects), User-Friendly Information Soci-
ety (76 projects) and Competitive and Sustainable Growth
(47 projects). Private firms and research institutes ranked first
UNESCO SCIENCE REPORT 2005
TH
E S
TA
TE
OF
SC
IEN
CE
IN
TH
E W
OR
LD
132 UNESCO Science Report 2005 - ISBN 92-3-103967-9 - © UNESCO 2005
among the participating bodies. Within these contracts,
contacts were established most frequently with France,
Germany and the UK. Cooperation with the other EU candi-
date countries led to 255 collaborations, most of which were
established with Poland, Bulgaria and Hungary. In joining
the Sixth Framework Programme in 2002, Romania under-
took to contribute € 14.3 million (of which € 13.3 million
will go to EURATOM).
The special CORINT programme of Romania’s MERY
National Plan supports the participation of researchers in
international programmes. In 2002, the CORINT
programme absorbed 7.9% of the budget for Romania’s
National Plan. The importance attributed by Romania to
this programme is also confirmed by an increase in the
number of projects funded: from 19 in 2001 to 69 in 2002.
The Bulgarian Academy of Science is giving strong priority to
participation in the Framework Programmes in the context of
integration and the European Research Area. The Academy
obtained 125 out of Bulgaria’s 255 projects granted by the
Fifth Framework Programme, for example. Those 255 projects
represent financial support of more than € 7.5 million (2003
data), a sum which has allowed research institutes to perform
R&D up to international standards.
Cooperation within INCO
Within the EU’s INCO–Copernicus–Balkans programme,
which encourages cooperation in areas related to the
improvement of living conditions or public health, as well
as the development of industrial schemes in the energy,
food and information society sectors, Croatia is conducting
seven research projects in environmental protection and
health care, the latter focusing on post-traumatic stress
disorder, a syndrome typically induced by war.
The Bulgarian Academy of Sciences hosts four out of
five Bulgarian centres of excellence set up under the EU’s
INCO 2 programme: the Centre for Sustainable
Development and Management of the Black Sea System, the
Centre for a Bulgarian Information Society in the 21st
Century, the Centre for Portable Energy Sources and the
Bulgarian Centre for Solar Energy.
Cooperation within EUREKA
EUREKA was established in 1985 by 17 countries and the EU
to encourage a bottom-up approach to technological devel-
opment and to strengthen the competitive position of Euro-
pean companies on the world market. EUREKA fosters
international cooperation between companies, R&D centres
and universities of the member countries.
Although Croatia has only been a member of EUREKA
since 2000, it has been active in two important projects since
their inception: EUROTRAC (air research) and EUROMAR
(marine research). Currently Croatia is a coordinator for eight
EUREKA projects and cooperates on nine umbrella projects:
EUROENVIRON (environmental protection technologies),
EUROTOURISM (technologies for tourism), EUROLEARN (e-
learning and multimedia), EUROCARE (protection of cultural
monuments), EUROAGRI (agricultural technologies), EULAS-
NET (laser use in medicine and industry – Croatia is a found-
ing member of the project), FACTORY (development of
technologies for use in manufacturing industries), ITEA
(software-intensive systems) and MEDEA (technologies in
microelectronics).
In 2003, Serbian researchers were engaged in four
EUREKA programmes and 18 projects under the Cooperation
in Scientific and Technical Research (COST) programme.
Cooperation within COST
The COST programme is the oldest and widest European
intergovernmental network for cooperation in research.
Established in 1971, COST is presently used by the scientific
communities of 35 European countries to cooperate in
common research projects supported by national funds. In a
bottom-up approach, the initiative of launching a COST
action comes from the European scientists themselves.
As a precursor of advanced multidisciplinary research,
COST plays an important role in realizing the targeted Euro-
pean Research Area. It complements the activities of the
Framework Programmes, constituting a bridge to the
scientific communities of emerging countries, increasing the
mobility of researchers across Europe and fostering the estab-
lishment of networks of excellence in many key scientific
UNESCO SCIENCE REPORT 2005
SO
UT
H-E
AS
T E
UR
OP
E
133UNESCO Science Report 2005 - ISBN 92-3-103967-9 - © UNESCO 2005
domains such as physics, chemistry, telecommunications and
information science, nanotechnologies, meteorology, envi-
ronment, medicine and health, forests, agriculture and social
sciences. It covers basic and more applied research and also
addresses issues of a pre-normative nature or of societal
importance.
Since 1992, Croatia has been involved in more than
80 COST research projects in oceanography, new mate-
rials, environmental protection, meteorology, agriculture
and biotechnology, food processing, social sciences,
medicine, chemistry, forestry, telecommunication and
transport. Some 35 projects are on-going. Bulgaria has
participated in COST since 1999, taking part in 74 on-
going projects, 40% of which are in the fields of agricul-
ture and biotechnology, telecommunications and
information science. Turkey is currently participating in
46 activities within COST.
Cooperation within TEMPUS
TEMPUS is the EU’s major instrument for the development
and restructuring of higher education. In the past 15 years,
it has undergone several different phases (Tempus I,
Tempus II and Tempus II bis). Tempus III (2000–06) is
focused on the Western Balkans, the partner states in
Eastern Europe and Central Asia (so called ‘Tacis’ countries)
and Mediterranean partners.
The EU’s TEMPUS-PHARE postgraduate programme in
molecular biology and genetic engineering began at the
University of Skopje (FYR Macedonia) in 1998. It involves
the eight faculties of medicine, pharmacy, veterinary
science, natural sciences, agriculture, forestry, technology
and electrical engineering. Also participating is the
Macedonian Academy, which is collaborating with
scientific institutions in several countries of the EU.
The EU provides Bulgaria and Romania with assistance
through the budget lines of PHARE, which provides general
accession aid in adopting the body of community
legislation, as well as through two other programmes
providing pre-accession funds: ISPA (transport and
environment) and SAPARD (agriculture).
Croatia, B&H, S&MN and FYR Macedonia all
participate in the TEMPUS programme.
Cooperation within NATOBulgaria is one of the most active partner countries in the
NATO Science Programme, having benefited by 2002 from
over 280 grants and 350 fellowships.
By the end of 2002, over 200 Romanian research teams
had participated in the NATO Science Programme and
Romania had received more than 320 fellowships allowing
Romanian scientists to study in NATO countries.
In Turkey, TÜBITAK participates actively in NATO. Beyond
Europe, Turkey’s participation in international bodies also
extends to the OECD and the Organization of Islamic States.
Croatian scientists are involved in several research
programmes with NATO, particularly those from the Rudjer
Boškovic Institute.
Cooperation within and beyond EuropeScientific activity in the former Yugoslavia has always been
characterized by intensive international scientific
cooperation. For instance, in the 1980s, 300 physicists
from Croatia published papers with scientists from 203
institutions: 108 from Western Europe, 35 from the USA
and 31 from Eastern Europe. Today, scientists from B&H,
S&MN, Croatia and FYR Macedonia are still collaborating
with one another and even more intensively with scientists
from Europe, the USA, Asia, Australia and Africa.
Noteworthy examples of current scientific cooperation
involving the countries of the former Yugoslavia are: the
Danube River Environmental Project with the Sava Basin
Project, the Coordinated Adriatic Observing System,
Mediterranean Sea Pollution Studies, Transport Connection
between Baltic and Adriatic Seas, Telemedicine, Eastern
European Consortium on Crystallographic Studies of
Macromolecules, Central European Studies in Chemistry
towards Biology, the Development of a Forensic
Osteological Database involving Bulgaria and Croatia with
the collaboration of the Smithsonian Institution in the USA,
International Cooperation in Humanitarian De-mining and
UNESCO SCIENCE REPORT 2005
TH
E S
TA
TE
OF
SC
IEN
CE
IN
TH
E W
OR
LD
134 UNESCO Science Report 2005 - ISBN 92-3-103967-9 - © UNESCO 2005
Securities, Wetland Research, Environmental Hot Spots,
projects within UNESCO’s Man and the Biosphere
programme (MAB), collaborative projects in hydrology, ICT
projects and fluidized bed conversion applied to efficient,
clean energy production in the sub-region.
All four countries have a considerable number of expatri-
ates working abroad. A project to include them in the
national R&D programme was initiated in 1987 in each inde-
pendent state. Most successful has been Croatia, which has
managed to draw several outstanding researchers back home
to take up leading positions. However, a joint collaborative
project with expatriates is the more frequent pattern, as in
the case of the observatory on the island of Hvar, which
boasts a high-energy gamma ray telescope on Pelješac and
particle physics research.
One of the most comprehensive endeavours involving
scientists from all four countries is the International Centre
for Sustainable Development hosted by the Jozef Stefan
Institute in Ljubljana, Slovenia, where scientists from the
Rudjer Boškoviç Institute in Croatia play a crucial role and
which involves researchers from B&H, FYR Macedonia,
S&MN, Bulgaria, Romania, Italy, Greece and Turkey. For
the past three years, the centre has organized an MSc
programme. All the countries of the former Yugoslavia, plus
Greece, Bulgaria, Romania, Albania and Italy, have
proposed that the centre be turned into the Southeast
European Institute of Technology under the Sixth
Framework Programme, after the pattern of the
Massachusetts Institute of Technology or the California
Institute of Technology in the USA.
Turkey cooperates bilaterally and multilaterally in S&T
through government agreements with the USA, Russia and
Hungary. TÜBITAK has agreements with CNR (Italy), the
Centre national de recherche scientifique (CNRS, France),
the Centre for Scientific and Industrial Research (CSIR,
India), the National Science Foundation (USA) and the
National Committee for Technological Development
(OMFB, Hungary).
Bulgarian institutions of higher learning have improved
international cooperation since 1990; a large number of
inter-university agreements have been established through
the EU’s ERASMUS and TEMPUS programmes. The oldest
Bulgarian University, St Kl. Ochridski in Sofia, has agreements
with 75 universities from 31 countries. An important devel-
opment is the setting up of a joint department with universi-
ties abroad. One example of this new trend is the Technical
University in Sofia, which has founded a joint faculty with the
University of Karlsruhe and Technical University in Braun-
schweig (Germany). Moreover, within its membership since
1995 of the Association of French-Speaking Universities, the
Technical University in Sofia has also created a French-
speaking Department of Electrical Engineering.
The Bulgarian Academy of Sciences has a strong
tradition in international cooperation. It remains the most
internationally recognized research body in the country,
participating in international programmes and bodies
which include the European Science Foundation,
European Federation of National Academies of Science
and Humanities (ALLEA) and EU programmes. By 2003,
the Bulgarian Academy of Sciences had concluded 53
bilateral agreements with national academies, research
centres, research councils and universities.
The Academy hosts four out of five Bulgarian centres of
excellence set up under the EU’s INCO 2 programme: the
Centre for Sustainable Development and Management of
the Black Sea System, the Centre for a Bulgarian
Information Society for Education, Science and Technology
in the 21st Century, the Centre for Portable Energy Sources
and the Bulgarian Centre for Solar Energy. The fifth centre
of excellence, that for Agrobiological Studies, has been set
up by the National Centre for Agrarian Studies which itself
dates from 1999.
The Croatian Academy of Sciences and Arts is a member
of the Interacademy Panel, ALLEA, European Science
Foundation and International Council of Scientific Unions.
It maintains active research collaboration with most of the
academies throughout the world and typically ‘exchanges’
300 scientists a year.
The Interuniversity Centre (IUC) in Dubrovnik (Croatia)
is an international institution for advanced studies founded
UNESCO SCIENCE REPORT 2005
SO
UT
H-E
AS
T E
UR
OP
E
135UNESCO Science Report 2005 - ISBN 92-3-103967-9 - © UNESCO 2005
in 1971. It has a membership of over 200 universities and
academies throughout the world. More than 50 000
scholars and students have participated in courses and
conferences organized by the IUC over the years.
The Romanian Academy has signed more than 42
agreements with institutions from 29 countries and with
UNESCO. The Academy is affiliated to about 30
international scientific associations and organizations,
among them the International Council for Science, Inter-
Academy Panel and ALLEA.
Macedonian scientists are cooperating on seven proj-
ects with Slovenia, six with Turkey, two with Italy, one
with Greece and another with Albania. They are
involved in four multilateral projects, two of which are
with NATO (involving Albania, Turkey, Greece, the USA
and Italy) and one with the United Nations Food and
Agricultural Organization (with Croatia, B&H and
S&MN). A fourth is financed by the French Association
des établissements d’enseignement supérieur et de
recherche agronomique, agro-alimentaire, horticole et
vétérinaire (AGRENA).
Croatian scientists are involved in six research projects
at the European Laboratory for Nuclear Research (CERN):
NA49, NOMAD, CMS, ALICE, OPERA and CAST. In the
NA49 experiment, for example, scientists recreate
conditions of high energy density as they existed at the time
of the early Big Bang by bombarding heavy nuclei that are
accelerated to near-light velocity onto nuclei in a thin metal
foil. NA49 is a large acceptance tracking spectrometer at
CERN’s SPS lead beam facility.
Croatian scientists are also participating in the work of
several international and European research centres: Elletra
(Italy); the Paul Scherrer Institute (Switzerland); FOPI and
CBA, GSI (Germany); Brookhaven National Laboratory
(Upton, New York), TUNL (Durham, NC), Los Alamos and
Oak Ridge National Laboratories (USA); and TRIUMF
(Canada). Croatian scientists are participating in five
projects within the Adriatic–Ionian Initiative, as well as on
projects within the Stabilisation and Association Agreement
and in cooperation with the Commonwealth of
Independent States. A particularly important research
project for Croatia is the Adriatic project which includes
Croatian R&D institutions and universities working with
sister institutions in several European countries.
As stated earlier, the TESLA Scientific Centre at the Vinca
Institute of Nuclear Sciences in Belgrade is the realization of
a long-standing project for the installation of an accelerator
for nuclear, biomedical and materials sciences research.
Although not yet completed, it has already become a
rendezvous for international cooperation.
One impediment to international cooperation for Serbia
has been a 1998 law the country passed cancelling the
autonomy of national institutions of higher education. That
law has resulted in the suspension of Serbian universities
from the Association of European Universities. Similarly
inadequate Croatian laws and practices regulating science
in the early 1990s have prevented Croatia from being
admitted to the European Science Foundation.
A new trend in cooperation is emerging in Romania, as
illustrated by the establishment of the Austrian Institute of
Timisoara in partnership with the West University of
Timisoara, Technical University of Timisoara and RISC
Institute of Linz in Austria (2002), which will ultimately
become a technological park in the field of information
technology. Moreover, Romania’s bilateral cooperation at
the European level is growing. In a single year from 2001
to 2002, this increased from 148 to 160 projects.
Albania’s Law on Science and Technological Devel-
opment gives ministries, research institutes, the Acad-
emy of Sciences and universities the opportunity to sign
bilateral agreements with similar institutions in other
countries. The Ministry of Education and Science, for
example, has signed two bilateral agreements, one each
with Italy and Greece. The Academy of Sciences also has
a bilateral agreement with Greece and takes part in
NATO scientific programmes, the International Atomic
Energy Agency (IAEA) programme and INTERREG-2. The
University of Tirana has established bilateral agreements
and cooperates with around 40 different universities and
institutions in Europe and in other parts of the world.
UNESCO SCIENCE REPORT 2005
TH
E S
TA
TE
OF
SC
IEN
CE
IN
TH
E W
OR
LD
136 UNESCO Science Report 2005 - ISBN 92-3-103967-9 - © UNESCO 2005
CONCLUSIONOver the past decade, the countries of South-East Europe
have followed different paths in the transformation of their
S&T systems. Almost all used to be socialist countries with
well-developed research systems supported by
government. Exposed to new market conditions, they
faced financial restrictions, deteriorating infrastructure and
the challenge of a competitive market, while professionals
working in science and engineering experienced a loss of
social prestige. The restructuring of S&T is a painful process
with many unanticipated outcomes and problems which
every country has to solve in its own way.
Despite the hurdles in recent years, the countries of
South-East Europe are all moving towards stabilization and
recovery.
The underlying national S&T policies in the region have
the goals of harmonization with European legislation and
the adoption of international standards and good practices.
The countries of the region are at different stages in
achieving this. To nurture the aforementioned processes,
regional cooperation in S&T will need to be strengthened
and transborder programmes developed. Member Nations
of the EU and accession countries will be vital to this effort.
REFERENCES AND FURTHER READING
Albania, Government of (2001) Statistical System of the Republic ofAlbania: Global Assessment 2001. http://www.undp.org.al/?elib
–– (2002) Report on the Status of Information and CommunicationTechnology in Albania. E-assessment:http://www.ictd.org.al/index.php?pageid=ereadiness/report
Angelov, G. (2001) Bulgarian academic science in internationalresearch projects. Strategies for Policy in Education and Science,2001/3. (In Bulgarian)
Bulgaria, Government of (2003) National Strategy for Science .Ministry for Education and Science, Sofia. (In Bulgarian)
–– (2004) Innovation Strategy of Republic of Bulgaria and theMeasures for its implementation. Ministry of Economics, Sofia. (InBulgarian)
Bulgarian Academy of Science (2002) On the way of reforms:1989–2000. Centre for Science Studies and History of Science,Sofia, 287 pp. (In Bulgarian)
–– (2004) Annual Report for 2003. Sofia. (In Bulgarian)
Cadiou, Y.; Esterle, L. (2002) Scientific Profile Activities in Central andEastern European Countries. Paper prepared for UNESCO RegionalBureau for Science in Europe, Venice.
Cakir, S. (2003) National Main Science and Technology Indicators forTurkey. UNESCO Workshop on Science and Technology Indicatorsand Statistics for S&T Policy Making in South-East EuropeanCountries, 15–18 November 2003. Sofia, Bulgaria. http://seestil.net
Dega, F. (2002) AAAS internship helps strengthen science policy inEastern Europe.http://www.aaas.org/news/releases/2002/1022dega.shtml
–– (2003) The State of Science Statistics in Albania. UNESCO Workshopon Science and Technology Indicators and Statistics for S&T PolicyMaking in South-East European Countries, 15–18 November 2003.Sofia, Bulgaria. http://seestil.net
Elci, Sirin (2003) National innovation policy profile: Turkey. Compiledby Technology Development Foundation of Turkey. In: InnovationPolicy in Seven Candidate Countries: The Challenges. Final Report,Volume 2. Study coordinated by ADE, in association with SSEESand LOGOTECH.
European Commission (2003) Innovation Policy in Seven CandidateCountries: The Challenges. Final Report, Volume 1. ADE-SSEES-LOGOTECH, Enterprise Directorate-General, Innovation Directorate.
–– (2004) Key Figures 2003–2004.
Eurostat (2000) R&D and Innovation Statistics in Candidate Countriesand the Russian Federation. Statistics for 1996. EuropeanCommission.
Holbrook, J.A.D. (1996) Measuring the Development of Science andTechnology in a Changing Economy: The Case of Albania. CPROSTReport no. 96–08. http://www2.sfu.ca/cprost/publications.htm
ISI Web of Science (2004) Science Citation Index of Institute forScientific Information, ISI-Thompson, Philadelphia, USA.
UNESCO SCIENCE REPORT 2005
SO
UT
H-E
AS
T E
UR
OP
E
137UNESCO Science Report 2005 - ISBN 92-3-103967-9 - © UNESCO 2005
Kajn, R. (2004) A Power Tool for Economic Growth. Invited talk toconference on intellectual property, 26 April 2004.
Karatnycky, A. (2001) Nations in Transit.http://www.freedomhouse.org
Kearney, A.T. (2003) Globalisation Index 2003. Foreign Policy.
Mulabegoviç, N. (2001) The general conditions of science in Bosnia &Herzogovina. In: Proceedings of conference on the Reconstructionof Scientific Cooperation in SEE. UNESCO ROSTE, Venice, pp. 55–7.
OECD (2003) Main Science and Technology Indicators, November.Organisation for Economic Co-Operation and Development, Paris.
Prpiç, K. (2002) Size, structure and dynamics of R&D personnel. In:Nada Švob Dokic (ed.) R&D Policies in the South-East EuropeanCountries in Transition. Zagreb, Croatia.
Romania, Government of (2002) Decree N 57 of 16 August, 2002about Research and Technological Development. Monitorul Oficial,643/30, August. (In Romanian)
–– (2003) Report of the Ministry of Education and Research,Development and Innovation between 2001–2002. Department ofResearch. Bucharest, 94 pp. (In Romanian)
Sandu, S. (2004) Romania: transformation of the S&T system. In: WernerMeske (ed.) From System Transformation to European Integration.Science and Technology in Central and Eastern Europe at the Begin-ning of the 21st Century. Lit Verlag Munster, p. 259–83.
Simeonova, K. (2004) Bulgaria: the long road to a new innovationsystem. In: Werner Meske (ed.) From System Transformation toEuropean Integration. Science and Technology in Central andEastern Europe at the beginning of the 21st century. Lit VerlagMunster, pp. 283–307.
Slaus, I. (1988) Including our expatriates in our R&D programme.Tehnika, 43: p. 1085–91
Trajkoviç, D. (2001) Encouraging international collaboration inresearch programmes. In: Proceedings of conference on theReconstruction of Scientific Cooperation in South-East Europe.UNESCO ROSTE, Venice, pp. 117–26.
Turkey, Government of. Turkish Science Policy 1983–2003.
–– Turkish Science and Technology Policy 1993–2003.
–– (1995) Impetus in Science and Technology.
Turkish State Institute of Statistics. Key Figures 2003–04.
UNDP (2002) Human Development Report. United NationsDevelopment Programme/Oxford University Press, Oxford, UK.
UNESCO (1996) The Development of Albanian S&T Policy. UNESCO andUNDP, August.
Watson, R.; Crawford, M.; Farley, S. (2003) Strategic Approaches toScience and Technology in Development. World Bank PolicyResearch Working Paper 3026:http://econ.worldbank.org/files/25709_wps3026.pdf
Georgi Dimitrov Angelov, PhD, is a Senior Research Fellow at
the Centre for Science Studies and History of Sciences of the
Bulgarian Academy of Sciences and lecturer in sociology of
education, science and technology and innovation policy at the
New Bulgarian University. In 1992, he was Chief Expert in
Science Policy at the Ministry of Science and Education. The
same year, he took on the function of Director of the National
Centre of Education and Science Studies of the Ministry of
Education, Science and Technology, a post he occupied until
1996.
Georgi Angelov is the author of more than 50 publications in
the fields of science studies and science policy. His main fields
of research are international scientific cooperation, innovation
policy and national and regional innovation systems.
Kostadinka Ivanova Simeonova, DrSc, has been Director of
the Centre for Science Studies and the History of Sciences of
the Bulgarian Academy of Sciences since 1995. She is a
Member of the Supreme Commission of Attestation of
Scientists and a National Expert for the EU’s Sixth Framework
Programme covering 2003–07 (Priority–7).
Kostadinka Simeonova is a member of the Editorial Board of
the journal Strategies of Educational and Science Policy, and
has authored more than 100 publications in the fields of
science studies and science policy. Her main research interests
are science policy, research evaluation and the methodology
of science.
Ivo Slaus, PhD, has been Professor of Physics at the Rudjer
Boškoviç Institute since 1968. In the course of his research
career, he has focused on nuclear and particle physics, medical
physics (radiopharmaceuticals and radiotherapy) and science
policy. In the latter domain, he has been active in setting up
international centres and fostering ties with scientists in the
diaspora.
He occupied the post of Foreign Secretary of the Croatian
Academy of Sciences and Arts betwen 1992 and 1997 and has
been a fellow of the Academy since 1977. He is a founding
fellow of the Academia Europaea (since 1988) and former
chairman of the Physics Section (1990–94). He is currently
president of the Croatian branch of Pugwash and
Deputy–Director General of the Interuniversity Centre in
Dubrovnik.

![7-3 Modified Angelov model for an exploratory GaN- HEMT ...in4.iue.tuwien.ac.at/pdfs/sispad2017/SISPAD_2017_117-120.pdf · The Angelov model [5], developed from the Curtice FET model](https://img.pdfslide.us/doc/110x75/610a1eebff39f252d315766b/7-3-modified-angelov-model-for-an-exploratory-gan-hemt-in4iue-the-angelov.jpg)