Embed Size (px)
Citation preview
KEY CLIMATE CHANGE POLICIESAND POLICY APPROACHES
REPORTED BY ANNEX I PARTIESIN THE THIRD NATIONAL
COMMUNICATIONS
Katia Simeonova Programme OfficerUNFCCC secretariat
UNFCCC Side Event on “Good Practices” in Policies and Measures
21 October, 2002, New Delhi, India
2
Outline of the presentation• Overview of policies reported
• Policies and measures, and emission trends of Annex I Parties
• Evolution of climate change policies between NC2 and NC3:
• A new integrated approach to climate policy formulation and implementation
• Criteria used for climate change policy design and implementation
• Monitoring and evaluation
• Role of new technologies
• Some policy trends by sector
• Conclusions
3
Overview of the policies reported• Continuity with policies from NC1 and NC2
• New policies having climate change mitigation as a primary objective
• Mitigation of CO2 from energy and transport the most important
• Significant emission reductions from non-CO2 gases: cost-effective measures, or cost associated with other objectives
• Wider involvement of regional and local governments in CC
• EIT Parties: role of charmonization with the EU legislation
4
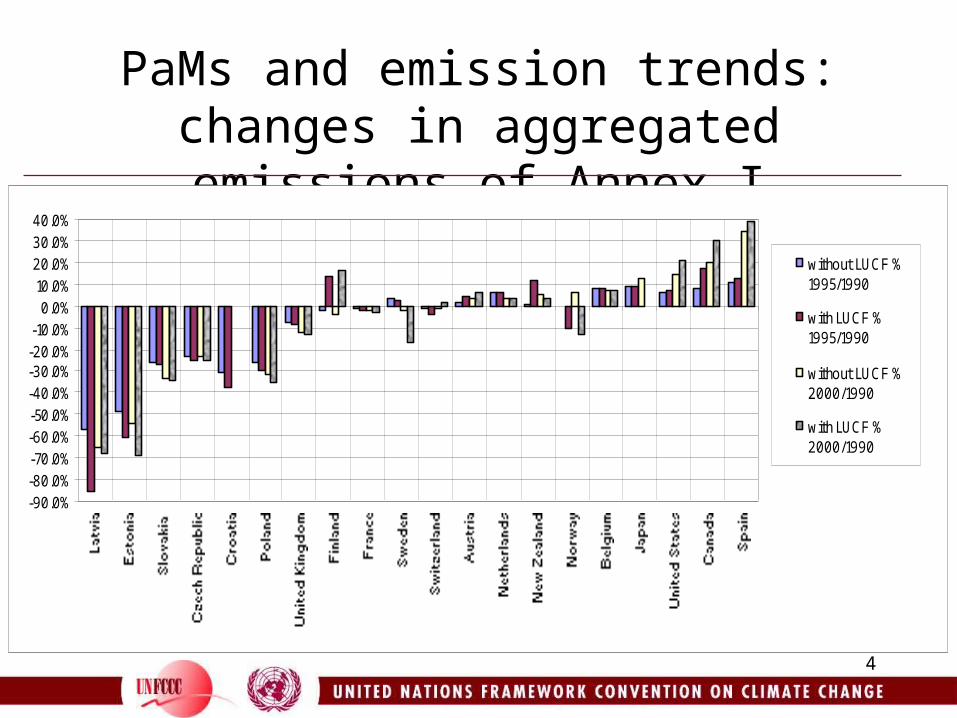
PaMs and emission trends: changes in aggregated emissions of Annex I
-90.0%-80.0%-70.0%-60.0%-50.0%-40.0%-30.0%-20.0%-10.0%
0.0%10.0%20.0%30.0%40.0%
without LUCF %1995/1990
with LUCF %1995/1990
without LUCF %2000/1990
with LUCF %2000/1990
5
PaMs and emission trends: main drivers Annex II
• The EC, Finland, France, Sweden, Switzerland and the U.K. contributed significantly to the aim of the Convention
• Main drivers: proactive climate policy (energy efficiency, fuel switching, nuclear power, economic slow down
• More specifically: the U.K. (fuel switch), France (reduction of N2O from chemical industry and nuclear), Finland (fuel shift, renewables, nuclear, transportation strategy)
6
PaMs and emission trends: main drivers EIT
• Emission levels in 2000 far below 1990 levels (66% for Latvia and 23% for Czech Republic)
• Evidence of success towards decoupling of emission growth from economic growth
• Poland: GDP 6.6 % annual growth (1995 and 1997) and 4.3 % (1998 and 1999), emissions continue to decline
7
Evolution of CC policy: overview
• The importance of the KP in shaping CC policy: target driven approach
• CC has risen in importance in the policy agenda
• Diversified policy portfolios with shift towards economic instruments
• Energy sector saw the most significant changes
8
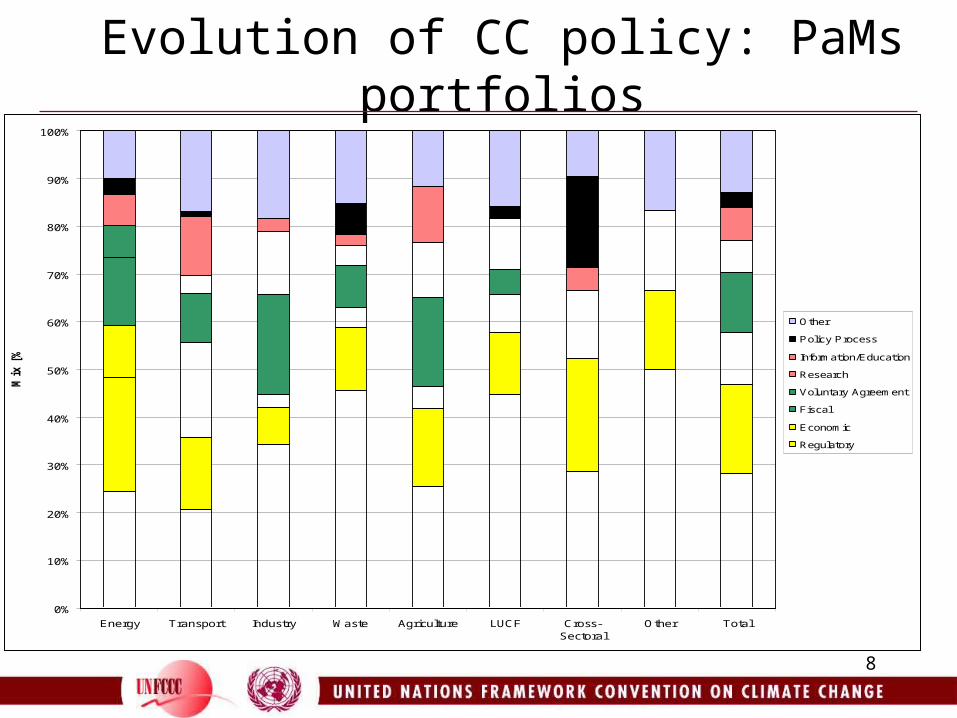
Evolution of CC policy: PaMs portfolios
0%
10%
20%
30%
40%
50%
60%
70%
80%
90%
100%
Energy Transport Industry Waste Agriculture LUCF Cross-Sectoral
Other Total
Mix
[%
]
Other
Policy Process
Information/Education
Research
Voluntary Agreement
Fiscal
Economic
Regulatory
9
Evolution of CC policy: a new integrated approach to climate policy
• Emphasize placed on portfolio approach
– Different portfolios even when national circumstances are similar
• Phased approach (initial and reserve packages of PaMs)
• Greater involvement of local and regional governments and stakeholders
• Examples of integrated approach
10
Evolution of CC policy: some important issues, such as...
• Criteria used for climate change design and implementation
• Monitoring and evaluations
• Role of new technologies
11
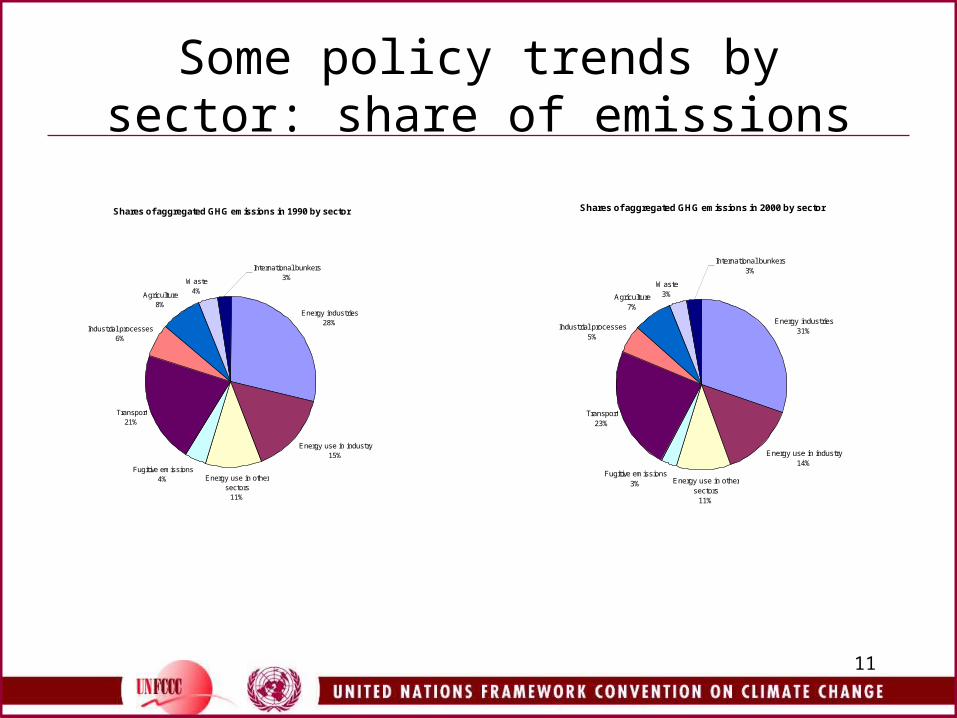
Some policy trends by sector: share of emissions
Shares of aggregated GHG emissions in 1990 by sector
Energy industries28%
Energy use in industry15%
Energy use in other sectors
11%
Fugitive emissions4%
Transport21%
Industrial processes6%
Agriculture8%
Waste4%
International bunkers3%
Shares of aggregated GHG emissions in 2000 by sector
Energy industries31%
Energy use in industry14%
Energy use in other sectors
11%
Fugitive emissions3%
Transport23%
Industrial processes5%
Agriculture7%
Waste3%
International bunkers3%
12
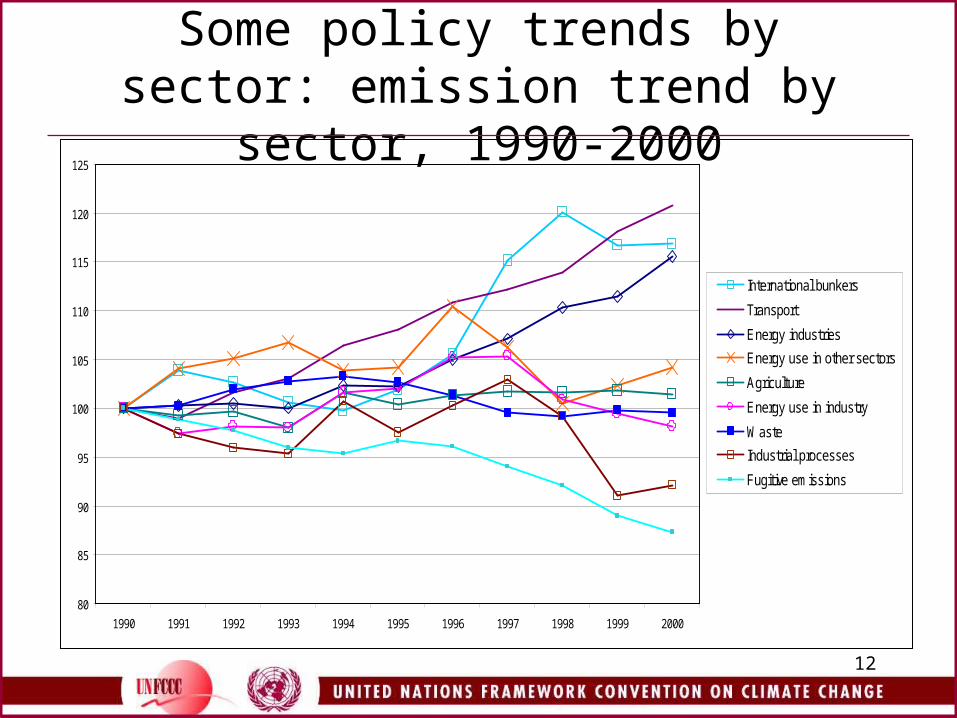
Some policy trends by sector: emission trend by sector, 1990-2000
80
85
90
95
100
105
110
115
120
125
1990 1991 1992 1993 1994 1995 1996 1997 1998 1999 2000
International bunkers
Transport
Energy industries
Energy use in other sectors
Agriculture
Energy use in industry
Waste
Industrial processes
Fugitive emissions
13
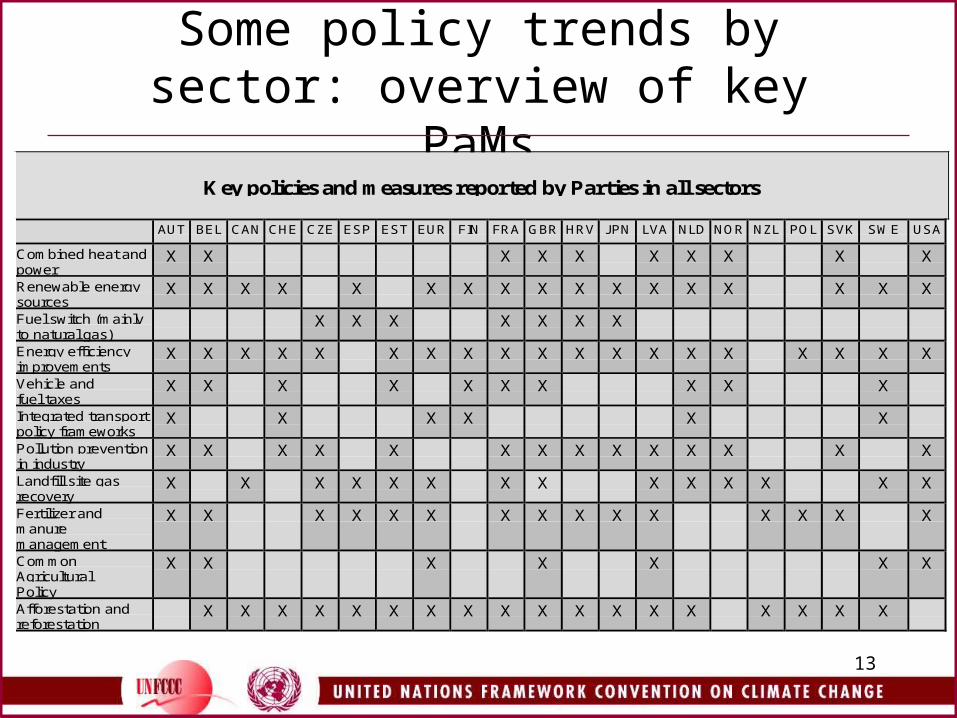
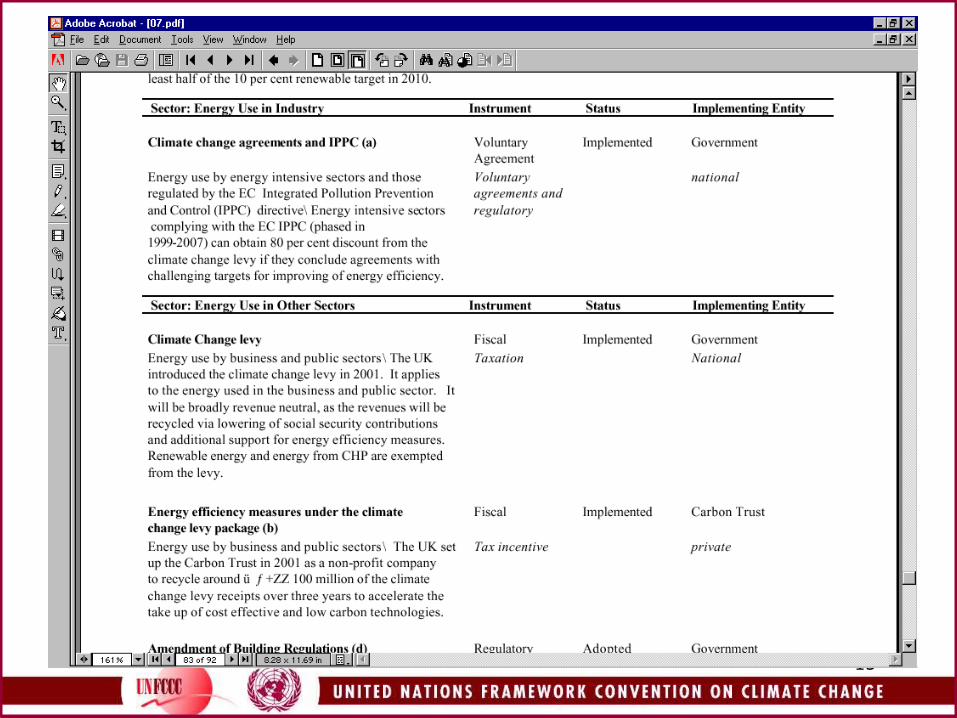
Some policy trends by sector: overview of key PaMs
Key policies and measures reported by Parties in all sectors
AUT BEL CAN CHE CZE ESP EST EUR FIN FRA GBR HRV JPN LVA NLD NOR NZL POL SVK SWE USA
Combined heat andpower
X X X X X X X X X X
Renewable energysources
X X X X X X X X X X X X X X X X X
Fuel switch (mainlyto natural gas)
X X X X X X X
Energy efficiencyimprovements
X X X X X X X X X X X X X X X X X X X
Vehicle andfuel taxes
X X X X X X X X X X
Integrated transportpolicy frameworks
X X X X X X
Pollution preventionin industry
X X X X X X X X X X X X X X
Landfill site gasrecovery
X X X X X X X X X X X X X X
Fertilizer andmanuremanagement
X X X X X X X X X X X X X X X
CommonAgriculturalPolicy
X X X X X X X
Afforestation andreforestation
X X X X X X X X X X X X X X X X X X
14
15
16
Conclusions
• Is there evidence that Annex I Parties were successful in finding a mix of effective policies to control GHG emissions?
• Were these policies sufficient to change the emission trends in the past and to achieve the aim of the Convention?
• Are these policies sufficient to form a framework and set a path to achieve significant emission reductions in the future?