Embed Size (px)
Citation preview

Clemson UniversityTigerPrints
All Dissertations Dissertations
8-2009
UNDERSTANDING THE ANTIOXIDANTMECHANISM OF INORGANIC SELENIUM,OXO- SULFUR, AND POLYPHENOLCOMPOUNDS, AND THE BIOLOGICALIMPLICATIONS OF FUNCTIONALIZEDNANOPARTICLESRia RamoutarClemson University, [email protected]
Follow this and additional works at: https://tigerprints.clemson.edu/all_dissertations
Part of the Inorganic Chemistry Commons
This Dissertation is brought to you for free and open access by the Dissertations at TigerPrints. It has been accepted for inclusion in All Dissertations byan authorized administrator of TigerPrints. For more information, please contact [email protected].
Recommended CitationRamoutar, Ria, "UNDERSTANDING THE ANTIOXIDANT MECHANISM OF INORGANIC SELENIUM, OXO- SULFUR,AND POLYPHENOL COMPOUNDS, AND THE BIOLOGICAL IMPLICATIONS OF FUNCTIONALIZEDNANOPARTICLES" (2009). All Dissertations. 430.https://tigerprints.clemson.edu/all_dissertations/430

UNDERSTANDING THE ANTIOXIDANT MECHANISM OF INORGANIC SELENIUM, OXO- SULFUR, AND POLYPHENOL COMPOUNDS, AND THE BIOLOGICAL IMPLICATIONS OF FUNCTIONALIZED NANOPARTICLES
A Dissertation Presented to
The Graduate School of Clemson University
In Partial Fulfillment of the Requirements for the Degree
Doctor of Philosophy Chemistry
by Ria R. Ramoutar
August 2009
Accepted by: Dr. Julia Brumaghim, Committee Chair
Dr. Kenneth A. Christensen Dr. William T. Pennington
Dr. Jason McNeill
i

ABSTRACT
Inorganic selenium, oxo-sulfur, and polyphenol compounds are found in foods
and dietary supplements, and are recognized for their nutritional benefits and their
potential to treat or prevent diseases caused by oxidative stress. In our experiments to
determine the effects of inorganic selenium compounds on iron-mediated DNA damage,
Na2SeO3 and SeO2 exhibit antioxidant and pro-oxidant activities depending on
concentrations of both the compound and hydrogen peroxide. Additional experiments
demonstrate that iron coordination is a novel mechanism responsible for the observed
activities. In similar experiments, oxo-sulfur compounds prevent Cu+/H2O2-mediated
DNA damage significantly more than DNA damage from Fe2+/H2O2. UV-vis and gel
electrophoresis experiments also confirm that copper coordination is primarily
responsible for the DNA damage inhibition, a novel mechanism that extends to all tested
sulfur and selenium antioxidants. Electrospray ionization mass spectroscopy indicates
that these sulfur and selenium compounds generally bind Cu+ in a 1:1 ratio.
Combinations of bioactive components in foods can affect activity of
antioxidants. For example, adding one equivalent of caffeine to polyphenols has no effect
on DNA damage prevention by epigallocatechin gallate, but significantly decreases the
antioxidant ability of quercetin. In addition, DNA damage prevention studies on peach
extracts indicate that genetically-modified peach cultivars prevent more DNA damage
than unmodified cultivars. In contrast, tetraphenyl-porphyrin-doped conjugated polymer
dot nanoparticles cause DNA backbone and base damage upon irradiation, suggesting
that these nanoparticles may be efficient photosensitizers for photodynamic therapy
i

ii
(PDT). Our studies also show H2O2 formation by and iron association with polyethylene
glycol (PEG) and PEG-functionalized beads at biologically-relevant concentrations.
Since Fe2+ and H2O2 react to form damaging hydroxyl radical, use of PEG-functionalized
nanoparticles in medical applications may cause oxidative stress. Overall, this work has
elucidated of antioxidant and pro-oxidant mechanisms of inorganic selenium, oxo-sulfur,
and polyphenol compounds, as well as the potential toxicity of functionalized
nanomaterials used for PDT and other medical applications.

DEDICATIONS
I dedicate this dissertation to my parents, Phagoo and Gowra Ramoutar, and
sisters Reshma and Asha for their encouragement, love and support that allowed me to
achieve this measure of academic success. The strength and support of my family made
me believe that all things are possible through hard work and dedication.
iii
ACKNOWLEDGEMENTS
Firstly, I would like to thank my advisor, Dr. Julia L. Brumaghim, for allowing
me to participate in research projects in the very interesting and exciting field of
bioinorganic chemistry. I would like to thank Dr. Brumaghim for her continuous
mentoring, guidance, and support throughout my graduate academic career. I am
especially grateful for the invaluable knowledge and experience gained from her.
I would also like to thank Mrs. Barbara Lewis for making my experience as a
teaching assistant very interesting and enjoyable. It was truly a pleasure working under
her supervision. Special thanks to both Joy Castro and Carolyn Quarles for training and
assisting me in both ICP and ESI mass spectroscopies. I would like to acknowledge my
collaborators, including Dr. Jason McNeill, Dr. Albert Abbott, and Dr. Pamela Riggs-
Gelasco.
I would especially like to thank my family and friends in Trinidad and Tobago
and Canada for their continuous love, support, and guidance, which has been invaluable
to me throughout my academic career while in the United States. I would also like to
acknowledge Rajashree Sathyamurthy, Mark Bradshaw, Erin Battin, and Jared Knutt, for
their ongoing support and friendship. Special thanks to the Brumaghim group members,
including Andrea Verdan, for their witty comments, humor, support and friendship,
which made research an enjoyable experience.
iv

TABLE OF CONTENTS
ABSTRACT......................................................................................................................... i DEDICATIONS................................................................................................................. iii ACKNOWLEDGEMENTS............................................................................................... iii TABLE OF CONTENTS................................................................................................... iv LIST OF TABLES............................................................................................................ vii LIST OF FIGURES ........................................................................................................... xi CHAPTER
1. A REVIEW OF THE ANTIOXIDANT AND ANTICANCER PROPERTIES AND MECHANISMS OF INORGANIC SELENIUM, OXO-SULFUR, AND OXO-SELENIUM COMPOUNDS
Introduction .................................................................................................. 1 Selenium bioavailability, related pathologies, and biological effects .......... 8 Pathologies associated with selenium deficiency and toxicity..................... 9 Antioxidant and anticancer activities of inorganic selenium compounds .. 13 Selenium speciation and anticancer activity .............................................. 16 Mechanisms of antioxidant and anticancer activity for inorganic selenium
compounds ............................................................................................. 17 Bioavailability and activity of oxo-sulfur and oxo-selenium compounds . 19 Antioxidant and pro-oxidant effects of oxo-sulfur compounds in disease
prevention .............................................................................................. 23 Antioxidant and pro-oxidant mechanisms of oxo-sulfur compounds ........ 28 Oxo-selenium compounds.......................................................................... 32 Conclusions ................................................................................................ 33 References .................................................................................................. 36
2. EFFECTS OF INORGANIC SELENIUM COMPOUNDS ON OXIDATIVE
DNA DAMAGE
Introduction ................................................................................................ 56 Results ........................................................................................................ 59 Discussion .................................................................................................. 70 Conclusions ................................................................................................ 76 Materials and methods................................................................................ 77 References .................................................................................................. 91
v
vi
3. INVESTIGATING THE ANTIOXIDANT PROPERTIES OF OXO-SULFUR
COMPOUNDS ON METAL-MEDIATED DNA DAMAGE
Introduction ................................................................................................ 95 Results and discussion................................................................................ 98 Conclusions .............................................................................................. 116 Materials and methods.............................................................................. 117 References ................................................................................................ 130
4. INVESTIGATING THE ABILITY OF π-CONJUGATED POLYMER
NANOPARTICLES TO PROMOTE OXIDATIVE DNA DAMAGE
Introduction .............................................................................................. 135 Toxicity of nanoparticles.......................................................................... 139 Results and discussion.............................................................................. 140 Conclusions .............................................................................................. 151 Materials and methods.............................................................................. 152 References ................................................................................................ 159
5. INTERACTIONS OF CAFFEINE WITH POLYPHENOLS AND THE
ABILITY OF PEACH ANTHOCYNANINS TO PREVENT OXIDATIVE DNA DAMAGE
Introduction .............................................................................................. 166 Results and discussion.............................................................................. 172 Conclusions .............................................................................................. 185 Materials and methods.............................................................................. 187 References ................................................................................................ 197
6. CONCLUSIONS ABOUT THE ANTIOXIDANT ACTIVITIES OF
INORGANIC SELENIUM, OXO-SULFUR, AND POLYPHENOL COMPOUNDS AND THE BIOLOGICAL IMPLICATIONS OF NANOPARTICLE FUNCTIONALIZATION
References ................................................................................................ 211

LIST OF TABLES
Table Page
2.1. Summary of effects of inorganic selenium compounds on DNA damage under Mode I and Mode II conditions. .......................................................................... 71
2.2. Tabulation for electrophoresis results for Na2SeO3 with Fe2+ (2 μM) and H2O2
(50 μM) in Mode I (pH 6). .................................................................................. 82
2.3. Tabulation for electrophoresis results for Na2SeO4 with Fe2+ (2 μM) and H2O2 (50 μM) in Mode I (pH 6). .................................................................................. 83
2.4. Tabulation for electrophoresis results for Na2Se with Fe2+ (2 μM) and H2O2 (50
μM) in Mode I (pH 6). ........................................................................................ 83
2.5. Tabulation for electrophoresis results for SeO2 with Fe2+ (2 μM) and H2O2 (50 μM) in Mode I (pH 6). ........................................................................................ 84
2.6. Tabulation for electrophoresis results for Na2SeO3 with [Fe(EDTA)]2- (400 μM)
and H2O2 (50 μM) in Mode I (pH 6). .................................................................. 84 2.7. Tabulation for electrophoresis results for SeO2 with [Fe(EDTA)]2- (400 μM) and
H2O2 (50 μM) in Mode I (pH 6).......................................................................... 85 2.8. Tabulation for electrophoresis results for Na2SeO3 and H2O2 (50 mM)
withoutFe2+ in Mode II (pH 6). ........................................................................... 85 2.9. Tabulation for electrophoresis results for Na2SeO4 with Fe2+ (2 μM) and H2O2
(50 mM) in Mode II (pH 6). ................................................................................ 86 2.10. Tabulation for electrophoresis results for Na2Se with Fe2+ (2 μM) and H2O2 (50
mM) in Mode II (pH 6). ...................................................................................... 86 2.11. Tabulation for electrophoresis results for SeO2 with Fe2+ (2 μM) and H2O2 (50
mM) in Mode II (pH 6). ...................................................................................... 87 2.12. Tabulation for electrophoresis results for SeO2 with [Fe(EDTA)]2- (400 μM)
and H2O2 (50 mM) in Mode II (pH 6)................................................................. 87 2.13. Tabulation for electrophoresis results for Na2SeO3 with Cu+ (6 μM) and H2O2
(50 μM) at pH 7……………………………………………………………..…88
vii

2.14. Tabulation for electrophoresis results for Na2SeO4with Cu+ (6 μM) and H2O2
(50 μM) at pH 7……………………………………………………………….88 2.15. Tabulation for electrophoresis results for Na2Se2 with Cu+ (6 μM) and H2O2 (50
μM) at pH 7…………………………………………..……………………….89 2.16. Tabulation for electrophoresis results for SeO2 with Cu+ (6 μM) and H2O2 (50
μM) at pH 7……………………………………..……………………………..89 2.17. Tabulation for electrophoresis results for Na2SeO3 with [Cu(bipy)]+ (50 μM)
and H2O2 (50 μM) at pH 7…………………………………………………….90 2.18. Tabulation for electrophoresis results for Na2SeO3 with [Cu(bipy)]+ (50 μM)
and H2O2 (50 μM) at pH 7…………………………………………………….90 3.1. IC50 values and λmax for oxo-sulfur compounds with Cu+ and H2O2 and maximal
DNA damage inhibition for Fe2+ and H2O2....................................................... 101 3.2. IC50 and ESI-MS values of selenium and sulfur compounds discussed in this
chapter. .............................................................................................................. 113 3.2. Tabulation for electrophoresis results for MeCysSO with Cu2+ (6 μM), ascorbate
(7.5 μM) and H2O2 (50 μM) at pH 7. ................................................................ 122 3.3. Tabulation for electrophoresis results for MetSO with Cu2+ (6 μM), ascorbate
(7.5 μM) and H2O2 (50 μM) at pH 7. ................................................................ 123 3.4. Tabulation for electrophoresis results for MMTS with Cu2+ (6 μM), ascorbate
(7.5 μM) and H2O2 (50 μM) at pH 7. ................................................................ 124 3.5. Tabulation for electrophoresis results for MePhSO with Cu2+ (6 μM), ascorbate
(7.5 μM) and H2O2 (50 μM) at pH 7. ................................................................ 124 3.6. Tabulation for electrophoresis results for Me2SO2 with Cu2+ (6 μM), ascorbate
(7.5 μM) and H2O2 (50 μM) at pH 7. ................................................................ 125 3.7. Tabulation for electrophoresis results for MetSO with [Cu(bipy)2]2+ (50 μM),
ascorbate (62.5 μM) and H2O2 (50 μM) at pH 7............................................... 125
viii
3.8. Tabulation for electrophoresis results for MeCysSO with [Cu(bipy)2]2+ (50 μM), ascorbate (62.5 μM) and H2O2 (50 μM) at pH 7............................................... 126
3.9. Tabulation for electrophoresis results for MMTS with [Cu(bipy)2]2+ (50 μM),
ascorbate (62.5 μM) and H2O2 (50 μM) at pH 7............................................... 126 3.10. Tabulation for electrophoresis results for MetSO with Fe2+ (2 μM) and H2O2 (50
μM) at pH 6. ...................................................................................................... 127 3.11. Tabulation for electrophoresis results for MeCysSO with Fe2+ (2 μM) and H2O2
(50 μM) at pH 6................................................................................................. 127 3.12. Tabulation for electrophoresis results for MMTS with Fe2+ (2 μM) and H2O2
(50 μM) at pH 6................................................................................................. 128 3.13. Tabulation for electrophoresis results for MePhSO with Fe2+ (2 μM) and H2O2
(50 μM) at pH 6................................................................................................. 128 3.14. Tabulation for electrophoresis results for Me2SO2 with Fe2+ (2 μM) and H2O2
(50 μM) at pH 6................................................................................................. 129 3.15. Tabulation for electrophoresis results for MetSO with [Fe(EDTA)]2 (400 μM)
and H2O2 (50 μM) at pH 7. ............................................................................... 129 3.16. Tabulation for electrophoresis results for MMTS with [Fe(EDTA)]2 (400 μM)
and H2O2 (50 μM) at pH 7. ............................................................................... 130 4.1. Tabulation for electrophoresis results for DNA backbone damage upon
irradiation of TPP-doped CP dot nanoparticles................................................. 158 4.2. Tabulation for electrophoresis results for DNA base damage upon irradiation of
TPP-doped CP dot nanoparticles....................................................................... 158
4.3. Tabulation for iron concentration associated to silica beads as determined from the [Fe(EDTA)]2- calibration curve……………………………..……………..158
4.4. Tabulation for iron concentration associated to PEG-TMS as determined from the [Fe(EDTA)]2- calibration curve……………………………..……………..158
5.1. Flesh and skin color, and estimated anthocyanin concentrations of various peach
cultivars discussed in this chapter. .................................................................... 180
ix

x
5.2. Tabulation for electrophoresis results for caffeine with Fe2+ (2 μM) and H2O2 (50 μM) at pH 6. ...................................................................................................... 192
5.3. Tabulation for electrophoresis results for EGCG and caffeine with Fe2+ (2 μM)
and H2O2 (50 μM) at pH 6. ............................................................................... 193 5.4. Tabulation for electrophoresis results for Q and caffeine with Fe2+ (2 μM) and
H2O2 (50 μM) at pH 6. ...................................................................................... 194 5.5. Tabulation for electrophoresis results for Red Globe peach extract with Fe2+ (2
μM) and H2O2 (50 μM) at pH 6. ....................................................................... 195 5.6. Tabulation for electrophoresis results for Lovell peach extract with Fe2+ (2 μM)
and H2O2 (50 μM) at pH 6. ............................................................................... 195 5.7. Tabulation for electrophoresis results for Sugar Giant peach extract with Fe2+ (2
μM) and H2O2 (50 μM) at pH 6. ....................................................................... 196 5.8. Tabulation for electrophoresis results for BY peach extract with Fe2+ (2 μM) and
H2O2 (50 μM) at pH 6. ...................................................................................... 196

LIST OF FIGURES
Figure Page 1.1. Structures of inorganic and other selenium compounds discussed in this chapter. ..... 6 1.2. Structures of oxo-sulfur and oxo-selenium compounds discussed in this chapter. ..... 7 1.3. Coordination of iron to selenite in Fe2(H2O)4(SeO3)2 reported by Xiao et al.177 ...... 19 1.4. Production of allicin from alliin by alliinase. ............................................................ 21 1.5. Oxidation of methionine to methionine sulfoxide by hydrogen peroxide. ................ 23 2.1. Selenium compounds tested: (1) selenium dioxide, SeO2, (2) sodium selenite,
Na2SeO3, (3) sodium selenate, Na2SeO4, and (4) sodium selenide, Na2Se. .............. 58 2.2. DNA gel electrophoresis experiments for (A) Na2SeO3, (B) Na2SeO4, (C) Na2Se, and
(D) SeO2 under Mode I conditions. For each gel, lane 1: 1 kb ladder; lanes 2-5: plasmid, H2O2 (50 μM), Na2SeO3, Na2SeO4, SeO2 (5000 μM) or Na2Se (200 μM), and Fe2+ (2 μM) respectively; lanes 6-10: 0.5, 5, 50, 500 and 5000 μM of Na2SeO3, Na2SeO4, and SeO2 respectively, or 0.5, 5, 50, 100 and 200 μM of Na2Se. ............. 60
2.3. Percent DNA damage inhibition graph for Na2SeO3, Na2SeO4, SeO2, and Na2Se
under Mode I conditions. Error bars represent standard deviations calculated from the average of three trials. ......................................................................................... 61
2.4. DNA gel electrophoresis experiments for (A) Na2SeO3 and (B) SeO2 with
[Fe(EDTA)]2- under Mode I conditions. For each gel, lane 1: 1 kb ladder; lanes 2-5: plasmid, H2O2 (50 μM), Se compound (5000 μM) and [Fe(EDTA)]2- (400 μM) respectively; lanes 6-10: 0.5, 5, 50, 500, and 5000 μM respectively of either Na2SeO3 or SeO2. ...................................................................................................... 63
2.5. DNA gel electrophoresis experiments for (A) Na2SeO3, (B) Na2SeO4, (C) Na2Se and
(D) SeO2 under Mode II conditions. For (A) Na2SeO3 lane 1: 1 kb ladder; lanes 2-4: plasmid, H2O2 (50 mM), and Na2SeO3 (5000 μM) respectively; lanes 5-9 have H2O2 + 0.5, 5, 50, 500, 5000 μM Na2SeO3, respectively. For gels B-D, lane 1: 1 kb ladder; 2-5: plasmid, H2O2 (50 mM), H2O2 + Na2SeO4, SeO2 (5000 μM) or Na2Se (200 μM), H2O2 + Fe2+ (2 μM); lanes 6-10: H2O2 + Fe2+ + 0.5, 5, 50, 500 and 5000 μM of Na2SeO4 or SeO2 respectively. For Na2Se, lanes 6-10: H2O2 + Fe2+ + 0.5, 5, 50, 100 and 200 μM Na2Se, respectively……………………................................................64
xi

2.6. A) Percent DNA damage graph for 0.5-5000 μM Na2SeO3 under Mode II conditions in the absence of Fe2+ B) Percent DNA damage inhibition graph for 0.5-5000 μM Na2SeO4 and SeO2, and 0.5-200 μM Na2Se under Mode II conditions in the presence of Fe2+ (2 μM) and H2O2 (50 mM). Error bars for both graphs represent standard deviations calculated from the average of three trials. .............................................. 65
2.7. DNA gel electrophoresis experiments for SeO2 with [Fe(EDTA)]2- under Mode II
conditions. Lane 1: 1 kb ladder; lanes 2-5: plasmid, H2O2 (50 μM), SeO2 (5000 μM) and [Fe(EDTA)]2- (400 μM), respectively; lanes 6-10: 0.5, 5, 50, 500, and 5000 μM SeO2, respectively. .................................................................................................. 666
2.8. DNA gel electrophoresis experiments for (A) Na2SeO3, (B) Na2SeO4, (C) Na2Se, and (D) SeO2 for Cu+. For each gel, lane 1: 1 kb ladder; lanes 2-5: plasmid, H2O2 (50
μM), Na2SeO3, Na2SeO4, SeO2 (5000 μM) or Na2Se (200 μM), Cu2+ (6 μM), and ascorbic acid (7.5 μM) respectively; lanes 6-10: 0.5, 5, 50, 500 and 5000 μM of Na2SeO3, Na2SeO4, and SeO2 respectively, or 0.5, 5, 50, 100 and 200 μM of Na2Se…………………………………………………………………………………67
2.9. Percent DNA damage inhibition graph for Na2SeO3, Na2SeO4, SeO2, and Na2Se with
Cu+. Error bars represent standard deviations calculated from three trials…………………………………………………………………………………..68
2.10: DNA gel electrophoresis experiments for (A) Na2SeO3 and (B) SeO2 with [Cu(bipy)2]+. For each gel, lane 1: 1 kb ladder; lanes 2-5: plasmid, H2O2 (50 μM), Se compound (5000 μM), [Cu(bipy)2]2+ (50 μM), ascorbic acid ( 62.5 μM) and respectively; lanes 6-10: 0.5, 5, 50, 500, and 5000 μM respectively of either Na2SeO3 or SeO2…………………………………………………………………………..….69
2.11. 77Se NMR spectra of Na2SeO3 at (A) pH 6 and (B) pH 7. Both spectra show a
singlet at δ 1274. ..................................................................................................... 81 2.12. 77Se NMR spectra of SeO2 at (A) pH 6 with a singlet at δ 1317, and (B) pH 7 with a
singlet at δ 1299. ..................................................................................................... 81 3.1. Structures of oxo-sulfur compounds discussed in this chapter: allicin, methionine
sulfoxide (MetSO), methylcysteine sulfoxide (MeCysSO), methyl phenyl sulfoxide (MePhSO), methyl methanethiosulfonate, (MMTS), and dimethyl sulfone (Me2SO2).................................................................................................................................... 97
xii

3.2. A) Agarose gel showing the effect of MeCysSO on Cu+-mediated DNA damage. Lanes: 1) 1 kb DNA ladder; 2) plasmid DNA (p); 3) p + H2O2; 4) p + H2O2 + MetSO; 5) p + H2O2 + Cu2+/ascorbate; 6-15) same as lane 5 with increasing [MeCysSO]: 0.1, 1, 3, 5, 7, 10, 50, 100, 1000, 1500 μM, respectively. B) Plot of DNA damage inhibition vs. log concentration of MeCysSO. The line indicates the best-fit sigmoidal dose-response curve, and error bars show the standard deviation of three duplicate trials (error bars are smaller than symbols). ..................................... 99
3.3. Gel images showing the ability of oxo-sulfur compounds to inhibit Cu+-mediated
DNA damage using 6 μΜ Cu2+, 7.5 μM ascorbate and 50 μM H2O2 in 10 mM MOPS buffer (pH 7). Tabulated data (Tables 3.3-3.3.6) give the concentrations for each oxo-sulfur compound. A) methionine sulfoxide (MetSO); B) methyl methanethiosulfonate (MMTS); C) methyl phenyl sulfoxide; and D) dimethyl sulfone (Me2SO2). ................................................................................................... 102
3.4. Best-fit sigmoidal dose-response curve of percent DNA damage inhibition with
Cu+/H2O2 versus log concentration of methionine sulfoxide (μM) to determine the concentration required to inhibit 50% of DNA damage (IC50). Error bars show the standard deviation of three duplicate trials (error bars are smaller than symbol). .. 102
3.4. Agarose gel showing the effect of MeCysSO on Fe2+-mediated DNA damage. Lanes:
1) 1 kb DNA ladder; 2) plasmid DNA (p); 3) p + H2O2; 4) p + H2O2 + MeCysSO; 5) p + H2O2 + Fe2+, 6-10) same as lane 5 with increasing [MeCysSO]: 0.1, 1, 10, 100, 1000 μM, respectively............................................................................................. 103
3.5. Gel images showing the ability of oxo-sulfur compounds to inhibit Fe2+-mediated
DNA damage using 2 μΜ Fe2+and 50 μM H2O2 in 10 mM MES buffer (pH 6). Tabulated data (Tables 3.11-3.14) give the concentrations for each oxo-sulfur compound. A) methionine sulfoxide (MetSO); B) methyl methanethiosulfonate (MMTS); and C) methyl phenyl sulfoxide; and D) dimethyl sulfone (Me2SO2). ... 104
3.6. UV-vis spectra of MetSO (116 μM), Cu2+/ascorbic acid (AA; 58 μM and 72.5 μM,
respectively), and Cu2+/ascorbic acid + MetSO in water at pH 7. .......................... 105 3.7. Agarose gel showing the effect of MetSO with [Cu(bipy)2]+ . Lanes: 1) 1 kb DNA
ladder; 2) plasmid DNA (p); 3) p + H2O2; 4) p + H2O2 + MetSO; 5) p + H2O2 + [Cu(bipy)2]2+/ascorbate; 6-10) same as lane 5 with increasing [MetSO]: 0.1, 1, 10, 100, 1000 μM, respectively..................................................................................... 106
xiii

3.8. Gel images showing the ability of oxo-sulfur compounds to inhibit [Cu(bipy)2]+-mediated DNA damage using 50 μΜ [Cu(bipy)2]+, 62.5 μM ascorbate and 50 μM H2O2 in 10 mM MOPS buffer (pH 7). Tabulated data (Tables 3.8-3.9) give the concentrations for each oxo-sulfur compound. A) methylcysteine sulfoxide (MeCysSO) and B) methyl methanethiosulfonate (MMTS)................................... 107
3.9. Gel images showing the ability of oxo-sulfur compounds to inhibit [Fe(EDTA)]2--
mediated DNA damage using 400 μΜ [Fe(EDTA)]2- and 50 μM H2O2 in 10 mM MES buffer (pH 6). Tabulated data (Tables 3.15-3.16) give the concentrations for each oxo-sulfur compound A) methyl-cysteine sulfoxide (MeCysSO) and B) methyl methanethiosulfonate (MMTS). .............................................................................. 108
3.10. UV-vis spectra of oxo-sulfur compounds (116 μM), Cu2+ (58 μM)/ascorbate (72.5 μM), and oxo-sulfur compound + Cu2+/ascorbate with MOPS buffer (pH 7, 10 mM): A) methylcysteine sulfoxide (MeCysSO) B) methyl methanethiosulfonate (MMTS); and C) methyl phenyl sulfoxide; and D) dimethyl sulfone (Me2SO2). . 108 3.11. UV-vis spectra of oxo-sulfur compounds (300 μM), Fe2+ (150 μM), and oxo-sulfur compound + Fe2+ maintained at pH 6 with MES buffer (10 mM): A: methionine sulfoxide (MetSO); B: methyl-cysteine sulfoxide (MeCysSO) C: methyl methanethiosulfonate (MMTS); and D: methyl phenyl sulfoxide; and E: dimethyl sulfone (Me2SO2). .................................................................................................. 109 3.12. Structures of selenium and sulfur compounds discussed in this chapter. .............. 111 4.1. Agarose gel image showing DNA backbone and base damage after irradiation of
TPP-doped CP dot nanoparticles over time. (A) For DNA backbone damage, lanes: 1) 1 kb DNA ladder; 2) plasmid DNA (p); 3) p + H2O2 (50 µM); 4) p + Fe2+ (2 μM); 5-8) p + TPP-doped CP dot nanoparticles irradiated for 0, 50, 100, and 200 min, respectively. (B) For DNA base damage, lanes: 1) 1 kb DNA ladder; (2) p + Fpg enzyme; 3-6) lane 2 + TPP-doped CP dot nanoparticles irradiated for 0, 50, 100, and 200 min, respectively, prior to Fpg digestion.......................................................... 142
4.2. Bar graph showing the effect of TPP-doped CP dot nanoparticles on DNA backbone
and base damage upon irradiation at different time intervals. (A) Lanes for DNA backbone damage: 2) plasmid DNA (p); 3) p + H2O2 (50 µM); 4) p + Fe2+ (2 μM) + H2O2; and 5-8) p + TPP-doped CP dot nanoparticles irradiated for 0, 50, 100, and 200 min, respectively. (B) Lanes for DNA base damage: 2) p + Fpg enzyme; and 3-6) lane 2 + TPP-doped CP dot nanoparticles irradiated for 0, 50, 100, and 200 min, respectively, prior to Fpg digestion. ........................................................................ 143
4.3. Calibration curve of absorbance at 593 nm (A593) vs. hydrogen peroxide
concentration as measured by the FOX assay. ........................................................ 145
xiv

4.4. Graph showing the amount of peroxide formed from PEG and PEG-TMS under light
and dark conditions at 37 °C and 80 °C. ................................................................. 146 4.5. Calibration curve for iron intensity vs. [(Fe(EDTA)]2- concentrations (μM) measured
by ICP-MS............................................................................................................... 149 4.6. Graph showing the concentration of iron associated with PEGylated silica and
unfunctionalized silica microspheres. ..................................................................... 150 5.1. Structures of gallol, catechol, quercetin (Q), and compounds found in green tea:
caffeine and epigallocatechin gallate (EGCG). ....................................................... 168 5.2. Gel electrophoresis image of caffeine under Fenton reaction conditions. Lane 1: 1 kb
ladder, lane 2: plasmid only (p), lane 3: p + H2O2 (50 μM), lane 4: p + H2O2 (50 μM) + caffeine (500 μM), lane 5: p + H2O2 (50 μM) + Fe2+ (2 μM), lanes 6-20: lane 5 + increasing concentrations of caffeine (0.0005, 0.001, 0.01, 0.02, 0.05, 0.2, 2, 4, 10, 50, 100, 200, 300, 400 and 500 μM, respectively).................................................. 172
5.3. Gel electrophoresis image of (-)-epigallocatechin-3-gallate (EGCG) and caffeine
under Fenton reaction conditions. Lane 1: 1 kb ladder, lane 2: plasmid only (p), lane 3: p + H2O2 (50 μM), lane 4: p + H2O2 (50 μM) + EGCG/caffeine (500 μM), lane 5: p + H2O2 (50 μM) + Fe2+ (2 μM), lanes 6-16: lane 5 + increasing concentrations of EGCG and caffeine (0.0005, 0.001, 0.01, 0.02, 0.05, 0.2, 2, 4, 10, 50, 100 μM, respectively). ........................................................................................................... 173
5.4. Percent DNA damage inhibition graph of a 1:1 ratio of (-)-epigallocatechin-3-gallate
(EGCG) and caffeine under Fenton reaction conditions (2 μM Fe2+ + 50 μM H2O2). Standard deviations were calculated from three separate trials at the concentrations shown. The best-fit sigmoidal dose-response curve (black line) was used to determine the IC50 value.......................................................................................... 174
5.5. Gel electrophoresis image of quercetin (Q) and caffeine under Fenton reaction
conditions. Lane 1: 1 kb ladder, lane 2: plasmid only (p), lane 3: p + H2O2 (50 μM), lane 4: p + H2O2 (50 μM) + Q/caffeine (500 μM), lane 5: p + H2O2 (50 μM) + Fe2+ (2 μM), lanes 6-20: lane 5 + increasing concentrations of Q and caffeine (0.0005, 0.001, 0.01, 0.02, 0.05, 0.2, 2, 4, 10, 50, 100, 200, 300, 400, and 500μM, respectively). ........................................................................................................... 175
5.6. Percent DNA damage inhibition graph of a 1:1 ratio of quercetin and caffeine under
Fenton reaction conditions (2 μM Fe2+ + 50 μM H2O2). Standard deviations were calculated from three separate trials at the concentrations shown. The best-fit sigmoidal dose-response curve (black line) was used to determine the IC50 value. 176
xv

xvi
5.7. Structures of gallic acid (GA), protocatechuic acid (PCA), and the anthocyanin,
cyanidin-3-rutinoside............................................................................................... 179 5.7. DNA gel electrophoresis experiments for peach extracts: (A) Red Globe, (B) Lovell,
(C) Sugar Giant, and (D) BY under Fenton reaction conditions at pH 6. For each gel, lanes 1) 1 kb ladder; 2) plasmid (p); 3) p + H2O2 (50 μM); 4) p + H2O2 (50 μM) + Red Globe, Sugar Giant, BY, or Lovell; 5) p + H2O2 (50 μM) + Fe2+ (2 μM); and 6-10) 1.7, 3.4, 6.9, 17, and 34 μM of Red Globe, Sugar Giant, or BY extracts, respectively or 6.9, 17, 34, 68, and 170 μM of Lovell extract, respectively........... 181
5.8. Percent DNA damage inhibition of Red Globe, Lovell, Sugar Giant, and BY peach
extracts at A) ~6.9 μM and B) ~17 μM................................................................... 183 5.9. Calibration curves for A) gallic acid (GA) and B) protocatechuic acid (PCA) using
the Folin-Ciocalteu method. .................................................................................... 185
CHAPTER ONE
A REVIEW OF THE ANTIOXIDANT AND ANTICANCER PROPERTIES AND
MECHANISMS OF INORGANIC SELENIUM, OXO-SULFUR, AND OXO-
SELENIUM COMPOUNDS
Introduction
The generation of reactive oxygen species (ROS) has dual functionality in
biological systems, with both beneficial and detrimental effects in cells.1,2 ROS
generation at low or moderate concentrations aids in the defense against infectious agents
and functions in several cell signaling pathways.1,2 The damaging effects of ROS such as
the superoxide anion radical (O2•-), hydrogen peroxide (H2O2), and hydroxyl radical
(•OH) caused by the overproduction of these species results in oxidative stress, an
unavoidable consequence of aerobic cellular respiration.1-6 ROS damage to lipids,
proteins, and DNA1,2,6,7 is a result of this oxidative stress and leads to several health
conditions including aging,1 cancer,1,8 neurodegenerative diseases such as Parkinson’s
and Alzheimer’s,9-12 and cardiovascular diseases such as arteriosclerosis.13-16
Reactive oxygen species are generated during the reduction of molecular oxygen
(O2) to produce water (H2O) via metabolic processes catalyzed by cytochrome oxidase in
biological systems.5,17 The primary ROS formed as a byproduct of this respiratory
process is the superoxide anion radical (O2•-), generated when molecular oxygen gains an
electron from either the mitochondrial electron transport chain (Reaction 1) or as a result
of UV-irradiation (Reaction 2).1,4,5,17 Further reduction of O2•-, either directly or through
1

enzyme- or metal-catalyzed reactions, results in the formation of secondary ROS such as
hydrogen peroxide (H2O2; Reaction 3) and the hydroxyl radical (•OH; Reaction 4).1,4,5,17
Hydrogen peroxide is also produced directly by protonation of the superoxide radical
anion in solution (Reaction 3), and indirectly upon oxidation of iron-sulfur clusters
(Reaction 5).18,19
O2 + e- → 2 O2•- (1)
O2 + hv → 2 O2•- (2)
2 O2•- + 2H+ → H2O2 + O2 (3)
O2•- + H2O2 + H+ → •OH + O2 + H2O (4)
O2•- + [2Fe2+2Fe3+4S] + 2H+ → [Fe2+3Fe3+4S] + H2O2 (5)
Compared to other ROS, hydrogen peroxide is a non-radical species with
relatively low reactivity.20 It is one of the more commonly studied ROS, and is produced
endogenously by various physiological processes including respiratory burst and
oxidative phosphorylation.21 Calculations to determine the steady-state intracellular
concentrations of hydrogen peroxide in unstressed E. coli cells determined a value of ~20
nM, with a high rate of H2O2 production ranging from 9-22 μM/s.22 Thus, any imbalance
between the rate of H2O2 generation and decomposition may result in significantly
increased H2O2 concentrations and resultant oxidative stress.22,23 24
Linn and colleagues reported bimodal cell killing when E. coli is exposed to
H2O2. Mode I cell killing occurs at low concentrations of H2O2 (1-5 mM) and is faster
than Mode II, which occurs at H2O2 concentrations greater than 10 mM.24,25 Mammalian
cells also show the same bimodal killing as E. coli upon hydrogen peroxide challenge,26
2

and these bimodal kinetics are also observed for iron-mediated oxidative DNA damage in
vitro, where maximal damage under Mode I conditions occurred at 50 μM H2O2 and for
Mode II conditions, at H2O2 concentrations >10 mM.24,25,27 Significantly, H2O2 reacts
with redox-active metal ions to generate hydroxyl radical.5,17,18,20,28 In vivo, hydroxyl
radical has an extremely short half-life (~10-9 s)29,30 and reacts quickly with biomolecules
in proximity to its site of generation, resulting in DNA damage, lipid peroxidation, thiol
depletion, and changes in calcium homeostatsis.1,21,31
Iron and copper are the most commonly studied redox-active metal ions found in
biological systems and are essential in many proteins and enzymes, including ferritin,
transferrin, ceruplasmin, and superoxide dismutase.32 In E. coli, normal intracellular non-
protein-bound (labile) iron concentrations are ~20 μM. However, this concentration
increases significantly to 80-320 μM upon disruption of iron homeostasis and oxidative
stress.20,31,33,34 Although the intracellular concentration of non-protein- bound copper was
calculated to be approximately 10-18 M in yeast, significant amounts of labile copper are
observed in mouse Golgi and mitochondria.35-37 Studies have also reported extracellular
copper concentrations in blood serum and cerebrospinal fluid between 10-25 μM and 0.5-
2.5 μM, respectively, whereas copper concentrations in the synaptic cleft are
approximately 30 μM.38,39 Neural copper concentrations are significantly higher in the
locus ceruleus (stress and panic response center) and substantia nigra (dopamine
production region) with concentrations of 1.3 mM and 0.4 mM, respectively.38,40
In the reduced state, Fe2+ and Cu+ are oxidized by H2O2 to Fe3+ and Cu2+,
generating hydroxyl radical in the Fenton or Fenton-like reaction (Reaction 6).1,21,28,41-43
3
Fe2+ or Cu+ + H2O2 → Fe3+ or Cu2+ + •OH + OH- (6)
This production of •OH becomes catalytic in vivo due to the presence of cellular
reductants such as NADH, which reduce Fe3+ and Cu2+ back to their reduced forms. In
fact, iron-mediated generation of •OH is the main cause of oxidative DNA damage and
cell death in prokaryotes26 and eukaryotes, including human cells, under oxidative stress
conditions,25,26,43 and is a root cause of several health conditions such as cancer, aging,
and cardiovascular and neurodegenerative diseases.9,14,43,44
Cellular defenses against the harmful effects of oxidative stress involve both
enzymatic and nonenzymatic antioxidant activities.1,4 Enzymatic defense requires
enzymes such as glutathione peroxidases (GPx), catalases, and superoxide dismutases
(SOD) that act by directly scavenging ROS or by producing nonenzymatic antioxidants
such as glutathione (GSH), thioredoxin, ubiquinone, and menaquinone.1,4 Nonenzymatic
defenses involve antioxidants such as carotenoids, lipoic acid, and vitamins C and E to
prevent against the damaging effects of oxidative stress.1,45 Both vitamins C and E reduce
oxidative stress and malformations in the offspring of rats with diabetes.46-48 Studies have
also focused on various selenium, sulfur, and polyphenol compounds to act as
antioxidants by preventing ROS-mediated DNA damage.23,49-54
Selenium has been extensively studied for its antioxidant and cancer preventative
properties and is an essential trace element in human and animal metabolism.55-58 It is
found in many dietary supplements and multivitamins in forms such as selenite
(Na2SeO3), selenate (Na2SeO4), or selenomethionine (SeMet).56,59 Selenite and selenate
are also found in fertilizers, animal feed, infant formulas, and protein shakes.56,60
4

Selenium is incorporated as selenocysteine (SeCys) in selenoproteins P, W, and R, as
well as in the active sites of enzymes such as glutathione peroxidases (GPx) and
thioredoxin reductases.23,52,57,61-63 In cells, these selenoproteins have important
antioxidant activities and protect the mitochondria, plasma membrane, and DNA from
oxidative damage by ROS.60,64 For example, GPx is found in the cytosol of cells and
exerts its antioxidant activity by reducing intracellular hydrogen peroxide to water,
preventing the generation of ROS.62,63,65-68 Although selenoproteins are a significant part
of the antioxidant properties of selenium, they have been extensively discussed62,69,70 and
are not the focus of this review.
Studies to determine the antioxidant activity of small-molecule selenium- and
sulfur-containing compounds have focused mainly on the organoselenium and
organosulfur compounds since they are more bioavailable and are more readily
incorporated into amino acids and proteins compared to the inorganic forms.62,71
Consumption of food products high in selenomethionine (SeMet) results in incorporation
of this amino acid into proteins by replacing its sulfur analog, methionine (Met).72 SeMet
is also more efficiently absorbed and retained than the inorganic sodium selenite and
selenate.73 While the organoselenium compounds have received a significant amount of
attention for their role as antioxidants,49,74-76 several studies indicate that inorganic
selenium compounds such as selenite, selenate, selenium dioxide (SeO2) and sodium
selenide (Na2Se; Figure 1.1) also exhibit similar antioxidative properties.23,51,55,57,58,77-79
Fruits, vegetables, and dietary supplements also contain oxo-sulfur compounds
(Figure 1.2) such as allicin, methylcysteine sulfoxide (MeCysSO), methyl methane
5

NH2
OH
O
Se
H2N
HSe OH
O O
SeOHH3C
SeO O
Se
O
OH
NH2
Na+ Na+Se2-
O- O-Na+ Na+
O
Se-O O-Na+ Na+
O
Se
O
Methyl selenic acid (MSeA)
Selenium dioxide (SeO2)
Sodium selenide (Na2Se)
Sodium selenite (Na2SeO3)
Sodium selenate (Na2SeO4)
Selenomethionine(SeMet)
Selenocysteine(SeCys)
Methylselenocysteine(MeSeCys)
Figure 1.1. Structures of inorganic and other selenium compounds discussed in this chapter. thiosulfonate (MMTS), and dimethyl sulfone or methylsulfonyl methane (Me2SO2),
which are also effective in preventing oxidative damage to cellular components.53,54,80-86
Understanding the effects of oxidation on the antioxidant properties of organosulfur
compounds is also important because compounds such as methionine are susceptible to
oxidation by ROS.87-89 To prevent the disruption of protein function upon methionine
oxidation to methionine sulfoxide (MetSO), cells have dedicated methionine reductase
enzymes (Msr) to reduce MetSO back to Met.88,90-93
Research has focused primarily on the ability of organoselenium and organosulfur
compounds in their reduced forms to prevent oxidative DNA damage and to treat or
prevent diseases caused by oxidative stress. However, it is important to acknowledge the
fact that inorganic selenium and oxo-sulfur compounds are abundant in many food
products such as dietary supplements, protein shakes, infant formulas, fruits, and
vegetables. This review will therefore discuss the role and biochemical mechanisms of
6

inorganic selenium, oxo-selenium, and oxo-sulfur compounds to act as antioxidants and
pro-oxidants, both in vivo and in vitro, for the treatment or prevention of ROS-mediated
diseases.
SOH
NH2
O O
SS
O
Allicin
S OH
O NH2
O
Methyl cysteine sulfoxide (MeCysSO)
SS
O
Methyl methane thiosulfonate (MMTS)
S
O
O
Methionine (Met)
Cysteine (Cys)
S
O
Dimethyl sulfoxide(DMSO)
NH2
OH
O
Se
O
Methionine selenoxide(MetSeO)
S
O
S
O
Phenyl sulfoxide(PhSO)
S OH
O
NH2O
Methyl cysteine sulfoxide (MeCysSO)
S OH
O
NH2O
S OH
O
NH2
O
S OH
O
NH2O
S-allyl-L-cysteinesulfoxide (alliin)
S-propyl-L-cysteinesulfoxide (propiin)
S-propenyl-L-cysteinesulfoxide (isoalliin)
SOH
NH2
O
OHNH2
O
HS
Methionine sulfoxide (MetSO)
Dimethyl sulfone (Me2SO2)
Methyl phenylsulfoxide (MePhSO)
Figure 1.2. Structures of oxo-sulfur and oxo-selenium compounds discussed in this chapter.
7

Selenium bioavailability, related pathologies, and biological effects
Selenium is an important micronutrient for both humans and animals and is
obtained through the diet from several sources including cereals, grains, nuts, vegetables,
meat, and seafood.62,94,95 The recommended daily allowance (RDA) for selenium ranges
from 55 to an upper limit of 350-400 μg/day, and daily intake comes from dietary
supplementation and foods rich in this mineral.56,96 Although selenium toxicity has been
observed for supplementation greater than 400 µg/d,60,97 it is important to note that some
studies conducted with a selenium intake ranging from 750 to 850 μg/d (~0.01 mg/kg)
reported no signs of selenium toxicity in humans.98,99 Animal studies reported selenium
toxicity within 12 h upon supplementation of 2 mg/kg selenium.100,101 These seemingly
contradictory results of selenium toxicity in humans highlight the need for additional
studies to establish accurate upper level RDA values for selenium supplementation.
The selenium content of plant and animal products in the diet is important to
maintain adequate selenium status and is highly dependent on regionally-variable
selenium concentrations in soil.48,56,62,63,66,68,99 In the United States, for example, soil in
northern Nebraska and the Dakotas has high selenium levels, but areas such as the
Keshan province of China and some parts of Finland, New Zealand, Australia, and North
America (northeast, northwest, Midwest, and southeast regions) have low soil selenium
levels.66,68,99,102-105 To increase the selenium content in soils, and therefore increase
animal and human consumption of selenium, these countries have implemented the use of
fertilizers enriched with selenite or selenate for agricultural crops.106-110 In the United
States, selenite supplementation in animal feed has been shown to improve animal
8

performance and increase the selenium dietary intake for Americans consuming meat
products.60
Pathologies associated with selenium deficiency and toxicity
Selenium deficiency occurs in regions where the selenium content in soil is low
and can result in diseases such as hypothyroidism, weakened immune defenses, and
cardiovascular diseases.63,111,112 Keshan disease is a cardiomyopathy endemic to the
Keshan province of China. This disease affects young children and women of child-
bearing age as a result of low iodine and selenium content in food products, leading to
low blood plasma selenium levels.113-117 The average intake of selenium for the
development of symptoms due to deficiency was 10 μg/d with symptoms such as
congestive heart failure, stroke or sudden death.62,117
Also resulting from low selenium and iodine intake is the endemic
osteoarthropathy known as Kashin-Beck disease found in several areas of China.115,116
Bone and joint deformations in growing children are characteristic of this disease.118 The
average serum selenium levels of patients with Kashin-Beck disease is significantly
lower (11 ng/mL) than those without these mineral deficiencies (60-105 ng/mL).119
Serum thyroxine levels are also much lower in patients with Kashin-Beck disease,
resulting in higher incidences of goiter than those unaffected by the disease.120 In farm
animals, selenium deficiency causes a muscular dystrophy known as white muscle
disease.68 This disease usually affects growing animals such as lambs and calves between
1 and 3 months old with symptoms including stiffness, inability to move, weakness,
9

tiredness, accelerated breathing, elevated temperatures, difficulty in feeding, and
death.68,121
Intake of selenium higher than the upper limit range 350-400 μg/d56,96 of the RDA
is also of major concern to humans and animals since it can result in selenium toxicity or
selenosis.60,97 Acute selenosis is caused by consumption of high levels of selenium in a
short period of time. Upon ingestion of 17.2 μg/mL selenium due to incorrect dosage in
animal feed, pigs showed signs of acute selenium toxicity, including paralysis,
hyperesthesia, anorexia, and tremors.97,122 Signs of acute selenosis in buffalo include
anorexia, alopecia, mild convulsions, and lowered body temperature.97,123,124 Symptoms
of chronic selenosis include hair loss, deformation or cracks on the skin, horns, and
hooves of animals, resulting in the sloughing of hooves and staggering.60,97,125 In humans,
signs of selenosis include garlic breath, hair and nail loss, thickened and brittle nails,
teeth deformation, skin lesions, and lowered hemoglobin levels upon dietary selenium
intake of 5 mg/d.98
Although countries have implemented the use of fertilizers containing selenite and
selenate to supplement foods grown in selenium-deficient soil, the effects of selenium
supplementation vary for each of these inorganic selenium compounds. In an attempt to
prevent or reduce the prevalence of selenium deficiency diseases in China, both selenite
and selenate were introduced into the soils of rice crops.117 In unsupplemented soil,
selenium content is extremely low, less than 0.06 μg/g. Rice crops grown in selenite- or
selenate-enriched soils had significantly increased selenium levels of 0.471 μg/g and 0.64
μg/g, respectively, with no adverse effects on the plants.117 In Chile, ryegrass
10

supplemented with 0.1 μg/g selenite or selenate increases selenium content from 0.07
μg/g for grass grown in untreated soil to 0.28 μg/g and 5.72 μg/g, respectively.66 Soil
enrichment at higher levels of selenate (4-10 μg/g), resulted in stunted growth of
ryegrass, with selenium content ranging from 150 to 247 μg/g.66 Surprisingly, selenite-
enriched soils (6-10 μg/g) decreased lipid peroxidation in the plants, whereas selenate
supplementation of soil at the same levels had the opposite effect. Higher lipid
peroxidation levels for plants grown in selenate supplemented soil may account for the
observed stunting of plant growth.66
Because inorganic forms of selenium effectively increase selenium levels in plant
crops and prevent selenium deficiency diseases in people that consume them, it is
important to understand the effect of selenite and selenate supplementation in crops.
Plants more efficiently absorb selenate, as indicated by the higher concentrations of
selenium in plants supplemented with selenate as compared to selenite supplementation,
but selenite may be safer to use in fertilizers, since there are fewer adverse effects with
supplementation at high concentrations.66
To better treat selenium deficiency and to prevent selenium toxicity, an accurate
evaluation of the effects of inorganic selenium compounds in fertilizers is required.
Selenite- and selenate-enriched pastures and salt licks are also used to increase selenium
concentrations in livestock.68 It is therefore also important to understand the effects of
this supplementation on animals, and further studies are necessary to determine the
appropriate levels and forms of inorganic selenium supplementation that are most
effective.
11

In humans, selenium deficiency causes poor immune response by reducing T-cell
counts and impairing lymphocyte proliferation and response.63,126 Studies have shown
that human supplementation of 200 μg/d of sodium selenite over an eight-week period
resulted in enhanced T-lymphocyte response.127 In HIV and AIDS patients, selenium
deficiency is associated with decreased immune cell count, higher rates of disease
progression, and increased risk of death.128,129 Additionally, selenium was found to
protect cells from oxidative stress, resulting in slower progression of this disease.130
A study performed over a period of 5 years on HIV-positive children found that
those with low selenium levels died at a younger age than patients with higher selenium
status.131 These experiments were corroborated by another study involving HIV-positive
men and women that linked increased death rates with selenium deficiency.132,133 Clinical
studies performed on male patients with AIDS and AIDS-related complex (ARC) showed
that blood selenium levels increased upon supplementation of 400 μg/d Se-enriched yeast
from 0.142 μg/mL to 0.240 μg/mL over a period of 70 days.134,135 Similar results were
also observed in AIDS patients supplemented with sodium selenite (80 μg/d).134,136 These
investigations indicate that both organic and inorganic selenium supplementation is
effective for the treatment of patients with immune deficiencies.133
Numerous studies indicate that selenium also plays an important role in cancer
prevention and treatment.48,137,138 In a random, double-blind cancer prevention trial, the
incidence of prostate cancer was reduced by 63% compared to the placebo group upon
selenium supplementation of 200 μg/d as selenium-enriched yeast. Similar studies also
showed a significant decrease in lung and colorectal cancers, as well as in total cancer
12

mortality rates.139,140 In a separate trial, patients with uterine cervical carcinoma were
found to have low glutathione peroxidases and selenium levels.141
Antioxidant and anticancer activities of inorganic selenium compounds
ROS generation is directly linked to cellular and DNA damage and is the primary
cause of many diseases.9,14,18,44,142 Antioxidants have been used to prevent or reduce the
effects of ROS-mediated DNA and other cellular damage, and selenium has been
extensively studied for its antioxidant properties.55,57,58 Inorganic selenium compounds
can also act as pro-oxidants to produce DNA damage and cell death, an activity that plays
an important role in the treatment of cancer.23,51,143-146 Although sometimes confused in
the literature, this distinction between antioxidant (cancer prevention) and pro-oxidant
(cancer treatment) behavior is important to make, since the chemical and cellular
mechanisms behind each type of activity are distinct. The behavior of these inorganic
selenium compounds is complex, and in several studies, both antioxidant and pro-oxidant
behavior have been observed for the same selenium compound depending on
experimental conditions.
The main inorganic selenium compound used in most cancer treatment studies is
sodium selenite; however, a few studies use other forms, such as sodium selenate and
selenium dioxide.57,62,143-145,147,148 Selenate and selenite (0.1 μg/mL) are effective dietary
supplements for the inhibition of tumor cell growth in rodents.145,147 These two inorganic
selenium compounds also strongly inhibit the growth of mammalian tumor cells at cell
cycle phases specific for each compound.144 Selenite-treatment (10 μM) of human
13

lymphocyte cells resulted in accumulation in the S-phase with irreversible growth
inhibition, whereas selenate-treated (250 μM) cells accumulated in the G2 phase with
reversible inhibitory effects.144 In a separate study, selenium dioxide (1.5 μM) was found
to be effective in the enhancement of lymphocyte progression into the S phase of the cell
cycle in patients with stage IV cancer, resulting in restoration of immune function and
control of cancer progression.143 Takahashi et al. showed that both selenite (10 μM) and
selenium dioxide (100 μM) induced ~ 80% apoptosis in human oral squamous carcinoma
(HSC-3) cells after treatment for 72 h, whereas selenate had no effect on cell survival.57
Brumaghim et al. have shown that inorganic selenium compounds exert both
antioxidant and pro-oxidant activities against iron-mediated oxidative DNA damage.23
Selenite progressively inhibited DNA damage at all concentrations tested (0-5000 μM),
with 91% inhibition at the highest concentration under Mode I conditions (50 μM
H2O2).23 Selenate and selenide had no effect on damage under similar conditions,
whereas SeO2 was found to be both a pro-oxidant and antioxidant, increasing DNA
damage by 20% at 50 μM, but inhibiting 100% DNA damage at 5000 μM.23 Similar
studies performed with organoselenium compounds, SeMet (1-1000 μM) showed no
antioxidant activity, whereas methyl selenocysteine prevented ~ 76% iron-mediated DNA
damage at very high concentrations (20,000 μM).149
In contrast, under Mode II conditions (50 mM H2O2), Na2SeO3 showed pro-
oxidant activity at all concentrations tested (0.5-5000 μM), damaging 90 % DNA at the
highest concentration in the absence of iron. However, SeO2 was an efficient antioxidant
under similar conditions, preventing 81% iron-mediated DNA damage, whereas Na2SeO4
14

and Na2Se had no effect on such damage.23 The antioxidant behavior of these inorganic
selenium compounds has been attributed to the oxidation state of the selenium atom,
rather than the overall charge of the selenium compound.23 Inorganic selenium
compounds in the +4 oxidation state (Na2SeO3 and SeO2) were more effective
antioxidants than Na2SeO4 and Na2Se, with selenium oxidation states of +6 and -2,
respectively.23 In a separate study Hamilton et al. found that Na2SeO4 (6.2 mM) was
effective at inhibiting DNA damage caused by alkylating agents.77
High levels of selenite (1 μg/mL) were also shown to increase thioredoxin
reductase activity twofold in rat kidney, liver, and lung tissues as compared to rats with
normal selenite intake (0.1 μg/mL).150 In human colon cancer cells supplemented with
various dosages of selenite (0.1, 1, and 10 μM), thioredoxin reductase activity increased
with increasing selenium concentration, resulting in a 65-fold increase at the highest
concentration tested.151
Although these studies make a strong case for selenium supplementation for the
prevention or treatment of cancer, additional studies are required to better compare and
elucidate the structural and chemical properties of inorganic selenium compounds that
contribute to antioxidant or pro-oxidant behavior. For example, while selenite has been
shown to be a more effective antioxidant compared to selenate in many studies, selenite
can also oxidatively damage DNA under conditions of oxidative stress. This pro-oxidant
effect is not observed with selenate, suggesting that selenate may be safer for use in
human or animal supplementation.
15

Selenium speciation and anticancer activity
Selenium bioavailability differs for organic and inorganic compounds, and studies
have shown that the formulation of the selenium compound, and not the presence of the
element itself, is essential for chemopreventative activity.152-154 It is therefore critical to
elucidate the specific selenium compounds that are required for such activity. For
example, sodium selenite (5-10 μM) introduced into cell culture media induced DNA
single strand breaks and cell death via necrosis.152,153,155,156 Organoselenium compounds
(10-50 μM), however, caused cell death by apoptosis with no DNA single strand
breaks.152,153 Similar results were obtained in a separate study by Thompson et al. to
determine the effect of selenium form on mouse mammary carcinoma cells.157 Although
all selenium compounds tested inhibited cell proliferation and induced cell death, selenite
and selenide induced both DNA single- (51-59%) and double-strand breaks (4.8-14.6 %)
in a concentration-dependent manner (1-5 μM); no DNA damage was observed for the
organic forms, methyselenocyanate (2-7 μM) and methylselenocysteine (20-100 μM).157
In another study, selenite was found to be more potent than either
selenocystamine or selenomethionine in inducing apoptosis in mouse keratinocyte
(BALB/cMK2) cells.142 In this experiment, selenite (10 μg/mL) produced 100%
apoptosis, whereas selenocystamine produced 2.8% apoptosis at the same
concentration.142 Selenocystamine (250 μg/mL) was capable of inducing 100% apoptosis,
whereas selenomethionine (5-250 μg/mL) showed no effect with BALB/cMK2 cells.142 A
study to determine whether sodium selenite and methylselenic acid (MSeA) repressed
interleukin-6-mediated (IL-6) androgen receptor action in prostate cancer progression
16

indicated that selenite significantly inhibited IL-6 activity in human prostate cancer
(LNCaP) cells, but MSeA did not.158
Although these investigations indicate that the inorganic forms of selenium may
be more effective for the prevention or treatment of diseases compared to the organic
forms, further studies are necessary to evaluate the effects of selenium speciation for such
purposes. While most studies have focused solely on selenite, the examination of other
inorganic selenium compounds such as selenate, selenide, and selenium dioxide, in
addition to organoselenium compounds, in antioxidant and anticancer experiments would
aid in understanding the effects of selenium speciation within these inorganic and organo-
selenium compounds on ROS-induced DNA damage and cell death.
Mechanisms of antioxidant and anticancer activity for inorganic selenium compounds
While the precise mechanisms of cancer prevention or treatment has not been
elucidated for inorganic selenium compounds, several reports indicate that the protection
against oxidative damage may involve selenoproteins, such as GPx and thioredoxin
reductase, and may require supranutritional levels of selenium.55,150,151,159-168 One
proposed mechanism for the effects of cancer treatment by selenium compounds is the
direct action of pro-oxidant selenometabolites to generate ROS, resulting in cellular
toxicity.57,148,169
This ROS-generation mechanism involves the metabolism of selenite and selenate
to generate hydrogen selenide (H2Se), a by-product of selenium metabolic pathway.148,170-
172 High levels of selenide can then react with oxygen to produce ROS resulting in
17

oxidative damage to cells.148,170,171 It has been suggested that the cytotoxicity of inorganic
selenium compounds such as selenite and selenium dioxide is due to the formation of
selenotrisulfides (RSSeSR), such as selenoglutathione, upon reaction with disulfide
peptides or proteins (Reaction 7).148,170,171 In more recent studies, this mechanism has also
been attributed to the pro-oxidant effect of inorganic selenium compounds in different
cell lines.57,142,173-175
This proposed mechanism for selenite cytotoxicity has been further supported by
generation of superoxide upon reduction of selenotrisulfide (GSSeSG) to
selenopersulfide anion (GSSe-).148 The selenopersulfide anion, in turn, is reduced by
thiols to generate H2Se (Reactions 7-9).148 Selenide then reacts with oxygen to form
elemental selenium (Se0) and O2•- (Reaction 10).148,170,171 Studies showing that selenite
and selenium dioxide, but not selenate, are cytotoxic via this mechanism have been
previously reviewed by Spallholz.148
SeO32- + 4GSH + 2H+ → GSSG + GSSeSG + 3H2O (7)
GSSeSG + GSH → GSSG + GSSe- + H+ (8)
2GSSe- + 4NADPH → 2H2Se + GSSG + 4NADP+ (9)
H2Se + O2 → Se0 + O2•- + 2H+ (10)
In contrast, the mechanism for the antioxidant ability of both inorganic and
organoselenium compounds in preventing iron-mediated oxidative DNA damage is
through metal coordination between the iron and the selenium compounds.23,149 Since
Na2SeO3 and SeO2 (0.5-5000 μM) showed no effect on DNA damage produced by
completely coordinated [Fe(EDTA)]2- (400 μM), coordination of Fe2+ to inorganic
18
selenium compounds is a primary mechanism for both their antioxidant and pro-oxidant
activities.23 These results were also observed for organoselenium compounds under
similar conditions.49 For inorganic selenium compounds, oxidation state of the selenium
atom may play a role in their ability to prevent iron-mediated DNA damage.23 Although
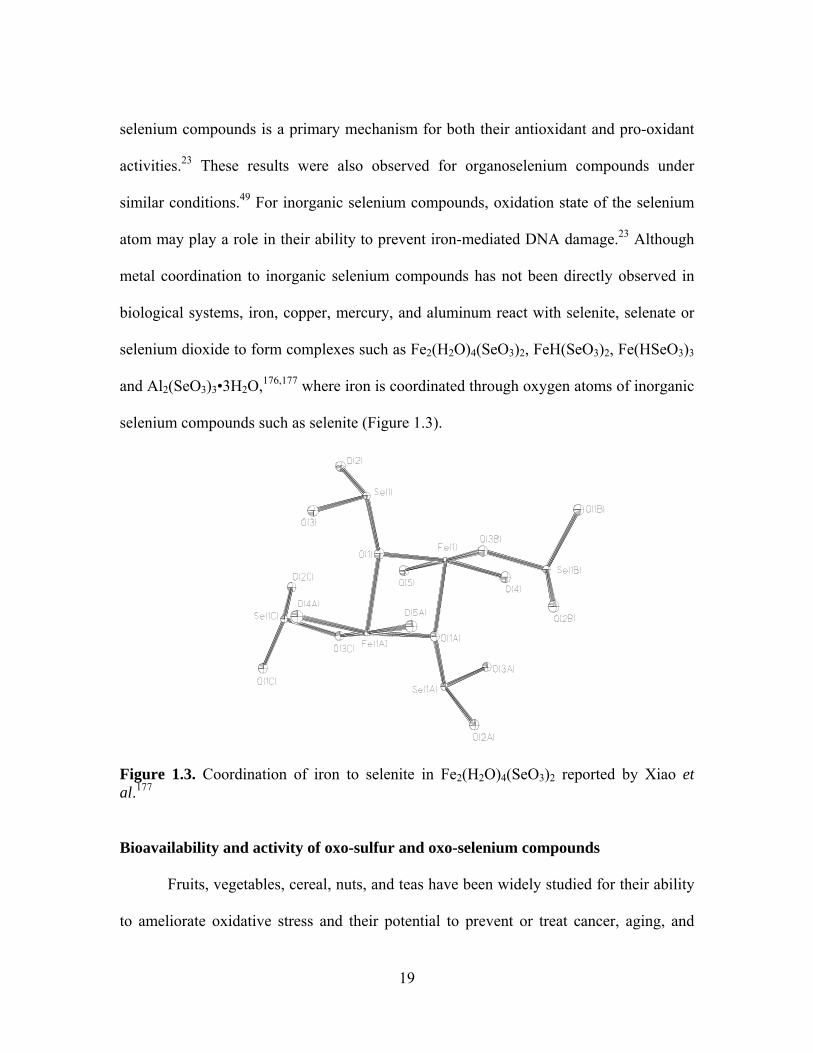
metal coordination to inorganic selenium compounds has not been directly observed in
biological systems, iron, copper, mercury, and aluminum react with selenite, selenate or
selenium dioxide to form complexes such as Fe2(H2O)4(SeO3)2, FeH(SeO3)2, Fe(HSeO3)3
and Al2(SeO3)3•3H2O,176,177 where iron is coordinated through oxygen atoms of inorganic
selenium compounds such as selenite (Figure 1.3).
Figure 1.3. Coordination of iron to selenite in Fe2(H2O)4(SeO3)2 reported by Xiao et al.177
Bioavailability and activity of oxo-sulfur and oxo-selenium compounds
Fruits, vegetables, cereal, nuts, and teas have been widely studied for their ability
to ameliorate oxidative stress and their potential to prevent or treat cancer, aging, and
19

cardiovascular diseases.54,62,94,95,178-180 The antioxidant capabilities of many foods are
attributed to their vitamin, polyphenolic, selenium, and sulfur content.53,54,62 Although
there are many members of the Allium genus, including onions, leeks, scallions, and
chives, garlic has been widely studied for its antioxidant activity.53,54,81 For many
centuries, garlic (Allium sativum Liliaceae) has been cultivated and used in food
preparation for its distinct flavor and aroma, as well as for its medicinal properties.53,54,81
Throughout the years, this bulb has been used to treat the plague, animal bites, leprosy,
and cancer, as well as bacterial, immune, and cardiovascular diseases.53,54,81,181-188
The characteristic flavor and aroma of garlic are attributed to the volatile
organosulfur compounds produced upon tissue damage and enzymatic hydrolysis from
non-volatile precursors.81,189 The vegetative parts of garlic are odorless and comprised of
non-volatile sulfur storage compounds known as S-alk(en)yl-L-cysteine sulfoxides.81,189
These compounds (Figure 1.2) are stored in the cytosol of undamaged Allium tissues
protected from the enzyme alliinase, which is found in the vacuoles.81,189 Upon tissue
damage, alliinase and S-alk(en)yl-L-cysteine sulfoxides react to generate sulfenic acid that
then undergoes condensation to form the volatile thiosulfonate compounds.81,189 The S-
alk(en)yl-L-cysteine sulfoxides detected in garlic and several other varieties of the Allium
genus are S-allyl-L-cysteine sulfoxide (alliin, ACSO), S-methyl-L-cysteine sulfoxide
(methiin, MeCysSO, MCSO), S-propyl-L-cysteine sulfoxide (propiin, PCSO) and S-trans-
1-propenyl-L-cysteine sulfoxide (isoalliin, TPCSO).81,189-192
The medicinal properties of garlic are primarily attributed to the thiosulfonate
compound, allicin produced from allin by alliinase when garlic is crushed (Figure
20
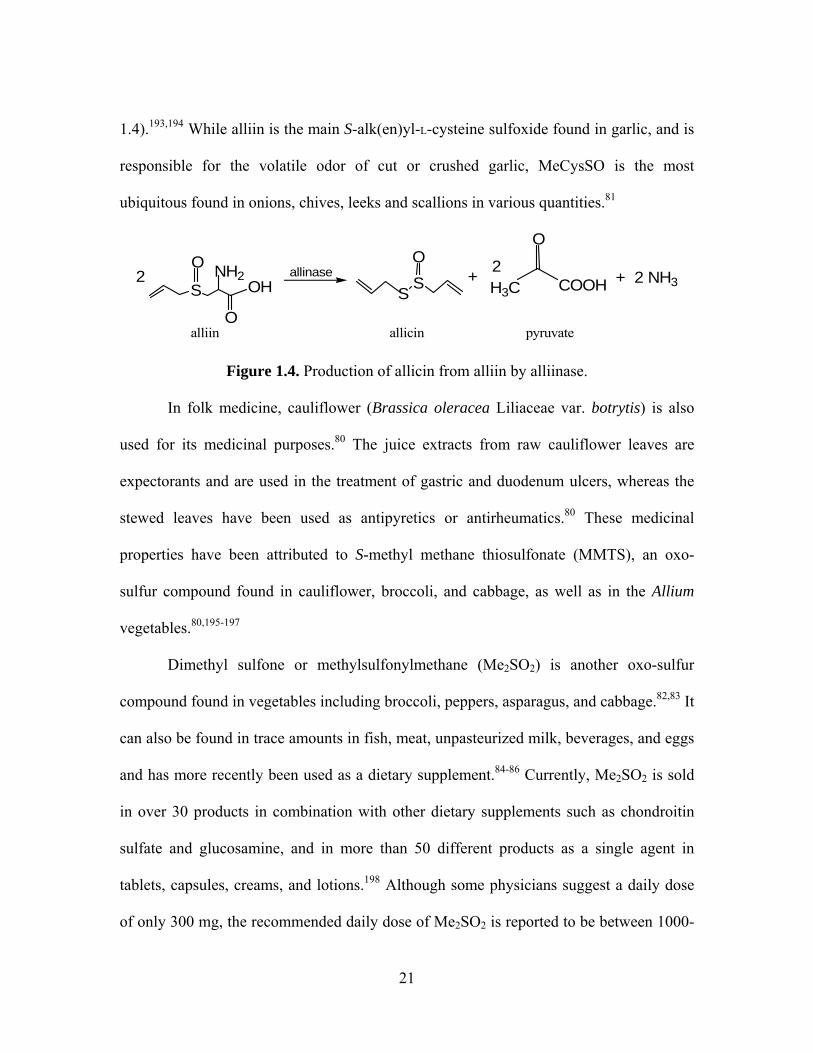
1.4).193,194 While alliin is the main S-alk(en)yl-L-cysteine sulfoxide found in garlic, and is
responsible for the volatile odor of cut or crushed garlic, MeCysSO is the most
ubiquitous found in onions, chives, leeks and scallions in various quantities.81
S OH
O
NH2O
S SO
O
COOHH3C2 NH32 2+ +allinase
alliin allicin pyruvate
Figure 1.4. Production of allicin from alliin by alliinase.
In folk medicine, cauliflower (Brassica oleracea Liliaceae var. botrytis) is also
used for its medicinal purposes.80 The juice extracts from raw cauliflower leaves are
expectorants and are used in the treatment of gastric and duodenum ulcers, whereas the
stewed leaves have been used as antipyretics or antirheumatics.80 These medicinal
properties have been attributed to S-methyl methane thiosulfonate (MMTS), an oxo-
sulfur compound found in cauliflower, broccoli, and cabbage, as well as in the Allium
vegetables.80,195-197
Dimethyl sulfone or methylsulfonylmethane (Me2SO2) is another oxo-sulfur
compound found in vegetables including broccoli, peppers, asparagus, and cabbage.82,83 It
can also be found in trace amounts in fish, meat, unpasteurized milk, beverages, and eggs
and has more recently been used as a dietary supplement.84-86 Currently, Me2SO2 is sold
in over 30 products in combination with other dietary supplements such as chondroitin
sulfate and glucosamine, and in more than 50 different products as a single agent in
tablets, capsules, creams, and lotions.198 Although some physicians suggest a daily dose
of only 300 mg, the recommended daily dose of Me2SO2 is reported to be between 1000-
21

6000 mg when taken as a dietary supplement.82 Me2SO2 is a metabolite of dimethyl
sulfoxide (DMSO), a by-product of algae and phytoplankton decay, and is commercially
synthesized by reacting hydrogen peroxide with DMSO to produce Me2SO2 and water
(Reaction 11).198,199 Studies have shown that ~15% of orally ingested DMSO is recovered
as Me2SO2 in urine.198-200
Me2SO + H2O2 → Me2SO2 + H2O (11)
Amino acids are major targets for oxidation by reactive oxygen species, and this
oxidation can disrupt protein structure and function.87 Methionine can be oxidized to
methionine sulfoxide (MetSO) by ROS and reactive nitrogen species (RNS) such as
hydrogen peroxide, hydroxyl radical, and peroxynitrite anion.88,89,201 ROS-mediated
oxidation of Met results in mixtures of R- and S-isomers of MetSO.202 Metal-catalyzed
oxidation of methionine occurs through Fenton or Fenton-like reactions when peptides
reduce metals such as iron and copper subsequently producing hydroxyl radical upon
reaction with hydrogen peroxide.88,203-205
MetSO can also be formed from methionine oxidized by H2O2 alone in the
absence of metal ions (Figure 1.5),206,207 and both peroxynitrous acid (ONOOH) and
peroxynitrite also react with methionine to produce MetSO.89,201 Methionine oxidation
can result in changes in protein hydrophobicity, alterations in protein conformation, and
disruption of biological function.92,203,208-213 However, cells contain two enzymes that
reduce MetSO to Met, repairing the oxidative damage.88,90-92 Methionine sulfoxide
reducatse A (MsrA) specifically reduces the S-isomer of MetSO, and methionine
22

SOH
NH2
O OS
OHNH2
OH2O2 H2O+ +
Figure 1.5. Oxidation of methionine to methionine sulfoxide by hydrogen peroxide.
sulfoxide reductase B (MsrB) is specific for reduction of the R-isomer.88,90,92 Based on
the reversibility of MetSO generation, MetSO formation is proposed to be important in
regulating cell functions.88,92,203,212,214-216 Interestingly, there have been reports on one
biologically relevant oxo-seleno compound formed from the oxidation of
selenomethionine (SeMet) by peroxynitrite to methionine selenoxide (MetSeO).69,217,218
This oxidation is analogous to the peroxynitrite oxidation of methionine.217
Antioxidant and pro-oxidant effects of oxo-sulfur compounds in disease prevention
Many studies have reported on the antioxidant effects and amelioration of
diseases using aged garlic extracts (AGE) and garlic essential oils.219-221 Although these
products are generally considered to be safe and may be effective in preventing diseases
such as cancer, it is difficult to determine the bioactive sulfur component or mixture of
components that is responsible for the observed biological effects.219,220 Therefore, this
review will focus on the ROS damage prevention (antioxidant) or ROS generation (pro-
oxidant) abilities of individual oxo-sulfur compounds.
Several studies have shown that oxo-sulfur compounds play a significant role in
preventing ROS-mediated cellular damage. For example, allicin, a major component in
garlic, acts as a vasodilator, inhibits cholesterol biosynthesis, ameliorates serum lipid in
23

hyperlipidemic rabbits, and lowers intraocular pressure in normal rabbits.193,222-225 In a
separate study, both allicin and alliin had no effect in reducing lipid peroxidation induced
by ferrous sulfate/ascorbic acid in microsomal membranes.226 Another study to determine
the effect of thiosulfonates on platelet aggregation showed that allicin inhibited 74% of
such aggregation with an IC50 of 0.27 mM.189 Hirsh et al. found that allicin (10-40 μM)
inhibited cell proliferation in mammary, colon, and endometrial cancer cells with 50%
inhibition at 10-25 μM.193 Alliin, the precursor to allicin, showed no inhibitory effect at
all concentrations tested (0-64 μM).193
Another oxo-sulfur compound found in Allium vegetables is MeCysSO; however,
only a few studies have been performed on this possible antioxidant sulfur derivative,
despite the fact that it is a major oxo-sulfur compound in garlic. MeCysSO is effective for
the treatment of hyperglycemia and hyperlipidemia in diabetic rats.227-230 In addition,
daily oral administration of MeCysSO (200 mg/kg) for 45 days significantly controlled
blood glucose and lipids in tissues and serum of diabetic rats.227 The activities of HMG
CoA reductases, liver hexokinase, and glucose-6-phosphate in these animals were close
to normal upon MeCysSO treatment, effects similar to the anti-diabetic drugs
glibenclamide and insulin.227 Augustini et al. also observed that that MeCysSO was
effective in lowering total cholesterol levels in rats.229
Similar to allicin, MMTS also has chemopreventative properties.195 Nakamura et
al. found that MMTS isolated from cauliflower homogenate showed strong
antimutagenic activity against UV-induced mutation in wildtype E. coli (B/r WP2), but
not in mutant cell strains lacking excision-repair activities.195-197 A separate study by the
24

same group showed that MMTS (10 mg/kg) suppressed the frequency of aflotoxin B1-
induced chromosome aberrations after 2 h.195 Additionally, Kawamori et al. reported that
MMTS (20 and 100 ppm) inhibited 42 % and 21% of intestinal neoplasm incidences
induced by azoxymethane in rats, respectively.231
MMTS also decreased the incidence of phenobarbital-promoted or
diethylnitrosamine-initiated hepatocarcinogenesis in rats.232 In Drosophilia melanogaster
and mice micronuclei, MMTS was found to reduce mitomycin C-induced somatic
mutation and recombination via oral administration.232 Experiments performed with
various antioxidants, including Kefir grain extracts, showed that both Kefir extracts (900-
21,000 μg/mL) and MMTS (10 μg/mL) stimulated more than 50% thymine dimer repair
in UVC-irradiated HMV-1 cells, whereas other antioxidants tested (epigallocatechin and
vitamins A, C, E, and K) showed little repair enhancement (≤ 10-30 %).233
While the use of Me2SO2 in commercially available products is generally
considered safe, little data is available to assess the safety and toxicity of this oxo-sulfur
compound. Unconfirmed side effects of Me2SO2 consumption include headaches,
hypertension, gastrointestinal symptoms, insomnia (if taken before bedtime), and
increased hepatic enzyme levels.198 The Me2SO2 oxo-sulfur compound has been used in
the treatment of inflammation, parasitic infections, allergies, asthma, cancer, arthritis, and
rheumatic pain.198,199 Due to its sulfur content, it has also been used in the nourishment of
hair, fingernails, and skin, and in the maintenance of normal connective tissues.198,234 In
one study to determine the acute (2000 mg/kg/day) and chronic (1500 mg/kg/day) effects
25
on rats, oral administration of Me2SO2 for 90 days did not affect body weight,
histopathological lesions in tissues and organs, hematological parameters, or mortality.82
Early pharmacokinetic studies showed that ~64% of [35S]Me2SO2 (21 mg/kg) was
excreted within 24 h upon intraperitoneal administration to rats.235 In a more recent
study, the distribution of Me2SO2 administered orally for 7 days using a 35S radioisotope
tracer found that [35S] Me2SO2 (470 mg/kg/day) was excreted in urine (~70%) and feces
(~10%).236 The highest levels of radioactivity were found in hair, blood, and spleen.236
Further investigations of Me2SO2 pharmacokinetics in rats was performed by Magnuson
et al.84 They also used radiolabled [35S]Me2SO2 to determine that Me2SO2 is rapidly
absorbed, well distributed, and efficiently eliminated.84 Oral administration of 500 mg/kg
in rats showed that the majority of Me2SO2 was excreted in urine (~57%), with only 1.6%
excreted in feces.84 After 48 h, Me2SO2 was distributed evenly in several tissues,
corresponding to blood concentrations of this compound.84
Two separate studies performed by Cottler-Fox et al. and Wever et al. found that
Me2SO2 was present in human plasma and cerebrospinal fluid ranging from 0-25
μM,237,238 and Lawrence et al. reported that this oxo-sulfur compound occurs naturally in
blood with a concentration of 3 μM.83 Me2SO2 was also detected by magnetic resonance
spectroscopy in the brains of patients with memory loss and in normal patients given
doses of 1-3 g/day.239 In this investigation, Me2SO2 was found to be distributed equally
between white and grey matter of the brain in all patients, ranging from 0.42-3.40
mmol/kg, with no adverse neurochemical or clinical effects.239 Me2SO2 was also
26

detected in the brain at a concentration of 2.36 mM in a normal patient after taking
Me2SO2 at a dosage of 181 mg/kg/day.240
While the suggested use of Me2SO2 is as a dietary supplement for the treatment of
arthritis and allergies, only a few studies have reported such activities.199,241,242 A 12-
week randomized and controlled study on individuals with knee osteoarthritis was
conducted, with each of the 118 patients given Me2SO2 (1.5 g/d). One-third reported
decrease in pain; joint mobility and improved walking time was also observed.242 In a
second study, 21 patients with osteoarthritis given Me2SO2 (3 g) twice daily for a 12-
week period showed decreases in pain (25%), stiffness (20%), physical function (31%),
and total symptoms (25%).198 Interestingly, in this study, patients in the placebo group
also showed decreases in pain, stiffness, physical function, and total symptoms (~13%,
12%, 17%, and 14%, respectively).198 Although Me2SO2 may ameliorate the effects of
osteoarthritis, its full effects were not observed in such a short period of time, indicating
the need for longer trials.198 A study to evaluate the efficacy of Me2SO2 for reduction of
seasonal allergy rhinitis (SAR) symptoms such as headaches, sinus infections, breathing
difficulties, and nasal congestion was performed by Barrager et al.199 The results of this
study indicate that Me2SO2 supplementation of 2600 mg/d over a period of 30 days was
effective in reducing the symptoms of SAR.199 Me2SO2 was also found to have minimal
side effects suggesting that this oxo-sulfur compound may be therapeutic and has
pharmaceutical significance for the amelioration of SAR-associated symptoms.199
27

Antioxidant and pro-oxidant mechanisms of oxo-sulfur compounds
Although numerous studies show that oxo-sulfur compounds can be used in the
treatment or prevention of several diseases including cancer and osteoarthritis, the
mechanisms of such action has not been elucidated.193-195,198,211,219,228,232 Studies by
Weiner et al. indicate two possible mechanisms for the biological activity of allicin:
radical scavenging or its ability to react with thiols.194 Spin trapping techniques and EPR
measurements were used to show that allicin efficiently scavenged •OH produced by the
Fenton reaction.194 The ability of allicin to inhibit the functions of thiol-containing
proteins such as papain and alcohol dehydrogenase was also suggested as a possible
mechanism.194
The susceptibility of Met to oxidation results in antioxidant activities due to the
radical scavenging capability of Met, and the ability of Msr to reduce MetSO back to
Met.211 Evidence of such antioxidant activity is observed in studies performed in yeast
and Drosophilia, which showed that over-expression of the MsrA gene prevents
oxidative stress induced by toxic levels of hydrogen peroxide and paraquat.243,244 Studies
performed on various bacterial strains and yeast lacking the MsrA gene found that these
strains were more susceptible to paraquat- or H2O2-induced oxidative stress.243,245,246
Under normal growth conditions, studies performed on MsrA knockout mice resulted in a
40% decrease of maximal life-span upon exposure to 100% oxygen.247 In other studies,
Met residues on the lipoprotein surface reduced low-density (LDL) and high-density
(HDL) lipoprotein-generated peroxides and cholesterolester peroxide to their respective
hydroxyl derivatives.92,248
28

The oxidation of methionine to methionine sulfoxide has been implicated in
aging, Alzheimer’s respiratory distress syndrome, and emphysema.212,214 A study by
Costabel et al. showed that methionine oxidation by neutrophil-generated ROS results in
acute and chronic bronchitis, dependent on the Met/MetSO ratio in lavage fluid in the
bronchialveolar.249 An investigation by Stadtman et al. indicated that surface
hydrophobicity of rat liver proteins increased with age over a period of 24 months.210
This study also indicated that increases in both hydrophobicity and MetSO levels were
caused by protein oxidation from ROS.210
Gradual decreases in the levels of MsrA activity in the brain and kidney tissues of
rats was found to be age-related, whereas in liver tissues, no age-related loss of enzyme
activity was observed.250 MsrA activity in rat kidney and brain tissues decreased from ~5
pmol/μg/h and ~0.55 pmol/μg/h, respectively, at 5 months of age to ~3.5 pmol/μg/h and
~4 pmol/μg/h, respectively, at 25 months.250 In addition, the proposed Met/MetSO
antioxidant cycle may aid in the prevention of Alzheimer’s disease.88,251 A study
performed by Marksbery et al. showed that in various brain regions of Alzheimer’s
patients, the level of MetSO and protein carbonyls, another measure of oxidative damage,
was significantly greater than in the brains of patients without this disease.251
In an animal study, 67% of Met residues in rat brain calmodulin were oxidized to
MetSO in aged rats.252 Experiments by Wells-Knecht and co-workers showed that in
humans, the methionine sulfoxide content of skin collagen increases from approximately
4% while young to approximately 12% at 80 years of age.253 Collectively, these studies
indicate the oxidation and reduction processes of methionine, as well as the expression of
29

MsrA, play an important role in the prevention of ROS-mediated diseases. Interestingly,
methionine oxidation increases protein hydrophobicity, despite the fact that Met is more
hydrophobic than MetSO.210,254 Further investigations are therefore needed to better
understand effects of the Met/MetSO oxidation cycle at the molecular level, since local
changes in protein folding may play a role in hydrophobicity alterations.214
Similar to DNA inhibition experiments performed with inorganic selenium
compounds, the ability of oxo-sulfur compounds to prevent metal-mediated DNA
damage has also been investigated. MetSO, MeCysSO, MMTS, Me2SO2, and methyl
phenyl sulfoxide (MePhSO; Figure 1.2) showed little inhibition of iron-mediated
oxidative DNA damage. While MeCysSO and MMTS inhibited 17% and 20% DNA
damage at 1000 μM, respectively, the other oxo-sulfur compounds showed no effect on
DNA damage.51 Likewise, Me2SO2 and MePhSO have no effect on copper-mediated
DNA damage, whereas MMTS (1000 μM) is a pro-oxidant, producing 35% damaged
DNA, and both MetSO and MeCysSO are efficient antioxidants with IC50 values of 18 ±
3 μM and 8.1 ± 1 μM, respectively.51 Interestingly, the reduced forms of MeCysSO and
MetSO, MeCys and Met, were also effective antioxidants with IC50 values of 8.9 ± 0.02
μM and 11.2 ± 0.02 μM, respectively.49 Thus, the ability of these sulfur-containing amino
acids to prevent copper-mediated DNA damage does not significantly change upon
oxidation.51
Similar to the results obtained with the inorganic selenium compounds, metal
coordination is also a mechanism for antioxidant activity of oxo-sulfur
compounds.23,49,51,74,149 Brumaghim et al. showed that sulfur compounds with the ability
30

to prevent copper-mediated DNA damage have a Cu-S charge transfer band at ~240 nm
when combined with Cu+, indicative of copper-sulfur coordination. Both MetSO and
MeCysSO show similar UV bands with Cu+, also indicating copper binding to these
compounds.49,51,74 Interestingly, in gel electrophoresis experiments using 2,2’-bipyridine
(bipy) to completely coordinate Cu+, MetSO and MeCysSO at 1000 μM, inhibited 43%
and 88% of [Cu(bipy)2]+-mediated DNA damage, respectively, significantly less than the
inhibition observed for uncoordinated Cu+.51 These studies also demonstrate that metal
coordination is a primary mechanism for the antioxidant activity of MetSO and
MeCysSO, but a second mechanism, such as radical scavenging, may also be responsible
for their DNA damage prevention at high concentrations.51 Under similar conditions,
MMTS (5000 μM) is a pro-oxidant, damaging 44% DNA in the presence of
[Cu(bipy)2]+/H2O2, indicating that copper coordination is not required for its pro-oxidant
activities.51 These experiments indicate that the antioxidant or pro-oxidant activities of
sulfur compounds are quite complex, and highlight the importance of understanding the
conditions and mechanisms for such behavior.
Recently, aryl sulfoxides such as phenyl sulfoxide (PhSO) and MePhSO (Figure
1.2) have been found to generate ROS upon irradiation, with implicated use in cancer
therapy.255-257 Interestingly, little has been reported on the effects of this ROS generation
on DNA damage. Predecki et al. showed that photoactivation at 240 nm of PhSO and
MePhSO results in 83% DNA damage at 180 μM and 360 μM, respectively.256 In this
experiment, 2,2,6,6-tetramethylpiperdine-1-oxyl (TEMPO) scavenged carbon-based
radicals, indicating that the possible mechanism for photoinduced-DNA damage by aryl
31

sulfoxides is caused by hydrogen abstraction from the DNA backbone to produce a DNA
radical.256 It is assumed that the reaction between the DNA radical and oxygen is
responsible for DNA damage generated by PhSO and MePhSO.256,257 Oxygen, in its
ground state (3O2), may also be necessary for the pro-oxidant effects of PhSO, since
photo-induced DNA damage was inhibited in the absence of oxygen.256 These studies
clearly indicate that the mechanistic action of oxo-sulfur compounds either as
antioxidants or pro-oxidants is quite complex, and further studies under biologically
relevant conditions are essential to better understand the activity of these compounds in
biological systems.
Oxo-selenium compounds
The naturally occurring amino acid, selenomethionine (SeMet) is found in many
proteins in place of its sulfur analog, methionine.258,259 Similar to methionine oxidation to
its corresponding sulfoxide, SeMet is also oxidized by peroxynitrite and enzymes such as
flavin-containing monooxygenases (FMOs) to methionine selenoxide
(MetSeO).69,217,218,258 A significant amount of research has investigated Met/MetSO
interconversion, but little work has investigated the properties of MetSeO. Oxidation
kinetics of SeMet are 10-1000 times faster than oxidation of methionine to produce
MetSeO.218 While the effects of MetSeO in biological systems have not been reported, it
is possible that this compound may lead to similar changes in hydrophobicity,
conformation, and disruption of biological functions associated with its sulfur analog,
MetSO.92,203,208-213 In light of this, Sies and colleagues investigated the reduction of
32

MetSeO to SeMet using glutathione (GSH) as a reductant.217 This study showed that
addition of MetSeO (0.4 mM) to increasing concentrations of GSH resulted in a loss of
MetSeO with an increase in SeMet (Reaction 12), suggesting that GSH in low
concentrations is effective in the protection against oxidants and that GSH may be
responsible for redox cycling of selenoxides.217
MetSeO + 2 GSH → SeMet + GSSG + H2O (12)
Apart from its role in protein function, SeMet metabolism by the methionine
transsulfuration pathway produces selenocysteine, an essential amino acid for the
function of several antioxidant enzymes including glutathione peroxidase and thioredoxin
reductase.258,260 Interestingly, FMOs also have been shown to oxidize other selenium
compounds, including the selenium containing drug ebselen, to their corresponding
selenoxides.261 Thus, further investigations are necessary to determine the effects of
oxidation on protein function and activity and the conditions required for antioxidant and
pro-oxidant activity of oxidized sulfur and selenium compounds, including selenium-
containing drugs.
Conclusions
Investigating the antioxidant and anticancer properties of inorganic selenium and
oxo-sulfur compounds in the treatment of diseases such as cancer, aging, and
neurodegenerative diseases generated from reactive oxygen species is an active and
promising area of research. In the case of inorganic selenium compounds, sodium selenite
is the compound of choice for both antioxidant and anticancer studies. While the
33

mechanism for its antioxidant activity is unclear, it has been proposed that the ability of
selenocysteine containing enzymes such as GPx and thioredoxin reductases to prevent
radical formation as a possible mechanism.57 The generation of hydrogen selenide from
selenometabolites such as selenite to produce toxic ROS is suggested as a possible
mechanism for the pro-oxidant and anticancer properties of inorganic selenium
compounds.55,57
The antioxidant activity of oxo-sulfur compounds is much less understood than
that of the inorganic selenium compounds. Most studies have focused on allicin, an oxo-
sulfur compound produced from crushed garlic; however, disparities concerning the
antioxidant activity of allicin are attributed to other endogenous components remaining
from the extraction process of crude garlic extracts.53,54 While MMTS and other oxo-
sulfur compounds may be effective in the treatment or prevention of cancer, their mode
of action has not been investigated. Similarly, little is known about the antioxidant
activity of MeCysSO, MetSeO and MePhSO; however, the ability of MetSO to prevent
ROS-mediated diseases such as aging, emphysema, and Alzheimer’s has been attributed
to the cyclic interconversion of MetSO by methionine sulfoxide reductases.212,214
Although MeCysSO and MetSeO are analogous to MetSO, little has been done to
determine the effects of these compounds in biological systems. Since MeCysSO and
MetSeO are formed from the oxidation of amino acids essential for protein function,
investigating the ability of these compounds to act as antioxidants, as well as their role in
disease prevention is of great interest. Therefore, further experiments including both in
vitro, and cellular and animal studies are required to investigate such behaviors. In
34

addition, studies are also needed to determine the effects of the sulfur compounds’
structural and chemical properties on their antioxidant activity.
Investigations of the ability of inorganic selenium and oxo-sulfur compounds to
inhibit metal-mediated oxidative DNA damage determined that coordination between
iron or copper and the antioxidant compound is required for prevention of DNA
damage.23,51 Additionally, the ability of oxo-sulfur compounds to scavenge radicals was
also suggested as a possible mechanism for this activity, particularly at high
concentrations.51 Further investigations to determine the role of metal coordination and
radical scavenging mechanisms of antioxidant behavior as well as the conditions required
to observe pro-oxidant properties of oxo-sulfur compounds are necessary to fully
understand the biological activities of these compounds.
In addition, the role of less studied compounds such as selenate, selenium dioxide,
methylcysteine sulfoxide, and methionine selenoxide in the prevention of ROS-mediated
disease is necessary to better understand and elucidate a mechanism for the antioxidant
and pro-oxidant activities of both inorganic and oxo-sulfur compounds. Although the
speciation of selenium compounds is an important factor in the biological activities of
these compounds,152-154 more studies using a larger number of selenium compounds
including selenide, selenate, and selenoxides are required to fully understand this effect.
Most of the inorganic selenium and oxo-compounds discussed in this review are obtained
from food products such as vegetables, fruits, nuts, and dietary supplements. However,
these foods and supplements may also contain other antioxidant or bioactive
ingredients.1,46,47 It is therefore equally important to determine the effects of other
35

bioactive compounds on the biological activity of inorganic and oxo-sulfur compounds.
Additional studies exploring the antioxidant, pro-oxidant, and mechanistic actions of
inorganic selenium, oxo-sulfur, and oxo-selenium compounds are essential to fully
understand the biological implications of food products and supplements for both humans
and animals.
References
(1) Valko, M.; Leibfritz, D.; Moncol, J.; Cronin, M. T.; Mazur, M.; Telser, J. Int. J.
Biochem. Cell Biol. 2007, 39, 44-84.
(2) Valko, M.; Rhodes, C. J.; Moncol, J.; Izakovic, M.; Mazur, M. Chem. Biol.
Interact. 2006, 160, 1-40.
(3) Storz, G.; Imlay, J. A. Curr. Opin. Microbiol. 1999, 2, 188-194.
(4) Farr, S. B.; Kogoma, T. Microbiol. Rev. 1991, 55, 561-585.
(5) Cadenas, E.; Davies, K. J. Free Radic. Biol. Med. 2000, 29, 222-230.
(6) Orrenius, S.; Gogvadze, V.; Zhivotovsky, B. Annu. Rev. Pharmacol. Toxicol.
2007, 47, 143-183.
(7) Marnett, L. J. Carcinogenesis 2000, 21, 361-370.
(8) Huang, X. Mutat. Res. 2003, 533, 153-171.
(9) Halliwell, B. Drugs Aging 2001, 18, 685-716.
(10) Markesbery, W. R. Free Radic. Biol. Med. 1997, 23, 134-147.
36

(11) Markesbery, W. R.; Carney, J. M. Brain Pathol. 1999, 9, 133-146.
(12) Markesbery, W. R.; Lovell, M. A. Antioxid. Redox Signal. 2006, 8, 2039-4205.
(13) Ide, T.; Tsutsui, H.; Hayashidani, S.; Kang, D.; Suematsu, N.; Nakamura, K.;
Utsumi, H.; Hamasaki, N.; Takeshita, A. Circ. Res. 2001, 88, 529-535.
(14) Steinberg, D. J. Biol. Chem. 1997, 272, 20963-20966.
(15) Dhalla, N. S.; Temsah, R. M.; Nettican, T. J. Hypertens. 2000, 18, 655-673.
(16) Kastan, M. B. Mol. Cancer Res. 2008, 6, 517-524.
(17) McCormick, M. L.; Buettner, G. R.; Britigan, B. E. J. Bacteriol. 1998, 180, 622-
625.
(18) Henle, E. S.; Linn, S. J. Biol. Chem. 1997, 272, 19095-19098.
(19) Flint, D. H.; Tuminello, J. F.; Emptage, M. H. J. Biol. Chem. 1993, 268, 22369-
22376.
(20) Park, S.; Imlay, J. A. J. Bacteriol. 2003, 185, 1942-1950.
(21) Rodriguez, H.; Holmquist, G. P.; D'Agostino, R., Jr.; Keller, J.; Akman, S. A.
Cancer Res. 1997, 57, 2394-2403.
(22) Seaver, L. C.; Imlay, J. A. J. Biol. Chem. 2004, 279, 48742-48750.
(23) Ramoutar, R. R.; Brumaghim, J. L. J. Inorg. Biochem. 2007, 101, 101028-35.
(24) Imlay, J. A.; Chin, S. M.; Linn, S. Science 1988, 240, 640-642.
(25) Imlay, J. A.; Linn, S. Science 1988, 240, 1302-1309.
37

(26) Hoffmann, M. E.; Mello-Filho, A. C.; Meneghini, R. Biochim. Biophys. Acta
1984, 781, 234-238.
(27) Henle, E. S.; Han, Z.; Tang, N.; Rai, P.; Luo, Y.; Linn, S. J. Biol. Chem. 1999,
274, 962-971.
(28) Nunoshiba, T.; Obata, F.; Boss, A. C.; Oikawa, S.; Mori, T.; Kawanishi, S.;
Yamamoto, K. J. Biol. Chem. 1999, 274, 34832-34837.
(29) Pastor, N.; Weinstein, H.; Jamison, E.; Brenowitz, M. J. Mol. Biol. 2000, 304, 55-
68.
(30) Emerit, J.; Beaumont, C.; Trivin, F. Biomed. Pharmacother. 2001, 55, 333-339.
(31) Stohs, S. J.; Bagchi, D. Free Radic. Biol. Med. 1995, 18, 321-336.
(32) Lippard, S. J.; Berg, J. M.; University Science Books: Mills Valley, 1994.
(33) Keyer, K.; Imlay, J. A. Proc. Natl. Acad. Sci. USA 1996, 93, 13635-13640.
(34) Woodmansee, A. N.; Imlay, J. A. Methods Enzymol. 2002, 349, 3-9.
(35) Lippard, S. J. Science 1999, 284, 748-749.
(36) Rae, T. D.; Schmidt, P. J.; Pufahl, R. A.; Culotta, V. C.; O'Halloran, T. V. Science
1999, 284, 805-808.
(37) Yang, L.; McRae, R.; Henary, M. M.; Patel, R.; Lai, B.; Vogt, S.; Fahrni, C. J.
Proc. Natl. Acad. Sci. USA 2005, 102, 11179-11184.
(38) Que, E. L.; Domaille, D. W.; Chang, C. J. Chem. Rev. 2008, 106, 1517-1549.
38

(39) Brown, D. R.; Qin, K. F.; erms, J. W.; Madlung, A.; Manson, J.; Strome, R.;
Fraser, P. E.; Kruck, T.; vonBohlen, A.; Schulz-Schaeffer, W.; Giese, A.;
Weataway, D.; Krestzschmar, H. Nature 1997, 390, 684-687.
(40) Stockel, J.; Safar, J.; Wallace, A. C.; Cohen, F. E.; Prusiner, S. B. Biochemistry
1998, 37, 7185-7193.
(41) Imlay, J. A.; Linn, S. J. Bacteriol. 1986, 166, 519-527.
(42) Imlay, J. A.; Linn, S. J. Bacteriol. 1987, 169, 2967-2976.
(43) Mello-Filho, A. C.; Meneghini, R. Mutat. Res. 1991, 251, 109-113.
(44) Singal, P. K.; Khaper, N.; Palace, V.; Kumar, D. Cardiovasc. Res. 1998, 40, 426-
432.
(45) Collins, A. R. BioEssays 1999, 21, 238-246.
(46) Siman, C. M.; Eriksson, U. J. Diabetes 1997, 46, 1054-1061.
(47) Siman, C. M.; Eriksson, U. J. Diabetologia 1997, 40, 1416-1424.
(48) Ames, B. N. Mutat. Res. 2001, 475, 7-20.
(49) Battin, E. E.; Brumaghim, J. L. J. Inorg. Biochem. 2008, 102, 2036-2042.
(50) Perron, N. R.; Hodges, J. N.; Jenkins, M.; Brumaghim, J. L. Inorg. Chem. 2008,
47, 6153-6161.
(51) Ramoutar, R. R.; L., B. J. Main Group Chem. 2007, 6, 143-153.
(52) Combs, G. F.; Gray, W. P. Pharmacol. Ther. 1998, 79, 179-192.
(53) Xiao, H.; Parkin, K. L. J. Agric. Food Chem. 2002, 50, 2488-2493.
39

(54) Yin, M.-C.; Cheng, W.-S. J. Agric. Food Chem. 1998, 46, 4097-4101.
(55) Holmgren, A. Free Radic. Biol. Med. 2006, 41, 862-865.
(56) Schrauzer, G. N. J. Am. Coll. Nutr. 2001, 20, 1-4.
(57) Takahashi, M.; Sato, T.; Shinohara, F.; Echigo, S.; Rikiishi, H. Int. J. Oncol.
2005, 27, 489-495.
(58) Zhong, W.; Oberley, T. D. Cancer Res. 2001, 61, 7071-7078.
(59) Finley, J. W.; Ip, C.; Lisk, D. J.; Davis, C. D.; Hintze, K. J.; Whanger, P. D. J.
Agric. Food Chem. 2001, 49, 2679-2683.
(60) Spallholz, J. E.; Mallory Boylan, L.; Rhaman, M. M. Sci. Total Environ. 2004,
323, 21-32.
(61) Gladyshev, V. N.; Kryukov, G. V. BioFactors 2001, 14, 87-92.
(62) Tapiero, H.; Townsend, D. M.; Tew, K. D. Biomed. Pharmacother. 2003, 57,
134-144.
(63) Brown, K. M.; Arthur, J. R. Public Health Nutr. 2001, 4, 593-599.
(64) Stadtman, T. C. Annu. Rev. Biochem. 2002, 71, 1-16.
(65) Brigelius-Flohe, R. Free Radic. Biol. Med. 1999, 27, 951-965.
(66) Cartes, P.; Gianfreda, L.; Mora, M. L. Plant Soil 2005, 276, 359-367.
(67) Rotruck, J. T.; Pope, A. L.; Ganther, H. E.; Swanson, A. B.; Hafeman, D. G.;
Hoekstra, W. G. Science 1973, 179, 588-590.
(68) Tinggi, U. Toxicol. Lett. 2003, 137, 103-110.
40

(69) Beilstein, M. A.; Whanger, P. D. J. Nutr. 1986, 116, 1711-1719.
(70) Abdulah, R.; Miyazaki, K.; Nakazawa, M.; Koyoma, H. J. Trace Elem. Med. Biol.
2005, 19, 141-150.
(71) Atmaca, G. Yonsei Med. J. 2004, 45, 776-788.
(72) Waschulewski, I. H.; Sunde, R. A. Br. J. Nutr. 1988, 60, 57-68.
(73) Fairweather-Tait, S. J. Eur. J. Clin. Nutr. 1997, 51 S20-S23.
(74) Battin, E. E.; Perron, N. R.; Brumaghim, J. L. Inorg. Chem. 2006, 45, 499-501.
(75) Davis, C. D.; Feng, Y.; Hein, D. W.; Finley, J. W. J. Nutr. 1999, 129, 63-69.
(76) Ip, C.; Hayes, C. Carcinogenesis 1989, 10, 921-925.
(77) Hamilton, E. E.; Wilker, J. J. J. Biol. Inorg. Chem. 2004, 9, 894-902.
(78) Nilsonne, G.; Sun, X.; Nystrom, C.; Rundlof, A. K.; Potamitou Fernandes, A.;
Bjornstedt, M.; Dobra, K. Free Radic. Biol. Med. 2006, 41, 874-885.
(79) Zhou, N.; Xiao, H.; Li, T. K.; Nur, E. K. A.; Liu, L. F. J. Biol. Chem. 2003, 278,
29532-29537.
(80) Lima, E. A. C.; Dire, G.; Mattos, D. M. M.; Freitas, R. S.; Gomes, M. L.; de
Oliveira, M. B. N.; Faria, M. V. C.; Jales, R. L.; Bernardo-Filho, M. Food Chem.
Toxicol. 2002, 40, 919-923.
(81) Rose, P.; Whiteman, M.; Moore, P. K.; Zhu, Y. Z. Nat. Prod. Rep. 2005, 22, 351-
368.
(82) Horvath, K.; Noker, P. E.; Somfai-Relle, S.; Glavits, R.; Financsek, I.; Schauss,
A. G. Food Chem. Toxicol. 2002, 40, 1459-1462.
41
(83) Lawrence, R. M. Int. J. Anti-Aging Med. 1998, 1, 50-57.
(84) Magnuson, B. A.; Appleton, J.; Ryan, B.; Matulka, R. A. Food Chem. Toxicol.
2007, 45, 977-984.
(85) Pearson, T. W.; Dawson, H. J.; Lackey, H. B. J. Agric. Food Chem. 1981, 29,
1089-1091.
(86) Silva Ferreira, A. C.; Rodrigues, P.; Hogg, T.; Guedes, D. P. J. Agric. Food
Chem. 2003, 51, 727-732.
(87) Berlett, B. S.; Stadtman, E. R. J. Biol. Chem. 1997, 272, 20313-20316.
(88) Hoshi, T.; Heinemann, S. J. Physiol. 2001, 531, 1-11.
(89) Perrin, D.; Koppenol, W. H. Arch. Biochem. Biophys. 2000, 377, 266-272.
(90) Levine, R. L.; Berlett, B. S.; Moskovitz, J.; Mosoni, L.; Stadtman, E. R. Mech.
Ageing Dev. 1999, 107, 323-332.
(91) Schoneich, C. Arch. Biochem. Biophys. 2002, 397, 370-376.
(92) Stadtman, E. R.; Moskovitz, J.; Levine, R. L. Antioxid. Redox. Signal. 2003, 5,
577-582.
(93) Kim, H. Y.; Gladyshev, V. N. Biochem. J. 2007, 407, 321-329.
(94) Pennington, J. A.; Schoen, S. A. Int. J. Vitam. Nutr. Res. 1996, 66, 350-362.
(95) Pennington, J. A.; Schoen, S. A. Int. J. Vitam. Nutr. Res. 1996, 66, 342-349.
(96) Burk, R. F. Nutr. Clin. Care 2002, 5, 75-79.
(97) Deore, M. D.; Srivastava, A. K.; Sharma, S. K. Toxicology 2005, 213, 169-174.
42

(98) Yang, G.; Wang, S.; Zhou, R.; Sun, S. Am. J. Clin. Nutr. 1983, 37, 872-881.
(99) Longnecker, M. P.; Taylor, P. R.; Levander, O. A.; Howe, M.; Veillon, C.;
McAdam, P. A.; Patterson, K. Y.; Holden, J. M.; Stampfer, M. J.; Morris, J. S.; et
al. Am. J. Clin. Nutr. 1991, 53, 1288-1294.
(100) Koller, L. D.; Exon, J. H. Can. J. Vet. Res. 1986, 50, 297-306.
(101) MacDonald, D. W.; Christian, R. G.; Strausz, K. I.; Roff, J. Can. Vet. J. 1981, 22,
279-281.
(102) Gissel-Nielsen, G.; Gupta, U. C.; Lamand, M.; Westermarck, T. Adv. Agron.
1984, 37, 397-460.
(103) Gupta, U. C.; Gupta, S. C. Commun. Soil Sci. Plant Anal. 2000, 31, 1791-1807.
(104) Gupta, U. C.; Watkinson, J. H. Outlook Agric. 1985, 14, 183-189.
(105) Kubota, J.; Allaway, W. H.; Carter, D. L.; Cary, E. E.; Lazar, V. A. J. Agric. Food
Chem. 1967, 15, 448-453.
(106) Aro, A.; Alfthan, G.; Varo, P. Analyst 1995, 120, 841-843.
(107) Thomson, C. D.; Robinson, M. F. Eur. J. Clin. Nutr. 1996, 50, 107-114.
(108) Whelan, B. R.; Barrow, N. J. Fert. Res. 1994, 38, 183-188.
(109) Whelan, B. R.; Peter, D. W.; Barrow, N. J. Aust. J. Agric. Res. 1994, 45, 863-875.
(110) Whelan, B. R.; Peter, D. W.; Barrow, N. J. Aust. J. Agric. Res. 1994, 45, 877-887.
(111) Pedrero, Z.; Madrid, Y.; Camara, C. J. Agric. Food Chem. 2006, 54, 2412-2417.
(112) Taylor, E. W. Biol. Trace Elem. Res. 1995, 49, 85-95.
43

(113) Cheng, Y. Y.; Qian, P. C. Biomed. Environ. Sci. 1990, 3, 422-428.
(114) Hartikainen, H. J. Trace Elem. Med. Biol. 2005, 18, 309-318.
(115) Vanderpas, J. B.; Contempre, B.; Duale, N. L.; Deckx, H.; Bebe, N.; Longombe,
A. O.; Thilly, C. H.; Diplock, A. T.; Dumont, J. E. Am. J. Clin. Nutr. 1993, 57,
271S-275S.
(116) Vanderpas, J. B.; Contempre, B.; Duale, N. L.; Goossens, W.; Bebe, N.; Thorpe,
R.; Ntambue, K.; Dumont, J.; Thilly, C. H.; Diplock, A. T. Am. J. Clin. Nutr.
1990, 52, 1087-1093.
(117) Chen, L.; Yang, F.; Xu, J.; Hu, Y.; Hu, Q.; Zhang, Y.; Pan, G. J. Agric. Food
Chem. 2002, 50, 5128-5130.
(118) Yang, C.; Niu, C.; Bodo, M.; Gabriel, E.; Notbohm, H.; Wolf, E.; Muller, P. K.
Biochem. J. 1993, 289, 829-835.
(119) Allander, E. Scand. J. Rheumatol. Suppl. 1994, 99, 1-36.
(120) Arthur, J. R.; Beckett, G. J. Br. Med. Bull. 1999, 55, 658-668.
(121) Schofield, F. W. Can. J. Comp. Med. 1953, 17, 422-424.
(122) Schroder, G.; Weissenbock, H.; Baumgartner, W. C.; Truschner, K. Wiener
Tiearztilche Monnatsshrift 1991, 80, 171-176.
(123) Kumar, K.; Bhatia, K. C.; Sadana, J. R. Ind. J. Anim. Nutr. 1989, 6, 52-55.
(124) Prasad, T.; Arora, S. P. Br. J. Nutr. 1991, 66, 261-267.
(125) Gupta, R. C.; Kwatra, M. S.; Singh, N. Ind. Vet. J. 1982, 59, 738-740.
44

(126) Kiremidjian-Schumacher, L.; Roy, M.; Wishe, H. I.; Cohen, M. W.; Stotzky, G.
Biol. Trace Elem. Res. 1994, 41, 115-127.
(127) Roy, M.; Kiremidjian-Schumacher, L.; Wishe, H. I.; Cohen, M. W.; Stotzky, G.
Biol. Trace Elem. Res. 1994, 41, 103-114.
(128) Look, M. P.; Rockstroh, J. K.; Rao, G. S.; Kreuzer, K. A.; Spengler, U.;
Sauerbruch, T. Biol. Trace Elem. Res. 1997, 56, 31-41.
(129) Singhal, N.; Austin, J. J. Int. Assoc. Physicians AIDS 2002, 1, 63-75.
(130) Romero-Alvira, D.; Roche, E. Med. Hypotheses 1998, 51, 169-173.
(131) Campa, A.; Shor-Posner, G.; Indacoche, F.; Zhang, G.; Lai, H.; Asthana, D.;
Scott, G. B.; Baum, M. K. J Acquir. Immune Defic. Syndr. Hum. Retrovirol. 1999,
15, 508-513.
(132) Baum, M. K.; Shor-Posner, G.; Lai, S.; Zhang, G.; Lai, H.; Fletcher, M. A.;
Sauberlich, H.; Page, J. B. J Acquir. Immune Defic. Syndr. Hum. Retrovirol. 1997,
15, 370-375.
(133) Baum, M. K.; Shor-Posner, G.; Lai, S.; Zhang, G.; Lai, H.; Fletcher, M. A.;
Sauberlich, H.; Page, J. B. J Acquir. Immune Defic. Syndr. Hum. Retrovirol. 1997,
15, 370-374.
(134) Chen, C.; Zhou, J.; Xu, H.; Jiang, Y.; Zhu, G. Biol. Trace Elem. Res. 1997, 59,
187-193.
(135) Olmsted, L.; Schruazer, G. N.; Flores-Acre, M.; Dowd, J. Biol. Trace Elem. Res.
1989, 25, 89-96.
(136) Schrauzer, G. N.; Sacher, J. Chem. Biol. Interact. 1994, 91, 199-205.
45
(137) Giovannucci, E. Lancet 1998, 352, 755-756.
(138) Harrison, P. R.; Lanfear, J.; Wu, L.; Fleming, J.; McGarry, L.; Blower, L.
Biomed. Environ. Sci. 1997, 10, 235-245.
(139) Clark, L. C.; Combs, G. F., Jr.; Turnbull, B. W.; Slate, E. H.; Chalker, D. K.;
Chow, J.; Davis, L. S.; Glover, R. A.; Graham, G. F.; Gross, E. G.; Krongrad, A.;
Lesher, J. L., Jr.; Park, H. K.; Sanders, B. B., Jr.; Smith, C. L.; Taylor, J. R. J. Am.
Med. Assoc. 1996, 276, 1957-1963.
(140) Clark, L. C.; Dalkin, B.; Krongrad, A.; Combs, G. F., Jr.; Turnbull, B. W.; Slate,
E. H.; Witherington, R.; Herlong, J. H.; Janosko, E.; Carpenter, D.; Borosso, C.;
Falk, S.; Rounder, J. Br. J. Urol. 1998, 81, 730-734.
(141) Bhuvarahamurthy, V.; Balasubramanian, N.; Govindasamy, S. Mol. Cell
Biochem. 1996, 158, 17-23.
(142) Stewart, M. S.; Spallholz, J. E.; Neldner, K. H.; Pence, B. C. Free Radic. Biol.
Med. 1999, 26, 42-48.
(143) Mantovani, G.; Maccio, A.; Madeddu, C.; Serpe, R.; Massa, E.; Gramignano, G.;
Lusso, M. R.; Curreli, N.; Rinaldi, A. J. Exp. Ther. Oncol. 2004, 4, 69-78.
(144) Spyrou, G.; Bjornstedt, M.; Skog, S.; Holmgren, A. Cancer Res. 1996, 56, 4407-
4412.
(145) Vadhanavikit, S.; Ip, C.; Ganther, H. E. Xenobiotica 1993, 23, 731-745.
(146) Shen, C. L.; Song, W.; Pence, B. C. Cancer Epidemiol. Biomarkers Prev. 2001,
10, 385-390.
(147) Ip, C. J. Am. Coll. Toxicol. 1986, 5, 7-20.
46

(148) Spallholz, J. E. Free Radic. Biol. Med. 1994, 17, 45-64.
(149) Battin, E. E.; Brumaghim, J. L. Ph.D. Dissertation, Clemson University, 2008.
(150) Berggen, M. M.; Mangin, J. F.; Gasdaska, J. R.; Powis, G. Biochem. Pharmacol.
1998, 57, 187-193.
(151) Berggren, M.; Gallegos, A.; Gasdaska, J.; Powis, G. Anticancer Res. 1997, 17,
3377-3380.
(152) El-Bayoumy, K. Mutat. Res. 2001, 475, 123-139.
(153) Ip, C. J. Nutr. 1998, 128, 1845-1854.
(154) Young, V. R.; Nahapetian, A.; Janghorbani, M. Am. J. Clin. Nutr. 1982, 35, 1076-
1088.
(155) Lu, J.; Kaeck, M.; Jiang, C.; Wilson, A. C.; Thompson, H. J. Biochem.
Pharmacol. 1994, 47, 1531-1535.
(156) Wilson, A. C.; Thompson, H. J.; Schedin, P. J.; Gibson, N. W.; Ganther, H. E.
Biochem. Pharmacol. 1992, 43, 1137-1141.
(157) Lu, J.; Jiang, C.; Kaeck, M.; Ganther, H.; Vadhanavikit, S.; Ip, C.; Thompson, H.
Biochem. Pharmacol. 1995, 50, 213-219.
(158) Gazi, M. H.; Gong, A.; Donkena, K. V.; Young, C. Y. Clin. Chim. Acta 2007,
380, 145-150.
(159) Burk, R. F.; Lawrence, R. A.; Lane, J. M. J. Clin. Invest. 1980, 65, 1024-1031.
(160) Hill, K. E.; Burk, R. F. Biomed. Environ. Sci. 1997, 10, 198-208.
(161) Holben, D. H.; Smith, A. M. J. Am. Diet. Assoc. 1999, 99, 836-843.
47

(162) Yang, J. G.; Hill, K. E.; Burk, R. F. J. Nutr. 1989, 119, 1010-1012.
(163) Gallegos, A.; Berggren, M.; Gasdaska, J. R.; Powis, G. Cancer Res. 1997, 57,
4965-4970.
(164) Behne, D.; Kyriakopoeulos, A.; Weiss-Nowak, C.; Kalckloesch, M.; Westphal,
C.; Gessner, H. Biol. Trace Elem. Res. 1996, 55, 99-110.
(165) Singh, M.; Lu, J.; Briggs, S. P.; McGinley, J. N.; Haegele, A. D.; Thompson, H. J.
Carcinogenesis 1994, 15, 1567-1570.
(166) Thirunavukkarasu, C.; Prince Vijeya Singh, J.; Thangavel, M.; Selvendiran, K.;
Sakthisekaran, D. Cell Biochem. Funct. 2002, 20, 347-356.
(167) Thirunavukkarasu, C.; Sakthisekaran, D. J. Cell. Biochem. 2003, 88, 578-588.
(168) Thompson, H. J.; Wilson, A.; Lu, J.; Singh, M.; Jiang, C.; Upadhyaya, P.; el-
Bayoumy, K.; Ip, C. Carcinogenesis 1994, 15, 183-186.
(169) Kim, T. S.; Yun, B. Y.; Kim, I. Y. Biochem. Pharmacol. 2003, 66, 2301-2311.
(170) Ganther, H. E. Biochemistry 1968, 7, 2898-2905.
(171) Ganther, H. E. Biochemistry 1971, 10, 4089-4098.
(172) Jacob, C. Nat. Prod. Rep. 2006, 23, 851-863.
(173) Kim, T. S.; Jeong, D. W.; Yun, B. Y.; Kim, I. Y. Biochem. Biophys. Res.
Commun. 2002, 294, 1130-1137.
(174) Seko, Y.; Imura, N. Biomed. Environ. Sci. 1997, 10, 333-339.
(175) Vaux, D. L.; Korsmeyer, S. J. Cell 1999, 96, 245-254.
48

(176) Harrison, W. T. A.; Stucky, G. D.; Morris, R. E.; Cheetham, A. K. Acta Cryst.
1992, C48, 1365-1367.
(177) Xiao, D.; An, H.; Wang, E.; Xu, L. J. Mol. Structure 2005, 740, 249-253.
(178) Cao, G.; Sofic, E.; Prior, L. R. J. Agric. Food Chem. 1996, 44, 3426-3431.
(179) Gey, K. F. Biochem. Soc. Trans. 1990, 18, 1041-1045.
(180) Willet, C. W. Science 1994, 264, 532-537.
(181) Ishikawa, K.; Naganawa, R.; Yoshida, H.; Iwata, N.; Fukuda, H.; Fujino, T.;
Suzuki, A. Biosci. Biotechnol. Biochem. 1996, 60, 2086-2088.
(182) Kyo, E.; Uda, N.; Suzuki, A.; Kakimoto, M.; Ushujima, M.; Kasuga, S.; Itakura,
Y. Phytomedicine 1998, 5, 259-267.
(183) Mirhadi, S. A.; Singh, S.; Gupta, P. P. Ind. J. Exp. Biol. 1991, 29, 162-168.
(184) Morimitsu, Y.; Morioka, Y.; Kawakishi, S. J. Agric. Food Chem. 1992, 40, 368-
372.
(185) Prasad, K.; Laxdal, V. A.; Yu, M.; Raney, B. L. Mol. Cell. Biochem. 1995, 148,
183-189.
(186) Siegers, C.-P.; Robke, A.; Pentz, R. Phytomedicine 1999, 6, 13-16.
(187) Singh, S. V.; Pan, S. S.; Srivastava, S. K.; Xia, H.; Hu, X.; Zaren, H. A.; Orchard,
J. L. Biochem. Biophys. Res. Commun. 1998, 244, 917-920.
(188) Weber, N. D.; Andersen, D. O.; North, J. A.; Murray, B. K.; Lawson, L. D.;
Hughes, B. G. Planta Med. 1992, 58, 417-423.
49
(189) Briggs, W. H.; Xiao, H.; Parkin, K. L.; Shen, C.; Goldman, I. L. J. Agric. Food
Chem. 2000, 48, 5731-5735.
(190) Edwards, J. S.; Musker, D.; Collin, H. A.; Britton, G. Phytochem. Anal. 1994, 5,
4-9.
(191) Thomas, D. J.; Parkin, K. L. J. Agric. Food Chem. 1994, 42, 1632-1638.
(192) Yoo, K. S.; Pike, L. M. Sci. Hortic. 1998, 75, 1-10.
(193) Hirsch, K.; Danilenko, M.; Giat, J.; Miron, T.; Rabinkov, A.; Wilchek, M.;
Mirelman, D.; Levy, J.; Sharoni, Y. Nutr. Cancer 2000, 38, 245-254.
(194) Rabinkov, A.; Miron, T.; Konstantinovski, L.; Wilchek, M.; Mirelman, D.;
Weiner, L. Biochim. Biophys. Acta 1998, 1379, 233-244.
(195) Ito, Y.; Nakamura, Y.; Nakamura, Y. Mutat. Res. 1997, 393, 307-316.
(196) Nakamura, Y.; Matsuo, T.; Shimoi, K.; Nakamura, Y.; Tomita, I. Bio. Pharm.
Bull. 1993, 16, 207-209.
(197) Nakamura, Y.; Matsuo, T.; Shimoi, K.; Nakamura, Y.; Tomita, I. Biosci. Biotech.
Biochem. 1996, 60, 1439-1443.
(198) Kim, L. S.; Axelrod, L. J.; Howard, P.; Buratovich, N.; Waters, R. F.
Osteoarthritis Cartilage 2006, 14, 286-294.
(199) Barrager, E.; Veltmann, J. R., Jr.; Schauss, A. G.; Schiller, R. N. J. Altern.
Complement. Med. 2002, 8, 167-173.
(200) Hucker, H. B.; Miller, J. K.; Hochberg, A.; Brobyn, R. D.; Riordan, F. H.;
Calesnick, B. J. Pharmacol. Exp. Ther. 1967, 155, 309-317.
50

(201) Pryor, W. A.; Jin, X.; Squadrito, G. L. Proc. Natl. Acad. Sci. USA 1994, 91,
11173-11177.
(202) Schoneich, C.; Zhao, F.; Wilson, G. S.; Borchardt, R. T. Biochim. Biophys. Acta
1993, 1158, 307-322.
(203) Ali, F. E.; Separovic, F.; Barrow, C. J.; Cherny, R. A.; Fraser, F.; Bush, A. I.;
Masters, C. L.; Barnham, K. J. J. Pept. Sci. 2005, 11, 353-360.
(204) Bush, A. I. Curr. Opin. Chem. Biol. 2000, 4, 184-191.
(205) Lynch, T.; Cherny, R. A.; Bush, A. I. Exp. Gerontol. 2000, 35, 445-451.
(206) Gao, J.; Yin, D. H.; Yao, Y.; Sun, H.; Qin, Z.; Schoneich, C.; Williams, T. D.;
Squier, T. C. Biophys. J. 1998, 74, 1115-1134.
(207) Squier, T. C.; Bigelow, D. J. Front Biosci. 2000, 5, D504-D526.
(208) Berlett, B. S.; Levine, R. L.; Stadtman, E. R. Proc. Natl. Acad. Sci. USA 1998, 95,
2784-2789.
(209) Brot, N.; Weissbach, H. Arch. Biochem. Biophys. 1983, 223, 271-281.
(210) Chao, C. C.; Ma, Y. S.; Stadtman, E. R. Proc. Natl. Acad. Sci. USA 1997, 94,
2969-2974.
(211) Levine, R. L.; Mosoni, L.; Berlett, B. S.; Stadtman, E. R. Proc. Natl. Acad. Sci.
USA 1996, 93, 15036-15040.
(212) Vogt, W. Free Radic. Biol. Med. 1995, 18, 93-105.
(213) von Eckardstein, A.; Walter, M.; Holz, H.; Benninghoven, A.; Assmann, G. J.
Lipid Res. 1991, 32, 1465-1476.
51

(214) Levine, R. L.; Moskovitz, J.; Stadtman, E. R. IUBMB Life 2000, 50, 301-307.
(215) Moskovitz, J.; Flescher, E.; Berlett, B. S.; Azare, J.; Poston, J. M.; Stadtman, E.
R. Proc. Natl. Acad. Sci. USA 1998, 95, 14071-14075.
(216) Tang, X. D.; Daggett, H.; Hanner, M.; Garcia, M. L.; McManus, O. B.; Brot, N.;
Weissbach, H.; Heinemann, S. H.; Hoshi, T. J. Gen. Physiol. 2001, 117, 253-274.
(217) Assmann, A.; Briviba, K.; Sies, H. Arch. Biochem. Biophys. 1998, 349, 201-203.
(218) Padmaja, S.; Squadrito, G. L.; Lemercier, J. N.; Cueto, R.; Pryor, W. A. Free
Radic. Biol. Med. 1996, 21, 317-322.
(219) Amagase, H.; Petesch, B. L.; Matsuura, H.; Kasuga, S.; Itakura, Y. J. Nutr. 2001,
131, 955S-962S.
(220) Corzo-Martinez, M.; Corzo, N.; Villamiel, M. Trends Food Sci. Technol. 2007,
18, 609-625.
(221) Das, S. Asian Pac. J. Cancer Prev. 2002, 3, 305-311.
(222) Chu, T. C.; Ogidigben, M.; Han, J. C.; Potter, D. E. J. Ocul. Pharmacol. 1993, 9,
201-209.
(223) Gebhardt, R.; Beck, H. Lipids 1996, 31, 1269-1276.
(224) Kaye, A. D.; Nossaman, B. D.; Ibrahim, I. N.; Feng, C. J.; McNamara, D. B.;
Agrawal, K. C.; Kadowitz, P. J. Eur. J. Pharmacol. 1995, 276, 21-26.
(225) Makheja, A. N.; Bailey, J. M. Agents Actions 1990, 29, 360-363.
(226) Chung, L. Y. J. Med. Food 2006, 9, 205-213.
52

(227) Kumari, K.; Mathew, B. C.; Augusti, K. T. Indian J. Biochem. Biophys. 1995, 32,
49-54.
(228) Kumari, K.; Augusti, K. T. Planta Med. 1995, 61, 72-74.
(229) Kumari, K.; Augusti, K. T. J. Ethnopharmacol. 2007, 109, 367-371.
(230) Kumari, K.; Augusti, K. T. Indian J. Exp. Biol. 2002, 40, 1005-1009.
(231) Kawamori, T.; Tanaka, T.; Ohnishi, M.; Hirose, Y.; Nakamura, Y.; Satoh, K.;
Hara, A.; Mori, H. Cancer Res. 1995, 55, 4053-4058.
(232) Nakamura, Y.; Matsuo, T.; Okamoto, S.; Nishikawa, A.; Imai, T.; Park, E. Y.;
Sato, K. Genes Environ. 2008, 30, 41-47.
(233) Nagira, T.; Narisawa, J.; Teruya, K.; Katakura, Y.; Shim, S. Y.; Kusumoto, K.;
Tokumaru, S.; Tokumaru, K.; Barnes, D. W.; Shirahata, S. Cytotechnology 2002,
40, 125-137.
(234) Richmond, V. L. Life Sci. 1986, 39, 263-268.
(235) Hucker, H. B.; Ahmad, P. M.; Miller, E. A.; Brobyn, R. Nature 1966, 209, 619-
620.
(236) Otsuki, S.; Qian, W.; Ishihara, A.; Kabe, T. Nutr. Res. 2002, 22, 313-322.
(237) Egorin, M. J.; Rosen, D. M.; Sridhara, R.; Sensenbrenner, L.; Cottler-Fox, M. J.
Clin. Oncol. 1998, 16, 610-615.
(238) Engelke, U. F.; Tangerman, A.; Willemsen, M. A.; Moskau, D.; Loss, S.; Mudd,
S. H.; Wevers, R. A. NMR Biomed. 2005, 18, 331-336.
(239) Lin, A.; Nguy, C. H.; Shic, F.; Ross, B. D. Toxicol. Lett. 2001, 123, 169-177.
53

(240) Rose, S. E.; Chalk, J. B.; Galloway, G. J.; Doddrell, D. M. Mag. Reson. Imag.
2000, 18, 95-98.
(241) Cronin, J. R. Altern. Compliment. Ther. 1999, 5, 386-390.
(242) Usha, P. R.; Naidu, M. U. Clin. Drug Investig. 2004, 24, 353-363.
(243) Moskovitz, J.; Berlett, B. S.; Poston, J. M.; Stadtman, E. R. Proc. Natl. Acad. Sci.
USA 1997, 94, 9585-9589.
(244) Ruan, H.; Tang, X. D.; Chen, M. L.; Joiner, M. L.; Sun, G.; Brot, N.; Weissbach,
H.; Heinemann, S. H.; Iverson, L.; Wu, C. F.; Hoshi, T. Proc. Natl. Acad. Sci.
USA 2002, 99, 2748-2753.
(245) Moskovitz, J.; Rahman, M. A.; Strassman, J.; Yancey, S. O.; Kushner, S. R.; Brot,
N.; Weissbach, H. J. Bacteriol. 1995, 177, 502-507.
(246) St. John, G.; Brot, N.; Ruan, J.; Erdjument-Bromage, H.; Tempst, P.; Weissbach,
H.; Nathan, C. Proc. Natl. Acad. Sci. USA 2001, 98, 9901-9906.
(247) Moskovitz, J.; Bar-Noy, S.; Williams, W. M.; Requena, J.; Berlett, B. S.;
Stadtman, E. R. Proc. Natl. Acad. Sci. USA 2001, 98, 12920-12925.
(248) Sattler, W.; Christison, J.; Stocker, R. Free Radic. Biol. Med. 1995, 18, 421-429.
(249) Maier, K.; Leuschel, L.; Costabel, U. Am. Rev. Respir. Dis. 1991, 143, 271-274.
(250) Petropoulos, I.; Mary, J.; Perichon, M.; Friguet, B. Biochem. J. 2001, 355, 819-
825.
(251) Gabbita, S. P.; Aksenov, M. Y.; Lovell, M. A.; Markesbery, W. R. J. Neurochem.
1999, 73, 1660-1666.
54

(252) Michaelis, M. L.; Bigelow, D. J.; Schoneich, C.; Williams, T. D.; Ramonda, L.;
Yin, D.; Huhmer, A. F.; Yao, Y.; Gao, J.; Squier, T. C. Life Sci. 1996, 59, 405-
412.
(253) Wells-Knecht, M. C.; Lyons, T. J.; McCance, D. R.; Thorpe, S. R.; Baynes, J. W.
J. Clin. Invest. 1997, 100, 839-846.
(254) Gellman, S. H. Biochemistry 1991, 30, 6633-6636.
(255) Armitage, B. Chem. Rev. 1998, 98, 1171-1200.
(256) Mayo, D. J.; Turner, D. P.; Zucconi, B. E.; Predecki, A. H. Bioorg. Med. Chem.
Lett. 2007, 17, 6116-6118.
(257) Wauchope, O. R.; Shakya, S.; Sawwan, N.; Liebman, J. F.; Greer, A. Sulf. Chem.
2007, 28, 11-15.
(258) Krause, R. J.; Glocke, S. C.; Sicuri, A. R.; Ripp, S. L.; Elfarra, A. A. Chem. Res.
Toxicol. 2006, 19, 1643-1649.
(259) Schrauzer, G. N. J. Nutr. 2000, 130, 1653-1656.
(260) Kajander, E. O.; Harvima, R. J.; Eloranta, T. O.; Martikainen, H.; Kantola, M.;
Karenlampi, S. O.; Akerman, K. Biol. Trace Elem. Res. 1991, 28, 57-68.
(261) Ziegler, D. M.; Graf, P.; Poulsen, L. L.; Stahl, W.; Sies, H. Chem. Res. Toxicol.
1992, 5, 163-166.
55

CHAPTER TWO
EFFECTS OF INORGANIC SELENIUM COMPOUNDS ON OXIDATIVE DNA
DAMAGE
Introduction
Generation of reactive oxygen species (ROS) in cells can damage cellular
components including nucleic acids, lipids, and proteins.1 Oxidative damage in vivo is
caused by ROS such as the hydroxyl radical (•OH) produced in the Fenton reaction.2,3
Fe2+ + H2O2 → Fe3+ + [•OH] + OH-
Iron-generated hydroxyl radical is the primary cause of oxidative DNA damage
and cell death in both prokaryotes4 and eukaryotes, including humans.4,5 This DNA
damage can lead to conditions such as aging,6 cancer,7 neurodegenerative,2 and
cardiovascular diseases.8 Since cellular reductants such as NADH reduce Fe3+ back to
Fe2+, the production of hydroxyl radical is catalytic in vivo.9
Two kinetically-distinct modes of cell killing exist when Escherichia coli or
mammalian cells are exposed to H2O2. Mode I killing is faster than Mode II and occurs at
low peroxide concentrations (1-5 mM), whereas Mode II killing occurs at peroxide
concentrations greater than 10 mM and is independent of H2O2 concentration.9,10 Similar
kinetics are also observed for in vitro DNA damage with maximal damage under Mode I
conditions at 50 μM H2O2 and under Mode II conditions at H2O2 concentrations greater
than 10 mM.9-11 Iron-mediated cleavage of the DNA backbone under Mode I and II
conditions occurs selectively at different DNA sequences: RTGR (with cleavage at the
thymidine deoxyribose) for Mode I damage and RGGG for Mode II (R = A or G).11,12
56

Under Mode I conditions, hydroxyl radical is likely generated by Fe(II) bound to solvent-
accessible sites on the deoxyribose-phosphate backbone or bases of DNA, whereas DNA
damage under Mode II conditions occurs when H2O2 reacts with more-sterically-hindered
Fe(II) bound to DNA bases, particularly guanine.11
Antioxidants can prevent or reduce oxidative DNA damage,13-15 and selenium has
been widely studied for its antioxidant and anticancer effects.16-18 Selenium is also an
essential micronutrient for both humans and animals with a RDA ranging from 55-350
μg/day for humans,19 and it is incorporated as selenocysteine in the active site of
antioxidant proteins, including glutathione peroxidases (GPx) and thioredoxin
reductases.16,20,21 Selenium is found in most multivitamins and dietary supplements19 as
selenomethionine, selenite (SeO32-), or selenate (SeO4
2-).22 In addition, selenite and
selenate are also incorporated into animal feed, protein mixes, and infant formula.19
Selenium additives to animal feed, 16.8 tons annually for sheep and cows alone,23
improve animal performance and increase selenium dietary intake for people consuming
meat products.24
Initially, the ability of selenium to prevent hydroxyl radical formation by
decomposition of H2O2 to water via GPx enzymes was proposed as a mechanism for their
anticancer activity.16,25 However, other studies indicate that while selenium is an effective
antioxidant, this is not the sole basis for its anticancer activity.16,26,27 Recently, a new
mechanism involving selenometabolites was proposed to explain the anticancer effects of
selenium.16,18 Compounds such as selenite generate hydrogen selenide (H2Se), used to
incorporate selenium into selenocysteine and selenomethionine. Thus, H2Se produced in
57

high concentrations may react with oxygen to produce ROS toxic to cells.20,28,29
Additionally, selenometabolites such as selenodigluthathione have been found to inhibit
cell growth and induce apoptosis in tumor cells.16,18,30
Although the mechanisms of antioxidant and anticancer activity for selenium
compounds are unclear, organoselenium compounds such as selenomethionine have been
shown to have antioxidant activity.26,27,31 In addition, a plethora of anticancer studies
have been conducted with sodium selenite (Na2SeO3), showing conflicting
results.16-18,30,32-34 Few studies have been conducted with either sodium selenate
(Na2SeO4) and selenium dioxide (SeO2). Hamilton et al. found that Na2SeO4 (6.2 mM)
inhibited DNA damage via alkylating agents.35 Takahashi and coworkers found that both
Na2SeO3 (10 μM) and SeO2 (50-100 μM) induced apoptosis in HSC-3 cells, whereas
Na2SeO4 (100 μM) did not, suggesting that the former compounds are better anticancer
agents.16 In addition, SeO2 (3-30 μM) was shown to inhibit the growth of lung cancer
GLC-82 cells via apoptosis in a dose-dependent and time-dependent manner.36
Se
O
O- Na+Na+ O-
Se
O
O- Na+Na+ -O
O
Se2-Na+ Na+SeO O
1 2 3 4
Figure 2.1. Selenium compounds tested: (1) selenium dioxide, SeO2, (2) sodium selenite, Na2SeO3, (3) sodium selenate, Na2SeO4, and (4) sodium selenide, Na2Se.
Despite the widespread use of inorganic selenium compounds in vitamins and animal
feed, relatively little work has been done to determine their antioxidant properties. Thus,
58
we have used gel electrophoresis to study the effects of Na2SeO3, Na2SeO4, SeO2, and
Na2Se (Figure 2.1) on DNA damage in the presence of H2O2 under both Mode I and II
conditions. For the selenium compounds that inhibited DNA damage, the mechanism by
which these compounds prevented such damage was also investigated.
Similarly to iron, Cu+ can also undergo Fenton-like chemistry, producing the
DNA-damaging hydroxyl radical. Unlike the bimodal rate of DNA damage observed
Cu+ + H2O2 → Cu2+ + OH¯+ •OH
under Fenton reaction conditions, the rate of copper-mediated DNA damage is linear
with increasing hydrogen peroxide concentration.37 The ability of the inorganic selenium
compounds to prevent copper-mediated DNA damage was also studied via gel
electrophoresis experiments. The iron work discussed in this chapter is published in J.
Inorg. Biochem. 2007, 101, 1028-1035.38
Results
The selenium compounds in Figure 2.1 differ in both oxidation state of the
selenium atom and in charge. Selenide, selenite, and selenate are charged species with -2,
+4 and +6 selenium oxidation states, respectively. Selenium dioxide, however is neutral
with a +4 selenium oxidation state. Our DNA damage studies examine both the ability of
these compounds to inhibit iron-mediated DNA damage, and the effects of selenium
oxidation state and charge on this activity.
59

Mode I experiments with inorganic selenium compounds and Fe2+
A gel electrophoresis experiment testing selenite for its ability to inhibit DNA
damage under Mode I conditions (50 μM H2O2, 10 mM ethanol) is shown in Figure 2.2A.
At this H2O2 concentration, the rate of Mode I DNA damage is maximal; ethanol was
also added to emulate organic molecules in cells that scavenge hydroxyl radical.11 From
the gel in Figure 2.2A, it is clear that both H2O2 alone (lane 3) and Na2SeO3 with H2O2
alone (lane 4) had no effect on DNA damage as compared to the plasmid-only lane (lane
2). Addition of both Fe(II) (2 μM) and H2O2 (lane 5) produced 94% damaged (nicked)
DNA. Addition of increasing concentrations of Na2SeO3 (0.5-5000 μM, all p < 0.02)
A B
C D
1 2 3 4 5 6 7 8 9 10 1 2 3 4 5 6 7 8 9 10
1 2 3 4 5 6 7 8 9 10 1 2 3 4 5 6 7 8 9 10
[Na2SeO4]
nicked DNAundamaged DNA
[Na2Se]
nicked DNAundamaged DNA
[Na2SeO3]
nicked DNAundamaged DNA
[SeO2]
nicked DNAundamaged DNA
A B
C D
1 2 3 4 5 6 7 8 9 10 1 2 3 4 5 6 7 8 9 10
1 2 3 4 5 6 7 8 9 10 1 2 3 4 5 6 7 8 9 10
[Na2SeO4]
nicked DNAundamaged DNA
[Na2Se]
nicked DNAundamaged DNA
[Na2SeO3]
nicked DNAundamaged DNA
[SeO2]
nicked DNAundamaged DNA
Figure 2.2. DNA gel electrophoresis experiments for (A) Na2SeO3, (B) Na2SeO4, (C) Na2Se, and (D) SeO2 under Mode I conditions. For each gel, lane 1: 1 kb ladder; lanes 2-5: plasmid, H2O2 (50 μM), Na2SeO3, Na2SeO4, SeO2 (5000 μM) or Na2Se (200 μM), and Fe2+ (2 μM) respectively; lanes 6-10: 0.5, 5, 50, 500 and 5000 μM of Na2SeO3, Na2SeO4, and SeO2 respectively, or 0.5, 5, 50, 100 and 200 μM of Na2Se. resulted in increased undamaged (closed, circular) DNA (Figure 2.2A, lanes 6-10),
indicating that Na2SeO3 inhibited oxidative DNA damage. From quantification of these
60

gel bands, we determined that the highest Na2SeO3 concentration (5000 μM) inhibited
91% of iron-mediated DNA damage.
Similar electrophoresis experiments were conducted for Na2SeO4, SeO2 and
Na2Se under identical Mode I conditions. In this case, Na2SeO4 (Figure 2.2B) and Na2Se
(Figure 2.2C), showed no inhibition of DNA damage with increasing concentration. In
contrast, adding SeO2 in the presence of Fe(II) and H2O2 showed a slight increase in
DNA damage (Figure 2.2D, lanes 6-8) at concentrations of 0.5-50 μM compared to the
Fe(II)/H2O2 lane (lane 5). This corresponds to a 20% increase in DNA damage at 50 μM
SeO2 (p = 0.02). At higher concentrations (500 and 5000 μM, lanes 9-10), however,
SeO2 inhibited DNA damage by 17% (p = 0.01) and 100% (p = > 0.0001), respectively.
-40
-20
0
20
40
60
80
100
0 1000 2000 3000 4000 5000
[Se compounds] (μM)
% D
NA
dam
age
inhi
bitio
n
Na SeO SeO Na SeO and Na Se
2 3
2
2
2 4
Figure 2.3. Percent DNA damage inhibition graph for Na2SeO3, Na2SeO4, SeO2, and Na2Se under Mode I conditions. Error bars represent standard deviations calculated from the average of three trials.
Figure 2.3 shows a graph of percent DNA damage inhibition vs. concentration of
selenium compound for the four inorganic selenium compounds tested. Inhibition of
DNA damage is clearly greatest for Na2SeO3 and high concentrations of SeO2, whereas
61

SeO2 shows increased DNA damage at lower concentrations, and both Na2SeO4 and
Na2Se show no effect on DNA damage.
[Fe(EDTA)]2- experiments under Mode I conditions
Since our studies indicated that both Na2SeO3 and SeO2 inhibit DNA damage at
high concentrations (500-5000 μM) under Mode I conditions, we investigated metal
coordination as a possible mechanism for the inhibitory effect of these compounds. Iron
binding to the selenium compound could prevent the generation or release of the
hydroxyl radical upon exposure to H2O2. To test this metal coordination hypothesis, we
performed gel electrophoresis experiments with the [Fe(EDTA)]2- complex as the iron
source. The chelating ligand EDTA (ethylenediaminetetraacetic acid) completely
coordinates Fe2+, preventing potential coordination between the selenium compound and
iron. Although completely coordinated, [Fe(EDTA)]2- does generate DNA-damaging
hydroxyl radical in the presence of H2O2.
Gel electrophoresis experiments showed that addition of [Fe(EDTA)]2- (400 μM)
and H2O2 under Mode I conditions produced approximately 63% nicked DNA (Figure
2.4, lane 5). As the concentration of Na2SeO3 was increased, no effect on oxidative DNA
damage was observed (lanes 6-10). Similarly, increasing concentrations of SeO2 had no
effect on DNA damage under the same conditions (Figure 2.4B). The lack of DNA
damage inhibition by both Na2SeO3 and SeO2 with [Fe(EDTA)]2- instead of FeSO4 as the
iron source suggests that metal coordination is required for the effects of both compounds
on DNA damage under Mode I conditions.
62

[Na2SeO3]
nicked DNA undamaged DNA
[SeO2]
nicked DNA undamaged DNA
1 2 3 4 5 6 7 8 9 10 1 2 3 4 5 6 7 8 9 10 A B
Figure 2.4. DNA gel electrophoresis experiments for (A) Na2SeO3 and (B) SeO2 with [Fe(EDTA)]2- under Mode I conditions. For each gel, lane 1: 1 kb ladder; lanes 2-5: plasmid, H2O2 (50 μM), Se compound (5000 μM) and [Fe(EDTA)]2- (400 μM) respectively; lanes 6-10: 0.5, 5, 50, 500, and 5000 μM respectively of either Na2SeO3 or SeO2.
Mode II experiments with inorganic selenium compounds
At higher peroxide concentrations (> 10 mM), in vitro iron-mediated DNA
damage was shown to occur independently of H2O2 concentration.11 This Mode II DNA
damage likely differs from Mode I damage in that the generated hydroxyl radical results
from the reaction of H2O2 with Fe(II) bound to the bases of DNA.11 Because Mode I and
Mode II DNA damage result from hydroxyl radical being produced at different sites of
iron localization on DNA, we also determined the effects of Na2SeO3, Na2SeO4, SeO2
and Na2Se on oxidative DNA damage under Mode II conditions.
Experiments performed under Mode II conditions were identical to those for
Mode I except that the concentrations of H2O2 (50 mM) and ethanol (100 mM) were
increased to ensure that DNA damage was caused only by Mode II radicals.10,11 Initial
experiments with Na2SeO3 indicated that this compound increases DNA damage in the
presence of H2O2 without addition of Fe(II). Therefore, further experiments with selenite
under Mode II conditions were conducted at pH 7 in the absence of iron.
63

[Na2SeO3]
nicked DNA undamaged DNA
[Na2SeO4]
nicked DNA undamaged DNA
[Na2Se]
nicked DNA undamaged DNA
[SeO2]
nicked DNA undamaged DNA
1 2 3 4 5 6 7 8 9 1 2 3 4 5 6 7 8 9 10
1 2 3 4 5 6 7 8 9 10 1 2 3 4 5 6 7 8 9 10
A B
C D
Figure 2.5. DNA gel electrophoresis experiments for (A) Na2SeO3, (B) Na2SeO4, (C) Na2Se and (D) SeO2 under Mode II conditions. For (A) Na2SeO3 lane 1: 1 kb ladder; lanes 2-4: plasmid, H2O2 (50 mM), and Na2SeO3 (5000 μM) respectively; lanes 5-9 have H2O2 + 0.5, 5, 50, 500, 5000 μM Na2SeO3, respectively. For gels B-D, lane 1: 1 kb ladder; 2-5: plasmid, H2O2 (50 mM), H2O2 + Na2SeO4, SeO2 (5000 μM) or Na2Se (200 μM), H2O2 + Fe2+ (2 μM); lanes 6-10: H2O2 + Fe2+ + 0.5, 5, 50, 500 and 5000 μM of Na2SeO4 or SeO2 respectively. For Na2Se, lanes 6-10: H2O2 + Fe2+ + 0.5, 5, 50, 100 and 200 μM Na2Se, respectively.
Sodium selenate (0.5-5000 μM) was also tested under Mode II conditions with
Fe(II) (2 μM) at pH 6. As seen from the gel in Figure 2.5B, Na2SeO4 had no effect on
DNA damage, regardless of concentration (lanes 6-10). Under similar conditions,
addition of Na2Se also had no effect on DNA damage (Figure 2.5C). In contrast, adding
increasing concentrations of SeO2 (5-5000 μM) under the same Mode II conditions
showed inhibition of DNA damage (Figure 2.5D lanes 6-10, all p < 0.05).
64

0
20
40
60
80
100
0 1000 2000 3000 4000 5000
[Na2SeO3] (μM)
% D
NA d
amag
e \
0
20
40
60
80
100
0 1000 2000 3000 4000 5000
[Se compounds] (μM)
% D
NA
dam
age
inhi
bitio
n
SeO
Na SeO and Na Se
2 2 4 2
BA
Figure 2.6. A) Percent DNA damage graph for 0.5-5000 μM Na2SeO3 under Mode II conditions in the absence of Fe2+ B) Percent DNA damage inhibition graph for 0.5-5000 μM Na2SeO4 and SeO2, and 0.5-200 μM Na2Se under Mode II conditions in the presence of Fe2+ (2 μM) and H2O2 (50 mM). Error bars for both graphs represent standard deviations calculated from the average of three trials.
Unlike selenite, adding only SeO2 and H2O2 (lane 4) had no effect on DNA
damage compared to the DNA control (lane 2). Increasing the concentration of SeO2 to
5000 μM resulted in inhibition of 81% DNA damage (lane 10; p = 0.003). Thus, under
Mode II conditions, SeO2 had an inhibitory effect on DNA that is concentration-
dependent. A comparison of DNA damage inhibition by Na2SeO4, Na2Se, and SeO2
under Mode II conditions is shown in Figure 2.6B.
[Fe(EDTA)]2- experiments under Mode II conditions
Under Mode II conditions, SeO2 was the only selenium compound to inhibit DNA
damage. Experiments similar to those under Mode I conditions, using [Fe(EDTA)]2- as
the iron source, were therefore conducted to determine whether metal coordination is
required for SeO2 inhibition of DNA damage under Mode II conditions. The gel shown in
65

[SeO2] nicked DNA undamaged DNA
1 2 3 4 5 6 7 8 9 10
Figure 2.7. DNA gel electrophoresis experiments for SeO2 with [Fe(EDTA)]2- under Mode II conditions. Lane 1: 1 kb ladder; lanes 2-5: plasmid, H2O2 (50 μM), SeO2 (5000 μM) and [Fe(EDTA)]2- (400 μM), respectively; lanes 6-10: 0.5, 5, 50, 500, and 5000 μM SeO2, respectively.
Figure 2.7 shows that [Fe(EDTA)]2- combined with H2O2 (lane 5) resulted in
100% nicked DNA. Upon addition of increasing concentrations of SeO2 (lanes 6-10), the
percentage of DNA damage did not change. This suggests that iron coordination is
required for SeO2 to prevent DNA damage under Mode II conditions in much the same
manner as was found for SeO2 and Na3SeO3 inhibition of DNA damage under Mode I
conditions.
77Se NMR Experiments
Several studies indicate that in aqueous solution at pH 6, SeO2 exists as HSeO3-
(SeO2 + H2O → HSeO3- + H+),39-41 a species similar to Na2SeO3 in aqueous solution.
Since our gel results with Na2SeO3 and SeO2 showed differing effects of these
compounds on DNA damage, 77Se NMR experiments were performed to elucidate the
speciation of SeO2. Aqueous solutions of SeO2 showed singlets at δ 1317 and 1299
(Figure 2.11) at pH 6 and 7, respectively, which did not change over a period of three
66

days. Under the same conditions, Na2SeO3, showed a singlet at δ 1274 at both pH 6 and 7
(Figure 2.12). Thus, our results indicate that aqueous solutions of Na2SeO3 and SeO2 do
not form the same compound under these conditions.
DNA nicking experiments with inorganic selenium compounds and Cu+
Since copper generates the DNA-damaging hydroxyl radical, the antioxidant
effects of Na2SeO3, Na2SeO4, Na2Se and SeO2 on copper-mediated DNA damage were
investigated via gel electrophoresis. In these experiments Cu2+ (6 μM) was reduced to
Cu+ by ascorbic acid (7.5 μM) and hydroxyl radical was generated upon addition of H2O2
(50 μM). A gel electrophoresis experiment testing the ability of selenite to inhibit copper-
mediated DNA damage is shown in Figure 2.8A.
undamagedDNA
nicked DNA
[Na2SeO3]108 9761 5432
A
nicked DNAundamagedDNA
[SeO2]108 9761 5432D
nicked DNAundamaged DNA
[Na2Se]108 9761 5432C
undamaged DNA
nicked DNA
[Na2SeO4]108 9761 5432B
undamagedDNA
nicked DNA
[Na2SeO3]108 9761 5432
A
undamagedDNA
nicked DNA
[Na2SeO3]108 9761 5432
undamagedDNA
nicked DNA
[Na2SeO3]108 9761 5432 108 9761 5432
A
nicked DNAundamagedDNA
[SeO2]108 9761 5432D
nicked DNAundamagedDNA
[SeO2]108 9761 5432
nicked DNAundamagedDNA
[SeO2]108 9761 5432 108 9761 5432D
nicked DNAundamaged DNA
[Na2Se]108 9761 5432C
nicked DNAundamaged DNA
[Na2Se]108 9761 5432
nicked DNAundamaged DNA
nicked DNAundamaged DNA
[Na2Se]108 9761 5432 108 9761 5432C
undamaged DNA
nicked DNA
[Na2SeO4]108 9761 5432B
undamaged DNA
nicked DNA
[Na2SeO4]
108 9761 5432
undamaged DNA
nicked DNA
[Na2SeO4]108 9761 5432 108 9761 5432B
Figure 2.8. DNA gel electrophoresis experiments for (A) Na2SeO3, (B) Na2SeO4, (C) Na2Se, and (D) SeO2 for Cu+. For each gel, lane 1: 1 kb ladder; lanes 2-5: plasmid, H2O2
(50 μM), Na2SeO3, Na2SeO4, SeO2 (5000 μM) or Na2Se (200 μM), Cu2+ (6 μM), and ascorbic acid (7.5 μM) respectively; lanes 6-10: 0.5, 5, 50, 500 and 5000 μM of Na2SeO3, Na2SeO4, and SeO2 respectively, or 0.5, 5, 50, 100 and 200 μM of Na2Se.
67

The gel data show that both H2O2 alone (lane 3) or Na2SeO3 with H2O2 alone
(lane 4) have no effect on DNA as compared to the plasmid-only lane (lane 2). Addition
of both Cu+ and H2O2 (lane 5) produces 97% damaged DNA, and adding increasing
concentrations of Na2SeO3 (0.5-5000 μM) results in increased undamaged DNA (Figure
2.8A, lanes 9-10). Na2SeO3 (5000 μM) inhibit 95% copper-mediated DNA damage.
-20
0
20
40
60
80
100
0 1000 2000 3000 4000 5000
[Se compound] (μM)
% D
NA
dm
age
inhi
bitio
n \
seleniteselenium dioxideselenate and selenide
Figure 2.9. Percent DNA damage inhibition graph for Na2SeO3, Na2SeO4, SeO2, and Na2Se with Cu+. Error bars represent standard deviations calculated from three trials.
Similar electrophoresis experiments performed with SeO2 (Figure 2.8D) under
similar conditions show that this compound inhibits 63% DNA damage at the highest
concentration tested (5000 μM; Figure 2.9). Both Na2SeO4 (Figure 2.8B) and Na2Se
(Figure 2.8C) show no inhibition of DNA damage upon adding increasing concentrations
of these selenium compounds (Figure 2.9).
68
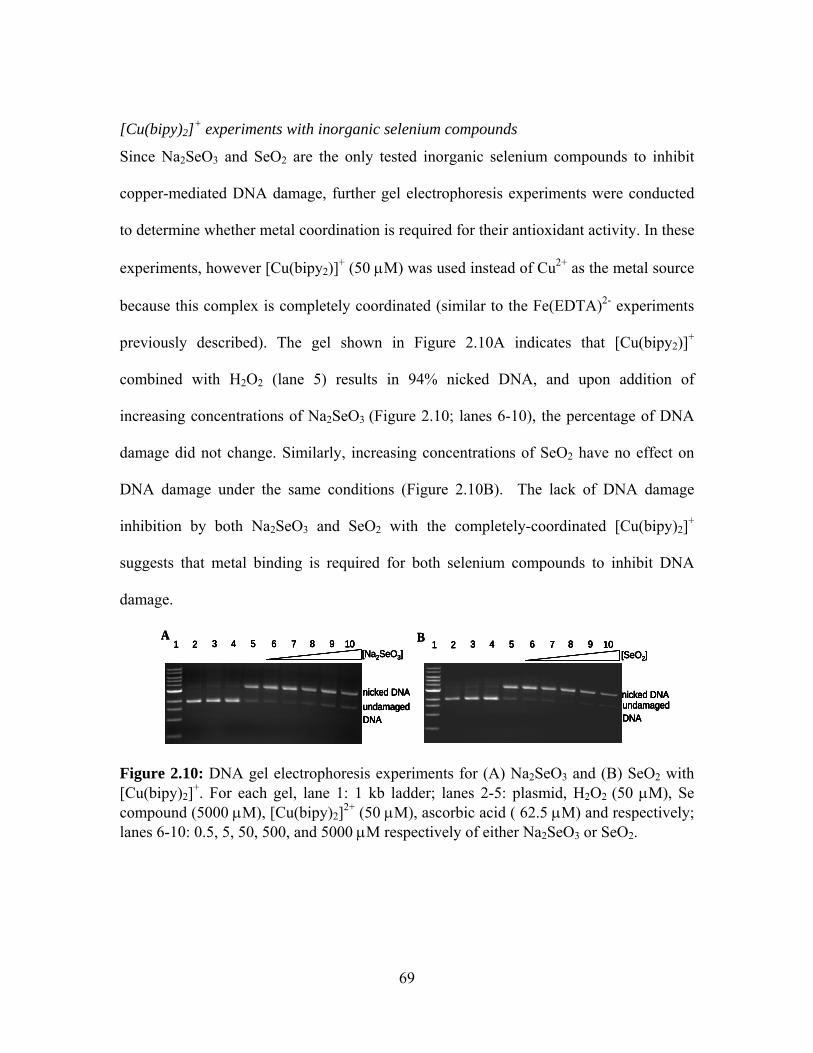
[Cu(bipy)2]+ experiments with inorganic selenium compounds
Since Na2SeO3 and SeO2 are the only tested inorganic selenium compounds to inhibit
copper-mediated DNA damage, further gel electrophoresis experiments were conducted
to determine whether metal coordination is required for their antioxidant activity. In these
experiments, however [Cu(bipy2)]+ (50 μM) was used instead of Cu2+ as the metal source
because this complex is completely coordinated (similar to the Fe(EDTA)2- experiments
previously described). The gel shown in Figure 2.10A indicates that [Cu(bipy2)]+
combined with H2O2 (lane 5) results in 94% nicked DNA, and upon addition of
increasing concentrations of Na2SeO3 (Figure 2.10; lanes 6-10), the percentage of DNA
damage did not change. Similarly, increasing concentrations of SeO2 have no effect on
DNA damage under the same conditions (Figure 2.10B). The lack of DNA damage
inhibition by both Na2SeO3 and SeO2 with the completely-coordinated [Cu(bipy)2]+
suggests that metal binding is required for both selenium compounds to inhibit DNA
damage.
B 108 9761 5432[SeO2]
undamaged DNA
nicked DNA
A
undamaged DNA
nicked DNA
[Na2SeO3]108 9761 5432 B 108 9761 5432
[SeO2]
undamaged DNA
nicked DNA
B 108 9761 5432[SeO2]
undamaged DNA
nicked DNA
108 9761 5432 108 9761 5432[SeO2]
undamaged DNA
nicked DNA
[SeO2]
undamaged DNA
nicked DNA
A
undamaged DNA
nicked DNA
[Na2SeO3]108 9761 5432
A
undamaged DNA
nicked DNA
[Na2SeO3]108 9761 5432
undamaged DNA
nicked DNA
[Na2SeO3]
undamaged DNA
nicked DNA
[Na2SeO3]108 9761 5432 108 9761 5432
Figure 2.10: DNA gel electrophoresis experiments for (A) Na2SeO3 and (B) SeO2 with [Cu(bipy)2]+. For each gel, lane 1: 1 kb ladder; lanes 2-5: plasmid, H2O2 (50 μM), Se compound (5000 μM), [Cu(bipy)2]2+ (50 μM), ascorbic acid ( 62.5 μM) and respectively; lanes 6-10: 0.5, 5, 50, 500, and 5000 μM respectively of either Na2SeO3 or SeO2.
69
Discussion
Selenium compounds are effective at preventing cancer, either due to their
antioxidant ability to neutralize ROS,16,32 or through induction of apoptosis in cancer
cells.18,30,32 Evidence for both prevention of cell death under oxidative stress and
promotion of apoptosis has been found for Na2SeO3 administered in similar
concentrations: Na2SeO3 (1 μM) prevented cell death from ROS in hepatoma cells42 and
stimulated benign mesothelial cell growth (7.5 μM),30 whereas in prostate cancer cells,
Na2SeO3 (0.5-5 μM) inhibited cell growth via apoptosis.18 Our results help explain these
contradictory chemopreventative (antioxidant) and anticancer effects of selenite, since we
have found that for selenite and selenium dioxide, inhibition of oxidative DNA damage
by hydroxyl radical is dependent on both the concentration of selenium compound and
H2O2.
Mode I experiments with inorganic selenium compounds and Fe2+
Experiments conducted with Na2SeO3 and SeO2 show that both compounds
inhibit DNA damage under Mode I conditions in a concentration-dependent manner with
maximal DNA damage inhibition at 5000 μM. Under the same conditions, Na2SeO4 and
Na2Se have no effect on DNA damage (Table 2.1). Although selenium concentrations of
5000 μM are much larger than would be found in cells, plasma selenium concentrations
in humans can reach 1.1-1.3 μM after consuming 40 μg of selenium supplement a day.43
At 0.5 μM, Na2SeO3 inhibited 37% of DNA damage (p = 0.02), whereas SeO2 at this
concentration acted as a pro-oxidant, increasing DNA damage by 20 % (p = 0.02). These
70

results indicate that Na2SeO3 may be a more effective antioxidant in vivo than Na2SeO4,
Na2Se, or SeO2.
Table 2.1. Summary of effects of inorganic selenium compounds on DNA damage under Mode I and Mode II conditions. Compound DNA Damage Behavior
Na2SeO4 No antioxidant or pro-oxidant behavior under any conditions
Na2SeO3 Mode I: Antioxidant at all concentrations (0.5 – 5000 μM)
Mode II: Pro-oxidant behavior with or without Fe2+ at all concentrations
(0.5 – 5000 μM)
SeO2 Mode I: Pro-oxidant at low concentrations (0.5 – 250 μM), antioxidant at
higher concentrations (250 - 5000 μM)
Mode II: Antioxidant at all concentrations
Na2Se No antioxidant or pro-oxidant behavior under any conditions (0.5 – 200
μM)
All antioxidant behavior requires Fe2+ coordination
It is not clear why SeO2 acts as a pro-oxidant and an antioxidant depending upon
concentration, but the pro-oxidant effect of SeO2 at low concentrations may be due to its
ability to generate radical species. SeO2 is proposed to react with aqueous H2O2 to form
peroxyselenenic acid (SeO2 + H2O2 → HOSe(O)OOH), that then may decompose to
yield •OH.44 In addition, it has been reported that SeO2 in aqueous solution at pH 6 exists
as HSeO3-,39-41 which can then be reduced to SeO2
- radical (SeO2 + H2O → HSeO3- + H+
→ SeO2- +OH-).39 However, if aqueous SeO2 is present as HSeO3
-, it is surprising that
71
we see significantly different effects with SeO2 as compared to Na2SeO3 in our gel
electrophoresis studies. Our 77Se NMR studies of SeO2 and Na2SeO3 show different
resonance frequencies for both compounds in aqueous solutions, indicating that they do
not form the same species. This result correlates well with the different effects of these
two compounds on DNA damage. A separate study showed that Na2SeO3 was more
effective at inducing apoptosis than SeO216 suggesting that these compounds also have
different properties in vivo.
The four inorganic selenium compounds studied in this work differ by both
oxidation state and charge. Both Na2SeO3 and SeO2 with a selenium oxidation state of +4
inhibit DNA damage at high concentrations, whereas Na2SeO4 with an oxidation state of
+6 and Na2Se (-2) have no effect on DNA damage. This indicates that inorganic selenium
compounds with selenium in the +4 oxidation state are more effective at preventing DNA
damage under Mode I conditions than those in either the highest or lowest oxidation
states. The lack of DNA damage inhibition with Na2SeO4 can be explained if the
selenium compound reacts with and neutralizes generated •OH. Since Na2SeO4 is in its
highest oxidation state, it cannot be oxidized by •OH. The lack of DNA damage
inhibition by Na2Se is more difficult to explain using charge arguments, since the
oxidation state of the selenium is low. In addition, organic selenides (R-Se-R, selenium
oxidation state of -2) are well-known for their antioxidant properties.21,31 However, based
on their respective reduction potentials, selenide (0.924 V45) cannot be oxidized by H2O2
(0.38 V10).
72

From our results, it is clear that charge on the inorganic selenium compounds
does not play a significant role in preventing DNA damage. Na2SeO3, Na2SeO4 and
Na2Se have the same -2 charge, however only Na2SeO3 was able to inhibit DNA damage
under Mode I conditions. SeO2, a neutral compound, also inhibits DNA damage at high
concentrations, suggesting that oxidation state plays a much more significant role than
overall charge in DNA damage inhibition.
Mode II experiments with inorganic selenium compounds and Fe2+
Similar to results observed under Mode I conditions, Na2SeO4 and Na2Se have no
effect on DNA damage under Mode II conditions. In contrast to Mode I conditions,
however, SeO2 under Mode II conditions inhibited DNA damage at all concentrations
tested, reducing DNA damage by a maximum of 81% at 5000 μM (Table I). At more
biologically-relevant concentrations of selenium (0.5 μM), SeO2 showed weak
antioxidant activity under Mode II conditions, in direct opposition to its pro-oxidant
activity at the same concentration under Mode I conditions.
Interestingly, when Na2SeO3 is combined with H2O2 without Fe2+ under Mode II
conditions, DNA damage is promoted in a concentration-dependent manner. This is very
different behavior compared to its inhibitory effect at all concentrations under Mode I
conditions. A possible reason for the pro-oxidant activity seen under Mode II conditions
is that the Na2SeO3 is oxidized by H2O2 from +4 to +6 states, producing •OH in the
process. Considering the reduction potentials of selenite (-0.05 V 45) and H2O2 (0.38V10),
selenite is capable of reducing H2O2. Additionally, SeO3•- formed from the one electron
73

oxidation of Na2SeO3 by •OH could also damage DNA.46 It is unclear, however, why the
antioxidant or pro-oxidant behavior of Na2SeO3 would be entirely dependent upon H2O2
concentration. Calculations indicate that the steady-state H2O2 concentration in
unstressed E. coli is ~20 nM, but with a high generation rate of 9-22 μM/s.47 Thus, H2O2
concentrations may increase quickly if an imbalance between generation and
decomposition exists. If the antioxidant or pro-oxidant behavior of Na2SeO3 depends on
cellular H2O2 concentrations, this highlights the need to accurately measure
concentrations of H2O2 in both unstressed and oxidatively-stressed cells.
Modes I and II [Fe(EDTA)]2- experiments with inorganic selenium compounds
Experiments with [Fe(EDTA)]2- as the iron source were performed to determine
whether DNA damage inhibition by inorganic selenium compounds is due to iron
coordination. Increasing concentrations of Na2SeO3 and SeO2 using the completely-
coordinated [Fe(EDTA)]2- resulted in no change in DNA damage. These experiments
indicate that iron coordination by Na2SeO3 and SeO2 is required for inhibition of (or
increase in, for lower concentrations of SeO2) DNA damage inhibition under Mode I
conditions. Similarly, under Mode II conditions, iron binding is also important for the
inhibitory effect of SeO2 on DNA damage. In a similar study performed with organic
selenium compounds using copper and H2O2 to generate •OH, metal coordination was
also the proposed mechanism for DNA damage inhibition.31
Coordination between iron and SeO32- or SeO2 is likely: both Na2SeO3 and SeO2
contain hard oxygen ligands, which can coordinate to Fe2+, a borderline hard Lewis acid.
74
Because selenium is much softer than oxygen, it less likely that Fe2+ would bind to
selenium, especially given its positive oxidation state in both Na2SeO3 and SeO2. In fact,
characterization of several iron-selenite complexes shows that iron indeed binds selenite
through the negatively-charged oxygen atoms.48,49
Based on our results, Na2SeO3, and to a lesser extent SeO2, exhibit both
antioxidant and pro-oxidant behaviors dependent on H2O2 concentration. Understanding
this seemingly contradictory behavior may help explain conflicting results seen for
anticancer studies using Na2SeO3.20,33,34,50,51 We have clearly demonstrated the ability of
inorganic selenium compounds both to prevent and generate DNA damage using a
biologically-relevant DNA damage assay, but the complex behaviors of these compounds
with regard to their concentration and concentration of H2O2 in vivo merit further study.
Cu+ experiments with inorganic selenium compounds
Similar to results observed under Mode I conditions with iron, Na2SeO4 and
Na2Se have no effect on copper-mediated DNA damage. Under similar conditions,
however, both Na2SeO3 and SeO2 inhibit 95% and 63% DNA damage, respectively at
high concentrations (5000 μM). Interestingly, the antioxidant activity observed for
Na2SeO3 were similar for both Fe2+-mediated DNA damage under Mode I conditions
(91%) and Cu+-mediated DNA damage (95%) at 5000 μM. However, SeO2 at the same
concentration was more effective at inhibiting Fe2+-mediated DNA damage (100%) than
Cu+-mediated DNA damage (63%) under similar reaction conditions. At more
biologically-relevant concentrations (0.5 μM), Na2SeO3 is a better antioxidant with iron-
75

mediated DNA damage under Mode I conditions (36%, p = 0.02) when compared to the
insignificant activity observed for this compound with copper-mediated DNA damage (-
0.5%, p = 0.5). Interestingly, the pro-oxidant activity of SeO2 (-21%, p = 0.02) at more
biologically-relevant concentrations (0.5 μM) under Mode I conditions with iron was
unobserved with copper-mediated DNA damage at the same concentration (0.1%, p =
0.2). These results suggest that the metal ion plays a significant role in the antioxidant
and pro-oxidant propeties of inorganic selenium compounds. Under Fenton reaction
conditions, iron coordination to the selenium compound is novel mechanism for the
antioxidant and pro-oxidant activities of both Na2SeO3 and SeO2. Our copper
coordination results performed with [Cu(bipy)]+ indicate that this novel metal-binding
mechanism is also responsible for the antioxidant activity observed with inorganic
selenium compounds with copper-mediated DNA damage. Similar to the results
observed for iron-mediated DNA damage, both Na2SeO3 and SeO2 ( both with a selenium
oxidation state of +4) are much more effective at preventing DNA damage than either
Na2SeO4 (+6) or Na2Se (-2). Our results suggest that oxidation state of the selenium atom
of the four inorganic selenium compounds tested plays an important role in the
antioxidant activity of these compounds on copper-mediated DNA damage.
Conclusions
The essential micronutrient selenium is widely used in over-the-counter
supplements, infant formulas, protein mixes, and animal feed, often in the form of its
inorganic compounds. Despite having received much attention for their antioxidant and
76

chemopreventative properties, uncertainties remain with regard to the concentration
dependence and mechanism for these behaviors.16,18,30 We have shown that Na2SeO4 and
Na2Se are unable to inhibit both iron-mediated and copper-mediated DNA damage, a
surprising result given the ability of organic selenides to inhibit DNA damage under
similar conditions.21,31 Additionally, SeO2 and Na2SeO3 behave as both pro-oxidants and
antioxidants depending on the concentrations of selenium compound and H2O2 with iron-
mediated DNA damage, but were only antioxidants with copper-mediated DNA damage.
Identification of these complex antioxidant and pro-oxidant behaviors help to reconcile
seemingly conflicting results obtained in cell studies with these compounds,16,18,32 and
also suggest that the more damage-neutral Na2SeO4 may be more suitable for use in
selenium supplementation. Our results also demonstrate that the formal oxidation state of
the selenium atom is the primary determinant of antioxidant behavior for these inorganic
selenium compounds, and not their overall charge. In addition, the antioxidant effects of
both inorganic and organic selenium compounds have now been attributed to their
coordination of the metal ions responsible for the production of reactive radicals,31
indicating that this novel metal-coordination mechanism for antioxidant behavior may be
relevant to antioxidant function in vivo.
Materials and Methods
Materials
NaCl (99.999% to avoid trace metal contamination), Na2SeO3, SeO2
Na2SeO4•10H2O, glacial acetic acid, NaOH, 30% H2O2 solution, FeSO4•7H2O,
77

CuSO4•5H2O, ascorbic acid, 2,2’-bipyridine and bromophenol blue were from Alpha
Aesar. Glucose, agarose, and ampicillin were from EMD Chemicals. TRIS hydrochloride
and sodium EDTA were from J.T. Baker. HCl was from VWR Scientific; ethidium
bromide from Lancaster Synthesis Inc. Xylene cyanol, peptone, and yeast extract came
from EM Science. D2O and DCl were from Acros, and NaOD was from Cambridge
Isotope Laboratories, Inc. Water was purified using the NANOpure DIamond water
deionization system (Barnstead International, Dubuque, IA). Iron-free microcentrifuge
tubes were prepared by washing the tubes in 1 M HCl prior to use and rinsing thoroughly.
77Se NMR data were obtained from a Bruker Avance 500 MHz NMR spectrometer.
Purification of plasmid DNA
DH1 E. coli cells were transfected with pBSSK, plated on LB/amp plates, and
incubated for 16 h at 37 oC. Cell cultures were grown in TB/amp medium inoculated with
a single colony and incubated for 15 h at 37 oC. Plasmid DNA was purified from the cell
pellets using a QIAprep Spin Miniprep kit, and tris-EDTA (TE) buffer was used to elute
the DNA. Dialysis of plasmid DNA was performed against 130 mM NaCl for 24 h at
4 oC. The resulting DNA concentration was found using UV-vis measurements at A260 (1
A260 = 50 ng/μL). Purity of plasmid DNA was determined via gel electrophoresis of a
digested sample, and all absorbance ratios were within acceptable limits (A250/260 < 0.95,
and A260/280 > 1.8).
78

DNA nicking experiments under Mode I conditions with Fe2+
The indicated concentrations of Na2SeO3, Na2SeO4, SeO2 and Na2Se, 0.1 pmol
plasmid DNA, 130 mM NaCl, 10 mM ethanol, 2 μM FeSO4•7H2O at pH 6 were
combined and allowed to stand for 5 min at room temperature. H2O2 (50 μM)11 was then
added and incubated for 30 min. EDTA (50 μM) was added after this time and a total
volume of 10 μL was maintained with ddH2O. DNA was separated on 1% agarose gels
via electrophoresis, stained with ethidium bromide for 30 min, and imaged on an
UVIproDBT-8000 gel imager (UVITec, Cambridge, UK). Quantification of closed-
circular and nicked DNA was performed using the UviPro software and results were
shown in a bar graph. For gels run with [Fe(EDTA)]2- (400 μM) as the iron source, a
similar procedure was used substituting [Fe(EDTA)]2- (400 μM) for FeSO4•7H2O.
DNA nicking experiments under Mode II conditions with Fe2+
Similar procedures to Mode I experiments were followed with increases in
ethanol (100 mM) and H2O2 (50 mM).11 Experiments with Na2SeO3 were performed at
pH 7 without iron.
DNA nicking experiments with copper
Similar procedures to Mode I experiments were followed using Cu+ (6 μM) as the
metal source instead of Fe2+ at pH 7. For gels run with [Cu(bipy)]+ (50 μM) as the metal
source, a similar procedure was used substituting [Cu(bipy)]+ (50 μM) for FeSO4•7H2O.
79

Data analysis
Percent DNA damage inhibition was determined using the formula 1-[% N / %
B]*100, where % N = % nicked DNA in the selenium containing lanes and % B = % of
nicked DNA in the Fe2+ or Cu+/H2O2 lane. Percentages are corrected for residual nicked
DNA prior to calculation. Results are the average of three trials, and standard deviations
are indicated by error bars. Percent DNA damage was calculated using the formula [% N
/ % B]*100, where % B = percent of nicked DNA in the H2O2 only lane. Statistical
significance was determined by calculating p values at 95% confidence (p < 0.05
indicates significance) as described by Perkowski et al.52 A complete listing of these
values can be found at the end of this Materials and Methods section in Tables 2.2-2.18.
77Se NMR Experiments
77Se NMR samples (0.75 mL) were prepared by adding SeO2 (2 M) or Na2SeO3
(0.6 M) to solutions of NaCl (2 equiv.) in D2O. Appropriate amounts of NaOD or DCl
were added to achieve the desired pD (6.4 or 7.4). Conversion of pH into pD was
performed using the formula p[D+] = 0.4 + p[H+].53,54 These experiments were performed
using diphenyl diselenide as a reference (δ 850). 77Se NMR spectra obtained for these
experiments are shown in Figures 2.11 and 2.12.
80
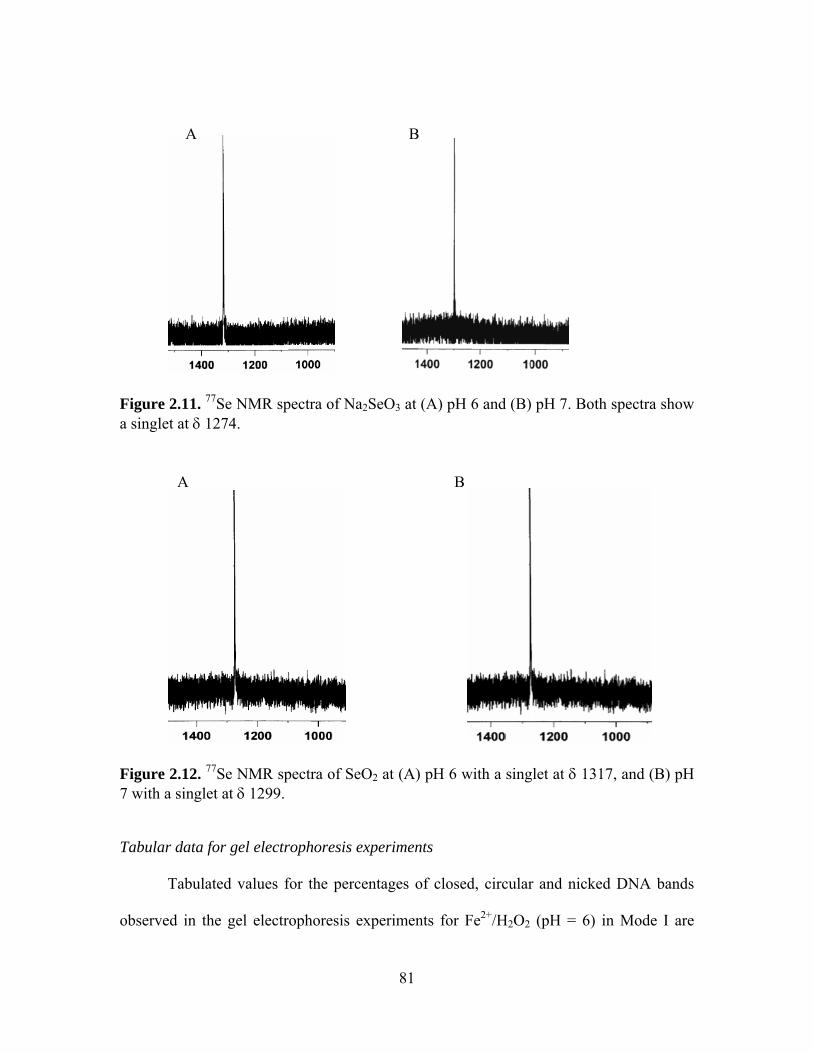
Figure 2.11. 77Se NMR spectra of Na2SeO3 at (A) pH 6 and (B) pH 7. Both spectra show a singlet at δ 1274.
Figure 2.12. 77Se NMR spectra of SeO2 at (A) pH 6 with a singlet at δ 1317, and (B) pH 7 with a singlet at δ 1299.
Tabular data for gel electrophoresis experiments
Tabulated values for the percentages of closed, circular and nicked DNA bands
observed in the gel electrophoresis experiments for Fe2+/H2O2 (pH = 6) in Mode I are
B A
B A
81
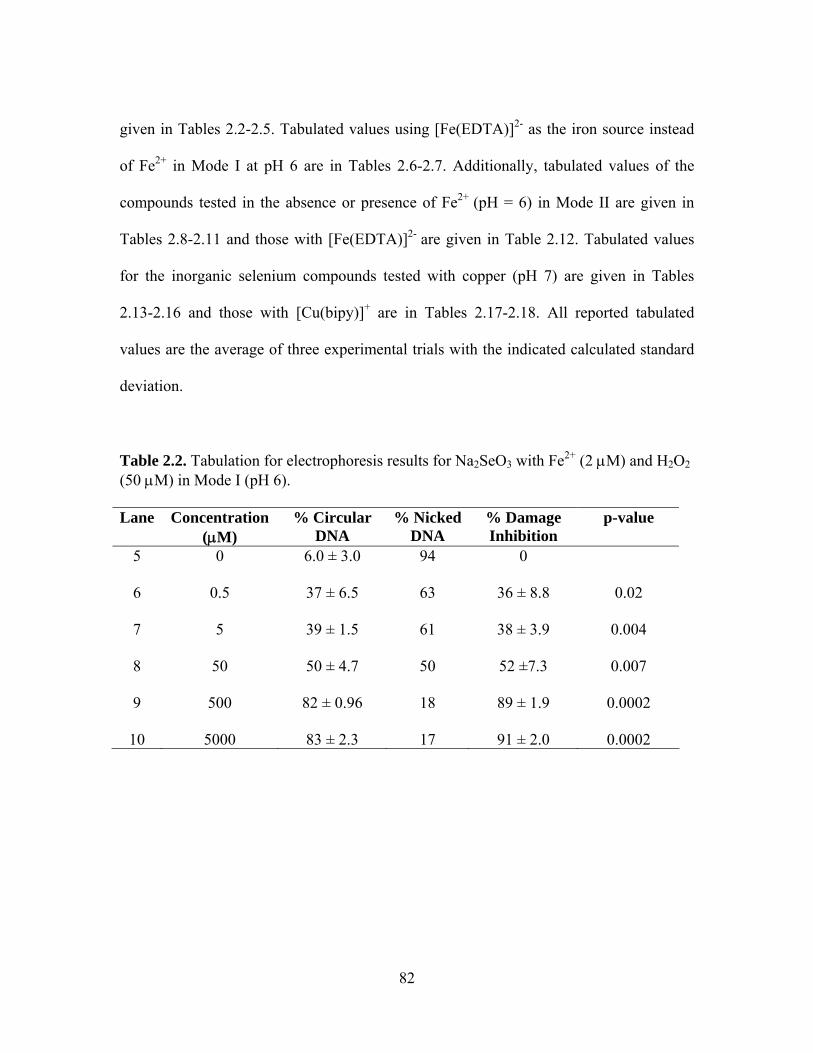
given in Tables 2.2-2.5. Tabulated values using [Fe(EDTA)]2- as the iron source instead
of Fe2+ in Mode I at pH 6 are in Tables 2.6-2.7. Additionally, tabulated values of the
compounds tested in the absence or presence of Fe2+ (pH = 6) in Mode II are given in
Tables 2.8-2.11 and those with [Fe(EDTA)]2- are given in Table 2.12. Tabulated values
for the inorganic selenium compounds tested with copper (pH 7) are given in Tables
2.13-2.16 and those with [Cu(bipy)]+ are in Tables 2.17-2.18. All reported tabulated
values are the average of three experimental trials with the indicated calculated standard
deviation.
Table 2.2. Tabulation for electrophoresis results for Na2SeO3 with Fe2+ (2 μM) and H2O2 (50 μM) in Mode I (pH 6). Lane Concentration
(μM) % Circular
DNA % Nicked
DNA % Damage Inhibition
p-value
5 0 6.0 ± 3.0 94 0
6 0.5 37 ± 6.5 63 36 ± 8.8 0.02
7 5 39 ± 1.5 61 38 ± 3.9 0.004
8 50 50 ± 4.7 50 52 ±7.3 0.007
9 500 82 ± 0.96 18 89 ± 1.9 0.0002
10 5000 83 ± 2.3 17 91 ± 2.0 0.0002
82

Table 2.3. Tabulation for electrophoresis results for Na2SeO4 with Fe2+ (2 μM) and H2O2 (50 μM) in Mode I (pH 6). Lane Concentration
(μM) % Circular
DNA % Nicked
DNA % Damage Inhibition
p-value
5 0 2.0 ± 1.5 98 0
6 0.5 3.7 ± 2.3 96.3 2.1 ± 1.4 0.12
7 5 2.0 ± 0.78 98 -0.05 ± 1.1 0.94
8 50 4.7 ± 3.7 95.3 3.4 ± 3.1 0.20
9 500 2.2 ± 0.61 97.8 0.3 ± 1.4 0.75
10 5000 5.0 ± 3.0 95 3.8 ± 3.1 0.17 Table 2.4. Tabulation for electrophoresis results for Na2Se with Fe2+ (2 μM) and H2O2
(50 μM) in Mode I (pH 6). Lane Concentration
(μM) % Circular
DNA % Nicked
DNA % Damage Inhibition
p-value
5 0 0.0 ± 0.1 100 0 6
0.5
0.1 ± 0.1
99.9
0.1 ± 0.1
0.23
7 5 0.2 ± 0.3 99.8 0.2 ± 0.3 0.37
8 50 0.0 ± 0.2 100 0.0 ± 0.2 1.0
9 100 0 .0 ± 0.3 100 0.0 ± 0.3 1.0
10 200 0.2 ± 0.4 99.8 0.2 ± 0.4 0.48
83
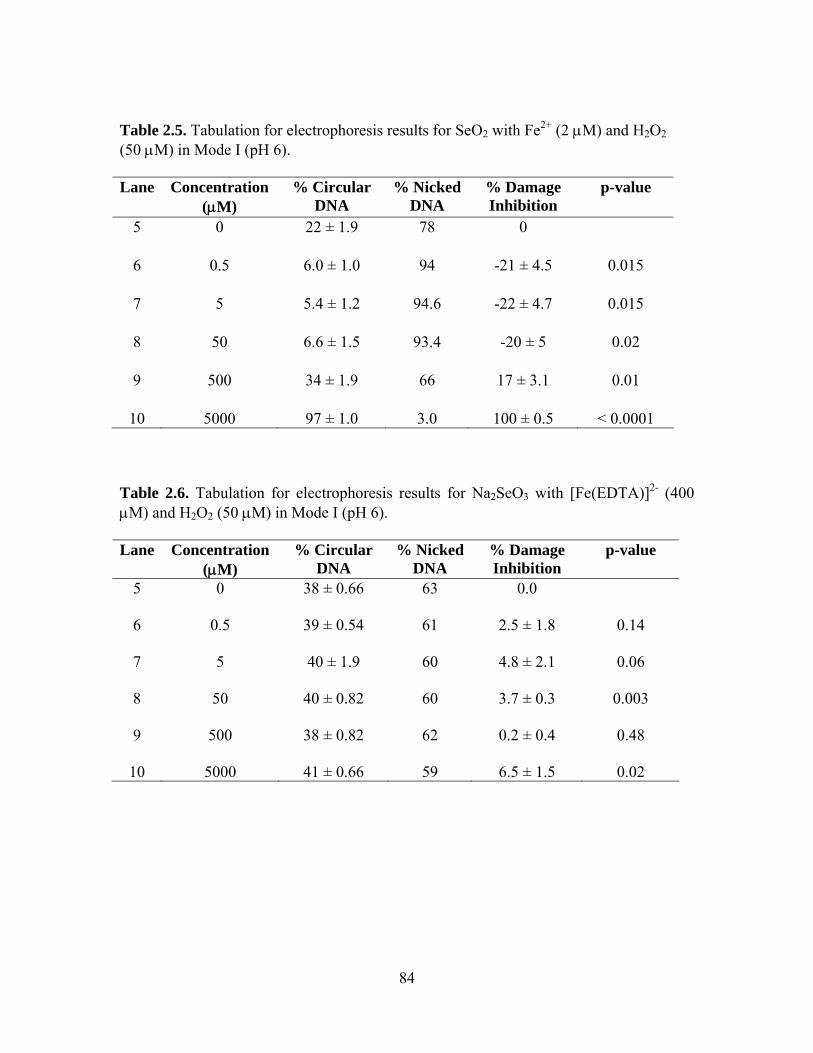
Table 2.5. Tabulation for electrophoresis results for SeO2 with Fe2+ (2 μM) and H2O2 (50 μM) in Mode I (pH 6). Lane Concentration
(μM) % Circular
DNA % Nicked
DNA % Damage Inhibition
p-value
5 0 22 ± 1.9 78 0
6 0.5 6.0 ± 1.0 94 -21 ± 4.5 0.015
7 5 5.4 ± 1.2 94.6 -22 ± 4.7 0.015
8 50 6.6 ± 1.5 93.4 -20 ± 5 0.02
9 500 34 ± 1.9 66 17 ± 3.1 0.01
10 5000 97 ± 1.0 3.0 100 ± 0.5 < 0.0001
Table 2.6. Tabulation for electrophoresis results for Na2SeO3 with [Fe(EDTA)]2- (400 μM) and H2O2 (50 μM) in Mode I (pH 6). Lane Concentration
(μM) % Circular
DNA % Nicked
DNA % Damage Inhibition
p-value
5 0 38 ± 0.66 63 0.0
6 0.5 39 ± 0.54 61 2.5 ± 1.8 0.14
7 5 40 ± 1.9 60 4.8 ± 2.1 0.06
8 50 40 ± 0.82 60 3.7 ± 0.3 0.003
9 500 38 ± 0.82 62 0.2 ± 0.4 0.48
10 5000 41 ± 0.66 59 6.5 ± 1.5 0.02
84

Table 2.7. Tabulation for electrophoresis results for SeO2 with [Fe(EDTA)]2- (400 μM) and H2O2 (50 μM) in Mode I (pH 6). Lane Concentration
(μM) % Circular
DNA % Nicked
DNA % Damage Inhibition
p-value
5 0 25 ± 2.7 75 0
6 0.5 26 ± 2.1 74 1.7 ± 0.8 0.06
7 5 25 ± 2.1 75 0.99 ± 0.9 0.18
8 50 26 ± 2.9 74 2.6 ± 2.1 0.17
9 500 27 ± 2.7 73 2.8 ± 0.6 0.02
10 5000 26 ± 2.6 74 1.7 ± 1.4 0.17 Table 2.8. Tabulation for electrophoresis results for Na2SeO3 and H2O2 (50 mM) without Fe2+ in Mode II (pH 6).
Lane Concentration (μM)
% Circular DNA
% Nicked DNA
% DNA Damage
p-value
3 0 98 ± 0.9 2.0 0
5 0.5 90 ± 3.9 10 1.7 ± 4.4 0.56
6 5 88 ± 1.8 11.7 3.4 ± 1.8 0.04
7 50 90 ± 0.4 9.6 1.1 ± 0.13 0.005
8 500 78 ± 1.6 22.5 15 ± 1.4 0.0006
9 5000 9.1 ± 2.6 90.9 90 ± 3.0 0.0004
85

86
Table 2.9. Tabulation for electrophoresis results for Na2SeO4 with Fe2+ (2 μM) and H2O2 (50 mM) in Mode II (pH 6). Lane Concentration
(μM) % Circular
DNA % Nicked
DNA % Damage Inhibition
p-value
5 0 19 ± 0.5 81 0
6 0.5 21 ± 1.0 89 2.7 ± 2.3 0.18
7 5 21 ± 1.3 89 3.7 ± 2.7 0.14
8 50 21 ± 0.8 89 3.0 ± 2.0 0.12
9 500 19 ± 0.7 81 0.6 ± 0.4 0.12
10 5000 19 ± 0.4 81 0.2 ± 0.3 0.37 Table 2.10. Tabulation for electrophoresis results for Na2Se with Fe2+ (2 μM) and H2O2 (50 mM) in Mode II (pH 6). Lane Concentration
(μM) % Circular
DNA % Nicked
DNA % Damage Inhibition
p-value
5 0 7.5 ± 6.5 93.9 0
6 0.5 0 100 -9.1 ± 7.9 0.18
7 5 0 100 -9.1 ± 7.9 0.18
8 50 0 100 -9.1 ± 7.9 0.18
9 100 0 100 -9.1 ± 7.9 0.18
10 200 0 100 -9.1 ± 7.9 0.18

Table 2.11. Tabulation for electrophoresis results for SeO2 with Fe2+ (2 μM) and H2O2 (50 mM) in Mode II (pH 6). Lane Concentration
(μM) % Circular
DNA % Nicked
DNA % Damage Inhibition
p-value
5 0 13 ± 1.1 87 0
6 0.5 16 ± 2.1 84 4.5 ± 3.1 0.13
7 5 20 ± 3.1 80 9.1 ± 3.8 0.05
8 50 26 ± 2.4 74 18 ± 3.1 0.01
9 500 34 ± 3.4 66 30 ± 5.6 0.01
10 5000 72 ± 1.6 28 81 ± 7.3 0.003 Table 2.12. Tabulation for electrophoresis results for SeO2 with [Fe(EDTA)]2- (400 μM) and H2O2 (50 mM) in Mode II (pH 6). Lane Concentration
(μM) % Circular
DNA % Nicked
DNA % Damage Inhibition
p-value
5 0 0.3 ± 0.3 99.7 0 6 0.5 0.1 ± 0.2 99.9 -0.3 ± 0.2 0.12
7 5 0.2 ± 0.3 99.8 -0.2 ± 0.2 0.23
8 50 0.2 ± 0.3 99.8 -0.2 ± 0.2 0.23
9 500 0.2 ± 0.3 99.8 -0.2 ± 0.2 0.23
10 5000 0.2 ± 0.3 99.8 -0.2 ± 0.2 0.23
87

Table 2.13. Tabulation for electrophoresis results for Na2SeO3 with Cu+ (6 μM) and H2O2 (50 μM) at pH 7. Lane Concentration
(μM) % Circular
DNA % Nicked
DNA % Damage Inhibition
p-value
5 0 0.8 ± 0.3 99.2 0
6 0.5 0.3 ± 0.7 99.7 -0.5 ±1.2 0.55
7 5 0.6 ± 4.7 99.4 -0.2 ± 1.7 0.86
8 50 0.7± 1.2 99.3 -0.1 ±2.2 0.94
9 500 12.6 ± 5.3 88.4 12.2 ± 4.4 0.04
10 5000 93.4 ± 3.7 6.6 95.1 ± 3.9 0.0003 Table 2.14. Tabulation for electrophoresis results for Na2SeO4 with Cu+ (6 μM) and H2O2 (50 μM) at pH 7.. Lane Concentration
(μM) % Circular
DNA % Nicked
DNA % Damage Inhibition
p-value
5 0 2 ± 1.5 98 0
6 0.5 3 ± 1.1 97 2.1 ± 1.4
0.12
7 5 2 ± 0.7 98 0.02 ± 1.1
0.98
8 50 5 ± 1.3 95 2.5 ± 3.1
0.30
9 500 2.2 ± 0.3 97.8 0.02 ± 1.4
0.98
10 5000 5 ± 3 95 3.8 ± 3.1 0.17
88

Table 2.15. Tabulation for electrophoresis results for Na2Se with Cu+ (6 μM) and H2O2
(50 μM) at pH 7. Lane Concentration
(μM) % Circular
DNA % Nicked
DNA % Damage Inhibition
p-value
5 0 0 ± 0.1 100 0
6 0.5 0.1 ± 0.1 99.9 0.1 ± 0.1
0.25
7 5 0.2 ± 0.3 99.8 0.2 ± 0.3
0.37
8 50 0.2 ± 0.2 99.8 0.2 ± 0.2
0.37
9 100 0.1± 0.1 99.9 0.1 ± 0.1
0.25
10 200 0.2 ± 0.4 99.8 0.2 ± 0.4 0.45
Table 2.16. Tabulation for electrophoresis results for SeO2 with Cu+ (6 μM) and H2O2
(50 μM) at pH 7.. Lane Concentration
(μM) % Circular
DNA % Nicked
DNA % Damage Inhibition
p-value
5 0 0 ± 0.1 100 0
6 0.5 0.4 ± 0.7 99.6 0.1 ± 0.1
0.25
7 5 0.7 ± 0.1 99.3 0.2 ± 0.1
0.48
8 50 0.7 ± 0.2 99.3 0.3 ± 0.2
0.12
9 500 2.2 ± 1.5 98.8 3.5 ± 1.2
0.04
10 5000 65.5 ± 4.3 34.5 70.4 ± 3.3 0.0007
89

Table 2.17. Tabulation for electrophoresis results for Na2SeO3 with [Cu(bipy)2]+ (50 μM) and H2O2 (50 μM) at pH 7.. Lane Concentration
(μM) % Circular
DNA % Nicked
DNA % Damage Inhibition
p-value
5 0 5 ± 0.7 95 0
6 0.5 5.5 ± 0.5 94.5 1.5 ± 1.2
0.16
7 5 4.2 ± 1.9 95.8 2.1 ± 1.3
0.11
8 50 5.1 ± 0.8 94.9 1.5 ± 0.3
0.01
9 500 2 ± 0.8 98 0.2 ± 0.1
0.07
10 5000 2.3 ± 0.6 97.7 0.3 ± 0.2 0.12
Table 2.18. Tabulation for electrophoresis results for SeO2 with [Cu(bipy)2]+ (50 μM) and H2O2 (50 μM) at pH 7.. Lane Concentration
(μM) % Circular
DNA % Nicked
DNA % Damage Inhibition
p-value
5 0 16 ± 0.5 84 0
6 0.5 10 ± 0.3 90 -4.7 ± 0.9
0.01
7 5 9.5 ± 1.2 90.5 -5.0 ± 1.2
0.02
8 50 8.3 ± 0.9 91.7 - 5.1 ± 0.2
0.003
9 500 8.1 ± 0.7 91.9 -5.5 ± 0.3
0.0009
10 5000 8 ± 0.8 92 -5.6 ± 0.1 0.0001
90

References
(1) Stewart, M. S.; Spallholz, J. E.; Neldner, K. H.; Pence, B. C. Free Rad. Biol. Med.
1999, 26, 42-48.
(2) Halliwell, B. Drugs and Aging 2001, 18, 685-716.
(3) Henle, E. S.; Linn, S. J. Biol. Chem. 1997, 272, 19095-19098.
(4) Hoffmann, M. E.; Mello-Filho, A. C.; Meneghini, R. Biochem. Biophys. Acta
1984, 781, 234-238.
(5) Mello-Filho, A. C.; Meneghini, R. Mutat. Res. 1991, 251, 109-113.
(6) Henle, E. S.; Luo, Y.; Linn, S. Biochemistry 1996, 35, 12212-12219.
(7) Steinberg, D. J. Biol. Chem. 1997, 272, 20963-20966.
(8) Singal, P. K.; Khaper, N.; Palace, V.; Kumar, D. Cardiovasc. Res. 1998, 40, 426-
32.
(9) Imlay, J. A.; Chin, S. M.; Linn, S. Science 1988, 240, 640-642.
(10) Imlay, J. A.; Linn, S. Science 1988, 240, 1302-1309.
(11) Henle, E. S.; Zhengxu, H.; Tang, N.; Rai, P.; Luo, Y.; Linn, S. J. Biol. Chem.
1999, 274, 962-971.
(12) Henle, E. S.; Linn, S. J. Biol. Chem. 1997, 272, 19095-19098.
(13) Warner, D. S.; Sheng, H.; Batinic-Haberle, I. J. Exp. Biol. 2004, 207, 3221-3231.
(14) Milne, L.; Nicotera, P.; Orrenius, S.; Burkitt, M. J. Arch. Biochem. Biophys. 1993,
304, 102-109.
91

(15) El-Bayoumy, K. Mutat. Res. 2001, 475, 123-139.
(16) Takahashi, M.; Sato, T.; Shinohara, F.; Echigo, S.; Rikiishi, H. Int. J. Oncol.
2005, 27, 489-495.
(17) Zhong, W.; Oberley, T. D. Cancer Res. 2001, 61, 7071-7078.
(18) Holmgren, A. Free Rad. Biol. Med. 2006, 41, 862-865.
(19) Schrauzer, G. N. J. Am. Coll. Nutr. 2001, 20, 1-4.
(20) Combs, G. F.; Gray, W. P. Pharmacol. Ther. 1998, 79, 179-192.
(21) Gladyshev, V. N.; Kryukov, G. V. BioFactors 2001, 14, 87-92.
(22) Finley, J. W.; Ip, C.; Lisk, D. J.; Davis, C. D.; Hintze, K. J.; Whanger, P. D. J.
Agric. Food Chem. 2001, 49, 2679-2683.
(23) Van Houweling, C. D. Final Environmental Impact Statement on Selenium in
Animal Feeds, 1975.
(24) Spallholz, J. E.; Boylan, L. M.; Rhaman, M. M. Sci. Tot. Environ. 2004, 323, 21-
32.
(25) Mugesh, G.; Singh, H. B. Chem. Soc. Rev. 2000, 29, 347-357.
(26) Davis, C. D.; Feng, Y.; Hein, D. W.; Finley, D. W. J. Nutr. 1999, 129, 63-69.
(27) Ip, C.; Hayes, C. Carcinogenesis 1989, 10, 921-925.
(28) Wilson, A. C.; Thompson, H. J.; Schedin, P. J.; Gibson, N. W.; Ganther, H. E.
Biochem. Pharmacol. 1992, 43, 1137-1141.
(29) Snyder, R. D. Cancer Lett. 1987, 34, 73-81.
92

(30) Nilsonne, G.; Sun, X.; Nystrom, C.; Rundlof, A.-K.; Fernandes, A. P.; Bjornstedt,
M.; Dobra, K. Free Rad. Biol. Med. 2006, 41, 874-885.
(31) Battin, E. B.; Perron, N. R.; Brumaghim, J. L. Inorg. Chem. 2006, 45, 499-501.
(32) Zhou, N.; Xiao, H.; Li, T.-K.; Nur-E-Kamal, A.; Liu, L. F. J. Biol. Chem. 2003,
278, 29532-29537.
(33) Dorado, R. D.; Porta, E. A.; Aquino, T. M. Hepatology 1985, 5, 1201-1208.
(34) Perchellet, J. P.; Abney, N. L.; Thomas, R. M.; Guislan, Y. L.; Perchellet, E. M.
Cancer Res. 1987, 47, 447-485.
(35) Hamilton, E. E.; Wilker, J. J. Biol. Inorg. Chem. 2004, 9, 894-902.
(36) Chen, W.; Cao, X.; Zhu, R.; Lui, W. Chinese J. Cancer Res. 2004, 16, 162-166.
(37) Prütz, W. A. Z. Naturforsch 1990, 45C, 1197-1206.
(38) Ramoutar, R. R.; Brumaghim, J. L. J. Inorg. Biochem. 2007, 101, 1028-1035.
(39) Adhikari, S.; Mukherjee, T.; Janata, E. Res. Chem. Intermed. 2005, 31, 227-234.
(40) Nazarenk, I. I.; Ermakov, A. N. Analytical Chemistry of Selenium and Tellurium;
John Wiley and Sons, Inc.: New York, 1972.
(41) Tamba, M.; Dadello, R. Radiat. Phys. Chem. 1977, 10, 283-288.
(42) Fiskin, K. Turk. J. Med. Sci. 2000, 30, 230-207.
(43) Duffield, A. J.; Thomson, C. D.; Hill, K. E.; Williams, S. Am. J. Clin. Nutr. 1999,
70, 896-903.
(44) Mlochowski, J. Phosphorus, Sulfur, Silicon 1998, 136-138, 191-204.
93

(45) CRC Handbook of Chemistry and Physics; Lide, D. R., Ed.; CRC Press: Boca
Raton, FL, 1994.
(46) Milligan, J. R.; Aguilera, J. A.; Paglinawan, R. A.; Ward, J. F. Int. J. Radiat. Biol.
2002, 78, 359-374.
(47) Seaver, L. C.; Imlay, J. A. J. Biol. Chem. 2004, 279, 48742-48750.
(48) Xiao, D.; Hou, Y.; Wang, E.; An, H.; Lu, J.; Li, Y.; Xu, L.; Hu, C. J. Solid State
Chem. 2004, 177, 2699-2704.
(49) Xiao, D.; An, H.; Wang, E.; Xu, L. J. Mol. Structure 2005, 740, 249-253.
(50) Thompson, H. J.; Meeker, L. D.; Becci, P. J.; Kokoska, S. Cancer Res. 1982, 42,
4954-4958.
(51) Ip, C.; Ip, M. Carcinogenesis 1981, 9, 915-918.
(52) Perkowski, D. A.; Perkowski, M. Data and Probability Connections; Pearson
Prentice Hall: New Jersey, 2007, pp 301-321.
(53) Covington, A. K.; Paabo, M.; Robinson, R. A.; Bates, R. G. Anal. Chem. 1968,
40, 700-706.
(54) Brumaghim, J. L.; Michels, M.; Raynond, K. N. Eur. J. Org. Chem. 2004, 22,
4552-4559.
94

CHAPTER THREE
INVESTIGATING THE ANTIOXIDANT PROPERTIES OF OXO-SULFUR
COMPOUNDS ON METAL-MEDIATED DNA DAMAGE
Introduction
Reactive oxygen species (ROS) are generated from numerous processes including
enzymatic activity, radiation, and metal ion reduction of oxygen compounds.1,2 ROS such
as hydroxyl radical (•OH) oxidize biological components including lipids, proteins, and
nucleic acids, leading to lipid peroxidation, enzyme deactivation, and oxidative DNA
damage.3,4 Formation of •OH in vivo is caused by the reaction of Fe2+ or Cu+ with H2O2
in Fenton or Fenton-like reactions:5,6 Fe2+ or Cu+ + H2O2 → Fe3+ or Cu2+ + •OH + OH-.
Metal-generated •OH is the primary cause of DNA damage and cell death under
oxidative stress in mammals, including humans.7,8 Oxidative DNA damage occurs at
either the backbone or bases, with base damage primarily occurring at guanine-rich sites.9
Oxidative stress due to DNA damage has been linked to several pathological conditions
including aging,10 cancer,2 and cardiovascular11 and neurodegenerative diseases.12
Iron and copper are the most prevalent transition metals in biological systems and
are required for the activity of many enzymes and proteins.13 Although both metals are
typically found in proteins, non-protein-bound (labile) pools of Fe2+ and Cu+ contribute to
cellular oxidative stress.2 It has been reported that the concentration of labile iron in E.
coli is ~10-20 μM.14,15 In yeast, the concentration of labile copper was calculated to be
less than 10-18 M,16,17 but recent studies indicate a significant labile copper pool in mouse
95
mitochondria.18 Studies have also shown that copper levels vary according to location,
with copper concentrations in blood serum ranging from 10-25 μM, 0.5-2.5 μM in
cerebrospinal fluid, and 30 μM in the synaptic cleft.19,20 Copper concentrations are
significantly higher in the brain with concentrations ranging from 1.3 mM to 0.4 mM.19,20
Even if normal levels are not sufficient to cause significant oxidative damage,
mildly-elevated iron levels are linked to increased cancer incidence in humans,21 and
increases in cellular iron and copper concentrations are associated with oxidative stress in
neurodegenerative diseases, as well as increased risk of cardiovascular disease.22-28
Antioxidants from fruits and vegetables have been widely studied for their ability
to reduce or prevent the effects of oxidative DNA damage.2,29-31 Garlic has been shown to
have many health benefits, including antioxidant and antibacterial activities, cholesterol
lowering activity, and tumor growth inhibition.32 The medicinal properties of garlic are
mainly due to allicin, the organosulfur compound responsible for its pungent odor (Figure
3.1). Allicin is generated when alliin, produced from the crushing of garlic, reacts with
the enzyme alliinase.33 Rabinkov et al. used spin trapping techniques to determine that
allicin scavenged •OH produced by the Fenton reaction.32 However, in
spectrophotometric investigations also using iron-generated •OH, allicin was an
inefficient •OH scavenger.4 Disparities concerning the antioxidant activity of allicin may
be due to the use of crude garlic extracts in these experiments, since the observed
antioxidant activity may be attributed to other endogenous components.34,35
96

OHS
O
NH2
O
S OHNH2
SS
OO
MetSO MeCysSO
MMTS
allicin
S
O
S S
O
S O
O
O
MePhSO Me2SO2
Figure 3.1. Structures of oxo-sulfur compounds discussed in this chapter: allicin, methionine sulfoxide (MetSO), methylcysteine sulfoxide (MeCysSO), methyl phenyl sulfoxide (MePhSO), methyl methanethiosulfonate, (MMTS), and dimethyl sulfone (Me2SO2).
Oxidation of biological sulfur compounds is an active area of research for reasons
extending beyond their role as antioxidants. ROS oxidation of methionine (Met)
produces methionine sulfoxide (MetSO, Figure 3.1), and oxidation of this residue may
alter protein structure and function.36-40 Further oxidation of methionine sulfoxide by
ROS has been reported to produce sulfones or radicals that induce oxidative DNA
damage.41 To reverse this oxidation, methionine sulfoxide reductases reduce MetSO back
to Met.42-45 In contrast, recent studies indicate that oxidized methionine residues in
proteins do not contribute to loss of protein function and, in fact, show antioxidant
behavior.46,47 Only a few studies have investigated the antioxidant activity of
methylcysteine sulfoxide (MeCysSO), but Nishimura et al. found that MeCysSO prevents
formation of lipid hydroperoxides in human low-density lipoprotein (LDL).48
Organosulfur compounds such as methionine and methylcysteine (MeCys)
effectively prevent Cu+-mediated oxidative DNA damage from •OH, but are not effective
at preventing Fe2+-mediated DNA damage.49 In addition, gel electrophoresis experiments
97

performed on inorganic selenium compounds indicate that oxidation state of the selenium
atom may play a role in preventing metal-mediated DNA damage,50 and that metal
coordination is a possible mechanism by which sulfur and selenium compounds exert
their antioxidant activities.49-51 Despite their proven antioxidant properties, little work has
been done to similarly examine analogous oxidized sulfur compounds for antioxidant
activity. This work has been previously published in Main Group Chem. 2007, 6, 143-
153.52
Results and Discussion
Inhibition of Cu+-mediated DNA damage by oxo-sulfur compounds
Using DNA gel electrophoresis, we have examined five oxo-sulfur compounds
for their ability to inhibit copper- and iron-mediated DNA damage: MetSO, MeCysSO,
methyl phenyl sulfoxide (MePhSO), methyl methanethiosulfonate (MMTS), and
dimethyl sulfone (Me2SO2; Figure 3.1). For these experiments, Cu+ or Fe2+ and H2O2 are
combined to generate •OH in the presence of plasmid DNA. Hydroxyl radical oxidatively
cleaves one strand of the DNA backbone, resulting in unwinding of the supercoiled
plasmid into the circular, nicked form. The damaged and undamaged forms of DNA are
then separated by gel electrophoresis and the resulting bands are quantified to determine
the percentage of damaged and undamaged DNA. By addition of increasing
concentrations of oxo-sulfur compound to these reactions, DNA damage inhibition by the
compound can be quantified.
98

The gel image in Figure 3.2A shows the effect of methylcysteine sulfoxide
(MeCysSO) on DNA damage produced by freshly-prepared Cu+ and H2O2 at pH 7.
Hydrogen peroxide alone (lane 3) and MeCysSO with H2O2 (lane 4) do not generate
DNA damage as compared to the plasmid DNA control (lane 2). In contrast, addition of
both H2O2 and Cu+ produced 74% damaged (nicked) DNA (lane 5), and upon adding
increasing concentrations of MeCysSO (0.1-1500 μM, lanes 6-15), this DNA damage
significantly decreases. Quantification of the band intensities indicates that MeCysSO
inhibits 100% of copper-mediated DNA damage at 1500 μM (Table 3.2). The results of
log [MeCysSO] (μM)-2 -1 0 1 2 3 4
% D
NA
dam
age
inhi
bitio
n
0
20
40
60
80
100
120B
A[MeCysSO]
nicked DNAundamaged
DNA
11 1376 9832 541 10 12 14 15
log [MeCysSO] (μM)-2 -1 0 1 2 3 4
% D
NA
dam
age
inhi
bitio
n
0
20
40
60
80
100
120B
log [MeCysSO] (μM)-2 -1 0 1 2 3 4
% D
NA
dam
age
inhi
bitio
n
0
20
40
60
80
100
120B
A[MeCysSO]
nicked DNAundamaged
DNA
11 1376 9832 541 10 12 14 15A
[MeCysSO]
nicked DNAundamaged
DNA
11 1376 9832 541 10 12 14 15[MeCysSO]
nicked DNAundamaged
DNA
11 1376 9832 541 10 12 14 15[MeCysSO]
nicked DNAundamaged
DNA
11 1376 9832 541 10 12 14 1511 1376 9832 541 10 12 14 1576 9832 541 10 12 14 15
Figure 3.2. A) Agarose gel showing the effect of MeCysSO on Cu+-mediated DNA damage. Lanes: 1) 1 kb DNA ladder; 2) plasmid DNA (p); 3) p + H2O2; 4) p + H2O2 + MetSO; 5) p + H2O2 + Cu2+/ascorbate; 6-15) same as lane 5 with increasing [MeCysSO]: 0.1, 1, 3, 5, 7, 10, 50, 100, 1000, 1500 µM, respectively. B) Plot of DNA damage inhibition vs. log concentration of MeCysSO. The line indicates the best-fit sigmoidal dose-response curve, and error bars show the standard deviation of three duplicate trials (error bars are smaller than symbols).
99

these gel studies were plotted and fit to a sigmoidal dose-response curve to determine the
concentration required to inhibit 50% of copper-mediated DNA damage (IC50; Figure
3.2B). For MeCysSO, this IC50 concentration is 8.1 ± 1 μM (Hillslope = 1.27).
MetSO, MePhSO, MMTS, and Me2SO2 were also tested for prevention of copper-
mediated DNA damage using the same method, and the results are given in Table 3.1.
MetSO inhibits 100% of DNA damage at 2000 μM (p < 0.001; Figure 3.3A), but its IC50
value of 18 ± 3 μM (Hillslope = 1.12, Figure 3.4) is significantly higher than that of
MeCysSO. MePhSO and Me2SO2 have no effect on oxidative DNA damage, even at
5000 μM, whereas MMTS is a pro-oxidant at the highest concentration tested (5000 μM),
further damaging DNA by 35% (p = 0.005) under these conditions (Figure 3.3). From
these results, it is clear that the nature of the oxo-sulfur compound significantly
contributes to the observed antioxidant (or pro-oxidant) activity observed for copper-
mediated DNA damage.
Comparing the antioxidant ability of MeCysSO and MetSO to similar
experiments with copper-mediated DNA damage inhibition of the non-oxidized amino
acids Met and MeCys, it is clear that all four of these compounds are strong antioxidants,
with IC50 values in the low micromolar range (Table 3.1). While the IC50 values for
MeCys and MeCysSO are similar (8.9 and 8.1 μM, respectively), the IC50 value for Met
is significantly lower than that of MetSO (11.2 and 18 μM, respectively; p = 0.01 for both
compounds), indicating that the reduced form of this amino acid is a more potent
antioxidant under these conditions.
100

Table 3.1. IC50 values and λmax for oxo-sulfur compounds with Cu+ and H2O2 and maximal DNA damage inhibition for Fe2+ and H2O2.
Compound IC50 (μM) with Cu+a λmax (nm)b
Maximum DNA damage inhibition (%)
with Fe2+
Reference
MeCysSO 8.1 ± 1.0 237 17 ± 3 at 1000 μM this work
MetSO 18 ± 3.0 236 - this work
MMTS 35 ± 4 % DNA damage at 1000 μM
- 20 ± 4 at 1000 μM this work
MePhSO - - - this work
Me2SO2 - - - this work
Met 11.2 ± 0.02 235 - 47, 56
MeCys 8.9 ± 0.02 239 13 ± 4 % DNA damage at 1000 μM
47, 56
a IC50 is defined as the concentration at which the compound inhibits 50% of DNA damage. b λmax was determined from the difference in absorbance between the Cu+/oxosulfur compound spectrum and the separate Cu+ and oxo-sulfur spectra.
101
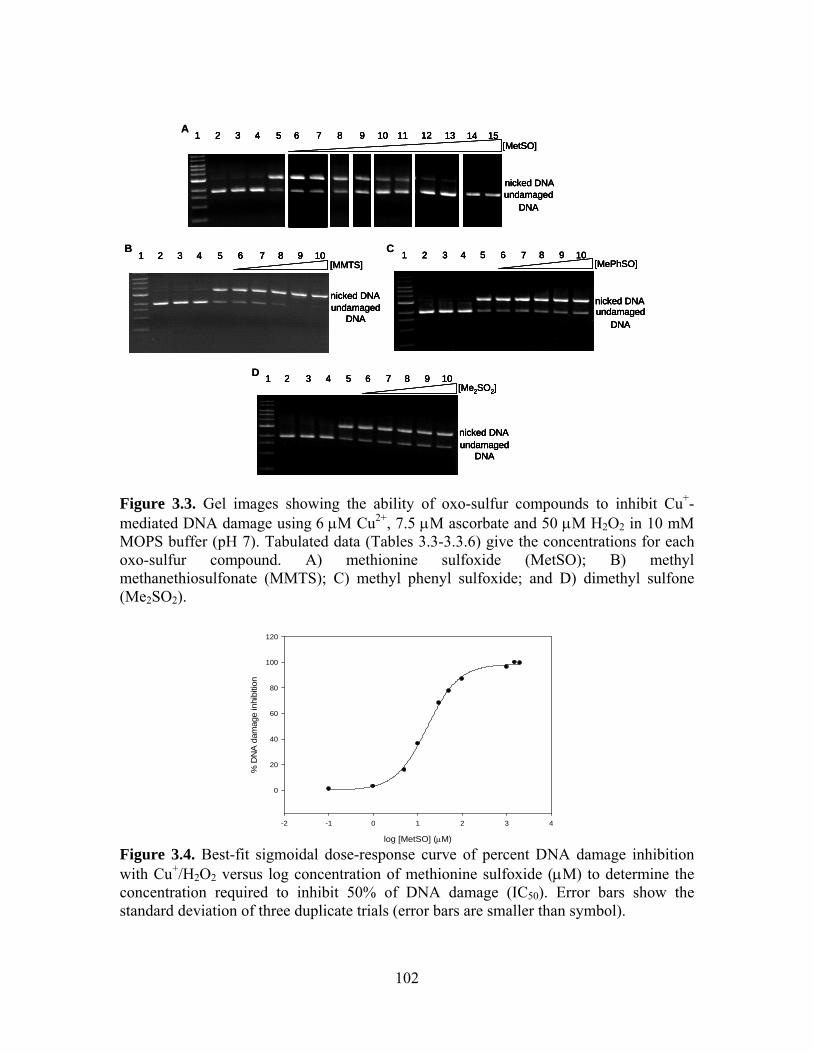
1 2 3 54 6 8 107 9[MePhSO]
nicked DNAundamaged
DNA
C 1 2 3 54 6 8 107 9[MePhSO]
nicked DNAundamaged
DNA
1 2 3 54 6 8 107 91 2 3 54 6 8 107 9[MePhSO][MePhSO]
nicked DNAundamaged
DNA
nicked DNAundamaged
DNA
C1 2 3 54 6 8 107 9
[MMTS]
nicked DNAundamaged
DNA
B1 2 3 54 6 8 107 9
[MMTS]
nicked DNAundamaged
DNA
1 2 3 54 6 8 107 91 2 3 54 6 8 107 9[MMTS][MMTS]
nicked DNAundamaged
DNA
nicked DNAundamaged
DNA
B
1 2 3 54 6 8 107 9[Me2SO2]
nicked DNAundamaged
DNA
D 1 2 3 54 6 8 107 9[Me2SO2]
nicked DNAundamaged
DNA
1 2 3 54 6 8 107 91 2 3 54 6 8 107 9[Me2SO2][Me2SO2]
nicked DNAundamaged
DNA
nicked DNAundamaged
DNA
D
76 9832 541 1110 12 13 14 15
nicked DNAundamaged
DNA
[MetSO]
A76 9832 541 1110 12 13 14 15
nicked DNAundamaged
DNA
[MetSO]76 9832 541 1110 12 13 14 1576 9832 541 32 541 1110 12 13 14 15
nicked DNAundamaged
DNA
nicked DNAundamaged
DNA
[MetSO][MetSO]
A
Figure 3.3. Gel images showing the ability of oxo-sulfur compounds to inhibit Cu+-mediated DNA damage using 6 μΜ Cu2+, 7.5 μM ascorbate and 50 μM H2O2 in 10 mM MOPS buffer (pH 7). Tabulated data (Tables 3.3-3.3.6) give the concentrations for each oxo-sulfur compound. A) methionine sulfoxide (MetSO); B) methyl methanethiosulfonate (MMTS); C) methyl phenyl sulfoxide; and D) dimethyl sulfone (Me2SO2).
log [MetSO] (μM)
-2 -1 0 1 2 3 4
% D
NA
dam
age
inhi
bitio
n
0
20
40
60
80
100
120
Figure 3.4. Best-fit sigmoidal dose-response curve of percent DNA damage inhibition with Cu+/H2O2 versus log concentration of methionine sulfoxide (μM) to determine the concentration required to inhibit 50% of DNA damage (IC50). Error bars show the standard deviation of three duplicate trials (error bars are smaller than symbol).
102

Inhibition of Fe2+-mediated DNA damage by oxo-sulfur compounds
For gel electrophoresis experiments with iron-generated •OH, freshly-prepared
FeSO4 solutions are used as the Fe2+ source, and the reactions are carried out at pH 6 due
to the insolubility of iron at higher pH. Figure 3.5 shows the gel results when increasing
concentrations of MeCysSO are added to Fe2+ and H2O2 in the presence of DNA.
nicked DNA
undamaged DNA
1 2 3 4 5 6 7 8 9 10[MeCysSO]
nicked DNA
undamaged DNA
1 2 3 4 5 6 7 8 9 10[MeCysSO]
Figure 3.5. Agarose gel showing the effect of MeCysSO on Fe2+-mediated DNA damage. Lanes: 1) 1 kb DNA ladder; 2) plasmid DNA (p); 3) p + H2O2; 4) p + H2O2 + MeCysSO; 5) p + H2O2 + Fe2+, 6-10) same as lane 5 with increasing [MeCysSO]: 0.1, 1, 10, 100, 1000 μM, respectively.
Although some DNA damage inhibition is observed at the highest concentration tested
(17 ± 3 % at 1000 μM; p = 0.01), the antioxidant activity in the iron system is much less
than that seen for copper-mediated DNA damage.
MMTS also shows a small amount of antioxidant activity (20 ± 4 % at 1000 μM;
p = 0.01), comparable to the antioxidant activity of MeCysSO. MetSO, MePhSO and
Me2SO2 had no effect on iron-mediated DNA damage (Table 3.1; Figure 3.6).
Interestingly, no activity is observed for MetSO, in contrast to its significant antioxidant
behavior in the copper system, and MMTS promotes copper-mediated DNA damage but
decreases iron-mediated damage. Once again, it is clear that not all oxidized sulfur
compounds have similar activities with iron-mediated DNA damage.
103

Under iron-mediated DNA damage conditions, Met shows no significant DNA
damage inhibition with iron, similar to its oxidized analog MetSO, whereas MeCys
promoted DNA damage by 13% in contrast to the 17% DNA damage inhibition observed
for MeCysSO.49 In this case, oxidation of the amino acid changes the behavior of the
compound from pro-oxidant to antioxidant. Xiao and Parkin determined that compounds
with the thiosulfonate group (R-S(O)S-R) including MMTS and allicin, effectively
scavenge iron-generated •OH.34 MMTS prevents iron-mediated DNA damage by •OH,
but notably promotes copper-mediated DNA damage. The differences between the results
for iron- and copper-mediated damage indicate that the nature of the metal ion plays a
crucial role in antioxidant or pro-oxidant activity of these compounds.
[MMTS]
nicked DNAundamaged
DNA
1 2 3 54 6 8 107 9B
[Me2SO2]
nicked DNAundamaged
DNA
1 2 3 54 6 8 107 9D
[MePhSO]
nicked DNAundamaged
DNA
1 2 3 54 6 8 107 9C
1 2 3 54 6 8 107 9[MetSO]
nicked DNAundamaged
DNA
A[MMTS]
nicked DNAundamaged
DNA
1 2 3 54 6 8 107 9B
[MMTS][MMTS]
nicked DNAundamaged
DNA
nicked DNAundamaged
DNA
1 2 3 54 6 8 107 91 2 3 54 6 8 107 93 54 6 8 107 9B
[Me2SO2]
nicked DNAundamaged
DNA
1 2 3 54 6 8 107 9D
[Me2SO2]
nicked DNAundamaged
DNA
1 2 3 54 6 8 107 9[Me2SO2]
nicked DNAundamaged
DNA
nicked DNAundamaged
DNA
1 2 3 54 6 8 107 91 2 3 54 6 8 107 93 54 6 8 107 9D
[MePhSO]
nicked DNAundamaged
DNA
1 2 3 54 6 8 107 9C
[MePhSO]
nicked DNAundamaged
DNA
1 2 3 54 6 8 107 9[MePhSO][MePhSO]
nicked DNAundamaged
DNA
nicked DNAundamaged
DNA
1 2 3 54 6 8 107 91 2 3 54 6 8 107 93 54 6 8 107 9C
1 2 3 54 6 8 107 9[MetSO]
nicked DNAundamaged
DNA
A 1 2 3 54 6 8 107 9[MetSO]
nicked DNAundamaged
DNA
1 2 3 54 6 8 107 91 2 3 54 6 8 107 93 54 6 8 107 9[MetSO]
nicked DNAundamaged
DNA
nicked DNAundamaged
DNA
A
Figure 3.6. Gel images showing the ability of oxo-sulfur compounds to inhibit Fe2+-mediated DNA damage using 2 μΜ Fe2+and 50 μM H2O2 in 10 mM MES buffer (pH 6). Tabulated data (Tables 3.11-3.14) give the concentrations for each oxo-sulfur compound. A) methionine sulfoxide (MetSO); B) methyl methanethiosulfonate (MMTS); and C) methyl phenyl sulfoxide; and D) dimethyl sulfone (Me2SO2).
104

Antioxidant activity and metal coordination
Battin et al. report that Cu-S charge-transfer bands around 240 nm in the UV-vis
spectrum are observed for all the antioxidant sulfur-containing compounds tested, and
that this charge transfer band is absent for the sulfur compounds lacking antioxidant
activity (Table 3.1).49 Similarly, addition of MetSO (Figure 3.7) and MeCysSO (Figure
3.11) to Cu2+/ascorbate solution also results in Cu-S charge transfer bands around 240 nm
that were not present for the other oxo-sulfur compounds. These UV-vis results indicate
that these two oxo-sulfur compounds coordinate the copper, and it is likely that this
interaction plays a role in their observed antioxidant activity.
0
0.2
0.4
0.6
0.8
1
220 240 260 280 300 320 340 360 380 400 420
Wavelength (nm)
Abs
Cu(II)/ AA
MetSO
Cu(II)/AA + MetSO
Figure 3.7. UV-vis spectra of MetSO (116 μM), Cu2+/ascorbic acid (AA; 58 μM and 72.5 μM, respectively), and Cu2+/ascorbic acid + MetSO in water at pH 7.
To test this copper-coordination hypothesis of antioxidant activity, plasmid DNA
electrophoresis experiments were conducted by substituting [Cu(bipy)2]+ for Cu+ as the
copper source. Since 2,2’-bipyridine (bipy) ligands completely coordinate Cu+, no free
site for binding of an oxo-sulfur compound is available. [Cu(bipy)2]+ reduces H2O2 to
yield DNA-damaging •OH (Figure 3.8, lane 5), but if copper coordination is required for
105

the antioxidant properties of oxo-sulfur compounds, no inhibition of DNA damage should
be observed.
[MetSO]
nicked DNAundamaged
DNA
1 2 3 54 6 8 107 9
[MetSO]
nicked DNAundamaged
DNA
nicked DNAundamaged
DNA
1 2 3 54 6 8 107 91 2 3 54 6 8 107 93 54 6 8 107 9
Figure 3.8. Agarose gel showing the effect of MetSO with [Cu(bipy)2]+ . Lanes: 1) 1 kb DNA ladder; 2) plasmid DNA (p); 3) p + H2O2; 4) p + H2O2 + MetSO; 5) p + H2O2 + [Cu(bipy)2]2+/ascorbate; 6-10) same as lane 5 with increasing [MetSO]: 0.1, 1, 10, 100, 1000 μM, respectively.
As can be seen in lanes 6-10 of the gel in Figure 3.8, increasing MetSO
concentration from 0.1 to 1000 μM results in some antioxidant activity, but at 1000 μM,
DNA damage was inhibited by 43 ± 3 % (p = 0.002) compared to 100% with Cu+ alone
(Figure 3.8). MeCysSO also exerted antioxidant activity in the presence of [Cu(bipy)2]+
and H2O2, inhibiting 88 ± 4 % damage DNA at 1000 μM (p < 0.001) compared to 100%
with Cu+ alone (Figure 3.9A). Since coordination of the copper by the bipyridine ligands
significantly reduces antioxidant activity for both these compounds, copper coordination
is likely one factor in their antioxidant activity. However, since some antioxidant activity
is still observed under these conditions, a second mechanism, such as •OH scavenging, is
likely responsible for the observed antioxidant effects. This is in direct contrast to similar
experiments with Met and MeCys that show a complete inhibition of antioxidant
behavior when [Cu(bipy)2]+ is used as the copper source in similar experiments.49
106

MMTS was again a pro-oxidant under these conditions with [Cu(bipy)2]+,
increasing DNA damage by 44 ± 7 % at 1000 μM (p = 0.007; Figure 3.9B), a slightly-
higher percentage than observed with uncoordinated Cu+ (35 ± 4 % at 1000 μM). Thus,
copper coordination is not required for the observed pro-oxidant activity of MMTS.
UV-vis studies on the five oxo-sulfur compounds resulted in no new absorption
band upon addition of Fe2+, suggesting that no Fe-S coordination occurs, consistent with
the generally weak activity seen for the oxo-sulfur compounds with iron compared to
copper. Experiments were also conducted to determine whether iron coordination is
required for the antioxidant activity of oxo-sulfur compounds by using [Fe(EDTA)]2-
instead of Fe2+ to generate DNA-damaging •OH (Figure 3.10). As with [Cu(bipy)2]+,
EDTA coordinates to Fe2+, leaving no space for the coordination of an oxo-sulfur
compound. Surprisingly, the slight antioxidant activity of both MeCysSO and MMTS
observed with Fe2+ is completely unobserved in the [Fe(EDTA)]2-/H2O2 system,
[MMTS]1 2 3 54 6 8 107 9
nicked DNAundamaged
DNA
B[MeCysSO]
nicked DNAundamaged
DNA
1 2 3 54 6 8 107 9A
[MMTS]1 2 3 54 6 8 107 9
nicked DNAundamaged
DNA
B[MMTS]
1 2 3 54 6 8 107 9
nicked DNAundamaged
DNA
[MMTS][MMTS]1 2 3 54 6 8 107 91 2 3 54 6 8 107 9
nicked DNAundamaged
DNA
nicked DNAundamaged
DNA
B[MeCysSO]
nicked DNAundamaged
DNA
1 2 3 54 6 8 107 9A
[MeCysSO]
nicked DNAundamaged
DNA
1 2 3 54 6 8 107 9[MeCysSO][MeCysSO]
nicked DNAundamaged
DNA
nicked DNAundamaged
DNA
1 2 3 54 6 8 107 91 2 3 54 6 8 107 93 54 6 8 107 9A
Figure 3.9. Gel images showing the ability of oxo-sulfur compounds to inhibit [Cu(bipy)2]+-mediated DNA damage using 50 μΜ [Cu(bipy)2]+, 62.5 μM ascorbate and 50 μM H2O2 in 10 mM MOPS buffer (pH 7). Tabulated data (Tables 3.8-3.9) give the concentrations for each oxo-sulfur compound. A) methylcysteine sulfoxide (MeCysSO) and B) methyl methanethiosulfonate (MMTS).
107

1 2 3 54 6 8 107 9[MMTS]
nicked DNAundamaged
DNA
B1 2 3 54 6 8 107 9
[MeCysSO]
nicked DNAundamaged
DNA
A1 2 3 54 6 8 107 9
[MMTS]
nicked DNAundamaged
DNA
B1 2 3 54 6 8 107 9
[MMTS]
nicked DNAundamaged
DNA
1 2 3 54 6 8 107 91 2 3 54 6 8 107 93 54 6 8 107 9[MMTS][MMTS]
nicked DNAundamaged
DNA
nicked DNAundamaged
DNA
B1 2 3 54 6 8 107 9
[MeCysSO]
nicked DNAundamaged
DNA
A1 2 3 54 6 8 107 9
[MeCysSO]
nicked DNAundamaged
DNA
1 2 3 54 6 8 107 91 2 3 54 6 8 107 93 54 6 8 107 9[MeCysSO][MeCysSO]
nicked DNAundamaged
DNA
nicked DNAundamaged
DNA
A
Figure 3.10. Gel images showing the ability of oxo-sulfur compounds to inhibit [Fe(EDTA)]2--mediated DNA damage using 400 μΜ [Fe(EDTA)]2- and 50 μM H2O2 in 10 mM MES buffer (pH 6). Tabulated data (Tables 3.15-3.16) give the concentrations for each oxo-sulfur compound A) methyl-cysteine sulfoxide (MeCysSO) and B) methyl methanethiosulfonate (MMTS).
0
0.2
0.4
0.6
0.8
1
220 240 260 280 300 320 340 360 380 400 420
Wavelength (nm)
Abs
Cu(II)/ AA
MePhSO
Cu(II)/ AA + MePhSO
C
0
0.2
0.4
0.6
0.8
1
220 240 260 280 300 320 340 360 380 400 420
Wavelength (nm)
Abs
Cu(II)/AAMMTSCu(II)/AA + MMTS
B
0
0.2
0.4
0.6
0.8
1
220 240 260 280 300 320 340 360 380 400 420
Wavelegth (nm)
Abs
Cu(II)/ AA
MeCysSO
Cu(II)/AA + MeCysSO
A
0
0.2
0.4
0.6
0.8
1
220 240 260 280 300 320 340 360 380 400 420
Wavelength (nm)
Abs
Cu(II)/AA
Me2SO
Cu(II)/AA + Me2SO2
D
2
0
0.2
0.4
0.6
0.8
1
220 240 260 280 300 320 340 360 380 400 420
Wavelength (nm)
Abs
Cu(II)/ AA
MePhSO
Cu(II)/ AA + MePhSO
C
0
0.2
0.4
0.6
0.8
1
220 240 260 280 300 320 340 360 380 400 420
Wavelength (nm)
Abs
Cu(II)/ AA
MePhSO
Cu(II)/ AA + MePhSO
C
0
0.2
0.4
0.6
0.8
1
220 240 260 280 300 320 340 360 380 400 420
Wavelength (nm)
Abs
Cu(II)/AAMMTSCu(II)/AA + MMTS
B
0
0.2
0.4
0.6
0.8
1
220 240 260 280 300 320 340 360 380 400 420
Wavelength (nm)
Abs
Cu(II)/AAMMTSCu(II)/AA + MMTS
B
0
0.2
0.4
0.6
0.8
1
220 240 260 280 300 320 340 360 380 400 420
Wavelegth (nm)
Abs
Cu(II)/ AA
MeCysSO
Cu(II)/AA + MeCysSO
A
0
0.2
0.4
0.6
0.8
1
220 240 260 280 300 320 340 360 380 400 420
Wavelegth (nm)
Abs
Cu(II)/ AA
MeCysSO
Cu(II)/AA + MeCysSO
A
0
0.2
0.4
0.6
0.8
1
220 240 260 280 300 320 340 360 380 400 420
Wavelength (nm)
Abs
Cu(II)/AA
Me2SO
Cu(II)/AA + Me2SO2
D
2
0
0.2
0.4
0.6
0.8
1
220 240 260 280 300 320 340 360 380 400 420
Wavelength (nm)
Abs
Cu(II)/AA
Me2SO
Cu(II)/AA + Me2SO2
D
2
Figure 3.11. UV-vis spectra of oxo-sulfur compounds (116 μM), Cu2+ (58 μM)/ascorbate (72.5 μM), and oxo-sulfur compound + Cu2+/ascorbate with MOPS buffer (pH 7, 10 mM): A) methylcysteine sulfoxide (MeCysSO) B) methyl methanethiosulfonate (MMTS); and C) methyl phenyl sulfoxide; and D) dimethyl sulfone (Me2SO2).
108
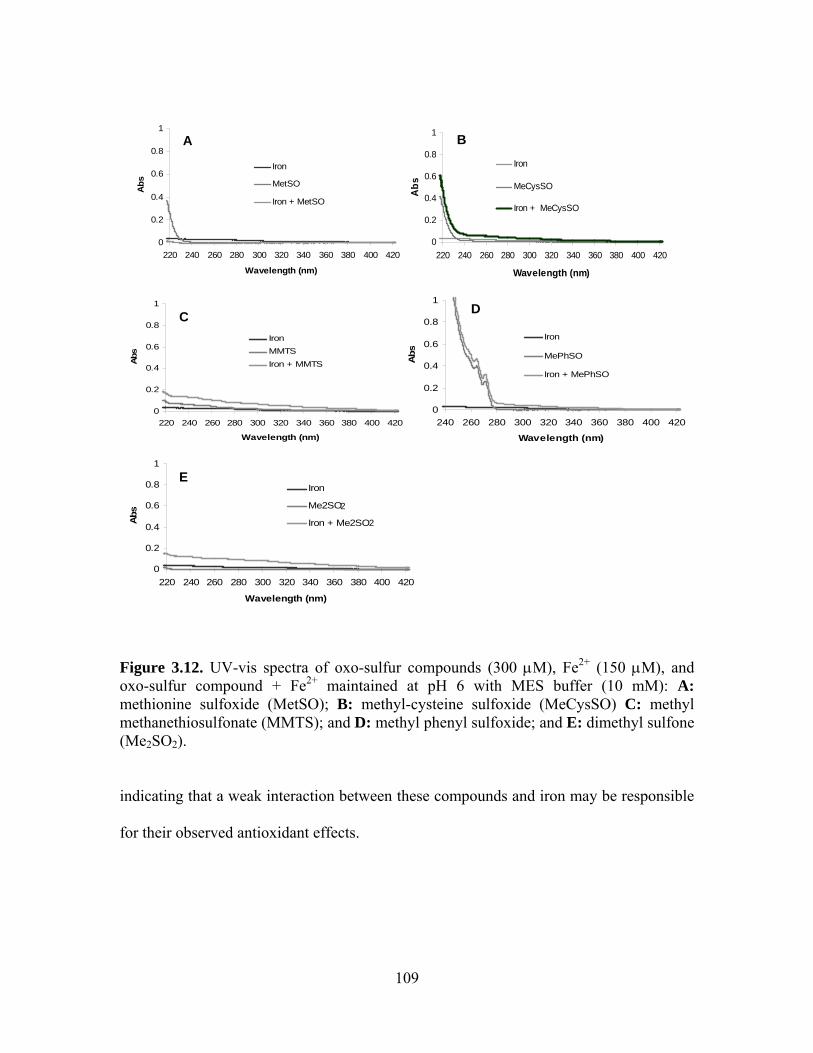
0
0.2
0.4
0.6
0.8
1
220 240 260 280 300 320 340 360 380 400 420
Wavelength (nm)
Abs
Iron
Me2SO
Iron + Me2SO2
2
E
0
0.2
0.4
0.6
0.8
1
240 260 280 300 320 340 360 380 400 420
Wavelength (nm)
Abs
Iron
MePhSO
Iron + MePhSO
D
0
0.2
0.4
0.6
0.8
1
220 240 260 280 300 320 340 360 380 400 420
Wavelength (nm)
Abs
IronMMTSIron + MMTS
C
0
0.2
0.4
0.6
0.8
1
220 240 260 280 300 320 340 360 380 400 420
Wavelength (nm)
Abs
Iron
MeCysSO
Iron + MeCysSO
B
0
0.2
0.4
0.6
0.8
1
220 240 260 280 300 320 340 360 380 400 420
Wavelength (nm)
Abs
Iron
MetSO
Iron + MetSO
A
0
0.2
0.4
0.6
0.8
1
220 240 260 280 300 320 340 360 380 400 420
Wavelength (nm)
Abs
Iron
Me2SO
Iron + Me2SO2
2
E
0
0.2
0.4
0.6
0.8
1
220 240 260 280 300 320 340 360 380 400 420
Wavelength (nm)
Abs
Iron
Me2SO
Iron + Me2SO2
2
0
0.2
0.4
0.6
0.8
1
220 240 260 280 300 320 340 360 380 400 420
Wavelength (nm)
Abs
Iron
Me2SO
Iron + Me2SO2
2
E
0
0.2
0.4
0.6
0.8
1
240 260 280 300 320 340 360 380 400 420
Wavelength (nm)
Abs
Iron
MePhSO
Iron + MePhSO
D
0
0.2
0.4
0.6
0.8
1
240 260 280 300 320 340 360 380 400 420
Wavelength (nm)
Abs
Iron
MePhSO
Iron + MePhSO
D
0
0.2
0.4
0.6
0.8
1
220 240 260 280 300 320 340 360 380 400 420
Wavelength (nm)
Abs
IronMMTSIron + MMTS
C
0
0.2
0.4
0.6
0.8
1
220 240 260 280 300 320 340 360 380 400 420
Wavelength (nm)
Abs
IronMMTSIron + MMTS
C
0
0.2
0.4
0.6
0.8
1
220 240 260 280 300 320 340 360 380 400 420
Wavelength (nm)
Abs
Iron
MeCysSO
Iron + MeCysSO
B
0
0.2
0.4
0.6
0.8
1
220 240 260 280 300 320 340 360 380 400 420
Wavelength (nm)
Abs
Iron
MeCysSO
Iron + MeCysSO
B
0
0.2
0.4
0.6
0.8
1
220 240 260 280 300 320 340 360 380 400 420
Wavelength (nm)
Abs
Iron
MetSO
Iron + MetSO
A
0
0.2
0.4
0.6
0.8
1
220 240 260 280 300 320 340 360 380 400 420
Wavelength (nm)
Abs
Iron
MetSO
Iron + MetSO
A
Figure 3.12. UV-vis spectra of oxo-sulfur compounds (300 μM), Fe2+ (150 μM), and oxo-sulfur compound + Fe2+ maintained at pH 6 with MES buffer (10 mM): A: methionine sulfoxide (MetSO); B: methyl-cysteine sulfoxide (MeCysSO) C: methyl methanethiosulfonate (MMTS); and D: methyl phenyl sulfoxide; and E: dimethyl sulfone (Me2SO2).
indicating that a weak interaction between these compounds and iron may be responsible
for their observed antioxidant effects.
109

Oxidation state and antioxidant activity
Previous work with inorganic selenium compounds suggests that oxidation state
of the selenium atom may play a role in their antioxidant activity. Sodium selenite and
selenium dioxide both have selenium oxidation states of +4, and both are effective at
inhibiting Fe2+-mediated DNA damage. In contrast, compounds with selenium oxidation
states of +6 (sodium selenate) and –2 (sodium selenide) exhibited no antioxidant activity
under the same conditions. The five oxo-sulfur compounds tested also differ in oxidation
state of the sulfur atom: MetSO, MeCysSO, and MePhSO have an oxidation state of 0,
the oxidized sulfur of MMTS has an oxidation state of +1, whereas that of the sulfide is –
1, and in Me2SO2 the sulfur oxidation state is +2. Comparing the results in Table 3.1, no
definitive trend can be identified due to the limited number of compounds tested, but the
ability of oxo-sulfur compounds to inhibit copper-mediated DNA damage may decrease
as the oxidation state of the thiolate sulfur atom increases. Further systematic testing of
the antioxidant properties of oxo-sulfur compounds is needed to firmly establish this
result.
Mass spectrometry evidence for metal binding to sulfur and selenium antioxidants
Recently, sulfur and selenium containing compounds were tested for their ability
to prevent copper-mediated oxidative damage (Figure 3.12).49,53 Eight of the sulfur
compounds tested, including cystine (Cys2), cysteine (Cys), and methionine sulfoxide
(MetSO) were potent antioxidants, with IC50 values ranging from 3.3-18 μM.49,52
110

Interestingly, only three of the ten selenium compounds tested prevented copper-
mediated DNA damage, with IC50 values between 3.3 and 25 μM.53
NH2
OH
O
SeSe
O
OH
NH2
OH
O
NH2
S
O
OH
NH2
SeSe
NH2
HO
O
NH2
SS
NH2
OH
O
HO
O
NH2S
SH2N
NH2Se
SeH2N
NH
HN
NH2
OHS
O
O
HO
O
OH SOH
NH2
O O
S OH
O NH2
O
SS
O
S
O
O
S
O
Methyl selenocysteine (MeSeCys)
Selenomethionine (SeMet)
Methionine (Met)
Selenocystine (SeCys2) Cystine (Cys2)
Selenocystamine (SeCysta)
Cystamine (Cysta)
Glutathione Methionine sulfoxide (MetSO)
Methyl cysteine sulfoxide (MeCysSO)
Methyl methane sulfoxide (MMTS)
Dimethyl sulfone (Me2SO2)
Methyl phenyl sulfoxide (MePhSO)
O
OHH2N
Glycine (Gly)
S
O
OH
NH2
Methylcysteine (MeCys)
SS
NH2
NH2
2-aminophenyl disulfide (2APS2)
O
O
OH
NH2
NH2
HO Se
O
HO OH
O
2,6-diaminopimelic acid (26DAPA)
3,3’-selenobispropionic acid (33SBPA)
Figure 3.13. Structures of selenium and sulfur compounds studied for metal binding using mass spectroscopy.
Additional gel electrophoresis experiments established that copper binding to
most selenium and sulfur compounds is the primary mechanism for their antioxidant
activity.49,53 Experiments with MetSO and methyl cysteine sulfoxide (MeCysSO) indicate
111

that copper coordination is only partly responsible for their antioxidant activity since both
compounds also prevented DNA damage by [Cu(bipy)2]+/H2O2.52
As previously described, UV-vis spectroscopy was also used to examine copper
binding to selenium and sulfur compounds. Adding antioxidant sulfur compounds (Figure
3.13) to Cu+ results in a new absorption band at 240 nm, indicative of Cu-S charge
transfer.49,51,52 Similarly, adding selenium antioxidants (Figure 3.13) to Cu+, results in
new absorption bands between 226 and 240 nm, indicative of Cu-Se coordination.53
These charge transfer bands were unobserved for compounds that had no antioxidant
activity in the presence of Cu+ and H2O2.49,52,53
Electrospray ionization mass spectroscopy (ESI-MS) is a widely used technique
for analysis of metal coordination complexes and covalent organometallic
compounds.54,55 To confirm metal coordination as the mechanism for antioxidant activity
of selenium and sulfur compounds, ESI-MS was utilized. This technique was also used to
examine stoichiometric ratios of copper binding to the antioxidant compounds. In these
experiments, Cu2+ was reduced to Cu+ by ascorbic acid in situ, and the combined with
either selenium or sulfur compounds in Cu+:antioxidant compound ratios of 1:1, 1:2, or
1:3. Analysis of the mass spectra obtained indicates that copper generally coordinates to
the selenium or sulfur compounds with 1:1 stoichiometry (Table 3.2). Furthermore,
nearly all of the compounds that showed antioxidant activity also showed copper
coordination, confirming the metal-coordination results obtained in gel electrophoresis
and UV-vis experiments.
112

Selenomethionine (SeMet) was found to be an effective antioxidant with an IC50
of 25.1 ± 0.01 μM.49,56 Mass spectra obtained using different ratios of Cu+:SeMet showed
a signal at m/z 259.8 Da, suggesting that copper binds to SeMet only in a 1:1
stiochiometric ratio. Similarly, methyl selenocysteine (MeSeCys), a more potent
antioxidant (IC50 = 10.0 ± 0.02 μM)49,56 than SeMet, has a peak envelope at m/z 245.8
Table 3.2. IC50 and ESI-MS values of selenium and sulfur compounds discussed in this chapter. Compound IC50 (μM)a with Cu+ Cu+ : Se or S
compound m/z (Da) Referenceb
SeMet 25.1 ± 0.01 1:1 259.8 53 MeSeCys 10.0 ± 0.02 1:1 245.8 53 SeCys2 3.34 ± 0.08 - - 53 SeCysta - - - 53 33SBPA - - - 53 MeCys 8.90 ± 0.02 1:1 197.9 49, 56 Met 11.20 ± 0.02 1:1 211.9 49, 56 Cys2 3.34 ± 0.07 - - 49, 56 Cysta - - - 49, 56 GSH 12.98 ± 0.01 1:1 369.0 49, 56 GSSG 6.82 ± 0.03 1:1 674.0 49, 56 2APS2 - - - 49, 56 MetSO 18 ± 3.0 1:1 228.0 52, 56 MeCysSO 8.1 ± 1.0 1:1, 1:2 213.9, 363.9 52, 56 MMTS 35 ± 4% DNA
damage at 5000 μM1:1, 1:2 189.9, 314.9 52, 56
MePhSO - 1:1, 1:2 202.9, 342.9 52, 56 Me2SO2 - - - 52, 56 26DAPA 5.84 ± 0.05 1:1 253.0 53 Gly 22.04 ± 0.01 1:1 138.0 53 a IC50 is defined as the compound concentration that inhibits 50% copper-mediated DNA damage. b References are for the IC50 values.
113

Da, also indicating 1:1 binding. Similar results were observed for the sulfur analogs,
methionine (Met) and methyl cysteine (MeCys), with m/z values of 211.9 Da and 197.9
Da, respectively (Table 3.2).
Interestingly, cystine and selenocystine are potent antioxidants, with similar IC50
values of 3.34 ± 0.07 μM and 3.34 ± 0.08 μM, respectively; however no clear copper
coordination signals are observed at any Cu+:antioxidant compound ratio tested (Table
3.2). These two compounds are the only two that have IC50 values but do not exhibit
copper coordination by mass spectrometry. It is possible that the Cu-disulfide or Cu-
diselenide interactions are somewhat weak and do not survive conditions of the mass
spectrometry However, oxidized glutathione, another disulfide with potent antioxidant
activity, does show copper coordination. The absence of observed copper coordination
for cystine and selenocystine also contradict results obtained from UV-vis experiments,
showing Cu-S and Cu-S charge transfer bands due to copper binding.49
A previous study observed copper binding to cystine and glutathione in a 2:1
molar ratio (m/z 603 Da) and a 1:1 (m/z 672 Da), respectively, using ESI-MS.57 The
stability of these copper complexes was found to change over time, and complexation of
copper with oxidized glutathione is more stable than with cystine.57 This stability factor
may also contribute to the lack of observed copper coordination with cystine and
selenocystine.
Interestingly, complexation between copper and oxo-sulfur compounds extends to
both antioxidant and pro-oxidant activities. MeCysSO, an effective antioxidant against
copper-mediated DNA damage (IC50 = 8.1 ± 1.0 μM)52,56 showed stoichiometries of 1:1
114

(m/z 213.9 Da) and 1:2 (m/z 363.9) upon addition of two equivalents of MeCysSO to one
equivalent of copper. The less potent antioxidant, MetSO (IC50 = 18 ± 3.0 μM)52,56
showed only 1:1 copper binding regardless of the Cu+:MetSO molar ratio used.
Surprisingly, although MePhSO and MMTS do not prevent copper-mediated DNA
damage, both coordinate to copper. MePhSO binds to copper in both a 1:1 (m/z 202.9
Da) and 1:2 (m/z 342.9 Da) Cu+ to MePhSO ratio. MMTS is a pro-oxidant at high
concentrations, and binds copper in both 1:1 and 1:2 ratios, with m/z 189.9 Da and 314.9
Da, respectively (Table 3.2). However, UV-vis experiments with MMTS and Cu+
resulted in no observed Cu-S charge transfer band.52 These experiments indicate that
copper binding is necessary but not sufficient for the antioxidant activity of sulfur
compounds, and additional studies are required to fully determine the factors involved in
sulfur and selenium antioxidant activity in addition to copper binding.
The disparities in the mass spectroscopy, UV-vis, and gel electrophoresis for
sulfur compounds suggest that the copper-binding mechanism for the antioxidant and
pro-oxidant activity of these compounds is complex. Results may be dependent on
differences in Cu+:sulfur compound ratio, concentration, or copper complex stability in
aqueous solutions. In addition, the structural characteristics of these sulfur and selenium
compounds likely play a significant role in both copper coordination and the resulting
antioxidant activity of these compounds.
115
Conclusions
The DNA damage inhibition abilities of several oxo-sulfur compounds were
examined for both copper- and iron-mediated •OH damage. Both MetSO and MeCysSO
were found to be effective at preventing copper-mediated DNA damage, with IC50 values
in the low micromolar range. Overall, the results ranged from potent antioxidant activity
to pro-oxidant activity, indicating that the nature of the oxo-sulfur compounds is an
important factor for antioxidant activity. All of the oxo-sulfur compounds tested showed
less pronounced antioxidant or pro-oxidant activity with iron-mediated DNA damage.
UV-vis spectroscopy indicated that Cu-S coordination occurs only for the oxo-sulfur
compounds that prevent copper-mediated DNA damage, and electrophoresis experiments
confirm that copper coordination is required for a substantial amount of the observed
antioxidant activity of these compounds, although a second antioxidant mechanism is
also responsible for additional antioxidant activity. Studies are currently being performed
to correlate these gel electrophoresis results with the ability of oxidized sulfur compounds
to inhibit metal-mediated cell death in vivo. Additional studies on how metal
coordination promotes the observed antioxidant activity are also underway to provide
mechanistic details on the effects of protein oxidation and the antioxidant effects of
garlic, onions, and other sulfur-containing foods.
These ESI-MS experiments performed confirm copper binding for the majority of
sulfur and selenium antioxidant compounds, with a 1:1 stoichiometry being predominant.
Interestingly, copper coordination as observed by ESI-MS seems to be necessary but not
sufficient for antioxidant (or pro-oxidant) activity. For example, antioxidant compounds
116

such as MMTS and MePhSO show copper coordination, but have little or no observed
DNA damage prevention abilities. To further understand how copper binding results in
antioxidant behavior, experiments showing how copper binds to the sulfur and selenium
compounds are essential. These experiments may include extended X-ray absorption fine
structure (EXAFS) analysis to determine the coordination environment of copper-
selenium or -sulfur complexes, if suitable crystals cannot be grown for X-ray structural
analysis. Additionally, synthesis of related copper-selenium or -sulfur complexes may
also be useful in further exploring the copper coordination to sulfur and selenium
compounds. These experiments, in addition to the studies presented in this chapter, will
help in understanding the antioxidant mechanisms of selenium and sulfur compounds.
Materials and Methods
Materials
NaCl (99.999% to avoid trace metal contamination), selenomethionine, reduced
and oxidized glutathione, and methyl-selenocysteine were purchased from Acros.
Selenocystamine, methyl-cysteine, 2,6-diaminopimelic acid, selenocysteine, methionine
sulfoxide, methyl cysteine sulfoxide, methyl phenyl sulfoxide, methyl methane
thiosulfonate, and dimethyl sulfone were from Sigma-Aldrich. Glycine and ascorbic acid
were purchased from J. T. Baker, and cysteine came from Alfa Aesar. Cystamine,
methionine, and 2-aminophenyl disulfide were purchased from TCI America, and cystine
came from Lancaster.. H2O2 solution (30%), FeSO4•7H2O, and CuSO4•5H2O were from
Fisher. EDTA (disodium salt) and ascorbic acid were from J.T. Baker. MES and MOPS
117

were from Acros and 2,2’-bipyridine came from Alfa Aesar. Water was purified using the
NANOpure DIamond water deionization system (Barnstead International, Dubuque, IA).
Iron-free microcentrifuge tubes were prepared by washing the tubes in 1 M HCl prior to
use and rinsing thoroughly with ddH2O. Degassed ddH2O was used for all mass
spectroscopy experiments and was prepared by bubbling nitrogen gas into deionized
water for 12 h prior to use.
DNA purification
Plasmid DNA was purified from DH1 E. coli cells using a QIAprep Spin
Miniprep kit (Qiagen, Chatsworth, CA), eluted using Tris-EDTA (TE) buffer, and then
dialyzed against 130 mM NaCl for 24 h at 4 oC. The resulting DNA concentration was
determined using UV-vis measurements at A260 (1 A260 = 50 ng/μL) with a Shimadzu
UV-3101 PC spectrophotometer. Purity of plasmid DNA was determined via gel
electrophoresis of a digested sample, all DNA samples had absorbance ratios of A250/260 <
0.95 and A260/280 > 1.8.
DNA nicking experiments with Fe2+ and H2O2
The indicated concentrations of MetSO, MeCysSO, MePhSO, MMTS or Me2SO2,
0.1 pmol plasmid DNA, 130 mM NaCl, 10 mM ethanol, freshly-prepared 2 μM
FeSO4•7H2O maintained at pH 6 with MES buffer were combined and allowed to stand
for 5 min at room temperature. H2O2 (50 μM) was then added and incubated for 30 min
to produced sufficient nicked (damaged) DNA with the iron concentration used in these
118

experiments. EDTA (50 μM) was added after this time and a total volume of 10 μL was
maintained with ddH2O. DNA was separated on 1% agarose gels via electrophoresis,
stained with ethidium bromide for 30 min, and imaged on an UVIproDBT-8000 gel
imager (UVITec, Cambridge, UK). Quantification of closed-circular and nicked DNA
was performed using the UviPro software and results were shown in a bar graph.
Ethidium stains Circular DNA less efficiently than nicked DNA, so Circular DNA band
intensities were multiplied by 1.24 prior to comparison.58 For gels run with Fe(EDTA)2-
(400 μM) as the iron source, a similar procedure was used substituting Fe(EDTA)2- (400
μM) for FeSO4•7H2O.
DNA nicking experiments with Cu+ and H2O2
Similar procedures to the Fe2+/H2O2 experiments were followed using
CuSO4•5H2O (6 μM) and ascorbic acid (7.5 μM) instead of iron to produce sufficient
DNA damage upon addition of H2O2. The pH was maintained at pH 7 with MOPS buffer.
For gels run with [Cu(bipy)2]+ as the copper source, a similar procedure was followed
substituting [Cu(bipy)2]+ (50 μM) for CuSO4•5H2O and increasing ascorbic acid
concentration to 62.5 μM.
Gel analysis and IC50 determination
Percent DNA damage inhibition was determined using the formula 1-[% N / %
B]*100, where % N = % nicked DNA in the oxo-sulfur containing lanes and % B = % of
nicked DNA in the Fe2+/H2O2 or Cu+/H2O2 lane. Percentages are corrected for residual
119

nicking prior to calculation. Results are the average of three trials, and standard
deviations are indicated by error bars. Calculation of p values at 95% confidence as
described by Perkowski et al. was used to determine statistical significance.59 Sigma Plot
(v.9.01, Sysat Software, Inc., San Jose, CA) was used to plot percent DNA damage
inhibition as a function of log concentration of oxo-sulfur compound and fit to a variable-
slope sigmoidal dose response curve using the equation:
50(log IC )min [(max min) / (1 10 )]x Hf −= + − +
where f = percent DNA damage inhibition, min = minimum DNA damage inhibition,
max = maximum DNA damage inhibition, x = log concentration of compound, and H =
Hillslope. Results are the average of the fits of three trials, and errors are reported as
standard deviations from error propagation calculations of the gel data.
UV-vis measurements
FeSO4•7H2O (300 μM) and the oxo-sulfur compound (600 μM) were combined in
MES buffer (10 mM) at pH 6. For experiments with Cu+, CuSO4•5H2O (58 μM),
ascorbic acid (72.5 μM) and the oxo-sulfur compound (116 μM) were combined in
MOPS buffer (10 mM). The indicated concentrations are final concentrations in a volume
of 3 mL.
Electrospray ionization mass spectroscopy (ESI-MS) measurements
For 1:1 mole ratio of Cu+:selenium or sulfur compound, CuSO4 (100 μM) and
ascorbic acid (125 μM) were combined in a 3:1 ratio of methanol : water, and allowed to
120

121
stand for 3 min at room temperature. The sulfur or selenium compound (100 μM) was
added to the solution to obtain a final volume of 1 mL, and allowed to stand for 5 min at
room temperature. Mass spectra were obtained using the QSTAR XL Hybrid MS/MS
System (Applied Biosystems), with direct injection of the sample (flow rate = 0.05
mL/min) into the Turbo Ionspray ionization source. Samples were run under positive
mode, with ionspray voltage of 5500 V, and time of flight (TOF) scan mode. The
QSTAR instrument was operated by Carolyn Quarles from Dr. R. Kenneth Marcus group
at Clemson University. For a 1:2 mole ratio of Cu+:selenium or sulfur compound, a
similar procedure was followed, using CuSO4 (50 μM) and ascorbic acid (62.5 μM). For
a 1:3 ratio, CuSO4 (25 μM), ascorbic acid (33 μM), and selenium or sulfur compound (75
μM) were used. All reported m/z peak envelopes (Table 3.2) matched theoretical peak
envelopes.
Tabular data for gel electrophoresis experiments
Tabulated values for the percentages of closed, circular (undamaged) and nicked
(damaged) DNA bands observed in the gel electrophoresis experiments for Cu+/H2O2 (pH
= 7) are given in Tables 3.2-3.6. Tabulated values using [Cu(bipy)2]+ as the copper source
instead of Cu+ at pH 7 are in Tables 3.7-3.9. Additionally, tabulated values of the
compounds tested with Fe2+/H2O2 (pH = 6) are given in Tables 3.10-3.14 and those with
[Fe(EDTA)]2- are given in Table 3.15-3.16. All reported tabulated values are the average
of three experimental trials with the indicated calculated standard deviation.

Table 3.2. Tabulation for electrophoresis results for MeCysSO with Cu2+ (6 μM), ascorbate (7.5 μM) and H2O2 (50 μM) at pH 7. Lane Concentration
(μM) % Circular
DNA % Nicked
DNA % Damage Inhibition
p-value
5 0 27 ± 1.5 73 0
6 0.1 30 ± 1.9 70 3.1 ± 1.4 0.06
7 1 31 ± 1.4 69 4.5 ± 0.40 0.003
8 3 40 ± 1.4 60 20 ± 1.2 0.001
9 5 52 ± 1.1 48 37 ± 1.8 < 0.001
10 7 31 ± 1.4 69 42 ± 3.4 0.002
11 10 56 ± 3.5 30 60 ± 2.0 < 0.001
12 50 89 ± 0.37 69 86 ± 0.73 < 0.001
13 100 92 ± 0.37 8.0 90 ± 1.0 < 0.001
14 1000 99 ± 0.97 1.0 99 ± 1.8 < 0.001
15 1500 99 ± 1.5 1.0 99 ± 1.5 < 0.001
122

Table 3.3. Tabulation for electrophoresis results for MetSO with Cu2+ (6 μM), ascorbate (7.5 μM) and H2O2 (50 μM) at pH 7. Lane Concentration
(μM) % Circular
DNA % Nicked
DNA % Damage Inhibition
p-value
5 0 27 ± 2.2 73 0
6 0.1 29 ± 0.24 71 3.7 ± 2.9 0.16
7 1 29 ± 0.96 71 2.7 ± 2.8 0.23
8 5 37 ± 1.6 63 15 ± 4.7 0.03
9 10 50 ± 2.3 50 34 ± 2.4 0.002
10 30 77 ± 2.1 23 69 ± 3.5 < 0.001
11 50 81 ± 2.5 19 75 ± 3.2 < 0.001
12 100 86 ± 1.9 14 86 ± 2.0 < 0.001
13 1000 95 ± 2.7 5.0 100 ± 2.8 < 0.001
14 1500 99 ± 0.83 1.0 100 ± 1.1 < 0.001
15 2000 99 ± 0.17 1.0 100 ± 0.5 < 0.001
123
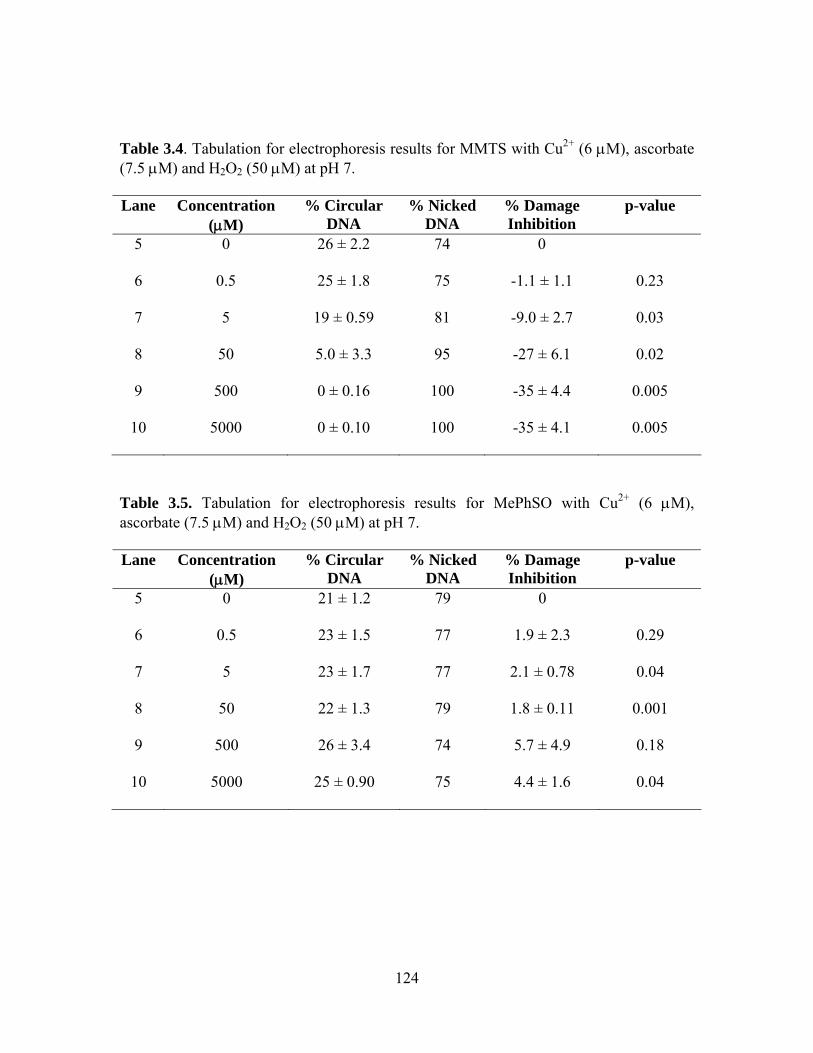
Table 3.4. Tabulation for electrophoresis results for MMTS with Cu2+ (6 μM), ascorbate (7.5 μM) and H2O2 (50 μM) at pH 7. Lane Concentration
(μM) % Circular
DNA % Nicked
DNA % Damage Inhibition
p-value
5 0 26 ± 2.2 74 0
6 0.5 25 ± 1.8 75 -1.1 ± 1.1 0.23
7 5 19 ± 0.59 81 -9.0 ± 2.7 0.03
8 50 5.0 ± 3.3 95 -27 ± 6.1 0.02
9 500 0 ± 0.16 100 -35 ± 4.4 0.005
10 5000 0 ± 0.10 100 -35 ± 4.1 0.005
Table 3.5. Tabulation for electrophoresis results for MePhSO with Cu2+ (6 μM), ascorbate (7.5 μM) and H2O2 (50 μM) at pH 7. Lane Concentration
(μM) % Circular
DNA % Nicked
DNA % Damage Inhibition
p-value
5 0 21 ± 1.2 79 0
6 0.5 23 ± 1.5 77 1.9 ± 2.3 0.29
7 5 23 ± 1.7 77 2.1 ± 0.78 0.04
8 50 22 ± 1.3 79 1.8 ± 0.11 0.001
9 500 26 ± 3.4 74 5.7 ± 4.9 0.18
10 5000 25 ± 0.90 75 4.4 ± 1.6 0.04
124

Table 3.6. Tabulation for electrophoresis results for Me2SO2 with Cu2+ (6 μM), ascorbate (7.5 μM) and H2O2 (50 μM) at pH 7. Lane Concentration
(μM) % Circular
DNA % Nicked
DNA % Damage Inhibition
p-value
5 0 23 ± 1.6 77 0
6 0.5 25 ± 2.4 75 3.2 ± 2.4 0.15
7 5 26 ± 2.5 74 4.1 ± 2.8 0.13
8 50 25 ± 2.4 75 3.9 ± 3.1 0.16
9 500 26 ± 2.3 74 4.0 ± 2.3 0.09
10 5000 25 ± 1.2 75 3.9 ± 1.0 0.02
Table 3.7. Tabulation for electrophoresis results for MetSO with [Cu(bipy)2]2+ (50 μM), ascorbate (62.5 μM) and H2O2 (50 μM) at pH 7. Lane Concentration
(μM) % Circular
DNA % Nicked
DNA % Damage Inhibition
p-value
5 0 23 ± 0.96 77 0
6 0.1 25 ± 3.0 75 3.5 ± 4.2 0.28
7 1 29 ± 3.1 71 9.1 ± 3.7 0.05
8 10 37 ± 4.7 63 20 ± 7.2 0.04
9 100 36 ± 5.6 64 18 ± 6.6 0.04
10 1000 55 ± 2.0 45 43 ± 3.2 0.002
125
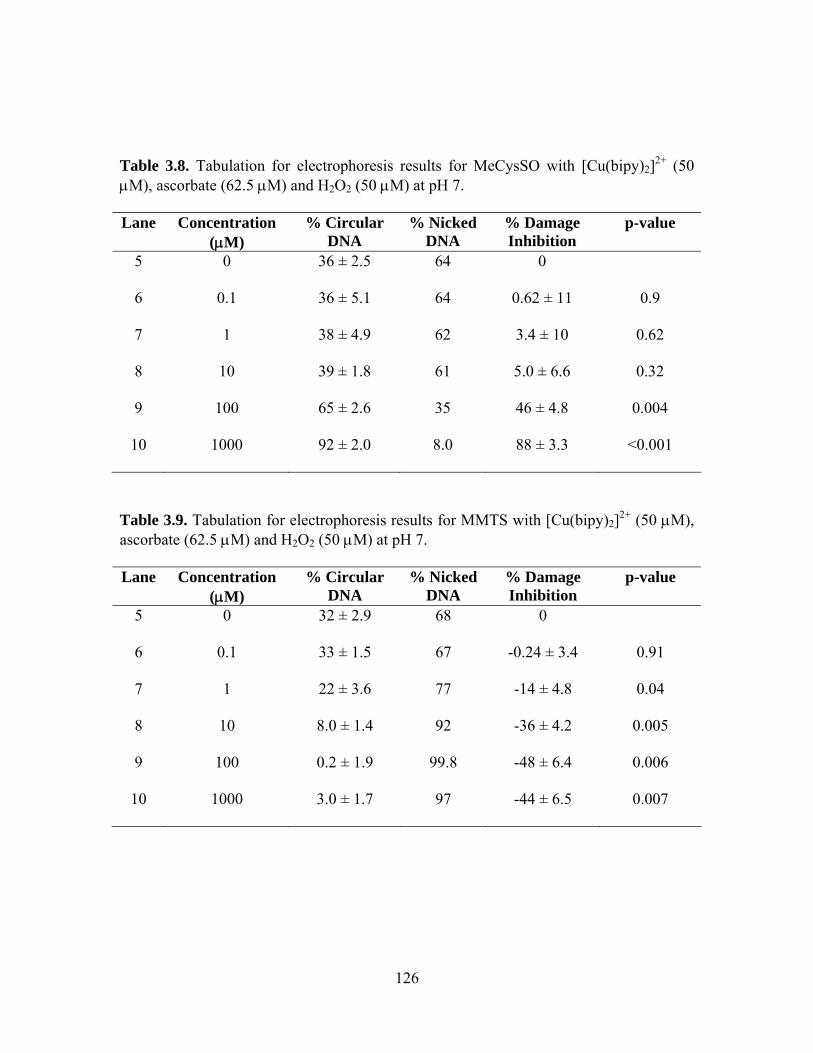
Table 3.8. Tabulation for electrophoresis results for MeCysSO with [Cu(bipy)2]2+ (50 μM), ascorbate (62.5 μM) and H2O2 (50 μM) at pH 7. Lane Concentration
(μM) % Circular
DNA % Nicked
DNA % Damage Inhibition
p-value
5 0 36 ± 2.5 64 0
6 0.1 36 ± 5.1 64 0.62 ± 11 0.9
7 1 38 ± 4.9 62 3.4 ± 10 0.62
8 10 39 ± 1.8 61 5.0 ± 6.6 0.32
9 100 65 ± 2.6 35 46 ± 4.8 0.004
10 1000 92 ± 2.0 8.0 88 ± 3.3 <0.001
Table 3.9. Tabulation for electrophoresis results for MMTS with [Cu(bipy)2]2+ (50 μM), ascorbate (62.5 μM) and H2O2 (50 μM) at pH 7. Lane Concentration
(μM) % Circular
DNA % Nicked
DNA % Damage Inhibition
p-value
5 0 32 ± 2.9 68 0
6 0.1 33 ± 1.5 67 -0.24 ± 3.4 0.91
7 1 22 ± 3.6 77 -14 ± 4.8 0.04
8 10 8.0 ± 1.4 92 -36 ± 4.2 0.005
9 100 0.2 ± 1.9 99.8 -48 ± 6.4 0.006
10 1000 3.0 ± 1.7 97 -44 ± 6.5 0.007
126

Table 3.10. Tabulation for electrophoresis results for MetSO with Fe2+ (2 μM) and H2O2 (50 μM) at pH 6. Lane Concentration
(μM) % Circular
DNA % Nicked
DNA % Damage Inhibition
p-value
5 0 11 ± 3.8 89 0
6 0.1 14 ± 9.2 86 3.7 ± 6.6 0.43
7 1 9.0 ± 0.73 91 -1.6 ± 4.7 0.61
8 10 10 ± 2.4 90 -0.55 ± 1.6 0.62
9 100 92 ± 0.70 8.0 -3.3 ± 4.2 0.31
10 1000 91 ± 1.3 9.0 -1.5 ± 3.3 0.52
Table 3.11. Tabulation for electrophoresis results for MeCysSO with Fe2+ (2 μM) and H2O2 (50 μM) at pH 6. Lane Concentration
(μM) % Circular
DNA % Nicked
DNA % Damage Inhibition
p-value
5 0 11 ± 4.2 89 0
6 0.1 11 ± 5.9 89 0.18 ± 4.9 0.96
7 1 91 ± 5.3 9.0 -2.3 ± 5.5 0.53
8 10 12 ± 6.1 88 1.3 ± 7.6 0.80
9 100 13 ± 4.4 87 2.2 ± 1.5 0.13
10 1000 25 ± 1.1 75 17 ± 3.0 0.01
127
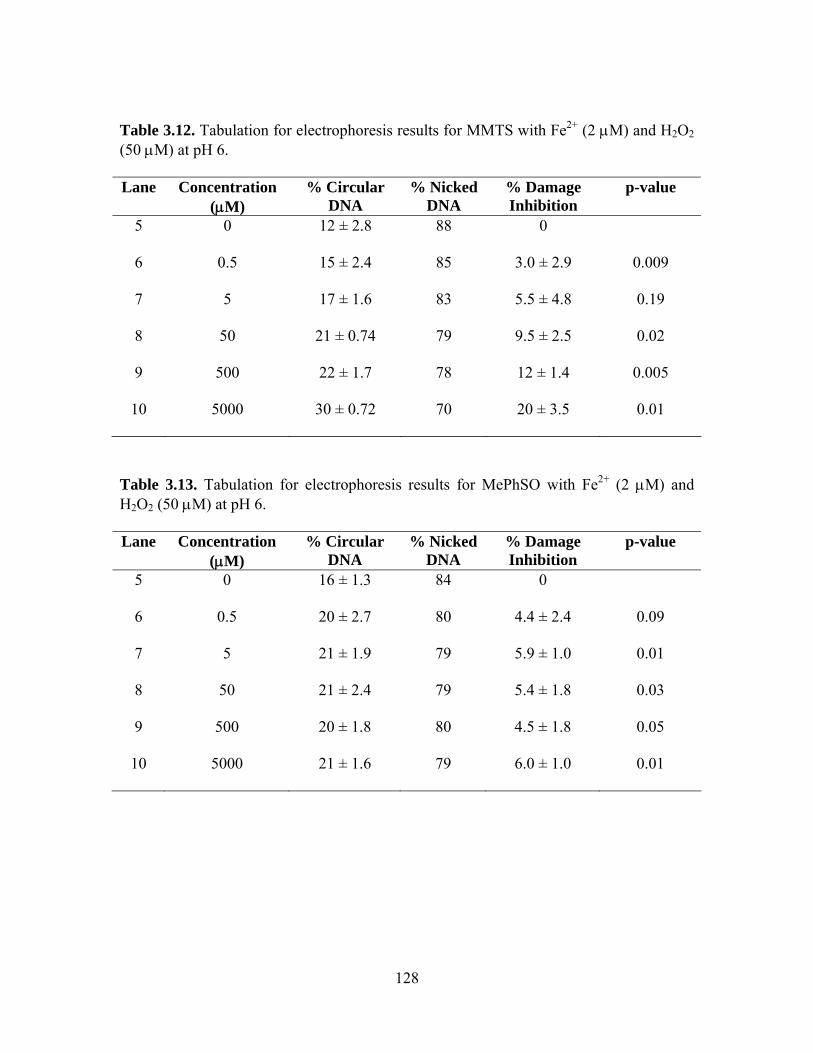
Table 3.12. Tabulation for electrophoresis results for MMTS with Fe2+ (2 μM) and H2O2 (50 μM) at pH 6. Lane Concentration
(μM) % Circular
DNA % Nicked
DNA % Damage Inhibition
p-value
5 0 12 ± 2.8 88 0
6 0.5 15 ± 2.4 85 3.0 ± 2.9 0.009
7 5 17 ± 1.6 83 5.5 ± 4.8 0.19
8 50 21 ± 0.74 79 9.5 ± 2.5 0.02
9 500 22 ± 1.7 78 12 ± 1.4 0.005
10 5000 30 ± 0.72 70 20 ± 3.5 0.01
Table 3.13. Tabulation for electrophoresis results for MePhSO with Fe2+ (2 μM) and H2O2 (50 μM) at pH 6. Lane Concentration
(μM) % Circular
DNA % Nicked
DNA % Damage Inhibition
p-value
5 0 16 ± 1.3 84 0
6 0.5 20 ± 2.7 80 4.4 ± 2.4 0.09
7 5 21 ± 1.9 79 5.9 ± 1.0 0.01
8 50 21 ± 2.4 79 5.4 ± 1.8 0.03
9 500 20 ± 1.8 80 4.5 ± 1.8 0.05
10 5000 21 ± 1.6 79 6.0 ± 1.0 0.01
128

Table 3.14. Tabulation for electrophoresis results for Me2SO2 with Fe2+ (2 μM) and H2O2 (50 μM) at pH 6. Lane Concentration
(μM) % Circular
DNA % Nicked
DNA % Damage Inhibition
p-value
5 0 14 ± 2.9 86 0
6 0.5 16 ± 1.7 84 3.2 ± 2.8 0.19
7 5 21 ± 5.7 79 8.6 ± 7.1 0.17
8 50 17 ± 1.7 83 4.2 ± 2.0 0.07
9 500 18 ± 0.62 82 4.6 ± 2.8 0.10
10 5000 18 ± 1.4 82 5.5 ± 3.6 0.12
Table 3.15. Tabulation for electrophoresis results for MetSO with [Fe(EDTA)]2 (400 μM) and H2O2 (50 μM) at pH 7. Lane Concentration
(μM) % Circular
DNA % Nicked
DNA % Damage Inhibition
p-value
5 0 49 ± 0.10 51 0
6 0.1 49 ± 0.20 51 1.2 ± 0.23 0.29
7 1 49 ± 0.19 51 1.8 ± 0.46 0.04
8 10 49 ± 0.98 51 1.7 ± 1.9 0.001
9 100 51 ± 1.4 49 4.6 ± 3.0 0.18
10 1000 51 ± 0.30 49 5.5 ± 0.65 0.04
129

Table 3.16. Tabulation for electrophoresis results for MMTS with [Fe(EDTA)]2 (400 μM) and H2O2 (50 μM) at pH 7. Lane Concentration
(μM) % Circular
DNA % Nicked
DNA % Damage Inhibition
p-value
5 0 21 ± 1.2 79 0
6 0.5 23 ± 1.5 77 1.9 ± 2.3 0.29
7 5 23 ± 1.7 77 2.1 ± 0.78 0.04
8 50 22 ± 1.3 79 1.8 ± 0.11 0.001
9 500 26 ± 3.4 74 5.7 ± 4.9 0.18
10 5000 25 ± 0.90 75 4.4 ± 1.6 0.04
References
(1) Cadenas, E. Ann. Rev. Biochem. 1989, 58, 79-110.
(2) Valko, M.; Rhodes, C. J.; Moncol, J.; Izakovic, M.; Mazur, M. Chemico-
Biological Interactions 2006, 160, 1-40.
(3) Stewart, M. S.; Spallholz, J. E.; Neldner, K. H.; Pence, B. C. Free Radic. Biol.
Med. 1999, 26, 42-48.
(4) Chung, L. Y. J. Med. Food 2006, 9, 205-213.
(5) Halliwell, B. Drugs Aging 2001, 18, 685-716.
(6) Henle, E. S.; Linn, S. J. Biol. Chem. 1997, 272, 19095-19098.
(7) Hoffmann, M. E.; Mello-Filho, A. C.; Meneghini, R. Biochim. Biophys. Acta
1984, 781, 234-238.
(8) Mello-Filho, A. C.; Meneghini, R. Mutat. Res. 1991, 251, 109-113.
130

(9) Henle, E. S.; Zhengxu, H.; Tang, N.; Rai, P.; Luo, Y.; Linn, S. J. Biol. Chem.
1999, 274, 962-971.
(10) Karanjawala, Z. E.; Lieber, M. R. Mech. Ageing Dev. 2004, 125, 405-415.
(11) van Schooten, F. J.; Knappen, A. M.; Izzotti, A. Mutat. Res. 2007, 621, 1-4.
(12) Emerit, J.; Edeas, M.; Bricaire, F. Biomed. Pharmacother. 2004, 58, 39-46.
(13) Lippard, S. J.; Berg, J. M. Principles of Bioinorganic Chemistry; University
Science Books: Mill Valley, 1994.
(14) Park, S.; Imlay, J. A. J. Bacteriol. 2003, 185, 1942-1950.
(15) Keyer, K.; Imlay, J. A. Proc. Nat. Acad. Sci. USA 1996, 93, 13635-13640.
(16) Rae, T. D.; Schmidt, P. J.; Pufahl, R. A.; Culotta, V. C.; O'Halloran, T. V. Science
1999, 284, 27402-27411.
(17) Lippard, S. J. Science 1999, 284, 748-749.
(18) Yang, L.; McRae, R.; Henary, M. M.; Patel, R.; Lai, B.; Vogt, S.; Fahrni, C. J.
Proc. Nat. Acad. Sci. USA 2005, 102, 11179-11184.
(19) Brown, D. R.; Qin, K. F.; Herms, J. W.; Madlung, A.; MAnson, J.; Strome, R.;
Fraser, P. E.; Kruck, T.; vonBohlen, A.; Schulz-Schaeffer, W.; Giese, A.;
Weataway, D.; Krestzschmar, H. Nature 1997, 390, 684-687.
(20) Que, E. L.; Domaille, D. W.; Chang, C. J. Chem. Rev. 2008, 106, 1517-1549.
(21) Huang, X. Mutat. Res. 2003, 533, 153-171.
(22) Ke, Y.; Qian, Z. M. Lancet Neurol. 2003, 2, 246-253.
131

(23) Moreira, P. I.; Siedlak, S. L.; Aliev, G.; Zhu, X.; Cash, A. D.; Smith, M. A.;
Perry, G. J. Neural Transm. 2005, 112, 921-932.
(24) Valavanidis, A.; Vlahoyianni, T.; Fiotakis, K. Free Rad. Res. 2005, 39, 1071-
1081.
(25) Selima, M. H.; Ratan, R. R. Ageing Res. Rev. 2004, 3, 345-353.
(26) Wood, R. J. Ageing Res. Rev. 2004, 3, 355–367.
(27) Giurgea, N.; Constantinescu, M. I.; Stanciu, R.; Suciu, S.; Muresan, A. Med. Sci.
Monit. 2005, 11, RA48-51.
(28) Swaminathan, S.; Fonseca, V. A. Diabetes Care 2007, 30, 1926-1934.
(29) Moon, H. K.; Yang, E. S.; Park, J. W. Arch. Pharm. Res. 2006, 29, 213-217.
(30) Sachidanandam, K.; Fagan, S.; Ergul, A. Cardiovasc. Drug Rev. 2005, 23, 115-
132.
(31) Thirunavukkarasu, C.; Sakthisekaran, D. J. Cell. Biochem. 2003, 88, 578-588.
(32) Rabinkov, A.; Miron, T.; Konstantinovski, L.; Wilchek, M.; Mirelman, D.;
Weiner, L. Biochim. Biophys. Acta 1998, 1379, 233-244.
(33) Stoll, A.; Seebeck, E. Adv. Enzymol. 1951, 11, 377-400.
(34) Xiao, H.; Parkin, K. J. Agric. Food. Chem. 2002, 50, 2488-2493.
(35) Yin, M.-C.; Cheng, W.-S. J. Agric. Food. Chem. 1998, 46, 4097-4101.
(36) Jacob, C.; G.I.Giles; Giles, N. M.; Sies, H. Angew. Chem. Int. Ed. 2003, 42, 4742-
4758.
132

(37) Brot, N.; Weissbach, H. Arch. Biochem. Biophys. 1983, 223, 271-281.
(38) Vogt, W. Free Radic. Biol. Med. 1995, 18, 93-105.
(39) Levine, R. L.; Moskovitz, J.; Stadtman, E. R. IUBMB Life 2000, 50, 301-307.
(40) Gonias, S. L.; Swaim, M. W.; Massey, M. F.; Pizzo, S. V. J. Biol. Chem. 1988,
263, 393-397.
(41) Nakao, L. S.; Iwai, L. K.; Kalil, J.; Augusto, O. FEBS Lett. 2003, 547, 87-91.
(42) Moskovitz, J. Biochim. Biophys. Acta 2005, 1703, 213-219.
(43) Weissbach, H.; Resnick, L.; Brot, N. Biochim. Biophys. Acta 2005, 1703, 203-
212.
(44) Kim, H.-Y.; Cheng, W.-S. Biochem. J. 2007, 407, 321-329.
(45) Moskovitz, J.; Berlett, B. S.; Poston, J. M.; Stadtman, E. R. Proc. Natl. Acad. Sci.
U.S.A. 1997, 94, 9585-9589.
(46) Levine, R. L.; Mosoni, L.; Berlett, B. S.; Stadtman, E. R. Proc. Natl. Acad. Sci.
U.S.A. 1996, 93, 15036-15040.
(47) Levine, R. L.; Berlett, B. S.; Moskovitz, J.; Mosoni, L.; Stadtman, E. R. Mech.
Ageing Develop. 1999, 107, 323-332.
(48) Nishimura, H.; Higuchi, O.; Tateshita, K. BioFactors 2004, 21, 277-280.
(49) Battin, E. E.; Brumaghim, J. L. J. Inorg. Biochem. 2008, 102, 2036-2042.
(50) Ramoutar, R. R.; Brumaghim, J. L. J. Inorg. Biochem. 2007, 101, 1028-1035.
(51) Battin, E. E.; Perron, N. R.; Brumaghim, J. L. Inorg. Chem. 2006, 45, 499-501.
133

(52) Ramoutar, R. R.; Brumaghim, J. L. Main Group Chem. 2007, 6, 143-153.
(53) Battin, E. E.; Ramoutar, R. R.; Brumaghim, J. L. in preparation.
(54) Schramel, O.; Michalke, B.; Kettrup, A. Fresenius J. Anal. Chem. 1999, 363, 452-
455.
(55) Michalke, B.; Schramel, O.; Kettrup, A. Fresenius J. Anal. Chem. 1999, 363, 456-
459.
(56) Note: The reported IC50 and error values have been refined since publication.49,52
(57) Polec-Pawlak, K.; Ruzik, R.; Lipiec, E. Talanta 2007, 72, 1564-1572.
(58) Hertzberg, R. P.; Dervan, P. B. J. Am. Chem. Soc. 1982, 104, 313-315.
(59) Perkowski, D. A.; Perkowski, M. Data and Probability Connections; Pearson
Prentice Hall: New Jersey, 2007, pp 318-337.
134

CHAPTER FOUR
INVESTIGATING THE ABILITY OF π-CONJUGATED POLYMER
NANOPARTICLES TO PROMOTE OXIDATIVE DNA DAMAGE
Introduction
Photodynamic therapy (PDT) is fast becoming a new approach for the treatment
of cancerous cells and tumors.1,2 The mechanistic action of photodynamic therapy
requires three components: light, oxygen, and a photosensitizing agent that localizes in or
near diseased cells or tissues.1-4 Upon activation by light (photons) at specific
wavelengths, the photosensitizer is excited from the singlet ground state (S0) to a triplet
state (T1) via an intermediate excited singlet state (S1).1-3,5,6 The excited singlet state is
short-lived, with a lifetime in the nanosecond range, and decays either through radiative
or non-radiative processes to the ground or triplet states, which have much longer
lifetimes, ranging from micro- to milliseconds.1,2,5,6
From the excited triplet state, the photosensitizer can undergo two processes
(Type I and Type II), which generate reactive oxygen species (ROS) in the presence of
molecular oxygen (O2). In the Type I process, the photosensitizer in its triplet state
transfers an electron to, or abstracts a hydrogen atom from, biomolecules such as lipids in
cell membranes to form radical cations or anions. These radical species then react with
molecular oxygen to generate ROS such as the superoxide anion radical (O2-•).1-3,5-7 The
second process (Type II) involves the direct transfer of energy from the triplet state to
oxygen to form singlet oxygen (1O2).1-3,5,6,8-10 While both of these processes occur
135

simultaneously, Type II generation of singlet oxygen typically predominates over Type I
production of radicals since the rate constant for generation of singlet oxygen (k ~ 1-3 ×
109 dm-1 mol-1 s-1) is usually higher than that for generation of O2-• (k ≤ 1 × 10⁷ dm-1
mol-1 s-1).7
Singlet oxygen is a highly reactive species that directly oxidatively damages
biological targets, thus making it ideal for photodynamic therapy.2,9,11-13 1O2 reacts with
electron-rich molecules and cellular components such as DNA, in particular guanine
bases, resulting in oxidized bases, strand breaks, mutagenesis, and cell death.10,11,13-18 In
vivo, cells are protected from such mutations by repair systems that use endonucleases
such as the formamidopyrimidine-DNA glycosylase (Fpg) enzyme, which cleaves
oxidized purine bases for removal or replacement.19,20 Other biological targets for singlet
oxygen include RNA, lipids, sterols, and proteins.6,7,21,22 In biological systems, 1O2 has a
short half-life (< 0.04 μs) with a small radius of action (< 0.02 μm), therefore only target
cells in close proximity to the photosensitizer are affected by photodynamic therapy.1,2,23
Many factors influence the efficiency and effectiveness of PDT, including oxygen
availability; the type, chemistry, light absorption, and bioavailability properties of the
photosensitizer; the location and dosage of the photosensitizer in diseased cells; and the
light dosage and timing of light activation after administration of the sensitizer.1,2,24
Several types of photosensitizer molecules have been examined, including organic dyes,
porphyrins and their derivatives, and various organometallic species.2,3,25,26 Although
there are several highly selective sensitizers,2,27-29 the FDA has approved the use of
Photofrin®, a haematoporphyrin derivative, and Verteporfin, a derivative of
136

benzoporphyrin, to be used in PDT.1,3 While effective in clinical applications, several
problems are associated with existing photosensitizers.3 These include the hydrophobicity
of most sensitizer molecules that causes aggregation in aqueous media and make
intravenous administration difficult, as well as a lack of selective accumulation in
diseased tissue.2,3 Although a few selective-targeting sensitizers have been reported, their
low selectivity hinders their testing in clinical trials.3 This lack of effective sensitizers for
PDT is of great concern for the advancement of photodynamic therapy. Therefore,
significant research efforts have focused on the development of photosensitizer carriers to
obtain effective sensitizers that generate more ROS upon irradiation with enhanced
localization on or near cancer cells.1,3,30-37
Nanotechnology is currently being implemented in the development of such
photosensitizer carriers.3,38,39 Nanoparticles are colloidal particles of various sizes in the
nanometer (nm) range and have been used for many applications in catalysis,40
optics,41electronics,42 clinical diagnostic assays, drug delivery systems, histology studies,
and separation techniques.3,43-45 Recently, a new class of π-conjugated polymer
nanoparticles (CP dots) was synthesized by the McNeill group at Clemson University
using the conjugated polymer poly(9,9-dihexyl)flourene (PDHF); the efficiency of these
CP dots to produce singlet oxygen when doped with the photosensitizer tetraphenyl
porphyrin (TPP) was measured.37,46,47 CP dot nanoparticles vary in size from 5-50 nm,
and the McNeill lab has synthesized TPP-doped CP dots with a diameter of 5 ± 1 nm that
are comparable to other spherical, nanoparticle-based photosensitizers.37 These TPP-
137
doped CP dot nanoparticles are considered to be efficient photosensitizers because of the
high yields of singlet oxygen produced upon photoexcitation.
Using spectrophometric analysis to measure the depletion of p-
nitrosodimethylaniline (RNO) after irradiation, the singlet oxygen quantum yield for CP
dots doped with TPP was determined to be between 0.6 and 0.8, which is high compared
to the yield produced from undoped PDHF (0.2-0.3).37 The high absorptivity of doped CP
dots (107-109 M-1cm-1), coupled with the high quantum yield of singlet oxygen generated
upon irradiation, make these TPP-doped nanoparticles promising photosensitizers for
photodynamic therapy cancer treatment.37 Since the potential use of these doped CP dots
to treat cancer is of great interest, it is necessary to determine the effects of TPP-doped
CP dot-generated singlet oxygen on cellular components such as DNA.
Gel electrophoresis assays have been previously employed by the Brumaghim
group to determine the antioxidant activity of several selenium, sulfur, and polyphenol
compounds by prevention of metal-mediated oxidative DNA damage.48-51 In these
studies, DNA damage results from the generation of hydroxyl radical (•OH) upon
addition of either copper(I) or iron(II) and hydrogen peroxide (H2O2).48-51 In
collaboration with the McNeill group, similar gel electrophoresis assays were employed
to quantify the amount of DNA backbone and base damage produced by singlet oxygen
generated from doped CP dot nanoparticles upon irradiation.
138

Toxicity of nanoparticles
Apart from PDT, nanomaterials are widely used in the pharmaceutical,
biomedical, electrical, cosmetic, and environmental fields.52 Metals or metal oxides of
iron, titanium, and silicon are used as nanomaterials in imaging techniques, sunscreens,
and cosmetics.52,53 To increase solubility, the surfaces of nanoparticles are often
functionalized. Nanoparticles functionalized with polyethylene glycol (PEG) and
polysorbates to facilitate solubility in drug delivery systems are also known to generate
ROS, which can damage cellular components in biological systems.54-56 In addition, PEG
used to functionalize nanoparticles undergo light- or metal-induced decomposition via
auto-oxidation to produce peroxides.54,55
Production of peroxides from PEG, coupled with metals found in biological
systems, may result in potential cellular damage from •OH generated in Fenton and
Fenton-like reactions.57-60 As a result, it is important to understand the toxic effects of
such functionalized nanomaterials before they can be used for biomedical applications. It
has been reported that PEG stored at different temperatures (25-40 °C) in the dark or
exposed to light generates different levels of peroxide (1.5-9.0 μM).54 In collaboration
with the McNeill group, the Brumaghim group has examined the production of H2O2 by
PEG and PEG-trimethoxysilane (PEG-TMS) under similar conditions. For these
experiments, the ferrous oxidation-xylenol orange (FOX) assay was used to determine
hydrogen peroxide concentrations.
Functionalized nanoparticles may also localize metal ions in addition to
generating ROS species with or without photoexcitation.32-34,61 Metal ions such as iron(II)
139

and copper(I) are present in cells, and react with H2O2 to produce oxidative DNA damage
via •OH generation leading to several health conditions such as cancer, aging, and
cardiovascular and neurodegenerative diseases.57,60,62-65 Functionalized nanoparticles may
have surface charges that may cause association with cellular metals such as iron and
copper.57-60 It is therefore important to determine the amount of metal that is associated
with these nanoparticles and functional groups to understand potential nanoparticle
toxicity in vivo. Working with the McNeill group, induced coupled plasma mass
spectroscopy (ICP-MS) was utilized in experiments to determine iron association to both
PEG and PEG-TMS. The results of these experiments are preliminary, and additional
studies will be required to fully understand the chemical behavior of functionalized
nanoparticles for use in biomedical applications.
Results and Discussion
Photodynamic therapy and the use of nanomaterials as carriers for photosensitizer
molecules is a new approach for the disease treatment. McNeill and coworkers at
Clemson University have recently synthesized π-conjugated polymer nanoparticles (CP
dots) with large one and two photon cross-sections.37,46,47,66 These TPP-doped CP dot
nanoparticles generate high yields of singlet oxygen upon UV irradiation (0.6-0.8), which
may have great potential in the treatment of cancer by PDT.37 Since singlet oxygen
damages both the backbone and bases of DNA, damage that is critical for PDT treatment
and cell death, gel electrophoresis experiments were conducted to quantify the amount of
DNA damage produced upon irradiation of the doped CP dots.
140
DNA backbone and base damage experiments with doped CP dot nanoparticles
TPP-doped CP dot nanoparticles were combined with plasmid DNA and
irradiated for 0, 50, 100, and 200 min using a fluorescence spectrometer at 377 nm. Gel
electrophoresis was used to quantify DNA backbone damage using previously reported
methods.52-55 To determine DNA base damage, the Fpg enzyme was used to digest the
DNA after irradiation, prior to running the gel assay. The Fpg enzyme nicks the DNA
backbone both 3′ and 5′ to damaged bases such as 8-oxoguanine, 8-oxoadenine, 5-
hydroxy-cytosine, and 5-hydroxy-uracil.70,71 This enzyme was chosen since oxidative
damage by 1O2 primarily causes oxidation of guanine and adenine to form 8-oxoguanine
and 8-oxoadenine.67,68
Figure 4.1 shows the gel images from these DNA damage experiments. The band
intensities in lanes 2-8 (Figure 4.1A) are undigested plasmid samples and indicate that
DNA backbone damage increases as irradiation time of the TPP-doped CP dot
nanoparticles increases. Lanes 2 and 3 (Figure 4.1A) are control lanes indicating that the
plasmid (lane 2) is of high quality and that H2O2 alone (lane 3) does not damage DNA.
Lane 4 shows the DNA damage produced when Fe2+ reacts with H2O2 to generate •OH.
Lanes 5-8 show the extent of DNA damage upon irradiation of the TPP-doped CP dots
for 0, 50, 100, and 200 min, respectively, as seen by the increase in band intensity from
undamaged to damaged DNA upon increasing irradiation time. Preliminary results for
base damage experiments are seen in Figure 4.1B. Lane 2 is a control lane with DNA
digested by the Fpg enzyme, showing that the enzyme has no effect on undamaged DNA.
141

Lanes 3-6 show that base damage increases with increasing irradiation times of 0, 50,
100, and 200 min, respectively, of TPP-doped CP dots (Figure 4.1B).
8654321 7
undamaged DNA
damaged DNA
A654321
undamaged DNA
damaged DNA
B8654321 7
undamaged DNA
damaged DNA
A8654321 7
undamaged DNA
damaged DNA
8654321 7 8654321 7
undamaged DNA
damaged DNA
undamaged DNA
damaged DNA
A654321
undamaged DNA
damaged DNA
B654321
undamaged DNA
damaged DNA
654321 654321
undamaged DNA
damaged DNA
undamaged DNA
damaged DNA
B
Figure 4.1. Agarose gel image showing DNA backbone and base damage after irradiation of TPP-doped CP dot nanoparticles over time. (A) For DNA backbone damage, lanes: 1) 1 kb DNA ladder; 2) plasmid DNA (p); 3) p + H2O2 (50 µM); 4) p + Fe2+ (2 μM); 5-8) p + TPP-doped CP dot nanoparticles irradiated for 0, 50, 100, and 200 min, respectively. (B) For DNA base damage, lanes: 1) 1 kb DNA ladder; (2) p + Fpg enzyme; 3-6) lane 2 + TPP-doped CP dot nanoparticles irradiated for 0, 50, 100, and 200 min, respectively, prior to Fpg digestion.
Quantification of the normalized band intensities from the gel images are shown
as a bar graph in Figure 4.2. Figure 4.2A shows that non-irradiated TPP-doped CP dots
(lane 5) do not damage plasmid DNA. This is expected since photoexcitation of the
nanoparticles is required to generate the DNA-damaging singlet oxygen. Similarly,
irradiation for 50 min did not produce measurable DNA damage (Figure 4.2A, lane 6).
However, 100 min irradiation produced 50% DNA damage, with 70% DNA damage
occurring after 200 min (lanes 7 and 8, respectively).
Similar results were obtained for the DNA base damage experiments (Figure
4.2B), where non-irradiated TPP-doped CP dots produced negligible DNA damage (lane
3). Irradiation of TPP-doped CP dots for 50 min (Figure 4.2B, lane 4) also produced a
negligible amount of base damage indicating little production of singlet oxygen. As the
142

irradiation time increased to 100 and 200 min, base damage also increased to ~ 55% (lane
12) and ~75% (lane 13), respectively.
Figure 4.2. Bar graph showing the effect of TPP-doped CP dot nanoparticles on DNA backbone and base damage upon irradiation at different time intervals. (A) Lanes for DNA backbone damage: 2) plasmid DNA (p); 3) p + H2O2 (50 µM); 4) p + Fe2+ (2 μM) + H2O2; and 5-8) p + TPP-doped CP dot nanoparticles irradiated for 0, 50, 100, and 200 min, respectively. (B) Lanes for DNA base damage: 2) p + Fpg enzyme; and 3-6) lane 2 + TPP-doped CP dot nanoparticles irradiated for 0, 50, 100, and 200 min, respectively, prior to Fpg digestion.
0
20
40
60
80
100
2 3 4 5 6 7 8Lane
% D
NA
dam
age
\ undamaged DNAdamaged DNA
A
0
20
40
60
80
100
2 3 4 5 6Lane
% D
NA
dam
age
/ undamaged DNAdamaged DNA
B
0
20
40
60
80
100
2 3 4 5 6 7 8Lane
% D
NA
dam
age
\ undamaged DNAdamaged DNA
A
0
20
40
60
80
100
2 3 4 5 6 7 8Lane
% D
NA
dam
age
\ undamaged DNAdamaged DNA
A
0
20
40
60
80
100
2 3 4 5 6Lane
% D
NA
dam
age
/ undamaged DNAdamaged DNA
B
0
20
40
60
80
100
2 3 4 5 6Lane
% D
NA
dam
age
/ undamaged DNAdamaged DNA
B
As expected, singlet oxygen generated by TPP-doped CP dots produces both
backbone and base DNA damage after 50 min of light exposure. In addition, DNA
backbone and base damage increases with increased irradiation time, suggesting that
more singlet oxygen is continually generated during irradiation. Although these data are
preliminary, they suggest the TPP-doped CP dot nanoparticles developed by the McNeill
lab may be effective and efficient photosensitizers for PDT. To properly validate the use
of the TPP-doped CP dot nanoparticles for PDT, experiments using Fpg digestion should
be performed in triplicate to accurately quantify base damage produced from irradiation
of these particles. In addition, the Nth (endonuclease III) and 8-oxoG-DNA glycosylase
(OGG) enzymes can be used to further determine types of DNA base damage. The Nth
143

enzyme cleaves damaged pyrimidine bases such as thymine glycol, uracil glycol, and 6-
hydroxy-5,6-dihydrothimine.69,70 The OGG enzyme is specific for 8-oxoguanine.71 From
these base damage experiments, DNA damage at specific bases could be quantified and
compared, which would allow for further understanding of DNA damage mechanisms by
irradiated TPP-doped CP dot nanoparticles.
Determining hydrogen peroxide formation from PEG and PEG-TMS
Polyethylene glycols (PEGs) are water soluble synthetic polymers with many
applications in the pharmaceutical and biotechnological industries.54 They are used as
lubricants, stabilizers, cosolvents and as chemical agents for the PEGylation of proteins.54
Despite many benefits, PEG and its derivatives can produce low levels of peroxides
under various conditions.54,55 Since PEG-functionalized nanomaterials have potential use
in biological systems to increase nanoparticle solubility, nanotoxicity becomes a great
concern since peroxides can react with metal ions found in cells to generate damaging
•OH.58-60,68
Since nanoparticles are often functionalized with PEG, and PEG-TMS is used to
facilitate such functionalization, determination of peroxide formation from both PEG and
PEG-TMS groups was undertaken. To determine peroxide formation from solutions of
PEG (MW 950-1050) and PEG-TMS (MW= 460-590), the FOX assay was used. The
FOX method is an analytical technique widely used to measure peroxides based on the
peroxide oxidation of iron(II) to iron(III) ions, with subsequent binding of iron(III) to the
144

xylenol-orange dye.67,72,73 This results in a color change from orange to blue/purple,
which can be measured via UV-vis spectroscopy.67,72,73
To generate the calibration curve, various concentrations of H2O2 (0.01-100 μM)
were added to the FOX reagent, and upon appearance of the blue/purple color, the
absorbance at each peroxide concentration was taken from 540-650 nm to obtain the
wavelength at which the highest absorbance was achieved (λmax). The H2O2 calibration
curve (Figure 4.3) was fit with a best fit line as indicated (R2 = 0.982).
y = 0.008 x + 0.015R2 = 0.982
00.10.20.30.40.50.60.70.80.9
0 20 40 60 80 1
A5
93
[H2O2] μM00
Figure 4.3. Calibration curve of absorbance at 593 nm (A593) vs. hydrogen peroxide concentration as measured by the FOX assay.
The FOX assay was then used to measure H2O2 concentrations formed from both
PEG and PEG-TMS solutions incubated at 37 °C under light and dark conditions over a
one-week period. Aliquots were taken every 24 h, treated with the FOX reagent, and
measured via UV-vis. The H2O2 concentration was then obtained by measuring the
absorbance at 593 nm and calculating the concentration using the calibration curve.
145

Similar experiments were also performed at 80 °C since peroxide levels are reported to
increase as temperature increases.54
Figure 4.4 shows a graph of the concentration of peroxide formed by each sample
over several days. At 80 °C, PEG exposed to light and PEG-TMS in the dark produced
only trace amounts (< 0.1 μM) over the course of the week. PEG incubated at 80 °C in
the dark produced the highest concentration of H2O2 (~31 μM) after 6 days. For all other
samples besides PEG-TMS exposed to light at 80 °C, the highest concentration of H2O2
produced was 2-4 μM.
0
10
20
30
40
0 1 2 3 4 5 6 7 8time (days)
[H2O
2] ( μ
M)
PEG, light, 37 degPEG, dark, 37 degPEG, light, 80 degPEG, dark, 80 degPEG-TMS, light, 37 degPEG-TMS. dark, 37 degPEG-TMS, light, 80 degPEG-TMS, dark, 80 deg
Figure 4.4. Graph showing the amount of peroxide formed from PEG and PEG-TMS under light and dark conditions at 37 °C and 80 °C.
In this investigation, PEG-TMS incubated at 80 °C with exposure to light became
viscous with a pungent odor after 4 days, but showed no formation of peroxide after this
time (Figure 4.4). Upon addition of the FOX reagent, PEG-TMS in the dark at 80 °C
turned a magenta color instead of the blue/purple color observed for all other samples
with absorbance measured at λmax = 560 nm. Peroxide concentration for this sample
146

calculated from the calibration curve generated at 560 nm was found to be ~0.4 μM after
4 days.
The preliminary results from these experiments contradict similar studies
performed with PEG 1450 and PEG 20000. Kuman and Kalonia reported that both PEG
1450 and PEG 20000 produced high levels of peroxide at 40 °C after 6 days when stored
in ambient light (1.5 and 4.8 μΜ, respectively).54 Samples stored in the dark for 20 days
at room temperature (25 °C) showed elevated peroxide levels in both PEG 1450 and PEG
20000 (2.7 and 9.0 μM, respectively).54 The lower levels of peroxides formed in our
experiments may be due the low molecular weight PEG used (950-1050) significantly
shorter than the PEGs of higher molecular weights (1450 or 20000) used by Kuman and
Kalonia. In addition, differences in the experimental design such as lighting and storage
conditions may also contribute to the differences observed in peroxide formation.
A study using PEG 400 to enhance the solubility of drug formulations reported
that this PEG provided a highly oxidizing environment resulting in radical chain
degradation and two-electron nucleophilic reactions.74 These processes may explain the
viscous appearance of the PEG-TMS exposed to light at 80°C and the magenta color of
this sample in the FOX assay. In addition, water may play a role in the formation of
peroxides by PEG, as reports indicate that peroxide formation is related to the fraction of
water in solution, and therefore the amount of dissolved oxygen.54,75,76
Preliminary experiments using PEG and PEG-TMS indicate that under most
conditions peroxide (~2-4 μM) is formed under conditions of light, dark, and elevated
temperature, with the exception of PEG stored in the dark at 80°C. Peroxide
147
concentrations of 2-4 μM are much higher than the steady-state H2O2 concentration
calculated for unstressed E. coli cells (~20 nM). In addition, in vivo studies have shown
that peroxide concentrations of 1-3 μM result in cell death due to oxidative DNA
damage,58,59 indicating that peroxide generation by functionalized nanoparticles, even at
low concentrations, may be toxic to cells.
Iron association with silica and PEG-functionalized silica beads
PEG-functionalized nanoparticles may facilitate localization of metal ions on
their surface since they contain oxygen donor groups that can bind metals. Iron
localization on or near PEG is possible due to interactions between the positively charged
iron and the electron-rich ether oxygen atoms of PEG. The generation of peroxides either
in vivo or from the PEG functional groups can react with redox-active metals such as iron
to produce the DNA damaging hydroxyl radical.57,60,68 The ability of metal ions such as
iron to associate with functionalized nanoparticles is therefore of considerable relevance
to potential nanoparticle toxicity. Studies of PEG-functionalized and non-functionalized
silica microspheres (beads) were performed to determine whether iron can associate to
PEG-functionalized nanoparticles.
In collaboration with the McNeill group at Clemson University, silica
microspheres (0.3 μm) and PEG-functionalized silica microspheres were prepared for
analysis by agitation with HCl (1M), centrifugation, and washing with deionized water to
ensure the bead surface was metal-free. To determine whether iron associated with the
functionalized or non-functionalized silica beads, a calibration curve using various
148

concentrations of [Fe(EDTA)]2- (0-500 μM) was generated via ICP-MS measurements of
iron intensities (Figure 4.5). The calibration curve obtained was found to be linear within
the concentration range of 0-500 μM (R2 = 0.99).
y = 25798x + 1465.2R2 = 0.9991
020000400006000080000
100000120000140000160000
0 1 2 3 4 5
[Fe(EDTA)]2- (μM)
Inte
nsity
Figure 4.5. Calibration curve for iron intensity vs. [(Fe(EDTA)]2- concentrations (μM) as measured by ICP-MS.
To determine iron association, both PEGylated and non-functionalized silica
beads were treated with the indicated volumes of iron (50 μM) and centrifuged. The
isolated beads were then washed with EDTA to bind and remove any iron associated with
the beads, centrifuged, and the EDTA supernatant was collected for analysis. The iron
intensity of each EDTA wash was then measured using ICP-MS, and the concentration of
iron was determined from the calibration curve.
Figure 4.6 is a graph of bead-associated iron with and without PEG-
functionalization. For the non-functionalized silica beads, the concentration of associated
iron was the same (~1.17 ± 0.03 μM) regardless of the amount of iron used (50, 100, and
200 μL of 50 μM solution). However, iron has a greater association with PEG-
149

functionalized microspheres, with iron concentrations increasing to ~2.2 ± 0.2 μM (p =
0.003), 2.7 ± 0.2 μM (p = 0.002) and 5.0 ±1.0 μM (p = 0.005)at 50, 100, and 200 μL,
respectively.
0
1
2
3
4
5
6
0 50 100 150 200 250
vol. of 50 μM Fe2+ used (μL)
[Fe2+
] (μ
M)
beadsPEG-TMS
Figure 4.6. Graph showing the concentration of iron associated with PEGylated silica and unfunctionalized silica microspheres. All differences between beads and PEG-TMS are statistically significant (p ≤ 0.005). Error bars for PEG-TMS are smaller than the data points.
In biological systems, iron is known to generate reactive oxygen species that can
damage DNA and result in cell death.58,59 Therefore, the interaction of iron ions with
PEG-functionalized nanoparticles may be an important factor to consider as a source of
nanotoxicity. In these iron association experiments, PEG-functionalized beads associated
more iron (~2-4 μM) than with the non-functionalized beads. This amount of localized
iron is a significant fraction of non-protein-bound cellular iron concentrations (~10-30
μM).77 Gel electrophoresis experiments with plasmid DNA show that iron at similar
concentrations (2 μM) significantly damages DNA in the presence of H2O2.48-51
Combined with the observed peroxide generation, iron association to PEG-functionalized
150

nanoparticles may lead to formation of the damaging hydroxyl radical and significant
cellular damage in vivo.
These preliminary experiments highlight the importance of understanding
nanotoxicity if nanomaterials are to be used for biomedical applications. To fully
comprehend the effects of such toxicity on biological systems, further studies to evaluate
the formation of peroxides from functional groups used in nanotechnology or
nanomaterials are necessary. In addition, it is also important to determine the association
of other cellular metal ions such as iron and copper to functionalized nanoparticles since
the combination of peroxide formation and metal association in cells may lead to
oxidative DNA damage, cell death, and adverse health effects.
Conclusions
TPP-doped CP dot nanoparticles have a great potential for use as photosensitizers
due to their high molar absorptivity (107-109 M-1 cm-1) and production of high yields of
singlet oxygen upon irradiation.37 Studies also show that the generated reactive oxygen
species produce both DNA backbone and base damage by irradiation in a time-dependent
manner, suggesting that TPP-doped CP dot nanoparticles may be effective
photosensitizers to be used in PDT. With the widespread use of nanomaterials for
medical purposes, the toxicity of these materials becomes a significant concern.
Preliminary results indicate that functionalization of nanoparticles with PEG may be
toxic to cells due PEG’s ability to form peroxides and associate iron. Iron can react with
peroxide to generate •OH that damages cellular components such as DNA, lipids, and
151

proteins and may cause significant nanotoxicity. Further studies are therefore warranted
to further understand the effects of metal localization and peroxide formation on PEG-
functionalized nanoparticles in biological systems.
Materials and Methods
Materials
NaCl (99.999% to avoid trace metal contamination), glacial acetic acid, NaOH,
30% H2O2 solution, FeSO4•7H2O, and bromophenol blue were purchased from Alpha
Aesar. Glucose, agarose, and ampicillin were from EMD Chemicals. TRIS hydrochloride
and sodium EDTA were from J.T. Baker. HCl was from VWR Scientific; ethidium
bromide was from Lancaster Synthesis, Inc. Xylene cyanol, peptone, and yeast extract
was from EM Science. Butylated hydroxytoluene, xylenol orange, HCl (≥ 99%),
ammonium hydroxide, H2O2 (30%), NaCl (99.999%), methanol (≥ 99%), polyethylene
glycol (PEG, MW 950-1050) were purchased from Sigma-Aldrich. H2SO4 was from
Fisher Scientific. Silica microspheres (0.3 μm) were from Polysciences, Inc. and 2-
[methoxy(polyethyleneoxy)propyl] trimethoxy silane (PEG-TMS, 460-590) from Gelest,
Inc. Concentrated plasmid DNA in TE buffer (4 mg/mL) was purchased from Aldevron,
Fpg enzyme, BSA buffer (10×) and NEB buffer were from New England BioLabs, Inc.
Water was purified using the NANOpure DIamond water deionization system (Barnstead
International, Dubuque, IA). Iron-free microcentrifuge tubes, bottles and glass vials were
prepared by washing the tubes in 1 M HCl prior to use and rinsing thoroughly with
152

ddH2O. MES buffer was treated with Chelex resin for 24 h and then filtered into an iron-
free bottle. π-Conjugated polymer nanoparticles (CP dots) for gel experiments were
obtained from the McNeill group at Clemson University.
Purification of plasmid DNA
Concentrated plasmid DNA (300 μL of 4 mg/mL) purchased from Aldevron was
dialyzed against 130 mM NaCl for 24 h at 4 oC. The resulting DNA concentration was
found using UV-vis measurements at A260 (1 A260 = 50 ng/μL). Purity of plasmid DNA
was determined via gel electrophoresis of a digested sample, and all absorbance ratios
were within acceptable limits (A250/260 < 0.95, and A260/280 > 1.8).
DNA backbone and base damage gel electrophoresis experiments with TPP-doped CP
dot nanoparticles
For control lanes, 0.1 pmol plasmid DNA, 130 mM NaCl (99.999% to avoid
metal contamination) and 2 μM FeSO4•7H2O maintained at pH 6 with MES buffer (10
mM) were combined and allowed to stand for 5 min at room temperature. H2O2 (50 μM)
was then added and incubated for 30 min. EDTA solution (50 μM) was added after this
time for a total volume of 10 μL. For experimental lanes, plasmid DNA (0.1 pmol) was
added to TPP-doped CP dot nanoparticles to a final volume of 300 μL. A fluorescence
spectrometer (Quantamaster, PTI, Inc.) was used to irradiate the nanoparticles at a
wavelength of 377 nm. Aliquots (10 μL) were taken at various time intervals after
irradiation (0, 50, 100, and 200 min) to determine DNA damage by the TPP-doped CP
153

dot nanoparticles. DNA was separated on 1% agarose gels via electrophoresis, stained
with ethidium bromide for 30 min, and imaged on an UVIproDBT-8000 gel imager
(UVITec, Cambridge, UK). Quantification of undamaged and damaged DNA was
performed using the UviPro software. A similar procedure was performed to quantify the
amount of DNA base damage by adding the Fpg enzyme to aliquots (10 μL) of doped CP
dots after irradiation for 50, 100, and 200 min. The Fpg enzyme cleaves the DNA
backbone at damaged bases such as 8-oxoguanine, 5-hydroxy-cytosine 8-oxoadenine, and
5-hydroxy-uracil.70,78 For these experiments, 0.5 μL of a 10× BSA buffer (2 μL)/NEB
buffer 1 (8 μL) solution, Fpg enzyme (0.5 μL) and plasmid DNA irradiation for the
indicated time periods were incubated for 1 h at 37 °C. After this time, gel
electrophoresis was performed.
H2O2 calibration curves using the FOX assay
FOX reagent was prepared by dissolving xylenol orange (7.60 mg), FeSO4•7H2O
(6.95 mg), butylated hydroxytoluene (92.14 mg) and 25 mM H2SO4 in a methanol : water
(9:1 v/v) solution. The reagent was kept refrigerated until used. H2O2 solutions (0-100
μM) were prepared in ddH2O using MES buffer (90 mM) to maintain pH 6. For the
calibration curve, an aliquot of 100 μL of H2O2 solution was mixed with 500 μL of the
FOX reagent and allowed to stand at room temperature for 30 min. After this time the
absorbance of each sample was measured from 540-600 nm using a Shimadzu UV-3101
PC spectrophotometer. The calibration curves for A593 vs. [H2O2] (μM) and A560 vs.
[H2O2] (μM) were fit with a best-fit line. Determination of a calibration curve at 560 nm
154

was necessary to calculate the H2O2 concentration of PEG-TMS exposed to light at 80°C,
since this sample turned magenta (λmax = 560 nm) instead of the blue/purple color
observed for the other samples (λmax = 593 nm). Averages and standard deviations were
determined from triplicate trials with the exception of the DNA base damage
experiments.
H2O2 formation from PEG and PEG-TMS
PEG (250 mg) and PEG-TMS (250 mg) were dissolved in ddH2O and maintained
at pH 6 using MES buffer (90 mM) to a final volume of 4 mL in iron-free glass vials.
Samples of each compound were tested for formation of H2O2 at various temperatures in
both the absence and presence of light. Temperatures of 37 °C and 80 °C were
maintained using water baths covered with plastic wrap to ensure light permeability. For
experiments conducted in the dark, vials for each sample were covered with foil to ensure
the absence of light. Aliquots (100 μL) of each sample were taken every 24 h for 8 days
and mixed with FOX reagent (500 μL) in 1.5 mL acid-washed microcentrifuge tubes.
Upon standing at room temperature for 30 min, the absorbance of each sample was
measured from 540-600 nm using a Shimadzu UV-3101 PC spectrophotometer.67,72,73
The H2O2 concentration for samples that turned blue/purple upon addition of the FOX
reagent was calculated from the H2O2 calibration curve at 593 nm. The H2O2
concentration for PEG-TMS exposed to light at 80 °C was calculated from the calibration
curve at 560 nm since it turned magenta upon addition of the FOX reagent.
155

Iron calibration curve from ICP-MS measurements
[Fe(EDTA)]2- solutions (10 mL, 50 μM-500 μM) were prepared and maintained
at pH 6 using MES buffer (90 mM). Iron intensity of each sample was measured using
inductively coupled plasma optical emission spectroscopy (ICP-OES, JY Horiba Ultima
2, Longjumeau, France) and a calibration curve was then obtained by fitting a best fin
line through the experimental data.
Preparation of silica and PEGylated silica beads
The surface of 0.30 μm silica microspheres (beads) was prepared by addition of 1
M HCl with agitation, centrifugation at 13,500 rpm, washing with deionized water. The
PEG-silane encapsulation of silica microspheres was performed as follows: 1 mL of a
10% aqueous dispersion of silica microspheres was added to a 4:1 mixture of methanol
and ammonium hydroxide (28 wt % ammonia). After mixing for 5 min, PEG-TMS (200
μL) was added to yield a total volume of 11.2 mL and stirred overnight at room
temperature. The resulting suspension was then centrifuged and washed with deionized
water. Both silica and PEGylated beads were prepared and obtained from the McNeill
group.
Iron association with silica and PEGylated beads
Various volumes (0, 50, 100, and 200 μL) of FeSO4•7H2O (50 μM) maintained at
pH 6 with MES buffer (90 mM) was added to silica beads (50 μL), vortex mixed for 2
156

min, and centrifuged for 5 min at 13,000 rpm. The supernatant was discarded and the
procedure was repeated. EDTA solution (500 μL of 400 μM) maintained at pH 6 with
MES buffer (90 mM) was then added to the beads and centrifuged as above. The
supernatant was saved and the procedure repeated to obtain a total wash volume of 1 mL.
Iron content of this solution was then measured using ICP-MS, and the iron concentration
was determined from the iron calibration curve. A similar procedure was performed to
determine the concentration of iron associated with silica beads using PEG-functionalized
beads instead of the silica beads.
Tabular data for gel electrophoresis experiments
Tabulated values for the percentages of closed, circular (undamaged) and nicked
DNA (damaged) bands observed in the DNA backbone and base damage gel
electrophoresis experiments are given in Tables 4.1 and 4.2. Tabulated values for DNA
backbone damage are the average of three experimental trials with the indicated
calculated standard deviation and p-value. Tabulated values for iron association with
silica beads and PEG-TMS are given in Tables 4.3 and 4.4. Tabulated values for the iron
association experiments are from one trial with the indicated standard deviation
calculated from the error obtained from the [Fe(EDTA)]2- calibration curve.
157

Table 4.1. Tabulation for electrophoresis results for DNA backbone damage upon irradiation of TPP-doped CP dot nanoparticles. Lane Content % Circular DNA % Nicked DNA p-value
2 plasmid DNA (p) 96.7 ± 0.2 3.3 -
3 p + H2O2 93.5 ± 2.5 6.5 -
4 p + H2O2 + Fe2+ 2.5 ± 2.3 97.5 -
5 p + CP dot (irr for 0 min) 97.5 ± 0.09 2.5 <0.0001
6 p + CP dot (irr for 50 min) 99.9 ± 0.08 0.1 <0.0001
7 p + CP dot (irr for 100 min) 50.0 ± 0.5 50.0 <0.0001
8 p + CP dot (irr for 200 min) 31.0 ± 0.5 69.0 <0.0001 Table 4.2. Tabulation for electrophoresis results for DNA base damage upon irradiation of TPP-doped CP dot nanoparticles. Lane Content % Circular DNA % Nicked DNA
2 plasmid (p) + Fpg 96.0 4.0
3 p + Fpg + CP dot (irr for 0 min) 99.3 0.7
4 p + Fpg + CP dot (irr for 50 min) 98.0 2.0
5 p + Fpg + CP dot (irr for 100 min) 47.0 53
6 p + Fpg + CP dot (irr for 200 min) 28.0 72
158

Table 4.3. Tabulation for iron concentration associated to silica beads as determined from the [Fe(EDTA)]2- calibration curve. Volume of 50 μM Fe2+ used
(μL) Concentration of Fe2+ associated
to beads (μM) p-value
50 1.17 ± 0.03 0.0002
100 1.24 ±0.03 0.0002
200 1.12 ± 0.03 0.0002
Table 4.4. Tabulation for iron concentration associated to PEG-TMS as determined from the [Fe(EDTA)]2- calibration curve. Volume of 50 μM Fe2+ used
(μL) Concentration of Fe2+ associated to
PEG-TMS (μM) p-value
50 2.16 ± 0.22 0.003
100 2.70 ±0.19 0.002
200 5.00 ± 0.60 0.005
References
(1) Dolmans, D. E.; Fukumura, D.; Jain, R. K. Nat. Rev. Cancer 2003, 3, 380-387.
(2) Dougherty, T. J.; Gomer, C. J.; Henderson, B. W.; Jori, G.; Kessel, D.; Korbelik,
M.; Moan, J.; Peng, Q. J. Natl. Cancer Inst. 1998, 90, 889-905.
(3) Wang, S.; Gao, R.; Zhou, F.; Selke, M. J. Mater. Chem. 2004, 14, 487-493.
(4) Pass, H. I. J. Natl. Cancer Inst. 1993, 85, 443-456.
(5) Henderson, B. W.; Dougherty, T. J. Photochem. Photobiol. 1992, 55, 145-157.
(6) Wilkinson, F. H., W. P.; Ross, A. B. J. Phys. Chem. Ref. Data 1993, 22, 113-262.
159
(7) Davies, M. J. Biochem. Biophys. Res. Commun. 2003, 305, 761-770.
(8) Schweitzer, C.; Schmidt, R. Chem. Rev. 2003, 103, 1685-1757.
(9) Arnbjerg, J.; Johnsen, M.; Nielsen, C. B.; Jorgensen, M.; Ogilby, P. R. J. Phys.
Chem. A 2007, 111, 4573-4583.
(10) Devasagayam, T. P.; Steenken, S.; Obendorf, M. S.; Schulz, W. A.; Sies, H.
Biochemistry 1991, 30, 6283-6289.
(11) Ravanat, J.-L.; Saint-Pierre, C.; Di Mascio, P.; Martinez, G. R.; Medeiros, M. H.
G.; Cadet, J. Helv. Chim. Acta. 2001, 84, 3702-3709.
(12) Floyd, R. A.; Schneider, J. E.; Watson, J. J.; Maildt, M. L. Free Radic. Biol. Med.
1990, 9, 76-83.
(13) Ravanat, J.-L.; Cadet, J. Chem. Res. Toxicol. 1995, 8, 379-388.
(14) Lutgerink, J. T.; van den Akker, E.; Smeets, I.; Pachen, D.; van Dijk, P.; Aubry, J.
M.; Joenje, H.; Lafleur, M. V.; Retel, J. Mutat. Res. 1992, 275, 377-386.
(15) Scurlock, R. D.; Wang, B.; Ogilby, P. R. J. Am. Chem. Soc. 1996, 118, 388-392.
(16) Epe, B. Chem. Biol. Interact. 1992, 80, 239-260.
(17) Piette, J. Photochem. Photobiol. B 1990, 4, 335-339.
(18) Ravanat, J.-L.; Di Mascio, P.; Martinez, G. R.; Medeiros, M. H. G.; Cadet, J. J.
Biol. Chem. 2000, 275, 40601-40604.
(19) Boiteux, S. J. Photochem. Photobiol. B 1993, 19, 87-96.
(20) Melvin, T.; Cummiffe, S. M. T.; O'Neill, P.; Parker, A. W.; Roldan-Arjona, T.
Nucl. Acids Res. 1998, 26, 4935-4942.
160

(21) Michaeli, A.; Feitelson, J. Photochem. Photobiol. 1997, 65, 309-315.
(22) Cadet, J.; Berger, M.; Douki, T.; Morin, B.; Raoul, S.; Ravanat, J. L.; Spinelli, S.
Biol. Chem. 1997, 378, 1275-1286.
(23) Moan, J.; Berg, K. Photochem. Photobiol. 1991, 53, 549-553.
(24) Peng, Q.; Moan, J.; Nesland, J. M. Ultrastruct. Pathol. 1996, 20, 109-129.
(25) Redmond, R. W.; Gamlin, J. N. Photochem. Photobiol. 1999, 70, 391-475.
(26) Gao, R.; Ho, D. G.; Hernandez, B.; Selke, M.; Murphy, D.; Djurovich, P. I.;
Thompson, M. E. J. Am. Chem. Soc. 2002, 124, 14828-14829.
(27) Kessel, D.; Luo, Y. J. Photochem. Photobiol. B 1998, 42, 89-95.
(28) Kessel, D.; Woodburn, K.; Gomer, C. J.; Jagerovic, N.; Smith, K. M. J.
Photochem. Photobiol. B 1995, 28, 13-18.
(29) Kessel, D.; Woodburn, K.; Henderson, B. W.; Chang, C. K. Photochem.
Photobiol. 1995, 62, 875-881.
(30) Gao, D.; Xu, H.; Philbert, M. A.; Kopelman, R. Angew. Chem. Int. Ed. Engl.
2007, 46, 2224-2227.
(31) Chen, C. Y.; Tian, Y.; Cheng, Y. J.; Young, A. C.; Ka, J. W.; Jen, A. K. J. Am.
Chem. Soc. 2007, 129, 7220-7221.
(32) Roy, I.; Ohulchanskyy, T. Y.; Pudavar, H. E.; Bergey, E. J.; Oseroff, A. R.;
Morgan, J.; Dougherty, T. J.; Prasad, P. N. J. Am. Chem. Soc. 2003, 125, 7860-
7865.
161

(33) Kim, S.; Ohulchanskyy, T. Y.; Pudavar, H. E.; Pandey, R. K.; Prasad, P. N. J. Am.
Chem. Soc. 2007, 129, 2669-2675.
(34) McCarthy, J. R.; Perez, J. M.; Bruckner, C.; Weissleder, R. Nano Lett. 2005, 5,
2552-2556.
(35) Samia, A. C. S.; Chen, X. B.; Burda, C. J. Am. Chem. Soc. 2003, 125, 15736-
15737.
(36) Gao, D.; Agayan, R. R.; Xu, H.; Philbert, M. A.; Kopelman, R. Nano Lett. 2006,
6, 2383-2386.
(37) Grimland, J. L.; Wu, C.; Ramoutar, R. R.; Aristizabal, K.; Brumaghim, J.;
McNeill, J. 2009, in preparation.
(38) DeRosa, M. C.; Crutchley, R. J. Coord. Chem. Rev. 2002, 234, 351-371.
(39) Zeitouni, N. C.; Oseroff, A. R.; Shieh, S. Mol. Immunol. 2003, 39, 1133-1136.
(40) Johnson, B. F. G. Coord. Chem. Rev. 1999, 190-192, 1269-1285.
(41) Fedorovich, R. D.; Naumovets, A. G.; Tomchuk, P. M. Phys. Rep. 2000, 328, 73-
179.
(42) Trinsdale, T. Chem. Mater. 2001, 13, 3843-3858.
(43) Brigger, I.; Dubernet, C.; Couvreur, P. Adv. Drug Del. Rev. 2002, 54, 631-651.
(44) Panyam, J.; Labhasetwar, V. Adv. Drug Deliv. Rev. 2003, 55, 329-347.
(45) Tibbe, A. G.; de Grooth, B. G.; Greve, J.; Liberti, P. A.; Dolan, G. J.; Terstappen,
L. W. Nat. Biotechnol. 1999, 17, 1210-1213.
162
(46) Wu, C. F.; Peng, H. S.; Jiang, Y. F.; McNeill, J. J. Phys. Chem. B 2006, 110,
14148-14154.
(47) Szymanski, C. F.; Wu, C.; Hooper, J.; Salazar, M. A.; Perdomo, A.; Dukes, A.;
McNeill, J. J. Phys. Chem. B 2005, 109, 8543-8546.
(48) Ramoutar, R. R.; Brumaghim, J. Main Group Chem. 2007, 6, 143-153.
(49) Ramoutar, R. R.; Brumaghim, J. L. J. Inorg. Biochem. 2007, 101, 1028-1035.
(50) Battin, E. E.; Brumaghim, J. J. Biol. Chem. 2008, 102, 2036-2042.
(51) Perron, N. R.; Brumaghim, J. Inorg. Chem. 2008, 47, 6153-6161.
(52) Nowack, B.; Bucheli, T. D. Environ. Pollut. 2007, 150, 5-22.
(53) Carot, C.; Robert, P.; Idee, J.-M.; Port, M. Adv. Drug Del. Rev. 2006, 58, 1471-
1504.
(54) Kumar, V.; Kalonia, D. S. AAPS Pharm. Sci. Tech. 2006, 7, E1-E7.
(55) Ha, E.; Wang, W.; Wang, Y. J. J. Pharm. Sci. 2002, 91, 2252-2264.
(56) Joo, H.; Yoo, Y. J.; Ryu, D. Y. Enzyme Microb. Technol. 1996, 19, 50-56.
(57) Mello-Filho, A. C.; Meneghini, R. Mutat. Res. 1991, 251, 109-113.
(58) Imlay, J. A.; Linn, S. Science 1988, 240, 1302-1309.
(59) Imlay, J. A.; Chin, S. M.; Linn, S. Science 1988, 240, 640-642.
(60) Henle, E. S.; Linn, S. J. Biol. Chem. 1997, 272, 19095-19098.
163

(61) Yamakoshi, Y.; Umezawa, N.; Ryu, A.; Arakane, K.; Miyata, N.; Goda, Y.;
Masumizu, T.; Nagano, T. J. Am. Chem. Soc. 2003, 125, 12803-12809.
(62) Halliwell, B. Drugs and Aging 2001, 18, 685-716.
(63) Hoffmann, M. E.; Mello-Filho, A. C.; Meneghini, R. Biochem. Biophys. Acta
1984, 234-238.
(64) Singal, P. K.; Khaper, N.; Palace, V.; Kumar, D., 40, 426-32. Cardiovasc. Res.
1998, 40, 426-432.
(65) Stewart, M. S.; Spallholz, J. E.; Neldner, K. H.; Pence, B. C. Free Radic. Biol.
Med. 1999, 26, 42-48.
(66) Wu, C.; Szymanski, C.; Cain, Z.; McNeill, J. J. Am. Chem. Soc. 2007, 12904-
12905.
(67) Cho, Y. S.; Kim, H. S.; Kim, C. H.; Cheon, H. G. Anal. Biochem. 2006, 351, 62-
68.
(68) Henle, E. S.; Zhengxu, H.; Tang, N.; Rai, P.; Luo, Y.; Linn, S. J. Biol. Chem.
1999, 274, 962-971.
(69) Dizdaroglu, M.; Laval, J.; Boiteux, S. Biochemistry 1993, 32, 12105-12111.
(70) Hatahet, Z.; Kow, Y. W.; Purmal, A. A.; Cunningham, R. P.; Wallace, S. S. J.
Biol. Chem. 1994, 269, 18814-18820.
(71) Hazra, T. K.; Izumi, T.; Maidt, L.; Floyd, R. A.; Mitra, S. Nucleic Acids Res.
1998, 26, 5116-5122.
(72) DeLong, J. M.; Prange, R. K.; Hodges, D. M.; Forney, C. F.; Bishop, M. C.;
Quilliam, M. J. Agric. Food Chem. 2002, 50, 248-254.
164

(73) Jansson, P. J.; Lindqvist, C.; Nordstrom, T. Free Radic. Res. 2005, 39, 1233-
1239.
(74) Wasylaschuk, W.; Harmon, P. A.; Wagner, G.; Harman, A. B.; Templeton, A. C.;
Xu, H.; Reed, R. A. J. Pharma. Sci. 2007, 96, 106-116.
(75) Donbrow, M.; Azaz, E.; Pillersdorf, A. J. Pharm. Sci. 1978, 67, 1676-1681.
(76) McGinity, J. W.; Patel, T. R.; Naqvi, A. H.; Hill, J. A. Drug Dev. Commun. 1976,
2, 505-519.
(77) Woodmansee, A. N.; Imlay, J. A. Methods Enzymol. 2002, 349, 3-9.
(78) Tchou, J.; Bodepudi, V.; Shibutani, S.; Antoshechkin, I.; Miller, J.; Grollman, A.
P.; Johnson, F. J. Biol. Chem. 1994, 269, 15318-15324.
165

CHAPTER FIVE
INTERACTIONS OF CAFFEINE WITH POLYPHENOLS AND THE ABILITY OF
PEACH ANTHOCYNANINS TO PREVENT OXIDATIVE DNA DAMAGE
Introduction
Reactive oxygen species (ROS) such as the hydroxyl radical (•OH) and hydrogen
peroxide (H2O2) are the main cause of cellular oxidative stress, damaging DNA, lipids,
and proteins.1,2 Iron-generated hydroxyl radical is the main source of cell death in both
prokaryotes and eukaryotes, including humans.3-5 DNA-damaging •OH is produced via
the Fenton reaction when H2O2 generated from cellular respiration oxidizes Fe2+ to Fe3+
(Reaction 1).
Fe2+ + H2O2 → Fe3+ + OH- + •OH (1)
The production of •OH becomes catalytic in vivo when Fe3+ is reduced back to
Fe2+ by cellular reductants such as reduced nicotinamide adenine dinucleotide (NADH).6
Oxidative DNA damage results in cellular mutations and death, causing several
conditions including aging,7 cancer,8 Alzheimer’s and Parkinson diseases,9 and
arteriosclerosis.10,11 Therefore, prevention of DNA damage is important for both the
treatment and prevention of these diseases, and antioxidants have been widely studied for
such uses.
Polyphenols are compounds found in a variety of foods and beverages such as
fruits, vegetables, tea, coffee, chocolates, and red wine.12-15 These compounds have been
widely studied for their antioxidant properties, and people have an average total dietary
166
intake of ~1 g/d, a value about 10 times higher than other commonly studied antioxidants
such as vitamin C.12-17 Due to their antioxidant properties, polyphenols have several other
health benefits, such as the prevention of cardiovascular diseases, osteoporosis, cancer,
and neurodegenerative diseases.18
Polyphenols constitute a diverse group of compounds categorized into several
classes, including anthocyanins, catechins, flavonoids, flavones, and flavanones.18,19 Of
the many classes, flavonoids and catechins have been widely studied for their antioxidant
properties. Catechins are an abundant group of polyphenols primarily found in green
tea.19 Green tea consumption is most popular in Asian diet and has been associated with
many biological activities, including induction of cell cycle arrest and apoptosis,
alteration of cell signaling, inhibition of proliferation and angiogenesis, and more
recently, weight loss.20-22
Major green tea catechins include epicatechin (EC), epigallocatechin (EGC), and
epigallocatechin gallate (EGCG). EGCG (Figure 6.1) is the major antioxidant polyphenol
in green tea and constitutes 40% of the total catechin content.20 The antioxidant ability of
EGCG has been attributed to its radical scavenging and iron chelating abilities.20,23
Because polyphenols are such an integral part of the human diet, it is important to
understand their biological functions and antioxidant activity. Gel electrophoresis
experiments used to investigate the ability of polyphenols to inhibit DNA damage from
the Fenton reaction show that EGCG is a potent antioxidant with an IC50 (inhibitory
concentration, the polyphenol concentration required to inhibit 50% DNA damage) of 1.1
167

± 0.01 μM, comparable to physiological plasma concentrations (~1 μM) after one cup of
green tea.18,24,25
N
N N
N
O
O CH3
CH3
H3C
Caffeine
OH
OH
OH
OH
OH
GallolCatechol
Epigallocatechin-3-gallate (EGCG)
O
O
O
OH
OHOH
OH
OH
OH
HO
OH
C
B
A
Quercetin (Q)
O
OH
OH
OH
OOH
HO
A C
B
Figure 5.1. Structures of gallol, catechol, quercetin (Q), and compounds found in green tea: caffeine and epigallocatechin gallate (EGCG).
Flavonoids are ubiquitous to plants and are found in high quantities in fruits,
vegetables, olive oil, red wine, and chocolate.19,26 The main flavonoid found in the
average Western diet is quercetin (Q, Figure 6.1), and humans have an average dietary
intake of 16 mg/d.26,27 Quercetin inhibits lipid peroxidation in the retina, oxidative stress
in cutaneous tissue-associated cell types, and hydrogen peroxide-induced cell death.28
Quercetin is also an effective antioxidant, inhibiting iron-mediated DNA damage with an
IC50 of 10.4 ± 0.2 μM.18,25 Experiments performed by Sestili et al. show that quercetin
168

prevents cell death from t-butyl hydroperoxide (tB-OOH) with an IC50 of 12.7 ± 0.9 μM,
and reduces nuclear DNA single strand breaks with an IC50 of 2.7 ± 0.3 μM.28
In addition to polyphenols, caffeine (1,3,7-trimethylxanthine; Figure 6.1) is
another major component of green tea, coffee, and chocolate.29-31 The caffeine content in
green tea is approximately 2-4%, whereas the polyphenol content is typically 10-30%.32
Pharmacokinetic studies performed in adults indicate that caffeine is rapidly absorbed
and eliminated from the body with a half life of 5-6 h.29,33,34 Serum levels of caffeine are
between 39-46 μM 1-2 h after consumption of 300 mg caffeine (5 mg/kg adult body
weight).29,35,36 In the US, the average daily caffeine intake from coffee by adults is
estimated to be 2.4 mg/kg body weight and 5.3 mg/kg for heavier consumers, indicating
that serum levels of caffeine rarely exceed 50 μM.29,37
Caffeine is widely studied for its physiological effects on human health, mainly
focusing on behavior or mood. It is also a diuretic and weak bronchodilator, and more
recently, high intakes of caffeine (> 300 mg/d) have been associated with low birth
weight and miscarriage in pregnant women.38 Caffeine also protects against mouse skin
carcinogenesis induced by chemical agents in cigarette smoke, as well as glandular
stomach carcinogenesis from lipid peroxidation.29,39,40 While the mechanism of this
anticarcinogenic effect of caffeine is uncertain, much interest lies in its role as a possible
antioxidant.
Studies have shown that caffeine scavenges iron-generated hydroxyl radical, and
also inhibits lipid peroxidation of rat liver microsomes in small doses.29,41,42 The ability of
caffeine to scavenge iron-generated hydroxyl radical was measured using electron
169

paramagnetic resonance (EPR) and found to be concentration dependent, with optimal
scavenging at 0.16 M and no activity at concentrations less than 0.02 M.29,41,42 These
caffeine concentrations are much higher than physiological serum concentrations, and
experiments performed on caffeine by the oxygen-radical absorbance capacity (ORAC)
assay indicate that at physiologically relevant concentrations (40 μM), this compound has
no antioxidant activity.29 Experiments with low density lipoprotein (LDL) lipid oxidation
also indicated that caffeine did not protect LDLs from peroxidation at physiological
concentrations. However, caffeine metabolites, 1-methylxanthine and 1-methyluric acid,
were found to have high antioxidant abilities and were able to prevent LDL oxidation at
biologically relevant concentrations (40 μM).29
Interestingly, polyphenols found in black tea and coffee can form π−stacked
complexes with caffeine.43-47 The proposed B ring binding site (Figure 6.1) and the
affinity of catechins for caffeine binding were based on the 1H-NMR chemical shifts of
the protons from gallol or catechol groups upon titrations with caffeine.43,48 Based on
these 1H-NMR titrations, Hayashi et al. showed that EGCG, which contains two gallol
substituents, forms more stable complexes with caffeine than catechins without gallol
groups, and has a binding constant with caffeine of 90 ± 2% M-1.43 Complexation of
polyphenols with caffeine is an interesting phenomenon, and very little has been done to
investigate the biological activities of such π-stacking interactions. Both polyphenol
compounds and caffeine are antioxidants individually, but it is not known how this π-
stacking behavior would affect this antioxidant activity in combination.
170

In addition to the ability of catechin polyphenols to interact with caffeine, studies
have shown that the complex formed between quercetin and transition metals such as
Cu2+ can bind DNA via intercalation.49 Several studies indicate that the catechol
functionalization of the B ring of quercetin (Figure 6.1) is important for Cu2+
chelation.49-53 A separate study showed a weak interaction between quercetin and DNA,
and DNA damage occurring upon addition of Cu2+ to quercetin-DNA solutions.54
Spectrophometric and electrochemical experiments indicate that this pro-oxidant effect of
quercetin is caused by the intercalation of the quercetin-Cu2+ complex into DNA,
resulting in DNA strand breakage.49 This pro-oxidant behavior is consistent with
additional investigations where flavonoids were found to damage DNA and induce
mutagenesis in the presence of transition metals. In the latter case, reduction of transition
metals by flavonoids resulted in the formation of the DNA-damaging hydroxyl
radical.49,55-58
In this chapter, the effects of caffeine on the antioxidant activity of EGCG and
quercetin are investigated using DNA gel electrophoresis. In addition, the ability of
polyphenol compounds in various peach cultivars with different antioxidant contents is
investigated for their ability to prevent iron-mediated DNA damage.
171

Results and Discussion
Iron-mediated DNA damage inhibition by caffeine, epigallocatechin-3-gallate (EGCG),
and quercetin (Q)
The antioxidant activities of EGCG and quercetin have been previously studied
via gel electrophoresis for their ability to prevent iron-mediated oxidative DNA
damage.18 EGCG was found to be a more potent antioxidant than quercetin with IC50
values of 1.1 ± 0.01 μM and 10.4 ± 0.2 μM, respectively.18,25
1 1312111098765432 2191817161514 0[caffeine]
undamaged DNAdamaged DNA
1 1312111098765432 21918171615141 1312 13121110 111098765432 21918 2019181716 17161514 1514 00[caffeine][caffeine]
undamaged DNAdamaged DNAundamaged DNAdamaged DNA
Figure 5.2. Gel electrophoresis image of caffeine under Fenton reaction conditions. Lane 1: 1 kb ladder, lane 2: plasmid only (p), lane 3: p + H2O2 (50 μM), lane 4: p + H2O2 (50 μM) + caffeine (500 μM), lane 5: p + H2O2 (50 μM) + Fe2+ (2 μM), lanes 6-20: lane 5 + increasing concentrations of caffeine (0.0005, 0.001, 0.01, 0.02, 0.05, 0.2, 2, 4, 10, 50, 100, 200, 300, 400 and 500 μM, respectively).
Similar DNA damage experiments were performed with caffeine alone. The gel in
Figure 5.2 shows that Fe2+/H2O2 (lane 5) damages a high percentage of DNA (~93%),
and caffeine (lanes 6-20) has no significant antioxidant activity against iron-mediated
oxidative DNA damage at concentrations up to 500 μM. Because studies have shown that
polyphenols such as catechins form π-stacked complexes with caffeine, similar gel
electrophoresis experiments were also performed with EGCG or Q and caffeine to
determine the effects of caffeine on the antioxidant activity of EGCG and Q.
172

In the NMR study by Hayashi et al., the stoichiometric ratio for polyphenol
compounds π-stacking with caffeine was determined to be 1:1.43 Therefore, in the gel
experiments performed, the concentration of caffeine in each lane was equal to the
concentration of EGCG. Also, since iron precipitates at pH > 6.5, MES buffer (10 mM)
was added in each lane to maintain pH 6. Figure 6.3 is a gel showing both undamaged
(circular) and damaged (nicked) DNA at various concentrations of EGCG/caffeine
(0.0005-100 μM). Without iron, EGCG/caffeine and hydrogen peroxide have no effect on
DNA damage (lane 4). Increasing concentrations of EGCG and caffeine in the presence
of Fe2+/H2O2 (lanes 6-16) showed an increase in undamaged DNA, with 64% DNA
damage inhibition at 2 μM (Figure 6.3, lane 12). At the highest EGCG/caffeine
concentration tested (100 μΜ), 100% DNA damage was inhibited (Figure 6.3, lane 16).
4321 8 9765 11 161514131210[EGCG/caffeine]
damaged DNAundamaged DNA
4321 8 9765 11 1615141312104321 8 9765 11 161514131210[EGCG/caffeine]
damaged DNAundamaged DNAdamaged DNAundamaged DNA
Figure 5.3. Gel electrophoresis image of (-)-epigallocatechin-3-gallate (EGCG) and caffeine under Fenton reaction conditions. Lane 1: 1 kb ladder, lane 2: plasmid only (p), lane 3: p + H2O2 (50 μM), lane 4: p + H2O2 (50 μM) + EGCG/caffeine (500 μM), lane 5: p + H2O2 (50 μM) + Fe2+ (2 μM), lanes 6-16: lane 5 + increasing concentrations of EGCG and caffeine (0.0005, 0.001, 0.01, 0.02, 0.05, 0.2, 2, 4, 10, 50, 100 μM, respectively).
A graph of the percent inhibition of DNA damage as a function of EGCG/caffeine
concentration is shown in Figure 5.4. From the best-fit sigmoidal dose response curve,
173

the IC50 value (the concentration of polyphenol necessary for inhibition of 50% of the
DNA damage produced by •OH) was obtained. The IC50 for EGCG/caffeine was 1.2 ±
0.2 μM (p = 0.01, Hillslope = 1.3), which is comparable to the IC50 for EGCG inhibition
of DNA damage alone (1.1 ± 0.01 μM) and that of physiological plasma concentrations
(~1 μM after one cup of green tea).24 Thus, addition of one equivalent caffeine to EGCG
has no significant effect (p = 0.48) on antioxidant activity compared to EGCG alone.
log [EGCG/caffeine] (μM)
-4 -2 0 2
% D
NA
dam
age
inhi
bitio
n
-20
0
20
40
60
80
100
120
Figure 5.4. Percent DNA damage inhibition graph of a 1:1 ratio of (-)-epigallocatechin-3-gallate (EGCG) and caffeine under Fenton reaction conditions (2 μM Fe2+ + 50 μM H2O2). Standard deviations were calculated from three separate trials at the concentrations shown. The best-fit sigmoidal dose-response curve (black line) was used to determine the IC50 value.
Because quercetin also π stacks with caffeine, similar experiments were
performed with a 1:1 ratio of quercetin and caffeine. Quantification of the gel band
intensities shows that Q/caffeine does inhibit iron-mediated DNA damage (Figure 5.5).
The highest concentration tested (500 μM) prevented 100% of damaged DNA. Figure 5.6
shows the best-fit sigmoidal dose-response curve, IC50 for Q/caffeine was determined to
174

be 72 ± 15 μM (p < 0.02, Hillslope = 1.39), a concentration much greater than that found
for Q alone (IC50 = 10.4 ± 0.2 μM) under similar conditions (p = 0.02).18,25 Thus, in
contrast to caffeine combined with EGCG, caffeine in combination with quercetin
significantly lowers the antioxidant activity of quercetin. Caffeine itself does not prevent
iron-mediated DNA damage, and addition of this compound in a 1:1 ratio to EGCG has
no effect on the antioxidant activity of this polyphenol. In contrast, the combination of Q
and caffeine in a 1:1 ratio greatly lowers antioxidant activity compared to Q alone,
indicating that π-stacking interactions have different effects on polyphenol antioxidant
activity. 1H NMR and Job’s plot titration studies show that EGCG (2 mM and 5mM)
binds caffeine (500 μM) in a 1:1 ratio, with similar binding constants (89 ± 10% M-1 and
90 ± 2% M-1, respectively).43
94321 8765 11 161514131210 20191817[Q/caffeine]
damaged DNAundamaged DNA
94321 8765 11 161514131210 20191817[Q/caffeine]
damaged DNAundamaged DNA
94321 8765 11 161514131210 2019181794321 8765 11 161514131210 20191817[Q/caffeine]
damaged DNAundamaged DNAdamaged DNAundamaged DNA
Figure 5.5. Gel electrophoresis image of quercetin (Q) and caffeine under Fenton reaction conditions. Lane 1: 1 kb ladder, lane 2: plasmid only (p), lane 3: p + H2O2 (50 μM), lane 4: p + H2O2 (50 μM) + Q/caffeine (500 μM), lane 5: p + H2O2 (50 μM) + Fe2+ (2 μM), lanes 6-20: lane 5 + increasing concentrations of Q and caffeine (0.0005, 0.001, 0.01, 0.02, 0.05, 0.2, 2, 4, 10, 50, 100, 200, 300, 400, and 500 μM, respectively).
175

log [Q/caffeine] (μM)
-4 -2 0 2
% D
NA
dam
age
inhi
bitio
n
-20
0
20
40
60
80
100
120
Figure 5.6. Percent DNA damage inhibition graph of a 1:1 ratio of quercetin and caffeine under Fenton reaction conditions (2 μM Fe2+ + 50 μM H2O2). Standard deviations were calculated from three separate trials at the concentrations shown. The best-fit sigmoidal dose-response curve (black line) was used to determine the IC50 value.
Similar results were also observed for other catechins including epicatechin and
epigallocatechin; however, estimation of binding constants was difficult due to small
changes in the proton chemical shifts resulting in large errors.43 It should be noted that
concentrations used in the NMR studies are significantly higher than those used for our
gel electrophoresis experiments with EGCG and caffeine (0.005-100 μM), and there may
be less interaction between the two compounds at such low concentrations. However, the
decreased antioxidant activity of Q/caffeine (0.005-500 μM) compared to Q alone
indicates that significant π-stacking may occur even at the low concentrations used for
the DNA damage experiments.
Hayashi et al. showed that both the A and B rings of catechins are required for
complexation with caffeine,43 and ECGG contains two gallol substituents, both of which
176

are B-type rings, while quercetin contains only one catechol group as its B-ring (Figure
5.1). Therefore, one equivalent of caffeine may bind to one gallol ring of EGCG, and the
presence of an additional gallol group to bind iron may still permit potent antioxidant
activity. In the case of quercetin, once its catechol ring is involved in π-stacking
interactions with caffeine, the catechol is unable to bind iron as efficiently and thus its
antioxidant function is reduced. To fully understand the different effects of caffeine with
EGCG and with Q, gel electrophoresis experiments using a higher caffeine to EGCG
ratio (at least 2:1) would be enlightening. Higher ratios of caffeine to EGCG may
promote π-stacking to both gallol substituents of EGCG and reduce antioxidant activity.
Since π-acidic polyphenols such as EGCG and Q π-stack with the π-basic
caffeine43,44,47 to yield different effects on antioxidant behavior, other polyphenol/caffeine
interactions should be examined for their effects on antioxidant activity. UV-vis and
NMR titrations of caffeine with various polyphenol compounds might also be performed
to additionally investigate the potential π−stacking interactions and to determine the
effects on antioxidant activity of one vs. two B ring gallol- and catechol-containing
compounds. In addition, since compounds such as quercetin can intercalate into the DNA
bases (also π bases), it is important to investigate the interactions of EGCG, Q, and other
polyphenols with the electron-rich DNA bases adenine and guanine to determine the
effects of DNA base binding on observed antioxidant activity. Lastly, because both
polyphenol compounds and caffeine are found in regularly-consumed foods, it is crucial
to fully understand how these combinations affect polyphenol antioxidant potency.
177
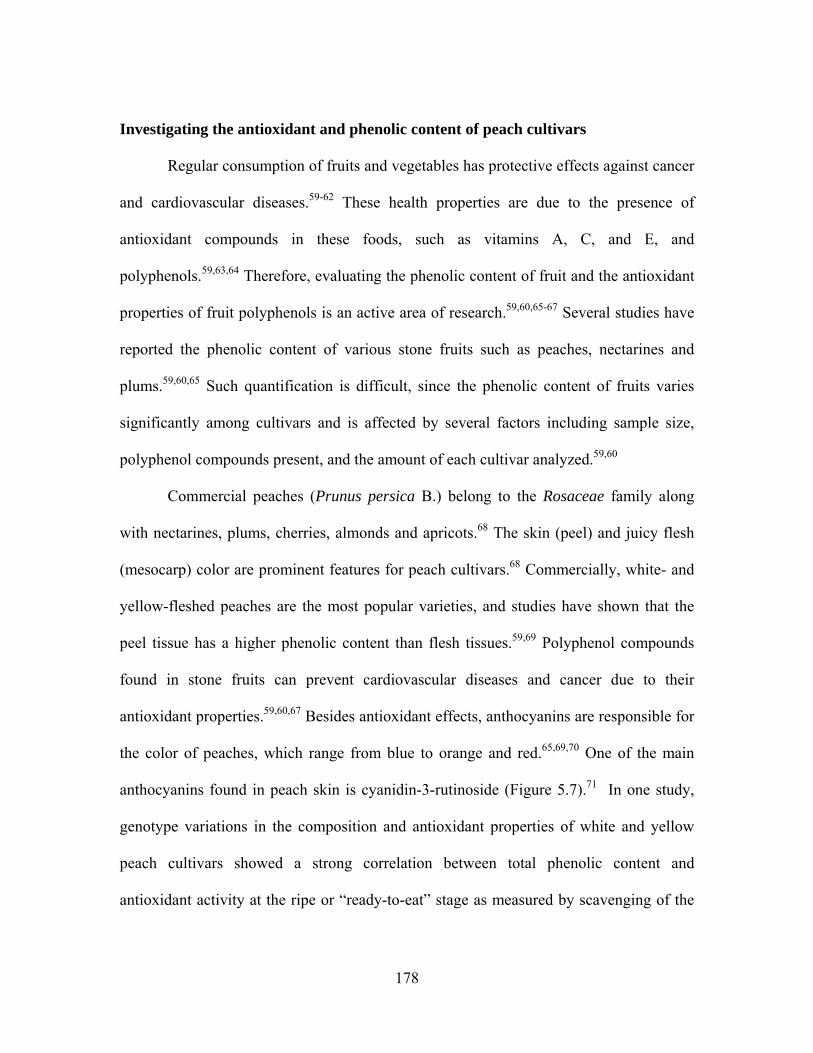
Investigating the antioxidant and phenolic content of peach cultivars
Regular consumption of fruits and vegetables has protective effects against cancer
and cardiovascular diseases.59-62 These health properties are due to the presence of
antioxidant compounds in these foods, such as vitamins A, C, and E, and
polyphenols.59,63,64 Therefore, evaluating the phenolic content of fruit and the antioxidant
properties of fruit polyphenols is an active area of research.59,60,65-67 Several studies have
reported the phenolic content of various stone fruits such as peaches, nectarines and
plums.59,60,65 Such quantification is difficult, since the phenolic content of fruits varies
significantly among cultivars and is affected by several factors including sample size,
polyphenol compounds present, and the amount of each cultivar analyzed.59,60
Commercial peaches (Prunus persica B.) belong to the Rosaceae family along
with nectarines, plums, cherries, almonds and apricots.68 The skin (peel) and juicy flesh
(mesocarp) color are prominent features for peach cultivars.68 Commercially, white- and
yellow-fleshed peaches are the most popular varieties, and studies have shown that the
peel tissue has a higher phenolic content than flesh tissues.59,69 Polyphenol compounds
found in stone fruits can prevent cardiovascular diseases and cancer due to their
antioxidant properties.59,60,67 Besides antioxidant effects, anthocyanins are responsible for
the color of peaches, which range from blue to orange and red.65,69,70 One of the main
anthocyanins found in peach skin is cyanidin-3-rutinoside (Figure 5.7).71 In one study,
genotype variations in the composition and antioxidant properties of white and yellow
peach cultivars showed a strong correlation between total phenolic content and
antioxidant activity at the ripe or “ready-to-eat” stage as measured by scavenging of the
178

2,2’-diphenyl-1-picrylhydrazyl radical (DPPH•+) and the ferric reducing ability plasma
(FRAP) methods.59
HO
OOH
OH
HO
OOH
OH
OH
O+
OH
OH
HO
O
O
O
OH
OH
OH
OH
OH
OHHO
HO
H3C
Cyanidin-3-rutiniside
Gallic acid (GA)
Protocatechuic acid (PCA)
Figure 5.7. Structures of gallic acid (GA), protocatechuic acid (PCA), and the anthocyanin, cyanidin-3-rutinoside.
A study by Cevallos-Casals et al. showed that the total anthocyanin content in
red-fleshed or blood peaches is approximately ten times higher than that of white or
yellow fleshed cultivars.72 Thus, peaches of the blood-red variety may have greater
antioxidant-derived protective effects than the more popular white and yellow cultivars.
The ability to genetically alter antioxidant content makes peaches, as well as other fruits,
a target for breeding programs focusing on enhancement of phenolic composition and
antioxidant activity.65,72
The Abbott laboratory at Clemson University has been successful in producing
several natural and genetically-modified peach cultivars.73 The four main varieties of
peaches investigated by the Abbott group are Red Globe, Di-haploid Lovell, Sugar Giant
179

and the genetically-modified cultivar, BY99P4508 (BY). The characteristics of each
peach cultivar with respect to the flesh and skin colors are shown in Table 5.1. In light of
Table 5.1. Flesh and skin color, and estimated anthocyanin concentrations of various peach cultivars discussed in this chapter.
aestimated anthocyanin concentration was calculated using the molecular mass of cyanidin-3-rutinoside (582 g/mol).
~3400.2Blood-redBlood-redBY99P1508 (BY)
~3400.2RedWhiteSugar Giant
~3400.2Yellow-greenYellowLovell
~3400.2RedYellowRed Globe
Estimated anthocyanin
concentration (μM)a
Total dissolved anthocyanin
(mg/mL)
Skin colorFlesh colorPeach cultivar
~3400.2Blood-redBlood-redBY99P1508 (BY)
~3400.2RedWhiteSugar Giant
~3400.2Yellow-greenYellowLovell
~3400.2RedYellowRed Globe
Estimated anthocyanin
concentration (μM)a
Total dissolved anthocyanin
(mg/mL)
Skin colorFlesh colorPeach cultivar
the health benefits and ongoing breeding programs with possible commercial value, it is
of great interest to determine and compare the anthocyanin content of these cultivars with
their ability to inhibit oxidative DNA damage.
The Brumaghim laboratory has used DNA gel electrophoresis assays to determine
and compare the antioxidant activities of polyphenol compounds.18 In these DNA damage
experiments, the generation of the DNA-damaging hydroxyl radical (•OH) is produced
upon oxidation of Fe2+ by hydrogen peroxide (H2O2).6,74 Antioxidant activity of the
polyphenol compounds was quantified by measuring the percentage of inhibited DNA
damage.18 In collaboration with the Abbott group, the antioxidant activities of aqueous
extracts of the peach cultivars in Table 5.1 were determined via similar DNA damage
assays.
180

Dried peach extracts from Red Globe, Lovell, Sugar Giant, and BY99P4508 (BY)
cultivars were obtained from the Abbott lab by methanol extraction, and solid samples
(0.75 mg) were prepared by lyophilization. Since the samples were only slightly soluble
in distilled water, an estimated concentration of diluted peach extract was determined for
each cultivar sample (340 μM) using the molecular weight of the anthocyanin, cyanidin-
3-rutinoside (582 g/mol; Table 5.1). Increasing concentrations of each peach extract were
used to determine the ability of each peach cultivar to inhibit iron-mediated DNA damage
via gel electrophoresis.
[Sugar Giant]106 983 752 41
undamaged DNAdamaged DNA
C
[Lovell]106 983 752 41
undamaged DNAdamaged DNA
B
[BY]106 983 752 41
undamaged DNAdamaged DNA
D
[Red Globe]106 983 752 41
damaged DNAundamaged DNA
A
[Sugar Giant]106 983 752 41
undamaged DNAdamaged DNA
C
[Sugar Giant]106 983 752 41
undamaged DNAdamaged DNA
C106 983 752 41
undamaged DNAdamaged DNA
106 983 752 41 106 983 752 41
undamaged DNAdamaged DNA
C
[Lovell]106 983 752 41
undamaged DNAdamaged DNA
B
[Lovell]106 983 752 41
undamaged DNAdamaged DNA
B106 983 752 41
undamaged DNAdamaged DNA
106 983 752 41 106 983 752 41
undamaged DNAdamaged DNA
B
[BY]106 983 752 41
undamaged DNAdamaged DNA
D
[BY]106 983 752 41
undamaged DNAdamaged DNA
D106 983 752 41
undamaged DNAdamaged DNA
106 983 752 41 106 983 752 41
undamaged DNAdamaged DNA
D
[Red Globe]106 983 752 41
damaged DNAundamaged DNA
A
[Red Globe]106 983 752 41 106 983 752 41
damaged DNAundamaged DNAdamaged DNAundamaged DNA
A
Figure 5.7. DNA gel electrophoresis experiments for peach extracts: (A) Red Globe, (B) Lovell, (C) Sugar Giant, and (D) BY under Fenton reaction conditions at pH 6. For each gel, lanes 1) 1 kb ladder; 2) plasmid (p); 3) p + H2O2 (50 μM); 4) p + H2O2 (50 μM) + Red Globe, Sugar Giant, BY, or Lovell; 5) p + H2O2 (50 μM) + Fe2+ (2 μM); and 6-10) 1.7, 3.4, 6.9, 17, and 34 μM of Red Globe, Sugar Giant, or BY extracts, respectively or 6.9, 17, 34, 68, and 170 μM of Lovell extract, respectively.
In these experiments a pH of 6 was maintained, since iron precipitates at pH >
6.5.18 Figure 5.7 shows DNA gel electrophoresis images at various concentrations for
181

each peach cultivar tested. The control lanes (Figure 5.7, lanes 2 and 3) indicate that the
plasmid is of good quality, and neither H2O2 nor the highest concentration of peach
extract tested (lanes 4) damages DNA. Addition of Fe2+ (2μM) and H2O2 (50 μM)
produced > 90 % DNA damage (Figure 5.7, lanes 5) as seen from the increase in the band
intensities.
In the presence of Fe2+/H2O2, Red Globe extract inhibited DNA damage in a
concentration-dependent manner as seen by the gradual increase in undamaged DNA
from Figure 5.7, lanes 6-10. Quantification of the gel band intensities showed that at the
highest concentration tested (~34 μM), this peach extract inhibited 95% DNA damage (p
= < 0.0001). Similarly, increasing concentrations of Lovell, Sugar Giant, and BY extracts
also significantly inhibited DNA damage from Fe2+ and hydrogen peroxide. Lovell (~170
μM) extract at the highest concentration prevented 91% (p = < 0.0001, Figure 5.7B),
Sugar Giant extract (~34 μM) prevented 80% (p = < 0.0001; Figure 5.7C), and BY
extract (~34 μM) inhibited 99% (p = < 0.0001; Figure 5.7D) DNA damage. While all
peach samples were found to be effective antioxidants, the genetically-modified extract,
BY, prevented the most DNA damage (77%; p = 0.001), followed by Red Globe (64%; p
< 0.0001), Lovell (22%; p = 0.006) and Sugar Giant (14%; p = 0.02) at ~6.9 μM (Figure
5.8A). These results correlate well with previous radical-scavenging and iron-reduction
studies of peach antioxidant activity that found that blood-red peach cultivars had higher
antioxidant activities than those with white or yellow mesocarps.65,72
182

0
20
40
60
80
100
Red Globe Lovell SugarGiant
BY
% D
NA
dam
age
inhi
bitio
n
A B
0
20
40
60
80
100
Red Globe Lovell SugarGiant
BY
% D
NA d
amag
e in
hibi
tion
0
20
40
60
80
100
Red Globe Lovell SugarGiant
BY
% D
NA
dam
age
inhi
bitio
n
A
0
20
40
60
80
100
Red Globe Lovell SugarGiant
BY
% D
NA
dam
age
inhi
bitio
n
A B
0
20
40
60
80
100
Red Globe Lovell SugarGiant
BY
% D
NA d
amag
e in
hibi
tion
B
0
20
40
60
80
100
Red Globe Lovell SugarGiant
BY
% D
NA d
amag
e in
hibi
tion
Figure 5.8. Percent DNA damage inhibition of Red Globe, Lovell, Sugar Giant, and BY peach extracts at A) ~6.9 μM and B) ~17 μM.
Interestingly, at higher concentrations of peach extracts (~17 μM), Red Globe
(yellow flesh) and BY (red flesh) have similar antioxidant effects, inhibiting 92% (p =
<0.0001) and 90% (p = <0.0001) oxidative DNA damage, respectively (Figure 5.8B).
This data suggest that flesh color may not necessarily be a determining factor of peach
extract antioxidant activity, especially since Lovell, with yellow flesh color has
significantly low antioxidant activity when compared to Red Globe (Figure 5.8) at both
~6.9 μM (p = 0.002) and ~17 μM (p = 0.01). Although the high antioxidant activity of
Red Globe and BY may be attributed to their red skin color, this factor seems unlikely
since Sugar Giant, with red skin has significantly little antioxidant activity compared to
Red Globe with similar skin color (p = 0.002 at ~6.9 μM and p = <0.0001 at ~17 μM).
Peach extracts have strong antioxidant activity and significantly prevent iron-
mediated DNA damage. As expected, the genetically modified peach extract (BY) has the
highest activity inhibiting 99% DNA damage at ~34 μM. This result correlates well with
the reports that peach cultivars of the blood-red variety have the highest radical
183
scavenging ability and iron-reducing abilities when compared to peaches that are yellow
or white in color.72 Studies by Kader et al. demonstrate that the antioxidant activity of
peaches is due to their phenolic content.59
Due to the strong correlation between antioxidant activity, peach flesh color, and
anthocyanin content, attempts to determine total phenolic content in peach extracts using
the Folin-Ciocalteu method were also undertaken for the four peach extracts. The Folin-
Ciocalteu phenol reagent, consisting of a mixture of phosphotungstic and
phosphomolybic acids, turns blue upon reduction by phenol compounds as tungsten blue
and molybdenum blue are produced.75 Thus, phenol content can be indirectly measured
by UV-vis spectroscopy.75 Calibration curves of either gallic acid (GA) or protocatechuic
acid (PCA) are used as a standard to calculate total phenolic content from food extracts
(Figure 5.9).75,76 Suitable calibration curves may also be obtained by UV-vis
measurements of the purple color obtained when Fe2+ is oxidized to Fe3+ by gallic acid or
protocatechuic acid.
It is expected that the total polyphenolic content of the peach extracts (including
anthocyanin compounds) could be determined using this method, since the estimated
anthocyanin concentrations of the peach extracts are ~340 µM. Unfortunately,
absorbances at lower polyphenol concentrations (1-10 μM) are extremely small using the
Folin-Ciocalteu method, so this method is unsuitable for determining polyphenol content
of solutions containing biologically-relevant phenolic concentrations.
184

y = 0.0023x + 0.024R2 = 0.9408
0
0.5
1
1.5
0 100 200 300 400 500
[GA] μM
A745
y = 0.0023x + 0.0523R2 = 0.9825
0
0.5
1
1.5
0 100 200 300 400 500
[PCA] (μM)
A745
A B
Figure 5.9. Calibration curves for A) gallic acid (GA) and B) protocatechuic acid (PCA) using the Folin-Ciocalteu method. Error bars for both graphs represent standard deviations calculated from the average of three trials. Error bars are smaller than the data points.
The peach extracts studied in this chapter came from the mesocarps (flesh) of
these cultivars, and although they have significant antioxidant activity, it would be
interesting to compare such activity with extracts obtained from the skin (peel), because
the peel tissues of peaches have a higher phenolic content than the flesh tissues.59 In
addition, since peaches are often cooked using different methods, the effects of such
cooking methods on the antioxidant content and activity of peach cultivars is also of
particular interest .
Conclusions
Gel electrophoresis experiments to determine the ability of polyphenols combined
with caffeine to inhibit iron-mediated DNA damage demonstrated that a 1:1 ratio of
EGCG/caffeine had greater antioxidant activity (IC50 = 1.2 ± 0.2 μM) than a 1:1 ratio of
Q/caffeine (IC50 = 72 ± 15 μM). Compared to similar experiments performed with
185

EGCG alone (IC50 = 1.1 ± 0.01 μM),18,25 addition of caffeine has no significant effect on
the antioxidant activity of EGCG (p = 0.48). However, the antioxidant activity of
quercetin (IC50 = 10.4 ± 0.2 μM)18,25 significantly decreased upon addition of one
equivalent of caffeine (p = 0.02).
The addition of caffeine may play a significant role on polyphenol antioxidant
activity depending on the specific polyphenol compound tested. Further studies are
therefore warranted to determine the effects of caffeine on the antioxidant activity of
other polyphenols such as epicatechin, myricetin, and epicatechin-3-gallate. To further
examine the biological implications of such activity, the ability of polyphenols (π-acids)
to interact with π-bases such as caffeine or the DNA bases adenine and guanine are
necessary. These π-stacking interactions can be examined by UV-vis or NMR titrations
of these compounds. Results from these experiments will determine the biological
implications of polyphenol antioxidant combinations with caffeine, also a common
dietary component, on human health.
Experiments performed to determine the antioxidant activity of Red
Globe, Lovell, Sugar Giant, and genetically-modified BY peach extracts obtained from
the Abbott lab at Clemson showed that all peach samples inhibited iron-mediated DNA
damage in a concentration dependent manner. BY peach extract had the highest
antioxidant activity followed by Red Globe, Lovell, and Sugar Giant extracts. To better
evaluate the antioxidant activity of these peach extracts, their phenolic content must also
be determined. Our experiments prove that peach polyphenols prevent oxidative DNA
186

damage at biological concentrations, and further validates the need for breeding programs
that produce genetically-modified peach cultivars to increase their antioxidant activity.
Materials and Method
Materials
Quercetin (Q) and protocatechuic acid (PCA) were purchased from MP
Biomedicals, Inc., and (-)-epigallocatechin-3-gallate (EGCG) was from Cayman
Chemical Company. FeSO•7H2O, NaCl (99.999%), hydrogen peroxide (30%), caffeine,
guanosine, and bromophenol blue were from Alfa Aesar. Glucose, agarose, and
ampicillin were from EMD Chemicals. TRIS hydrochloride and Na2EDTA were from J.
T. Baker; ethidium bromide was from Lancaster Synthesis Inc., and HCl was from VWR
Scientific. Xylene cyanol, peptone, and yeast extract were purchased from EM Science;
MES buffer (99.6%) was from Calbiochem, sodium carbonate and adenine were from
Acros. Gallic acid (GA) was from TCI America and Folin-Ciocalteu’s phenol reagent
came from Fluka Analytical. Use of high purity MES buffer (99.6%) and NaCl
(99.999%) were necessary to avoid metal contamination. Water was purified using the
NANOpure Diamond water deionization system (Barnstead International. Dubuque, IA).
Iron-free microcentrifuge tubes were prepared by washing the tubes in 1 M HCl and
triple rinsing with ddH2O. UV-vis absorption spectra were measured on a Shimadzu UV-
3101PC spectrophotometer (Shimadzu Corp., Kyoto, Japan).
187

Purification of plasmid DNA
DH1 E. coli cells were transfected with pBSSK, plated on LB/amp plates, and
incubated at 37 oC for 16 h. Cell cultures were grown in TB/amp medium inoculated with
a single colony for 15 h at 37 oC. Plasmid DNA was purified from cell pellets using a
QIAprep Spin Miniprep kit (Qiagen, Chatsworth, CA) with tris-EDTA (TE) buffer was
used to elute the DNA. Dialysis of plasmid DNA was performed against 130 mM NaCl
(99.999%) for 24 h at 4 oC. The resulting DNA concentration was found using UV-vis
measurements at A260 (1 A260 = 50 ng/μL). Purity of plasmid DNA was determined via
gel electrophoresis of a digested sample, and all absorbance ratios were within acceptable
limits (A250/260 < 0.95, and A260/280 > 1.8).
Preparation of peach extracts
Red Globe, Di-haploid Lovell, Sugar Giant, and BY99P5508 (BY) peach
cultivars were grown at Musser Farm, Clemson University in 2008. Samples (1 g)
collected from 3-4 peaches at full maturation were frozen in liquid nitrogen and stored at
-80°C. For antioxidant quantification via DNA damage assay, 1 g of each frozen peach
flesh cultivar (mesocarp without skin, 1 g) was ground to a fine powder with liquid
nitrogen and extracted twice with methanol and HCl (0.01%) at room temperature to a
volume of 15 mL. Extract (1 mL) was lyophylized overnight to obtain a solid sample
weighing ~0.75 mg. Solid peach samples were weighed and then dissolved in ddH2O (1
mL). Since the samples were only somewhat soluble in water, the soluble fractions were
transferred to another microcentrifuge tube and the remaining solid was weighed. The
188

two masses measured before and after dissolving the peach extract was subtracted, and an
estimated concentration of dissolved polyphenols was determined using the molecular
weight for an anthocyanin commonly found in large quantity in peaches, cyanidin-3-
rutinoside (582 g/mol).
Inhibition of iron-mediated DNA damage by caffeine, epigallocatechin gallate (EGCG),
quercetin (Q), and peach cultivars
The indicated concentrations of caffeine were combined with 0.1 pmol plasmid
DNA, 130 mM NaCl, 10 mM ethanol, 2 μM FeSO4•H2O, 10 mM MES buffer at pH 6
and allowed to stand for 5 min at room temperature. H2O2 (50 μM) was then added and
incubated for 30 min. EDTA solution (50 μM) was added after this time. All
concentrations are reported as final concentrations, and a total volume of 10 μL was
maintained with ddH2O. DNA was separated on 1% agarose gel via electrophoresis,
stained with ethidium bromide for 30 min, and imaged on an UVIproDBT-8000 gel
imager (UVITec, Cambridge, UK). Quantification of closed-circular (undamaged) and
nicked (damaged) DNA was performed using the UviPro software. Similar experiments
were performed for the polyphenols EGCG and Q with caffeine (in a stoichiometric ratio
of 1:1), Red Globe, Di-haploid Lovell, Sugar Giant, and BY99P4508 (BY) peach
extracts, substituting either EGCG/caffeine, quercetin/caffeine, or the peach extracts for
caffeine.
189

Gel analysis and IC50 determination
Percent DNA damage inhibition was determined using the formula 1-[% N / %
B]*100, where % N = % nicked DNA in the polyphenol or peach extract containing lanes
and % B = % of nicked DNA in the Fe2+/H2O2 lane. Percentages are corrected for
residual nicking prior to calculation. Results are the average of three trials, and standard
deviations are indicated by error bars. Statistical significance was determined by
calculation of p values at 95% confidence as described by Perkowski et al.77 Sigma Plot
(v.9.01, Sysat Software, Inc., San Jose, CA) was used to plot percent DNA damage
inhibition as a function of log concentration of antioxidant compounds and fit to a
variable-slope sigmoidal dose response curve using the equation: f = min + (max-min)/ (1
+ 10(logEC50 – x)*Hillslope). Results are the average of the fits of three trials, and errors are
reported as standard deviations calculated by error propagation from gel results.
Calibration curves for GA and PCA via Folin-Ciocalteu method
Solutions of gallic acid and protocatechuic acid (0.001-0.5 mM, 100 μL)
prepared in MES buffer (90 mM) to maintain a pH of 6 was combined with Folin-
Ciocalteu phenol reagent (1 mL of phenol reagent was first diluted to 3 mL using
ddH2O), and allowed to stand for 5 min at room temperature. After this time, saturated
Na2CO3 (2 mL, 3.5 M) was added and diluted to 6 mL with ddH2O. The solution was
allowed to stand at room temperature until it turned blue (~5-10 min) and the absorbance
was measured via UV-vis at 745 nm. The absorbance of a blank solution, which remained
yellow (the color of the phenol reagent) was also obtained using ddH2O instead of GA or
190

PCA. The blank absorbance was subtracted from the experimental absorbances and the
resulting absorbances at 745 nm were plotted as a function of concentration to obtain
calibration curves.
Tabular data for gel electrophoresis experiments
Tabulated values for the percentages of undamaged (closed, circular) and
damaged (nicked) DNA bands observed in the gel electrophoresis experiments for
Fe2+/H2O2 (pH = 6) with caffeine and polyphenols are given in Tables 5.2-5.8. All
reported tabulated values are the average of three experimental trials with the indicated
standard deviations.
191

Table 5.2. Tabulation for electrophoresis results for caffeine with Fe2+ (2 μM) and H2O2 (50 μM) at pH 6. Lane Concentration
(μM) % Supercoiled DNA
% Nicked DNA
% Damage Inhibition
p-value
5 0 5.6 ± 2.0 94.4 0 0
6 0.0005 6.6 ± 3.1 93.4 -6.8 ± 3.4 0.07
7 0.001 8.3 ± 0.56 91.7 -6.9 ± 3.2 0.06
8 0.01 5.7 ± 5.2 94.3 -7.0 ± 2.3 0.03
9 0.02 4.2 ± 3.8 95.8 -6.9 ± 3.5 0.08
10 0.05 5.9 ± 1.6 94.1 -7.3 ± 3.2 0.06
11 0.2 6.8 ± 1.6 93.2 -7.6 ± 33 0.06
12 2 6.9 ± 0.87 93.1 -7.3 ± 3.5 0.07
13 4 6.3 ± 1.8 93.7 0.82 ± 2.1 0.57
14 10 5.8 ± 2.9 94.2 0.25 ± 1.6 0.81
15 50 6.7 ± 3.6 93.3 1.2 ± 1.8 0.37
16 100 6.4 ± 1.3 93.6 0.97 ± 3.2 0.65
17 200 8.0 ± 1.7 92 2.9 ± 1.4 0.07
18 300 8.0 ± 3.2 92 2.8 ± 2.2 0.16
19 400 8.1 ± 3.4 91.9 2.9 ± 1.5 0.08
20 500 6.8 ± 6.1 93.2 1.5 ± 8.3 0.78
192

Table 5.3. Tabulation for electrophoresis results for EGCG and caffeine with Fe2+ (2 μM) and H2O2 (50 μM) at pH 6. Lane Concentration
(μM) % Supercoiled DNA
% Nicked DNA
% Damage Inhibition
p-value
5 0 6.7 ± 2.0 93.3 0 0
6 0.0005 7.9 ± 1.2 92.1 2.1 ± 0.79 0.04
7 0.001 7.4 ± 0.19 92.6 1.6 ± 1.9 0.28
8 0.01 6.7± 0.5 93.3 1.3 ± 2.8 0.51
9 0.02 6.3 ± 0.99 93.7 -0.45 ± 3.2 0.83
10 0.05 9.9 ± 1.9 90.2 1.7 ± 4.2 0.56
11 0.2 32 ± 4.9 68 14 ± 3.2 0.02
12 2 64 ± 5.2 36 57 ± 3.6 0.001
13 4 80 ± 4.2 20 74 ± 2.6 <0.0001
14 10 94 ± 2.6 6.0 93 ± 0.77 <0.0001
15 50 98 ± 1.9 2.0 100 ± 0.05 <0.0001
16 100 99 ± 1.5 1.0 101 ± 0.42 <0.0001
193

Table 5.4. Tabulation for electrophoresis results for Q and caffeine with Fe2+ (2 μM) and H2O2 (50 μM) at pH 6. Lane Concentration
(μM) % Supercoiled DNA
% Nicked DNA
% Damage Inhibition
p-value
5 0 7.2 ± 3.0 92.8 0 0
6 0.0005 1.0 ± 0.29 99.0 -6.8 ± 3.4 0.07
7 0.001 0.9 ± 0.99 99.1 -6.9 ± 3.2 0.06
8 0.01 0.8 ± 0.84 99.2 -7.0 ± 2.3 0.03
9 0.02 0.9 ± 0.69 99.1 -6.9 ± 3.5 0.08
10 0.05 0.6 ± 0.52 99.4 -7.3 ± 3.2 0.06
11 0.2 0.2 ± 0.12 99.8 -7.6 ± 3.3 0.06
12 2 0.5 ± 0.5 99.5 -7.3 ± 3.5 0.07
13 4 1.7 ± 0.63 98.3 -6.1 ± 3.9 0.11
14 10 6.9 ± 4.6 93.1 -0.31 ± 1.8 0.79
15 50 48 ± 2.4 52 45 ± 2.2 <0.0001
16 100 59 ± 6.7 41 57 ± 5.6 0.003
17 200 81 ± 4.9 19 81 ± 4.9 0.001
18 300 89 ± 2.7 11 90 ± 5.1 0.001
19 400 93 ± 1.1 7.0 95 ± 1.3 <0.0001
20 500 99 ± 1.6 1.0 100 ± 0.69 <0.0001
194

Table 5.5. Tabulation for electrophoresis results for Red Globe peach extract with Fe2+ (2 μM) and H2O2 (50 μM) at pH 6. Lane Concentration
(μM)a % Supercoiled DNA
% Nicked DNA
% Damage Inhibition
p-value
5 0 6.7 ± 9.7 93.3 0 0
6 ~1.7 17 ± 2.4 83 11 ± 5.0 0.06
7 ~3.4 36 ± 4.2 64 31 ± 7.4 0.02
8 ~6.9 66 ± 2.1 34 64 ± 0.67 <0.0001
9 ~17 92 ± 2.5 8.0 92 ± 3.4 <0.0001 10 ~34 94 ± 2.2 6.0 95 ± 3.2 <0.0001 aEstimated anthocyanin concentration was calculated using the molecular mass of cyanidin-3-rutinoside (582 g/mol). Table 5.6. Tabulation for electrophoresis results for Lovell peach extract with Fe2+ (2 μM) and H2O2 (50 μM) at pH 6. Lane Concentration
(μM)a % Supercoiled DNA
% Nicked DNA
% Damage Inhibition
p-value
5 0 4.0 ± 3.7 96 0 0
6 ~6.9 25 ± 5.7 75 22 ± 3.0 0.006
7 ~17 57 ± 8.3 43 56 ± 6.9 0.005
8 ~34 78 ± 5.2 22 77 ± 4.7 0.001
9 ~68 86 ± 3.5 14 86 ± 3.1 <0.0001
10 ~170 91 ± 1.8 9.0 91 ± 1.2 <0.0001 aEstimated anthocyanin concentration was calculated using the molecular mass of cyanidin-3-rutinoside (582 g/mol).
195

Table 5.7. Tabulation for electrophoresis results for Sugar Giant peach extract with Fe2+ (2 μM) and H2O2 (50 μM) at pH 6. Lane Concentration
(μM)a % Supercoiled DNA
% Nicked DNA
% Damage Inhibition
p-value
5 0 0.8 ± 3.1 99.2 0 0
6 ~1.7 3.7 ± 1.4 96.3 3.0 ± 1.3 0.06 7 ~3.4 6.3 ± 0.93 93.7 5.7 ± 0.57 0.003
8 ~6.9 15 ± 3.4 85 14 ± 3.5 0.02
9 ~17 53 ± 1.9 47 54 ± 1.1 <0.0001
10 ~34 79 ± 2.2 21 80 ± 0.89 <0.0001 aEstimated anthocyanin concentration was calculated using the molecular mass of cyanidin-3-rutinoside (582 g/mol). Table 5.8. Tabulation for electrophoresis results for BY peach extract with Fe2+ (2 μM) and H2O2 (50 μM) at pH 6. Lane Concentration
(μM)a % Supercoiled DNA
% Nicked DNA
% Damage Inhibition
p-value
5 0 1.3 ± 1.1 98.7 0 0
6 ~1.7 23 ± 3.5 77 22 ± 4.5 0.01
7 ~3.4 46 ± 5.6 54 45 ± 6.3 0.006
8 ~6.9 76 ± 4.8 24 77 ± 5.0 0.001
9 ~17 89 ± 1.6 11 90 ± 1.8 <0.0001
10 ~34 99 ± 1.1 1.0 99 ± 1.2 <0.0001 aEstimated anthocyanin concentration was calculated using the molecular mass of cyanidin-3-rutinoside (582 g/mol).
196
References
(1) Orrenius, S.; Gogvadze, V.; Zhivotovsky, B. Annu. Rev. Pharmacol. Toxicol.
2007, 47, 143-183.
(2) Park, S.; Imlay, J. A. J. Bacteriol. 2003, 185, 1942-1950.
(3) Macomber, L.; Rensing, C.; Imlay, J. A. J. Bacteriol. 2007, 189, 1616-1626.
(4) Mello-Filho, A. C.; Meneghini, R. Mutat. Res. 1991, 251, 109-113.
(5) Hoffmann, M. E.; Mello-Filho, A. C.; Mello-Filho, A. C. Biochim. Biophys. Acta
1984, 781, 234-238.
(6) Imlay, J. A.; Chin, S. M.; Linn, S. Science 1988, 240, 640-642.
(7) Henle, E. S.; Luo, Y.; Linn, S. Biochemistry 1996, 35, 12212-12219.
(8) Steinberg, D. J. Biol. Chem. 1997, 272, 20963-20966.
(9) Halliwell, B. Drugs Aging 2001, 18, 685-716.
(10) Huang, X. Mutat. Res. 2003, 533, 153-171.
(11) Singal, P. K.; Khaper, N.; Palace, V.; Kumar, D. Cardiovas. Res. 1998, 40, 426-
432.
(12) Scalbert, A.; Johnson, I. T.; Salmarsh, M. Am. J. Clin. Nutr. 2005, 81, 215S-217S.
(13) Vinson, J. A.; Su, X.; Zubik, L.; Bose, P. J. Agri. Food Chem. 2001, 49, 5315-
5321.
(14) Vinson, J. A.; Hao, Y.; Su, X.; Zubik, L. J. Agri. Food Chem. 1998, 46, 3630-
3634.
197

(15) Vinson, J. A.; Proch, J.; Zubik, L. J. Agri. Food Chem. 1999, 47, 4821-4824.
(16) Manach, C.; Scalbert, A.; Morand, A.; Remesy, C.; Jimenez, L. Am. J. Clin. Nutr.
2004, 79, 727-747.
(17) Scalbert, A.; Williamson, G. J. Nutr. 2000, 130, 2073S-2085S.
(18) Perron, N. P.; Hodges, J. N.; Jenkins, M.; Brumaghim, J. L. Inorg. Chem. 2008,
47, 6153-6161.
(19) Manach, C.; Williamson, G.; Morand, C.; Scalbert, A.; Remesy, C. Am. J. Clin.
Nutr. 2005, 81, 230S-242S.
(20) Seeram, N. P.; Henning, S. M.; Niu, Y.; Lee, R.; Scheuler, H. S.; Heber, D. J.
Agric. Food Chem. 2006, 54, 1599-1603.
(21) Lambert, J. D.; Yang, C. S. J. Nutr. 2003, 133, 3262S-3267S.
(22) Saper, R. B.; Eisenberg, D. M.; Philips, R. S. Am. Fam. Phys. 2004, 70, 1731-
1738.
(23) Cao, G.; Sofic, E.; Proior, L. R. Free Radic. Biol. Med. 1996, 20, 331-342.
(24) Yamamoto, T.; Hsu, S.; Lewis, J.; Wataha, J.; Dickinson, D.; Singh, B.; Bollag,
W. B.; Lockwood, P.; Ueta, E.; Osaki, T.; Schuster, G. J. Pharm. Exp. Ther.
2003, 307, 230-236.
(25) Note: These IC50 and error values have been refined since publication.18
(26) Duthie, S. J.; Collins, A. R.; Duthie, G. G.; Dobson, V. L. Mutat. Res. 1997, 393,
223-231.
198

(27) Hertog, M. G. L.; Hollman, P. C. H.; Katan, M. B.; Krombout, D. Nutr. Cancer
1993, 20, 21-29.
(28) Sestili, P.; Guidarelli, A.; Dacha, M.; Cantoni, O. Free Radic. Biol. Med. 1998,
25, 196-200.
(29) Lee, C. Clin. Chim. Acta 2000, 295, 141-154.
(30) Curatolo, P. W.; Robertson, D. Ann. Intern. Med. 1983, 98, 641-653.
(31) Ashton, C. H. Br. Med. J. 1987, 295, 1293-1294.
(32) Pan, X.; Niu, G.; Liu, H. Chem. Eng. Process. 2003, 42, 129-133.
(33) Zylber-Katz, E.; Granit, L.; Levy, M. Clin. Pharmacol. Ther. 1984, 36, 133-137.
(34) Setchell, K. D. R.; Welsh, M. B.; Klooster, M. J.; Balistreri, W. F. J. Chromatogr.
1987, 385, 267-274.
(35) Newton, R.; Broughton, L. J.; Lind, M. J.; Morrison, P. J.; Rogers, H. J.;
Bradbrook, I. D. Eur. J. Clin. Pharmacol. 1981, 21, 45-52.
(36) Campbell, M. E.; Spielberg, S. P.; Kalow, W. Clin. Pharmacol. Ther. 1987, 42,
157-165.
(37) Barone, J. J.; Roberts, H. R. Food Chem. Toxicol. 1996, 34, 119-129.
(38) Shishikura, Y.; Khokhar, S. J. Sci. Food Agric. 2005, 85, 2125-2133.
(39) Nishikawa, A.; Furukawa, F.; Imazawa, T.; Ikezaki, S.; Hasegawa, T.; Takahashi,
M. Food Chem. Toxicol. 1995, 33, 21-26.
(40) Rothwell, K. Nature 1974, 252, 69-70.
199
(41) Shi, X.; Dalal, N. S.; Jain, A. C. Food Chem. Toxicol. 1991, 29, 1-6.
(42) Devasagayam, T. P.; Kamat, J. P.; Mohan, H.; Kesavan, P. C. Biochim. Biophys.
Acta 1996, 1282, 63-70.
(43) Hayashi, N.; Ujihara, T.; Kohata, K. Biosci. Biotechnol. Biochem. 2004, 68, 2512-
2518.
(44) Martin, R.; Lilley, T. H.; Falshaw, C. P.; Haslam, E.; Begley, M. J.; Magnolato,
D. Phytochem. 1987, 26, 273-279.
(45) Martin, R.; Lilley, T. H.; Bailey, N. A.; Falshaw, C. P.; Haslam, E.; Magnolato,
D.; Begley, M. J. J. Chem. Soc., Chem. Commun. 1986, 105-106.
(46) Horman, I.; Viani, R. J. Food. Sci. 1972, 37, 925-927.
(47) Gaffney, S. H.; Martin, R.; Lilley, T. H.; Haslam, E.; Magnolato, D. J. Chem.
Soc., Chem. Commun. 1986, 107-108.
(48) Maruyama, N.; Suzuki, Y.; Sakata, K.; Yagi, A.; Ina, K. Proc. Int. Sym. Tea Sci.
1991, 145-149.
(49) Oliveira-Brett, A. M.; Diculescu, V. C. Bioelectrochemistry 2004, 64, 133-141.
(50) Brown, J. E.; Khodr, H.; Hider, R. C.; Rice-Evans, C. A. Biochem. J. 1998, 330,
1173-1178.
(51) Yamamoto, N.; Moon, J. H.; Tsushida, T.; Nagao, A.; Terao, J. Arch. Biochem.
Biophys. 1999, 372, 347-354.
(52) Plaper, A.; Golob, M.; Hafner, I.; Oblak, M.; Solmajer, T.; Jerala, R. Biochem.
Biophys. Res. Comm. 2003, 306, 530-536.
200

(53) Hollstein, M.; Sidransky, D.; Vogelstein, B.; Harris, C. C. Science 1991, 253, 49-
53.
(54) Perron, N. R.; Chaur, M. N.; Brumaghim., J. L. 2009, submitted.
(55) Johnson, M. K.; Loo, G. Mutat. Res. 2000, 459, 211-218.
(56) Ohshima, H.; Yoshie, Y.; Auriol, S.; Gilibert, I. Free Radic. Biol. Med. 1998, 25,
1057-1065.
(57) Sahu, S. C.; Washington, M. C. Cancer Lett. 1991, 60, 259-264.
(58) Duthie, S. J.; Johnson, W.; Dobson, V. L. Mutat. Res. 1997, 390, 141-151.
(59) Gil, M. I.; Tomas-Barberan, F. A.; Hess-Pierce, B.; Kader, A. A. J. Agric. Food
Chem. 2002, 50, 4976-4982.
(60) Tomas-Barberan, F. A.; Gil, M. I.; Cremin, P.; Waterhouse, A. L.; Hess-Pierce,
B.; Kader, A. A. J. Agric. Food. Chem. 2001, 49, 4748-4760.
(61) Doll, R. Proc. Nutr. Soc. 1990, 49, 119-131.
(62) Knekt, P.; Jarvinen, R.; Reunanen, A.; Maatela, J. Br. Med. J. 1996, 312, 478-
481.
(63) Bors, W.; Heller, W.; Michel, C.; Saran, M. Methods Enzymol. 1990, 186, 343-
355.
(64) Rimm, E. B.; Katan, M. B.; Ascherio, A.; Stampfer, M. J.; Willett, W. C. Ann.
Intern. Med. 1996, 125, 384-389.
(65) Cevallos-Casals, B. A.; Byrne, D.; Okie, W. R.; Cisneros-Zevallos, L. Food
Chem. 2006, 96, 273.
201

(66) Duthie, G. G.; Duthie, S. J.; Kyle, J. A. Nutr. Res. Rev. 2000, 13, 79-106.
(67) Tsuda, T.; Horio, F.; Osawa, T. Lipids 1998, 33, 583-588.
(68) Shulaev, V.; Korban, S. S.; Sosinski, B.; Abbott, A. G.; Aldwinckle, H. S.; Folta,
K. M.; Iezzoni, A.; Main, D.; Arus, P.; Dandekar, A. M.; Lewers, K.; Brown, S.
K.; Davis, T. M.; Gardiner, S. E.; Potter, D.; Veilleux, R. E. Plant Physiol. 2008,
147, 985-1003.
(69) Bassi, D.; Monet, R. Botany and Taxonomy 2008, pp 1-36.
(70) Cevallos-Casals, B. A.; Cisneros-Zevallos, L. Food Chem. 2004, 86, 69-77.
(71) Deineka, V.; Deineka, L.; Sirotin, A. Chem. Natural Compounds 2005, 41, 230-
231.
(72) Cevallos-Casals, B. A.; Byrne, D.; Cisneros-Zevallos, L.; Okie, W. R. Acta Hort.
2002, 592, 589-592.
(73) Horn, R.; Lecouls, A. C.; Callahan, A.; Dandekar, A.; Garay, L.; McCord, P.;
Howad, W.; Chan, H.; Verde, I.; Main, D.; Jung, S.; Georgi, L.; Forrest, S.;
Mook, J.; Zhebentyayeva, T.; Yu, Y. S.; Kim, H. R.; Jesudurai, C.; Sosinski, B.;
Arus, P.; Baird, V.; Parfitt, D.; Reighard, G.; Scorza, R.; Tomkins, J.; Wing, R.;
Abbott, A. G. Theor. Appl. Genet. 2005, 110, 1419-1428.
(74) Imlay, J. A.; Linn, S. Science 1988, 240, 1302-1309.
(75) Ikawa, M.; Schapper, T. D.; Dollard, C. A.; Sasner, J. J. J. Agri. Food Chem.
2003, 51, 1811-1815.
(76) Obanda, M.; Owuor, P. O. J. Sci. Food Agric. 1997, 74, 209-215.
202

(77) Perkowski, D. A.; Perkowski, M.; Data and Probability Connections; Pearson
Prentice Hall: New Jersey, 2007, pp 318-337.
203

CHAPTER SIX
CONCLUSIONS ABOUT THE ANTIOXIDANT ACTIVITIES OF INORGANIC
SELENIUM, OXO-SULFUR, AND POLYPHENOL COMPOUNDS AND THE
BIOLOGICAL IMPLICATIONS OF NANOPARTICLE FUNCTIONALIZATION
Generation of hydroxyl radical (•OH) from oxidation of redox-active metals such
as iron and copper by hydrogen peroxide (H2O2) causes DNA damage, resulting in
mutations cell death, and diseases such as cancer,1 aging,2 arteriosclerosis, Alzheimer’s
and Parkinson’s diseases.3-5 The ability of selenium, sulfur, and polyphenol compounds
to exhibit antioxidant and/or pro-oxidant activities may be beneficial in the prevention or
treatment of these diseases caused by oxidative stress.6-11
Since most studies have focused on the antioxidant activity of organosulfur and
organoselenium compounds, our experiments investigated four inorganic selenium
compounds for their ability to prevent DNA damage produced by either iron or copper
and hydrogen peroxide.12 The antioxidant efficacy of inorganic selenium compounds
with iron-mediated DNA damage is complex, since these compounds exhibit both
antioxidant and pro-oxidant properties depending on concentrations of the selenium
compound or H2O2.12 However, inorganic selenium compounds are antioxidants with
copper-mediated DNA damage. Oxidation state of the selenium atom of inorganic
selenium compounds is important for the activities of these compounds. Inorganic
selenium compounds in the +4 oxidation state, such as selenite and selenium dioxide, are
capable of both inhibiting and producing DNA damage, whereas those with oxidation
204

states of -2 and +6 have no effect on iron- or copper-mediated DNA damage. From our
experiments, iron or copper coordination is proven to be a novel mechanism for the
antioxidant activity of Na2SeO3 and SeO2. This iron-binding mechanism is also
responsible for the pro-oxidant ability of SeO2 at low concentrations.12 Previous studies
have shown that both inorganic and organic selenium compounds have application for
use in dietary supplements, food products, and in the treatment and prevention of
diseases. However, little is understood about the antioxidant activity and antioxidant
mechanisms of these compounds. Our results highlight the complexity of the antioxidant
and pro-oxidant activities of inorganic selenium compounds and have elucidated a novel
metal-binding mechanism for this activity. The results of this work will contribute to a
better understanding of how inorganic selenium compounds exerts their effects, with
great implications in determining proper nutritional quantities for fertilizers, food
products, and supplements for disease prevention.
Similar experiments investigating the effects of five oxo-sulfur compounds
indicate that these compounds are generally more effective at inhibiting copper-mediated
DNA damage than that produced by iron. This result suggests that the metal ion affects
antioxidant activity. Methionine sulfoxide (MetSO) and methyl cysteine sulfoxide
(MeCysSO) both prevented copper-mediated DNA damage, with low IC50 values (8.1-18
μM), an effect not observed for iron-mediated DNA damage.13 In addition, oxidation
state of the thiolate sulfur atom may also be a determining factor for prevention of DNA
damage by Cu+/H2O2, but not against Fe2+/H2O2 generated DNA damage. Interestingly,
methyl methane thiosulfonate (MMTS) is a pro-oxidant in the presence of Cu+/H2O2, but
205

exhibits a small amount of antioxidant activity with Fe2+/H2O2 DNA damage. While our
experiments indicate that iron binding to MMTS is responsible for the observed
antioxidant activity, copper coordination plays no role in the observed pro-oxidant
activity of MMTS, indicating that radical generation may be involved.13
The mechanisms for antioxidant and pro-oxidant activities of oxo-sulfur
compounds are more complex than those for the inorganic selenium compounds. Copper
coordination is a novel mechanism responsible for most, but not all, of the antioxidant
properties of oxo-sulfur compounds. UV-vis spectroscopy of antioxidant sulfur
compounds added to copper show Cu-S charge transfer bands at 240 nm, correlating to
prevention of copper-mediated DNA damage.13 However, gel electrophoresis
experiments show that copper-binding is only partly responsible for the antioxidant
activity observed for oxo-sulfur compounds, and indicate that a second mechanism, most
likely radical scavenging, is also responsible for additional antioxidant activity
observed.13 Our results show the complex nature of the antioxidant effects and
mechanisms for oxo-sulfur compounds, and give insight for disparities in disease
prevention and treatment trials. Further investigations are therefore required to fully
understand the mechanistic action of oxo-sulfur compounds advance treatment or
prevention of disease with these or similar compounds. Additionally, since most oxo-
sulfur compounds are consumed in foods, it is essential to establish accurate nutritional
requirements for these compounds to maintain proper health.
Electrospray ionization mass spectroscopy (ESI-MS) experiments further support
copper coordination as the mechanism for the antioxidant activity of both selenium and
206

sulfur compounds. Copper binds to selenium or sulfur compounds in a 1:1 ratio for most
antioxidant sulfur compounds tested. Because several sulfur and selenium compounds
that do not prevent copper-mediated DNA damage also show copper coordination in the
mass spectrometry experiments, copper binding is required but not sufficient for the
observed antioxidant activity. These studies suggest that the specific chemical properties
of sulfur and selenium compounds, rather than the presence of sulfur or selenium alone,
play an important role in determining antioxidant activity.
Polyphenols such as epigallocatechin-3-gallate (EGCG) and quercetin (Q) have
been shown to prevent DNA damage produced by Fe2+/H2O2. However, combination of
these polyphenols with caffeine can affect their antioxidant ability. Comparatively,
EGCG/caffeine (1:1 ratio) and EGCG alone have the same ability to prevent DNA
damage. However, addition of caffeine to Q (1:1 ratio), significantly lowers the activity
compared to Q alone. Our results show the importance of understanding the synergistic or
antagonistic antioxidant activity of combining compounds commonly found in food. π-
stacking interactions have been shown to occur between polyphenols and caffeine,14 and
these interactions may be responsible for the antioxidant activity changes when caffeine
is combined with polyphenols. In addition to the gel electrophoresis experiments
performed with one equivalent of caffeine, polyphenol compounds containing two gallol
or catechol groups should be tested using two or more equivalents of caffeine to
investigate whether π stacking of caffeine to both gallol or catechol groups affects
antioxidant activity. Such studies will promote understanding of how these compounds
interact with each other and how dietary combinations may modify antioxidant activity.
207

Additionally, since caffeine is structurally similar to DNA bases such as adenine and
guanine, investigations to determine π-stacking interactions between polyphenol
compounds and DNA bases will be beneficial in elucidating the effects of DNA
interactions on polyphenol antioxidant activity.
Since inorganic selenium compounds are consumed in dietary supplements that
may contain other antioxidant compounds, combinations of these components also can be
tested via gel electrophoresis experiments to determine whether such combinations alter
the antioxidant efficacy inorganic selenium compounds. Similar experiments can be
performed with the oxo-sulfur compounds in combination with allicin, alliin, and methyl
cysteine sulfoxide since these are commonly found in garlic and synthesized garlic
extracts. Such experiments will elucidate the varying effects observed for inorganic
selenium and oxo-sulfur compounds in the treatment or prevention of diseases.
The ability of peach extracts obtained from the Abbott group at Clemson
University to inhibit iron-mediated DNA damage was examined using four samples.
Extract from the genetically modified peach (BY) is showed the most potent antioxidant
activity at ~6.9 μM, followed by Red Globe, Lovell, and Sugar Giant peach extracts at
the same concentration. The ability of peach extracts to inhibit iron-mediated DNA
damage is a new area of research, and these preliminary experiments indicate that peach
polyphenols do prevent iron-mediated oxidative DNA damage. Further experiments to
determine the antioxidant ability of anthocyanins on copper-mediated DNA damage
should also be performed, as well as to determine the anthocyanin compounds
responsible for the observed DNA damage activity. It is expected that antioxidant activity
208

of anthocyanin to prevent Cu+/H2O2-mediated DNA damage will be different than that
observed with Fe2+/H2O2 since such differences have been previously observed for
polyphenol compounds.15 Because peaches are a widely consumed fruit, our results show
that genetically modified peaches may be more beneficial for disease prevention due to
their high antioxidant activity compared to unmodified, lower antioxidant peaches. Our
preliminary results also support the need for breeding programs focused on producing
genetically-modified peach cultivars with increased antioxidant properties and increased
ability to prevent ROS-mediated DNA damage.
The ability of ROS to induce DNA damage and cell death has been applied to
photodynamic therapy (PDT) for the treatment of cancer. Tetraphenyl porphyrin (TPP)-
doped CP dot nanoparticles synthesized by the McNeill group at Clemson University
have great potential for use as photosensitizers for PDT because of their high molar
absorptivity (107-109 M-1 cm-1) and generation of singlet oxygen upon irradiation.16
Irradiation of TPP-doped nanoparticles produces both DNA backbone and base damage,
which increases with increasing irradiation time, thus supporting the use of these
nanoparticles as effective and efficient photosensitizers for PDT. To further develop this
work, experiments using the Fpg, Nth, and OGG enzymes to determine specific types of
DNA base damage produced upon irradiation. Our results also provide proof-of-principle
experiments to indicate that similar nanoparticle photosensitizer carriers may be effective
for PDT.
Apart from PDT, use of nanomaterials for medical applications is a quickly
evolving field of research, making toxicity of such materials a serious concern. Our
209

preliminary experiments show that polyethylene glycol (PEG) can generate H2O2 and
associate to iron in biologically relevant concentrations. These results suggest that PEG-
functionalized nanoparticles used for medical purposes may result in cytotoxicity due to
hydroxyl radical formation upon reaction of iron and peroxide. However, to fully
understand the toxic effects of functionalized nanoparticles, studies to further evaluate
peroxide formation and metal association of these nanoparticles are necessary. In
addition, the effects of functionalized nanoparticles can be performed to quantify the
amount of DNA damage produced upon reaction of iron with H2O2. Investigating the
toxicity of nanomaterials will provide direction for the design of less toxic nanoparticles
for medicinal applications.
These in vitro DNA damage studies are reliable for determining the antioxidant
and pro-oxidant effects of inorganic selenium, oxo-sulfur, and polyphenol compounds.
However, these experiments should be extended to cellular systems to further validate
our in vitro results. Similar cellular studies can also be applied for determining the
effectiveness and toxicity of doped or functionalized nanoparticles under more biological
conditions. Ultimately, animal and clinical studies may be performed with inorganic
selenium, oxo-sulfur, polyphenol compounds, and/or combinations of compounds with
high antioxidant activity to better elucidate their ability and mechanisms of action in the
prevention or treatment of disease. In addition, these studies will help in determining the
most effective and efficient compounds or foods for supplementation to maintain good
health, and prevent diseases produced by oxidative stress.
210
References
(1) Steinberg, D. J. Biol. Chem. 1997, 272, 20963-20966.
(2) Henle, E. S.; Luo, Y.; Linn, S. Biochemistry 1996, 35, 12212-12219.
(3) Halliwell, B. Drugs Aging 2001, 18, 685-716.
(4) Huang, X. Mutat. Res. 2003, 533, 153-171.
(5) Singal, P. K.; Khaper, N.; Palace, V.; Kumar, D. Cardiovas. Res. 1998, 40, 426-
432.
(6) Valko, M.; Rhodes, C. J.; Moncol, J.; Izakovic, M.; Mazur, M. Chemico-
Biological Interactions 2006, 160, 1-40.
(7) Huang, X. Mutat. Res. 2003, 533, 153-171.
(8) Gil, M. I.; Tomas-Barberan, F. A.; Hess-Pierce, B.; Kader, A. A. J. Agric. Food
Chem. 2002, 50, 4976-4982.
(9) Sutherland, B. A.; Rahman, R. M. A.; Appleton, I. J. Nutr. Biochem. 2006, 17,
291-306.
(10) Holmgren, A. Free Rad. Biol. Med. 2006, 41, 862-865.
(11) Takahashi, M.; Sato, T.; Shinohara, F.; Echigo, S.; Rikiishi, H. Int. J. Oncol.
2005, 27, 489-495.
(12) Ramoutar, R. R.; Brumaghim, J. L. J. Inorg. Biochem. 2007, 101, 1028-1035.
211

212
(13) Ramoutar, R. R.; Brumaghim, J. L. Main Group Chem. 2007, 6, 143-153.
(14) Hayashi, N.; Ujihara, T.; Kohata, K. Biosci. Biotechnol. Biochem. 2004, 68, 2512-
2518.
(15) Perron, N. R.; Chaur, M. N.; Brumaghim., J. L. 2009, submitted.
(16) Grimland, J. L.; Wu, C.; Ramoutar, R. R.; Aristizabal, K.; Brumaghim, J.;
McNeill, J. 2009, in preparation.