Embed Size (px)
Citation preview
Towards Understanding the Mechanism of Catalysis by Benzoylformate Decarboxylase: Enzyme and Solution-
phase Studies
by
Liliana Guevara Opinska
A thesis submitted in conformity with the requirements for the degree of Master of Science
Chemistry Department University of Toronto
© Copyright by Liliana Guevara Opinska (2015)

ii
Towards Understanding the Mechanism of Catalysis by
Benzoylformate Decarboxylase: Enzyme and Solution-phase
Studies
Liliana Guevara Opinska
Master of Science
Chemistry Department University of Toronto
2015
Abstract Benzoylformate decarboxylase (BFD) is a thiamine diphosphate (ThDP) dependent enzyme that
catalyzes the non-oxidative cleavage of benzoylformate to benzaldehyde and CO2. BFD catalysis
occurs a million times faster than the solution-phase decarboxylation of the synthetic analogue;
2-(α-Mandelyl)thiamine (MTh).
Although the function of the ThDP cofactor is well understood, the role of the protein
environment in promoting catalysis is not.
The recently reported mechanism for the base-catalyzed, solution decarboxylation of MTh could
be an accurate model for the enzymatic decarboxylation by BFD. Studies suggest serine 26 in the
active site of BFD, participates in catalysis, in a way analogous to water in the base-catalyzed
mechanism.
This work encompasses results from enzyme kinetics and inhibition studies. It also includes
activation parameters for the base-catalyzed decarboxylation of MTh. Taken together the data
supports an enzymatic mechanism, similar to serine hydrolases, in which serine 26 acts as a
nucleophile to trap CO2.

iii
In loving memory of my Grandfather, David Guevara Feliciano
He instilled in me a curiosity for science and a love of nature.

iv
Acknowledgments
I would like to thank my supervisor Prof. Ronald Kluger for giving me the opportunity to work
on this fascinating project. As a teacher he is responsible for sparking my interest and love of
Physical Organic Chemistry. As a supervisor he was always enthusiastic and encouraging. Ron,
your philosophical approach to chemistry is true art and has been an incredible source of
inspiration to me. Thank you for believing in me and for your input in my professional and
personal growth.
I would like to thank the past and present members of the Kluger group. Thank you: Aizhou
Wang, Serena Singh, Adelle Vandersteen, Erika Siren, Yuyang Li, Yi Han, Daniel Bator,
Elizabeth Wilson and Sohyoung Her for making our lab such a positive and enjoyable place.
Thank you, Chung-Woo Fung for your technical assistance. Thank you, Raj Dhiman for your
mentorship. Thank you, Scott Mundle for being the best T.A. ever and encouraging me to pursue
a graduate degree. Thank you, Michael Bielecki for your invaluable support and friendship.
Thank you, Graeme Howe for your help, support, friendship and the many unforgettable
moments spent together over the past 4 years.
I would like to thank Prof. Michael McLeish at the Indiana University-Purdue University
Indianapolis for hosting me at his laboratory and teaching me useful molecular biology
techniques. Forest Andrews, thank you for the helpful discussions and suggestions but above all
thank you for your friendship and for making my time in Indianapolis so enjoyable.
I would like to thank Prof. Deborah Zamble and the members of her group for their helpful
suggestions and for allowing me to use their laboratory equipment. I would also like to thank
Prof. Jik Chin for reviewing this thesis.
Lastly and most importantly I would like to thank my parents Elżbieta Opinska and David
Guevara and brother David Guevara Jr. for their unconditional love and support. You are my
main source of strength, inspiration and motivation. You are my raison d’être. I love you.
v
Table of Contents
Abstract……………………………………………………………………………………………ii
Acknowledgments………………………………………………………………………………..iv
List of Tables…………………………………………………………………………………….ix
List of Equations…………………………………………………………………………………..x
List of Figures…………………………………………………………………………………….xi
List of Schemes…………………………………………………………………………………..xii
List of Abbreviations……………………………………………………………………………xiii
List of Appendixes………………………………………………………………………………xvi
Chapter 1: Introduction
1.1 Thiamine diphosphate as a cofactor……………………………………..…………....1
1.2 Catalytic cycle in ThDP-dependent decarboxylation…………………………………2
1.3 Benzoylformate decarboxylase………………………………………………………..4
1.3.1 Structure of BFD…………………………………………………………….4
1.3.2 Active site of BFD…………………………………………………………..6
1.3.3 Role of serine 26 in catalysis by BFD………………………………………7
1.4 Comparison of mechanisms on BFD and in solution……………………………….10
1.5 Decarboxylation accelerated by desolvation…………………………………………12

vi
1.6 Internal return in decarboxylation …………………………………………………...13
1.6.1 Pyridinium-catalyzed decarboxylation…………………………………….14
1.6.2 Base-catalyzed decarboxylation……………………………………………16
1.6.3 Internal return and enzymatic mechanisms………………………………...17
1.7 Activation Energies in Decarboxylation……………………………………………..18
1.8 Hypotheses and Purpose of Study……………………………………………………21
Chapter 2: Experimental
2.1 Instrumentation………………………………………………………………………22
2.2 Materials……………………………………………………………………………..22
2.3 Synthesis……………………………………………………………………………..23
2.3.1 Synthesis of MBP……………………….…………………………………23
2.3.2 Synthesis of BP……………………………………………………………24
2.3.3 Synthesis of MoBP…………………...……………………………………25
2.3.4 Synthesis of BoP……………...……………………………………………26
2.3.5 Synthesis of MTh ethyl ester……………….……………………………...27
2.4 Protein expression and purification…………………………………………………29
2.4.1 Protein expression…………………………………………………………29
2.4.2 Protein purification………………………………………………………...30
2.5 Tryptic digest………………………………………………………………………..31
2.6 Kinetic methods……………………………………………………………………...32
vii
2.6.1 Coupled assay using HLAD……………………………...………………32
2.6.2 Inhibition studies…………………………………………………………..33
2.6.3 Kinetics of MTh decarboxylation in solution……………..………………34
2.6.4 Determination of SKIEs…………………………………..………………..35
Chapter 3: Results
3.1 Synthesis……………………………………………………………………………..36
3.2 Protein expression and purification………………………………………………….37
3.3 Tryptic digest………………………………………………………………………..38
3.4 Enzyme kinetics……………………………………………………………………..40
3.4.1 Inhibition of wild-type BFD…………………………..…………………..40
3.4.2 Kinetic parameters for S26 mutants…………………………………….…41
3.5 Activation parameters for base-catalyzed decarboxylation of MTh…………….….50
3.6 Solvent kinetic isotope effects……………………………………………………….47
Chapter 4: Discussion
4.1 Tryptic digest………………………………………………………………………..48
4.2 Inhibitors of BFD…………………………………………………………………….48
4.3 Kinetic Parameters for Serine 26 Mutants on BFD………………………………….53
4.4 Kinetics, activation parameters and SKIEs for decarboxylation of MTh in
solution……………………………………………………………………………...……55
Chapter 5: Conclusions and Future Directions……………………………………………….60
viii
References……………………………………………………………………………………….62
Appendixes………………………………………………………………………………………66
ix
List of Tables
Table 3.1 Results from the tryptic digest of BFD-His6 analyzed by LC-MS/MS……………….38
Table 3.2 Inhibition constants of a number of inhibitors of BFD……………………………….40
Table 3.3 Kinetic Parameters for BFD and its mutants………………………………………....41
Table 3.4 Activation Parameters for the Base-catalyzed Decarboxylation of MTh at varying
acetate concentrations at pH 4.6 and I= 1M……………………………………………………..43
Table 3.5 Activation Parameters for the Base-catalyzed Decarboxylation of MTh at varying
acetate concentrations at pH 7.2 and I = 2.0 M………….............................................................44
Table 3.6 SKIEs at different pHs………………………………………………………………..47
x
List of Equations
Equation 1.1 Eyring-Polanyi Equation………………………………………………………….18
Equation 1.2 Equation relating the Gibbs free energy of activation to enthalpy and entropy of
activation…………………………………………………………………………………………18
Equation 2.1 Michaelis-Menten equation……………………………………………………….33
Equation. 2.2 Equation used to calculate inhibition constants…………………………..……...33
Equation 2.3 Rate law for the base-catalyzed decarboxylation of protonated MTh…..………..34
Equation 2.4 pH correction in deuterium oxide………………………………………………...35
xi
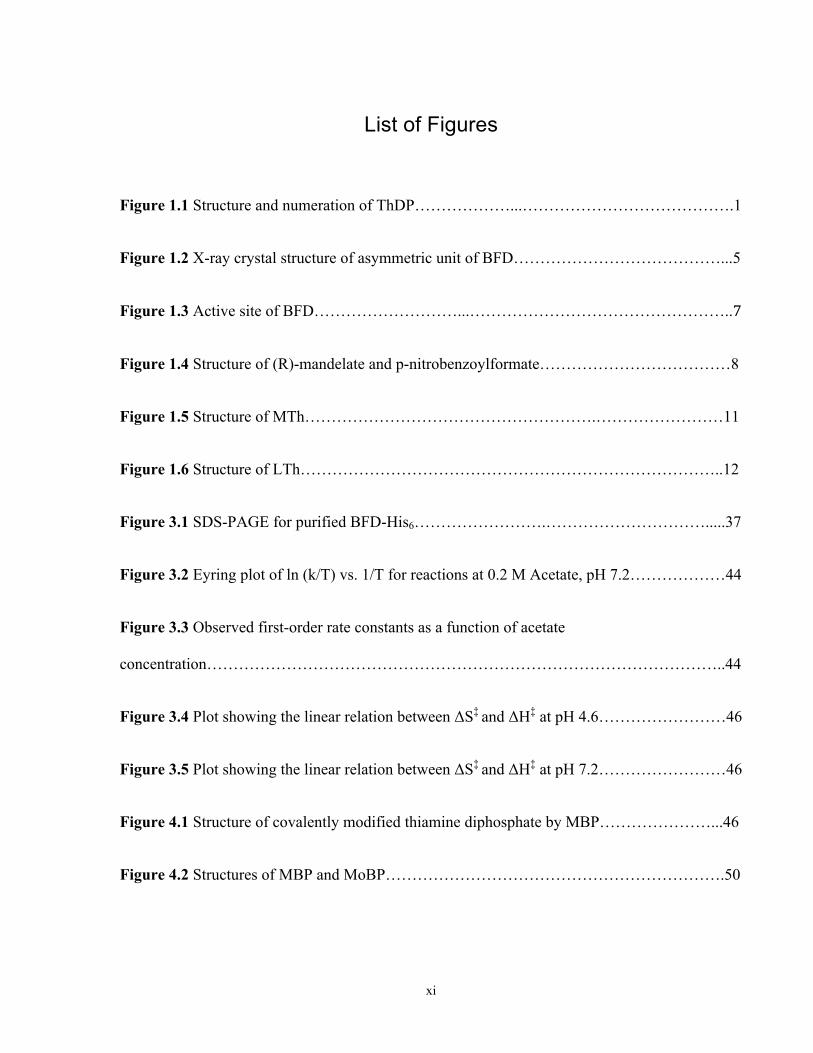
List of Figures
Figure 1.1 Structure and numeration of ThDP………………...………………………………….1
Figure 1.2 X-ray crystal structure of asymmetric unit of BFD…………………………………...5
Figure 1.3 Active site of BFD………………………...…………………………………………..7
Figure 1.4 Structure of (R)-mandelate and p-nitrobenzoylformate………………………………8
Figure 1.5 Structure of MTh……………………………………………….……………………11
Figure 1.6 Structure of LTh……………………………………………………………………..12
Figure 3.1 SDS-PAGE for purified BFD-His6…………………….………………………….....37
Figure 3.2 Eyring plot of ln (k/T) vs. 1/T for reactions at 0.2 M Acetate, pH 7.2………………44
Figure 3.3 Observed first-order rate constants as a function of acetate
concentration……………………………………………………………………………………..44
Figure 3.4 Plot showing the linear relation between ΔS‡ and ΔH‡ at pH 4.6……………………46
Figure 3.5 Plot showing the linear relation between ΔS‡ and ΔH‡ at pH 7.2……………………46
Figure 4.1 Structure of covalently modified thiamine diphosphate by MBP…………………...46
Figure 4.2 Structures of MBP and MoBP……………………………………………………….50
xii
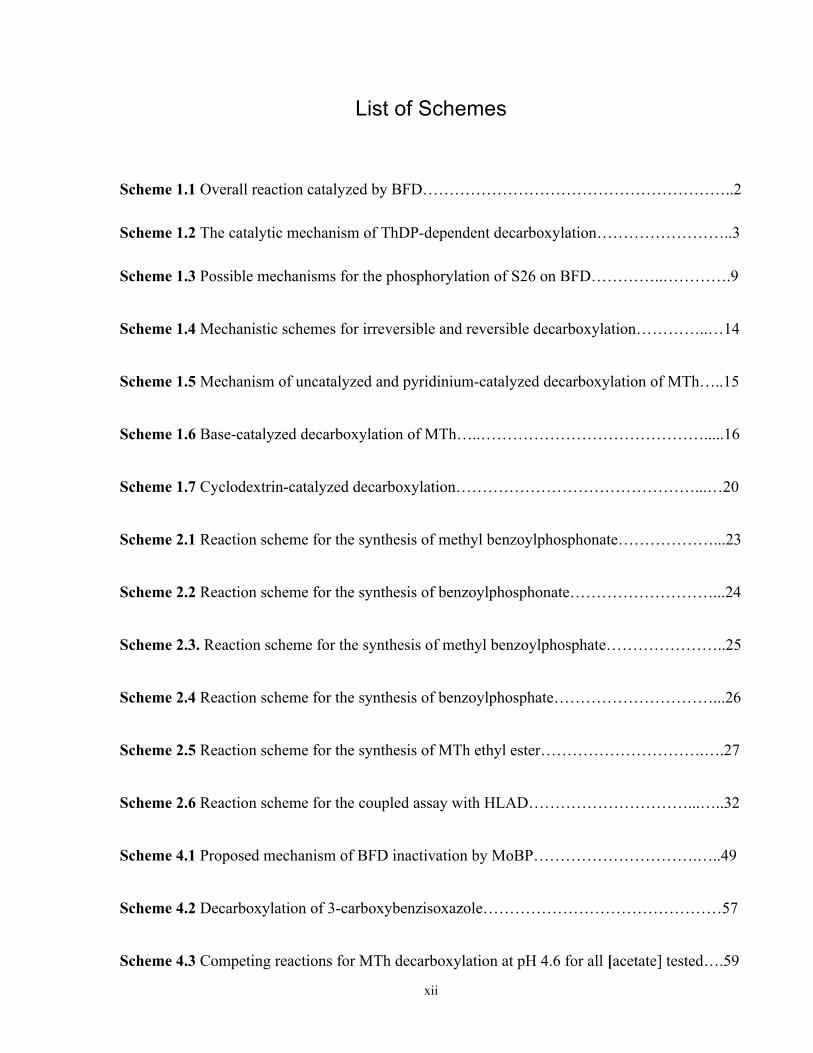
List of Schemes
Scheme 1.1 Overall reaction catalyzed by BFD…………………………………………………..2
Scheme 1.2 The catalytic mechanism of ThDP-dependent decarboxylation……………………..3
Scheme 1.3 Possible mechanisms for the phosphorylation of S26 on BFD…………..………….9
Scheme 1.4 Mechanistic schemes for irreversible and reversible decarboxylation…………..…14
Scheme 1.5 Mechanism of uncatalyzed and pyridinium-catalyzed decarboxylation of MTh…..15
Scheme 1.6 Base-catalyzed decarboxylation of MTh…..…………………………………….....16
Scheme 1.7 Cyclodextrin-catalyzed decarboxylation………………………………………...…20
Scheme 2.1 Reaction scheme for the synthesis of methyl benzoylphosphonate………………...23
Scheme 2.2 Reaction scheme for the synthesis of benzoylphosphonate………………………...24
Scheme 2.3. Reaction scheme for the synthesis of methyl benzoylphosphate…………………..25
Scheme 2.4 Reaction scheme for the synthesis of benzoylphosphate…………………………...26
Scheme 2.5 Reaction scheme for the synthesis of MTh ethyl ester………………………….….27
Scheme 2.6 Reaction scheme for the coupled assay with HLAD…………………………...…..32
Scheme 4.1 Proposed mechanism of BFD inactivation by MoBP………………………….…..49
Scheme 4.2 Decarboxylation of 3-carboxybenzisoxazole………………………………………57
Scheme 4.3 Competing reactions for MTh decarboxylation at pH 4.6 for all [acetate] tested….59
xiii
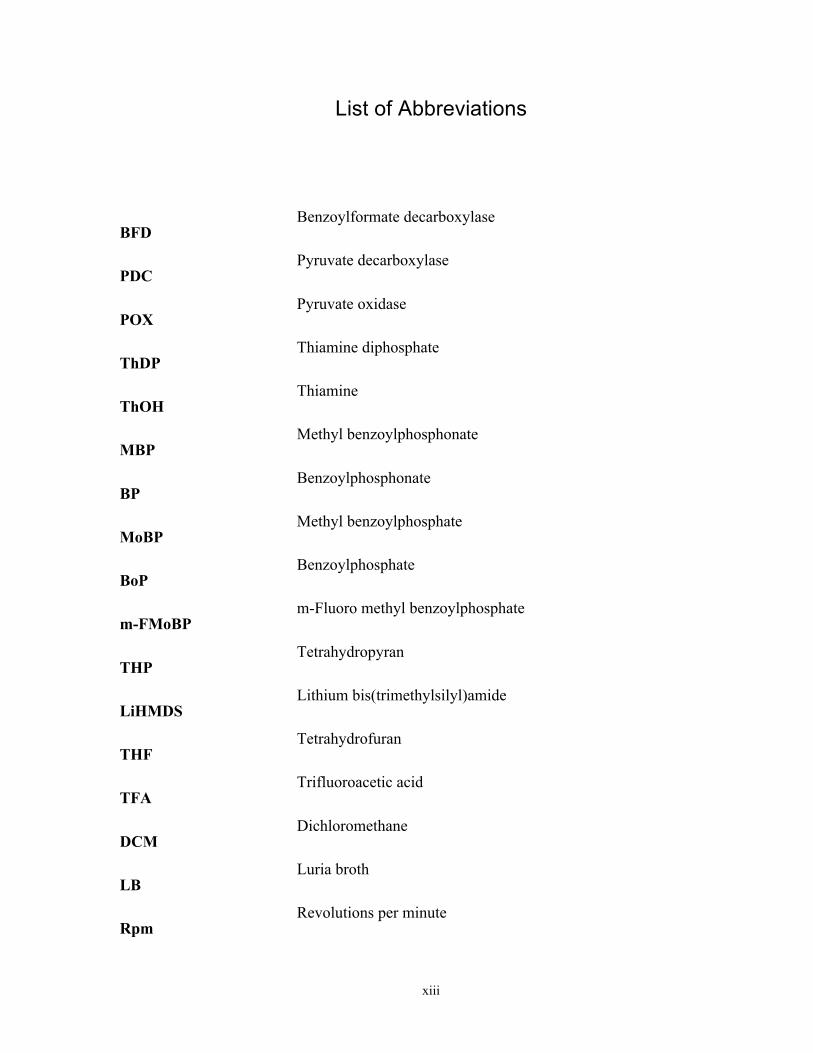
List of Abbreviations
BFD Benzoylformate decarboxylase
PDC Pyruvate decarboxylase
POX Pyruvate oxidase
ThDP Thiamine diphosphate
ThOH Thiamine
MBP Methyl benzoylphosphonate
BP Benzoylphosphonate
MoBP Methyl benzoylphosphate
BoP Benzoylphosphate
m-FMoBP m-Fluoro methyl benzoylphosphate
THP Tetrahydropyran
LiHMDS Lithium bis(trimethylsilyl)amide
THF Tetrahydrofuran
TFA Trifluoroacetic acid
DCM Dichloromethane
LB Luria broth
Rpm Revolutions per minute
xiv
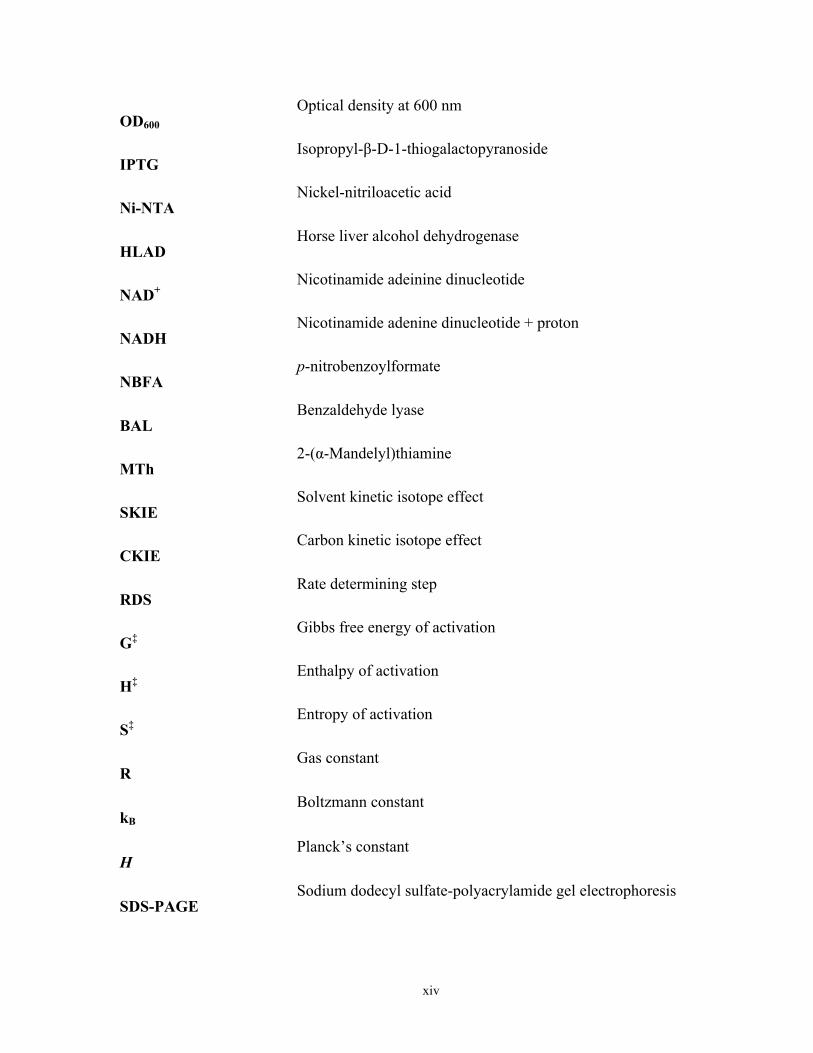
OD600
Optical density at 600 nm
IPTG Isopropyl-β-D-1-thiogalactopyranoside
Ni-NTA Nickel-nitriloacetic acid
HLAD Horse liver alcohol dehydrogenase
NAD+ Nicotinamide adeinine dinucleotide
NADH Nicotinamide adenine dinucleotide + proton
NBFA p-nitrobenzoylformate
BAL Benzaldehyde lyase
MTh 2-(α-Mandelyl)thiamine
SKIE Solvent kinetic isotope effect
CKIE Carbon kinetic isotope effect
RDS Rate determining step
G‡ Gibbs free energy of activation
H‡ Enthalpy of activation
S‡ Entropy of activation
R Gas constant
kB
Boltzmann constant
H Planck’s constant
SDS-PAGE Sodium dodecyl sulfate-polyacrylamide gel electrophoresis
xv
CD Circular dichroism
I Ionic strength
DTT Dithiothreitol
ESI-MS Electrospray ionization mass spectrometry
TK Transketolase
LC Liquid chromatography
MS/MS Tandem mass spectrometry
LTh 2-(α-Lactyl)thiamine
MThDP 2-(α-Mandelyl)thiamine diphosphate
HBnTDP 2-(1-Hydroxybenzyl)thiamine diphosphate
LThTDP 2-(α-Lactyl)thiamine diphosphate
xvi
List of Appendices
Appendix 1. ExPASy Predicted peptide fragments after Tryptic digest………………………...66
Appendix 2. Rate constants for MTh decarboxylation at pH 4.6 And 7.2 ……………..……….68
Appendix 3. Rate constants used to determine SKIEs…………………………………………..76

1
Chapter 1: Introduction
1.1 Thiamine diphosphate as a cofactor
Thiamine diphosphate (ThDP) is a cofactor, a non-protein chemical compound that is required
for the biological activity of the protein. ThDP has an essential role in most, if not all,
organisms1. It is required at several central points of anabolic and catabolic intermediary
metabolism, such as the pentose-phosphate pathway and the Krebs cycle1. In eukaryotes it is
derived from thiamine (ThOH) (vitamin B1) whereas in prokaryotes it is biosynthesized2. The
only structural difference between ThDP and ThOH is a hydroxyl group that replaces the
diphosphate moiety in the later molecule. The structure of ThDP, shown in Figure 1.1, consists
of three groups: the diphosphate terminated side chain, the thiazolium ring and the
aminoprymidine ring. ThDP assists in making and breaking bonds between carbon and sulfur,
oxygen, nitrogen, hydrogen and carbon1.
Figure 1.1 Structure and numeration of ThDP
Although ThDP-dependent enzymes catalyze diverse reactions, they all share some mechanistic
similarities. These reactions can be broadly classified into two categories: decarboxylating and
non-decarboxylating1. The non-decarboxylating group of reactions involves “transferase”-type
SN+
NH2
N
N
Cl-
P
O
O OHOH
OP
O
OH
12
34
55'
4'
3'2'
1'
6'
2
reactions. An alternative classification involves grouping ThDP-dependent enzymes into those
catalyzing oxidative and non-oxidative reactions3. An example of a ThDP-dependent enzyme
that catalyzes an oxidative reaction is pyruvate oxidase (POX). POX catalyzes the oxidative
formation of acetyl phosphate from pyruvate and a phosphate molecule4. Pyruvate decarboxylase
(PDC) and benzoylformate decarboxylase (BFD) are examples of enzymes that catalyze non-
oxidative decarboxylation. PDC catalyzes the non-oxidative decarboxylation of pyruvate into
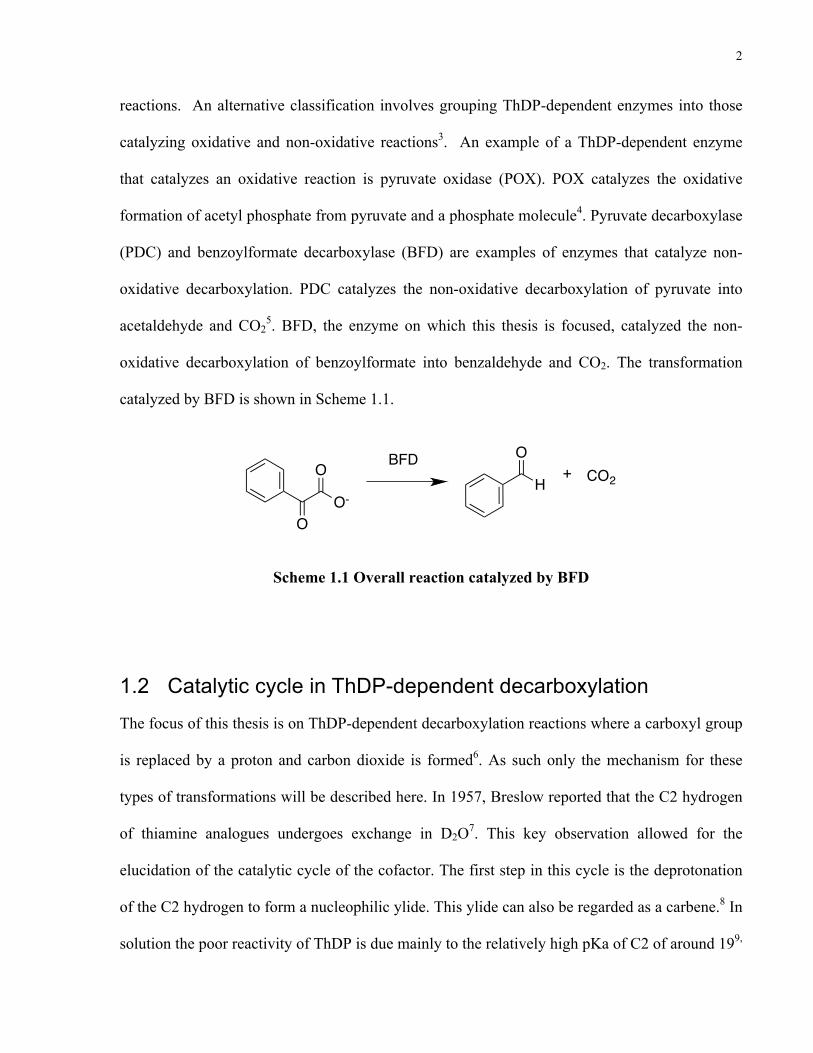
acetaldehyde and CO25. BFD, the enzyme on which this thesis is focused, catalyzed the non-
oxidative decarboxylation of benzoylformate into benzaldehyde and CO2. The transformation
catalyzed by BFD is shown in Scheme 1.1.
Scheme 1.1 Overall reaction catalyzed by BFD
1.2 Catalytic cycle in ThDP-dependent decarboxylation
The focus of this thesis is on ThDP-dependent decarboxylation reactions where a carboxyl group
is replaced by a proton and carbon dioxide is formed6. As such only the mechanism for these
types of transformations will be described here. In 1957, Breslow reported that the C2 hydrogen
of thiamine analogues undergoes exchange in D2O7. This key observation allowed for the
elucidation of the catalytic cycle of the cofactor. The first step in this cycle is the deprotonation
of the C2 hydrogen to form a nucleophilic ylide. This ylide can also be regarded as a carbene.8 In
solution the poor reactivity of ThDP is due mainly to the relatively high pKa of C2 of around 199,
O
O-
O
O
H CO2BFD
+
3
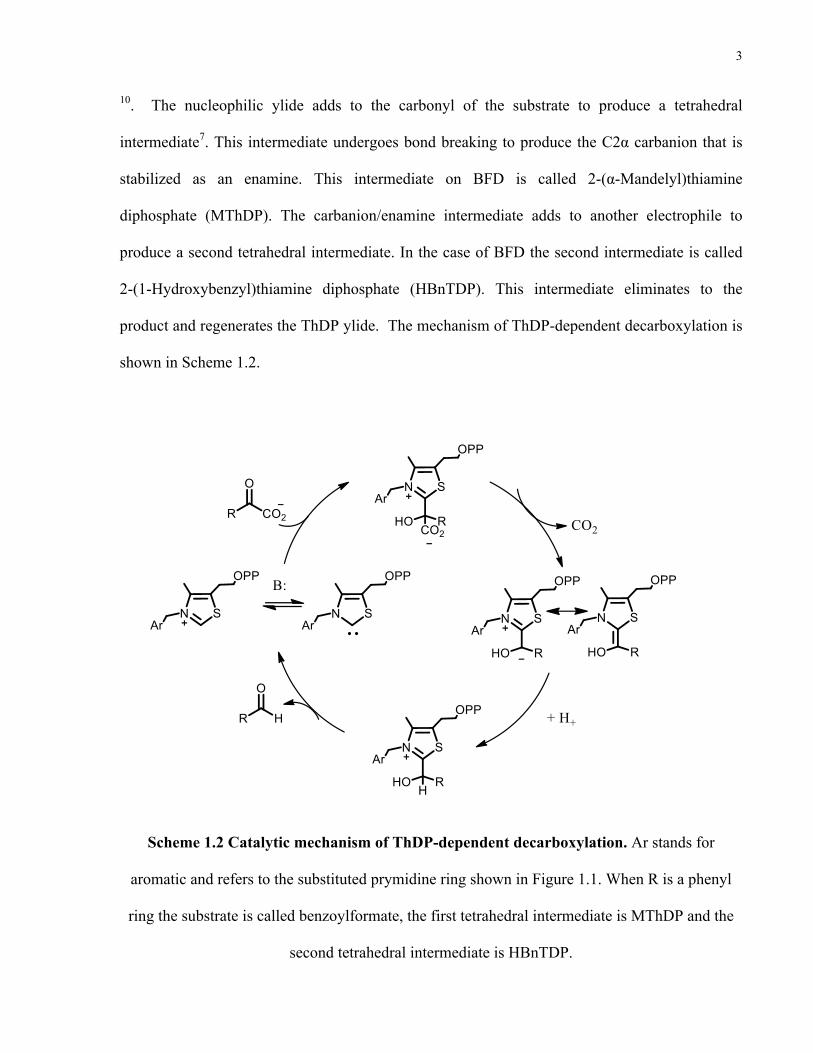
10. The nucleophilic ylide adds to the carbonyl of the substrate to produce a tetrahedral
intermediate7. This intermediate undergoes bond breaking to produce the C2α carbanion that is
stabilized as an enamine. This intermediate on BFD is called 2-(α-Mandelyl)thiamine
diphosphate (MThDP). The carbanion/enamine intermediate adds to another electrophile to
produce a second tetrahedral intermediate. In the case of BFD the second intermediate is called
2-(1-Hydroxybenzyl)thiamine diphosphate (HBnTDP). This intermediate eliminates to the
product and regenerates the ThDP ylide. The mechanism of ThDP-dependent decarboxylation is
shown in Scheme 1.2.
Scheme 1.2 Catalytic mechanism of ThDP-dependent decarboxylation. Ar stands for
aromatic and refers to the substituted prymidine ring shown in Figure 1.1. When R is a phenyl
ring the substrate is called benzoylformate, the first tetrahedral intermediate is MThDP and the
second tetrahedral intermediate is HBnTDP.
4
1.3 Benzoylformate decarboxylase
Benzoylformate decarboxylase (BFD) is the third enzyme in the mandelate pathway of
Pseudomonas and Actinobacter species 11. This pathway allows these organisms to utilize (R)-
mandelic acid as a sole carbon source by converting it to benzoic acid, which is then metabolized
in the β-ketoadipate pathway and the citric acid cycle12. Kenyon and coworkers determined the
Km of the enzyme to be 340 µM and kcat 81 s-1 at 25.0 °C, pH 7.013.
1.3.1 Structure of BFD
BFD is a dimer of dimers14.The molecular weight of BFD is 57 kDa15. Ca (II) and Mg (II) ions
have been identified in the BFD crystal structure14. ThDP is bound at the dimer interface of
BFD14. The structure of BFD is composed of three domains: α, β and γ14. The α and γ domains
are topologically equivalent, while the β domain has a slightly different fold14. Residues, that
make contact with ThDP, are located at the C-terminal of the α and γ domains14.

5
Figure 1.2 X-ray crystal structure of asymmetric unit of BFD (PDB: 1BFD). The large, ball
structure represents ThDP. The two green spheres on the right hand site represent Ca (II) ions.
The green sphere to the left represents Mg (II). The image was captured using FirstGlance in
Jmol.
6
1.3.2 Active site of BFD
ThDP is bound in the “V” conformation on the enzyme16. This describes the position of the
planar aromatic 4’-aminopyrimidine and thiazolium rings with respect to the bridging methylene.
The “V” conformation is not the preferred conformation in the absence of protein since it has a
high potential energy3. A water molecule is present in the active site, 3.2 Å from the C2 atom of
ThDP. It has been speculated that this water molecule may be near the position C2α of the
substrate upon binding to the enzyme. This water molecule forms hydrogen bonds with the
hydroxyl group of serine 26 (S26) and the imidazole ring of histidine 70 (H70) 14. H70 is thought
to act as a catalytic base and its basicity is probably increased by hydrogen bonding with the
carboxylate group of glutamic acid 28 (E28)14. Another amino acid, which is important for
catalysis, is H281, positioned 5.3 Å from the water molecule already mentioned14. H281 is
involved in protonation of the carbanion/enamine17. The active site of the enzyme is shown in
Figure 1.5.
7
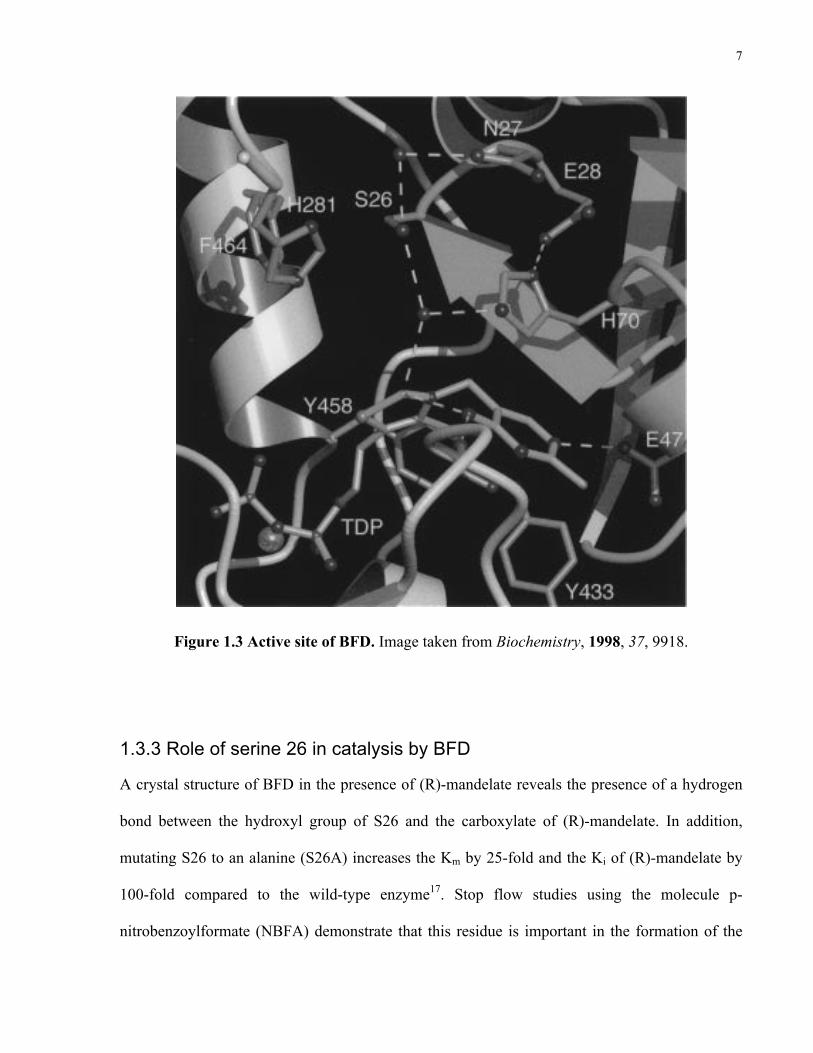
Figure 1.3 Active site of BFD. Image taken from Biochemistry, 1998, 37, 9918.
1.3.3 Role of serine 26 in catalysis by BFD
A crystal structure of BFD in the presence of (R)-mandelate reveals the presence of a hydrogen
bond between the hydroxyl group of S26 and the carboxylate of (R)-mandelate. In addition,
mutating S26 to an alanine (S26A) increases the Km by 25-fold and the Ki of (R)-mandelate by
100-fold compared to the wild-type enzyme17. Stop flow studies using the molecule p-
nitrobenzoylformate (NBFA) demonstrate that this residue is important in the formation of the
8
first covalent intermediate, 2-α-p-nitromandelyl-ThDP17. The S26A mutation also affects the
decarboxylation step, the rate of protonation of the enamine to from 2-α-p-nitrohydroxybenzyl-
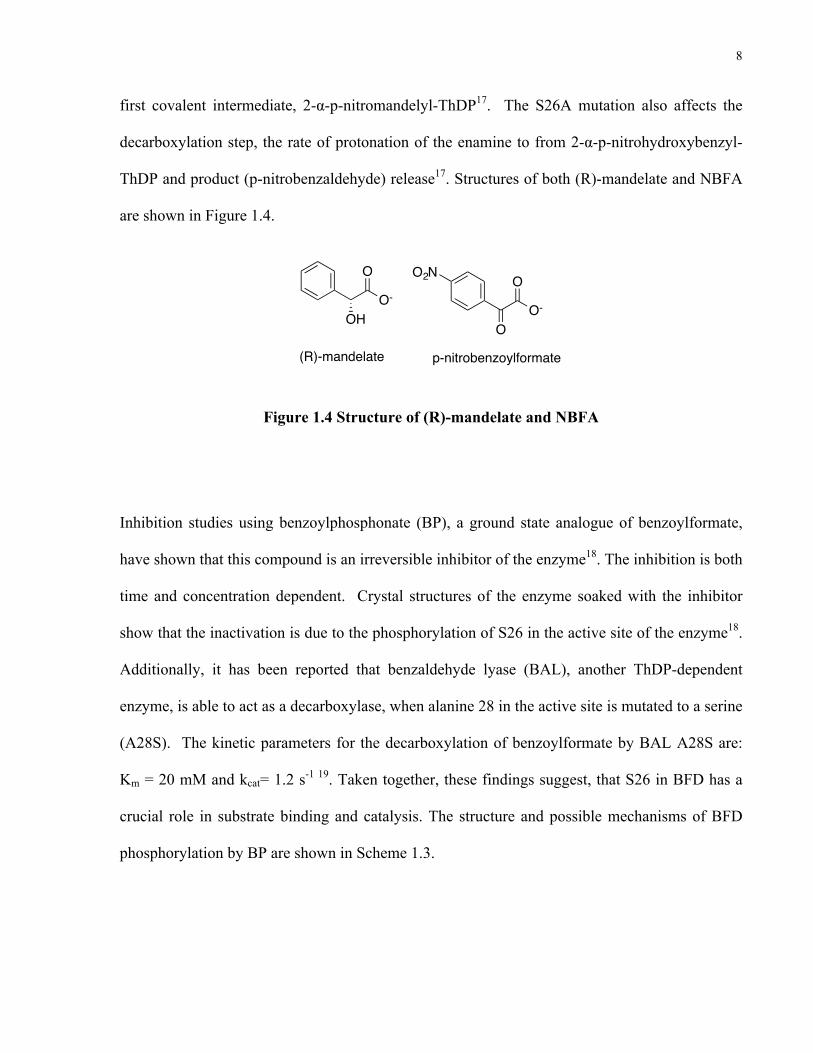
ThDP and product (p-nitrobenzaldehyde) release17. Structures of both (R)-mandelate and NBFA
are shown in Figure 1.4.
Figure 1.4 Structure of (R)-mandelate and NBFA
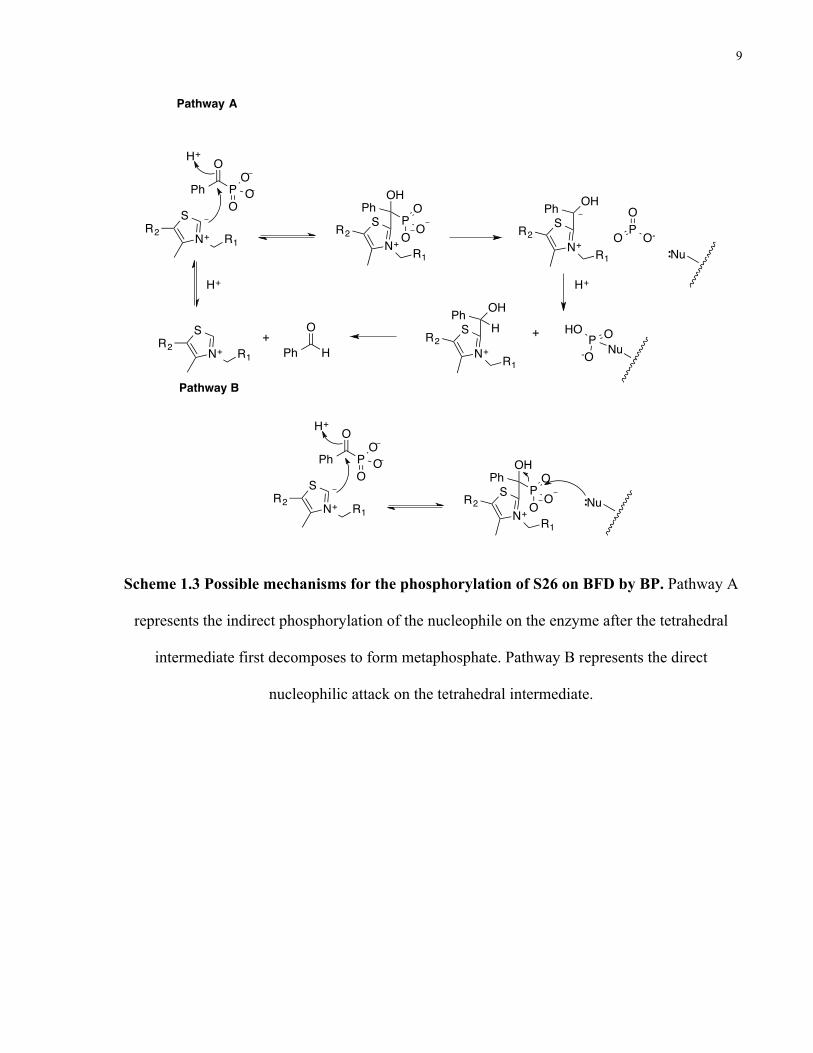
Inhibition studies using benzoylphosphonate (BP), a ground state analogue of benzoylformate,
have shown that this compound is an irreversible inhibitor of the enzyme18. The inhibition is both
time and concentration dependent. Crystal structures of the enzyme soaked with the inhibitor
show that the inactivation is due to the phosphorylation of S26 in the active site of the enzyme18.
Additionally, it has been reported that benzaldehyde lyase (BAL), another ThDP-dependent
enzyme, is able to act as a decarboxylase, when alanine 28 in the active site is mutated to a serine
(A28S). The kinetic parameters for the decarboxylation of benzoylformate by BAL A28S are:
Km = 20 mM and kcat= 1.2 s-1 19. Taken together, these findings suggest, that S26 in BFD has a
crucial role in substrate binding and catalysis. The structure and possible mechanisms of BFD
phosphorylation by BP are shown in Scheme 1.3.
OH
O
O-O
O-
O
O2N
(R)-mandelate p-nitrobenzoylformate
9
Scheme 1.3 Possible mechanisms for the phosphorylation of S26 on BFD by BP. Pathway A
represents the indirect phosphorylation of the nucleophile on the enzyme after the tetrahedral
intermediate first decomposes to form metaphosphate. Pathway B represents the direct
nucleophilic attack on the tetrahedral intermediate.
S
N+ R1R2
Ph
O
PO
OO
S
N+R1
R2
OH
POOO
PhS
N+R1
R2
OHPhPO
O
O-
Nu
H+
S
N+ R1R2 H
O
Ph+ S
N+R1
R2
OHPhH
PHO O
-O Nu+
H+ H+
S
N+ R1R2
Ph
O
PO
OO
S
N+R1
R2
OH
POOO
Ph
H+
Nu
Pathway A
Pathway B

10
1.4 Comparison of mechanisms of decarboxylation on BFD and
in solution
Comparison of the enzymatic rate with that of a suitable non-enzymatic model for the biological
reaction in solution provides a measure of the enzymes’ catalytic proficiency (kcat/knon)20. This
measure allows for an appreciation of what natural selection has accomplished in the evolution
of enzymes as proficient catalysts. It is informative for chemists working in the growing field of
biomimetic chemistry and in producing synthetic catalysts with enzyme-like properties. It
provides a better understanding of the factors involved in the enzymes’ ability to stabilize the
transition state for substrate transformation20.
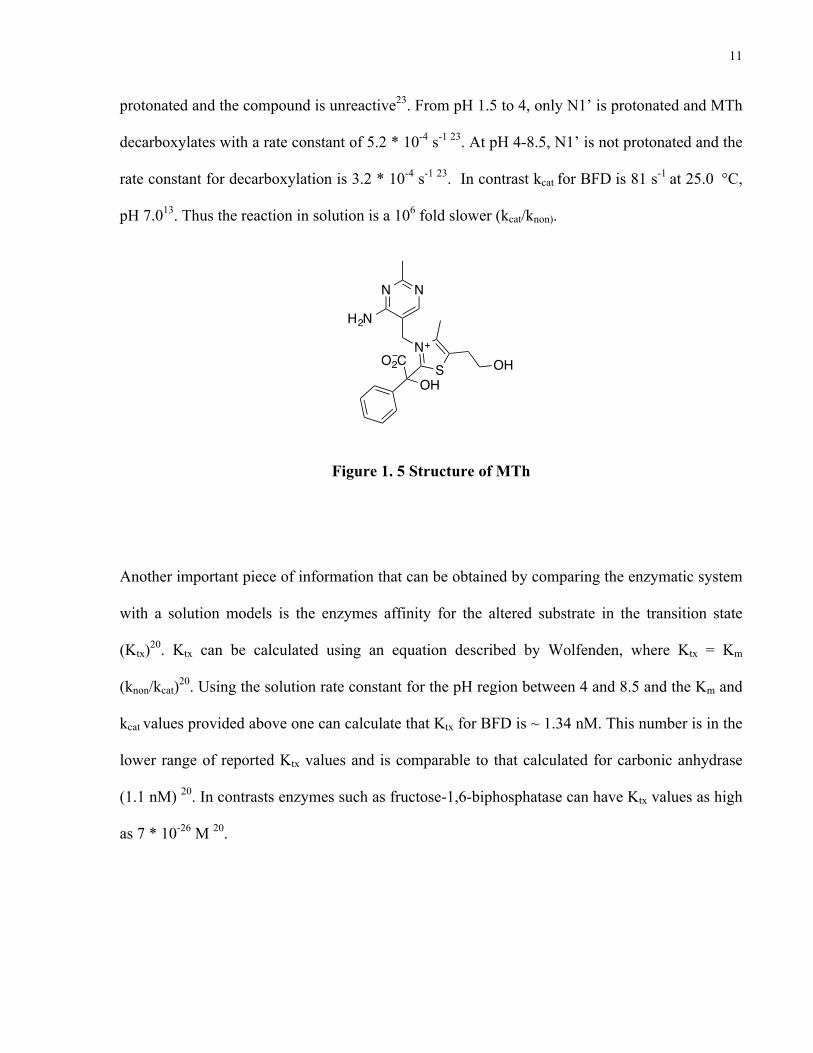
2-(α-Mandelyl)thiamine (MTh) is the synthetic condensation product between thiamine and
benzoylformate. It is an analogue of the first tetrahedral intermediate on BFD, MThDP. Its
structure is shown in Figure 1.5. The only difference in chemical structure between the two
molecules is the replacement of the diphosphate moiety in the enzymatic intermediate by a
hydroxyl group. This change should not have a significant impact on the catalytic reactivity of
the molecule since the role of the diphosphate group pertains to enzyme binding rather then
catalysis21. Our group has developed a synthetic method of producing MTh22 that is described in
the experimental section.
In solution the rate limiting step in catalysis by ThOH will be the formation of the first
tetrahedral intermediate; MTh since the deprotonation of C2 on ThOH (pKa~ 19)9 requires a
strong base. Based on the understanding of basic chemical principles it should be expected that
the subsequent steps will be fast since the post-decarboxylation intermediate is resonance
stabilized. Surprisingly the rate of decarboxylation of MTh is much slower then the rate for the
catalytic decarboxylation by BFD. Below pH 1.5 both the N1’ and the carboxylate of MTh are
11
protonated and the compound is unreactive23. From pH 1.5 to 4, only N1’ is protonated and MTh
decarboxylates with a rate constant of 5.2 * 10-4 s-1 23. At pH 4-8.5, N1’ is not protonated and the
rate constant for decarboxylation is 3.2 * 10-4 s-1 23. In contrast kcat for BFD is 81 s-1 at 25.0 °C,
pH 7.013. Thus the reaction in solution is a 106 fold slower (kcat/knon).
Figure 1. 5 Structure of MTh
Another important piece of information that can be obtained by comparing the enzymatic system
with a solution models is the enzymes affinity for the altered substrate in the transition state
(Ktx)20. Ktx can be calculated using an equation described by Wolfenden, where Ktx = Km
(knon/kcat)20. Using the solution rate constant for the pH region between 4 and 8.5 and the Km and
kcat values provided above one can calculate that Ktx for BFD is ~ 1.34 nM. This number is in the
lower range of reported Ktx values and is comparable to that calculated for carbonic anhydrase
(1.1 nM) 20. In contrasts enzymes such as fructose-1,6-biphosphatase can have Ktx values as high
as 7 * 10-26 M 20.
OHSN+
H2N
N N
O2C
OH
12
1.5 Decarboxylation accelerated by desolvation
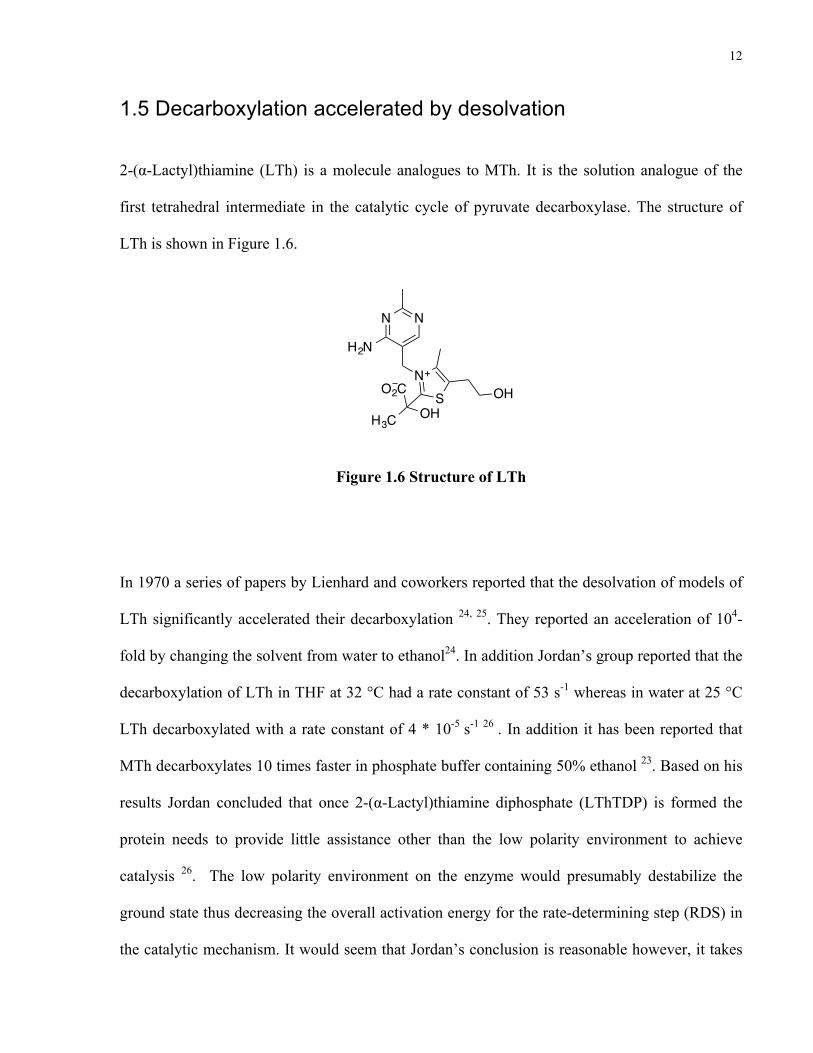
2-(α-Lactyl)thiamine (LTh) is a molecule analogues to MTh. It is the solution analogue of the
first tetrahedral intermediate in the catalytic cycle of pyruvate decarboxylase. The structure of
LTh is shown in Figure 1.6.
Figure 1.6 Structure of LTh
In 1970 a series of papers by Lienhard and coworkers reported that the desolvation of models of
LTh significantly accelerated their decarboxylation 24, 25. They reported an acceleration of 104-
fold by changing the solvent from water to ethanol24. In addition Jordan’s group reported that the
decarboxylation of LTh in THF at 32 °C had a rate constant of 53 s-1 whereas in water at 25 °C
LTh decarboxylated with a rate constant of 4 * 10-5 s-1 26 . In addition it has been reported that
MTh decarboxylates 10 times faster in phosphate buffer containing 50% ethanol 23. Based on his
results Jordan concluded that once 2-(α-Lactyl)thiamine diphosphate (LThTDP) is formed the
protein needs to provide little assistance other than the low polarity environment to achieve
catalysis 26. The low polarity environment on the enzyme would presumably destabilize the
ground state thus decreasing the overall activation energy for the rate-determining step (RDS) in
the catalytic mechanism. It would seem that Jordan’s conclusion is reasonable however, it takes
OHSN+
H2N
N N
O2C
H3COH
13
energy for the enzyme to desolvate a highly solvated substrate. The energy required to desolvate
the substrate could be provided by the binding energy, however in the case of BFD the small
substrate does not present enough sites for such a process. Thus the cost of desolvating the
substrate would negate the overall effect of ground state destabilization by the non-polar active
site23. As Warshel pointed out, the proposals that enzymes work by providing a non-polar
environment that destabilizes the ground state are based on improper thermodynamic cycles that
do not use a proper reference state27. Additionally many enzymatic reactions, including the one
catalyzed by BFD, generate ionic species as intermediates and transition states along the reaction
pathway. The energy associated with forming such species in the gas phase is very large and
stabilization by the protein environment is required in order for these ionic intermediates and
transition states to be formed at all 28. Thus desolvation in order to induce ground state
destabilization cannot explain the catalytic effect of the protein environment in BFD.
1.6 Internal return in decarboxylation
Decarboxylation of MTh is subjected to pyridinium catalysis in solution. The second-order rate
constant for this catalysis is 1 * 10-4 M-1 s-1 29. Moreover, the base component of this buffer is not
catalytic and neither are N-alkylated versions of pyridine29. Thus, the reaction is specific acid
catalyzed29. Conventional understanding of the steps in decarboxylation considers only carbon-
carbon bond breaking and carbon-hydrogen bond formation (Figure 1.7, A). However, this
traditional view of decarboxylation reactions makes it difficult to understand the mechanism by
which pyridinium might catalyze the decarboxylation of MTh, since C-C bond breaking cannot
be accelerated by an acid. Evidence from catalytic patterns30, stereochemical outcomes31,
changes in isotope effects32 and QM/MM calculations33 suggest that in cases where a localized
14
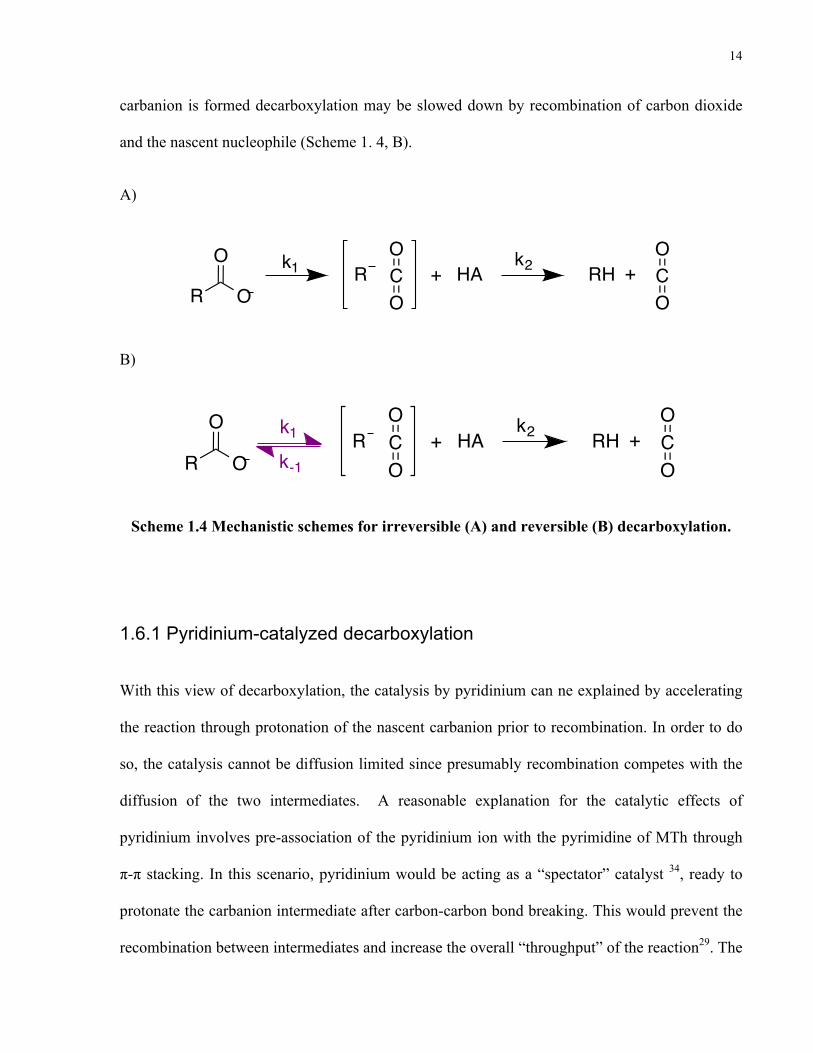
carbanion is formed decarboxylation may be slowed down by recombination of carbon dioxide
and the nascent nucleophile (Scheme 1. 4, B).
A)
B)
Scheme 1.4 Mechanistic schemes for irreversible (A) and reversible (B) decarboxylation.
1.6.1 Pyridinium-catalyzed decarboxylation
With this view of decarboxylation, the catalysis by pyridinium can ne explained by accelerating
the reaction through protonation of the nascent carbanion prior to recombination. In order to do
so, the catalysis cannot be diffusion limited since presumably recombination competes with the
diffusion of the two intermediates. A reasonable explanation for the catalytic effects of
pyridinium involves pre-association of the pyridinium ion with the pyrimidine of MTh through
π-π stacking. In this scenario, pyridinium would be acting as a “spectator” catalyst 34, ready to
protonate the carbanion intermediate after carbon-carbon bond breaking. This would prevent the
recombination between intermediates and increase the overall “throughput” of the reaction29. The
R
O
OR
OCO
+ HA RH +OCO
k1 k2
R
O
OR
OCO
+ HA RH +OCO
k1 k2
k-1
15
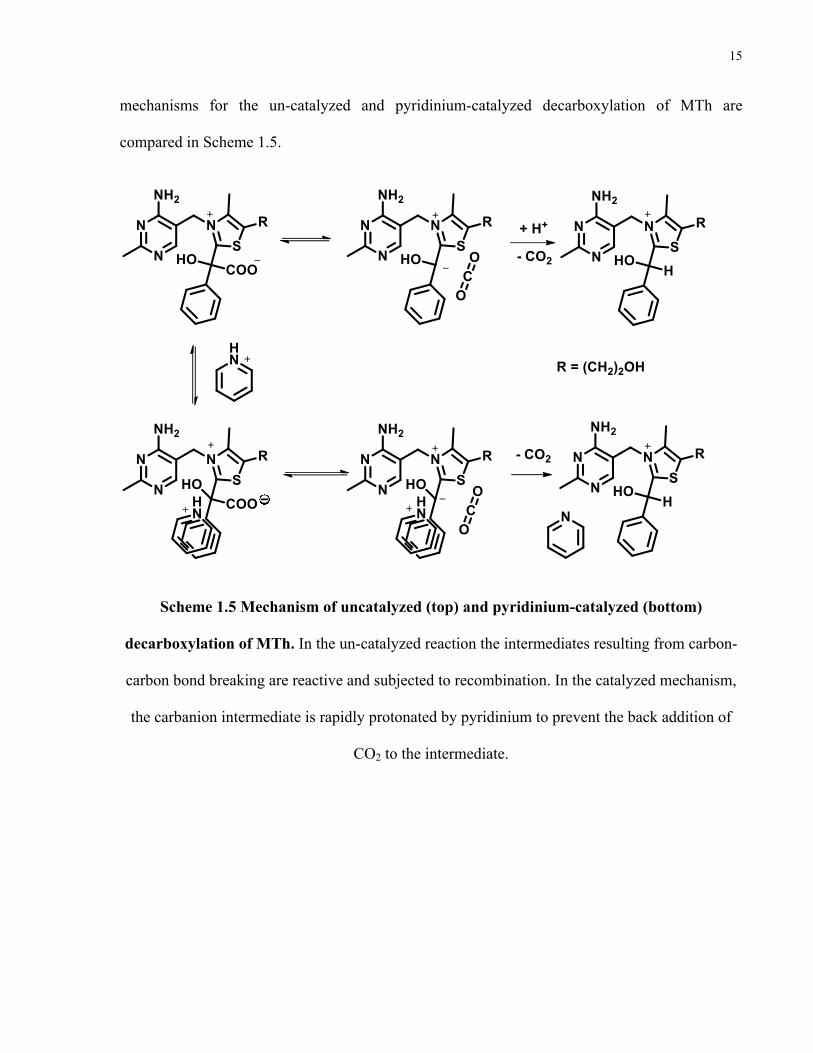
mechanisms for the un-catalyzed and pyridinium-catalyzed decarboxylation of MTh are
compared in Scheme 1.5.
Scheme 1.5 Mechanism of uncatalyzed (top) and pyridinium-catalyzed (bottom)
decarboxylation of MTh. In the un-catalyzed reaction the intermediates resulting from carbon-
carbon bond breaking are reactive and subjected to recombination. In the catalyzed mechanism,
the carbanion intermediate is rapidly protonated by pyridinium to prevent the back addition of
CO2 to the intermediate.
16
1.6.2 Base-catalyzed decarboxylation
Our research group has recently reported that the decarboxylation of MTh is also subject to
general base catalysis (β=0.26)35. The reaction in acetate buffer has a second order rate constant
of 3*10-4 s -1 at pH 4.635. We have also noted that this type of catalysis occurs only for the
protonated form of MTh35. Moreover this reaction has a solvent kinetic isotope effect (SKIE) of
1.8 (0.4 M 1:1 acetate/acetic acid buffer) and a carbon kinetic isotope effect (CKIE) of 1.058 ±
5*10-4 35. Based on the above experimental observations, the transition state of the RDS of the
reaction must include at least partial carbon-carbon bond breaking, movement of a proton and
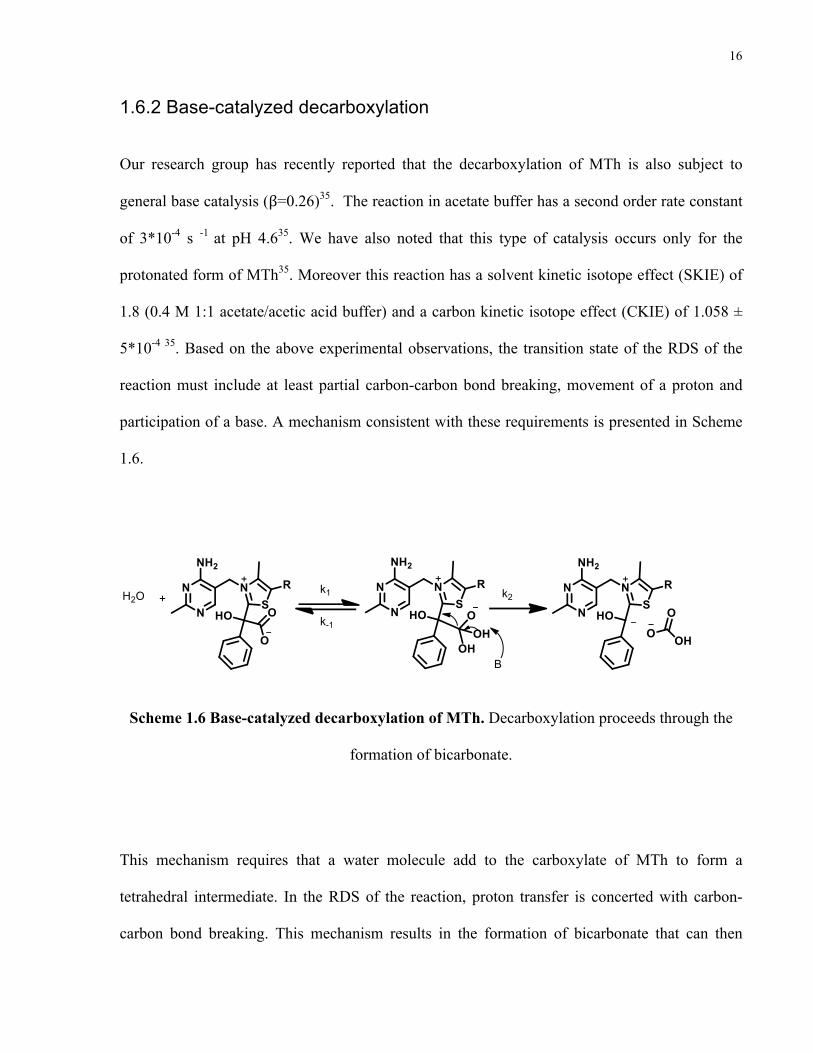
participation of a base. A mechanism consistent with these requirements is presented in Scheme
1.6.
Scheme 1.6 Base-catalyzed decarboxylation of MTh. Decarboxylation proceeds through the
formation of bicarbonate.
This mechanism requires that a water molecule add to the carboxylate of MTh to form a
tetrahedral intermediate. In the RDS of the reaction, proton transfer is concerted with carbon-
carbon bond breaking. This mechanism results in the formation of bicarbonate that can then
17
decompose to CO2. Bicarbonate is negatively charged and is thus less electrophilic then CO236.
Since bicarbonate is less electrophilic then CO2, it will be subjected to recombination with the
nucleophilic carbanion to a lesser extent. As such, the indirect decarboxylation through
bicarbonate provides an alternative, lower energy pathway, avoiding the problem of internal
return present in the direct decarboxylation mechanism.
1.6.3 Internal return and enzymatic mechanism
A recently determined crystal structure at sub-atomic (better then 1 Å) resolution of human
transketolase (TK), another ThDP-dependent enzyme, revealed a pronounced out-of-plane
distortion of over 20° for the covalent bond that links cofactor and substrate and a specific
elongation of the scissile substrate carbon-carbon bond37. This observation suggests that after
the carbon-carbon bond breaking, the resulting intermediate does not relax to the lower energy
form in which the negative charge becomes delocalized over two sp2 hybridized atoms but rather
remains localized on the sp3 hybridized carbon. This observation makes sense, as a high-energy
intermediate will have a lower activation barrier for the subsequent step. If one accepts that the
observation reported for TK might also apply to other ThDP-dependent enzymes then in the case
of the decarboxylases the problem of creating a CO2 molecule in close proximity to a high-
energy carbanion must be dealt with. It is possible that on BFD a mechanism analogous to the
base catalyzed decarboxylation of MTh is at hand to prevent the recombination of CO2 with the
reactive carbanion. If so, based on the previously described reactivity of S26 towards BFD
inhibitors and alternative substrates, it is likely that this residue acts as the catalytic
base/nucleophile.
18
1.7 Activation energies in decarboxylation
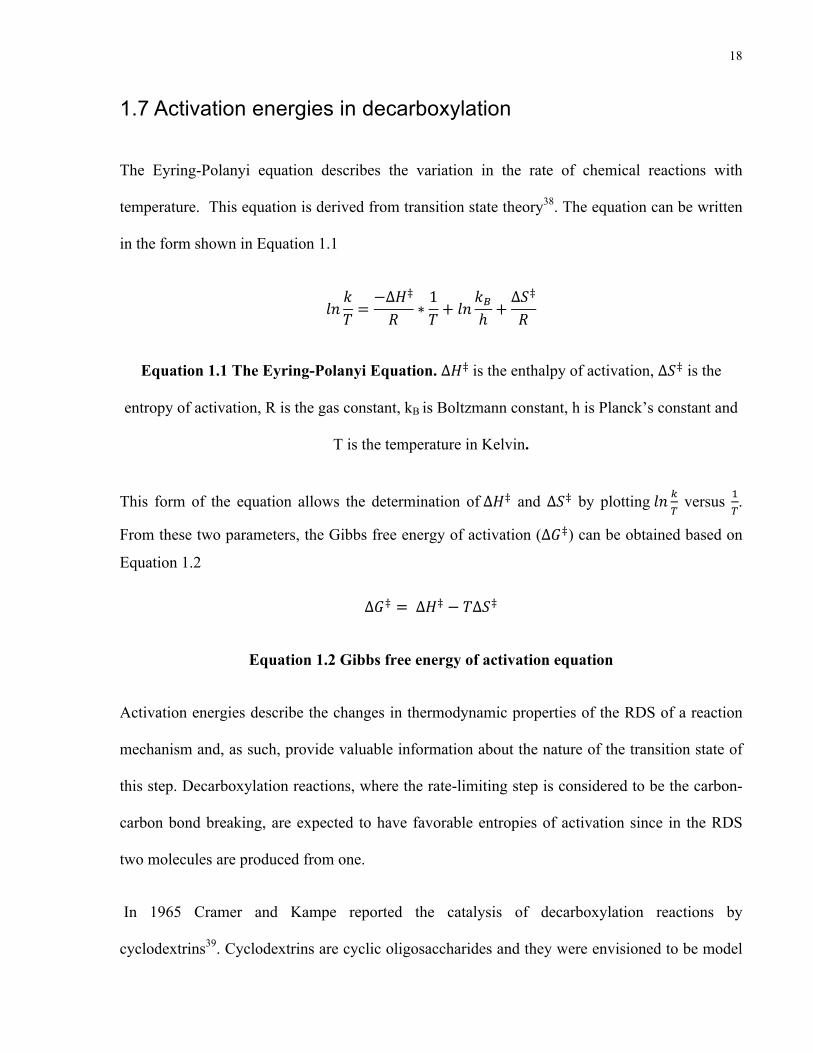
The Eyring-Polanyi equation describes the variation in the rate of chemical reactions with
temperature. This equation is derived from transition state theory38. The equation can be written
in the form shown in Equation 1.1
𝑙𝑛𝑘𝑇 =
−Δ𝐻‡
𝑅 ∗1𝑇 + 𝑙𝑛
𝑘!ℎ +
∆𝑆‡
𝑅
Equation 1.1 The Eyring-Polanyi Equation. Δ𝐻‡ is the enthalpy of activation, ∆𝑆‡ is the
entropy of activation, R is the gas constant, kB is Boltzmann constant, h is Planck’s constant and
T is the temperature in Kelvin.
This form of the equation allows the determination of Δ𝐻‡ and ∆𝑆‡ by plotting 𝑙𝑛 !! versus !
!.
From these two parameters, the Gibbs free energy of activation (∆𝐺‡) can be obtained based on
Equation 1.2
Δ𝐺‡ = ∆𝐻‡ − 𝑇Δ𝑆‡
Equation 1.2 Gibbs free energy of activation equation
Activation energies describe the changes in thermodynamic properties of the RDS of a reaction
mechanism and, as such, provide valuable information about the nature of the transition state of
this step. Decarboxylation reactions, where the rate-limiting step is considered to be the carbon-
carbon bond breaking, are expected to have favorable entropies of activation since in the RDS
two molecules are produced from one.
In 1965 Cramer and Kampe reported the catalysis of decarboxylation reactions by
cyclodextrins39. Cyclodextrins are cyclic oligosaccharides and they were envisioned to be model

19
compounds of enzymes. The authors reported activation energies for decarboxylation of a
number of compounds in the presence and absence of cyclodextrins. In all cases, cyclodextrins
did act as catalysts by providing a small decrease in the overall Δ𝐺‡ of the reaction. Interestingly,
in all cases the acceleration was due to the enthalpic component, which was reduced to a large
extent (ΔΔH‡ = 6-8 kcal/mol). However, the large favorable change in enthalpy of activation was
offset by an unfavorable change in entropy ΔS‡, (ΔΔS‡ = 11-19 cal/ mol K) 39. This unfavorable
change in Δ𝑆‡ suggests that the cyclodextrins-catalyzed decarboxylation cannot simply involve
carbon-carbon bond breaking in the RDS. The catalytic effect of cyclodextrins can be attributed
to the electron-donating properties of ether and hydroxyl oxygen atoms40. Cramer and Kampe
proposed that the hydroxyl oxygen on cyclodextrin, adds to the carboxylate to form a tetrahedral
intermediate that, decomposes into an enol intermediate and a carbonate species that can then in
turn decompose into the free hydroxyl and carbon dioxide. This mechanism is shown in Scheme
1.7. A follow up paper by Thomson reported that the decarboxylation of 2-(2-chlorophenyl)- and
2-(4-chlorophenyl)-2-cyanoacetate ions in 80% ethanol-water mixtures showed similar activation
parameters to those reported for the cyclodextrin catalysis41. Based on this result Thomson
suggested that the cyclodextrin catalysis is due to the change in polarity of the local molecular
environment upon the complexation of the cyclodextrin with its’ substrate. To the best of our
knowledge no subsequent experiments have been undertaken to distinguish between the two
possible modes of catalysis by cyclodextrin. The mechanism for cyclodextrin catalysis proposed
by Cramer and Kampe parallels the mechanism for serine phosphorylation shown in Scheme 1.3
as well as the base-catalyzed decarboxylation of MTh shown in Scheme 1.6.

20
Scheme 1.7 Cyclodextrin-catalyzed decarboxylation. The grey oval represents cyclodextrin. The second
step of the reaction is rate-determining, the transition state for this step is expected to be highly organized
and as such have a unfavorable Δ𝑆‡.
OO
ORO O
OO
R
O BH
O O
O
O
R H OCO
O

21
1.8 Hypotheses and purpose of study
It is to be expected that the condensation product between thiamine and benzoylformate (MTh)
should decarboxylate rapidly since the resulting high-energy intermediate will be stabilized
through resonance by the vitamin. However, the decarboxylation of MTh in solution is a million
times slower then the rate of enzymatic decarboxylation by BFD. As such the enzyme
environment must play a crucial role in accelerating the decarboxylation reaction. What is the
role of the enzymatic environment in BFD? How is this acceleration achieved? To answer these
questions we compare catalysis of MTh decarboxylation in solution versus that on the enzyme.
Based on the introductory information presented above, we have hypothesized that
decarboxylation of MTh in solution is subject to internal return and is thus significantly slowed
compared to the enzymatic system. We have also hypothesized that S26 in the active site of BFD
plays an important role in catalysis by acting as a nucleophile to trap CO2. To address these
hypotheses I have looked into the catalytic role of S26 through inhibition and mutagenesis
studies. I have also looked at the activation parameters of the base catalyzed decarboxylation of
MTh in solution, to better characterize this interesting mechanism and its relevance with respect
to understanding the enzymatic catalysis by BFD.
22
Chapter 2: Experimental Procedures
2.1 Instrumentation
Proton, carbon and phosphorous NMR spectra were obtained at 400 MHz on a Varian Mercury
instrument. All UV measurements were recorded on a UV-Vis spectrophotometer equipped with
a Peltier-effect thermo-cell and a circulating water bath. A digital thermometer was used to
ensure the thermo-regulated temperature was accurate.
2.2 Materials
pETBFD-His6, pKKBFDS26A-His6 and pETBFDS26T-His6 plasmids were obtained from Prof.
Michael McLeish’s lab. Plasmid pETBFD26C-His6 was constructed using QuickChange® site-
directed mutagenesis kit during a stay at Prof. McLeish’s lab and brought back to our laboratory.
E. Coli BL21DE3 competent cells were purchased from New England BioLabs®. Ni-NTA
agarose resin was purchased from Qiagen. Horse liver alcohol dehydrogenase (HLAD) from
equine liver was purchased from Sigma Aldrich® as a lyophilized powder. NADH, NAD+ and
thiamine diphosphate were purchased from Sigma Aldrich®. All other starting materials for the
synthesis of various inhibitors and reagents were purchased in high purity.

23
2.3 Synthesis
2.3.1 Synthesis of methyl benzoylphosphonate
Scheme 2.1 Reaction scheme for the synthesis of methyl benzoylphosphonate
The synthesis of MBP was based on the Michaelis-Arbuzov reaction42. Trimethyl phosphite (4.8
mL, 40.3 mmol) was added dropwise to benzoylchloride (4.7 mL, 40.3 mmol) under nitrogen at
0°C. The solution was stirred for 30 minutes at 0 °C. Next the solution was allowed to warm up
to room temperature and was stirred continuously over a period of 3 hours. The resulting
yellowish oil was collected by vacuum distillation.
1H NMR (400 MHz, CDCl3) δ: 3.9 (6H, d), 7.5 (3H, m), 8.2 (2H, m)
2.1 g (14.0 mmol) of dry NaI were dissolved in 25mL of dry acetone under nitrogen at room
temperature. 1 g (4.7 mmol) of dimethyl benzoylphosphonate was added to the acetone solution.
The solution was stirred overnight and then evaporated to dryness. The product was triturated
with ethyl acetate several times, and then it was evaporated to dryness. The product was
recrystallized from absolute ethanol.
1H NMR (400 MHz, D2O) δ: 3.7 (3H, d), 7.6 (3H, m), 8.2 (2H, m); 85% yield
O
Cl POO
O
O
P
OO
O
NaI+
+
O
P
OO
O
Na+
Neat0 o C
30 min.
Acetone25 o C10 hrs.

24
2.3.2 Synthesis of benzoylphosphonate
Scheme2.2 Reaction scheme for the synthesis of benzoylphosphonate
Following the same literature procedure used to prepare MBP42, the product from synthesis 2.3.1
(0.5 mol) was dissolved in 20 mL of distilled water and transferred to a 250 mL separating
funnel. 20 mL of concentrated HCl was added and the solution was extracted 3 times with
chloroform (70 mL total). The combined chloroform layers were dried with sodium sulfate,
filtered and evaporated under reduced pressure keeping the temperature below 40 °C.
The product from the first step (1 mmol, 0.2 g) was dissolved in 15 mL of dry acetone. 10%
excess of NaI (1.1 mmol, 0.15g) was dissolved in 18 mL of acetonitrile and was added to the
acetone solution while stirring. The reaction was refluxed with stirring for 48 hours. The
precipitate was filtered off, washed with dry acetonitrile and dried.
1H NMR (400 MHz, D2O) δ: 7.6 (3H, m), 8.2 (2H, m)
O
P
O-O
OHCl
O
P
OHO
ONaI
O
P
OHO-
O
Na++ +
H2O25 o C 5 min.
Acetone/Acetonitrile120 o C/ 1 mmHg
48 hrs.
25
2. 3. 3 Synthesis of methyl benzoylphosphate
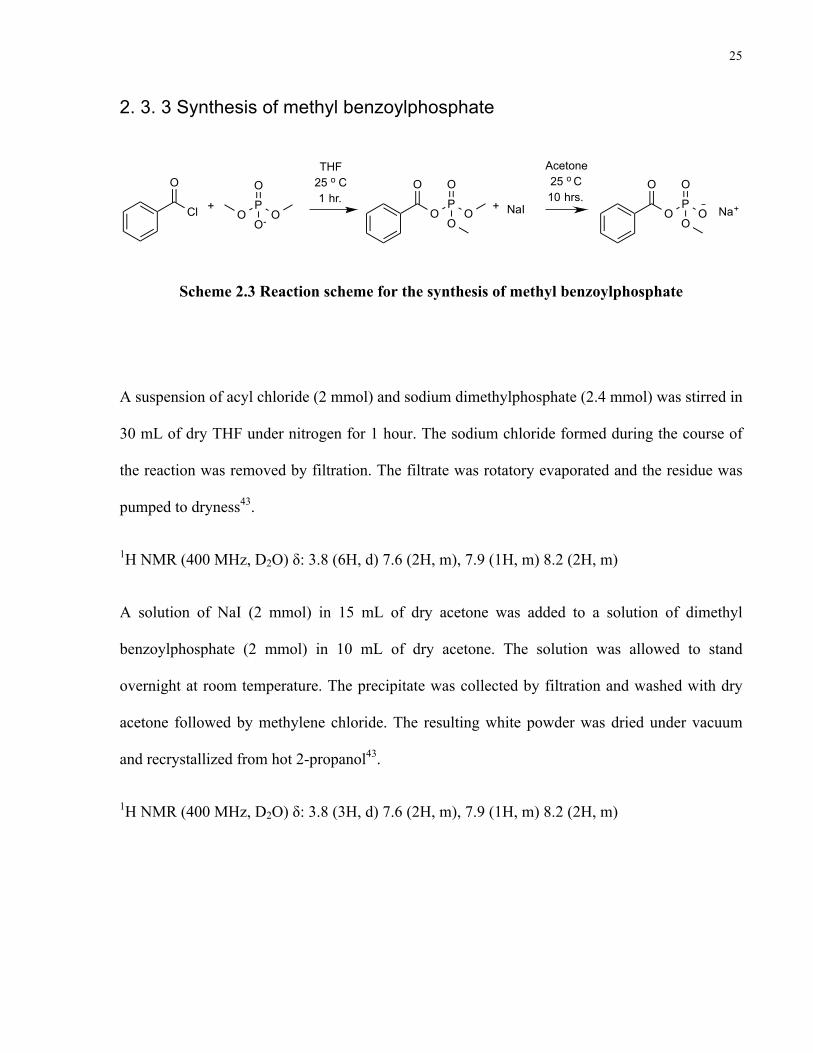
Scheme 2.3 Reaction scheme for the synthesis of methyl benzoylphosphate
A suspension of acyl chloride (2 mmol) and sodium dimethylphosphate (2.4 mmol) was stirred in
30 mL of dry THF under nitrogen for 1 hour. The sodium chloride formed during the course of
the reaction was removed by filtration. The filtrate was rotatory evaporated and the residue was
pumped to dryness43.
1H NMR (400 MHz, D2O) δ: 3.8 (6H, d) 7.6 (2H, m), 7.9 (1H, m) 8.2 (2H, m)
A solution of NaI (2 mmol) in 15 mL of dry acetone was added to a solution of dimethyl
benzoylphosphate (2 mmol) in 10 mL of dry acetone. The solution was allowed to stand
overnight at room temperature. The precipitate was collected by filtration and washed with dry
acetone followed by methylene chloride. The resulting white powder was dried under vacuum
and recrystallized from hot 2-propanol43.
1H NMR (400 MHz, D2O) δ: 3.8 (3H, d) 7.6 (2H, m), 7.9 (1H, m) 8.2 (2H, m)
O
Cl P
O
OOO-
P
O
O OO
O
NaI P
O
O OO
O
Na++ +
THF25 o C1 hr.
Acetone25 o C10 hrs.
26
2.3.4 Synthesis of benzoylphosphate
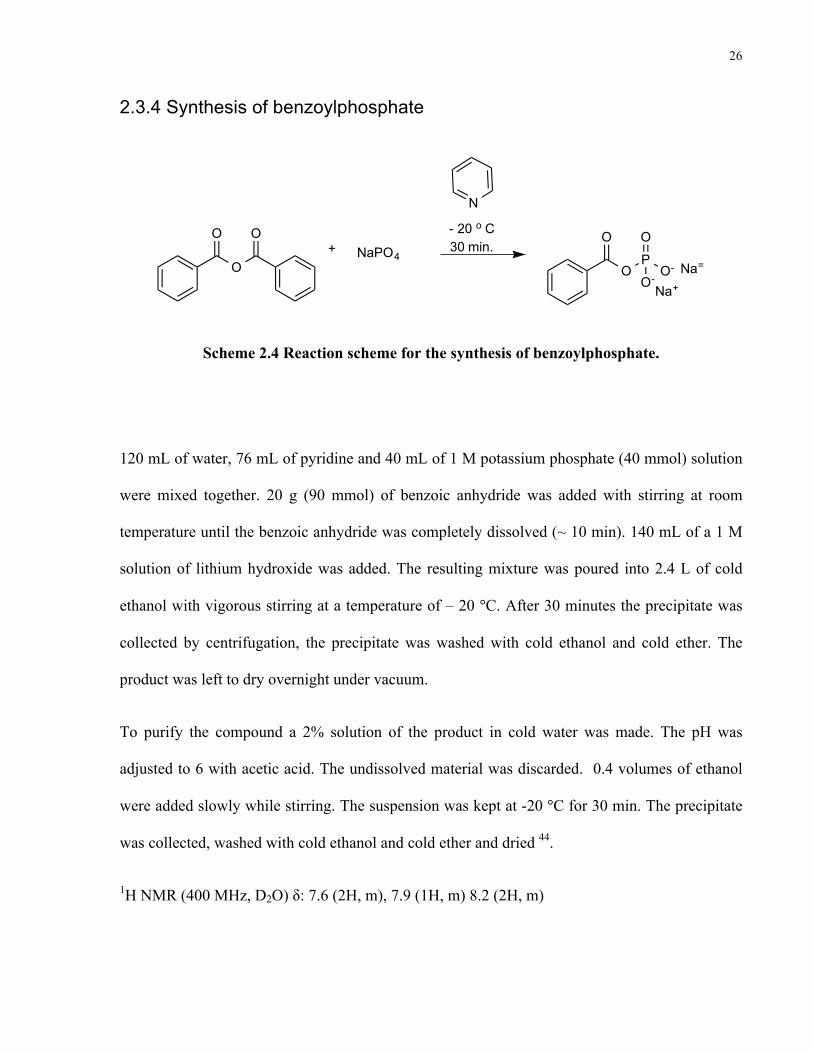
Scheme 2.4 Reaction scheme for the synthesis of benzoylphosphate.
120 mL of water, 76 mL of pyridine and 40 mL of 1 M potassium phosphate (40 mmol) solution
were mixed together. 20 g (90 mmol) of benzoic anhydride was added with stirring at room
temperature until the benzoic anhydride was completely dissolved (~ 10 min). 140 mL of a 1 M
solution of lithium hydroxide was added. The resulting mixture was poured into 2.4 L of cold
ethanol with vigorous stirring at a temperature of – 20 °C. After 30 minutes the precipitate was
collected by centrifugation, the precipitate was washed with cold ethanol and cold ether. The
product was left to dry overnight under vacuum.
To purify the compound a 2% solution of the product in cold water was made. The pH was
adjusted to 6 with acetic acid. The undissolved material was discarded. 0.4 volumes of ethanol
were added slowly while stirring. The suspension was kept at -20 °C for 30 min. The precipitate
was collected, washed with cold ethanol and cold ether and dried 44.
1H NMR (400 MHz, D2O) δ: 7.6 (2H, m), 7.9 (1H, m) 8.2 (2H, m)
O
O
O+ NaPO4 P
O
OO-
O-
O
N
Na=
Na+
- 20 o C30 min.
27
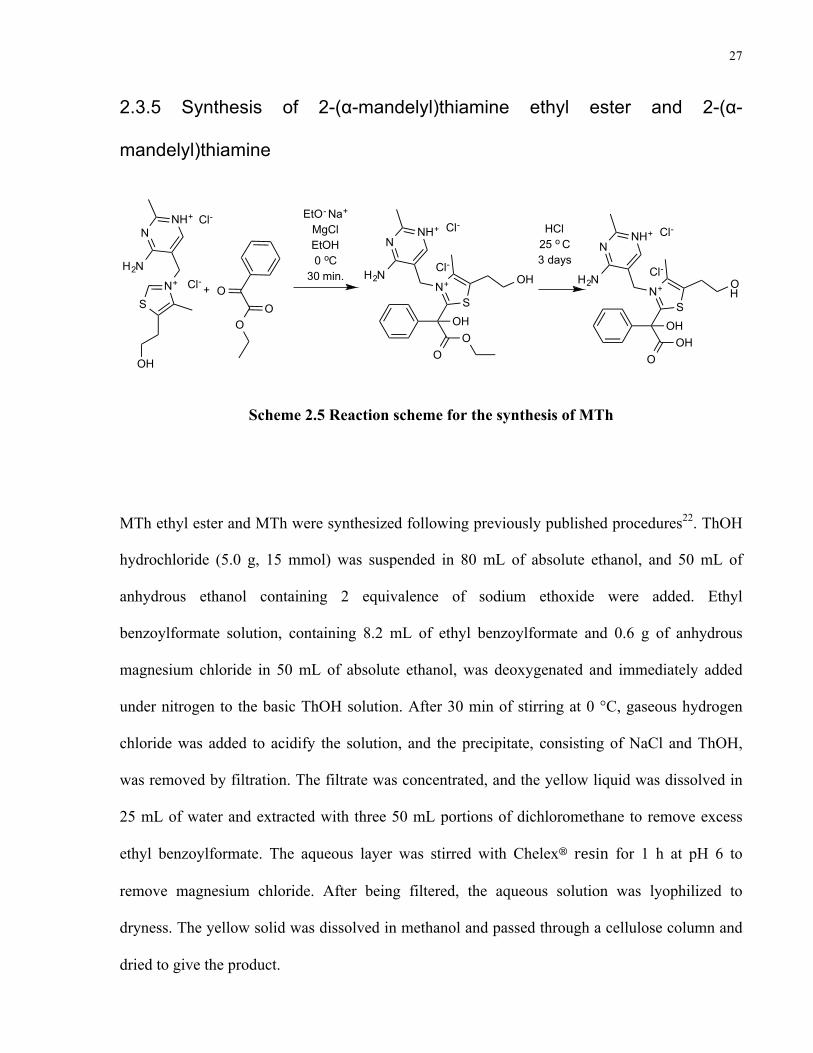
2.3.5 Synthesis of 2-(α-mandelyl)thiamine ethyl ester and 2-(α-
mandelyl)thiamine
Scheme 2.5 Reaction scheme for the synthesis of MTh
MTh ethyl ester and MTh were synthesized following previously published procedures22. ThOH
hydrochloride (5.0 g, 15 mmol) was suspended in 80 mL of absolute ethanol, and 50 mL of
anhydrous ethanol containing 2 equivalence of sodium ethoxide were added. Ethyl
benzoylformate solution, containing 8.2 mL of ethyl benzoylformate and 0.6 g of anhydrous
magnesium chloride in 50 mL of absolute ethanol, was deoxygenated and immediately added
under nitrogen to the basic ThOH solution. After 30 min of stirring at 0 °C, gaseous hydrogen
chloride was added to acidify the solution, and the precipitate, consisting of NaCl and ThOH,
was removed by filtration. The filtrate was concentrated, and the yellow liquid was dissolved in
25 mL of water and extracted with three 50 mL portions of dichloromethane to remove excess
ethyl benzoylformate. The aqueous layer was stirred with Chelex® resin for 1 h at pH 6 to
remove magnesium chloride. After being filtered, the aqueous solution was lyophilized to
dryness. The yellow solid was dissolved in methanol and passed through a cellulose column and
dried to give the product.
OH
SN+
H2N
NNH+
OO
OOH
SN+
H2N
NNH+
OO
OH
+Cl-
Cl-
Cl-
Cl-
OH
SN+
H2N
NNH+
OOH
OH
Cl-
Cl-EtO- Na+
MgClEtOH0 oC
30 min.
HCl25 o C3 days

28
1H NMR (400 MHz, D2O): δ 7.56 – 7.52 (m, 2H), 7.36 - 7.27 (m, 3H), 6.79 (s, 1H), 5.85 (d, 1H,
J = 18 Hz), 5.40 (d, 1H, J = 18 Hz,), 4.44 (q, 2H, J = 6.9 Hz), 3.96 (t, 2H, J = 5.4 Hz), 3.25 (t,
2H, J = 5.2 Hz), 2.50 (s, 3H), 2.41 (s, 3H), 1.31 (t, 3H, J = 7.0 Hz).
MTh was obtained by hydrolyzing the ethyl ester in hydrochloric acid. After concentration to
remove excess acid the MTh sample was lyophilized and its purity tested by 1H NMR.
1H NMR (400 MHz, DMSO-d6): δ 9.10 (br, 2H), 7.97 (br, 1H), 7.51 (m, 2H), 7.26 (m, 3H), 7.18
(s, 1H), 6.49 (s, 1H), 5.89 (d, 1H, J = 17.8 Hz), 5.53 (d, 1H, J = 17.9 Hz), 3.75 – 3.62 (m, 2H),
3.04 (t, 2H, J = 5.4 Hz), 2.46 (s, 3H), 2.31 (s, 3H)
.
29
2.4 Protein expression and purification
2.4.1 Protein expression
Competent E. Coli BL21(DE3) cells (20 μL aliquots) were transformed with a plasmid
containing a sequence coding for BFD-His6 or BFD-His6 mutants using heat shock (42 °C, 1
min. 15 secs.). pET type vectors contained a kanamycin resistance gene, whereas pKK type
vectors contained an ampicillin resistance gene. The transformed cells were plated on LB/agar
plates containing the appropriate antibiotics. The cells were grown overnight at 37 °C. The next
day single colonies were selected and transferred to a 50 mL LB starter culture containing the
corresponding antibiotic. The starter culture was grown overnight at 37 °C with shaking at 180-
200 rpm. The next morning the starter culture was added to 1 L of LB. The cells were grown at
37 °C and 225 rpm until OD600 ~ 0.6. The cells cultures were then chilled on ice for 20 minutes.
Adding 1mM of IPTG induced protein expression. The expression culture was grown overnight
at 23 °C and 225 rpm. The expression culture was distributed into Nalgene bottles and
centrifuged at 6000 rpm. The supernatant was discarded. The cell pellets were resuspended in 5
to 10 mL of 10 mM imidazole buffer (50 mM NaPO4, 10 mM imidazole, 300 mM NaCl, pH 8).
After this step the cells were either stored at – 80 °C or the cell-free extract was prepared for
immediate purification.
Lysozyme (0.2 mg/mL) and DNase (10 µg/mL) were added to the cell pellet and mixed carefully
by inversion. After 15 to 20 minutes the cells were disrupted by sonication. The disrupted
suspension was centrifuged for 30 minute at 13000 rpm. The supernatant was poured off into
Nalgene tubes and the tubes were centrifuged again for 30 minutes at 13000 rpm. The cell debris
was discarded and the supernatant retained.
30
2.4.2 Protein purification
All steps of the protein purification were performed in the cold room. The clear, cell free extract
supernatant was loaded onto a 5 mL Ni-NTA column. The column was washed with 3 to 4
column volumes of wash buffer (50 mM NaPO4, 300 mM NaCl, 50 mM imidazole, pH 8.0). 5
mL fractions were collected in test tubes. The protein was eluted with 40 mL of elution buffer
(50 mM NaPO4, 300 mM NaCl, 250 mM imidazole, pH 8.0). 5 mL fractions were collected in
test tubes.
Fractions were checked for protein presence by UV-Vis absorbance at 280 nm and by SDS-
PAGE. Fractions containing the protein were pooled together and concentrated to 3 mL using an
Amicon® Ultra-15 centrifuge filter unit. The elution buffer was exchanged for protein storage
buffer (100 mM KPO4, 1mM MgCl, 0,5 mM ThDP, 10% glycerol, pH 6.0) using an EconoPak®
10DG desalting column. The protein concentration was determined both by UV-Vis absorption
at 280 nm and using a Bradford standard 45. The extinction coefficient used to calculate protein
concentrations was obtained from ExPASy and is equal to 62,715 M-1 cm-1. The protein solution
was passed through a sterile filter (0.2 µm), aliquoted into cryovials and stored at – 80 °C.

31
2.5 Tryptic digest
7.5 μL of digestion buffer (10 mM Ammonium bicarbonate) and 1.5 μL of reducing buffer (~
100 mM DTT solution) were added to a 0.5 mL micro-centrifuge tube. 10 μL of a BFD solution
(0.2 mg/mL) (final protein concentration ~ 1.2 μM) were added to the micro-centrifuge tube and
the final volume was adjusted to 27 μL with ultrapure water. The sample was incubated at 95 °C
for 5 minutes and then allowed to cool. 1 µL of trypsin (1 µg/ µL stock) was added to the
reaction tube and incubated at 37 °C for 3 hours. An additional 1 μL of trypsin was added and the
reaction was incubated at 30 °C overnight. The fragments resulting from the tryptic digest were
predicted using the PeptideCutter tool from ExPASy and are included in Appendix 1. The
overnight tryptic digest was submitted for ESI-MS analysis and analyzed by SDS-PAGE.
32
2.6 Kinetic methods
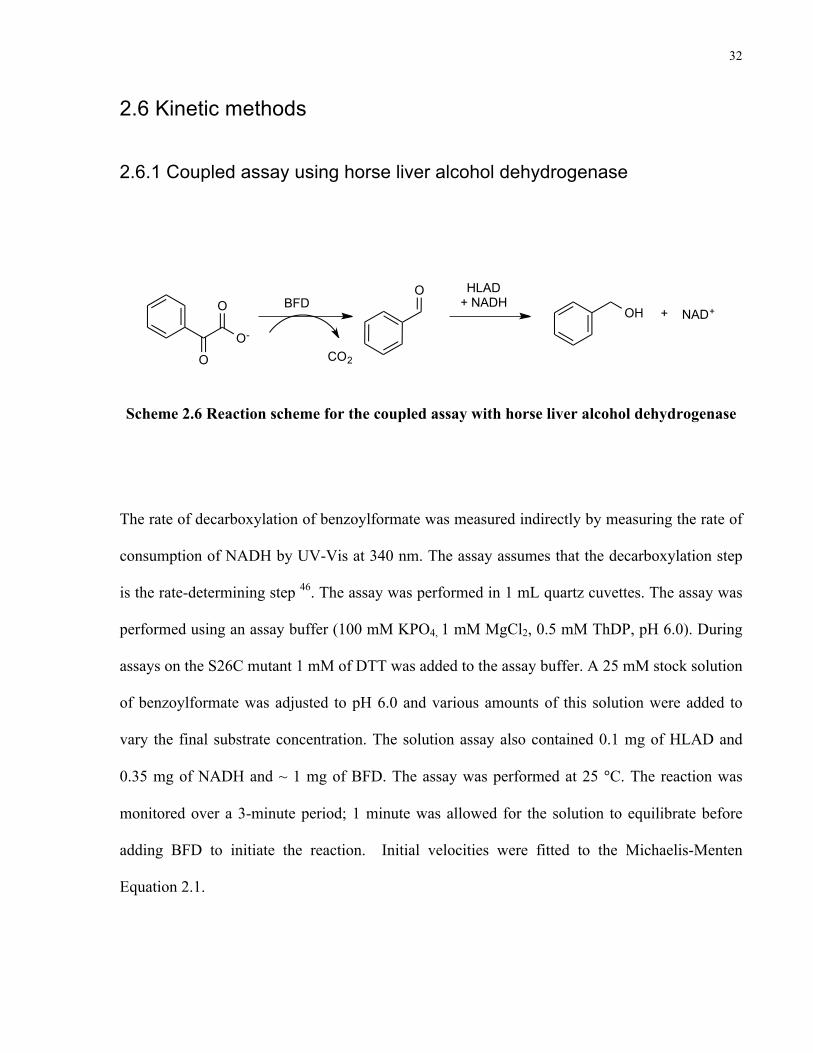
2.6.1 Coupled assay using horse liver alcohol dehydrogenase
Scheme 2.6 Reaction scheme for the coupled assay with horse liver alcohol dehydrogenase
The rate of decarboxylation of benzoylformate was measured indirectly by measuring the rate of
consumption of NADH by UV-Vis at 340 nm. The assay assumes that the decarboxylation step
is the rate-determining step 46. The assay was performed in 1 mL quartz cuvettes. The assay was
performed using an assay buffer (100 mM KPO4, 1 mM MgCl2, 0.5 mM ThDP, pH 6.0). During
assays on the S26C mutant 1 mM of DTT was added to the assay buffer. A 25 mM stock solution
of benzoylformate was adjusted to pH 6.0 and various amounts of this solution were added to
vary the final substrate concentration. The solution assay also contained 0.1 mg of HLAD and
0.35 mg of NADH and ~ 1 mg of BFD. The assay was performed at 25 °C. The reaction was
monitored over a 3-minute period; 1 minute was allowed for the solution to equilibrate before
adding BFD to initiate the reaction. Initial velocities were fitted to the Michaelis-Menten
Equation 2.1.
O
O-
O
O
OHBFD
HLAD+ NADH
+ NAD+
CO2
33
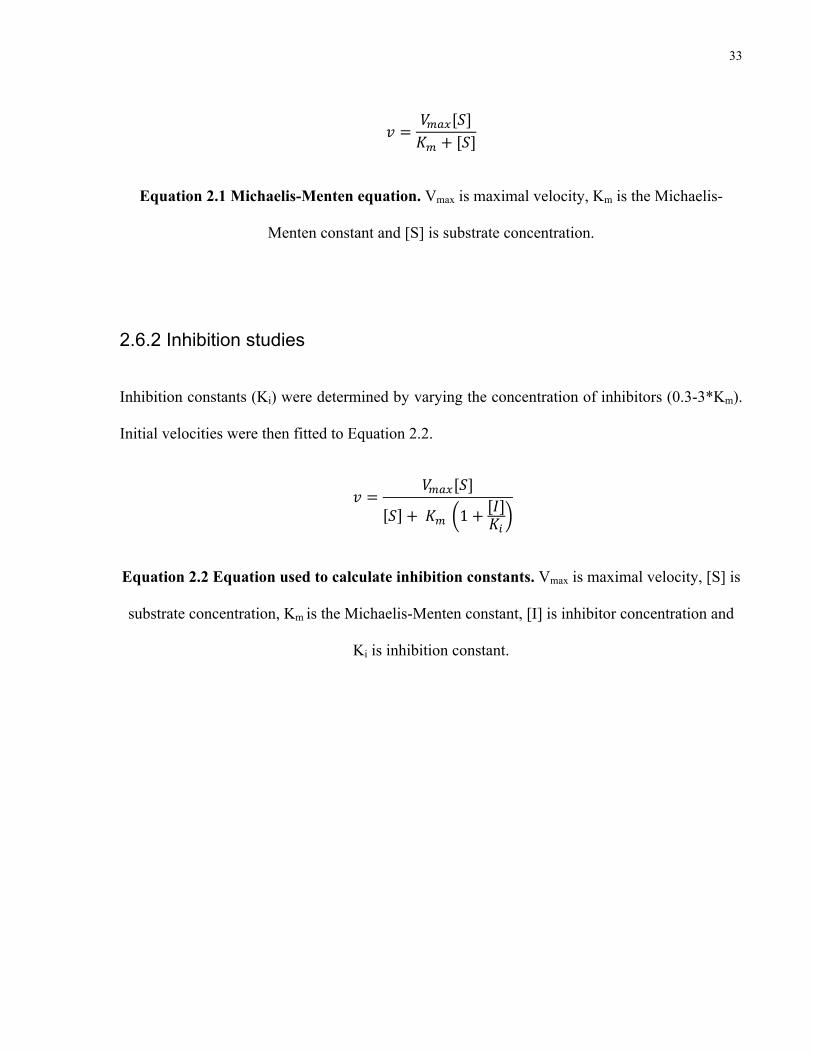
𝑣 =𝑉!"#[𝑆]𝐾! + [𝑆]
Equation 2.1 Michaelis-Menten equation. Vmax is maximal velocity, Km is the Michaelis-
Menten constant and [S] is substrate concentration.
2.6.2 Inhibition studies
Inhibition constants (Ki) were determined by varying the concentration of inhibitors (0.3-3*Km).
Initial velocities were then fitted to Equation 2.2.
𝑣 =𝑉!"#[𝑆]
𝑆 + 𝐾! 1+[𝐼]𝐾!
Equation 2.2 Equation used to calculate inhibition constants. Vmax is maximal velocity, [S] is
substrate concentration, Km is the Michaelis-Menten constant, [I] is inhibitor concentration and
Ki is inhibition constant.

34
2.6.3 Kinetics of mandelylthiamine decarboxylation in solution
Different concentrations of acetate buffers were prepared. Buffer solutions were titrated to pH
4.60 ± 0.01 in a thermojacket beaker at 25°C ± 0.1°C. The ionic strength of all solutions was
maintained at 1.0 M using dry KCl. Another set of acetate/phosphate co-buffers was prepared.
For this set of buffers phosphate concentrations were kept constant at 0.2 M while acetate
concentrations were varied. These buffers were titrated to pH 7.2 ± 0.01 in a thermojacket beaker
at 25°C ± 0.1°C. The ionic strength of all solutions was maintained at 2.0 M using dry KCl.
All reactions for both sets of buffers were run in triplicate in quartz cuvettes under pseudo first-
order conditions at different temperatures. Wavelength scans were taken every 5 minutes
between 240 and 350 nm. Data from a typical run were collected over a period of 5 hours. Non-
linear regression analysis of the absorbance change over time at a single wavelength (290 nm)
afforded kobs, the first order rate constant.
To correct for the fact that at higher pHs a smaller fraction of the active, protonated form of MTh
is present the associate rate law35 from Equation 2.3 was used.
𝑣 = 𝑘[𝐵]![𝑀𝑇ℎ]!
1+ [𝐻!]
𝐾! 1+ 𝐾!
[𝐻!]
Equation 2.3 Rate law for the base-catalyzed decarboxylation of protonated MTh. [B]T is
total buffer concentration, [MTh]T is total substrate concentration, KB is the association constant
of the buffer, KA is the association constant of the pyrimidine of MTh and [H+] is the proton
concentration.

35
2.6.4 Determination of solvent kinetic isotope effects (SKIEs)
Acetate/phosphate co-buffers containing 0.05 M of acetate and 0.05M of phosphate were made
in water and in deuterium oxide (D2O). The solutions in water were titrated to different pH’s at
25.0 °C. The corresponding buffers in D2O were made with the correction specified in Equation
2.4. According to a paper by Krężel and Bal the pKa correction for the dissociation of acids in
D2O is almost identical to the formula relating pH and pD and thus no further calculations were
required47. The ionic strength in both the H2O and D2O buffers was adjusted to 1.0 M using KCl.
pD = pH(meter reading) + 0.4
Equation 2.4 pH correction in deuterium oxide
36
Chapter 3: Results
3.1 Synthesis
Both MBP and BP were produced by single or double demethylation of dimethyl
benzoylphosphonate. This compound was in turn synthesized using the well-established
Michaelis-Arbuzov reaction without major complications. MoBP was synthesized using
established procedures from our laboratory48 and did not present any challenges.
The purification of BoP turned out to be inefficient. After the purification steps the product was
only sparingly soluble in water. This should not be the case since benzoylphosphate is charged
and should be readily soluble in this solvent 49. It is likely that the starting material, benzoic
anhydride, did not react completely and that the separation of this compound from BoP was not
successful.
m-FMoBP was also tested as an inhibitor. This compound had been previously synthesized and
found to be pure by 1H.
1H NMR (400 MHz, D2O): δ 7.8-7.4 (m, 4H), 3.6 (d, 3H)
37
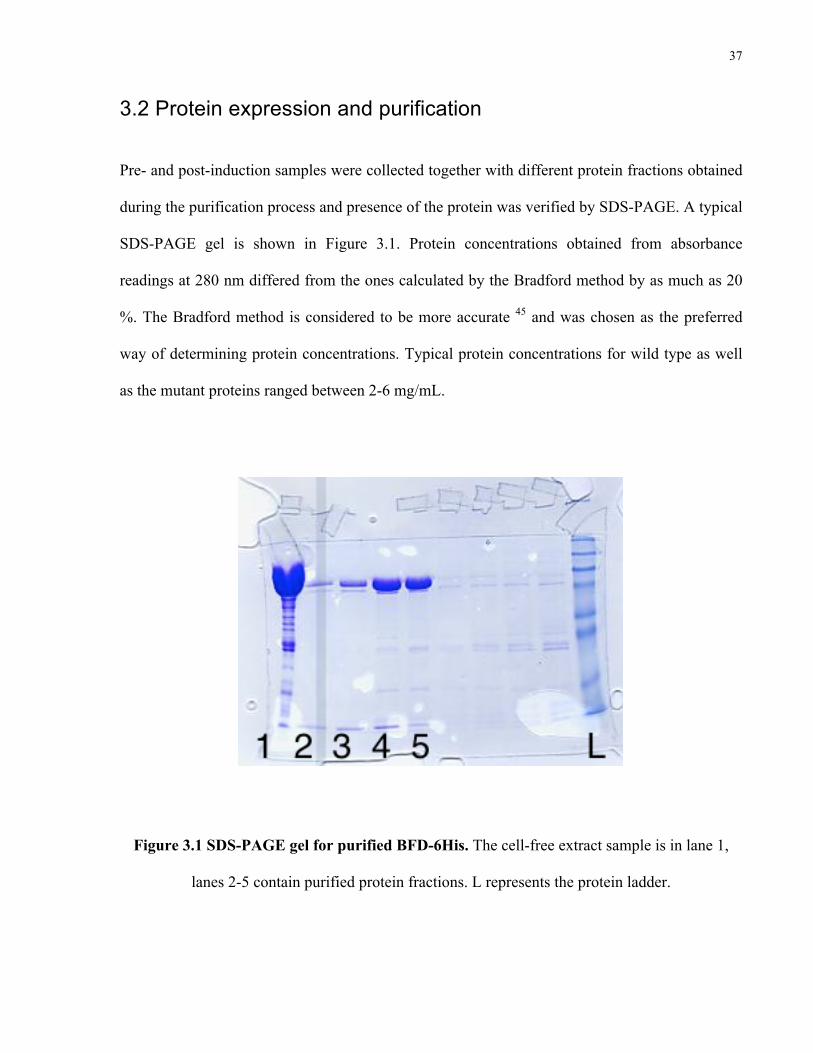
3.2 Protein expression and purification
Pre- and post-induction samples were collected together with different protein fractions obtained
during the purification process and presence of the protein was verified by SDS-PAGE. A typical
SDS-PAGE gel is shown in Figure 3.1. Protein concentrations obtained from absorbance
readings at 280 nm differed from the ones calculated by the Bradford method by as much as 20
%. The Bradford method is considered to be more accurate 45 and was chosen as the preferred
way of determining protein concentrations. Typical protein concentrations for wild type as well
as the mutant proteins ranged between 2-6 mg/mL.
Figure 3.1 SDS-PAGE gel for purified BFD-6His. The cell-free extract sample is in lane 1,
lanes 2-5 contain purified protein fractions. L represents the protein ladder.
38
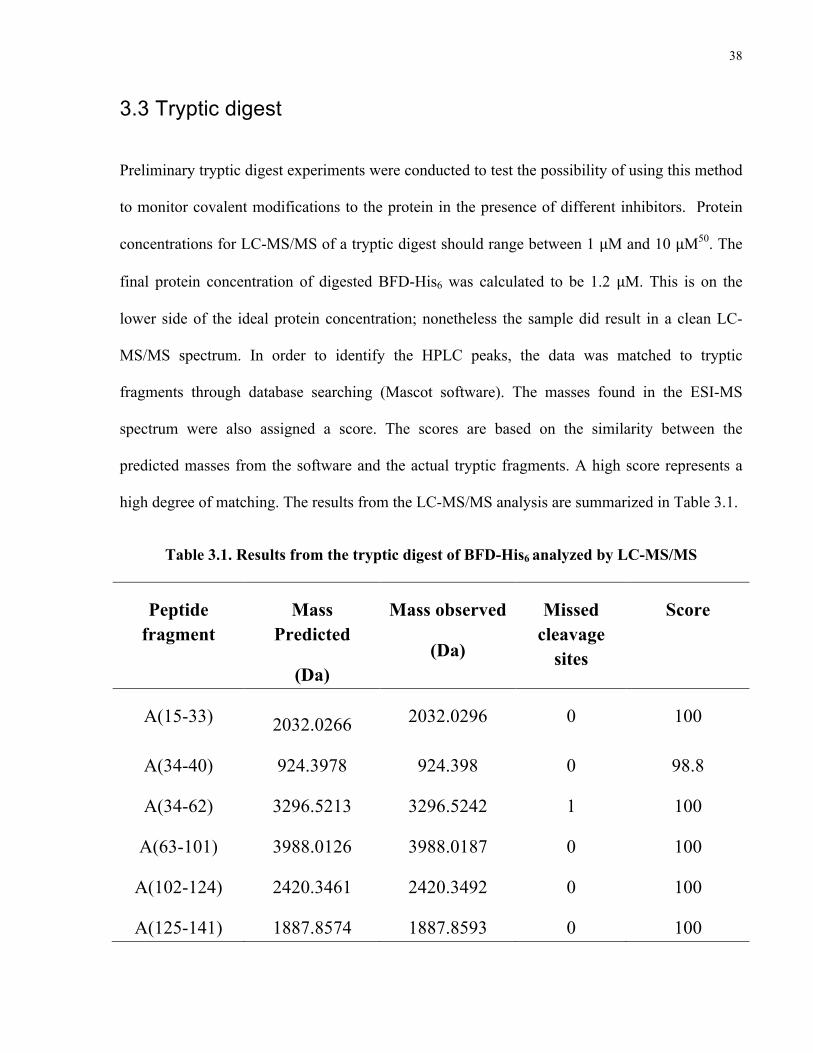
3.3 Tryptic digest
Preliminary tryptic digest experiments were conducted to test the possibility of using this method
to monitor covalent modifications to the protein in the presence of different inhibitors. Protein
concentrations for LC-MS/MS of a tryptic digest should range between 1 μM and 10 μM50. The
final protein concentration of digested BFD-His6 was calculated to be 1.2 μM. This is on the
lower side of the ideal protein concentration; nonetheless the sample did result in a clean LC-
MS/MS spectrum. In order to identify the HPLC peaks, the data was matched to tryptic
fragments through database searching (Mascot software). The masses found in the ESI-MS
spectrum were also assigned a score. The scores are based on the similarity between the
predicted masses from the software and the actual tryptic fragments. A high score represents a
high degree of matching. The results from the LC-MS/MS analysis are summarized in Table 3.1.
Table 3.1. Results from the tryptic digest of BFD-His6 analyzed by LC-MS/MS
Peptide fragment
Mass Predicted
(Da)
Mass observed
(Da)
Missed cleavage
sites
Score
A(15-33)
2032.0266 2032.0296 0 100
A(34-40) 924.3978 924.398 0 98.8
A(34-62) 3296.5213 3296.5242 1 100
A(63-101) 3988.0126 3988.0187 0 100
A(102-124) 2420.3461 2420.3492 0 100
A(125-141) 1887.8574 1887.8593 0 100

39
A(142-165) 2690.2509 2690.2553 0 98.2
A(142-177) 4108.8836 4108.8916 1 100
A(178-184) 770.4035 770.4045 0 95.8
A(185-195) 1285.6766 1285.6771 0 100
A(196-228) 3498.5926 3498.5926 1 100
A(229-239) 1149.6295 1149.6306 0 80.4
A(250-279) 2942.6416 2942.6466 0 100
A(280-294) 1837.8748 1837.8782 0 100
A(395-307) 1386.7177 1386.7188 0 100
A(308-334) 2658.2993 2658.3011 0 100
A(335-345) 1104.5815 1104.5824 0 100
A(335-352) 1862.9486 1862.9516 1 100
A(353-386) 3922.8142 3922.8205 0 100
A(387-390) 532.2792 532.2792 0 80
A(463-484) 2400.2114 2400.2147 0 100
A(485-488) 401.2638 401.2638 0 100
A(489-496) 834.46 834.4612 0 100
A(497-504) 929.4818 929.4828 0 100
A(505-514) 1002.5346 1002.5352 0 100
A(515-528) 1423.8286 1423.8295 0 100
Fragments A(1-13), A(391-420), A(421-460) and A(529-535) are missing.

40
3.4 Enzyme kinetics
3.4.1 Inhibitors of wild-type BFD
All compounds tested except for m-FMoBP did act as inhibitors of BFD. BoP was not testes for
inhibition due to problems with purification described in section 3.1. The concentration of m-
FMoBP was increased up to 20 mM (~ 50 * Km) without any effects on the rate of
decarboxylation by BFD. It is interesting to note that all Ki values are similar to one another and
similar to Km. Table 3.2 lists the inhibition constants of the different inhibitors of BFD.
Table 3.2 Inhibition constants of a number of inhibitors of BFD.
Substrate/Inhibitor Km or Ki (mM)
Benzoylformate 0.39 ± 0.07
Methyl benzoylphosphonate 0.43 ± 0.07
Benzoylphosphonate 0.31 ± 0.12
Methyl benzoylphosphate 0.38 ± 0.04
m-fluoro methyl benzoylphosphate No inhibition up to 20 mM F-MoBP
41
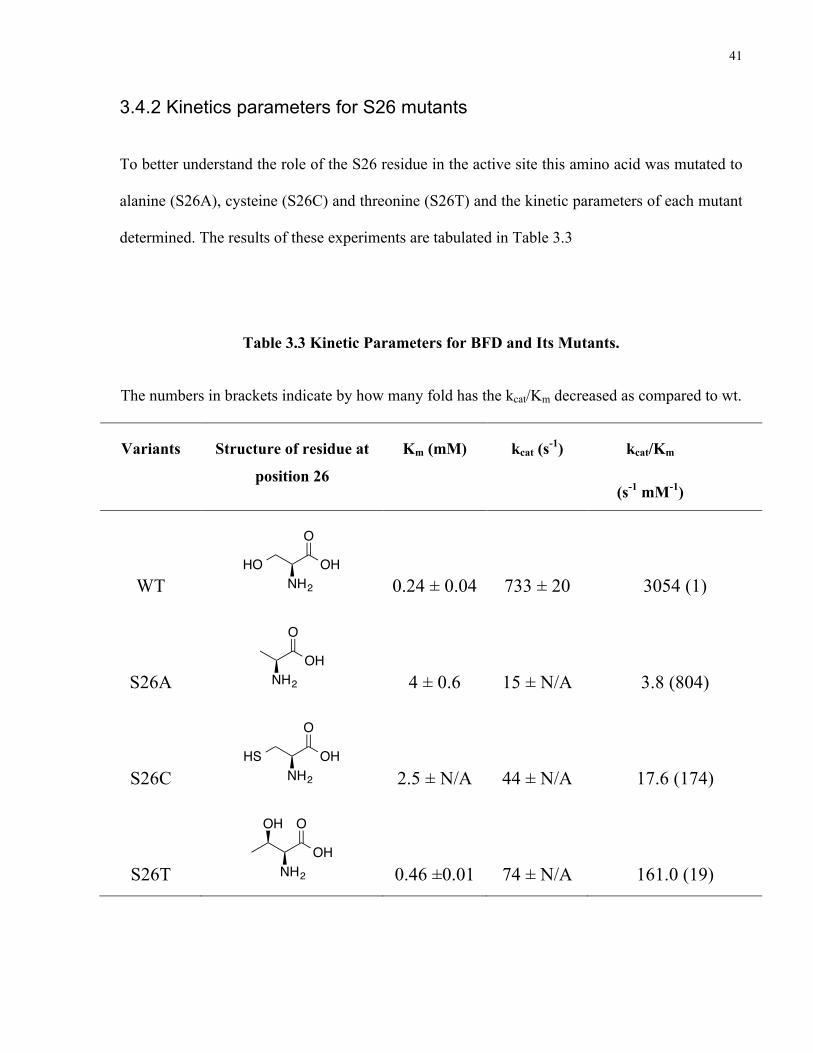
3.4.2 Kinetics parameters for S26 mutants
To better understand the role of the S26 residue in the active site this amino acid was mutated to
alanine (S26A), cysteine (S26C) and threonine (S26T) and the kinetic parameters of each mutant
determined. The results of these experiments are tabulated in Table 3.3
Table 3.3 Kinetic Parameters for BFD and Its Mutants.
The numbers in brackets indicate by how many fold has the kcat/Km decreased as compared to wt.
Variants Structure of residue at
position 26
Km (mM) kcat (s-1) kcat/Km
(s-1 mM-1)
WT
0.24 ± 0.04
733 ± 20
3054 (1)
S26A
4 ± 0.6
15 ± N/A
3.8 (804)
S26C
2.5 ± N/A
44 ± N/A
17.6 (174)
S26T
0.46 ±0.01
74 ± N/A
161.0 (19)
NH2
HO
O
OH
NH2
O
OH
NH2
HS
O
OH
NH2
OH O
OH

42
3.5 Kinetics and activation parameters for decarboxylation of 2-(α-
mandelyl)thiamine in solution
Eyring plots constructed by plotting rate constants as a function of changing temperature
provided activation parameters for the MTh decarboxylation reaction at pH 4.6 and 7.2. The
results at pH 4.6 are tabulated in Table 3.4 and those at pH 7.2 in Table 3.5. The activation
energies were obtained graphically from the slopes of the straight lines in the ln(k/T) vs.1/T plot.
A typical diagram is shown in Figure 3.2. The pseudo-first order observed rate constants are
tabulated in Appendix 2.
Figure 3.3 shows the second order slopes for decarboxylation of MTh at 4.6 and 7.2 at room
temperature. The second order rate constant at pH 4.6 is 18 times greater then at pH 7.2.
Figure 3.2 Eyring plot of ln(k/T) vs. 1/T for reactions at 0.2 M Acetate, pH 7.2.
1/T
0.00320.003220.003240.003260.003280.00330.003320.003340.00336
ln(k/T)
-15-14.8-14.6-14.4-14.2-14
-13.8-13.6-13.4-13.2-13
-12.8
1/T
0.0032 0.00322 0.00324 0.00326 0.00328 0.0033 0.00332 0.00334
ln(k/T)
-13.8
-13.6
-13.4
-13.2
-13
-12.8
-12.6
-12.4
-12.2 ln(k/T)
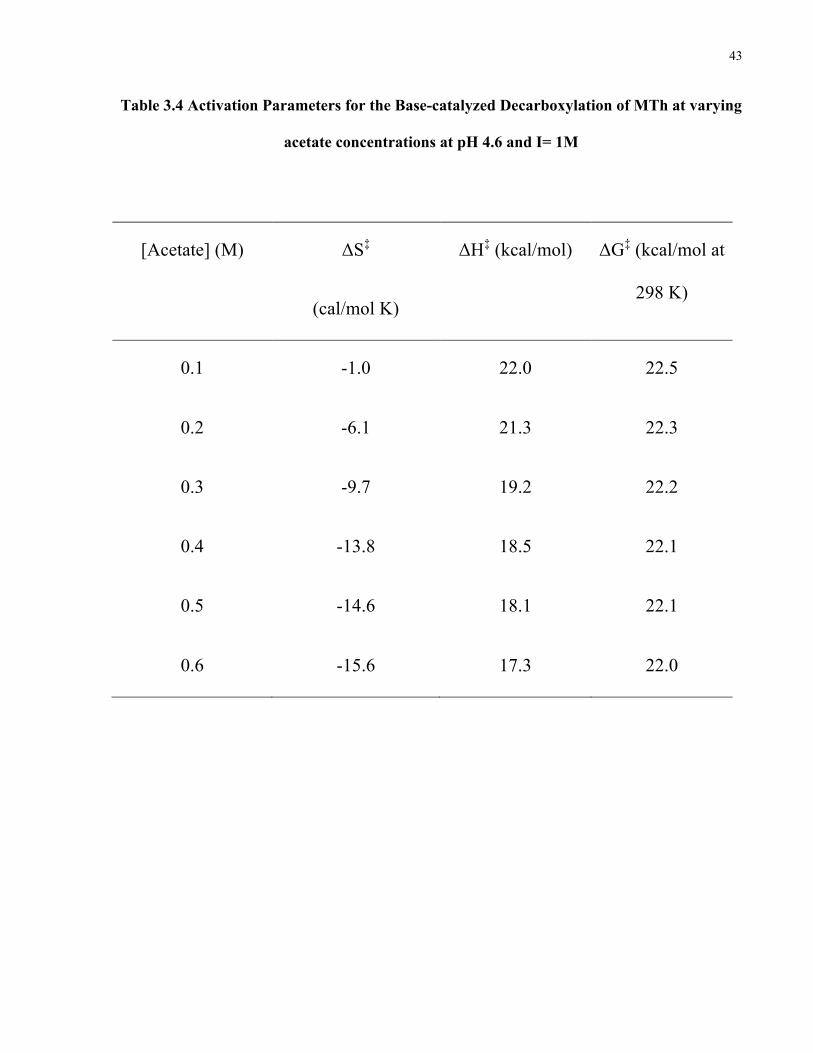
43
Table 3.4 Activation Parameters for the Base-catalyzed Decarboxylation of MTh at varying
acetate concentrations at pH 4.6 and I= 1M
[Acetate] (M) ΔS‡
(cal/mol K)
ΔH‡ (kcal/mol) ΔG‡ (kcal/mol at
298 K)
0.1 -1.0 22.0 22.5
0.2 -6.1 21.3 22.3
0.3 -9.7 19.2 22.2
0.4 -13.8 18.5 22.1
0.5 -14.6 18.1 22.1
0.6 -15.6 17.3 22.0
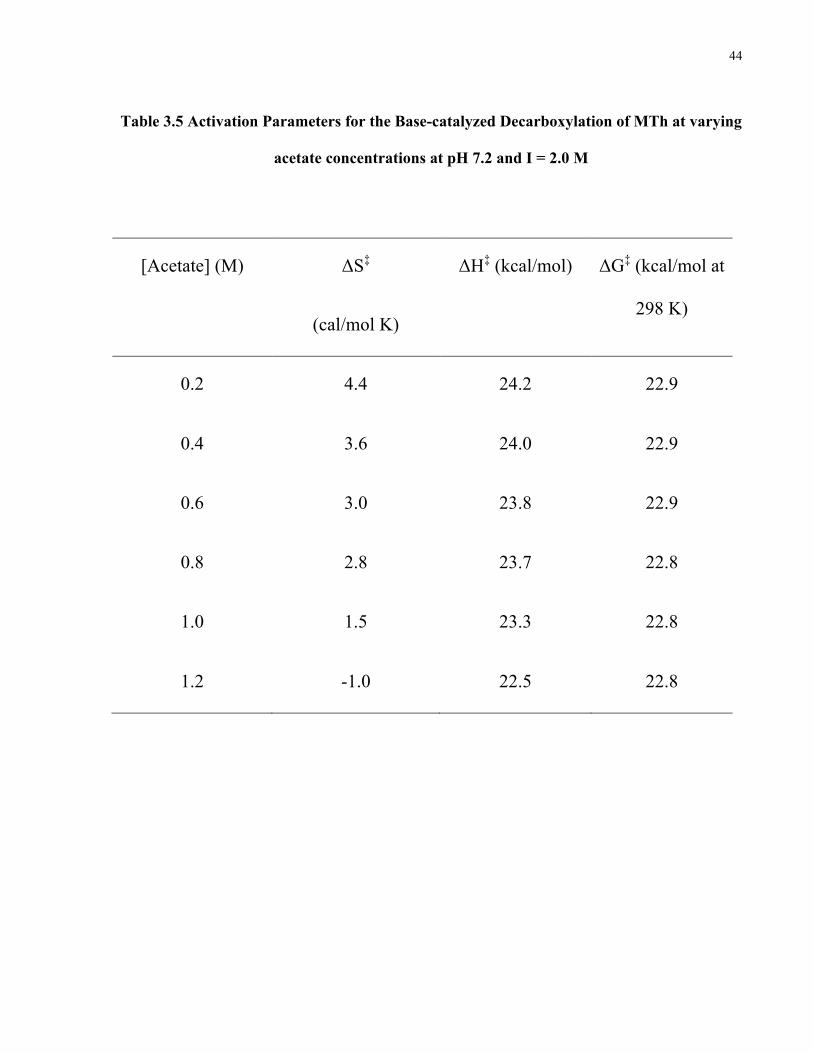
44
Table 3.5 Activation Parameters for the Base-catalyzed Decarboxylation of MTh at varying
acetate concentrations at pH 7.2 and I = 2.0 M
[Acetate] (M) ΔS‡
(cal/mol K)
ΔH‡ (kcal/mol) ΔG‡ (kcal/mol at
298 K)
0.2 4.4 24.2 22.9
0.4 3.6 24.0 22.9
0.6 3.0 23.8 22.9
0.8 2.8 23.7 22.8
1.0 1.5 23.3 22.8
1.2 -1.0 22.5 22.8
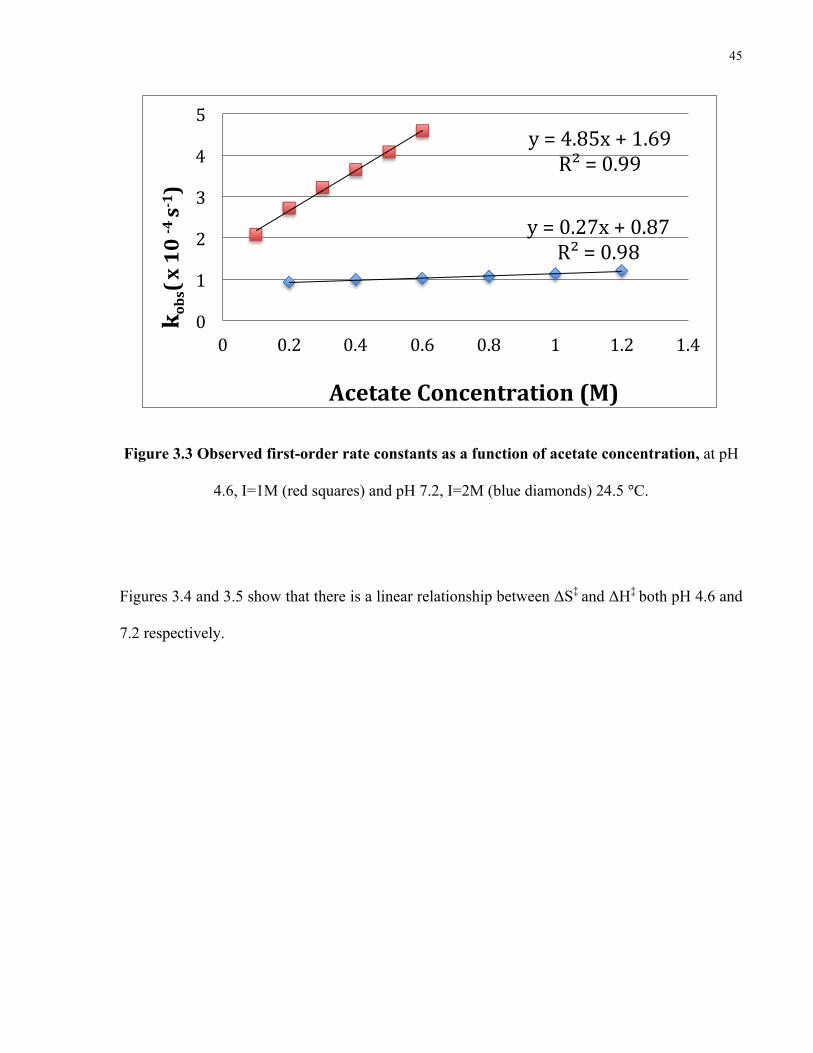
45
Figure 3.3 Observed first-order rate constants as a function of acetate concentration, at pH
4.6, I=1M (red squares) and pH 7.2, I=2M (blue diamonds) 24.5 °C.
Figures 3.4 and 3.5 show that there is a linear relationship between ΔS‡ and ΔH‡ both pH 4.6 and
7.2 respectively.
y = 0.27x + 0.87 R² = 0.98
y = 4.85x + 1.69 R² = 0.99
0
1
2
3
4
5
0 0.2 0.4 0.6 0.8 1 1.2 1.4
k obs( x 10 -‐4 s-‐1 )
Acetate Concentration (M)

46
Figure 3.4 Plot showing the linear relation between ΔS‡ and ΔH‡ at pH 4.6
Figure 3.5 Plot showing the linear relation between ΔS‡ and ΔH‡ at pH 7.2
S J/mol K
-60 -40 -20 0
H J
/mol
720007400076000780008000082000840008600088000900009200094000
S J/mol K
-6 -4 -2 0 2 4 6 8 10 12 14 16 18 20
H J
/mol
94000
96000
98000
1e5
1.02e5
47
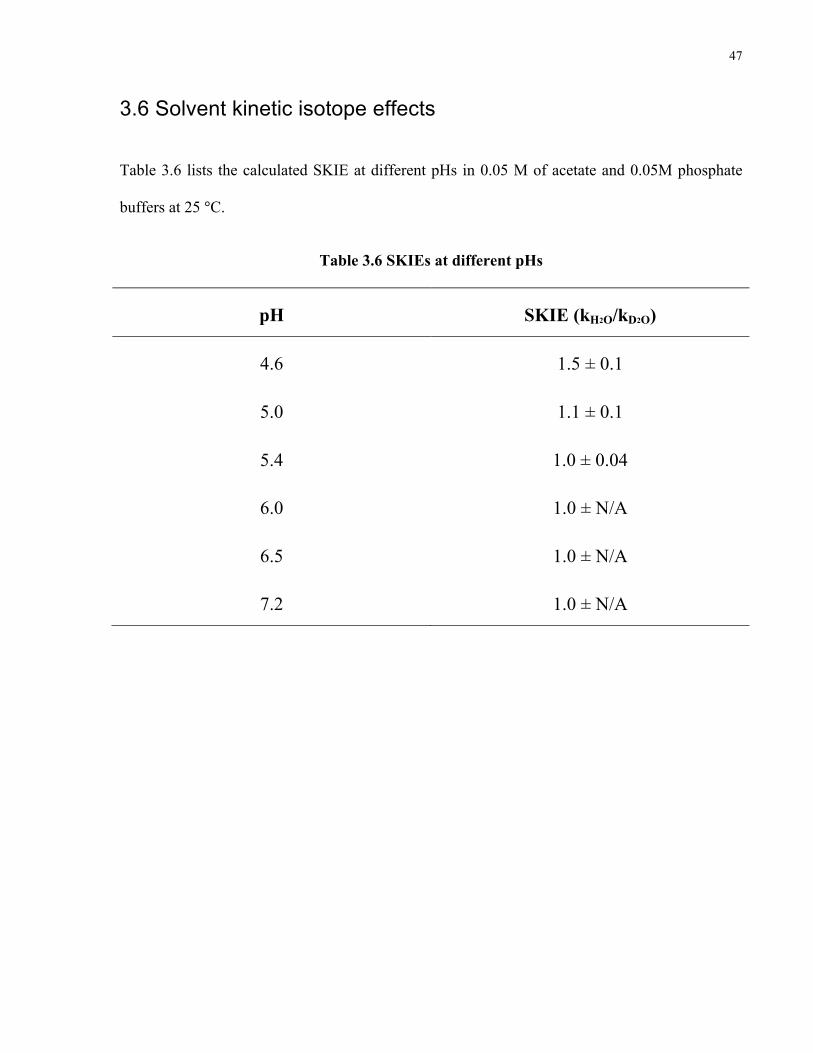
3.6 Solvent kinetic isotope effects
Table 3.6 lists the calculated SKIE at different pHs in 0.05 M of acetate and 0.05M phosphate
buffers at 25 °C.
Table 3.6 SKIEs at different pHs
pH SKIE (kH2O/kD2O)
4.6 1.5 ± 0.1
5.0 1.1 ± 0.1
5.4 1.0 ± 0.04
6.0 1.0 ± N/A
6.5 1.0 ± N/A
7.2 1.0 ± N/A
48
Chapter 4: Discussion
4.1 Tryptic digest
LC-MS/MS analysis of tryptic digests of BFD incubated with a number of inhibitors could be an
efficient, fast and easy method of assessing covalent modifications on the enzyme caused by the
inhibitors. The results presented in section 3.3 pertain to the wild-type enzyme in the absence of
inhibitors. This was done to test the viability of the method and as a proof of concept. The results
confirm that the method is appropriate to study covalent modifications on the enzyme and to
determine the site of these modifications. After incubation of the enzyme with BP the mass of
fragment A(15-33) should increase. Fragments A(1-13), A(391-420), A(421-460) and A(529-
535) were missing from the LC-MS/MS spectrum. It is not clear why these fragments were not
observed.
4.2 Inhibitors of BFD
MBP and BP have previously been reported as inhibitors of BFD18. The Ki values of both these
inhibitors as well as that of MoBP closely resemble the Km value of the substrate. All three
inhibitors are thus ground-state analogues of the substrate. As discussed in the introductory
section a transition-state analogue would be expected to have a much larger affinity for the
enzyme in the range of 10-9 M and has not yet been synthesized or tested.
Although both MBP and BP behave as ground state analogues, are competitive inhibitors of BFD
and inactivate the enzyme irreversibly their mode of inhibition is different18. The inhibition of
the enzyme by BP is due to the phosphorylation of serine 26, likely through one of the two

49
mechanisms shown in Scheme 1.3. In contrast the inactivation produce by MBP is due to the
formation of a covalent intermediate between ThDP and MBP that cannot further decompose18.
The structure of this intermediate is shown in Figure 4.1.
Figure 4.1 Structure of the covalently modified thiamine diphosphate by methyl
benzoylphosphonate
The reason for the difference in the reactivity between these two compounds is not completely
understood. One possible explanation is based on the reported observation that methyl
metaphosphate is more difficult to generate than metaphosphate51. If this indeed is the reason
behind the difference in reactivity of the two inhibitors then it is likely that pathway A from
Scheme 1.3 is the correct one. In this pathway metaphosphate is generated first and then it reacts
with S26 to phosphorylate it.
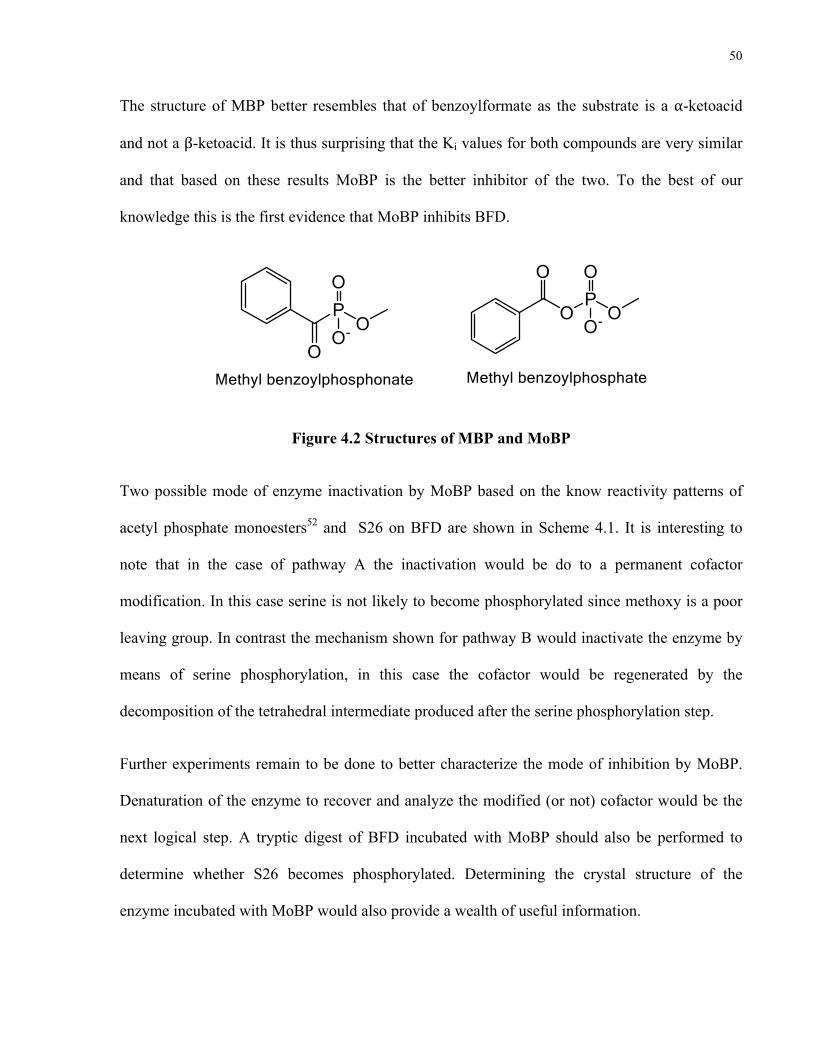
The inhibitors MBP and MoBP differ in structure only by one oxygen atom, this oxygen is the
bridging oxygen between the carbonyl carbon and the phosphorus atom which is present in the
structure of MoBP but not it that of MBP. The structure of both inhibitors is shown in Figure 4.2.
S
N+
OPPHO
P
Ph
O
OO
Ar
50
The structure of MBP better resembles that of benzoylformate as the substrate is a α-ketoacid
and not a β-ketoacid. It is thus surprising that the Ki values for both compounds are very similar
and that based on these results MoBP is the better inhibitor of the two. To the best of our
knowledge this is the first evidence that MoBP inhibits BFD.
Figure 4.2 Structures of MBP and MoBP
Two possible mode of enzyme inactivation by MoBP based on the know reactivity patterns of
acetyl phosphate monoesters52 and S26 on BFD are shown in Scheme 4.1. It is interesting to
note that in the case of pathway A the inactivation would be do to a permanent cofactor
modification. In this case serine is not likely to become phosphorylated since methoxy is a poor
leaving group. In contrast the mechanism shown for pathway B would inactivate the enzyme by
means of serine phosphorylation, in this case the cofactor would be regenerated by the
decomposition of the tetrahedral intermediate produced after the serine phosphorylation step.
Further experiments remain to be done to better characterize the mode of inhibition by MoBP.
Denaturation of the enzyme to recover and analyze the modified (or not) cofactor would be the
next logical step. A tryptic digest of BFD incubated with MoBP should also be performed to
determine whether S26 becomes phosphorylated. Determining the crystal structure of the
enzyme incubated with MoBP would also provide a wealth of useful information.
51
Another surprising finding is the fact that m-FMoBP does not seem to bind to BFD even at
concentrations as high as 20 mM (50X Km). This is surprising since the active site of BFD is
fairly plastic53 and can accommodate larger molecules such as [p-
(bromomethyl)benzoyl]formate54. To the best of our knowledge no other meta-substituted
compounds have been tested as BFD inhibitors. It is possible that substitutions at this position
preclude the molecule from binding to BFD. It remains to be further tested why BFD does not
recognize m-FMoBP as substrate.
BFD is one of the ThDP-dependent enzymes that is essential for the viability of certain
microorganisms (Pseudomonas and Actinobacter species) but that is not present in humans as
such inhibitors of this enzyme might be potential candidates for antibacterials55.

52
Scheme 4.1 Possible mechanisms for the inhibition of BFD by MoBP. Pathway A represents
the spontaneous loss of the methyl phosphate as a leaving group. Pathway B represents the direct
nucleophilic attack on the tetrahedral intermediate.
S
N
R1
R2
PO
O OMeO-Ph
OH+
S
N
R1
R2
OHPh
O PO
OMeO
Nu
S
N
R1
R2
OHPh
O
S
N
R1
R2
PO
O OMeO-Ph
O
S
N
R1
R2
OHPh
O P OOMeO
BS
N
R1
R2
O
Ph
PO
MeO O-O-
Pathway A
Pathway B
NuPO
MeOO
S
N
R1
R2
Ph
O
O
53
4.3 Kinetic parameters for S26 mutants on BFD
The amino acid substitutions at position 26 were chosen to specifically assess the importance of a
nucleophilic functional group at that position. Choosing to mutate serine to residues with similar
structures should minimize any structural changes in the active site of the protein. Threonine has
an additional methyl group compared with serine and might thus create some steric hindrance.
Serine and cysteine differ only by one atom and are structurally very similar although the sulfur
atom is larger than oxygen. The van der Waals radii of oxygen and sulfur are 1.40 and 1.85 Å
respectively, and the covalent radii are 0.66 and 1.04 Å, respectiverly56. In alanine the side chain
becomes truncated by the –OH group as compared to serine and is not expected to have major
structural effects on the active site of BFD. Circular dichroism (CD) experiments confirm that
the point mutations do not have a detectable effect on the overall secondary structure of the
protein (personal correspondence with Prof. M. McLeish).
The S26A mutant shows the biggest decrease in the specificity constant (kcat/Km) with respect to
wild type, with a drop of more then 800-fold. The elimination of the hydroxyl group has a big
effect on both substrate binding (Km) and catalysis (kcat). This result was not unexpected and it is
in agreement with previous studies on this mutant 17.
It is interesting that between the two mutants that retained a nucleophilic functional group, the
nature of the nucleophile seems to be important. Although thiols are better nucleophiles than
alcohols, the S26C mutant is less active than S26T. The incorporation of the methyl group alpha
to the hydroxyl (S26T) has an effect of increasing Km by two fold. This is not a drastic change
compared to the almost 17-fold increase caused by removing the hydroxyl group in S26A. This
is in line with previous research indicating that the hydroxyl group of serine is implicated in
forming a H-bond with the substrate carboxylate17. The two-fold increase in the Km of S26T
54
might be due to minor steric perturbations of the active site. S26C shows a 10-fold increase in
Km with respect to wt.
It is also interesting to note that the effects of mutating serine have a greater effect on kcat than on
Km. This observation supports the idea that S26 must be playing an important role in the catalysis
of decarboxylation of benzoylformate.
The same trend observed in the mutants with respect to Km can be seen for kcat. The mutant with
the smallest decrease in kcat is S26T, which displays a 10-fold lowering of kcat with respect to the
wild-type enzyme. S26C has almost a 17-fold decrease in kcat with respect to the wt enzyme and
S26A shows a 49-fold decrease in kcat with respect to the wt.
Although it is surprising to see such a marked difference between the –OH and –SH nucleophiles
literature reports also describe marked changes in activity between enzymes differing only by the
nature of the nucleophilic functional group between serine and cysteine57. Neet and Koshland
reported that converting the hydroxyl of a serine in the active center of subtilisin to a sulfhydryl
group resulted in a 100-fold loss of activity towards normal ester and peptide substrates57. The
authors ascribed the loss of activity to the change in geometry in the active site caused by the
increase in radius of 0.4 Å and the change in bond angle due to the sulfur atom57. However it
would be very surprising in the enzyme displayed such enormous sensitivity to subtle changes in
structure.
Another hypothesis to explain the poorer enzymatic efficiency of S26C compared to S26T is that
the thiol nucleophile is too nucleophilic or “sticky”. If serine is indeed acting as a nucleophile to
trap CO2 then the cysteine variant might be holding on to the CO2 too tightly and slowing down
the turnover. In their paper, Neet and Koshland also noted that thiol esters are less susceptible to
55
acid hydrolysis than are oxygen esters. They suggested that a general acid-catalyzed deacylation
of thiol-subtilisin might become critically rate-determining57.
4.4 Kinetics, activation parameters and SKIEs for the decarboxylation of
MTh in solution
To further characterize the base-catalyzed mechanism of MTh decarboxylation in solution
activation energies were calculated based on rate constants obtained at different temperatures.
Activation parameters provide important information about the enthalpic and entropic
differences between the transition state and the ground state of the RDS and insight into the
reaction mechanism.
The reaction conditions at the two different pH values differ in ionic strength. The change in this
parameter of the reaction conditions was based on the desire to compare results presented here
with those by Mr. Graeme Howe and Mr. Michael Bielecki. The phosphate species in the
acetate/phosphate co-buffer at pH 7.2 acts as the buffering species and is unreactive. Previous
results have shown that changing the ionic strength affects the zero-buffer rate but has no effect
on the second order rate constants for the base catalysis35 (supporting information). In fact as seen from
Figure 3.2 the second order rate constant at pH 7.2 is almost negligible (18 times smaller)
compared to that at pH 4.6. Accordingly a 1M change in acetate concentration only provides a
0.1 kcal/mol lowering of ΔG‡. This is consistent with previously reported data where it has been
shown that only the N1’-protonated form of MTh, not present substantially at pH 7.2, is subject
to base catalysis. The small second order rate constant is probably due to a medium effect.

56
Unpublished results by Mr. Graeme Howe show that at pH 7.2 there is second order rate constant
for the decarboxylation of MTh in acetonitrile (k2 ~ 0.8 x 10⁻⁴ s-1).
The SKIEs support the idea that there is a change in mechanism as the pH increases. The fact
that there is no SKIE at pH 5.0 or higher indicates that at those pH values the base-catalyzed
mechanism is not taking place. These results confirm that the N1’ protonated form of MTh is
required for base catalysis. It remains to be investigated why the protonation of the nitrogen is
essential for this mode of catalysis.
The data on activation parameters for decarboxylation reactions in the literature is limited and
not systematic. This is partly due to the often difficult interpretation of these parameters. Caution
must be exercised when interpreting activation parameters since solvation will have an effect on
both ΔH‡ and ΔS‡ 58. Moreover comparison of ΔS‡ for reactions of different molecularity should
be done with caution58. Keeping in mind those precautions it should still be expected that for
decarboxylation reactions in which the RDS is carbon-carbon bond breaking ΔS‡ should be
positive (favorable). A system for which activation energies have been reported and extensively
analyzed and which involves a one step decarboxylation reaction is 3-carboxybenzisoxazole. The
reaction is shown in Scheme 4.2. ΔS‡ for the reaction in water was reported to be 19 cal/mol K
and ΔH‡ to be 32 kcal/mol59. We can take these values to be “standards” of the activation
parameters for a one step decarboxylation reaction where internal return is not a problem, since
the negative charge is annihilated during the reaction progress59.
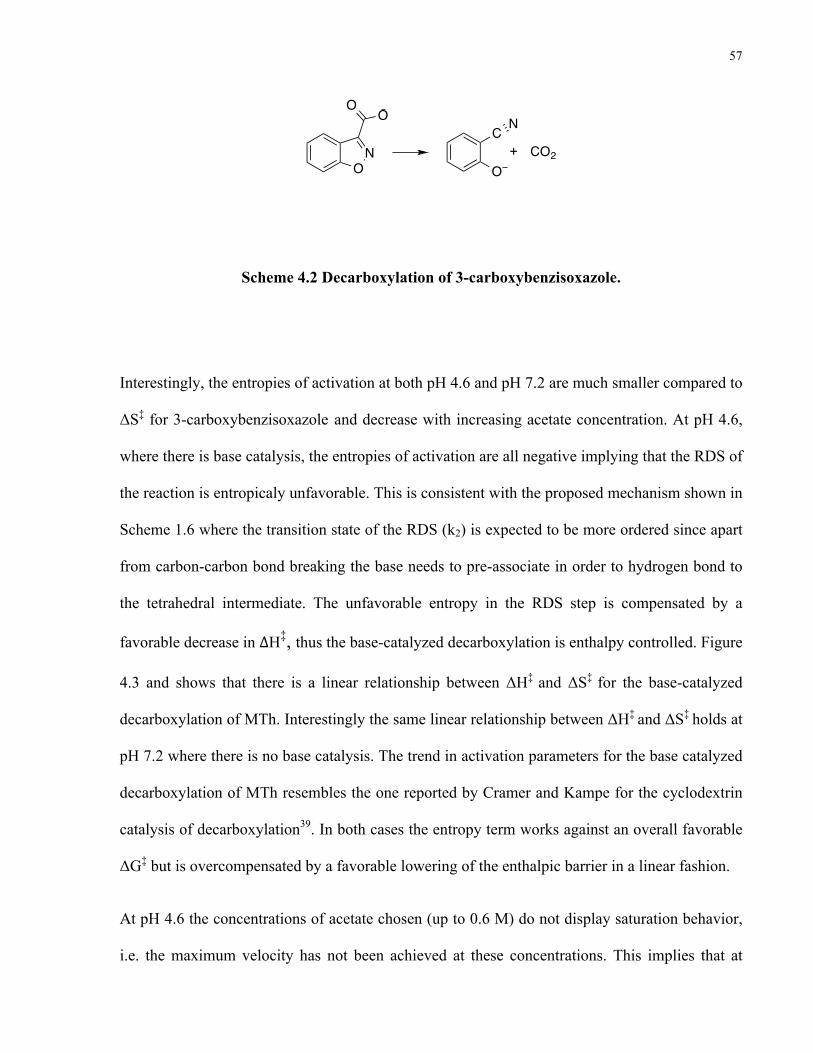
57
Scheme 4.2 Decarboxylation of 3-carboxybenzisoxazole.
Interestingly, the entropies of activation at both pH 4.6 and pH 7.2 are much smaller compared to
ΔS‡ for 3-carboxybenzisoxazole and decrease with increasing acetate concentration. At pH 4.6,
where there is base catalysis, the entropies of activation are all negative implying that the RDS of
the reaction is entropicaly unfavorable. This is consistent with the proposed mechanism shown in
Scheme 1.6 where the transition state of the RDS (k2) is expected to be more ordered since apart
from carbon-carbon bond breaking the base needs to pre-associate in order to hydrogen bond to
the tetrahedral intermediate. The unfavorable entropy in the RDS step is compensated by a
favorable decrease in ΔH‡, thus the base-catalyzed decarboxylation is enthalpy controlled. Figure
4.3 and shows that there is a linear relationship between ΔH‡ and ΔS‡ for the base-catalyzed
decarboxylation of MTh. Interestingly the same linear relationship between ΔH‡ and ΔS‡ holds at
pH 7.2 where there is no base catalysis. The trend in activation parameters for the base catalyzed
decarboxylation of MTh resembles the one reported by Cramer and Kampe for the cyclodextrin
catalysis of decarboxylation39. In both cases the entropy term works against an overall favorable
ΔG‡ but is overcompensated by a favorable lowering of the enthalpic barrier in a linear fashion.
At pH 4.6 the concentrations of acetate chosen (up to 0.6 M) do not display saturation behavior,
i.e. the maximum velocity has not been achieved at these concentrations. This implies that at
ON
OO
O
C N
CO2+
58
these conditions, not all of the molecules are decarboxylating through the lowest energy, base-
catalyzed pathway. Under these conditions some of the molecules must still decarboxylate via
the uncatalyzed pathway. The uncatalyzed pathway might involve direct loss of CO2. Alternative
a hydration mechanism in which water acts as a base is also conceivable. A combination of both
pathways is also not unreasonable. The fact that at pH 7.2, where there is no base catalysis, the
ΔS‡ values are low and eventually become negative, suggests that the uncatalyzed pathway is
likely to proceed through the hydration mechanism at least to some extent. However the reaction
mechanism for the uncatalyzed decarboxylation of MTh in solution (direct CO2 loss, indirect
bicarbonate loss or both) remains to be investigated in depth. A schematic showing all possible
competing pathways is shown in Scheme 4.3. Further increase in acetate concentration should
lead to rate accelerations and further lowering of ΔS‡ and ΔH‡ values.
Conventional hydrolytic processes tend to display TΔS‡ values in the range between -4 to -11
kcal/mol20. The values obtained for the entropy term of the base-catalyzed decarboxylation fall in
the lower range (~ -0.3 to -5 kcal/mol at 298 K) of this spectrum. The activation parameters at
pH 4.6 are consistent and lend further support to the proposed mechanism for base-catalyzed
indirect decarboxylation proceeding through the formation of bicarbonate. The activation
parameters at pH 7.2 most likely correspond to acceleration through some sort of medium effect.
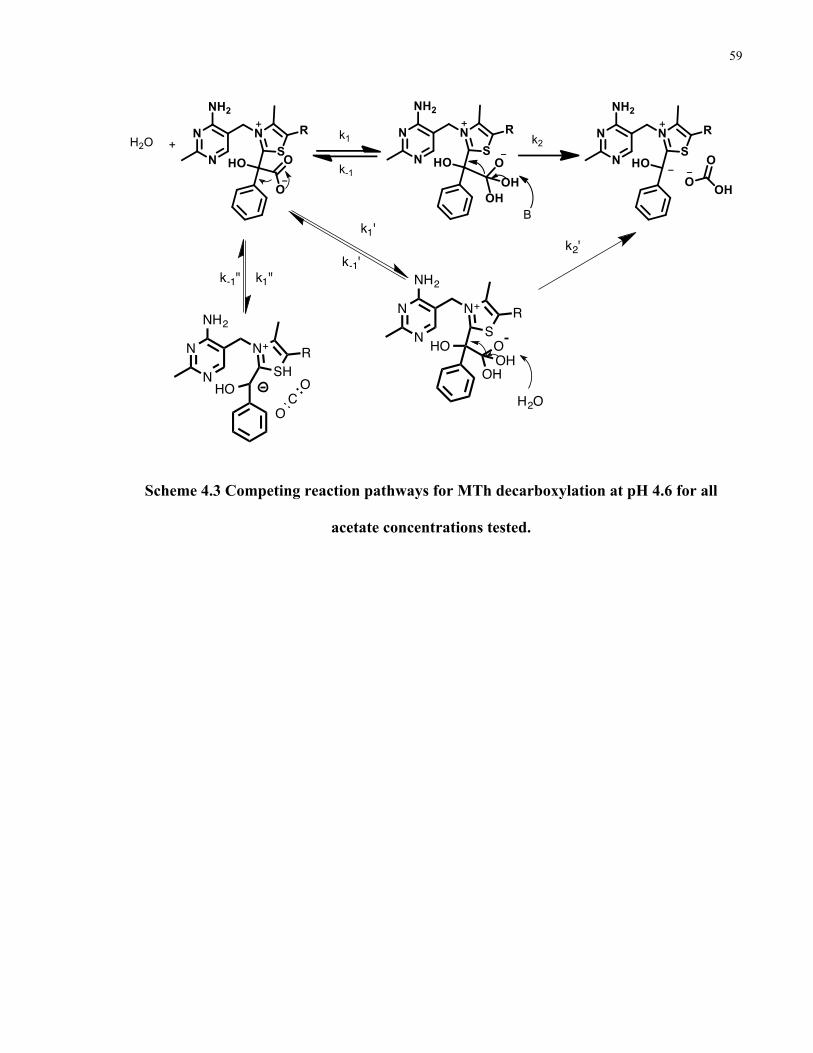
59
Scheme 4.3 Competing reaction pathways for MTh decarboxylation at pH 4.6 for all
acetate concentrations tested.
SHN+ R
N
N
NH2 SN+ R
N
N
NH2
HO
OH
OOH
H2O
k1'
k-1'
HOCO
O
k2'
k1"k-1"
60
Chapter 5: Conclusions and Future Directions
The enzyme mutagenesis and inhibition results presented in this dissertation clearly show that
S26 is essential for catalysis by BFD. Furthermore they support the hypothesis that BFD
catalyzes the decarboxylation of benzoylformate through a mechanism in which S26 acts as a
nucleophile to trap carbon dioxide. Such a mechanism is analogous to the one used by the serine
hydrolase enzyme superfamily to catalyze a variety of transformations60. These results led us to
propose that a decarboxylase might catalyze its reaction by a hydrolytic-like mechanism. This
type of catalysis in decarboxylases is only logical if internal return of CO2 and the carbanion
intermediate is a problem for the uncatalyzed pathway.
The base-catalyzed decarboxylation of MTh can be considered a solution model for the
mechanism catalyzed by the enzyme. The determination of activation parameters for the base-
catalyzed decarboxylation of MTh has provided further mechanistic information. The decrease in
ΔS‡ with increasing acetate concentrations indicates that the rate-limiting step in this mechanism
cannot be simply carbon-carbon bond breaking. This supports the previously proposed
mechanism in which a base participates in H-bonding to the hydrated carboxylate intermediate.
Much work remains to be done to further characterize both the enzymatic and non-enzymatic
systems. In terms of the enzymatic work the next step is to use LC-MS/MS of BFD tryptic
digests to further characterize the mode of inhibition by the new inhibitor; MoBP. Furthermore
inhibition studies on mutants of S26 will provide further information on the role of this amino
acid in catalysis. Why m-FMoBP is not an inhibitor of BFD also remains to be determined.
Obtaining activation parameters for the enzymatic reaction would also aid in understanding the
mechanism of catalysis by BFD. We can further characterize the solution phase reactivity of
61
MTh by obtaining activation parameters for the pyridinium-catalyzed reaction. Further
experiments need to be undertaken to understand the mechanism of uncatalyzed decarboxylation
of MTh in solution. It should not be assumed that direct loss of CO2 is the only alternative in the
absence of a catalyst. It remains to be determined why only the protonated N1’ form of MTh is
subjected to base catalysis. Experiments by other members in our laboratory are currently being
undertaken to understand the relevance of N1’ protonation in the base-catalyzed decarboxylation
of MTh.

62
References
1. Frank, R. A. W.; Leeper, F. J.; Luisi, B. F. Cell. Mol. Life Sci. 2007, 64, 892 – 905.
2. Begley, T. P.; Downs, D. M.; Ealick, S. E.; McLafferty, F. W.; Van Loon, A. P.; Taylor,
S.; Campobasso, N.; Chiu, H.; Kinsland, C.; Reddick, J. J.; Xi, J. Arch. Microbiol. 1999, 171,
293-300.
3. Jordan, F. Nat. Prod. Rep. 2003, 20, 184-201.
4. Williams, F. R.; Hager, L. P. Archives of Biochemistry and Biophysics 1966, 116, 168-
176.
5. Kluger, R.; Chin, J.; Smyth, T. J. Am. Chem. Soc. 1981, 103, 884-888.
6. Brown, B. R. Quar. Rev. 1951, 5, 131-146.
7. Breslow, R. J. Am. Chem. Soc.1957, 79, 1762 – 1762.
8. Breslow, R. J. Am. Chem. Soc. 1958, 80, 3719-3726.
9. Washabaugh, M. W.; Jencks, W. P. Biochemistry 1988, 27, 5044-5053.
10. a) Washabaugh, M. W.; Jencks, W. P. J. Am. Chem. Soc. 1989, 111, 674.
b) Washabaugh, M. W.; Jencks, W. P. J. Am. Chem. Soc. 1989, 111, 683.
11. Tsou, A. Y.; Ransom, S. C.; Gerlt, J. A.; Buechter, D. D. Biochemistry 1990, 29, 9856-
9862.
12. a) Hegeman, G. D. J. Bacteriol. 1966, 91, 1140-1154.
b) Hegeman, G. D. J. Bacteriol. 1966, 91, 1155-1160.
c) Hegeman, G. D. J. Bacteriol. 1966, 91, 1161-1167.
13. Reynolds, L. J.; Garcia, G. A.; Kozarich, J. W.; Kenyon, G. L. Biochemistry 1988, 27,
5530-5537.
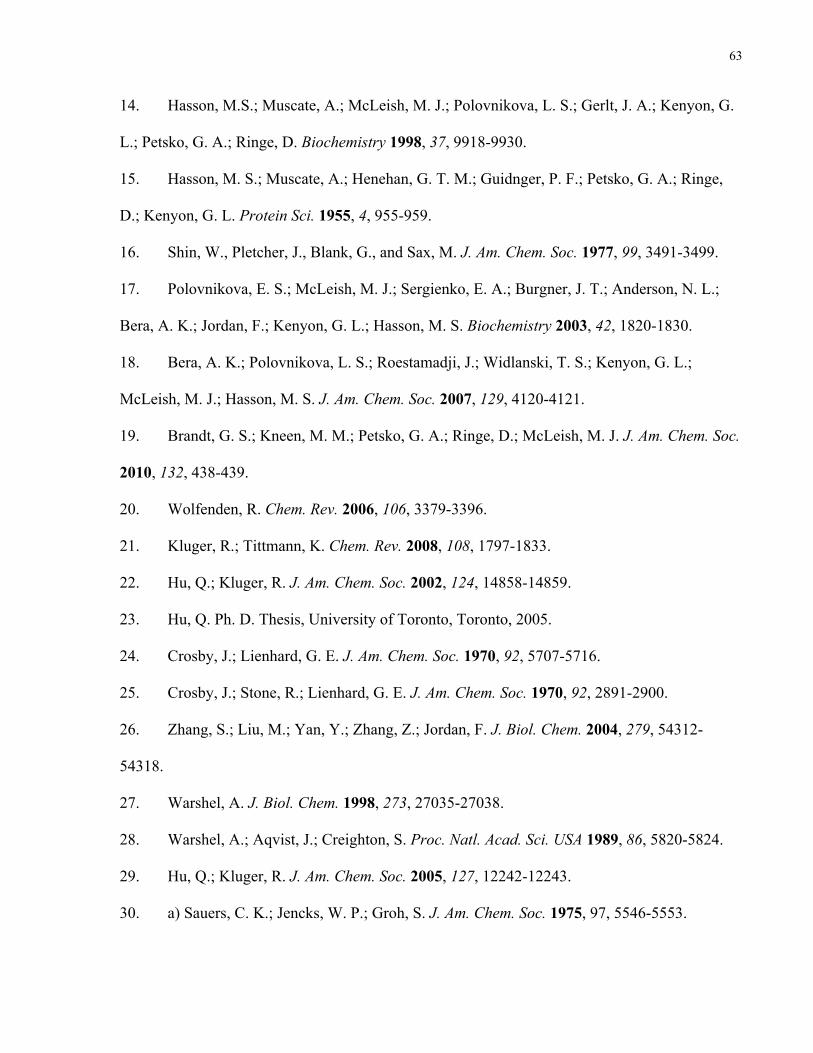
63
14. Hasson, M.S.; Muscate, A.; McLeish, M. J.; Polovnikova, L. S.; Gerlt, J. A.; Kenyon, G.
L.; Petsko, G. A.; Ringe, D. Biochemistry 1998, 37, 9918-9930.
15. Hasson, M. S.; Muscate, A.; Henehan, G. T. M.; Guidnger, P. F.; Petsko, G. A.; Ringe,
D.; Kenyon, G. L. Protein Sci. 1955, 4, 955-959.
16. Shin, W., Pletcher, J., Blank, G., and Sax, M. J. Am. Chem. Soc. 1977, 99, 3491-3499.
17. Polovnikova, E. S.; McLeish, M. J.; Sergienko, E. A.; Burgner, J. T.; Anderson, N. L.;
Bera, A. K.; Jordan, F.; Kenyon, G. L.; Hasson, M. S. Biochemistry 2003, 42, 1820-1830.
18. Bera, A. K.; Polovnikova, L. S.; Roestamadji, J.; Widlanski, T. S.; Kenyon, G. L.;
McLeish, M. J.; Hasson, M. S. J. Am. Chem. Soc. 2007, 129, 4120-4121.
19. Brandt, G. S.; Kneen, M. M.; Petsko, G. A.; Ringe, D.; McLeish, M. J. J. Am. Chem. Soc.
2010, 132, 438-439.
20. Wolfenden, R. Chem. Rev. 2006, 106, 3379-3396.
21. Kluger, R.; Tittmann, K. Chem. Rev. 2008, 108, 1797-1833.
22. Hu, Q.; Kluger, R. J. Am. Chem. Soc. 2002, 124, 14858-14859.
23. Hu, Q. Ph. D. Thesis, University of Toronto, Toronto, 2005.
24. Crosby, J.; Lienhard, G. E. J. Am. Chem. Soc. 1970, 92, 5707-5716.
25. Crosby, J.; Stone, R.; Lienhard, G. E. J. Am. Chem. Soc. 1970, 92, 2891-2900.
26. Zhang, S.; Liu, M.; Yan, Y.; Zhang, Z.; Jordan, F. J. Biol. Chem. 2004, 279, 54312-
54318.
27. Warshel, A. J. Biol. Chem. 1998, 273, 27035-27038.
28. Warshel, A.; Aqvist, J.; Creighton, S. Proc. Natl. Acad. Sci. USA 1989, 86, 5820-5824.
29. Hu, Q.; Kluger, R. J. Am. Chem. Soc. 2005, 127, 12242-12243.
30. a) Sauers, C. K.; Jencks, W. P.; Groh, S. J. Am. Chem. Soc. 1975, 97, 5546-5553.

64
b) Kluger, R.; Ikeda, G.; Hu, Q. Y.; Cao, P. P.; Drewry, J. J. Am. Chem. Soc. 2006, 128,
15856-15864.
31. Cram, D. J.; Haberfield, P. J. Am. Chem. Soc. 1961, 83, 2354-2362.
32. a) Mundle, S. O. C.; Rathgeber, S.; Lacrampe-Couloume, G.; Sherwood Lollar, B.;
Kluger, R. J. Am. Chem. Soc. 2009, 131, 11638-11639.
Kluger, R.; Mundle, S. O. C. Advances in Physical Organic Chemistry, 2010, 44, 357.
33. Gao, J.; Major, D. T. J. Chem. Theory Comput. 2007, 3, 949-960.
34. Venkatasubban, K. S.; Schowen, R. L. J. Org. Chem. 1984, 49, 653-655.
35. Howe, G. W.; Bielecki, M.; Kluger, R. 2012, 134, 20621-20623.
36. Edsall, J. T.; Wyman, J. In Biophysical Chemistry, Press:, A., Ed. New York, 1958.
37. Ludtke, S.; Neumann, P.; Erixon, K. M.; Leeper, F.; Kluger, R.; Fincer, R.; Tittmann, K.
Nat. Chem. 2013, 5, 762-767.
38. a) Evans, M. G.; M., P. Trans. Faraday Soc. 1935, 31, 875.
b) Eyring, H. J. Chem. Phys. 1935, 3, 107.
39. Cramer, F.; Kampe, W. J. Am. Chem. Soc. 1965, 87, 1115-1120.
40. Cramer, F. Chem. Ber. 1951, 84, 851.
41. Thomson, A. J. Chem . Soc. (B) 1970, 1198- 1201.
42. Karaman, R.; Goldblum, A.; Breuer, E.; Leader, H. J. Chem. Soc. Perkin Trans. 1 1989,
765-774.
43. Kluger, R.; Grant, A. S.; Bearne, S. L.; Trachsel, M. R. J,. Org. Chem. 1990, 55, 2864-
2868 .
44. Camici, G.; Manao, G.; Cappugi, G.; Ramponi, G. Experientia 1976, 32, 535-536.
45. Bradford, M. M. Anal. Biochem. 1976, 72, 248-254.
46. Storer, A. C.; Cornish-Bowden, A. Biochem. J. 1974, 141, 205-209.
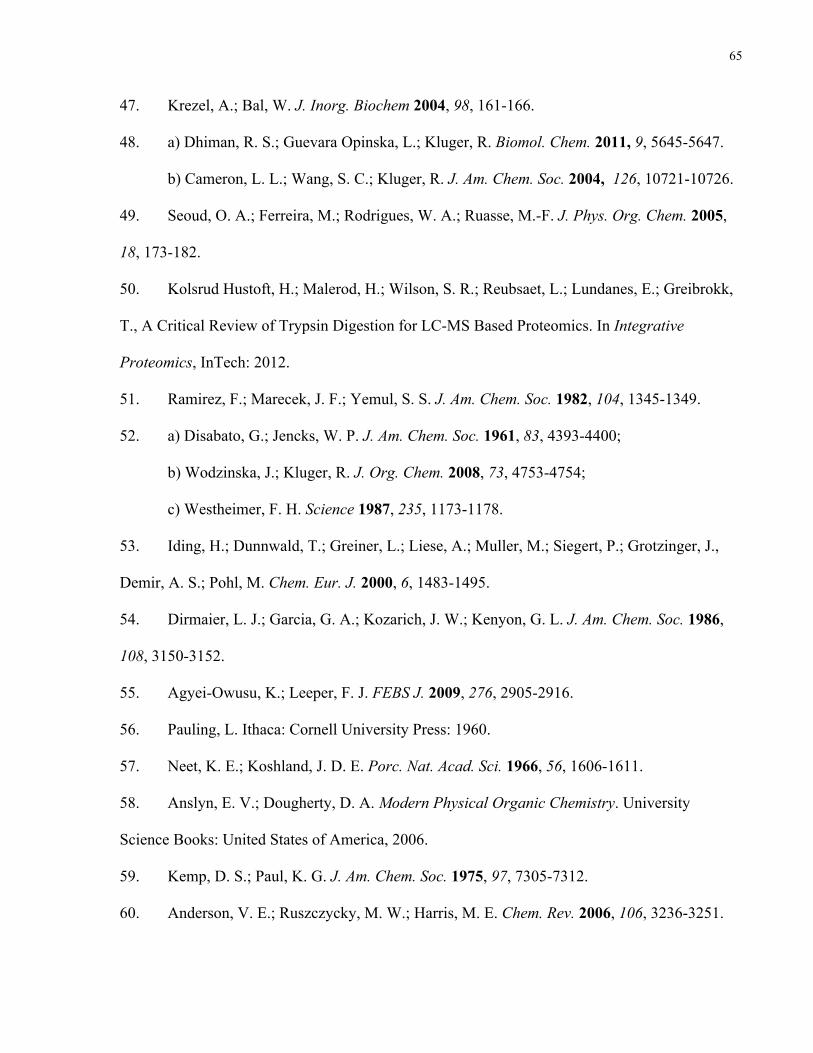
65
47. Krezel, A.; Bal, W. J. Inorg. Biochem 2004, 98, 161-166.
48. a) Dhiman, R. S.; Guevara Opinska, L.; Kluger, R. Biomol. Chem. 2011, 9, 5645-5647.
b) Cameron, L. L.; Wang, S. C.; Kluger, R. J. Am. Chem. Soc. 2004, 126, 10721-10726.
49. Seoud, O. A.; Ferreira, M.; Rodrigues, W. A.; Ruasse, M.-F. J. Phys. Org. Chem. 2005,
18, 173-182.
50. Kolsrud Hustoft, H.; Malerod, H.; Wilson, S. R.; Reubsaet, L.; Lundanes, E.; Greibrokk,
T., A Critical Review of Trypsin Digestion for LC-MS Based Proteomics. In Integrative
Proteomics, InTech: 2012.
51. Ramirez, F.; Marecek, J. F.; Yemul, S. S. J. Am. Chem. Soc. 1982, 104, 1345-1349.
52. a) Disabato, G.; Jencks, W. P. J. Am. Chem. Soc. 1961, 83, 4393-4400;
b) Wodzinska, J.; Kluger, R. J. Org. Chem. 2008, 73, 4753-4754;
c) Westheimer, F. H. Science 1987, 235, 1173-1178.
53. Iding, H.; Dunnwald, T.; Greiner, L.; Liese, A.; Muller, M.; Siegert, P.; Grotzinger, J.,
Demir, A. S.; Pohl, M. Chem. Eur. J. 2000, 6, 1483-1495.
54. Dirmaier, L. J.; Garcia, G. A.; Kozarich, J. W.; Kenyon, G. L. J. Am. Chem. Soc. 1986,
108, 3150-3152.
55. Agyei-Owusu, K.; Leeper, F. J. FEBS J. 2009, 276, 2905-2916.
56. Pauling, L. Ithaca: Cornell University Press: 1960.
57. Neet, K. E.; Koshland, J. D. E. Porc. Nat. Acad. Sci. 1966, 56, 1606-1611.
58. Anslyn, E. V.; Dougherty, D. A. Modern Physical Organic Chemistry. University
Science Books: United States of America, 2006.
59. Kemp, D. S.; Paul, K. G. J. Am. Chem. Soc. 1975, 97, 7305-7312.
60. Anderson, V. E.; Ruszczycky, M. W.; Harris, M. E. Chem. Rev. 2006, 106, 3236-3251.
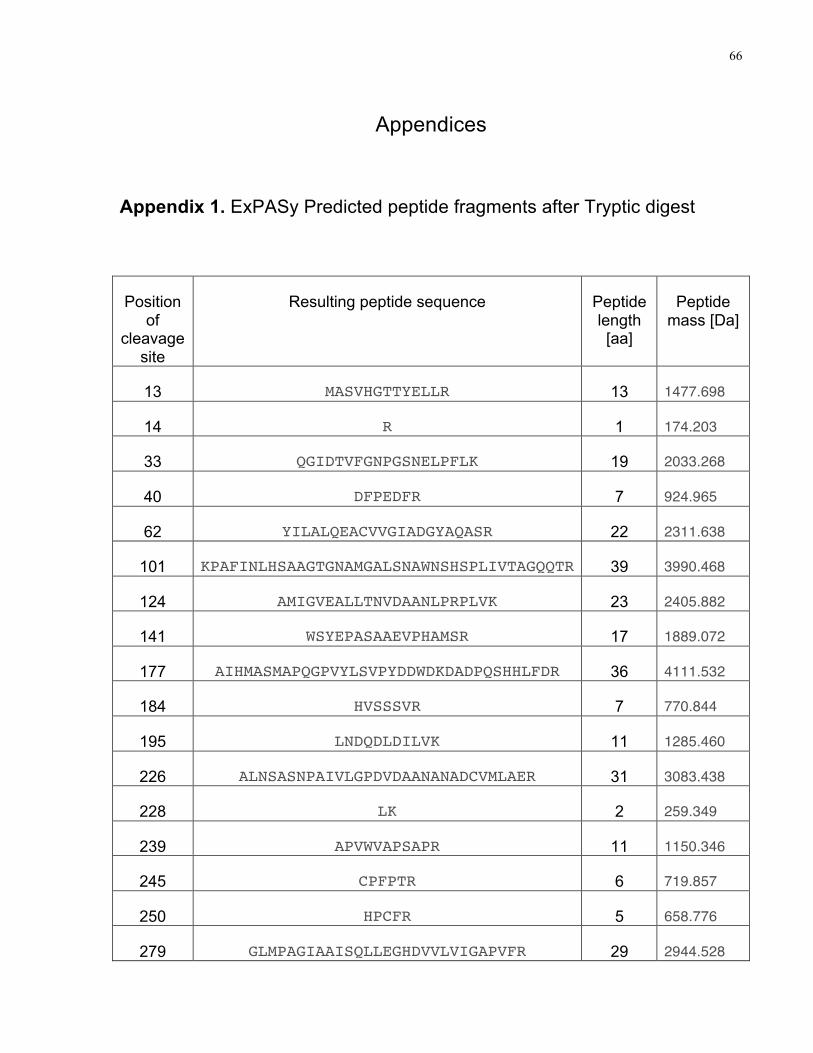
66
Appendices
Appendix 1. ExPASy Predicted peptide fragments after Tryptic digest
Position of
cleavage site
Resulting peptide sequence Peptide length [aa]
Peptide mass [Da]
13 MASVHGTTYELLR 13 1477.698
14 R 1 174.203
33 QGIDTVFGNPGSNELPFLK 19 2033.268
40 DFPEDFR 7 924.965
62 YILALQEACVVGIADGYAQASR 22 2311.638
101 KPAFINLHSAAGTGNAMGALSNAWNSHSPLIVTAGQQTR 39 3990.468
124 AMIGVEALLTNVDAANLPRPLVK 23 2405.882
141 WSYEPASAAEVPHAMSR 17 1889.072
177 AIHMASMAPQGPVYLSVPYDDWDKDADPQSHHLFDR 36 4111.532
184 HVSSSVR 7 770.844
195 LNDQDLDILVK 11 1285.460
226 ALNSASNPAIVLGPDVDAANANADCVMLAER 31 3083.438
228 LK 2 259.349
239 APVWVAPSAPR 11 1150.346
245 CPFPTR 6 719.857
250 HPCFR 5 658.776
279 GLMPAGIAAISQLLEGHDVVLVIGAPVFR 29 2944.528
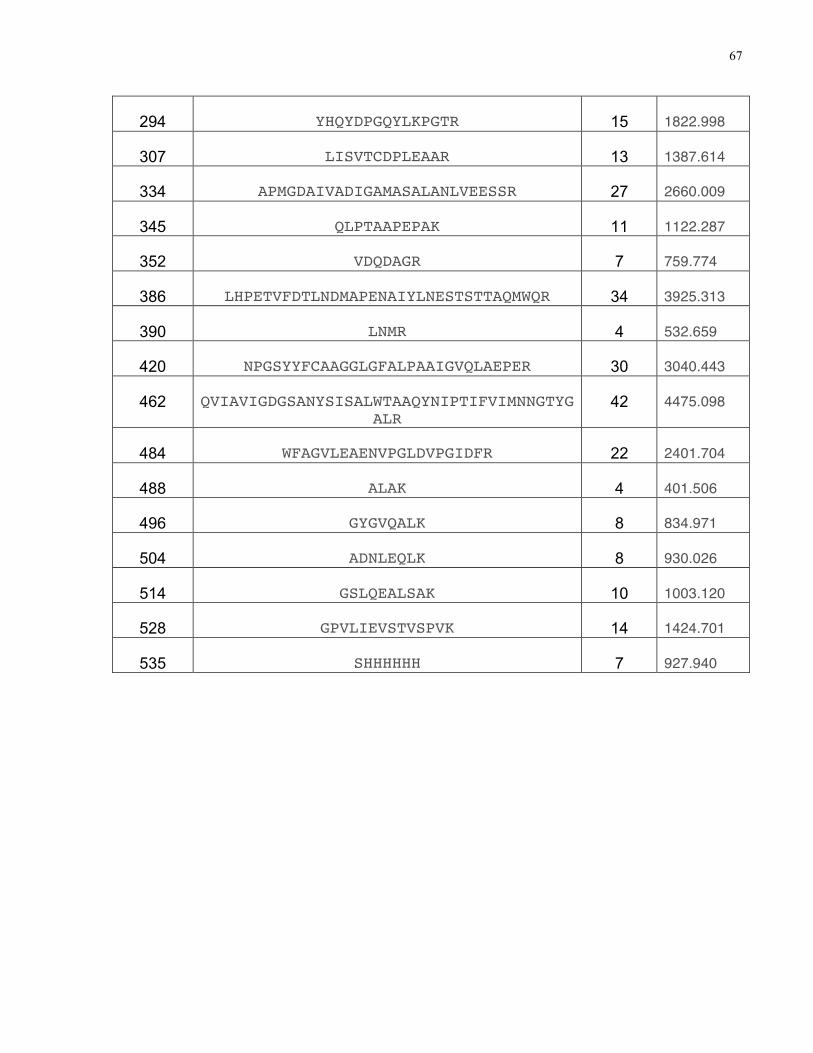
67
294 YHQYDPGQYLKPGTR 15 1822.998
307 LISVTCDPLEAAR 13 1387.614
334 APMGDAIVADIGAMASALANLVEESSR 27 2660.009
345 QLPTAAPEPAK 11 1122.287
352 VDQDAGR 7 759.774
386 LHPETVFDTLNDMAPENAIYLNESTSTTAQMWQR 34 3925.313
390 LNMR 4 532.659
420 NPGSYYFCAAGGLGFALPAAIGVQLAEPER 30 3040.443
462 QVIAVIGDGSANYSISALWTAAQYNIPTIFVIMNNGTYGALR
42 4475.098
484 WFAGVLEAENVPGLDVPGIDFR 22 2401.704
488 ALAK 4 401.506
496 GYGVQALK 8 834.971
504 ADNLEQLK 8 930.026
514 GSLQEALSAK 10 1003.120
528 GPVLIEVSTVSPVK 14 1424.701
535 SHHHHHH 7 927.940
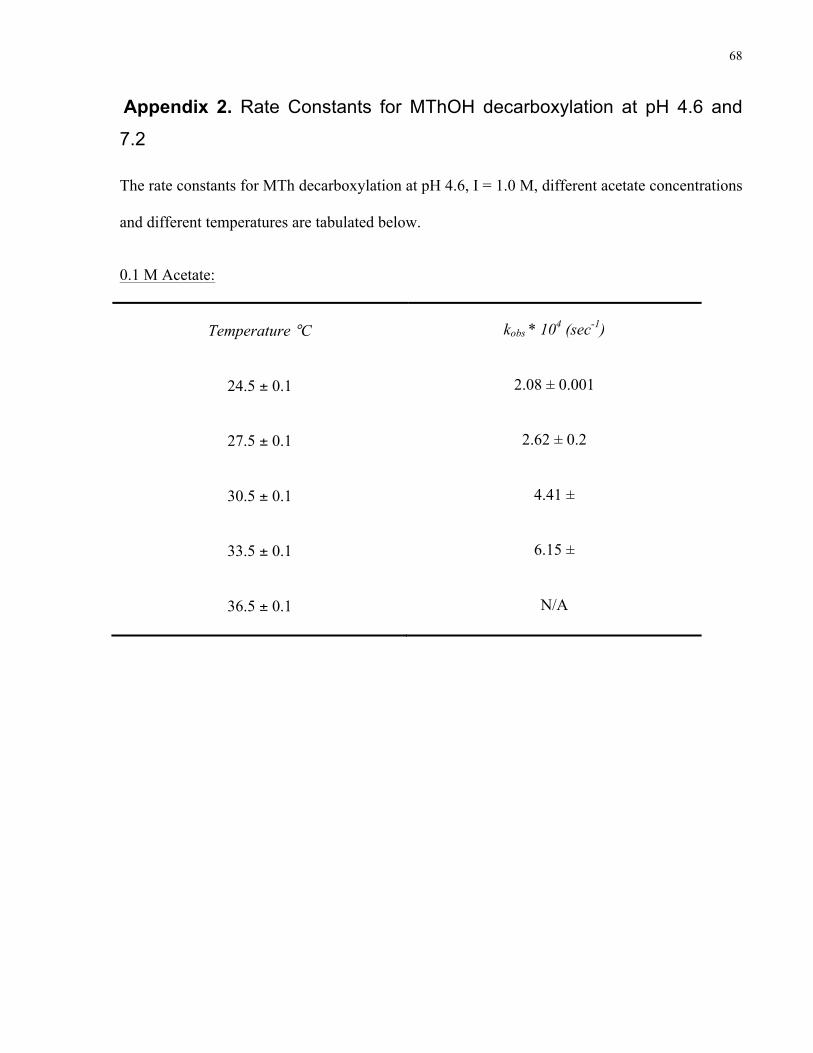
68
Appendix 2. Rate Constants for MThOH decarboxylation at pH 4.6 and
7.2
The rate constants for MTh decarboxylation at pH 4.6, I = 1.0 M, different acetate concentrations
and different temperatures are tabulated below.
0.1 M Acetate:
Temperature °C kobs * 104 (sec-1)
24.5 ± 0.1 2.08 ± 0.001
27.5 ± 0.1 2.62 ± 0.2
30.5 ± 0.1 4.41 ±
33.5 ± 0.1 6.15 ±
36.5 ± 0.1 N/A

69
0.2 M Acetate:
Temperature °C kobs * 104 (sec-1)
24.5 ± 0.1 2.72 ± 0.02
27.5 ± 0.1 3.5 ± 0.6
30.5 ± 0.1 5.9 ± 0.5
33.5 ± 0.1 7.4 ± 0.1
36.5 ± 0.1 10.3 ± 0.9
0.3 M Acetate:
Temperature °C kobs * 104 (sec-1)
24.5 ± 0.1 3.21 ± 0.01
27.5 ± 0.1 4.1 ± 0.6
30.5 ± 0.1 6.9 ± 1.1
33.5 ± 0.1 8.46 ± 0.01
36.5 ± 0.1 11.9 ± 1.3
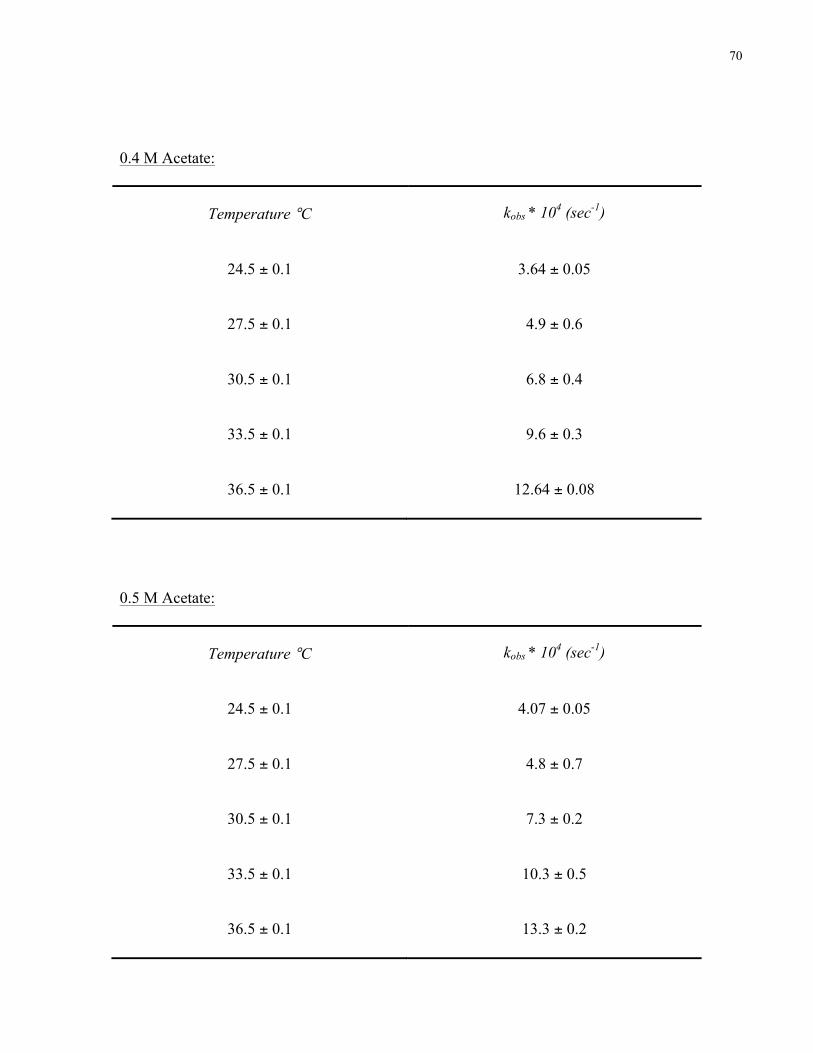
70
0.4 M Acetate:
Temperature °C kobs * 104 (sec-1)
24.5 ± 0.1 3.64 ± 0.05
27.5 ± 0.1 4.9 ± 0.6
30.5 ± 0.1 6.8 ± 0.4
33.5 ± 0.1 9.6 ± 0.3
36.5 ± 0.1 12.64 ± 0.08
0.5 M Acetate:
Temperature °C kobs * 104 (sec-1)
24.5 ± 0.1 4.07 ± 0.05
27.5 ± 0.1 4.8 ± 0.7
30.5 ± 0.1 7.3 ± 0.2
33.5 ± 0.1 10.3 ± 0.5
36.5 ± 0.1 13.3 ± 0.2
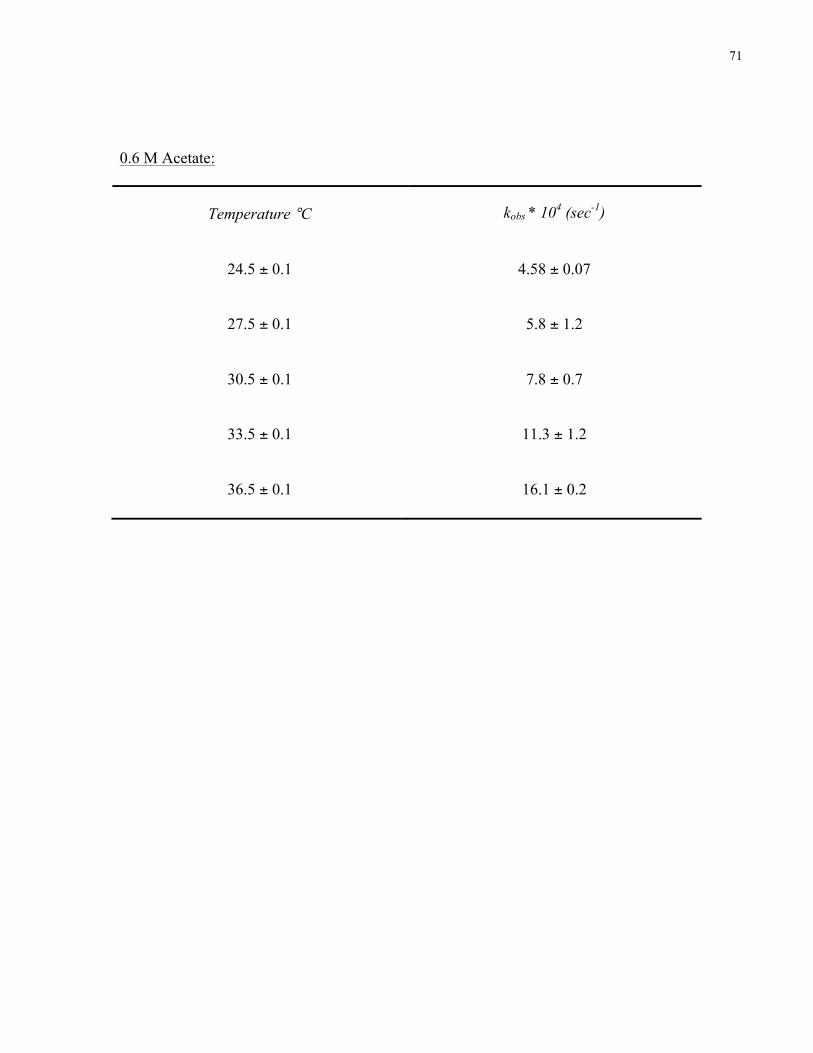
71
0.6 M Acetate:
Temperature °C kobs * 104 (sec-1)
24.5 ± 0.1 4.58 ± 0.07
27.5 ± 0.1 5.8 ± 1.2
30.5 ± 0.1 7.8 ± 0.7
33.5 ± 0.1 11.3 ± 1.2
36.5 ± 0.1 16.1 ± 0.2

72
The rate constants for MTh decarboxylation at pH 7.2, I = 2.0 M, different acetate concentrations
and different temperatures are tabulated below.
0.2 M Acetate:
Temperature °C kobs * 104 (sec-1)
24.5 ± 0.1 0.93 ± 0.02
27.5 ± 0.1 1.39 ± 0.03
30.5 ± 0.1 2.15 ± 0.01
33.5 ± 0.1 3.2± 0.2
36.5 ± 0.1 4.2 ± 0.4
39.5 ± 0.1 7.6 ± 0.1
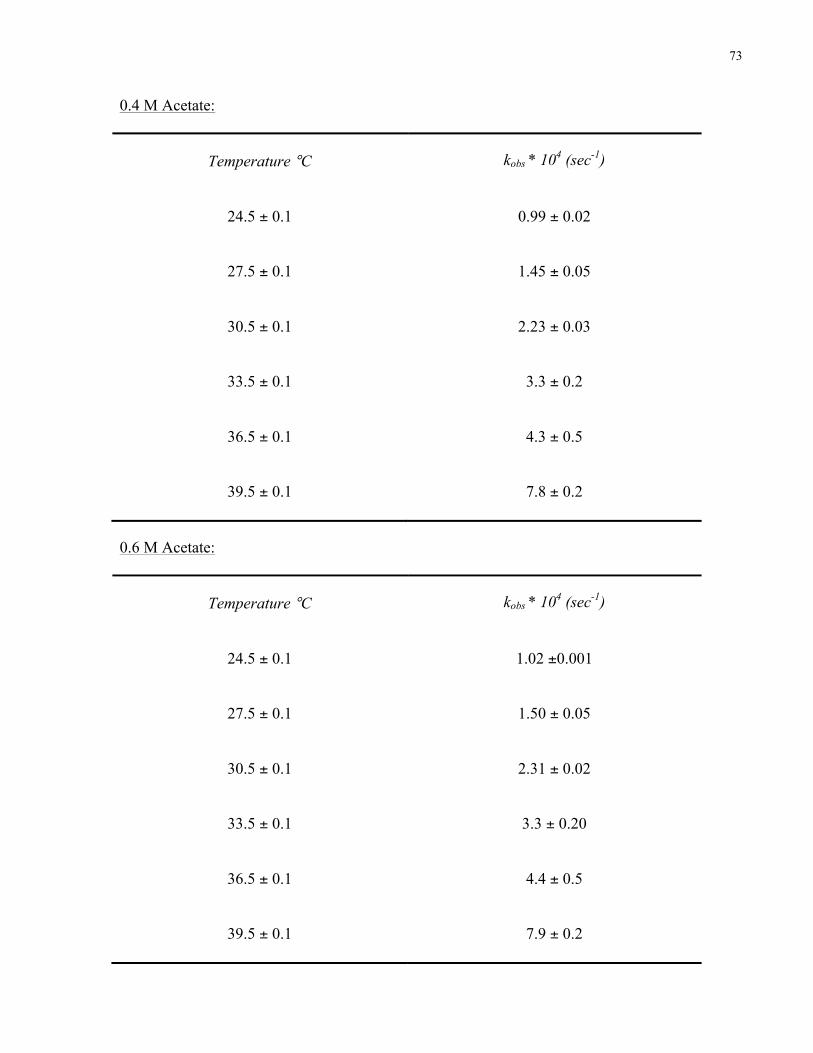
73
0.4 M Acetate:
Temperature °C kobs * 104 (sec-1)
24.5 ± 0.1 0.99 ± 0.02
27.5 ± 0.1 1.45 ± 0.05
30.5 ± 0.1 2.23 ± 0.03
33.5 ± 0.1 3.3 ± 0.2
36.5 ± 0.1 4.3 ± 0.5
39.5 ± 0.1 7.8 ± 0.2
0.6 M Acetate:
Temperature °C kobs * 104 (sec-1)
24.5 ± 0.1 1.02 ±0.001
27.5 ± 0.1 1.50 ± 0.05
30.5 ± 0.1 2.31 ± 0.02
33.5 ± 0.1 3.3 ± 0.20
36.5 ± 0.1 4.4 ± 0.5
39.5 ± 0.1 7.9 ± 0.2

74
0.8 M Acetate:
Temperature °C kobs * 104 (sec-1)
24.5 ± 0.1 1.07 ± 0.03
27.5 ± 0.1 1.58 ± 0.04
30.5 ± 0.1 2.42 ± 0.01
33.5 ± 0.1 3.5 ± 0.2
36.5 ± 0.1 4.6 ± 0.5
39.5 ± 0.1 8.2 ± 0.2
1.0 M Acetate:
Temperature °C kobs * 104 (sec-1)
24.5 ± 0.1 1.13 ± 0.01
27.5 ± 0.1 1.63 ± 0.05
30.5 ± 0.1 2.47 ± 0.05
33.5 ± 0.1 3.5 ± 0.2
36.5 ± 0.1 4.8 ± 0.4
39.5 ± 0.1 8.36 ± 0.08
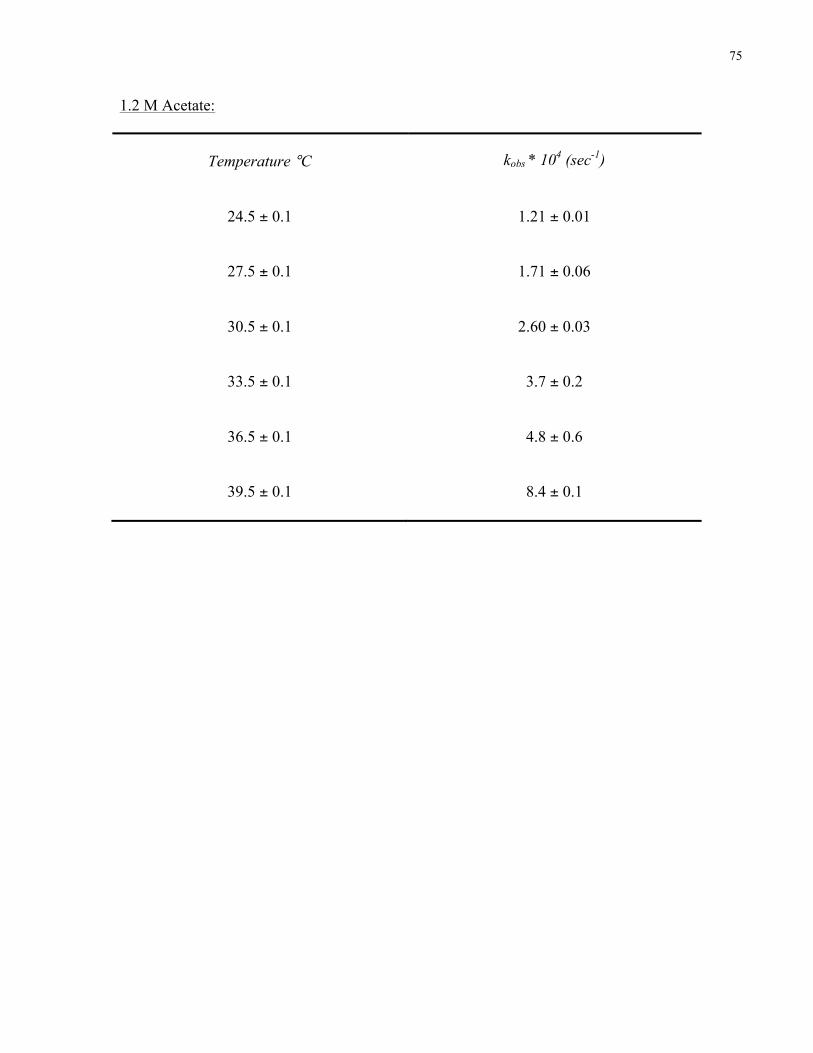
75
1.2 M Acetate:
Temperature °C kobs * 104 (sec-1)
24.5 ± 0.1 1.21 ± 0.01
27.5 ± 0.1 1.71 ± 0.06
30.5 ± 0.1 2.60 ± 0.03
33.5 ± 0.1 3.7 ± 0.2
36.5 ± 0.1 4.8 ± 0.6
39.5 ± 0.1 8.4 ± 0.1
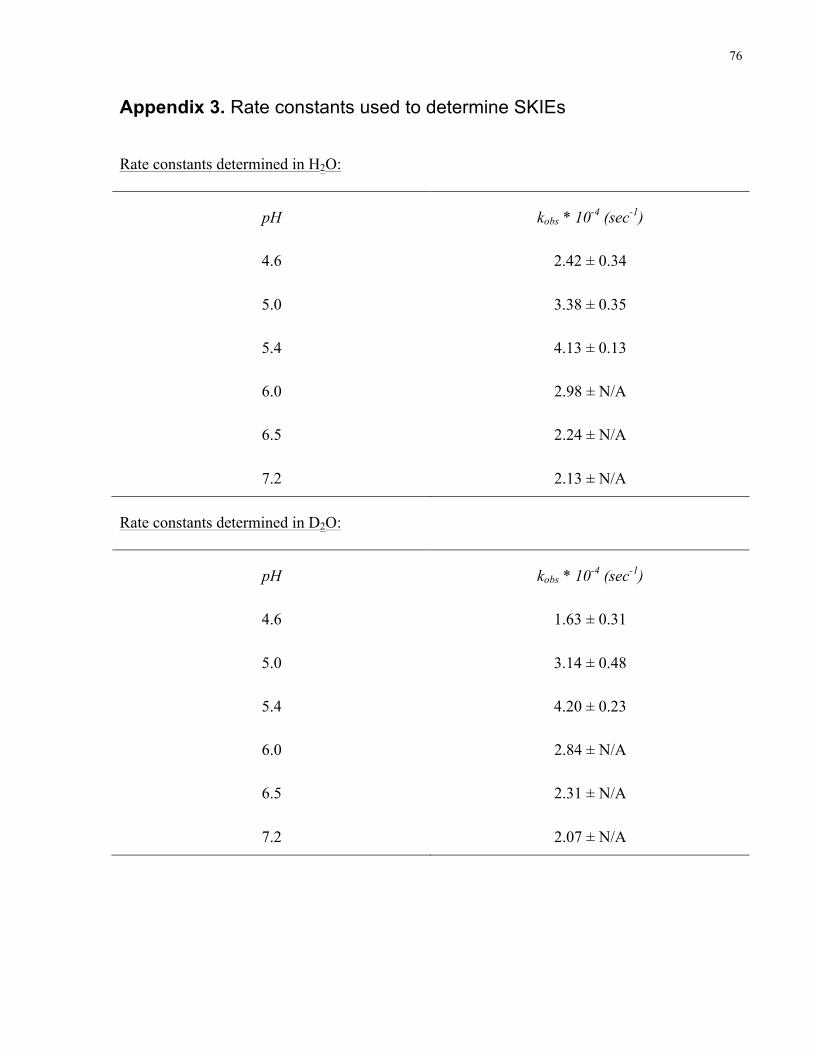
76
Appendix 3. Rate constants used to determine SKIEs
Rate constants determined in H2O:
pH kobs * 10-4 (sec-1)
4.6 2.42 ± 0.34
5.0 3.38 ± 0.35
5.4 4.13 ± 0.13
6.0 2.98 ± N/A
6.5 2.24 ± N/A
7.2 2.13 ± N/A
Rate constants determined in D2O:
pH kobs * 10-4 (sec-1)
4.6 1.63 ± 0.31
5.0 3.14 ± 0.48
5.4 4.20 ± 0.23
6.0 2.84 ± N/A
6.5 2.31 ± N/A
7.2 2.07 ± N/A