Embed Size (px)
Citation preview
arX
iv:1
709.
0536
5v2
[cs
.DC
] 1
9 Se
p 20
17
Understanding System Characteristics of Online
Erasure Coding on Scalable, Distributed and
Large-Scale SSD Array Systems
Sungjoon Koh∗, Jie Zhang∗, Miryeong Kwon∗, Jungyeon Yoon‡, David Donofrio†,
Namsung Kim§ and Myoungsoo Jung∗
∗Computer Architecture and Memory Systems Laboratory,
School of Integrated Technology, Yonsei Institute Convergence Technology, Yonsei University†Lawrence Berkeley National Laboratory,‡SK Telecom,§University of Illinois Urbana-Champaign∗[email protected],∗[email protected],∗[email protected],‡[email protected],†[email protected],
§[email protected],∗[email protected]
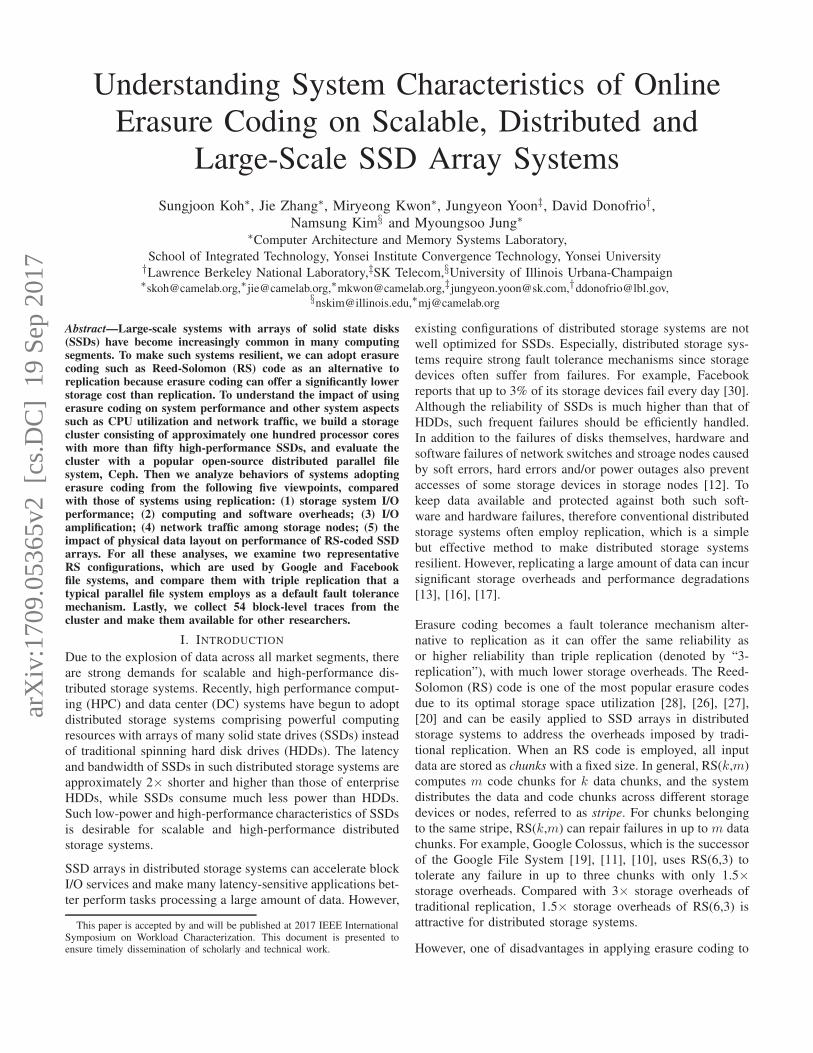
Abstract—Large-scale systems with arrays of solid state disks(SSDs) have become increasingly common in many computingsegments. To make such systems resilient, we can adopt erasurecoding such as Reed-Solomon (RS) code as an alternative toreplication because erasure coding can offer a significantly lowerstorage cost than replication. To understand the impact of usingerasure coding on system performance and other system aspectssuch as CPU utilization and network traffic, we build a storagecluster consisting of approximately one hundred processor coreswith more than fifty high-performance SSDs, and evaluate thecluster with a popular open-source distributed parallel filesystem, Ceph. Then we analyze behaviors of systems adoptingerasure coding from the following five viewpoints, comparedwith those of systems using replication: (1) storage system I/Operformance; (2) computing and software overheads; (3) I/Oamplification; (4) network traffic among storage nodes; (5) theimpact of physical data layout on performance of RS-coded SSDarrays. For all these analyses, we examine two representativeRS configurations, which are used by Google and Facebookfile systems, and compare them with triple replication that atypical parallel file system employs as a default fault tolerancemechanism. Lastly, we collect 54 block-level traces from thecluster and make them available for other researchers.
I. INTRODUCTION
Due to the explosion of data across all market segments, there
are strong demands for scalable and high-performance dis-
tributed storage systems. Recently, high performance comput-
ing (HPC) and data center (DC) systems have begun to adopt
distributed storage systems comprising powerful computing
resources with arrays of many solid state drives (SSDs) instead
of traditional spinning hard disk drives (HDDs). The latency
and bandwidth of SSDs in such distributed storage systems are
approximately 2× shorter and higher than those of enterprise
HDDs, while SSDs consume much less power than HDDs.
Such low-power and high-performance characteristics of SSDs
is desirable for scalable and high-performance distributed
storage systems.
SSD arrays in distributed storage systems can accelerate block
I/O services and make many latency-sensitive applications bet-
ter perform tasks processing a large amount of data. However,
This paper is accepted by and will be published at 2017 IEEE InternationalSymposium on Workload Characterization. This document is presented toensure timely dissemination of scholarly and technical work.
existing configurations of distributed storage systems are not
well optimized for SSDs. Especially, distributed storage sys-
tems require strong fault tolerance mechanisms since storage
devices often suffer from failures. For example, Facebook
reports that up to 3% of its storage devices fail every day [30].
Although the reliability of SSDs is much higher than that of
HDDs, such frequent failures should be efficiently handled.
In addition to the failures of disks themselves, hardware and
software failures of network switches and stroage nodes caused
by soft errors, hard errors and/or power outages also prevent
accesses of some storage devices in storage nodes [12]. To
keep data available and protected against both such soft-
ware and hardware failures, therefore conventional distributed
storage systems often employ replication, which is a simple
but effective method to make distributed storage systems
resilient. However, replicating a large amount of data can incur
significant storage overheads and performance degradations
[13], [16], [17].
Erasure coding becomes a fault tolerance mechanism alter-
native to replication as it can offer the same reliability as
or higher reliability than triple replication (denoted by “3-
replication”), with much lower storage overheads. The Reed-
Solomon (RS) code is one of the most popular erasure codes
due to its optimal storage space utilization [28], [26], [27],
[20] and can be easily applied to SSD arrays in distributed
storage systems to address the overheads imposed by tradi-
tional replication. When an RS code is employed, all input
data are stored as chunks with a fixed size. In general, RS(k,m)
computes m code chunks for k data chunks, and the system
distributes the data and code chunks across different storage
devices or nodes, referred to as stripe. For chunks belonging
to the same stripe, RS(k,m) can repair failures in up to m data
chunks. For example, Google Colossus, which is the successor
of the Google File System [19], [11], [10], uses RS(6,3) to
tolerate any failure in up to three chunks with only 1.5×
storage overheads. Compared with 3× storage overheads of
traditional replication, 1.5× storage overheads of RS(6,3) is
attractive for distributed storage systems.
However, one of disadvantages in applying erasure coding to
Read Write Read Write Read Write Read Write Read Write Read Write
Throughput Latency CPUUtilization
RelativeContextSwitch
PrivateNetwork
Overhead
I/OAmplification
05
10253035505560 57.7
10.4
37.8
8.712.6
1.9
10.77.6
1.50.14
4KB Random Request 3-Replication (3-Rep.) RS (10, 4)
Nor
mal
ized
to R
eplic
atio
n
0.67
Almost 0
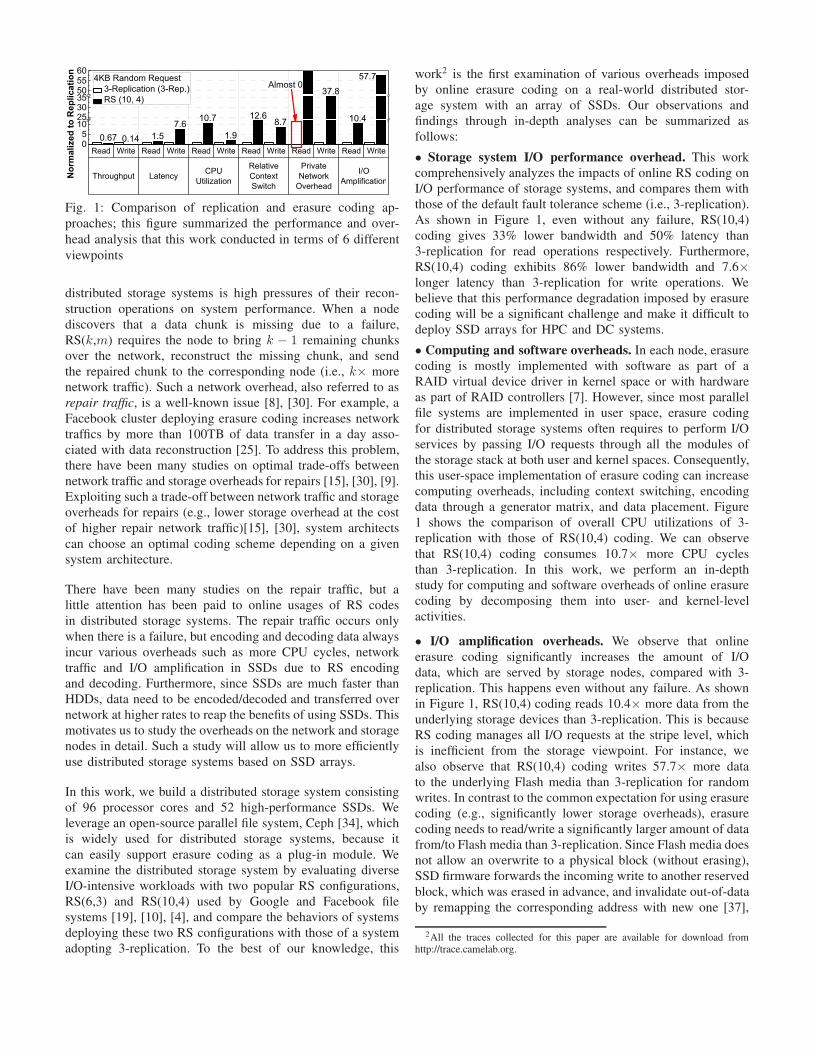
Fig. 1: Comparison of replication and erasure coding ap-
proaches; this figure summarized the performance and over-
head analysis that this work conducted in terms of 6 different
viewpoints
distributed storage systems is high pressures of their recon-
struction operations on system performance. When a node
discovers that a data chunk is missing due to a failure,
RS(k,m) requires the node to bring k − 1 remaining chunks
over the network, reconstruct the missing chunk, and send
the repaired chunk to the corresponding node (i.e., k× more
network traffic). Such a network overhead, also referred to as
repair traffic, is a well-known issue [8], [30]. For example, a
Facebook cluster deploying erasure coding increases network
traffics by more than 100TB of data transfer in a day asso-
ciated with data reconstruction [25]. To address this problem,
there have been many studies on optimal trade-offs between
network traffic and storage overheads for repairs [15], [30], [9].
Exploiting such a trade-off between network traffic and storage
overheads for repairs (e.g., lower storage overhead at the cost
of higher repair network traffic)[15], [30], system architects
can choose an optimal coding scheme depending on a given
system architecture.
There have been many studies on the repair traffic, but a
little attention has been paid to online usages of RS codes
in distributed storage systems. The repair traffic occurs only
when there is a failure, but encoding and decoding data always
incur various overheads such as more CPU cycles, network
traffic and I/O amplification in SSDs due to RS encoding
and decoding. Furthermore, since SSDs are much faster than
HDDs, data need to be encoded/decoded and transferred over
network at higher rates to reap the benefits of using SSDs. This
motivates us to study the overheads on the network and storage
nodes in detail. Such a study will allow us to more efficiently
use distributed storage systems based on SSD arrays.
In this work, we build a distributed storage system consisting
of 96 processor cores and 52 high-performance SSDs. We
leverage an open-source parallel file system, Ceph [34], which
is widely used for distributed storage systems, because it
can easily support erasure coding as a plug-in module. We
examine the distributed storage system by evaluating diverse
I/O-intensive workloads with two popular RS configurations,
RS(6,3) and RS(10,4) used by Google and Facebook file
systems [19], [10], [4], and compare the behaviors of systems
deploying these two RS configurations with those of a system
adopting 3-replication. To the best of our knowledge, this
work2 is the first examination of various overheads imposed
by online erasure coding on a real-world distributed stor-
age system with an array of SSDs. Our observations and
findings through in-depth analyses can be summarized as
follows:
• Storage system I/O performance overhead. This work
comprehensively analyzes the impacts of online RS coding on
I/O performance of storage systems, and compares them with
those of the default fault tolerance scheme (i.e., 3-replication).
As shown in Figure 1, even without any failure, RS(10,4)
coding gives 33% lower bandwidth and 50% latency than
3-replication for read operations respectively. Furthermore,
RS(10,4) coding exhibits 86% lower bandwidth and 7.6×
longer latency than 3-replication for write operations. We
believe that this performance degradation imposed by erasure
coding will be a significant challenge and make it difficult to
deploy SSD arrays for HPC and DC systems.
• Computing and software overheads. In each node, erasure
coding is mostly implemented with software as part of a
RAID virtual device driver in kernel space or with hardware
as part of RAID controllers [7]. However, since most parallel
file systems are implemented in user space, erasure coding
for distributed storage systems often requires to perform I/O
services by passing I/O requests through all the modules of
the storage stack at both user and kernel spaces. Consequently,
this user-space implementation of erasure coding can increase
computing overheads, including context switching, encoding
data through a generator matrix, and data placement. Figure
1 shows the comparison of overall CPU utilizations of 3-
replication with those of RS(10,4) coding. We can observe
that RS(10,4) coding consumes 10.7× more CPU cycles
than 3-replication. In this work, we perform an in-depth
study for computing and software overheads of online erasure
coding by decomposing them into user- and kernel-level
activities.
• I/O amplification overheads. We observe that online
erasure coding significantly increases the amount of I/O
data, which are served by storage nodes, compared with 3-
replication. This happens even without any failure. As shown
in Figure 1, RS(10,4) coding reads 10.4× more data from the
underlying storage devices than 3-replication. This is because
RS coding manages all I/O requests at the stripe level, which
is inefficient from the storage viewpoint. For instance, we
also observe that RS(10,4) coding writes 57.7× more data
to the underlying Flash media than 3-replication for random
writes. In contrast to the common expectation for using erasure
coding (e.g., significantly lower storage overheads), erasure
coding needs to read/write a significantly larger amount of data
from/to Flash media than 3-replication. Since Flash media does
not allow an overwrite to a physical block (without erasing),
SSD firmware forwards the incoming write to another reserved
block, which was erased in advance, and invalidate out-of-data
by remapping the corresponding address with new one [37],
2All the traces collected for this paper are available for download fromhttp://trace.camelab.org.
����
����������
���� ��
����� ������
� ����
���
�����������
��
�
������� ���
�!�"#�
�$�%#$& '�����#$&
"�����$
��('��$�"#�
"��#�#�# ������)����!�"#� ���"#�
�$�%#$&���
�������"�''����$
��'�#��*�$
�$�%#$&+���!
�!��#�,���������#��� -�
���
��('��$�"�''����$
��'�#��*�$
�$�%#$&+���!
�!��#�,���������#��� -�
���
��
������
���� ��
�� ��
������
���� ��
��
�������.���'
�(�����.��/�$,
.����� .�����
"�����$ "�����$
�$�0#��.��/�$,
�#�����*�#$�*�����($�1 �����#�#�#�*1 �������$#���'�#�,1
����������
����������
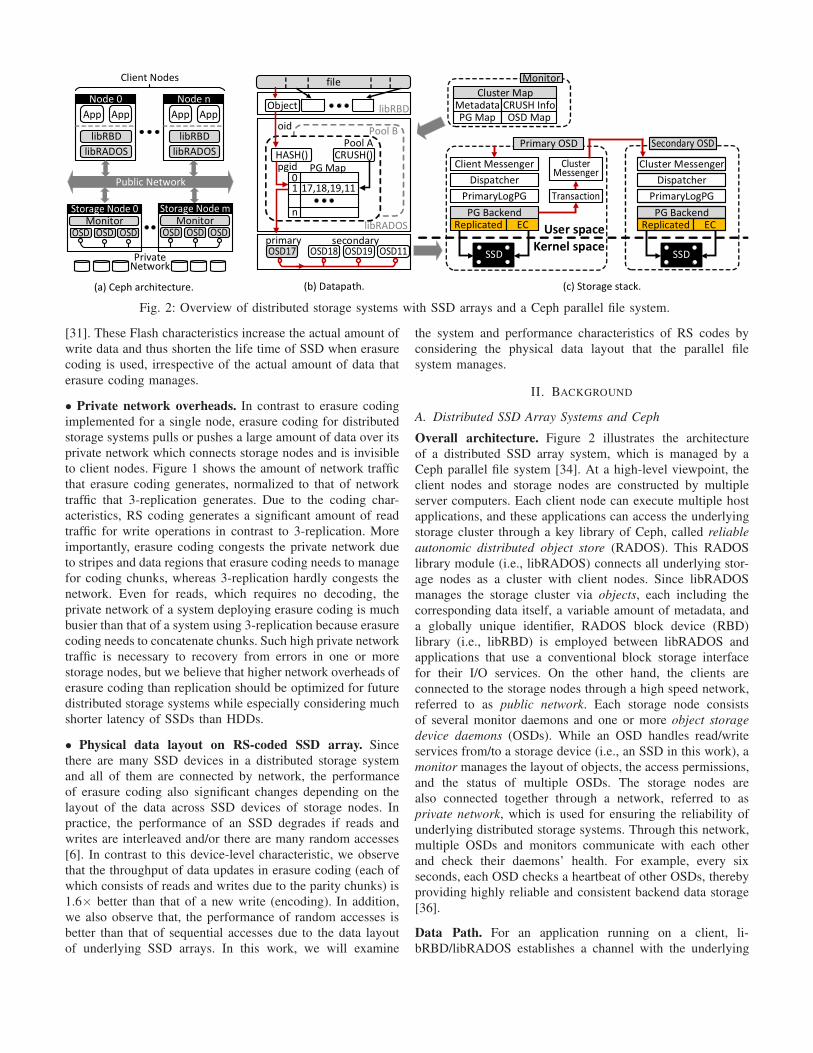
Fig. 2: Overview of distributed storage systems with SSD arrays and a Ceph parallel file system.
[31]. These Flash characteristics increase the actual amount of
write data and thus shorten the life time of SSD when erasure
coding is used, irrespective of the actual amount of data that
erasure coding manages.
• Private network overheads. In contrast to erasure coding
implemented for a single node, erasure coding for distributed
storage systems pulls or pushes a large amount of data over its
private network which connects storage nodes and is invisible
to client nodes. Figure 1 shows the amount of network traffic
that erasure coding generates, normalized to that of network
traffic that 3-replication generates. Due to the coding char-
acteristics, RS coding generates a significant amount of read
traffic for write operations in contrast to 3-replication. More
importantly, erasure coding congests the private network due
to stripes and data regions that erasure coding needs to manage
for coding chunks, whereas 3-replication hardly congests the
network. Even for reads, which requires no decoding, the
private network of a system deploying erasure coding is much
busier than that of a system using 3-replication because erasure
coding needs to concatenate chunks. Such high private network
traffic is necessary to recovery from errors in one or more
storage nodes, but we believe that higher network overheads of
erasure coding than replication should be optimized for future
distributed storage systems while especially considering much
shorter latency of SSDs than HDDs.
• Physical data layout on RS-coded SSD array. Since
there are many SSD devices in a distributed storage system
and all of them are connected by network, the performance
of erasure coding also significant changes depending on the
layout of the data across SSD devices of storage nodes. In
practice, the performance of an SSD degrades if reads and
writes are interleaved and/or there are many random accesses
[6]. In contrast to this device-level characteristic, we observe
that the throughput of data updates in erasure coding (each of
which consists of reads and writes due to the parity chunks) is
1.6× better than that of a new write (encoding). In addition,
we also observe that, the performance of random accesses is
better than that of sequential accesses due to the data layout
of underlying SSD arrays. In this work, we will examine
the system and performance characteristics of RS codes by
considering the physical data layout that the parallel file
system manages.
II. BACKGROUND
A. Distributed SSD Array Systems and Ceph
Overall architecture. Figure 2 illustrates the architecture
of a distributed SSD array system, which is managed by a
Ceph parallel file system [34]. At a high-level viewpoint, the
client nodes and storage nodes are constructed by multiple
server computers. Each client node can execute multiple host
applications, and these applications can access the underlying
storage cluster through a key library of Ceph, called reliable
autonomic distributed object store (RADOS). This RADOS
library module (i.e., libRADOS) connects all underlying stor-
age nodes as a cluster with client nodes. Since libRADOS
manages the storage cluster via objects, each including the
corresponding data itself, a variable amount of metadata, and
a globally unique identifier, RADOS block device (RBD)
library (i.e., libRBD) is employed between libRADOS and
applications that use a conventional block storage interface
for their I/O services. On the other hand, the clients are
connected to the storage nodes through a high speed network,
referred to as public network. Each storage node consists
of several monitor daemons and one or more object storage
device daemons (OSDs). While an OSD handles read/write
services from/to a storage device (i.e., an SSD in this work), a
monitor manages the layout of objects, the access permissions,
and the status of multiple OSDs. The storage nodes are
also connected together through a network, referred to as
private network, which is used for ensuring the reliability of
underlying distributed storage systems. Through this network,
multiple OSDs and monitors communicate with each other
and check their daemons’ health. For example, every six
seconds, each OSD checks a heartbeat of other OSDs, thereby
providing highly reliable and consistent backend data storage
[36].
Data Path. For an application running on a client, li-
bRBD/libRADOS establishes a channel with the underlying
��������
�������
��������
�������
�� �� �� ��
� � ���������� �
� �
������ ������
�����
(a) Terminology.
��
� �
��������
� �����
��
��
��
�
��
��
��
��
��
��
��
��������
��������
�
���� ���� ����
���� ���� ����
���� ���� ����
� � �
� � � �
� � � �
� � � �
���������������� �
� �
�
��
�� �����
��
�
(b) Encoding.
��
��
��
��
��
��
��
�
����������������
����������������
����������������
� � �
� � � �
� � � �
� � � ���
�������� �
�
��������������������
�
��
��������
��
��
��
��� ������������������ �
� � ������� ���� �������� � �
(c) Decoding.
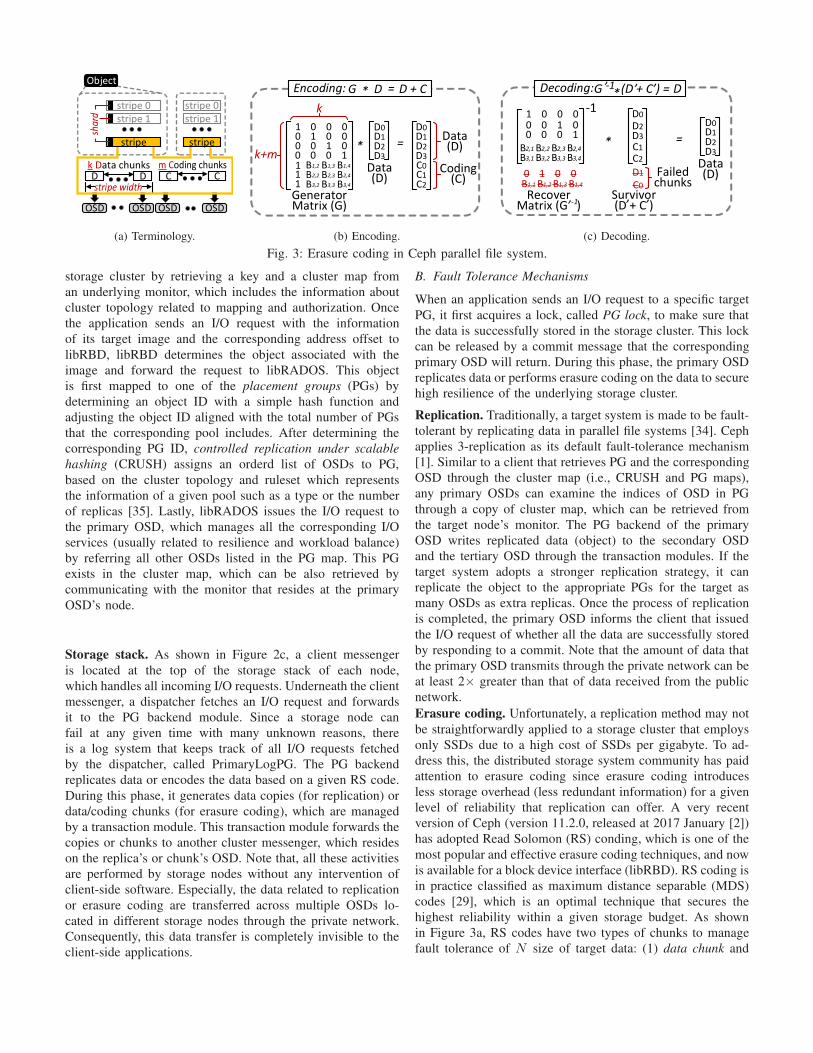
Fig. 3: Erasure coding in Ceph parallel file system.
storage cluster by retrieving a key and a cluster map from
an underlying monitor, which includes the information about
cluster topology related to mapping and authorization. Once
the application sends an I/O request with the information
of its target image and the corresponding address offset to
libRBD, libRBD determines the object associated with the
image and forward the request to libRADOS. This object
is first mapped to one of the placement groups (PGs) by
determining an object ID with a simple hash function and
adjusting the object ID aligned with the total number of PGs
that the corresponding pool includes. After determining the
corresponding PG ID, controlled replication under scalable
hashing (CRUSH) assigns an orderd list of OSDs to PG,
based on the cluster topology and ruleset which represents
the information of a given pool such as a type or the number
of replicas [35]. Lastly, libRADOS issues the I/O request to
the primary OSD, which manages all the corresponding I/O
services (usually related to resilience and workload balance)
by referring all other OSDs listed in the PG map. This PG
exists in the cluster map, which can be also retrieved by
communicating with the monitor that resides at the primary
OSD’s node.
Storage stack. As shown in Figure 2c, a client messenger
is located at the top of the storage stack of each node,
which handles all incoming I/O requests. Underneath the client
messenger, a dispatcher fetches an I/O request and forwards
it to the PG backend module. Since a storage node can
fail at any given time with many unknown reasons, there
is a log system that keeps track of all I/O requests fetched
by the dispatcher, called PrimaryLogPG. The PG backend
replicates data or encodes the data based on a given RS code.
During this phase, it generates data copies (for replication) or
data/coding chunks (for erasure coding), which are managed
by a transaction module. This transaction module forwards the
copies or chunks to another cluster messenger, which resides
on the replica’s or chunk’s OSD. Note that, all these activities
are performed by storage nodes without any intervention of
client-side software. Especially, the data related to replication
or erasure coding are transferred across multiple OSDs lo-
cated in different storage nodes through the private network.
Consequently, this data transfer is completely invisible to the
client-side applications.
B. Fault Tolerance Mechanisms
When an application sends an I/O request to a specific target
PG, it first acquires a lock, called PG lock, to make sure that
the data is successfully stored in the storage cluster. This lock
can be released by a commit message that the corresponding
primary OSD will return. During this phase, the primary OSD
replicates data or performs erasure coding on the data to secure
high resilience of the underlying storage cluster.
Replication. Traditionally, a target system is made to be fault-
tolerant by replicating data in parallel file systems [34]. Ceph
applies 3-replication as its default fault-tolerance mechanism
[1]. Similar to a client that retrieves PG and the corresponding
OSD through the cluster map (i.e., CRUSH and PG maps),
any primary OSDs can examine the indices of OSD in PG
through a copy of cluster map, which can be retrieved from
the target node’s monitor. The PG backend of the primary
OSD writes replicated data (object) to the secondary OSD
and the tertiary OSD through the transaction modules. If the
target system adopts a stronger replication strategy, it can
replicate the object to the appropriate PGs for the target as
many OSDs as extra replicas. Once the process of replication
is completed, the primary OSD informs the client that issued
the I/O request of whether all the data are successfully stored
by responding to a commit. Note that the amount of data that
the primary OSD transmits through the private network can be
at least 2× greater than that of data received from the public
network.
Erasure coding. Unfortunately, a replication method may not
be straightforwardly applied to a storage cluster that employs
only SSDs due to a high cost of SSDs per gigabyte. To ad-
dress this, the distributed storage system community has paid
attention to erasure coding since erasure coding introduces
less storage overhead (less redundant information) for a given
level of reliability that replication can offer. A very recent
version of Ceph (version 11.2.0, released at 2017 January [2])
has adopted Read Solomon (RS) conding, which is one of the
most popular and effective erasure coding techniques, and now
is available for a block device interface (libRBD). RS coding is
in practice classified as maximum distance separable (MDS)
codes [29], which is an optimal technique that secures the
highest reliability within a given storage budget. As shown
in Figure 3a, RS codes have two types of chunks to manage
fault tolerance of N size of target data: (1) data chunk and
����
������
���� ���� ������
�����
�� ���������
���� ���� ���� ������
���
�� ���������
���
��
�
���
��
�
���
��
�
��
�
��
��
��
�� �����������������
������������
��������������
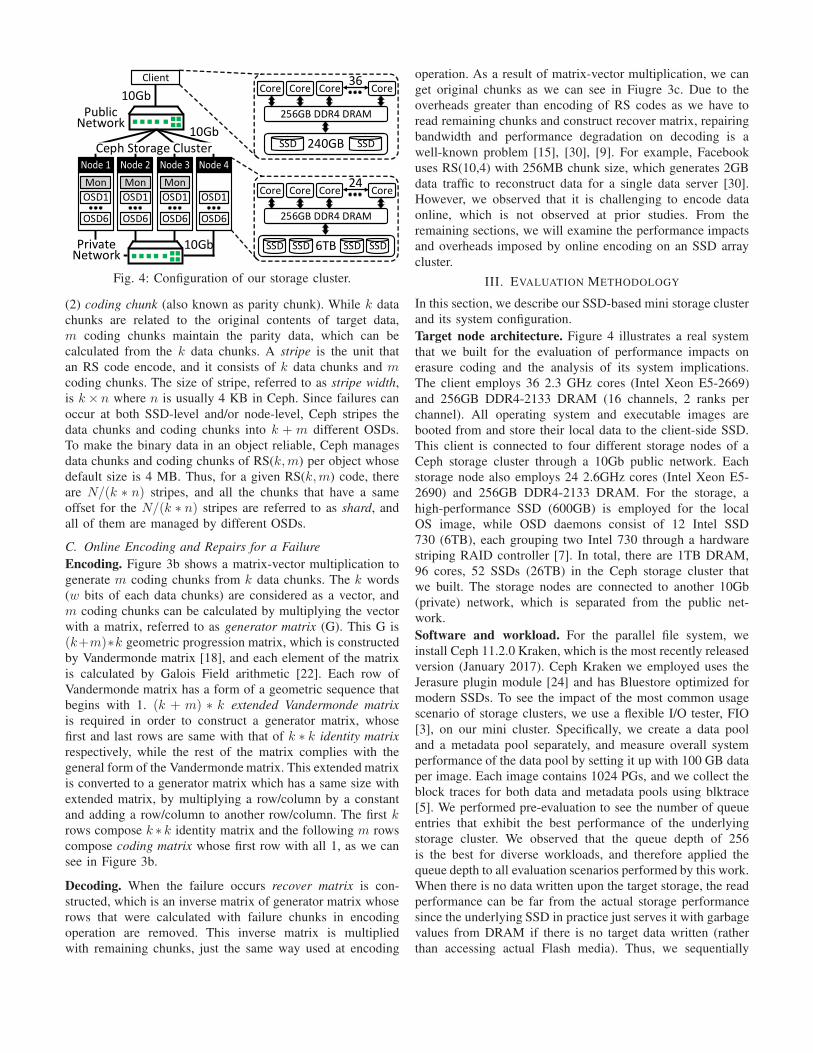
Fig. 4: Configuration of our storage cluster.
(2) coding chunk (also known as parity chunk). While k data
chunks are related to the original contents of target data,
m coding chunks maintain the parity data, which can be
calculated from the k data chunks. A stripe is the unit that
an RS code encode, and it consists of k data chunks and mcoding chunks. The size of stripe, referred to as stripe width,
is k× n where n is usually 4 KB in Ceph. Since failures can
occur at both SSD-level and/or node-level, Ceph stripes the
data chunks and coding chunks into k + m different OSDs.
To make the binary data in an object reliable, Ceph manages
data chunks and coding chunks of RS(k,m) per object whose
default size is 4 MB. Thus, for a given RS(k,m) code, there
are N/(k ∗ n) stripes, and all the chunks that have a same
offset for the N/(k ∗ n) stripes are referred to as shard, and
all of them are managed by different OSDs.
C. Online Encoding and Repairs for a Failure
Encoding. Figure 3b shows a matrix-vector multiplication to
generate m coding chunks from k data chunks. The k words
(w bits of each data chunks) are considered as a vector, and
m coding chunks can be calculated by multiplying the vector
with a matrix, referred to as generator matrix (G). This G is
(k+m)∗k geometric progression matrix, which is constructed
by Vandermonde matrix [18], and each element of the matrix
is calculated by Galois Field arithmetic [22]. Each row of
Vandermonde matrix has a form of a geometric sequence that
begins with 1. (k + m) ∗ k extended Vandermonde matrix
is required in order to construct a generator matrix, whose
first and last rows are same with that of k ∗ k identity matrix
respectively, while the rest of the matrix complies with the
general form of the Vandermonde matrix. This extended matrix
is converted to a generator matrix which has a same size with
extended matrix, by multiplying a row/column by a constant
and adding a row/column to another row/column. The first krows compose k ∗ k identity matrix and the following m rows
compose coding matrix whose first row with all 1, as we can
see in Figure 3b.
Decoding. When the failure occurs recover matrix is con-
structed, which is an inverse matrix of generator matrix whose
rows that were calculated with failure chunks in encoding
operation are removed. This inverse matrix is multiplied
with remaining chunks, just the same way used at encoding
operation. As a result of matrix-vector multiplication, we can
get original chunks as we can see in Fiugre 3c. Due to the
overheads greater than encoding of RS codes as we have to
read remaining chunks and construct recover matrix, repairing
bandwidth and performance degradation on decoding is a
well-known problem [15], [30], [9]. For example, Facebook
uses RS(10,4) with 256MB chunk size, which generates 2GB
data traffic to reconstruct data for a single data server [30].
However, we observed that it is challenging to encode data
online, which is not observed at prior studies. From the
remaining sections, we will examine the performance impacts
and overheads imposed by online encoding on an SSD array
cluster.
III. EVALUATION METHODOLOGY
In this section, we describe our SSD-based mini storage cluster
and its system configuration.
Target node architecture. Figure 4 illustrates a real system
that we built for the evaluation of performance impacts on
erasure coding and the analysis of its system implications.
The client employs 36 2.3 GHz cores (Intel Xeon E5-2669)
and 256GB DDR4-2133 DRAM (16 channels, 2 ranks per
channel). All operating system and executable images are
booted from and store their local data to the client-side SSD.
This client is connected to four different storage nodes of a
Ceph storage cluster through a 10Gb public network. Each
storage node also employs 24 2.6GHz cores (Intel Xeon E5-
2690) and 256GB DDR4-2133 DRAM. For the storage, a
high-performance SSD (600GB) is employed for the local
OS image, while OSD daemons consist of 12 Intel SSD
730 (6TB), each grouping two Intel 730 through a hardware
striping RAID controller [7]. In total, there are 1TB DRAM,
96 cores, 52 SSDs (26TB) in the Ceph storage cluster that
we built. The storage nodes are connected to another 10Gb
(private) network, which is separated from the public net-
work.
Software and workload. For the parallel file system, we
install Ceph 11.2.0 Kraken, which is the most recently released
version (January 2017). Ceph Kraken we employed uses the
Jerasure plugin module [24] and has Bluestore optimized for
modern SSDs. To see the impact of the most common usage
scenario of storage clusters, we use a flexible I/O tester, FIO
[3], on our mini cluster. Specifically, we create a data pool
and a metadata pool separately, and measure overall system
performance of the data pool by setting it up with 100 GB data
per image. Each image contains 1024 PGs, and we collect the
block traces for both data and metadata pools using blktrace
[5]. We performed pre-evaluation to see the number of queue
entries that exhibit the best performance of the underlying
storage cluster. We observed that the queue depth of 256
is the best for diverse workloads, and therefore applied the
queue depth to all evaluation scenarios performed by this work.
When there is no data written upon the target storage, the read
performance can be far from the actual storage performance
since the underlying SSD in practice just serves it with garbage
values from DRAM if there is no target data written (rather
than accessing actual Flash media). Thus, we sequentially
1KB 2KB 4KB 8KB16KB
32KB64KB
128KB0
200
400
600
800
048124KB
2KB1KB
3-Rep. RS 6, 3 RS 10, 4Th
roug
hput
(MB
/s)
X 11.3
(a) Throughput.
1KB 2KB 4KB 8KB16KB
32KB64KB
128KB0200400600800
10001200 3-Rep.
RS 6, 3 RS 10, 4
Late
ncy
(mse
c)
(b) Latency.
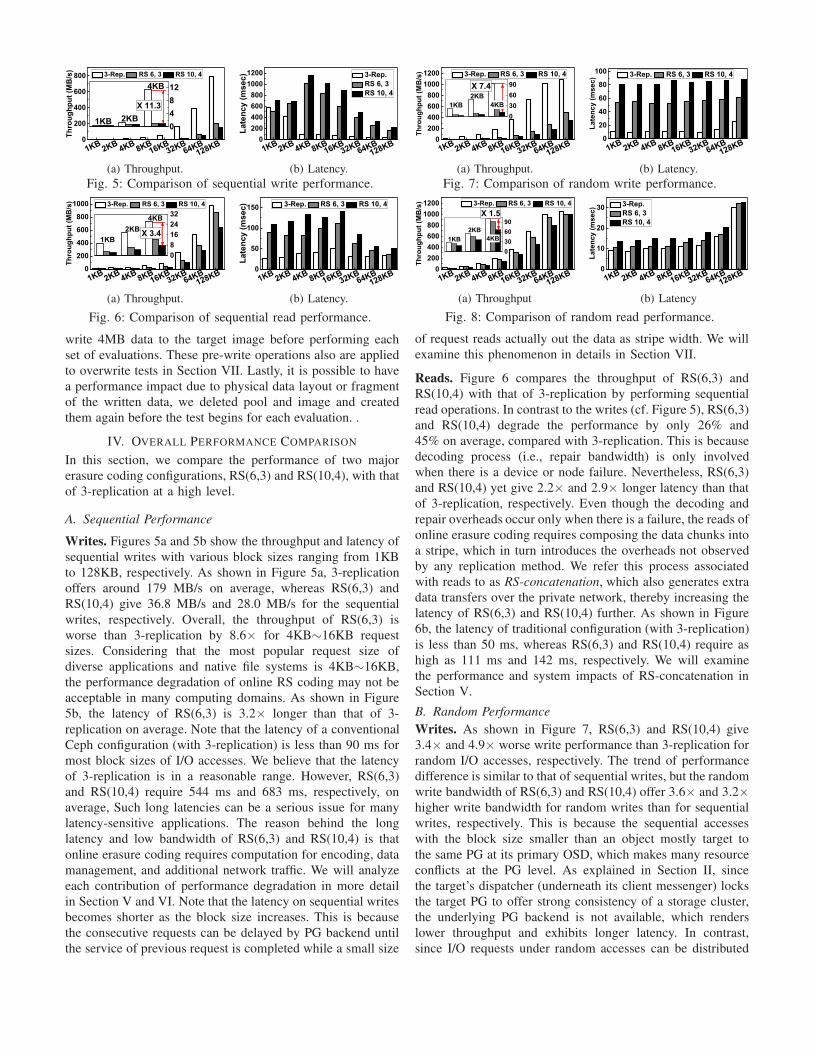
Fig. 5: Comparison of sequential write performance.
1KB 2KB 4KB 8KB16KB
32KB64KB
128KB0200400600800
1000
081624324KB
2KB1KB
Thro
ughp
ut (M
B/s
) 3-Rep. RS 6, 3 RS 10, 4
X 3.4
(a) Throughput.
1KB 2KB 4KB 8KB16KB
32KB64KB
128KB0
50
100
150 3-Rep. RS 6, 3 RS 10, 4
Late
ncy
(mse
c)
(b) Latency.
Fig. 6: Comparison of sequential read performance.
write 4MB data to the target image before performing each
set of evaluations. These pre-write operations also are applied
to overwrite tests in Section VII. Lastly, it is possible to have
a performance impact due to physical data layout or fragment
of the written data, we deleted pool and image and created
them again before the test begins for each evaluation. .
IV. OVERALL PERFORMANCE COMPARISON
In this section, we compare the performance of two major
erasure coding configurations, RS(6,3) and RS(10,4), with that
of 3-replication at a high level.
A. Sequential Performance
Writes. Figures 5a and 5b show the throughput and latency of
sequential writes with various block sizes ranging from 1KB
to 128KB, respectively. As shown in Figure 5a, 3-replication
offers around 179 MB/s on average, whereas RS(6,3) and
RS(10,4) give 36.8 MB/s and 28.0 MB/s for the sequential
writes, respectively. Overall, the throughput of RS(6,3) is
worse than 3-replication by 8.6× for 4KB∼16KB request
sizes. Considering that the most popular request size of
diverse applications and native file systems is 4KB∼16KB,
the performance degradation of online RS coding may not be
acceptable in many computing domains. As shown in Figure
5b, the latency of RS(6,3) is 3.2× longer than that of 3-
replication on average. Note that the latency of a conventional
Ceph configuration (with 3-replication) is less than 90 ms for
most block sizes of I/O accesses. We believe that the latency
of 3-replication is in a reasonable range. However, RS(6,3)
and RS(10,4) require 544 ms and 683 ms, respectively, on
average, Such long latencies can be a serious issue for many
latency-sensitive applications. The reason behind the long
latency and low bandwidth of RS(6,3) and RS(10,4) is that
online erasure coding requires computation for encoding, data
management, and additional network traffic. We will analyze
each contribution of performance degradation in more detail
in Section V and VI. Note that the latency on sequential writes
becomes shorter as the block size increases. This is because
the consecutive requests can be delayed by PG backend until
the service of previous request is completed while a small size
1KB 2KB 4KB 8KB16KB
32KB64KB
128KB0200400600800
10001200
0306090
4KB2KB
1KB
Thro
ughp
ut (M
B/s
) 3-Rep. RS 6, 3 RS 10, 4X 7.4
(a) Throughput.
1KB 2KB 4KB 8KB16KB
32KB64KB
128KB0
20
40
60
80
100 3-Rep. RS 6, 3 RS 10, 4
Late
ncy
(mse
c)
(b) Latency.
Fig. 7: Comparison of random write performance.
1KB 2KB 4KB 8KB16KB
32KB64KB
128KB0200400600800
10001200
0306090
4KB2KB
1KB
Thro
ughp
ut (M
B/s
) 3-Rep. RS 6, 3 RS 10, 4X 1.5
(a) Throughput
1KB 2KB 4KB 8KB16KB
32KB64KB
128KB0
10
20
30 3-Rep. RS 6, 3 RS 10, 4
Late
ncy
(mse
c)
(b) Latency
Fig. 8: Comparison of random read performance.
of request reads actually out the data as stripe width. We will
examine this phenomenon in details in Section VII.
Reads. Figure 6 compares the throughput of RS(6,3) and
RS(10,4) with that of 3-replication by performing sequential
read operations. In contrast to the writes (cf. Figure 5), RS(6,3)
and RS(10,4) degrade the performance by only 26% and
45% on average, compared with 3-replication. This is because
decoding process (i.e., repair bandwidth) is only involved
when there is a device or node failure. Nevertheless, RS(6,3)
and RS(10,4) yet give 2.2× and 2.9× longer latency than that
of 3-replication, respectively. Even though the decoding and
repair overheads occur only when there is a failure, the reads of
online erasure coding requires composing the data chunks into
a stripe, which in turn introduces the overheads not observed
by any replication method. We refer this process associated
with reads to as RS-concatenation, which also generates extra
data transfers over the private network, thereby increasing the
latency of RS(6,3) and RS(10,4) further. As shown in Figure
6b, the latency of traditional configuration (with 3-replication)
is less than 50 ms, whereas RS(6,3) and RS(10,4) require as
high as 111 ms and 142 ms, respectively. We will examine
the performance and system impacts of RS-concatenation in
Section V.
B. Random Performance
Writes. As shown in Figure 7, RS(6,3) and RS(10,4) give
3.4× and 4.9× worse write performance than 3-replication for
random I/O accesses, respectively. The trend of performance
difference is similar to that of sequential writes, but the random
write bandwidth of RS(6,3) and RS(10,4) offer 3.6× and 3.2×
higher write bandwidth for random writes than for sequential
writes, respectively. This is because the sequential accesses
with the block size smaller than an object mostly target to
the same PG at its primary OSD, which makes many resource
conflicts at the PG level. As explained in Section II, since
the target’s dispatcher (underneath its client messenger) locks
the target PG to offer strong consistency of a storage cluster,
the underlying PG backend is not available, which renders
lower throughput and exhibits longer latency. In contrast,
since I/O requests under random accesses can be distributed
System User
Block Size (KB)
3-Rep.
5.1%
(a) Sequential write.
System User
Block Size (KB)CPU
Util
izat
ion
(%)
RS 10, 4RS 6, 3
3-Rep. 37.7%
(b) Random write.
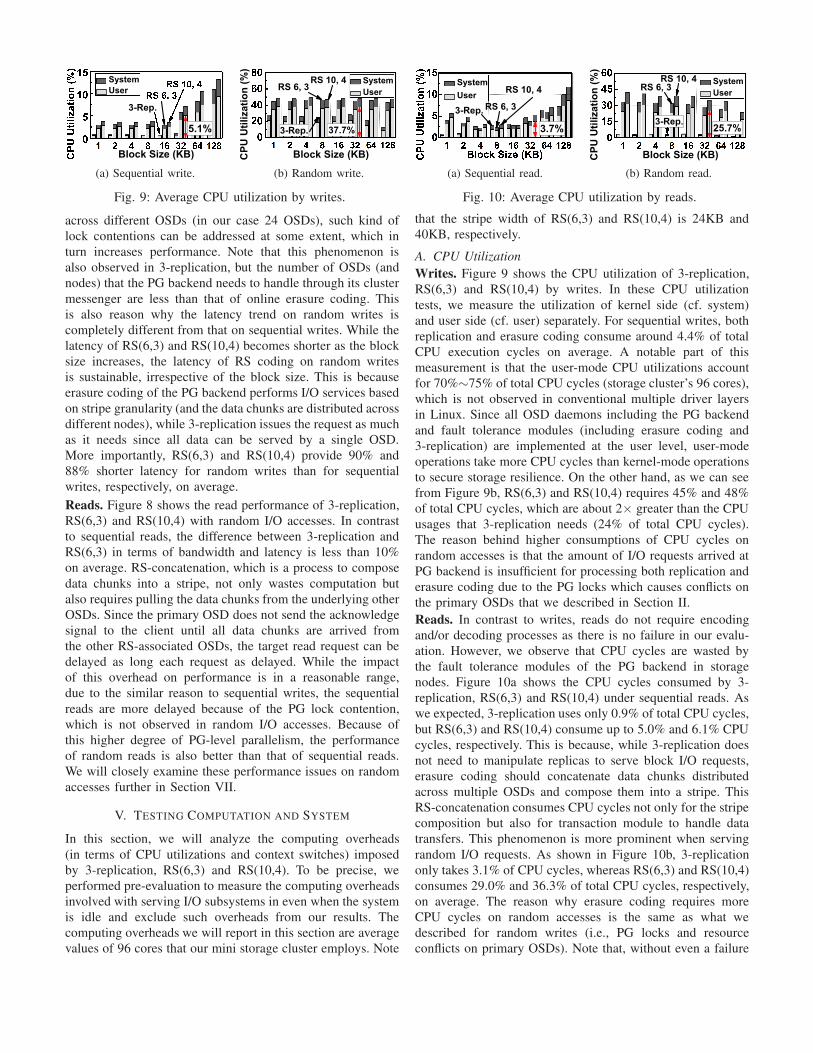
Fig. 9: Average CPU utilization by writes.
across different OSDs (in our case 24 OSDs), such kind of
lock contentions can be addressed at some extent, which in
turn increases performance. Note that this phenomenon is
also observed in 3-replication, but the number of OSDs (and
nodes) that the PG backend needs to handle through its cluster
messenger are less than that of online erasure coding. This
is also reason why the latency trend on random writes is
completely different from that on sequential writes. While the
latency of RS(6,3) and RS(10,4) becomes shorter as the block
size increases, the latency of RS coding on random writes
is sustainable, irrespective of the block size. This is because
erasure coding of the PG backend performs I/O services based
on stripe granularity (and the data chunks are distributed across
different nodes), while 3-replication issues the request as much
as it needs since all data can be served by a single OSD.
More importantly, RS(6,3) and RS(10,4) provide 90% and
88% shorter latency for random writes than for sequential
writes, respectively, on average.
Reads. Figure 8 shows the read performance of 3-replication,
RS(6,3) and RS(10,4) with random I/O accesses. In contrast
to sequential reads, the difference between 3-replication and
RS(6,3) in terms of bandwidth and latency is less than 10%
on average. RS-concatenation, which is a process to compose
data chunks into a stripe, not only wastes computation but
also requires pulling the data chunks from the underlying other
OSDs. Since the primary OSD does not send the acknowledge
signal to the client until all data chunks are arrived from
the other RS-associated OSDs, the target read request can be
delayed as long each request as delayed. While the impact
of this overhead on performance is in a reasonable range,
due to the similar reason to sequential writes, the sequential
reads are more delayed because of the PG lock contention,
which is not observed in random I/O accesses. Because of
this higher degree of PG-level parallelism, the performance
of random reads is also better than that of sequential reads.
We will closely examine these performance issues on random
accesses further in Section VII.
V. TESTING COMPUTATION AND SYSTEM
In this section, we will analyze the computing overheads
(in terms of CPU utilizations and context switches) imposed
by 3-replication, RS(6,3) and RS(10,4). To be precise, we
performed pre-evaluation to measure the computing overheads
involved with serving I/O subsystems in even when the system
is idle and exclude such overheads from our results. The
computing overheads we will report in this section are average
values of 96 cores that our mini storage cluster employs. Note
System User RS 10, 4
RS 6, 33-Rep.
3.7%
(a) Sequential read.
System User
Block Size (KB)CPU
Util
izat
ion
(%)
RS 6, 3
3-Rep.
RS 10, 4
25.7%
(b) Random read.
Fig. 10: Average CPU utilization by reads.
that the stripe width of RS(6,3) and RS(10,4) is 24KB and
40KB, respectively.
A. CPU Utilization
Writes. Figure 9 shows the CPU utilization of 3-replication,
RS(6,3) and RS(10,4) by writes. In these CPU utilization
tests, we measure the utilization of kernel side (cf. system)
and user side (cf. user) separately. For sequential writes, both
replication and erasure coding consume around 4.4% of total
CPU execution cycles on average. A notable part of this
measurement is that the user-mode CPU utilizations account
for 70%∼75% of total CPU cycles (storage cluster’s 96 cores),
which is not observed in conventional multiple driver layers
in Linux. Since all OSD daemons including the PG backend
and fault tolerance modules (including erasure coding and
3-replication) are implemented at the user level, user-mode
operations take more CPU cycles than kernel-mode operations
to secure storage resilience. On the other hand, as we can see
from Figure 9b, RS(6,3) and RS(10,4) requires 45% and 48%
of total CPU cycles, which are about 2× greater than the CPU
usages that 3-replication needs (24% of total CPU cycles).
The reason behind higher consumptions of CPU cycles on
random accesses is that the amount of I/O requests arrived at
PG backend is insufficient for processing both replication and
erasure coding due to the PG locks which causes conflicts on
the primary OSDs that we described in Section II.
Reads. In contrast to writes, reads do not require encoding
and/or decoding processes as there is no failure in our evalu-
ation. However, we observe that CPU cycles are wasted by
the fault tolerance modules of the PG backend in storage
nodes. Figure 10a shows the CPU cycles consumed by 3-
replication, RS(6,3) and RS(10,4) under sequential reads. As
we expected, 3-replication uses only 0.9% of total CPU cycles,
but RS(6,3) and RS(10,4) consume up to 5.0% and 6.1% CPU
cycles, respectively. This is because, while 3-replication does
not need to manipulate replicas to serve block I/O requests,
erasure coding should concatenate data chunks distributed
across multiple OSDs and compose them into a stripe. This
RS-concatenation consumes CPU cycles not only for the stripe
composition but also for transaction module to handle data
transfers. This phenomenon is more prominent when serving
random I/O requests. As shown in Figure 10b, 3-replication
only takes 3.1% of CPU cycles, whereas RS(6,3) and RS(10,4)
consumes 29.0% and 36.3% of total CPU cycles, respectively,
on average. The reason why erasure coding requires more
CPU cycles on random accesses is the same as what we
described for random writes (i.e., PG locks and resource
conflicts on primary OSDs). Note that, without even a failure
1KB 2KB 4KB 8KB16KB
32KB64KB
128KB0
250k
500k
750k
1M
010k20k30k40k 32KB
64KB128KB
Con
text
Sw
itch
(#/M
B) 3-Rep. RS 6, 3 RS 10, 4
(a) Sequential write.
1KB 2KB 4KB 8KB16KB
32KB64KB
128KB0
500k
1M
0
20k
40k 32KB
64KB128KB
Con
text
Sw
itch
(#/M
B) 3-Rep. RS 6, 3 RS 10, 4
(b) Random write.
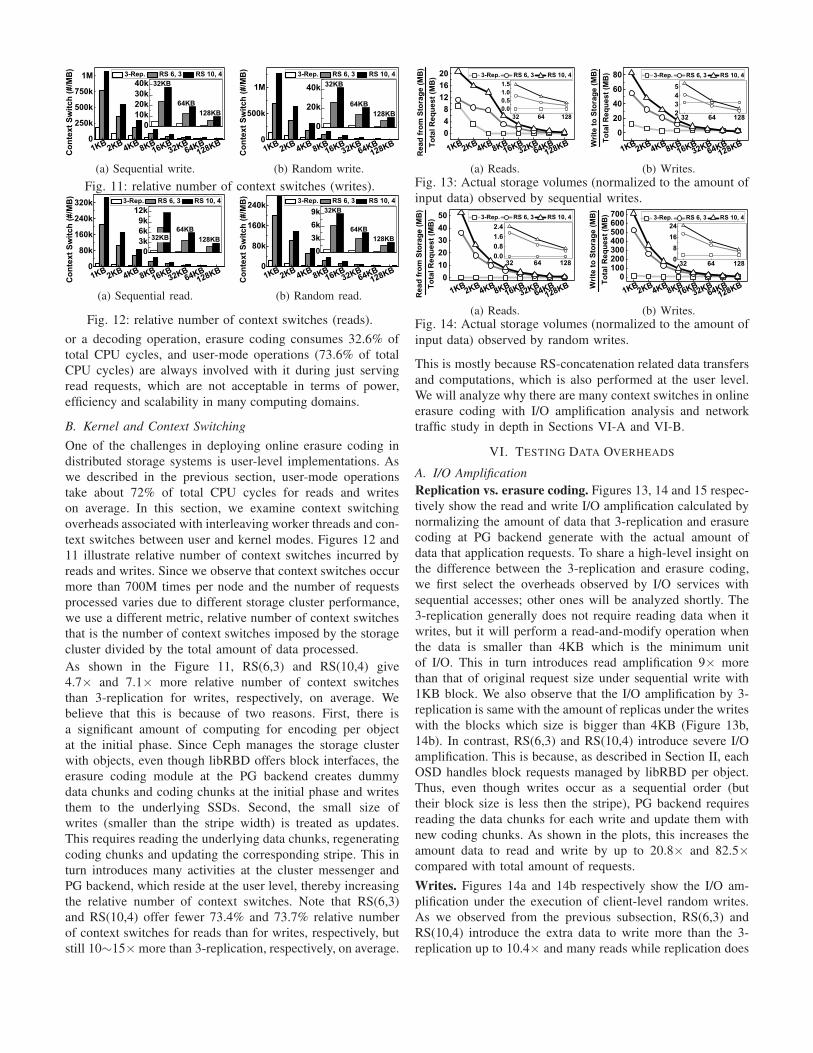
Fig. 11: relative number of context switches (writes).
1KB 2KB 4KB 8KB16KB
32KB64KB
128KB0
80k
160k
240k
320k
03k6k9k
12k
32KB64KB
128KB
Con
text
Sw
itch
(#/M
B) 3-Rep. RS 6, 3 RS 10, 4
(a) Sequential read.
1KB 2KB 4KB 8KB16KB
32KB64KB
128KB0
80k
160k
240k
03k6k9k 32KB
64KB128KB
Con
text
Sw
itch
(#/M
B) 3-Rep. RS 6, 3 RS 10, 4
(b) Random read.
Fig. 12: relative number of context switches (reads).
or a decoding operation, erasure coding consumes 32.6% of
total CPU cycles, and user-mode operations (73.6% of total
CPU cycles) are always involved with it during just serving
read requests, which are not acceptable in terms of power,
efficiency and scalability in many computing domains.
B. Kernel and Context Switching
One of the challenges in deploying online erasure coding in
distributed storage systems is user-level implementations. As
we described in the previous section, user-mode operations
take about 72% of total CPU cycles for reads and writes
on average. In this section, we examine context switching
overheads associated with interleaving worker threads and con-
text switches between user and kernel modes. Figures 12 and
11 illustrate relative number of context switches incurred by
reads and writes. Since we observe that context switches occur
more than 700M times per node and the number of requests
processed varies due to different storage cluster performance,
we use a different metric, relative number of context switches
that is the number of context switches imposed by the storage
cluster divided by the total amount of data processed.
As shown in the Figure 11, RS(6,3) and RS(10,4) give
4.7× and 7.1× more relative number of context switches
than 3-replication for writes, respectively, on average. We
believe that this is because of two reasons. First, there is
a significant amount of computing for encoding per object
at the initial phase. Since Ceph manages the storage cluster
with objects, even though libRBD offers block interfaces, the
erasure coding module at the PG backend creates dummy
data chunks and coding chunks at the initial phase and writes
them to the underlying SSDs. Second, the small size of
writes (smaller than the stripe width) is treated as updates.
This requires reading the underlying data chunks, regenerating
coding chunks and updating the corresponding stripe. This in
turn introduces many activities at the cluster messenger and
PG backend, which reside at the user level, thereby increasing
the relative number of context switches. Note that RS(6,3)
and RS(10,4) offer fewer 73.4% and 73.7% relative number
of context switches for reads than for writes, respectively, but
still 10∼15× more than 3-replication, respectively, on average.
1KB2KB4KB8KB16KB
32KB64KB
128KB048
121620
32 64 1280.00.51.01.5
Rea
d fr
om S
tora
ge (M
B)
Tota
l Req
uest
(MB
) 3-Rep. RS 6, 3 RS 10, 4
(a) Reads.
1KB2KB4KB8KB16KB
32KB64KB
128KB0
20406080
32 64 1282345
Writ
e to
Sto
rage
(MB
)To
tal R
eque
st (M
B) 3-Rep. RS 6, 3 RS 10, 4
(b) Writes.
Fig. 13: Actual storage volumes (normalized to the amount of
input data) observed by sequential writes.
1KB2KB4KB8KB16KB
32KB64KB
128KB0
1020304050
32 64 1280.00.81.62.4
3-Rep. RS 6, 3 RS 10, 4
Rea
d fr
om S
tora
ge (M
B)
Tota
l Req
uest
(MB
)
(a) Reads.
1KB2KB4KB8KB16KB
32KB64KB
128KB0
100200300400500600700
32 64 12808
1624
3-Rep. RS 6, 3 RS 10, 4
Writ
e to
Sto
rage
(MB
)To
tal R
eque
st (M
B)
(b) Writes.
Fig. 14: Actual storage volumes (normalized to the amount of
input data) observed by random writes.
This is mostly because RS-concatenation related data transfers
and computations, which is also performed at the user level.
We will analyze why there are many context switches in online
erasure coding with I/O amplification analysis and network
traffic study in depth in Sections VI-A and VI-B.
VI. TESTING DATA OVERHEADS
A. I/O Amplification
Replication vs. erasure coding. Figures 13, 14 and 15 respec-
tively show the read and write I/O amplification calculated by
normalizing the amount of data that 3-replication and erasure
coding at PG backend generate with the actual amount of
data that application requests. To share a high-level insight on
the difference between the 3-replication and erasure coding,
we first select the overheads observed by I/O services with
sequential accesses; other ones will be analyzed shortly. The
3-replication generally does not require reading data when it
writes, but it will perform a read-and-modify operation when
the data is smaller than 4KB which is the minimum unit
of I/O. This in turn introduces read amplification 9× more
than that of original request size under sequential write with
1KB block. We also observe that the I/O amplification by 3-
replication is same with the amount of replicas under the writes
with the blocks which size is bigger than 4KB (Figure 13b,
14b). In contrast, RS(6,3) and RS(10,4) introduce severe I/O
amplification. This is because, as described in Section II, each
OSD handles block requests managed by libRBD per object.
Thus, even though writes occur as a sequential order (but
their block size is less then the stripe), PG backend requires
reading the data chunks for each write and update them with
new coding chunks. As shown in the plots, this increases the
amount data to read and write by up to 20.8× and 82.5×
compared with total amount of requests.
Writes. Figures 14a and 14b respectively show the I/O am-
plification under the execution of client-level random writes.
As we observed from the previous subsection, RS(6,3) and
RS(10,4) introduce the extra data to write more than the 3-
replication up to 10.4× and many reads while replication does
1KB2KB4KB8KB16KB
32KB64KB
128KB0.60.81.01.21.4
Rea
d fr
om S
tora
ge (M
B)
Tota
l Req
uest
(MB
) 3-Rep. RS 6, 3 RS 10, 4
(a) Sequential read.
1KB2KB4KB8KB16KB
32KB64KB
128KB0
10
20
30
40
32 64 1280.81.21.62.02.4
3-Rep. RS 6, 3 RS 10, 4
Rea
d fr
om S
tora
ge (M
B)
Tota
l Req
uest
(MB
)
(b) Random read.
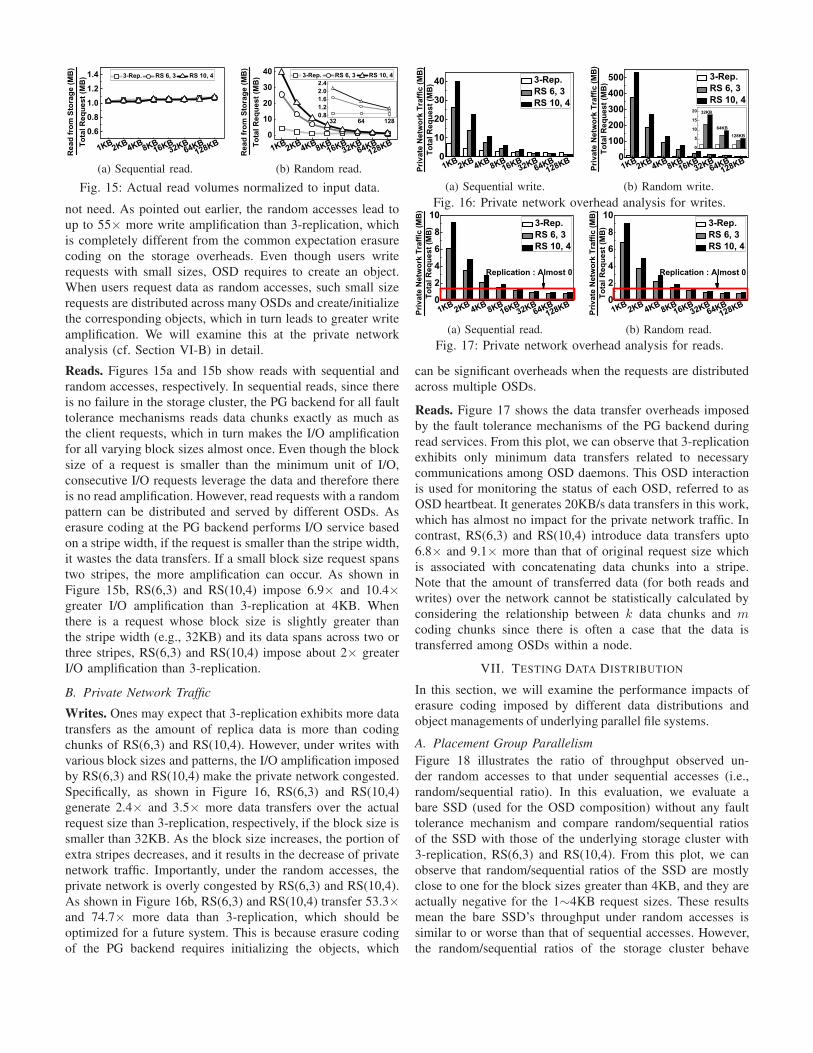
Fig. 15: Actual read volumes normalized to input data.
not need. As pointed out earlier, the random accesses lead to
up to 55× more write amplification than 3-replication, which
is completely different from the common expectation erasure
coding on the storage overheads. Even though users write
requests with small sizes, OSD requires to create an object.
When users request data as random accesses, such small size
requests are distributed across many OSDs and create/initialize
the corresponding objects, which in turn leads to greater write
amplification. We will examine this at the private network
analysis (cf. Section VI-B) in detail.
Reads. Figures 15a and 15b show reads with sequential and
random accesses, respectively. In sequential reads, since there
is no failure in the storage cluster, the PG backend for all fault
tolerance mechanisms reads data chunks exactly as much as
the client requests, which in turn makes the I/O amplification
for all varying block sizes almost once. Even though the block
size of a request is smaller than the minimum unit of I/O,
consecutive I/O requests leverage the data and therefore there
is no read amplification. However, read requests with a random
pattern can be distributed and served by different OSDs. As
erasure coding at the PG backend performs I/O service based
on a stripe width, if the request is smaller than the stripe width,
it wastes the data transfers. If a small block size request spans
two stripes, the more amplification can occur. As shown in
Figure 15b, RS(6,3) and RS(10,4) impose 6.9× and 10.4×
greater I/O amplification than 3-replication at 4KB. When
there is a request whose block size is slightly greater than
the stripe width (e.g., 32KB) and its data spans across two or
three stripes, RS(6,3) and RS(10,4) impose about 2× greater
I/O amplification than 3-replication.
B. Private Network Traffic
Writes. Ones may expect that 3-replication exhibits more data
transfers as the amount of replica data is more than coding
chunks of RS(6,3) and RS(10,4). However, under writes with
various block sizes and patterns, the I/O amplification imposed
by RS(6,3) and RS(10,4) make the private network congested.
Specifically, as shown in Figure 16, RS(6,3) and RS(10,4)
generate 2.4× and 3.5× more data transfers over the actual
request size than 3-replication, respectively, if the block size is
smaller than 32KB. As the block size increases, the portion of
extra stripes decreases, and it results in the decrease of private
network traffic. Importantly, under the random accesses, the
private network is overly congested by RS(6,3) and RS(10,4).
As shown in Figure 16b, RS(6,3) and RS(10,4) transfer 53.3×
and 74.7× more data than 3-replication, which should be
optimized for a future system. This is because erasure coding
of the PG backend requires initializing the objects, which
1KB2KB4KB8KB16KB
32KB64KB
128KB0
10
20
30
40
Priv
ate
Net
wor
k Tr
affic
(MB
)To
tal R
eque
st (M
B) 3-Rep.
RS 6, 3 RS 10, 4
(a) Sequential write.
1KB2KB4KB8KB16KB
32KB64KB
128KB0100200300400500
0
5
10
15
20 32KB
64KB128KB
Priv
ate
Net
wor
k Tr
affic
(MB
)To
tal R
eque
st (M
B)
3-Rep. RS 6, 3 RS 10, 4
(b) Random write.
Fig. 16: Private network overhead analysis for writes.
1KB 2KB 4KB 8KB16KB
32KB64KB
128KB0
2
4
6
8
10
Priv
ate
Net
wor
k Tr
affic
(MB
)To
tal R
eque
st (M
B) 3-Rep.
RS 6, 3 RS 10, 4
Replication : Almost 0
(a) Sequential read.
1KB 2KB 4KB 8KB16KB
32KB64KB
128KB0
2
4
6
8
10
Priv
ate
Net
wor
k Tr
affic
(MB
)To
tal R
eque
st (M
B) 3-Rep.
RS 6, 3 RS 10, 4
Replication : Almost 0
(b) Random read.
Fig. 17: Private network overhead analysis for reads.
can be significant overheads when the requests are distributed
across multiple OSDs.
Reads. Figure 17 shows the data transfer overheads imposed
by the fault tolerance mechanisms of the PG backend during
read services. From this plot, we can observe that 3-replication
exhibits only minimum data transfers related to necessary
communications among OSD daemons. This OSD interaction
is used for monitoring the status of each OSD, referred to as
OSD heartbeat. It generates 20KB/s data transfers in this work,
which has almost no impact for the private network traffic. In
contrast, RS(6,3) and RS(10,4) introduce data transfers upto
6.8× and 9.1× more than that of original request size which
is associated with concatenating data chunks into a stripe.
Note that the amount of transferred data (for both reads and
writes) over the network cannot be statistically calculated by
considering the relationship between k data chunks and mcoding chunks since there is often a case that the data is
transferred among OSDs within a node.
VII. TESTING DATA DISTRIBUTION
In this section, we will examine the performance impacts of
erasure coding imposed by different data distributions and
object managements of underlying parallel file systems.
A. Placement Group Parallelism
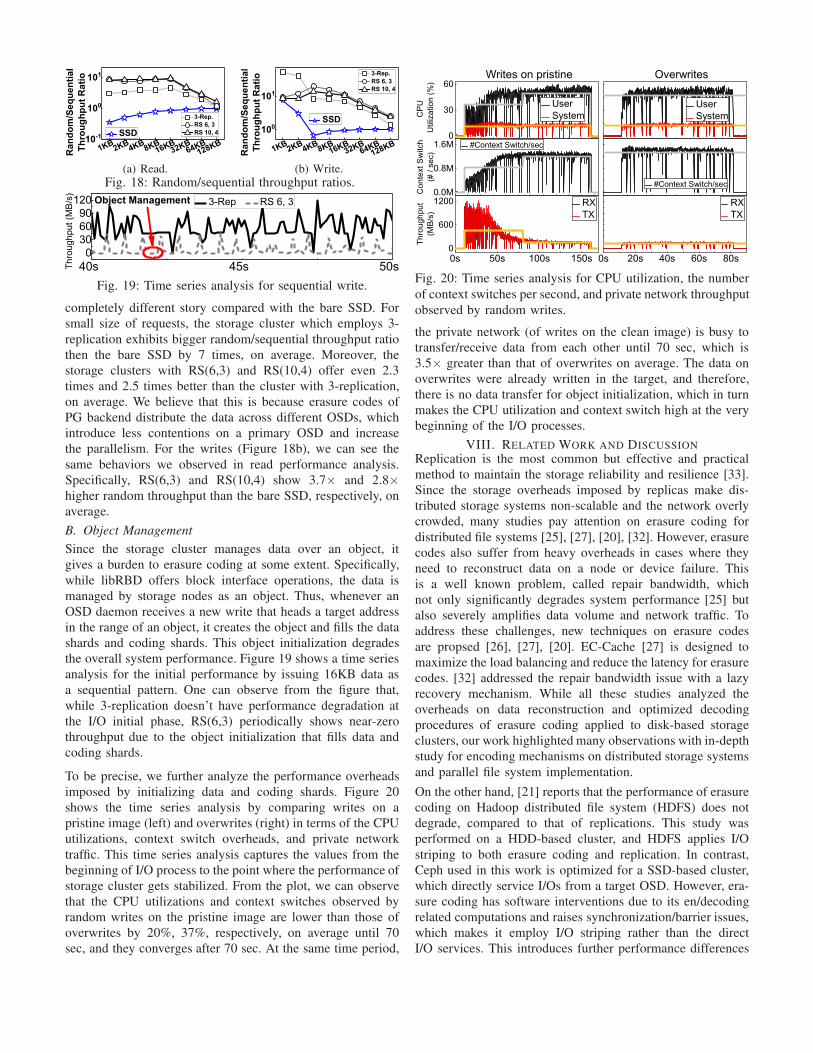
Figure 18 illustrates the ratio of throughput observed un-
der random accesses to that under sequential accesses (i.e.,
random/sequential ratio). In this evaluation, we evaluate a
bare SSD (used for the OSD composition) without any fault
tolerance mechanism and compare random/sequential ratios
of the SSD with those of the underlying storage cluster with
3-replication, RS(6,3) and RS(10,4). From this plot, we can
observe that random/sequential ratios of the SSD are mostly
close to one for the block sizes greater than 4KB, and they are
actually negative for the 1∼4KB request sizes. These results
mean the bare SSD’s throughput under random accesses is
similar to or worse than that of sequential accesses. However,
the random/sequential ratios of the storage cluster behave
1KB2KB4KB8KB16KB
32KB64KB
128KB10-1
100
101
3-Rep. RS 6, 3 RS 10, 4
Ran
dom
/Seq
uent
ial
Thro
ughp
ut R
atio
SSD
(a) Read.
1KB2KB4KB8KB16KB
32KB64KB
128KB
100
101
3-Rep. RS 6, 3 RS 10, 4
Ran
dom
/Seq
uent
ial
Thro
ughp
ut R
atio
SSD
(b) Write.
Fig. 18: Random/sequential throughput ratios.
40s 45s 50s0
306090
120 3-Rep RS 6, 3
Thro
ughp
ut (M
B/s) Object Management
Fig. 19: Time series analysis for sequential write.
completely different story compared with the bare SSD. For
small size of requests, the storage cluster which employs 3-
replication exhibits bigger random/sequential throughput ratio
then the bare SSD by 7 times, on average. Moreover, the
storage clusters with RS(6,3) and RS(10,4) offer even 2.3
times and 2.5 times better than the cluster with 3-replication,
on average. We believe that this is because erasure codes of
PG backend distribute the data across different OSDs, which
introduce less contentions on a primary OSD and increase
the parallelism. For the writes (Figure 18b), we can see the
same behaviors we observed in read performance analysis.
Specifically, RS(6,3) and RS(10,4) show 3.7× and 2.8×
higher random throughput than the bare SSD, respectively, on
average.
B. Object Management
Since the storage cluster manages data over an object, it
gives a burden to erasure coding at some extent. Specifically,
while libRBD offers block interface operations, the data is
managed by storage nodes as an object. Thus, whenever an
OSD daemon receives a new write that heads a target address
in the range of an object, it creates the object and fills the data
shards and coding shards. This object initialization degrades
the overall system performance. Figure 19 shows a time series
analysis for the initial performance by issuing 16KB data as
a sequential pattern. One can observe from the figure that,
while 3-replication doesn’t have performance degradation at
the I/O initial phase, RS(6,3) periodically shows near-zero
throughput due to the object initialization that fills data and
coding shards.
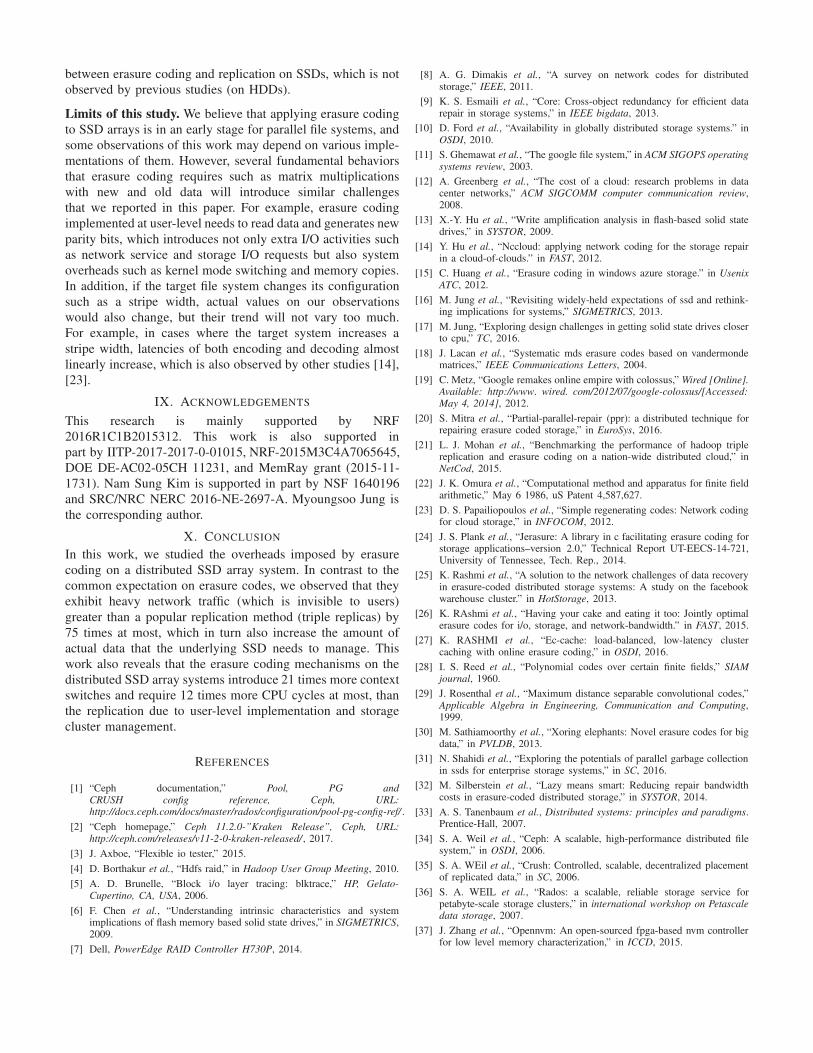
To be precise, we further analyze the performance overheads
imposed by initializing data and coding shards. Figure 20
shows the time series analysis by comparing writes on a
pristine image (left) and overwrites (right) in terms of the CPU
utilizations, context switch overheads, and private network
traffic. This time series analysis captures the values from the
beginning of I/O process to the point where the performance of
storage cluster gets stabilized. From the plot, we can observe
that the CPU utilizations and context switches observed by
random writes on the pristine image are lower than those of
overwrites by 20%, 37%, respectively, on average until 70
sec, and they converges after 70 sec. At the same time period,
0s 50s 100s 150s0
600
1200
0s 20s 40s 60s 80s
0.0M
0.8M
1.6M0
30
60Overwrites
Thro
ughp
ut(M
B/s)
RX TX
Writes on pristine
RX TX
Con
text
Sw
itch
(# /
sec)
#Context Switch/sec
#Context Switch/sec
CPU
U
tiliz
atio
n (%
)
User System
User System
Fig. 20: Time series analysis for CPU utilization, the number
of context switches per second, and private network throughput
observed by random writes.
the private network (of writes on the clean image) is busy to
transfer/receive data from each other until 70 sec, which is
3.5× greater than that of overwrites on average. The data on
overwrites were already written in the target, and therefore,
there is no data transfer for object initialization, which in turn
makes the CPU utilization and context switch high at the very
beginning of the I/O processes.
VIII. RELATED WORK AND DISCUSSION
Replication is the most common but effective and practical
method to maintain the storage reliability and resilience [33].
Since the storage overheads imposed by replicas make dis-
tributed storage systems non-scalable and the network overly
crowded, many studies pay attention on erasure coding for
distributed file systems [25], [27], [20], [32]. However, erasure
codes also suffer from heavy overheads in cases where they
need to reconstruct data on a node or device failure. This
is a well known problem, called repair bandwidth, which
not only significantly degrades system performance [25] but
also severely amplifies data volume and network traffic. To
address these challenges, new techniques on erasure codes
are propsed [26], [27], [20]. EC-Cache [27] is designed to
maximize the load balancing and reduce the latency for erasure
codes. [32] addressed the repair bandwidth issue with a lazy
recovery mechanism. While all these studies analyzed the
overheads on data reconstruction and optimized decoding
procedures of erasure coding applied to disk-based storage
clusters, our work highlighted many observations with in-depth
study for encoding mechanisms on distributed storage systems
and parallel file system implementation.
On the other hand, [21] reports that the performance of erasure
coding on Hadoop distributed file system (HDFS) does not
degrade, compared to that of replications. This study was
performed on a HDD-based cluster, and HDFS applies I/O
striping to both erasure coding and replication. In contrast,
Ceph used in this work is optimized for a SSD-based cluster,
which directly service I/Os from a target OSD. However, era-
sure coding has software interventions due to its en/decoding
related computations and raises synchronization/barrier issues,
which makes it employ I/O striping rather than the direct
I/O services. This introduces further performance differences
between erasure coding and replication on SSDs, which is not
observed by previous studies (on HDDs).
Limits of this study. We believe that applying erasure coding
to SSD arrays is in an early stage for parallel file systems, and
some observations of this work may depend on various imple-
mentations of them. However, several fundamental behaviors
that erasure coding requires such as matrix multiplications
with new and old data will introduce similar challenges
that we reported in this paper. For example, erasure coding
implemented at user-level needs to read data and generates new
parity bits, which introduces not only extra I/O activities such
as network service and storage I/O requests but also system
overheads such as kernel mode switching and memory copies.
In addition, if the target file system changes its configuration
such as a stripe width, actual values on our observations
would also change, but their trend will not vary too much.
For example, in cases where the target system increases a
stripe width, latencies of both encoding and decoding almost
linearly increase, which is also observed by other studies [14],
[23].
IX. ACKNOWLEDGEMENTS
This research is mainly supported by NRF
2016R1C1B2015312. This work is also supported in
part by IITP-2017-2017-0-01015, NRF-2015M3C4A7065645,
DOE DE-AC02-05CH 11231, and MemRay grant (2015-11-
1731). Nam Sung Kim is supported in part by NSF 1640196
and SRC/NRC NERC 2016-NE-2697-A. Myoungsoo Jung is
the corresponding author.
X. CONCLUSION
In this work, we studied the overheads imposed by erasure
coding on a distributed SSD array system. In contrast to the
common expectation on erasure codes, we observed that they
exhibit heavy network traffic (which is invisible to users)
greater than a popular replication method (triple replicas) by
75 times at most, which in turn also increase the amount of
actual data that the underlying SSD needs to manage. This
work also reveals that the erasure coding mechanisms on the
distributed SSD array systems introduce 21 times more context
switches and require 12 times more CPU cycles at most, than
the replication due to user-level implementation and storage
cluster management.
REFERENCES
[1] “Ceph documentation,” Pool, PG andCRUSH config reference, Ceph, URL:http://docs.ceph.com/docs/master/rados/configuration/pool-pg-config-ref/ .
[2] “Ceph homepage,” Ceph 11.2.0-”Kraken Release”, Ceph, URL:http://ceph.com/releases/v11-2-0-kraken-released/ , 2017.
[3] J. Axboe, “Flexible io tester,” 2015.
[4] D. Borthakur et al., “Hdfs raid,” in Hadoop User Group Meeting, 2010.
[5] A. D. Brunelle, “Block i/o layer tracing: blktrace,” HP, Gelato-Cupertino, CA, USA, 2006.
[6] F. Chen et al., “Understanding intrinsic characteristics and systemimplications of flash memory based solid state drives,” in SIGMETRICS,2009.
[7] Dell, PowerEdge RAID Controller H730P, 2014.
[8] A. G. Dimakis et al., “A survey on network codes for distributedstorage,” IEEE, 2011.
[9] K. S. Esmaili et al., “Core: Cross-object redundancy for efficient datarepair in storage systems,” in IEEE bigdata, 2013.
[10] D. Ford et al., “Availability in globally distributed storage systems.” inOSDI, 2010.
[11] S. Ghemawat et al., “The google file system,” in ACM SIGOPS operatingsystems review, 2003.
[12] A. Greenberg et al., “The cost of a cloud: research problems in datacenter networks,” ACM SIGCOMM computer communication review,2008.
[13] X.-Y. Hu et al., “Write amplification analysis in flash-based solid statedrives,” in SYSTOR, 2009.
[14] Y. Hu et al., “Nccloud: applying network coding for the storage repairin a cloud-of-clouds.” in FAST, 2012.
[15] C. Huang et al., “Erasure coding in windows azure storage.” in UsenixATC, 2012.
[16] M. Jung et al., “Revisiting widely-held expectations of ssd and rethink-ing implications for systems,” SIGMETRICS, 2013.
[17] M. Jung, “Exploring design challenges in getting solid state drives closerto cpu,” TC, 2016.
[18] J. Lacan et al., “Systematic mds erasure codes based on vandermondematrices,” IEEE Communications Letters, 2004.
[19] C. Metz, “Google remakes online empire with colossus,” Wired [Online].Available: http://www. wired. com/2012/07/google-colossus/[Accessed:May 4, 2014], 2012.
[20] S. Mitra et al., “Partial-parallel-repair (ppr): a distributed technique forrepairing erasure coded storage,” in EuroSys, 2016.
[21] L. J. Mohan et al., “Benchmarking the performance of hadoop triplereplication and erasure coding on a nation-wide distributed cloud,” inNetCod, 2015.
[22] J. K. Omura et al., “Computational method and apparatus for finite fieldarithmetic,” May 6 1986, uS Patent 4,587,627.
[23] D. S. Papailiopoulos et al., “Simple regenerating codes: Network codingfor cloud storage,” in INFOCOM, 2012.
[24] J. S. Plank et al., “Jerasure: A library in c facilitating erasure coding forstorage applications–version 2.0,” Technical Report UT-EECS-14-721,University of Tennessee, Tech. Rep., 2014.
[25] K. Rashmi et al., “A solution to the network challenges of data recoveryin erasure-coded distributed storage systems: A study on the facebookwarehouse cluster.” in HotStorage, 2013.
[26] K. RAshmi et al., “Having your cake and eating it too: Jointly optimalerasure codes for i/o, storage, and network-bandwidth.” in FAST, 2015.
[27] K. RASHMI et al., “Ec-cache: load-balanced, low-latency clustercaching with online erasure coding,” in OSDI, 2016.
[28] I. S. Reed et al., “Polynomial codes over certain finite fields,” SIAMjournal, 1960.
[29] J. Rosenthal et al., “Maximum distance separable convolutional codes,”Applicable Algebra in Engineering, Communication and Computing,1999.
[30] M. Sathiamoorthy et al., “Xoring elephants: Novel erasure codes for bigdata,” in PVLDB, 2013.
[31] N. Shahidi et al., “Exploring the potentials of parallel garbage collectionin ssds for enterprise storage systems,” in SC, 2016.
[32] M. Silberstein et al., “Lazy means smart: Reducing repair bandwidthcosts in erasure-coded distributed storage,” in SYSTOR, 2014.
[33] A. S. Tanenbaum et al., Distributed systems: principles and paradigms.Prentice-Hall, 2007.
[34] S. A. Weil et al., “Ceph: A scalable, high-performance distributed filesystem,” in OSDI, 2006.
[35] S. A. WEil et al., “Crush: Controlled, scalable, decentralized placementof replicated data,” in SC, 2006.
[36] S. A. WEIL et al., “Rados: a scalable, reliable storage service forpetabyte-scale storage clusters,” in international workshop on Petascaledata storage, 2007.
[37] J. Zhang et al., “Opennvm: An open-sourced fpga-based nvm controllerfor low level memory characterization,” in ICCD, 2015.