Embed Size (px)
Citation preview

Industry Information Session:Understanding School Operations Understanding School Operations
Profit and LossProfit and Loss
Monday, January 14 10:15 AM – 11:30 AM
Facilitator: Gary VonckPanelists: Dora Rivas
Linda Stoll Julia Bauscher

Understanding Profit and Loss
Dora Rivas, MS, RD, SNSDallas ISD Executive Director
Food and Child Nutrition Services
Learning Objectives
Implementing strong financial methods for a successful SN program
Attendees will leave with a thorough understanding of the importance of applying strong financial methods within a program involving multiple regulatory requirements

The Why is Obvious
• Efficient use of funds is critical to operations• Monitoring of Profit and Loss helps in decision
making• A sustainable program assures JOB SECURITY!
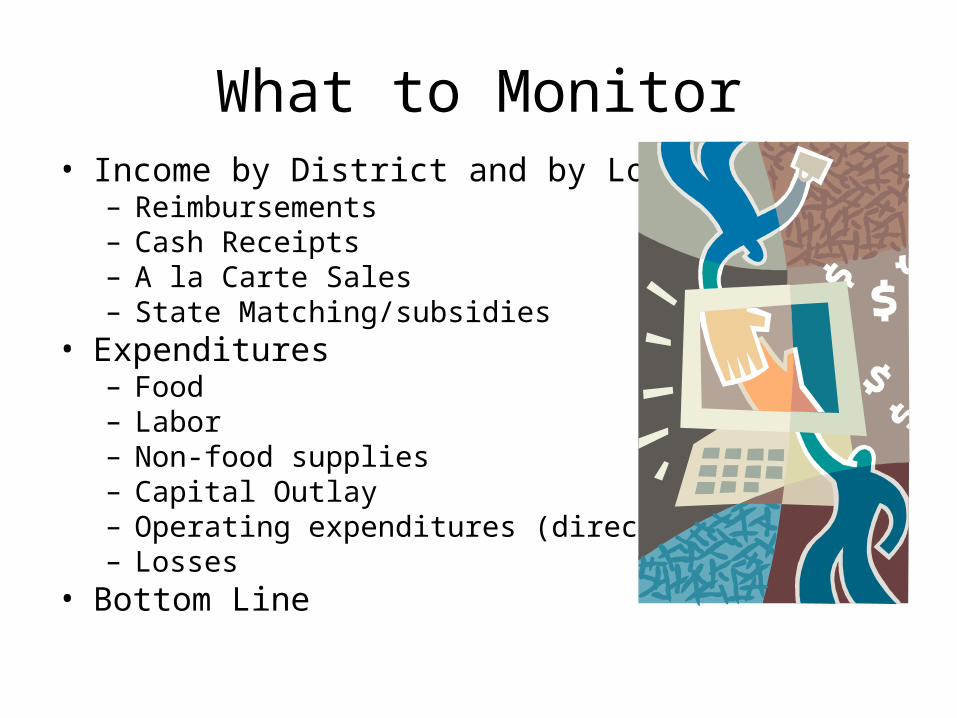
What to Monitor• Income by District and by Location
– Reimbursements– Cash Receipts– A la Carte Sales– State Matching/subsidies
• Expenditures– Food– Labor– Non-food supplies– Capital Outlay– Operating expenditures (direct & indirect)– Losses
• Bottom Line

Factors that affect Profit & Loss• Menu planning
Required menu pattern is the same but decisions around products purchased varies
Too many choices Monitoring student meal participation Pennies make a difference – they add up!
• Staff training Management- Food ordering/receipt & storage, handling Employee- preparation, production, batch-cooking and use of
leftovers
• Monitoring Compliance- skimping on serving sizes to reduce cost can result in
non-compliance and student dissatisfaction Food Quality- affects participation Food overproduction and/or food waste affects bottom-line

Strategic Planning Cycle

Reports that help me
• Profit & Loss Monthly comparison (total cost & percentage of revenue by district and by school)– Comparison current month to same month
previous year– Comparison of YTD this year to last year YTD
• Monthly Meals per Labor Hour by district and by school

Profit and Loss Report

Meals per Labor Hour Reports by District

Participation Trend

Meals per Labor Hour Reports by Campus
Fund Balance Cost of Operations
• Profitability• Use of reserve funds
– Cash flow– How much should be in reserves

Participation Trends

Participation Trend

THANK YOU
Understanding Profit and Loss
Linda Stoll, MPH, SNSExecutive Director, Food and Nutrition
ServicesJeffco Public Schools

Bottom Line – “Break Even”
• School Boards expect Food Service Programs to be self-supporting
• Increasingly, school districts charge Food Service Programs for “services” provided by the district– HR; Payroll; Maintenance; AP; Trash; Utilities
• Direct Charge for specific services
• Indirect charges - % of budget

Profit and Loss Statement is a measure of success
• Against previous month
• Against same month, previous year
• Against budgeted numbers– Government Accounting works different than
“business Accounting” – need to “meet the budget”.

District P & L
Go to spread sheet #1

Compare to last year
Go to spread sheet #2

Look at specific area of district
Go to spread sheet # 3
Look at specific School
Go to spread sheet #4

Against budget
• Go to spread sheet #7

Plate Cost• An important number to our program is “plate
cost”
• We know how much money we receive for each meal that we serve
• We need to know how much it costs us to produce one meal– Food costs– Labor costs– Indirect costs

Plate cost
• District wide – spread sheet # 5• Site – spread sheet # 6
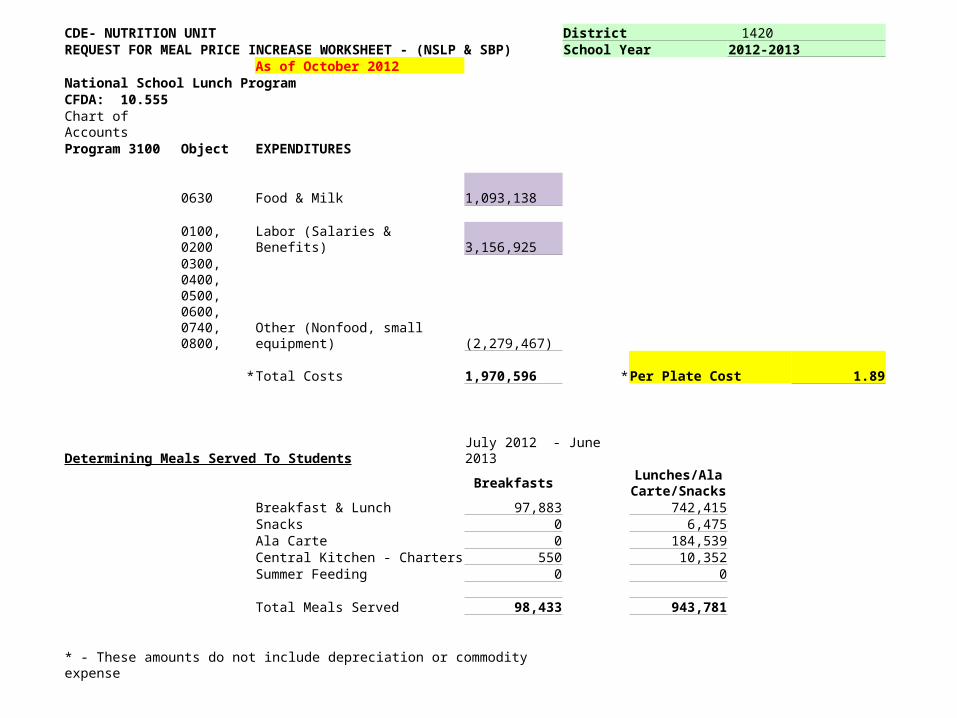
CDE- NUTRITION UNIT District 1420REQUEST FOR MEAL PRICE INCREASE WORKSHEET - (NSLP & SBP) School Year 2012-2013
As of October 2012National School Lunch ProgramCFDA: 10.555Chart of AccountsProgram 3100 Object EXPENDITURES
0630 Food & Milk 1,093,138
0100, 0200 Labor (Salaries & Benefits) 3,156,925 0300, 0400, 0500, 0600, 0740, 0800, Other (Nonfood, small equipment) (2,279,467)
*Total Costs 1,970,596 *Per Plate Cost 1.89
Determining Meals Served To Students July 2012 - June 2013
BreakfastsLunches/Ala
Carte/Snacks Breakfast & Lunch 97,883 742,415Snacks 0 6,475Ala Carte 0 184,539 Central Kitchen - Charters 550 10,352 Summer Feeding 0 0
Total Meals Served 98,433 943,781
* - These amounts do not include depreciation or commodity expense
When reporting to CDE for future price increases, depreciation and commodities should be left in theexpenses calculation

Participation comparisons
• Look at impact of menu changes
• Look at impact of enrollment changes
• Look at impact of marketing strategies

Jeffco – Elementary Breakfast

Jeffco – Secondary Breakfast
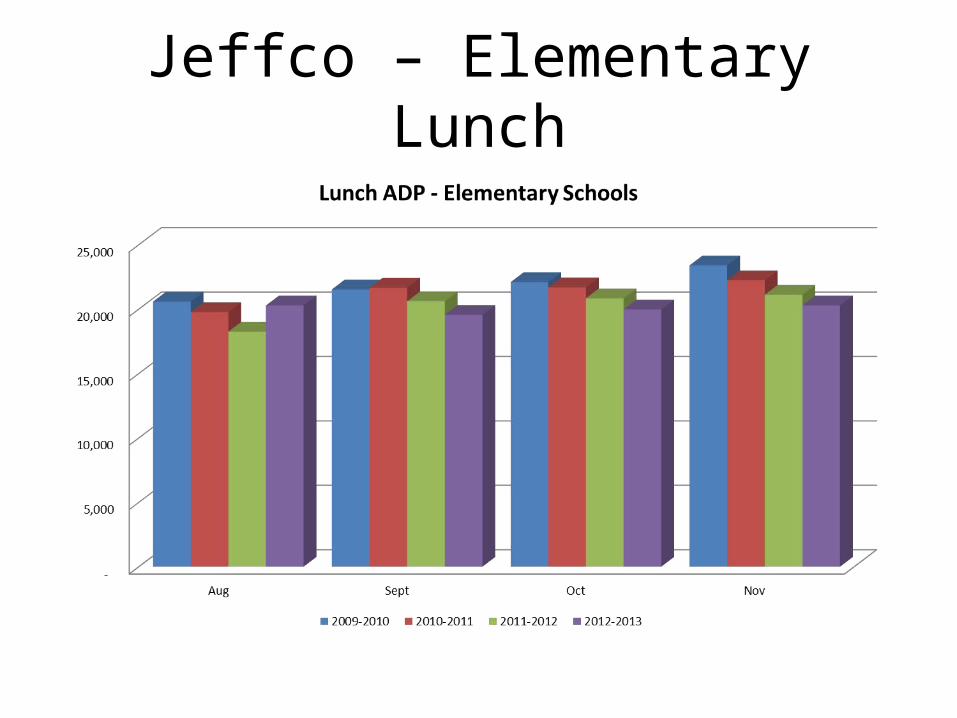
Jeffco – Elementary Lunch

Jeffco – Secondary Lunch

THANK YOU

Jefferson County Public SchoolsSCHOOL AND COMMUNITY
NUTRITION SERVICES
Louisville, KY Julia Bauscher, SNS
Director

Overview• 101,000 students• 65% Free/Reduced• 144 school cafeterias; central
kitchen/warehouse• 825 employees• 61,500 Lunch ADP• 35,000 Breakfast ADP• NSLP, SBP, SFSP, BIC, USDA FFVP

Gain/Loss
• Extensive report by location, by level, generated by coordinator records and reports
• Detailed participation information
• Detailed expense information
• Detailed revenue information
• Utilized by SCNS administrators to monitor school performance and target areas for improvement

Gain/Loss Snapshot
Avg. Lunch Food
Plate Cost per Meal
Avg. YTD Lunch Labor
Cost (w/ Benefits)
Avg. Lunch Labor
Cost per Meal
Avg. YTD Other Direct Lunch Plate
Costs
Avg. Lunch Other Direct
Cost per Meal
Avg. YTD Indirect
Plate Cost
Avg. Lunch Indirect
Cost per Meal
Avg. YTD Lunch
Equipment, CO Plate
Cost
Avg. Lunch
Equip/CO Cost per
Meal
Avg. Lunch Meal Plate Cost
1.23$ 25,245.60$ 1.08$ 10,924.80$ 0.47$ $4,868.00 0.21$ $1,118.30 0.05$ 3.04$
1.26$ 29,019.20$ 0.98$ 13,447.20$ 0.45$ $5,596.00 0.19$ $1,425.60 0.05$ 2.92$
1.22$ 37,513.60$ 0.78$ 17,252.00$ 0.36$ $7,233.60 0.15$ $2,303.14 0.05$ 2.56$
1.17$ 31,696.00$ 0.79$ 14,541.60$ 0.36$ $6,112.00 0.15$ $1,929.31 0.05$ 2.52$
1.23$ 40,519.20$ 0.75$ 19,475.20$ 0.36$ $7,813.60 0.14$ $2,607.26 0.05$ 2.53$
1.37$ 26,529.60$ 0.92$ 11,749.60$ 0.41$ $5,116.00 0.18$ $1,387.58 0.05$ 2.92$
1.23$ 31,043.20$ 0.66$ 14,620.80$ 0.31$ $5,986.40 0.13$ $2,261.95 0.05$ 2.37$

School Name: Loc.# Membership Month/Year # Days Served
1 Free Reduced
2 Attendance: ADP-Lunch ADP-Break.
3 #DIV/0! #DIV/0! #DIV/0! #DIV/0!4 Lunch Breakfast B % Fr Eating B% R Eating
5 #DIV/0! #DIV/0!6 L % Fr Eating L % R Eating
INCOME: Federal ReimbursementReimb. # Meals Mo. Reimb. Daily Daily Rates X Served = Due Counts Dollars
10 Reduced 1.55 -$ #DIV/0! #DIV/0!
11 Free 1.85 -$ #DIV/0! #DIV/0!
12 Paid 0.27 -$ #DIV/0! #DIV/0!
13 0 -$ #DIV/0! #DIV/0!
14 Lunch Reduced 2.48 -$ #DIV/0! #DIV/0!15 Free 2.88 -$ #DIV/0! #DIV/0!16 Paid 0.29 -$ #DIV/0! #DIV/0!
17 0 -$ #DIV/0! #DIV/0!
18 -$ #DIV/0!
19
20 #DIV/0!21 #DIV/0!22 #DIV/0!23 Misc. Includes G&A Revenue Letter Payment
24 -$ #DIV/0!
25 EXPENSES:
26 1 #DIV/0!27
28 2 #DIV/0!
29 3 -$ #DIV/0!
30 4 #DIV/0!
31 5 #DIV/0!
32 6
33
34 -$ #DIV/0!
35 -$ #DIV/0!
36 $0.00 #DIV/0!
SCNS SCHOOL SITE MONTHLY GAIN/LOSS
Percent Eating Daily To Attendance:
(1) Federal Reimbursement Received (Rates are Updated Annually in July).
Needy Breakfast Rates
Tot. Number "Breakfast" Meals Served
Tot. Number "Lunch" Meals Served
Total Reimbursement Due(2) Cash Daily Sales
Lunch -Cash Income - 116 EOM ReportBreakfast -Cash Income - 116 EOM ReportMisc. ALaCarte Cash Income - 116 EOM Report
Grand Tot.Cash Will Include Reimbursement Due + G&A Revenue Payment Rec'd.
Food - All Food Used By EOM Physical InventoryIncludes Purchased Food Loss/Food Bank Donation
Labor - Total Direct Labor Per Biometric Time Clock
* Grand Total EOM Expense Position:
* Grand Total EOM Revenue (Cash+Reimb.)
Directions: Goal is to operate a financially sound program by maintaining a daily/monthly gain.
School Site Management will enter data into the blank (yellow highlighted) fields relevant to the school location program each month using the SCN-D2 116 School Report. The 116 report will be sent from SCNS-Records & Reports each month.
Equipment Depreciation .22% to Lunch ADP
Other Direc - Supplies/Disposables/Fringe/Other
Indirect - KDE % Annual Assignment X Indirect Cost Base
Covers Cost of Chemicals/C.O. Adm./NSC-Drivers & Whs.
ADDITIONAL EXPENSES: Uncollected Student Charges
Enter 0 in # 6 if you have 0 charges to collect.

Other Reports• Summary Profit/Loss for Program – updated
monthly
• Summary Claim for Reimbursement – updated monthly
• Monthly/Annual Report for COO focusing on major KPIs; “War Room data”
• Others as needed/requested

School Breakfast Participation

School Lunch Participation

Lunch Participation by Eligibility

Breakfast Participation by Eligibility


QUESTIONS?