Embed Size (px)
Citation preview
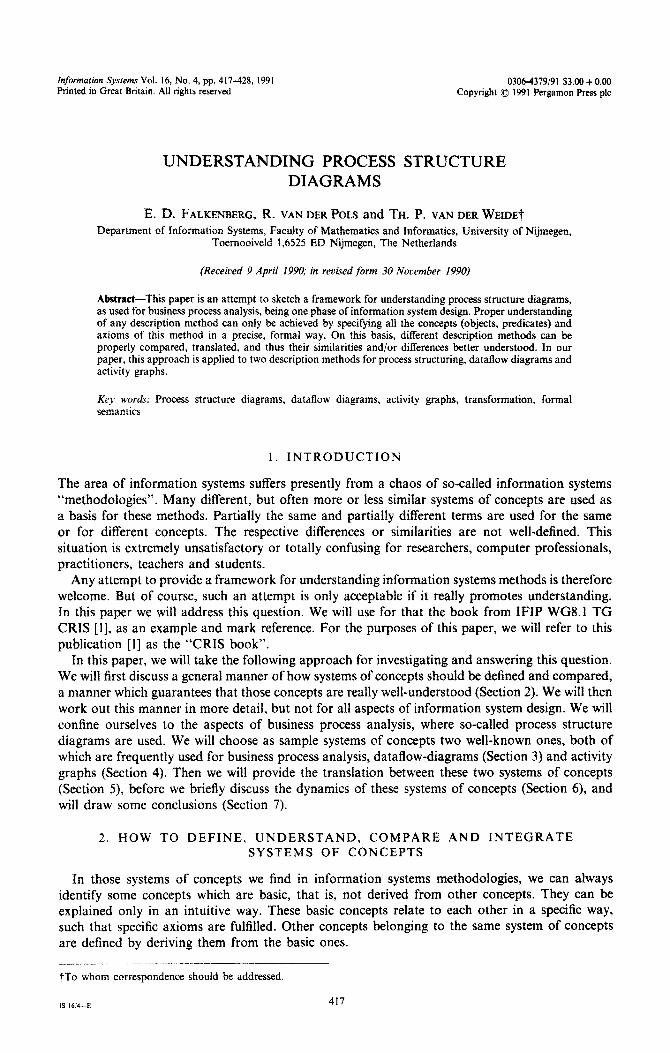
Injirma~ion Sysrems Vol. 16, No. 4, PP. 417-428, 1991 0306-4379/91 $3.00 + 0.00 Printed in Great Britain. All rights reserved Copyright 0 1991 Pergamon Press plc
UNDERSTANDING PROCESS STRUCTURE DIAGRAMS
E. D. FALKENBERG, R. VAN DER Pots and TH. P. VAN DER WEIDE~
Department of Info~ation Systems, Faculty of Mathematics and Informatics, University of Nijmegen, Toernooiveld 1,6525 ED Nijmegen, The Netherlands
(Received 9 April 1990; in revised form 30 November 1990)
Abstract-This paper is an attempt to sketch a framework for understanding process structure diagrams, as used for business process analysis, being one phase of info~ation system design. Proper undemanding of any description method can only be achieved by specifying all the concepts (objects, predicates) and axioms of this method in a precise, formal way. On this basis, different description methods can be properly compared, translated, and thus their similarities and/or differences better understood. In our paper, this approach is applied to two description methods for process structuring, dataflow diagrams and activity graphs.
Key words: process structure diagrams, dataflow diagrams, activity graphs, transfo~ation, formal semantics
I. INTRODUCTION
The area of information systems suffers presently from a chaos of so-called information systems “methodologies”. Many different, but often more or less similar systems of concepts are used as a basis for these methods. Partially the same and partially different terms are used for the same or for different concepts. The respective differences or similarities are not well-defined. This situation is extremely unsatisfactory or totally confusing for researchers, computer professionals, practitioners, teachers and students.
Any attempt to provide a framework for understanding info~ation systems methods is therefore welcome. But of course, such an attempt is only acceptable if it really promotes understanding. In this paper we will address this question. We will use for that the book from IFIP WGg.1 TG CRIS [l], as an example and mark reference. For the purposes of this paper, we will refer to this publication [l] as the “CRIS book”.
In this paper, we will take the following approach for investigating and answering this question. We will first discuss a general manner of how systems of concepts should be defined and compared, a manner which guarantees that those concepts are really well-understood (Section 2). We will then work out this manner in more detail, but not for all aspects of information system design. We will confine ourselves to the aspects of business process analysis, where so-called process structure diagrams are used. We will choose as sample systems of concepts two well-known ones, both of which are frequently used for business process analysis, dataflow-diagrams (Section 3) and activity graphs (Section 4). Then we will provide the translation between these two systems of concepts (Section 5), before we briefly discuss the dynamics of these systems of concepts (Section 61, and will draw some conclusions (Section 7).
2. HOW TO DEFINE, UNDERSTAND, COMPARE AND INTEGRATE SYSTEMS OF CONCEPTS
In those systems of concepts we find in information systems methodologies, we can always identify some concepts which are basic, that is, not derived from other concepts. They can be explained only in an intuitive way. These basic concepts relate to each other in a specific way, such that specific axioms are fulfilled. Other concepts belonging to the same system of concepts are defined by deriving them from the basic ones.
TO whom correspondence should be addressed.
IS I(i/CE 417
418 E. D. FALKENBERG et al.
From the above, it can be concluded that there are two components of understanding a system of concepts: an intuitive, dealing with the basic concepts (objects, predicates); and a derivable component, dealing with the rest. The fewer basic concepts there are, the larger the derivable component is, and the fewer the possibilities of misunderstanding due to faulty intuition are.
Understanding a system of concepts requires a description of its properties in terms of these concepts. These are usually formulated as axioms. These properties both deal with the well-formedness of specifications using this system of concepts, as well as with the dynamic behaviour of such a specification.
For understanding, it is not only essential to provide all the necessary axioms, but also the choice of the definition language is important. The language of mathematical logic is certainly superior with respect to precision of definition, compared to many other languages. On the other hand, graphical languages may be very useful to support understanding; that is the reason why they are so widely used. With respect to our question of defining and understanding systems of concepts, we think that a synthesis of both approaches is optimal; the language of mathematical logic for achieving precision, and a suitable, powerful graphical language for supporting understanding.
The similarities and/or differences of several systems of concepts can only be well-understood by providing for each one the proper, precise definitions, and then providing partial translations between them, using these definitions. In doing that, the differences, as well as the similarities or partial equalities will become clear, and terminological problems, synonym and/or homonym situations, may become resolvable.
The approach, for example followed in the CRIS book, is quite different. There, it has tried to “melt” concepts of various methods analytically into one “supersystem” of concepts. Whether such an analytical integration can be performed at all, is in general highly uncertain. Certainty can only be achieved in specific cases, by performing an in-depth analysis of the concepts of the various methods, and then trying to solve the view integration problems. In the CRIS book, only the objects and predicates are defined formally, leaving the question, what are basic and what are derivable predicates’ mostly open. Axioms are defined only informally, if at all. Neither an in-depth analysis of the systems of concepts used as “raw material” for that “supersystem”, nor of that “supersystem” itself, is performed. It is therefore impossible for the reader of the CRIS book to judge the validity of that “supersystem”.
The following specifications of dataflow diagrams and activity graphs, and their translation into each other, are meant only as a small example for illustrating the above considerations, only as far as well-formedness of specifications is concerned. We will discuss the dynamic aspects only briefly. A graphical language is not used in this paper, in order to keep its size small.
3. DATAFLOW DIAGRAMS
Dataflow diagrams are a widely accepted mechanism for modelling process structures during the early phases of information system design (business process analysis). Typical of these phases is a low level of formalization and a high level of user involvement. This makes is desirable to use a specification mechanism which is understandable for the non-technical user. On the other hand, the process model serves as a basis for further specification as is required for the conceptual model. For that, we need a clear semantics of the specification mechanism used.
In this section we present a first-order description of dataflow diagrams. This gives us a formal mechanism for reasoning about those diagrams, without accidentally taking advantage of properties which result from a specific representation. The style used is according to Falkenberg and van der Weide [2]. The term basic predicates is used to distinguish these from definable predicates.
We base our axiomatic description of dataflow diagrams on work by Gane and Sarson [3] and van der Pols [4]. Dataflow diagrams are built around two sorts of objects:
J&’ the set of so-called activators. 9 the set of so-called dataflows.
Understanding process structure diagrams 419
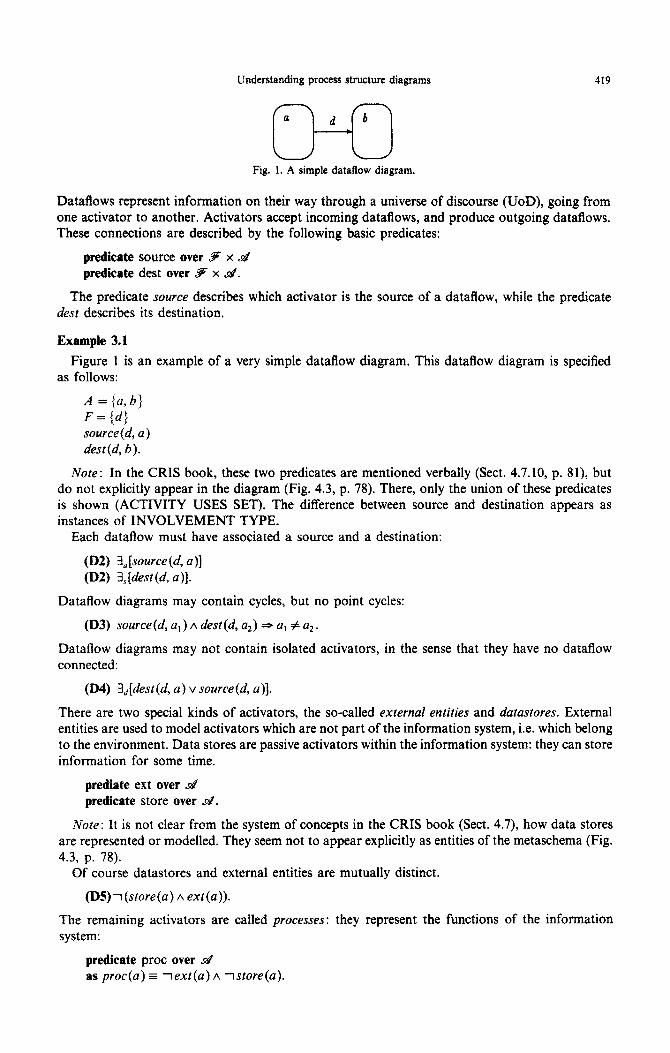
c!Y-cl Fig. 1. A simple dataAow diagram.
Dataflows represent information on their way through a universe of discourse (UoD), going from one activator to another. Activators accept incoming dataflows, and produce outgoing dataflows. These connections are described by the following basic predicates:
predicate source over 9 x d predicate dest over S x d.
The predicate source describes which activator is the source of a dataflow, while the predicate dest describes its destination.
Example 3.1
Figure 1 is an example of a very simple dataflow diagram. This dataflow diagram is specified as follows:
A = (u,6) F=(df source(d, a) dest(d, b).
Note: In the CRIS book, these two predicates are mentioned verbally (Sect. 4.7.10, p. 81) but do not explicitly appear in the diagram (Fig. 4.3, p. 78). There, only the union of these predicates is shown (ACTIVITY USES SET). The difference between source and destination appears as instances of INVOLVEMENT TYPE.
Each dataflow must have associated a source and a destination:
(D2) 3a [source (d, a)] (D2) 3,[dest(d, a)].
Dataflow diagrams may contain cycles, but no point cycles:
(D3) source(d, a, ) A dest(d, a*) =r a, # a2.
Dataflow diagrams may not contain isolated activators, in the sense that they have no dataflow connected:
(D4) &fdest(d, a) v source(d, a)].
There are two special kinds of activators, the so-called external entities and dutastores. External entities are used to model activators which are not part of the information system, i.e. which belong to the environment. Data stores are passive activators within the information system: they can store information for some time.
prediate ext over d predicate store over d.
Note: It is not clear from the system of concepts in the CRIS book (Sect. 4.7), how data stores are represented or modelled. They seem not to appear explicitly as entities of the metaschema (Fig. 4.3, p. 78).
Of course datastores and external entities are mutually distinct.
(D5)1 (store(u) A ext(a)).
The remaining activators are called processes: they represent the functions of the info~ation system:
predicate proc over d as proc(a) z iexr(a)A istore(
420 E. D. FALKENBERG et al.
The role of processes is further clarified by the requirement that in each dataflow a process must be involved. As a consequence, flow of data between external entities cannot be considered as part of the info~ation system. Furthe~ore, external entities may not access datastores directly. Finally, as datastores are considered as passive activators, it does not make sense to have a dataflow between datastores.
(Da) sowce(d, al) A dest(d, a*) *proc(a,) vproc(az).
According to axiom D4 activators are not isolated. For internal objects this requirement is strengthened as follows: internal activators have both inputs and outputs. For example, a read-only store would not make sense, as it is never filled, neither internally, nor from an external entity.
(D’l)Text(a) 3 !l,[de.st(d, a)] A $,[source(d, a)].
A direct consequence of this axiom is that an activator connected with only one dataflow is an external entity.
A powerful feature of dataflow diagrams is that they provide the opportunity for hierarchical decomposition of processes. We model this by introducing a predicate t_subproc. From the predicate t_subproc we derive the corresponding intransitive predicate subproc. Note that the other way around has the disadvantage that we have to introduce both ~_subproc and s~b~roc as basic predicates.
predicate t_subproc over d x d
where t-subproc(a,, u2) should be read as: a, contains u2 as a subprocess (at some level). The restriction to processes is expressed by:
@X3) ~-s~bproc(u,, uz) =+proc(u,) Aproc(a&
The imposed hierarchy forms a strict (but not total) partial order on processes:
(D9) t-subproc(a,, a,) * -I-wbproc(a2, a,) (DlO) t-subproc(u,, UJ A t_subproc(a2, a3) =r t_mbproc(a, , a3).
The corresponding intransitive predicate subproc is easily defined:
predicate subproc over d x JZZ’
as subproc(q , u2) E t_subproc(u, , u2) A 13,, [t_subproc(a, , a3) A t_subproc(a,, u2)].
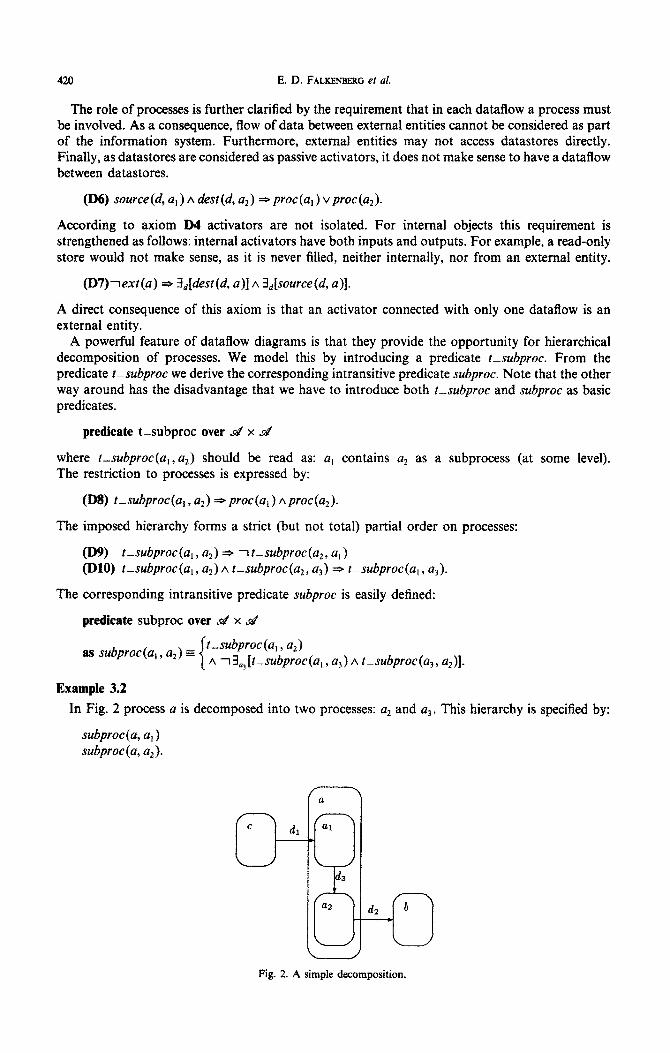
Example 3.2
In Fig. 2 process a is decomposed into two processes: u2 and a3, This hierarchy is specified by:
subprocfu, a, ) s~bproc (a, a, ).
Fig. 2. A simple decomposition.
Understanding process structure diagrams 421
The hierarchical nature can now be enforced by:
(Dll) ~~~~oc(u,, a) A ~~~~~oc~~~, a) =3 a, = az.
It will be convenient to introduce a predicate which tells if an activator has a decomposition:
predicate decomposed over d as decomposed(a) = 3,[tsubproc(a, b)].
A dataflow is created by a single process. So, if there are more creating processes, there must be a hierarchy:
(D12) ~~~~~e(~, Q,) A ~~~~ce(~, az) A a, # a2 =c- ~~~~~~oc(~, , a*) v t~~~pr~c~~~, al),
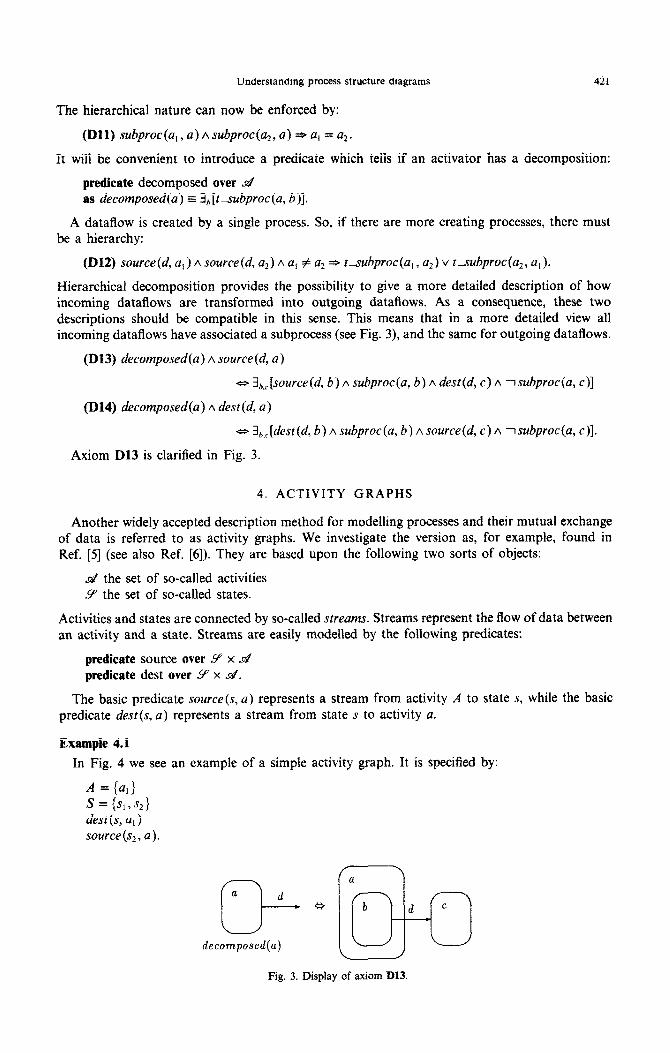
Hierarchical decomposition provides the possibility to give a more detailed description of how incoming dataflows are transformed into outgoing dataflows. As a consequence, these two descriptions should be compatible in this sense. This means that in a more detailed view all incoming dataflows have associated a subprocess (see Fig. 3), and the same for outgoing dataflows.
(D13) decomposed(a) A source(d, a)
o &.[source(d, 6) A subp~oc(~, b) A dest(d, c) A ls~~p~oc(u, c)]
@14) decomposed(~) A dest(d, a)
o &[dest(d, b) A subproc(a, b) A source(d, c) A lsubproc(a, c)].
Axiom D13 is clarified in Fig. 3.
4. ACTIVITY GRAPHS
Another widely accepted description method for modelhng processes and their mutual exchange of data is referred to as activity graphs. We investigate the version as, for example, found in Ref. [5] (see also Ref. [6]). They are based upon the following two sorts of objects:
d the set of so-called activities 9 the set of so-called states.
Activities and states are connected by so-called streams. Streams represent the flow of data between an activity and a state. Streams are easily modelled by the following predicates:
predicate source over Y x d predicate dest over Y x d.
The basic predicate source(s, a) represents a stream from activity A to state s, while the basic predicate dest(s, a) represents a stream from state s to activity a.
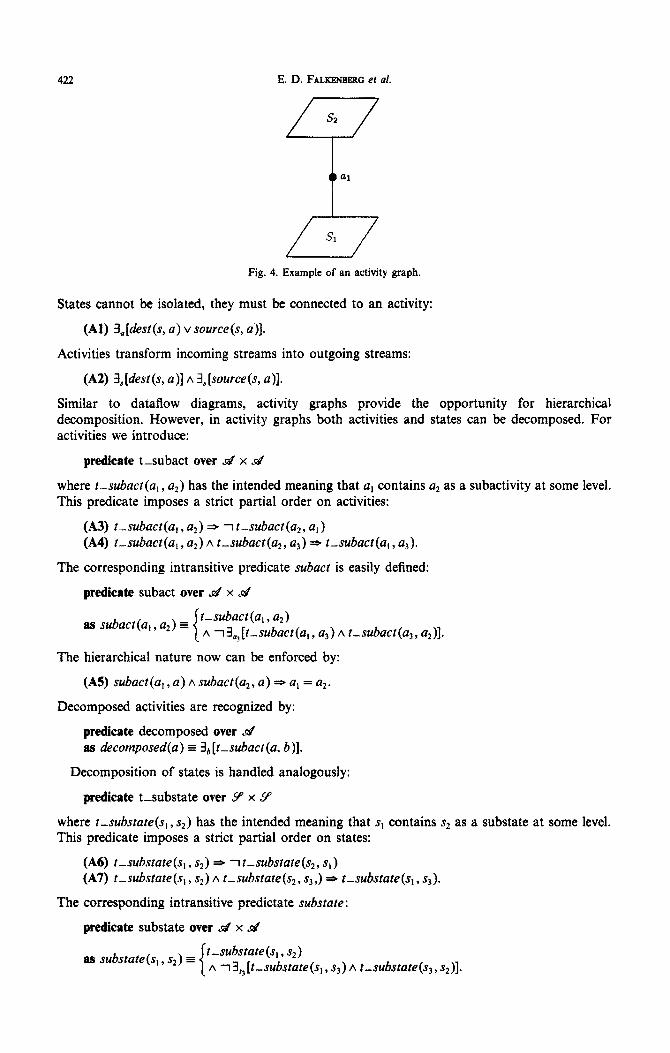
Example 4.1
In Fig. 4 we see an example of a simple activity graph. It is specified by:
A = (a, f S = (&S2) dest(s, a, ) source(s2, a).
decomposed(a)
Fig. 3. Display of axiom D13.
422 E. D. FALKENBERG et al.
Fig. 4. Example of an activity graph.
States cannot be isolated, they must be connected to an activity:
(Al) 3,[dest(s, a) v SOUIM(S, a)].
Activities transform incoming streams into outgoing streams:
(A2) 3,[dest(s, a)] A 3,[source(s, a)].
Similar to dataflow diagrams, activity graphs provide the opportunity for hierarchical d~omposition. However, in activity graphs both activities and states can be d~ompo~d. For activities we introduce:
predicate t-subact over ~9’ x .B’
where t-subact(a, , u2) has the intended meaning that a, contains u2 as a subactivity at some level. This predicate imposes a strict partial order on activities:
(A3) t_subuct(u,, al) e -7 t_subuct(u,, q) (A4) t_~~uct(u,, a*) A t_subact(u,, u3) =s- t_~~~uct(~~, a,).
The corresponding intransitive predicate subact is easily defined:
predicate subact over d x d
as subuct (a,, u2) = I t-subuct(u,) 632) A 13, [t_subuct (a,, u3) A t-subact(u3, uz)].
The hierarchical nature now can be enforced by:
(A5) subact (q , a) A subuet (a2, a) * a, = u2.
Decomposed activities are recognized by:
predicate decomposed over d as decomposed(u) E 3,[t_subact(u, b)].
Decomposition of states is handled analogously:
predicate t-substate over Y x Y
where t_substute(s,, s2) has the intended meaning that sI contains s2 as a substate at some level. This predicate imposes a strict partial order on states:
(A6) t_substute(s,, s2) a -1t_substute(s,, s,) (A7) t_substute(s,, x2) A t-substute(s,, s3,) * t_substute(s,, sj).
The corresponding intransitive predictate ~~b~t~te:
predicate substate over Ss x d
as substute(s,, s2) = I t-substute(s, , s2)
A i3,,[t-substute(s,, s,) A t-substute(q, sz)].
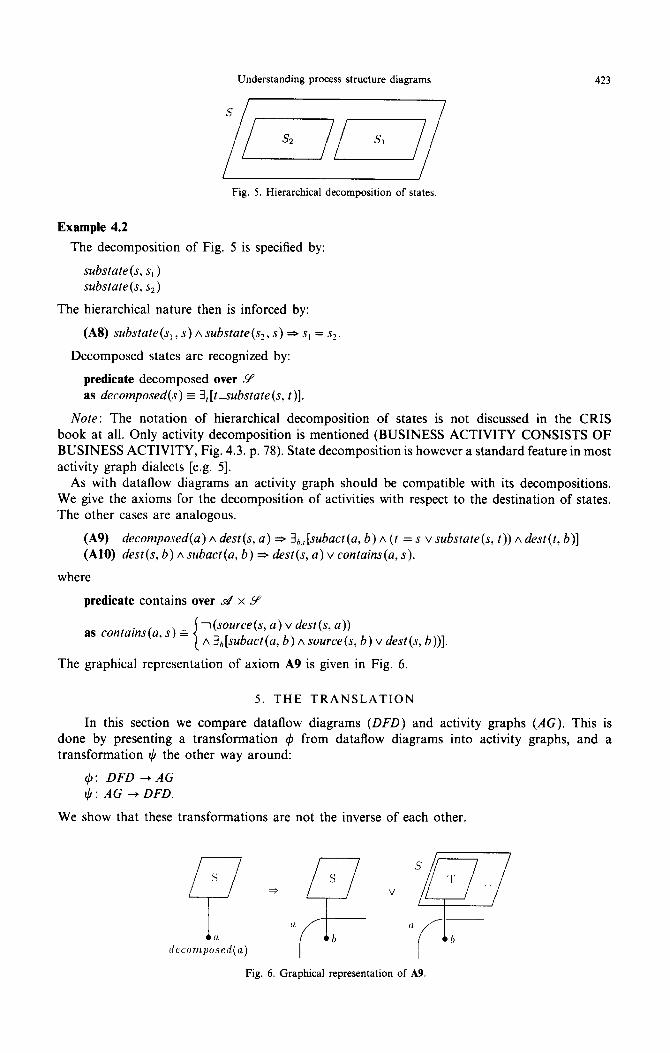
Understanding process structure diagrams 423
Example 4.2
The decomposition
substate (s, s, ) substate(s, s2)
/ / Fig. 5. Hierarchical decomposition of states.
of Fig. 5 is specified by:
The hierarchical nature then is inforced by:
(A8) substate (s, , s) A substate(s,, s) =a s, = s2.
Decomposed states are recognized by:
predicate decomposed over 9’ as decomposed(s) 5 3,[tsubstute(s, t)].
Note: The notation of hierarchical decomposition of states is not discussed in the CRIS book at all. Only activity decomposition is mentioned (BUSINESS ACTIVITY CONSISTS OF BUSINESS ACTIVITY, Fig. 4.3. p. 78). State decomposition is however a standard feature in most activity graph dialects [e.g. 51.
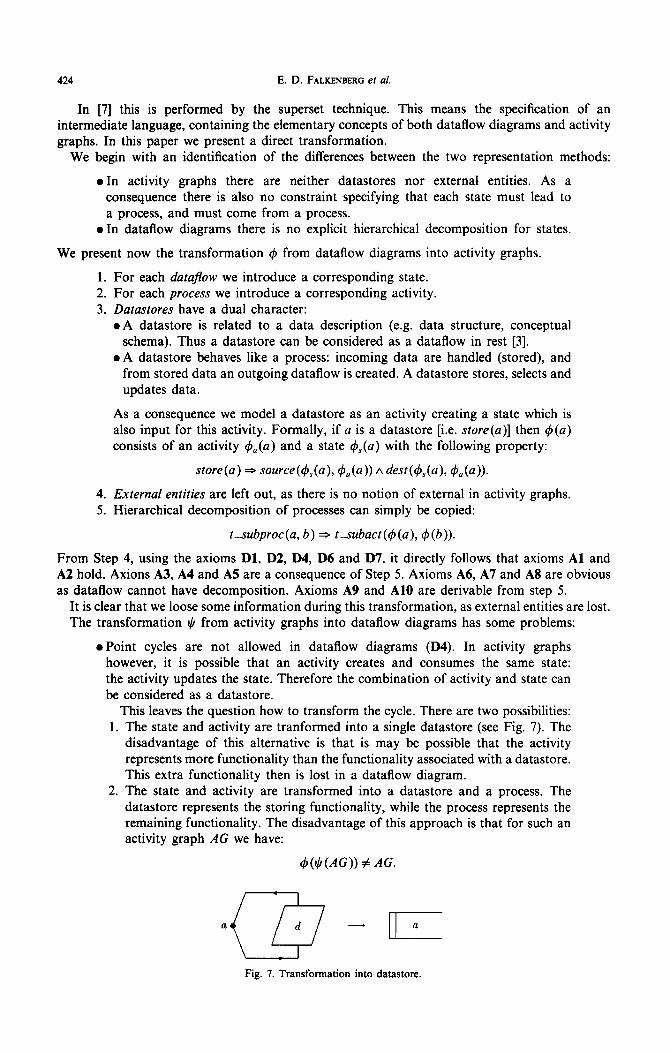
As with dataflow diagrams an activity graph should be compatible with its decompositions. We give the axioms for the decomposition of activities with respect to the destination of states. The other cases are analogous.
(A9) decomposed(a) A dest(s, a) = 3,,[subact(u, b) A (t = s v substute(s, t)) A dest(t, b)] (AlO) dest(s, 6) A subuct(u, b) =+ dest(s, a) v contuins(u, s).
where
predicate contains over d x Y
as confuins(u’ ‘) E i(source(s, a) v dest(s, a)) A 3,[subuct(u, b) A source(s, b) v dest(s, b))].
The graphical representation of axiom A9 is given in Fig. 6.
5. THE TRANSLATION
In this section we compare dataflow diagrams (DFD) and activity graphs (AG). This is done by presenting a transformation 4 from dataflow diagrams into activity graphs, and a transformation Ic/ the other way around:
4: DFD + AG $1 AG --t DFD.
We show that these transformations are not the inverse of each other.
Fig. 6. Graphical representation of A9.
424 E. D. FALKENBERG er al.
In [7j this is performed by the superset technique. This means the specification of an intermediate language, containing the elementary concepts of both dataflow diagrams and activity graphs. In this paper we present a direct transformation.
We begin with an identification of the differences between the two representation methods:
l In activity graphs there are neither datastores nor external entities. As a consequence there is also no constraint specifying that each state must lead to a process, and must come from a process.
l In dataflow diagrams there is no explicit hierarchical decomposition for states.
We present now the transformation 4 from dataflow diagrams into activity graphs.
1. 2. 3.
4. 5.
For each dataflow we introduce a corresponding state. For each process we introduce a corresponding activity. Datastores have a dual character: l A datastore is related to a data description (e.g. data structure, conceptual
schema). Thus a datastore can be considered as a dataflow in rest [3]. l A datastore behaves like a process: incoming data are handled (stored), and
from stored data an outgoing dataflow is created. A datastore stores, selects and updates data.
As a consequence we model a datastore as an activity creating a state which is also input for this activity. Formally, if a is a datastore [i.e. store(a)] then $(a) consists of an activity $O(a) and a state &(a) with the following property:
store(a) * sourN&( &(a)) A deNMa), 9,(a)).
External entities are left out, as there is no notion of external in activity graphs. Hierarchical decomposition of processes can simply be copied:
tsubproc(a, b) * tsubact(+(a), 4(b)).
From Step 4, using the axioms Dl, D2, D4, D6 and D7, it directly follows that axioms Al and A2 hold. Axions A3, A4 and A5 are a consequence of Step 5. Axioms A6, A7 and A8 are obvious as dataflow cannot have decomposition. Axioms A9 and A10 are derivable from step 5.
It is clear that we loose some information during this transformation, as external entities are lost. The transformation $ from activity graphs into dataflow diagrams has some problems:
l Point cycles are not allowed in dataflow diagrams (D4). In activity graphs however, it is possible that an activity creates and consumes the same state: the activity updates the state. Therefore the combination of activity and state can be considered as a datastore.
This leaves the question how to transform the cycle. There are two possibilities: 1. The state and activity are tranformed into a single datastore (see Fig. 7). The
disadvantage of this alternative is that is may be possible that the activity represents more functionality than the functionality associated with a datastore. This extra functionality then is lost in a dataflow diagram.
2. The state and activity are transformed into a datastore and a process. The datastore represents the storing functionality, while the process represents the remaining functionality. The disadvantage of this approach is that for such an activity graph AG we have:
4(1(1(AG)) ZAG.
a
CQ
d - I
a
Fig. 7. Transformation into datastore.
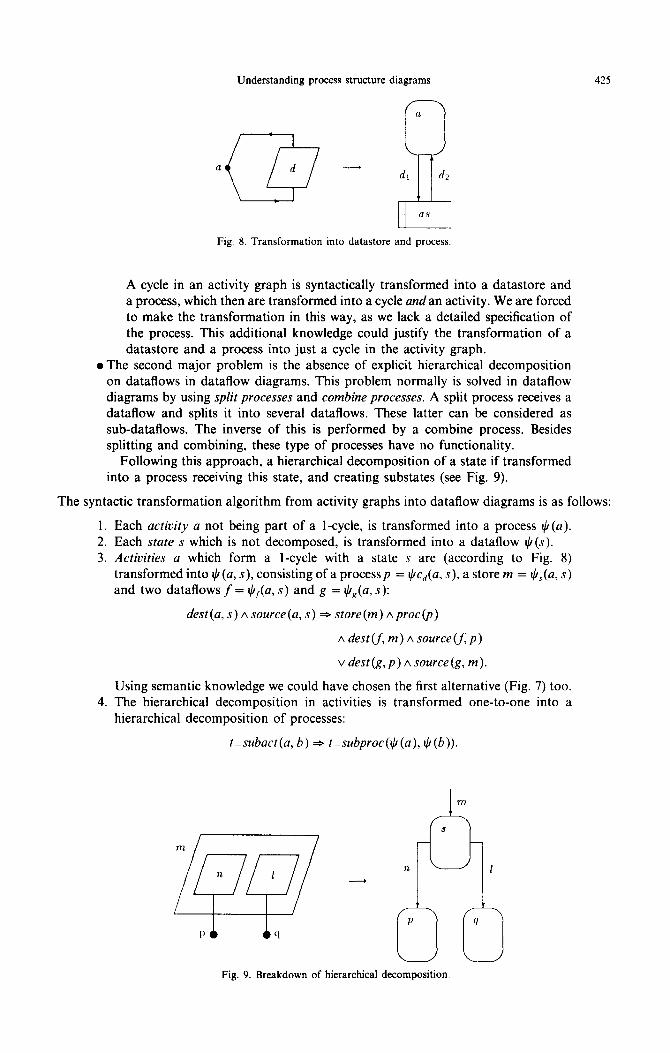
Understanding process structure diagrams 425
Fig. 8. Transformation into datastore and process.
A cycle in an activity graph is syntactically transformed into a datastore and a process, which then are transformed into a cycle andan activity. We are forced to make the transformation in this way, as we lack a detailed specification of the process. This additional knowledge could justify the transformation of a datastore and a process into just a cycle in the activity graph.
l The second major problem is the absence of explicit hierarchical decomposition on dataflows in dataflow diagrams. This problem normally is solved in dataflow diagrams by using split processes and combine processes. A split process receives a dataflow and splits it into several dataflows. These latter can be considered as sub-dataflows. The inverse of this is performed by a combine process. Besides splitting and combining, these type of processes have no functionality.
Following this approach, a hierarchical decomposition of a state if transformed into a process receiving this state, and creating substates (see Fig. 9).
The syntactic transformation algorithm from activity graphs into dataflow diagrams is as follows:
Each activity a not being part of a l-cycle, is transformed into a process $(a). Each state s which is not decomposed, is transformed into a dataflow e(s). Activities a which form a l-cycle with a state s are (according to Fig. 8) transformed into +(a, s), consisting of a processp = IC/cJa, s), a store m = $,(a, s) and two dataflows f = t~Q~(a, s) and g = $,(a, s):
dest(a, s) A source(a, s) =S store(m) ~proc(p)
A dest(f, m) A sourceCf,p)
v dest (g, p) A source (g, m).
Using semantic knowledge we could have chosen the first alternative (Fig. 7) too. The hierarchical decomposition in activities is transformed one-to-one into a hierarchical decomposition of processes:
t-subact (a, b) =S t_subproc(II/ (a), II/(b)).
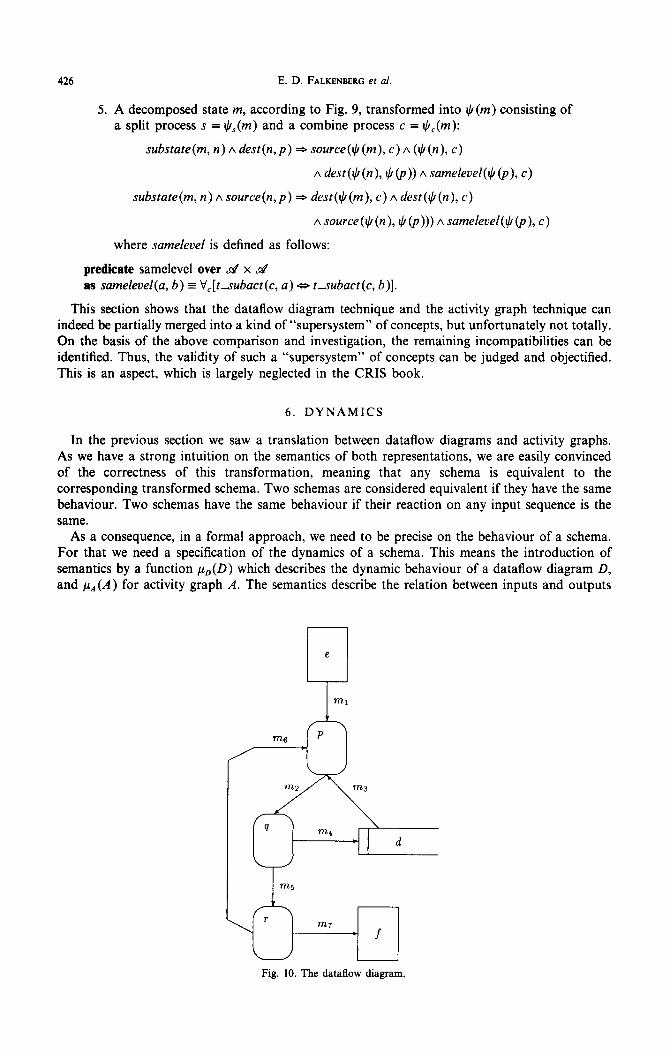
Fig. 9. Breakdown of hierarchical decomposition.
Im
426 E. D. FALKENBERG et al.
5. A decomposed state m, according to Fig. 9, transformed into $(m) consisting of a split process s = tjs(rn) and a combine process c = t,bC(m):
substate(m, n) A de@, p) * source(+ (m), c) A ($@I), c)
A dest ($ (n), $@I)) A samelevel($ (p), c)
substate(m, n) A source(n,p) * dest($(m), c) A dest($(n), c)
A source($(n), $(p))) A sameleuel(ll/(p), c)
where samelevel is defined as follows:
predicate samelevel over d x d as sumelevel(a, b) = V,[fsubact(c, a) 0 tsubact(c, !I)].
This section shows that the dataflow diagram technique and the activity graph technique can indeed be partially merged into a kind of “supersystem” of concepts, but unfortunately not totally. On the basis of the above comparison and investigation, the remaining incompatibilities can be identified. Thus, the validity of such a “supersystem” of concepts can be judged and objectified. This is an aspect, which is largely neglected in the CRIS book.
6. DYNAMICS
In the previous section we saw a translation between dataflow diagrams and activity graphs. As we have a strong intuition on the semantics of both representations, we are easily convinced of the correctness of this transformation, meaning that any schema is equivalent to the corresponding transformed schema. Two schemas are considered equivalent if they have the same behaviour. Two schemas have the same behaviour if their reaction on any input sequence is the same.
As a consequence, in a formal approach, we need to be precise on the behaviour of a schema. For that we need a specification of the dynamics of a schema. This means the introduction of semantics by a function p,(D) which describes the dynamic behaviour of a dataflow diagram D, and p,_,(A) for activity graph A. The semantics describe the relation between inputs and outputs
d
m5
m7 c f
Fig. 10. The dataflow diagram.
Understanding process structure diagrams 427
p: (ml - m2)
p:(m3-m2)
-----6p p : (m - m2)
m6 il 9
m5
m2 m3 &I 9: (mz - m5) m4
a q:(mz-+mr)
T : (m5 -+ me)
or T : (mg -+ m7)
Fig. 11. The corresponding PT-net.
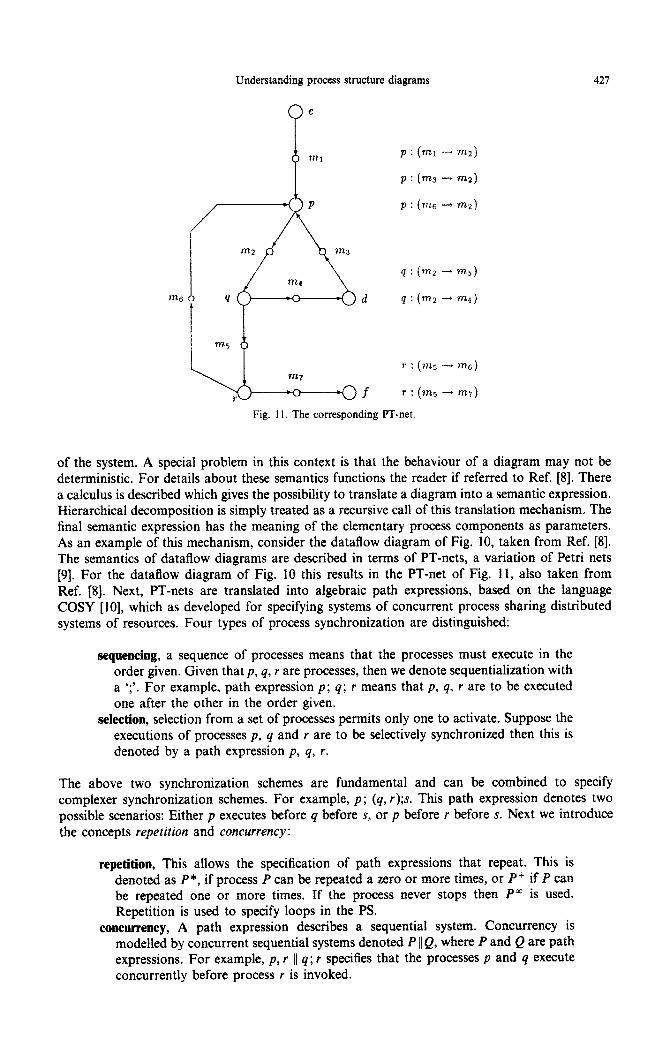
of the system. A special problem in this context is that the behaviour of a diagram may not be deterministic. For details about these semantics functions the reader if referred to Ref. [8]. There a calculus is described which gives the possibility to translate a diagram into a semantic expression. Hierarchical decomposition is simply treated as a recursive call of this translation mechanism. The final semantic expression has the meaning of the elementary process components as parameters. As an example of this mechanism, consider the dataflow diagram of Fig. 10, taken from Ref. [8]. The semantics of dataflow diagrams are described in terms of PT-nets, a variation of Petri nets [9]. For the dataflow diagram of Fig. 10 this results in the PT-net of Fig. 11, also taken from Ref. {8]. Next, PT-nets are translated into algebraic path expressions, based on the language COSY [lo], which as developed for specifying systems of concurrent process sharing distributed systems of resources. Four types of process synchronization are distinguished:
sequencing, a sequence of processes means that the processes must execute in the order given. Given that p, q, r are processes, then we denote sequentialization with a ‘;‘. For example, path expression p; q; r means that p. q, r are to be executed one after the other in the order given.
selection, selection from a set of processes permits only one to activate. Suppose the executions of processes p, q and r are to be selectively synchronized then this is denoted by a path expression p, q, r.
The above two synchronization schemes are fundamental and can be combined to specify complexer synchronization schemes. For example, p; (q, r);s. This path expression denotes two possibIe scenarios: Either p executes before q before s, or p before r before s. Next we introduce the concepts repetition and concurrency :
repetition, This allows the specification of path expressions that repeat. This is denoted as P*, if process P can be repeated a zero or more times, or P+ if P can be repeated one or more times. If the process never stops then P” is used. Repetition is used to specify loops in the PS.
concurrency, A path expression describes a sequential system. Concurrency is modelled by concurrent sequential systems denoted P /IQ, where P and Q are path expressions. For example, p, r I/ q; r specifies that the processes p and q execute concurrently before process r is invoked.
428 E. D. FALKENBERG et al.
The example in Fig. 11 leads to the following expression, describing the behaviour of the dataflow diagram of Fig. 10:
e; @; 4; (4p; 4)*; r)‘;J
The advantage of algebraic expressions is that they allow algebraic manipulation, for example:
p; (4, I) = (P; 4x @, I).
In the previous section we saw a transfo~ation (b(D) of a datafiow diagram D into an activity graph. This transformation only makes sense if we can show:
or, shorter,
For the reverse transformation $(A) of a activity graph A
PA = PD ’ ti
7. CONCLUSIONS
into a dataflow diagram we have:
In Section 5 we found, that the dataflow diagram technique and the activity graph technique can be partially integrated, but not totally. We showed where precisely the problems of transIating a specification following one technique into a (partially) equivalent specification, following the other technique, are. Thus, a partially integrated system of concepts, comprising parts of the dataflow diagram technique and parts of the activity graph technique, is possible, but a rest of compatibility remains.
In this paper, we have demonstrated the problems of compatibility and view intergation only for the case of two realtively simple business process analysis techniques. Without further demonstration, we can state with confidence that these kinds of problems become even larger when treating more sophisticated techniques for information system design, for example, for knowledge/information, task or behaviour analysis.
In order to find points of incompatibility and problems of view integration, it is essential to do an in-depth analysis of the systems of concepts in question. Only then one can speak of understanding those systems of concepts,
A shallow analysis on the other hand, as is provided, for example, in the CRIS book, leads to the faulty conclusion that there are no incompatibilities or view integration problems when trying to integrate “similar” systems of concepts, like those we used in this paper as examples. We stress that this type of shallow analysis as well as the resulting faulty conclusions are not useful for promoting the understanding of information system “methodologies”, it may even promote more confusion than ever.
REFERENCES
{l] T. W. Oile, J. Hageistein, I. G. McDonald, C. Roland, H. G. Sol, F. J. M. Van Assche and A. A. Verrijn-Stuart. lnfarmat~on System Methodo~agjes: A frame~vork for Un~rstand~ng. Addison-Wesley, Reading, MA (1988).
f2] E. D. Falkenberg and Th. P. van der Weide. Formal description of the TOP model. Technical Report 88-01, Vakgroep Info~atiesystemen, Univ. of Nijmegen, The Netherlands (1988).
[3] C. Gane and T. Sarson. Structures Svstem Analvsis: Tools and Techniaues. IST Databooks. MacDonald Dounias. . St Louis, MO (1986).
[71
PI
191 WI
R. van der Pals. The SSAD handbook. Technical Report, Digital Equipment BV, Utrecht, The Netherlands (1988). G. Scheschonk. Petri-Netze als formale Basis fiir Informationssysteme. Lecture Notes, Technical Univ. of Berlin, Germany (1984). G. Scheschonk. Eine auf Petri-Netzen basierende Konstruktions-, Analyseund veil-) Verificationsmethode zur Modellierungstunterstiitzung bei der Entwicklung von Informationssystemen. Ph.D. Thesis, Berlin Univ. of Technology, Germany (1984). R. van der Pals. Comparison of different information system techniques on a formal level. Master’s Thesis, Univ. of Nijmegen, The Netherlands (1988). P. D. Bruza and Th. P. van der Weide. The samantics of data flow diagrams. In Proc. At. Conf. on Management of Data, Hyderabad, India (1989). Peterson. Petri Net Theory. Prentice Hall, Englewood Chffs, NJ (1982). P. E. Lauer, P. R. Tor~~ani and M. W. Shields. Cost-a system s~ifi~tion language based on paths and processes. Acta Znformatica 12, 109-158 (1979).