Embed Size (px)
DESCRIPTION
Process Diagram
Citation preview

By Debangsu Bha acharyya, Joseph A. Shaeiwitz, Richard Turton, Wallace B. Whi ng
Date: Jul 3, 2012
Sample Chapter is provided courtesy of Pren ce Hall.
Return to the ar cle
This chapter covers different types of chemical process diagrams, how these diagrams represent different scales of process views, one
consistent method for drawing process flow diagrams, the informa on to be included in a process flow diagram, and the purpose of operator
training simulators and recent advances in 3‐D representa on of different chemical processes.
What You Will Learn
Different types of chemical process diagrams
How these diagrams represent different scales of process views
One consistent method for drawing process flow diagrams
The informa on to be included in a process flow diagram
The purpose of operator training simulators and recent advances in 3‐D representa on of different chemical processes
The chemical process industry (CPI) is involved in the produc on of a wide variety of products that improve the quality of our lives and
generate income for companies and their stockholders. In general, chemical processes are complex, and chemical engineers in industry
encounter a variety of chemical process flow diagrams. These processes o en involve substances of high chemical reac vity, high toxicity, and
high corrosivity opera ng at high pressures and temperatures. These characteris cs can lead to a variety of poten ally serious consequences,
including explosions, environmental damage, and threats to people’s health. It is essen al that errors or omissions resul ng from missed
communica on between persons and/or groups involved in the design and opera on do not occur when dealing with chemical processes.
Visual informa on is the clearest way to present material and is least likely to be misinterpreted. For these reasons, it is essen al that
chemical engineers be able to formulate appropriate process diagrams and be skilled in analyzing and interpre ng diagrams prepared by
others.
The most effec ve way of communica ng informa on about a process is through the use of flow diagrams.
This chapter presents and discusses the more common flow diagrams encountered in the chemical process industry. These diagrams evolve
from the me a process is conceived in the laboratory through the design, construc on, and the many years of plant opera on. The most
important of these diagrams are described and discussed in this chapter.
The following narra ve is taken from Kauffman [1] and describes a representa ve case history related to the development of a new chemical
process. It shows how teams of engineers work together to provide a plant design and introduces the types of diagrams that will be explored
in this chapter.
The research and development group at ABC Chemicals Company worked out a way to produce alpha‐beta souptol (ABS). Process
engineers assigned to work with the development group have pieced together a con nuous process for making ABS in commercial
quan es and have tested key parts of it. This work involved hundreds of block flow diagrams, some more complex than others. Based
on informa on derived from these block flow diagrams, a decision was made to proceed with this process.
A process engineering team from ABC’s central office carries out the detailed process calcula ons, material and energy balances,
equipment sizing, etc. Working with their dra ing department, they produced a series of PFDs (Process Flow Diagrams) for the
process. As problems arise and are solved, the team may revise and redraw the PFDs. O en the work requires several rounds of
drawing, checking, and revising.
Specialists in dis lla on, process control, kine cs, and heat transfer are brought in to help the process team in key areas. Some are
company employees and others are consultants.
Since ABC is only a moderate‐sized company, it does not have sufficient staff to prepare the 120 P&IDs (Piping and Instrumenta on
Diagrams) needed for the new ABS plant. ABC hires a well‐known engineering and construc on firm (E&C Company), DEFCo, to do this
work for them. The company assigns two of the ABC process teams to work at DEFCo to coordinate the job. DEFCo’s process engineers,
specialists, and dra ing department prepare the P&IDs. They do much of the detailed engineering (pipe sizes, valve specifica ons, etc.)
as well as the actual drawing. The job may take two to six months. Every drawing is reviewed by DEFCo’s project team and by ABC’s
team. If there are disagreements, the engineers and specialists from the companies must resolve them.
Finally, all the PFDs and the P&IDs are completed and approved. ABC can now go ahead with the construc on. They may extend their
contract with DEFCo to include this phase, or they may go out for construc on bids from a number of sources.
Diagrams for Understanding Chemical Processes | 1.1. Block Flow Diag... http://www.informit.com/articles/printerfriendly/1915161
1 of 34 18-Feb-14 12:29 PM

This narra ve describes a typical sequence of events taking a project from its ini al stages through plant construc on. If DEFCo had carried
out the construc on, ABC could go ahead and take over the plant or DEFCo could be contracted to carry out the start‐up and to commission
the plant. Once sa sfactory performance specifica ons have been met, ABC would take over the opera on of the plant and commercial
produc on would begin.
From concep on of the process to the me the plant starts up, two or more years will have elapsed and millions of dollars will have been
spent with no revenue from the plant. The plant must operate successfully for many years to produce sufficient income to pay for all plant
opera ons and to repay the costs associated with designing and building the plant. During this opera ng period, many unforeseen changes
are likely to take place. The quality of the raw materials used by the plant may change, product specifica ons may be raised, produc on rates
may need to be increased, the equipment performance will decrease because of wear, the development of new and be er catalysts will occur,
the costs of u li es will change, new environmental regula ons may be introduced, or improved equipment may appear on the market.
As a result of these unplanned changes, plant opera ons must be modified. Although the opera ng informa on on the original process
diagrams remains informa ve, the actual performance taken from the opera ng plant will be different. The current opera ng condi ons will
appear on updated versions of the various process diagrams, which will act as a primary basis for understanding the changes taking place in
the plant. These process diagrams are essen al to an engineer who has been asked to diagnose opera ng problems, solve problems in
opera ons, debo leneck systems for increased capacity, and predict the effects of making changes in opera ng condi ons. All these ac vi es
are essen al in order to maintain profitable plant opera on.
In this chapter, the focus is on three diagrams that are important to chemical engineers: block flow, process flow, and piping and
instrumenta on diagrams. Of these three diagrams, the most useful to chemical engineers is the PFD. The understanding of the PFD
represents a central goal of this textbook.
1.1. Block Flow Diagram (BFD)
Block flow diagrams were introduced early in the chemical engineering curriculum. In the first course in material and energy balances, o en
an ini al step was to convert a word problem into a simple block diagram. This diagram consisted of a series of blocks represen ng different
equipment or unit opera ons that were connected by input and output streams. Important informa on such as opera ng temperatures,
pressures, conversions, and yield was included on the diagram along with flowrates and some chemical composi ons. However, the diagram
did not include any details of equipment within any of the blocks.
The block flow diagram can take one of two forms. First, a block flow diagram may be drawn for a single process. Alterna vely, a block flow
diagram may be drawn for a complete chemical complex involving many different chemical processes. These two types of diagrams are
differen ated by calling the first a block flow process diagram and the second a block flow plant diagram.
1.1.1. Block Flow Process Diagram
An example of a block flow process diagram is shown in Figure 1.1, and the process illustrated is described below.
Figure 1.1. Block Flow Process Diagram for the Produc on of Benzene
Toluene and hydrogen are converted in a reactor to produce benzene and methane. The reac on does not go to comple on, and excess
toluene is required. The noncondensable gases are separated and discharged. The benzene product and the unreacted toluene are
then separated by dis lla on. The toluene is then recycled back to the reactor and the benzene removed in the product stream.
Diagrams for Understanding Chemical Processes | 1.1. Block Flow Diag... http://www.informit.com/articles/printerfriendly/1915161
2 of 34 18-Feb-14 12:29 PM

This block flow diagram gives a clear overview of the produc on of benzene, unobstructed by the many details related to the process. Each
block in the diagram represents a process func on and may, in reality, consist of several pieces of equipment. The general format and
conven ons used in preparing block flow process diagrams are presented in Table 1.1.
Table 1.1. Conven ons and Format Recommended for Laying Out a Block Flow Process Diagram
1. Opera ons shown by blocks.
2. Major flow lines shown with arrows giving direc on of flow.
3. Flow goes from le to right whenever possible.
4. Light stream (gases) toward top with heavy stream (liquids and solids) toward bo om.
5. Cri cal informa on unique to process supplied.
6. If lines cross, then the horizontal line is con nuous and the ver cal line is broken (hierarchy for alldrawings in this book).
7. Simplified material balance provided.
Although much informa on is missing from Figure 1.1, it is clear that such a diagram is very useful for “ge ng a feel” for the process. Block
flow process diagrams o en form the star ng point for developing a PFD. They are also very helpful in conceptualizing new processes and
explaining the main features of the process without ge ng bogged down in the details.
1.1.2. Block Flow Plant Diagram
An example of a block flow plant diagram for a complete chemical complex is illustrated in Figure 1.2. This block flow plant diagram is for a
coal to higher alcohol fuels plant. Clearly, this is a complicated process in which there are a number of alcohol fuel products produced from a
feedstock of coal. Each block in this diagram represents a complete chemical process (compressors and turbines are also shown as trapezoids),
and a block flow process diagram could be drawn for each block in Figure 1.2. The advantage of a diagram such as Figure 1.2 is that it allows a
complete picture of what this plant does and how all the different processes interact to be obtained. On the other hand, in order to keep the
diagram rela vely unclu ered, only limited informa on is available about each process unit. The conven ons for drawing block flow plant
diagrams are similar to Table 1.1.
Figure 1.2. Block Flow Plant Diagram of a Coal to Higher Alcohol Fuels Process
Both types of block flow diagrams are useful for explaining the overall opera on of chemical plants. For example, consider that you have just
Diagrams for Understanding Chemical Processes | 1.1. Block Flow Diag... http://www.informit.com/articles/printerfriendly/1915161
3 of 34 18-Feb-14 12:29 PM

joined a large chemical manufacturing company that produces a wide range of chemical products from the site to which you have been
assigned. You would most likely be given a block flow plant diagram to orient you to the products and important areas of opera on. Once
assigned to one of these areas, you would again likely be provided with a block flow process diagram describing the opera ons in your
par cular area.
In addi on to the orienta on func on described earlier, block flow diagrams are used to sketch out and screen poten al process alterna ves.
Thus, they are used to convey informa on necessary to make early comparisons and eliminate compe ng alterna ves without having to make
detailed and costly comparisons.
1.2. Process Flow Diagram (PFD)
The process flow diagram (PFD) represents a quantum step up from the BFD in terms of the amount of informa on that it contains. The PFD
contains the bulk of the chemical engineering data necessary for the design of a chemical process. For all of the diagrams discussed in this
chapter, there are no universally accepted standards. The PFD from one company will probably contain slightly different informa on from the
PFD for the same process from another company. Having made this point, it is fair to say that most PFDs convey very similar informa on. A
typical commercial PFD will contain the following informa on:
All the major pieces of equipment in the process will be represented on the diagram along with a descrip on of the equipment. Each
piece of equipment will have assigned a unique equipment number and a descrip ve name.
1.
All process flow streams will be shown and iden fied by a number. A descrip on of the process condi ons and chemical composi on
of each stream will be included. These data will be either displayed directly on the PFD or included in an accompanying flow summary
table.
2.
All u lity streams supplied to major equipment that provides a process func on will be shown.3.
Basic control loops, illustra ng the control strategy used to operate the process during normal opera ons, will be shown.4.
It is clear that the PFD is a complex diagram requiring a substan al effort to prepare. It is essen al that it should remain unclu ered and be
easy to follow, to avoid errors in presenta on and interpreta on. O en PFDs are drawn on large sheets of paper (for example, size D: 24 in ×
36 in), and several connected sheets may be required for a complex process. Because of the page size limita ons associated with this text,
complete PFDs cannot be presented here. Consequently, certain liber es have been taken in the presenta on of the PFDs in this text.
Specifically, certain informa on will be presented in accompanying tables, and only the essen al process informa on will be included on the
PFD. The resul ng PFDs will retain clarity of presenta on, but the reader must refer to the flow summary and equipment summary tables in
order to extract all the required informa on about the process.
Before the various aspects of the PFD are discussed, it should be noted that the PFD and the process that is described in this chapter will be
used throughout the book. The process is the hydrodealkyla on of toluene to produce benzene. This is a well‐studied and well‐understood
commercial process s ll used today. The PFD presented in this chapter for this process is technically feasible but is in no way op mized. In
fact, many improvements to the process technology and economic performance can be made. Many of these improvements will become
evident when the appropriate material is presented. This allows the techniques provided throughout this text to be applied both to iden fy
technical and economic problems in the process and to make the necessary process improvements. Therefore, throughout the text, weak
spots in the design, poten al improvements, and a path toward an op mized process flow diagram will be iden fied.
The basic informa on provided by a PFD can be categorized into one of the following:
Process topology1.
Stream informa on2.
Equipment informa on3.
Each aspect of the PFD will be considered separately. A er each of the three topics has been addressed, all the informa on will be gathered
and presented in the form of a PFD for the benzene process.
1.2.1. Process Topology
Figure 1.3 is a skeleton process flow diagram for the produc on of benzene (see also the block flow process diagram in Figure 1.1). This
skeleton diagram illustrates the loca on of the major pieces of equipment and the connec ons that the process streams make between
equipment. The loca on of and interac on between equipment and process streams are referred to as the process topology.
Diagrams for Understanding Chemical Processes | 1.1. Block Flow Diag... http://www.informit.com/articles/printerfriendly/1915161
4 of 34 18-Feb-14 12:29 PM

Figure 1.3. Skeleton Process Flow Diagram (PFD) for the Produc on of Benzene via the Hydrodealkyla on of Toluene
Equipment is represented symbolically by “icons” that iden fy specific unit opera ons. Although the American Society of Mechanical
Engineers (ASME) [2] publishes a set of symbols to use in preparing flowsheets, it is not uncommon for companies to use in‐house symbols. A
comprehensive set of symbols is also given by Aus n [3]. Whatever set of symbols is used, there is seldom a problem in iden fying the
opera on represented by each icon. Figure 1.4 contains a list of the symbols used in process diagrams presented in this text. This list covers
more than 90% of those needed in fluid (gas or liquid) processes.
Figure 1.4. Symbols for Drawing Process Flow Diagrams
Figure 1.3 shows that each major piece of process equipment is iden fied by a number on the diagram. A list of the equipment numbers along
with a brief descrip ve name for the equipment is printed along the top of the diagram. The loca on of these equipment numbers and names
roughly corresponds to the horizontal loca on of the corresponding piece of equipment. The conven on for forma ng and iden fying the
process equipment is given in Table 1.2.
Table 1.2. Conven ons Used for Iden fying Process Equipment
Process Equipment General Format XX‐YZZ A/B
XX are the iden fica on le ers for the equipment classifica on
C ‐ Compressor or Turbine
E ‐ Heat Exchanger
H ‐ Fired Heater
Diagrams for Understanding Chemical Processes | 1.1. Block Flow Diag... http://www.informit.com/articles/printerfriendly/1915161
5 of 34 18-Feb-14 12:29 PM
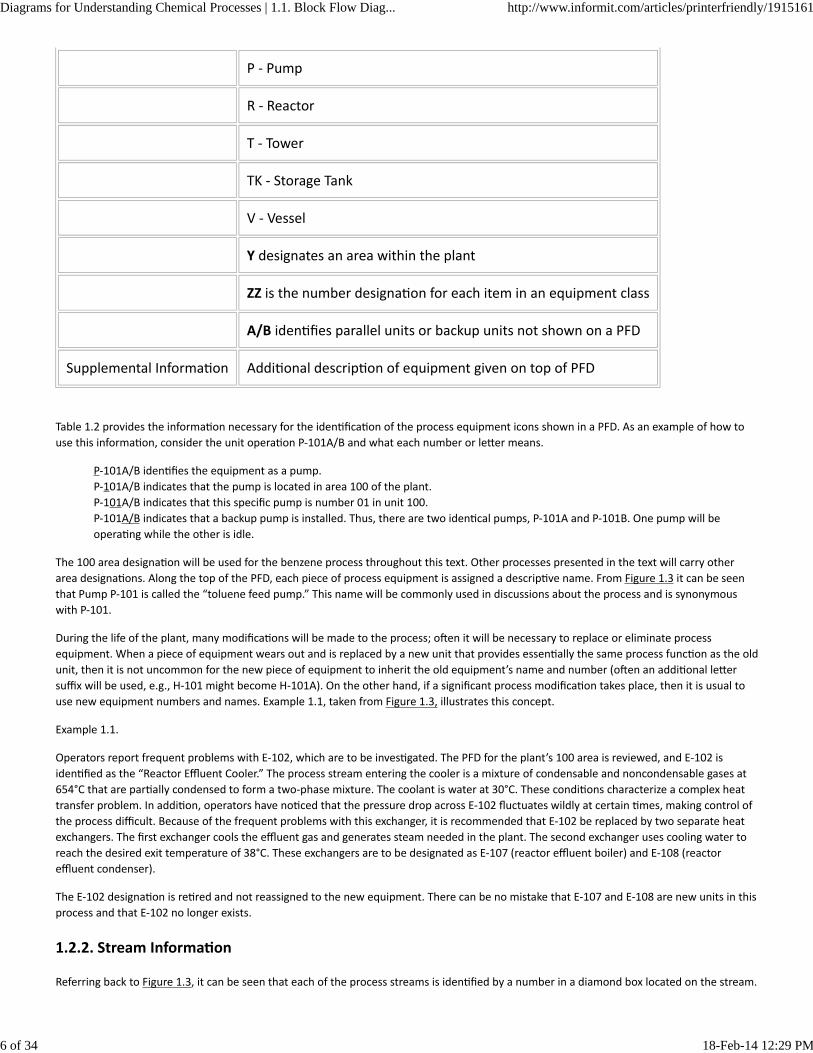
P ‐ Pump
R ‐ Reactor
T ‐ Tower
TK ‐ Storage Tank
V ‐ Vessel
Y designates an area within the plant
ZZ is the number designa on for each item in an equipment class
A/B iden fies parallel units or backup units not shown on a PFD
Supplemental Informa on Addi onal descrip on of equipment given on top of PFD
Table 1.2 provides the informa on necessary for the iden fica on of the process equipment icons shown in a PFD. As an example of how to
use this informa on, consider the unit opera on P‐101A/B and what each number or le er means.
P‐101A/B iden fies the equipment as a pump.
P‐101A/B indicates that the pump is located in area 100 of the plant.
P‐101A/B indicates that this specific pump is number 01 in unit 100.
P‐101A/B indicates that a backup pump is installed. Thus, there are two iden cal pumps, P‐101A and P‐101B. One pump will be
opera ng while the other is idle.
The 100 area designa on will be used for the benzene process throughout this text. Other processes presented in the text will carry other
area designa ons. Along the top of the PFD, each piece of process equipment is assigned a descrip ve name. From Figure 1.3 it can be seen
that Pump P‐101 is called the “toluene feed pump.” This name will be commonly used in discussions about the process and is synonymous
with P‐101.
During the life of the plant, many modifica ons will be made to the process; o en it will be necessary to replace or eliminate process
equipment. When a piece of equipment wears out and is replaced by a new unit that provides essen ally the same process func on as the old
unit, then it is not uncommon for the new piece of equipment to inherit the old equipment’s name and number (o en an addi onal le er
suffix will be used, e.g., H‐101 might become H‐101A). On the other hand, if a significant process modifica on takes place, then it is usual to
use new equipment numbers and names. Example 1.1, taken from Figure 1.3, illustrates this concept.
Example 1.1.
Operators report frequent problems with E‐102, which are to be inves gated. The PFD for the plant’s 100 area is reviewed, and E‐102 is
iden fied as the “Reactor Effluent Cooler.” The process stream entering the cooler is a mixture of condensable and noncondensable gases at
654°C that are par ally condensed to form a two‐phase mixture. The coolant is water at 30°C. These condi ons characterize a complex heat
transfer problem. In addi on, operators have no ced that the pressure drop across E‐102 fluctuates wildly at certain mes, making control of
the process difficult. Because of the frequent problems with this exchanger, it is recommended that E‐102 be replaced by two separate heat
exchangers. The first exchanger cools the effluent gas and generates steam needed in the plant. The second exchanger uses cooling water to
reach the desired exit temperature of 38°C. These exchangers are to be designated as E‐107 (reactor effluent boiler) and E‐108 (reactor
effluent condenser).
The E‐102 designa on is re red and not reassigned to the new equipment. There can be no mistake that E‐107 and E‐108 are new units in this
process and that E‐102 no longer exists.
1.2.2. Stream Informa on
Referring back to Figure 1.3, it can be seen that each of the process streams is iden fied by a number in a diamond box located on the stream.
Diagrams for Understanding Chemical Processes | 1.1. Block Flow Diag... http://www.informit.com/articles/printerfriendly/1915161
6 of 34 18-Feb-14 12:29 PM

The direc on of the stream is iden fied by one or more arrowheads. The process stream numbers are used to iden fy streams on the PFD,
and the type of informa on that is typically given for each stream is discussed in the next sec on.
Also iden fied in Figure 1.3 are u lity streams. U li es are needed services that are available at the plant. Chemical plants are provided with a
range of central u li es that include electricity, compressed air, cooling water, refrigerated water, steam, condensate return, inert gas for
blanke ng, chemical sewer, wastewater treatment, and flares. A list of the common services is given in Table 1.3, which also provides a guide
for the iden fica on of process streams.
Table 1.3. Conven ons for Iden fying Process and U lity Streams
Process Streams
All conven ons shown in Table 1.1 apply.
Diamond symbol located in flow lines.
Numerical iden fica on (unique for that stream) inserted in diamond.
Flow direc on shown by arrows on flow lines.
U lity Streams
lps Low‐Pressure Steam: 3–5 barg (sat)*
mps Medium‐Pressure Steam: 10–15 barg (sat)*
hps High‐Pressure Steam: 40–50 barg (sat)*
htm Heat Transfer Media (Organic): to 400°C
cw Cooling Water: From Cooling Tower 30°C Returned at Less than 45°C+
wr Water: From River 25°C Returned at Less than 35°C
rw Refrigerated Water: In at 5°C Returned at Less than 15°C
rb Refrigerated Brine: In at ‐45°C Returned at Less than 0°C
cs Chemical Wastewater with High COD
ss Sanitary Wastewater with High BOD, etc.
el Electric Heat (Specify 220, 440, 660V Service)
bfw Boiler Feed Water
ng Natural Gas
fg Fuel Gas
Diagrams for Understanding Chemical Processes | 1.1. Block Flow Diag... http://www.informit.com/articles/printerfriendly/1915161
7 of 34 18-Feb-14 12:29 PM

fo Fuel Oil
fw Fire Water
*These pressures are set during the preliminary design stages and typical values vary within the rangesshown.
+Above 45°C, significant scaling occurs.
Each u lity is iden fied by the ini als provided in Table 1.3. As an example, locate E‐102 in Figure 1.3. The nota on, cw, associated with the
nonprocess stream flowing into E‐102 indicates that cooling water is used as a coolant.
Electricity used to power motors and generators is an addi onal u lity that is not iden fied directly on the PFD or in Table 1.3 but is treated
separately. Most of the u li es shown are related to equipment that adds or removes heat within the process in order to control
temperatures. This is common for most chemical processes.
From the PFD in Figure 1.3, the iden fica on of the process streams is clear. For small diagrams containing only a few opera ons, the
characteris cs of the streams such as temperatures, pressures, composi ons, and flowrates can be shown directly on the figure, adjacent to
the stream. This is not prac cal for a more complex diagram. In this case, only the stream number is provided on the diagram. This indexes the
stream to informa on on a flow summary or stream table, which is o en provided below the process flow diagram. In this text the flow
summary table is provided as a separate a achment to the PFD.
The stream informa on that is normally given in a flow summary table is given in Table 1.4. It is divided into two groups—required
informa on and op onal informa on—that may be important to specific processes. The flow summary table, for Figure 1.3, is given in Table
1.5 and contains all the required informa on listed in Table 1.4.
Table 1.4. Informa on Provided in a Flow Summary
Required Informa on
Stream Number
Temperature (°C)
Pressure (bar)
Vapor Frac on
Total Mass Flowrate (kg/h)
Total Mole Flowrate (kmol/h)
Individual Component Flowrates (kmol/h)
Op onal Informa on
Component Mole Frac ons
Component Mass Frac ons
Diagrams for Understanding Chemical Processes | 1.1. Block Flow Diag... http://www.informit.com/articles/printerfriendly/1915161
8 of 34 18-Feb-14 12:29 PM

Individual Component Flowrates (kg/h)
Volumetric Flowrates (m3/h)
Significant Physical Proper es
Density
Viscosity
Other
Thermodynamic Data
Heat Capacity
Stream Enthalpy
K‐values
Stream Name
Table 1.5. Flow Summary Table for the Benzene Process Shown in Figure 1.3 (and Figure 1.5)
Stream
Number
1 2 3 4 5 6 7 8 9 10 11
Temperature
(°C)
25 59 25 225 41 600 41 38 654 90 147
Pressure
(bar)
1.90 25.8 25.5 25.2 25.5 25.0 25.5 23.9 24.0 2.6 2.8
VaporFrac on
0.0 0.0 1.00 1.0 1.0 1.0 1.0 1.0 1.0 0.0 0.0
Mass Flow
(tonne/h)
10.0 13.3 0.82 20.5 6.41 20.5 0.36 9.2 20.9 11.6 3.27
Mole Flow
(kmol/h)
108.7 144.2 301.0 1204.4 758.8 1204.4 42.6 1100.8 1247.0 142.2 35.7
ComponentFlowrates
(kmol/h)
Hydrogen 0.0 0.0 286.0 735.4 449.4 735.4 25.2 651.9 652.6 0.02 0.0
Methane 0.0 0.0 15.0 317.3 302.2 317.3 16.95 438.3 442.3 0.88 0.0
Diagrams for Understanding Chemical Processes | 1.1. Block Flow Diag... http://www.informit.com/articles/printerfriendly/1915161
9 of 34 18-Feb-14 12:29 PM

Benzene 0.0 1.0 0.0 7.6 6.6 7.6 0.37 9.55 116.0 106.3 1.1
Toluene 108.7 143.2 0.0 144.0 0.7 144.0 0.04 1.05 36.0 35.0 34.6
With informa on from the PFD (Figure 1.3) and the flow summary table (Table 1.5), problems regarding material balances and other problems
are easily analyzed. Example 1.2 and Example 1.3 are provided to offer experience in working with informa on from the PFD.
Example 1.2.
Check the overall material balance for the benzene process shown in Figure 1.3. From the figure, iden fy the input streams as Stream 1
(toluene feed) and Stream 3 (hydrogen feed) and the output streams as Stream 15 (product benzene) and Stream 16 (fuel gas). From the flow
summary table, these flows are listed as (units are in (103 kg)/h):
Click to view larger image
Balance is achieved since Output = Input.
Example 1.3.
Determine the conversion per pass of toluene to benzene in R‐101 in Figure 1.3. Conversion is defined as
ε = (benzene produced)/(total toluene introduced)
From the PFD, the input streams to R‐101 are shown as Stream 6 (reactor feed) and Stream 7 (recycle gas quench), and the output stream is
Stream 9 (reactor effluent stream). From the informa on in Table 1.5 (units are kmol/h):
Toluene introduced = 144 (Stream 6) + 0.04 (Stream 7) = 144.04 kmol/h
Benzene produced = 116 (Stream 9) – 7.6 (Stream 6) – 0.37 (Stream 7)
= 108.03 kmol/h
ε = 108.03/144.04 = 0.75
Alterna vely, the following can be wri en:
Moles of benzene produced = Toluene in – Toluene out = 144.04 – 36.00
= 108.04 kmol/h
ε = 108.04/144.04 = 0.75
1.2.3. Equipment Informa on
The final element of the PFD is the equipment summary. This summary provides the informa on necessary to es mate the costs of
equipment and furnish the basis for the detailed design of equipment. Table 1.6 provides the informa on needed for the equipment summary
for most of the equipment encountered in fluid processes.
Table 1.6. Equipment Descrip ons for PFD and P&IDs
Equipment Type
Descrip on of Equipment
Diagrams for Understanding Chemical Processes | 1.1. Block Flow Diag... http://www.informit.com/articles/printerfriendly/1915161
10 of 34 18-Feb-14 12:29 PM

Towers
Size (height and diameter), Pressure, Temperature
Number and Type of Trays
Height and Type of Packing
Materials of Construc on
Heat Exchangers
Type: Gas‐Gas, Gas‐Liquid, Liquid‐Liquid, Condenser, Vaporizer
Process: Duty, Area, Temperature, and Pressure for both streams
Number of Shell and Tube Passes
Materials of Construc on: Tubes and Shell
Tanks and Vessels
Height, Diameter, Orienta on, Pressure, Temperature, Materials of Construc on
Pumps
Flow, Discharge Pressure, Temperature, ΔP, Driver Type, Sha Power, Materials of Construc on
Compressors
Actual Inlet Flowrate, Temperature, Pressure, Driver Type, Sha Power,
Materials of Construc on
Heaters (Fired)
Type, Tube Pressure, Tube Temperature, Duty, Fuel, Material of Construc on
Other
Provide Cri cal Informa on
The informa on presented in Table 1.6 is used in preparing the equipment summary por on of the PFD for the benzene process. The
equipment summary for the benzene process is presented in Table 1.7, and details of how to es mate and choose various equipment
parameters are discussed in Chapter 11.
Table 1.7. Equipment Summary for Toluene Hydrodealkyla on PFD
Heat Exchangers E‐101 E‐102 E‐103 E‐104 E‐105 E‐106
Diagrams for Understanding Chemical Processes | 1.1. Block Flow Diag... http://www.informit.com/articles/printerfriendly/1915161
11 of 34 18-Feb-14 12:29 PM

Type Fl.H. Fl.H. MDP Fl.H. MDP Fl.H.
Area (m2) 36 763 11 35 12 80
Duty (MJ/h) 15,190 46,660 1055 8335 1085 9045
Shell
Temp. (°C) 225 654 160 112 112 185
Pres. (bar) 26 24 6 3 3 11
Phase Vap. Par. Cond. Cond. Cond. l Cond.
MOC 316SS 316SS CS CS CS CS
Tube
Temp. (°C) 258 40 90 40 40 147
Pres. (bar) 42 3 3 3 3 3
Phase Cond. l l l l Vap.
MOC 316SS 316SS CS CS CS CS
Vessels/Tower/Reactors
V‐101 V‐102 V‐103 V‐104 T‐101 R‐101
Temperature (°C) 55 38 38 112 147 660
Pressure (bar) 2.0 24 3.0 2.5 3.0 25
Orienta on Horizontal Ver cal Ver cal Horizontal Ver cal Ver cal
MOC CS CS CS CS CS 316SS
Size
Height/Length (m) 5.9 3.5 3.5 3.9 29 14.2
Diameter (m) 1.9 1.1 1.1 1.3 1.5 2.3
Internals s.p. s.p. 42
sieve
trays316SS
Catalyst
packed
bed‐10m
Pumps/Compressors P‐101 (A/B) P‐102 (A/B) C‐101 (A/B) Heater H‐101
Diagrams for Understanding Chemical Processes | 1.1. Block Flow Diag... http://www.informit.com/articles/printerfriendly/1915161
12 of 34 18-Feb-14 12:29 PM

Flow (kg/h) 13,000 22,700 6770 Type Fired
Fluid Density
(kg/m3)
870 880 8.02 MOC 316SS
Power (sha ) (kW) 14.2 3.2 49.1 Duty
(MJ/h)
27,040
Type/Drive Recip./Electric Centrf./Electric Centrf./Electric Radiant
Area (m2)
106.8
Efficiency (Fluid
Power/Sha Power)
0.75 0.50 0.75 Convec ve
Area (m2)
320.2
MOC CS CS CS Tube P
(bar)
26.0
Temp. (in) (°C) 55 112 38
Pres. (in) (bar) 1.2 2.2 23.9
Pres. (out) (bar) 27.0 4.4 25.5
Key:
MOC Materials ofconstruc on
Par Par al
316SS Stainless steel
type 316
F.H. Fixed head
CS Carbon steel Fl.H. Floa ng head
Vap Stream being
vaporized
Rbl Reboiler
Cond Stream being
condensed
s.p. Splash plate
Recipr. Reciproca ng l Liquid
Centrf. Centrifugal MDP Mul ple
double pipe
1.2.4. Combining Topology, Stream Data, and Control Strategy to Give a PFD
Up to this point, the amount of process informa on displayed on the PFD has been kept to a minimum. A more representa ve example of a
PFD for the benzene process is shown in Figure 1.5. This diagram includes all of the elements found in Figure 1.3, some of the informa on
Diagrams for Understanding Chemical Processes | 1.1. Block Flow Diag... http://www.informit.com/articles/printerfriendly/1915161
13 of 34 18-Feb-14 12:29 PM

found in Table 1.5, plus addi onal informa on on the major control loops used in the process.
Figure 1.5. Benzene Process Flow Diagram (PFD) for the Produc on of Benzene via the Hydrodealkyla on of Toluene
Stream informa on is added to the diagram by a aching “informa on flags.” The shape of the flags indicates the specific informa on
provided on the flag. Figure 1.6 illustrates all the flags used in this text. These informa on flags play a dual role. They provide informa on
needed in the plant design leading to plant construc on and in the analysis of opera ng problems during the life of the plant. Flags are
mounted on a staff connected to the appropriate process stream. More than one flag may be mounted on a staff. Example 1.4 illustrates the
different informa on displayed on the PFD.
Figure 1.6. Symbols for Stream Iden fica on
Example 1.4.
Locate Stream 1 in Figure 1.5 and note that immediately following the stream iden fica on diamond a staff is affixed. This staff carries three
flags containing the following stream data:
Temperature of 25°C1.
Pressure of 1.9 bar2.
Mass flowrate of 10.0 × 10³ kg/h3.
The units for each process variable are indicated in the key provided at the le ‐hand side of Figure 1.5.
With the addi on of the process control loops and the informa on flags, the PFD starts to become clu ered. Therefore, in order to preserve
clarity, it is necessary to limit what data are presented with these informa on flags. Fortunately, flags on a PFD are easy to add, remove, and
change, and even temporary flags may be provided from me to me.
The informa on provided on the flags is also included in the flow summary table. However, o en it is far more convenient when analyzing the
PFD to have certain data directly on the diagram.
Diagrams for Understanding Chemical Processes | 1.1. Block Flow Diag... http://www.informit.com/articles/printerfriendly/1915161
14 of 34 18-Feb-14 12:29 PM

Not all process informa on is of equal importance. General guidelines for what data should be included in informa on flags on the PFD are
difficult to define. However, at a minimum, informa on cri cal to the safety and opera on of the plant should be given. This includes
temperatures and pressures associated with the reactor, flowrates of feed and product streams, and stream pressures and temperatures that
are substan ally higher than the rest of the process. Addi onal needs are process specific. Examples 1.5–1.7 illustrate where and why
informa on should be included directly on a PFD.
Example 1.5.
Acrylic acid is temperature sensi ve and polymerizes at 90°C when present in high concentra on. It is separated by dis lla on and leaves
from the bo om of the tower. In this case, a temperature and pressure flag would be provided for the stream leaving the reboiler.
Example 1.6.
In the benzene process, the feed to the reactor is substan ally ho er than the rest of the process and is crucial to the opera on of the
process. In addi on, the reac on is exothermic, and the reactor effluent temperature must be carefully monitored. For this reason Stream 6
(entering) and Stream 9 (leaving) have temperature flags.
Example 1.7.
The pressures of the streams to and from R‐101 in the benzene process are also important. The difference in pressure between the two
streams gives the pressure drop across the reactor. This, in turn, gives an indica on of any maldistribu on of gas through the catalyst beds.
For this reason, pressure flags are also included on Streams 6 and 9.
Of secondary importance is the fact that flags are useful in reducing the size of the flow summary table. For pumps, compressors, and heat
exchangers, the mass flows are the same for the input and output streams, and complete entries in the stream table are not necessary. If the
input (or output) stream is included in the stream table, and a flag is added to provide the temperature (in the case of a heat exchanger) or
the pressure (in the case of a pump) for the other stream, then there is no need to present this stream in the flow summary table. Example
1.8 illustrates this point.
Example 1.8.
Follow Stream 13 leaving the top of the benzene column in the benzene PFD given in Figure 1.5 and in Table 1.5. This stream passes through
the benzene condenser, E‐104, into the reflux drum, V‐104. The majority of this stream then flows into the reflux pump, P‐102, and leaves as
Stream 14, while the remaining noncondensables leave the reflux drum in Stream 19. The mass flowrate and component flowrates of all these
streams are given in Table 1.5. The stream leaving E‐104 is not included in the stream table. Instead, a flag giving the temperature (112°C) was
provided on the diagram (indica ng condensa on without subcooling). An addi onal flag, showing the pressure following the pump, is also
shown. In this case the entry for Stream 14 could be omi ed from the stream table, because it is simply the sum of Streams 12 and 15, and no
informa on would be lost.
More informa on could be included in Figure 1.5 had space for the diagram not been limited by text format. It is most important that the PFD
remain unclu ered and easy to follow in order to avoid errors and misunderstandings. Adding addi onal material to Figure 1.5 risks sacrificing
clarity.
The flow table presented in Table 1.5, the equipment summary presented in Table 1.7, and Figure 1.5 taken together cons tute all the
informa on contained on a commercially produced PFD.
The PFD is the first comprehensive diagram drawn for any new plant or process. It provides all of the informa on needed to understand the
chemical process. In addi on, sufficient informa on is given on the equipment, energy, and material balances to establish process control
protocol and to prepare cost es mates to determine the economic viability of the process.
Many addi onal drawings are needed to build the plant. All the process informa on required can be taken from this PFD. As described in the
narra ve at the beginning of this chapter, the development of the PFD is most o en carried out by the opera ng company. Subsequent
ac vi es in the design of the plant are o en contracted out.
The value of the PFD does not end with the construc on of the plant. It remains the document that best describes the process, and it is used
in the training of operators and new engineers. It is consulted regularly to diagnose opera ng problems that arise and to predict the effects of
changes on the process.
1.3. Piping and Instrumenta on Diagram (P&ID)
The piping and instrumenta on diagram (P&ID), also known as mechanical flow diagram (MFD), provides informa on needed by engineers to
begin planning for the construc on of the plant. The P&ID includes every mechanical aspect of the plant except the informa on given in Table
1.8. The general conven ons used in drawing P&IDs are given in Table 1.9.
Diagrams for Understanding Chemical Processes | 1.1. Block Flow Diag... http://www.informit.com/articles/printerfriendly/1915161
15 of 34 18-Feb-14 12:29 PM

Table 1.8. Exclusions from Piping and Instrumenta on Diagram
1. Opera ng Condi ons T, P
2. Stream Flows
3. Equipment Loca ons
4. Pipe Rou ng
Pipe Lengthsa.
Pipe Fi ngsb.
5. Supports, Structures, and Founda ons
Table 1.9. Conven ons in Construc ng Piping and Instrumenta on Diagrams
For Equipment—Show Every Piece Including
Spare Units
Parallel Units
Summary Details of Each Unit
For Piping—Include All Lines Including Drains and Sample Connec ons, and Specify
Size (Use Standard Sizes)
Schedule (Thickness)
Materials of Construc on
Insula on (Thickness and Type)
For Instruments—Iden fy
Indicators Recorders Controllers Show Instrument Lines
For U li es—Iden fy
Entrance U li es Exit U li es Exit to Waste Treatment Facili es
Each PFD will require many P&IDs to provide the necessary data. Figure 1.7 is a representa ve P&ID for the dis lla on sec on of the benzene
process shown in Figure 1.5. The P&ID presented in Figure 1.7 provides informa on on the piping, and this is included as part of the diagram.
As an alterna ve, each pipe can be numbered, and the specifics of every line can be provided in a separate table accompanying this diagram.
When possible, the physical size of the larger‐sized unit opera ons is reflected by the size of the symbol in the diagram.
Diagrams for Understanding Chemical Processes | 1.1. Block Flow Diag... http://www.informit.com/articles/printerfriendly/1915161
16 of 34 18-Feb-14 12:29 PM
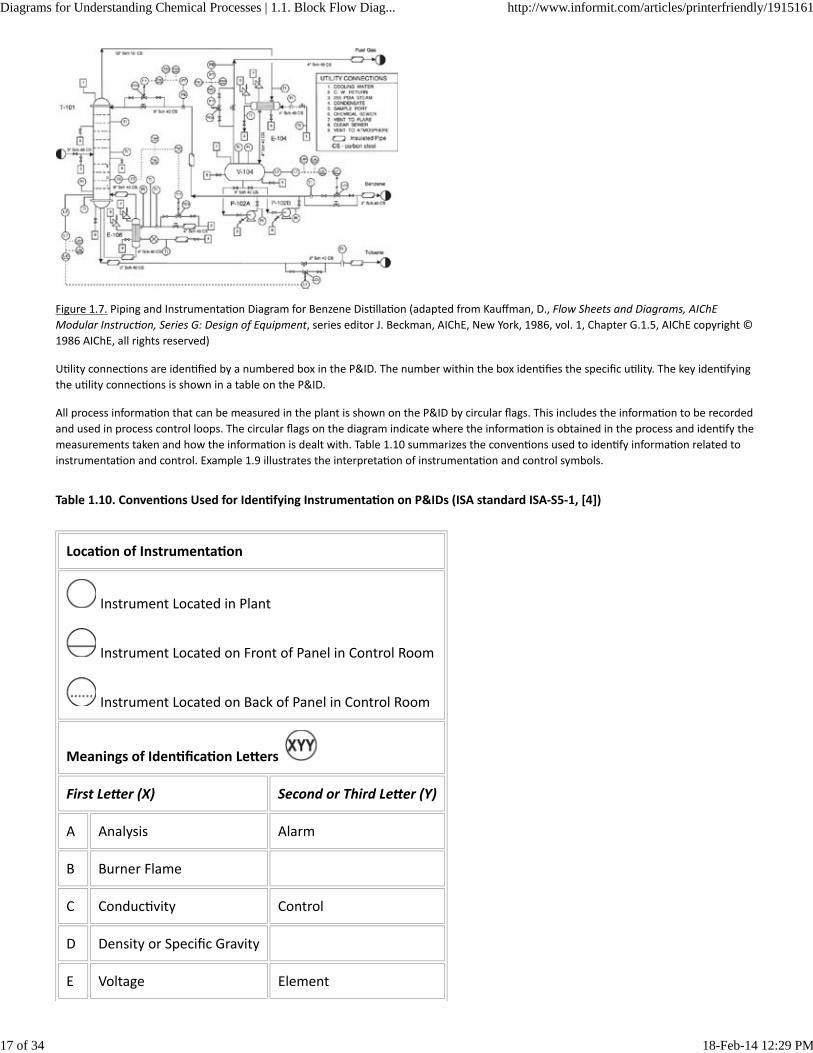
Figure 1.7. Piping and Instrumenta on Diagram for Benzene Dis lla on (adapted from Kauffman, D., Flow Sheets and Diagrams, AIChE
Modular Instruc on, Series G: Design of Equipment, series editor J. Beckman, AIChE, New York, 1986, vol. 1, Chapter G.1.5, AIChE copyright ©
1986 AIChE, all rights reserved)
U lity connec ons are iden fied by a numbered box in the P&ID. The number within the box iden fies the specific u lity. The key iden fying
the u lity connec ons is shown in a table on the P&ID.
All process informa on that can be measured in the plant is shown on the P&ID by circular flags. This includes the informa on to be recorded
and used in process control loops. The circular flags on the diagram indicate where the informa on is obtained in the process and iden fy the
measurements taken and how the informa on is dealt with. Table 1.10 summarizes the conven ons used to iden fy informa on related to
instrumenta on and control. Example 1.9 illustrates the interpreta on of instrumenta on and control symbols.
Table 1.10. Conven ons Used for Iden fying Instrumenta on on P&IDs (ISA standard ISA‐S5‐1, [4])
Loca on of Instrumenta on
Instrument Located in Plant
Instrument Located on Front of Panel in Control Room
Instrument Located on Back of Panel in Control Room
Meanings of Iden fica on Le ers
First Le er (X) Second or Third Le er (Y)
A Analysis Alarm
B Burner Flame
C Conduc vity Control
D Density or Specific Gravity
E Voltage Element
Diagrams for Understanding Chemical Processes | 1.1. Block Flow Diag... http://www.informit.com/articles/printerfriendly/1915161
17 of 34 18-Feb-14 12:29 PM

F Flowrate
H Hand (Manually Ini ated) High
I Current Indicate
J Power
K Time or Time Schedule Control Sta on
L Level Light or Low
M Moisture or Humidity Middle or Intermediate
O Orifice
P Pressure or Vacuum Point
Q Quan ty or Event
R Radioac vity or Ra o Record or print
S Speed or Frequency Switch
T Temperature Transmit
V Viscosity Valve, Damper, or Louver
W Weight Well
Y Relay or Compute
Z Posi on Drive
Iden fica on of Instrument Connec ons
Capillary
Pneuma c
Electrical
Example 1.9.
Consider the benzene product line leaving the right‐hand side of the P&ID in Figure 1.7. The flowrate of this stream is controlled by a control
valve that receives a signal from a level measuring element placed on V‐104. The sequence of instrumenta on is as follows:
A level sensing element (LE) is located on the reflux drum V‐104. A level transmi er (LT) also located on V‐104 sends an electrical signal
(designated by a dashed line) to a level indicator and controller (LIC). This LIC is located in the control room on the control panel or console (as
indicated by the horizontal line under LIC) and can be observed by the operators. From the LIC, an electrical signal is sent to an instrument (LY)
Diagrams for Understanding Chemical Processes | 1.1. Block Flow Diag... http://www.informit.com/articles/printerfriendly/1915161
18 of 34 18-Feb-14 12:29 PM

that computes the correct valve posi on and in turn sends a pneuma c signal (designated by a solid line with cross hatching) to ac vate the
control valve (LCV). In order to warn operators of poten al problems, two alarms are placed in the control room. These are a high‐level alarm
(LAH) and a low‐level alarm (LAL), and they receive the same signal from the level transmi er as does the controller.
This control loop is also indicated on the PFD of Figure 1.5. However, the details of all the instrumenta on are condensed into a single symbol
(LIC), which adequately describes the essen al process control func on being performed. The control ac on that takes place is not described
explicitly in either drawing. However, it is a simple ma er to infer that if there is an increase in the level of liquid in V‐104, the control valve
will open slightly and the flow of benzene product will increase, tending to lower the level in V‐104. For a decrease in the level of liquid, the
valve will close slightly.
The details of the other control loops in Figures 1.5 and 1.7 are le to problems at the end of this chapter. It is worth men oning that in
virtually all cases of process control in chemical processes, the final control element is a valve. Thus, all control logic is based on the effect that
a change in a given flowrate has on a given variable. The key to understanding the control logic is to iden fy which flowrate is being
manipulated to control which variable. Once this has been done, it is a rela vely simple ma er to see in which direc on the valve should
change in order to make the desired change in the control variable. The response me of the system and type of control ac on used—for
example, propor onal, integral, or differen al—are le to the instrument engineers and are not covered in this text.
The final control element in nearly all chemical process control loops is a valve.
The P&ID is the last stage of process design and serves as a guide for those who will be responsible for the final design and construc on.
Based on this diagram,
Mechanical engineers and civil engineers will design and install pieces of equipment.1.
Instrument engineers will specify, install, and check control systems.2.
Piping engineers will develop plant layout and eleva on drawings.3.
Project engineers will develop plant and construc on schedules.4.
Before final acceptance, the P&IDs serve as a checklist against which each item in the plant is checked.
The P&ID is also used to train operators. Once the plant is built and is opera onal, there are limits to what operators can do. About all that can
be done to correct or alter performance of the plant is to open, close, or change the posi on of a valve. Part of the training would pose
situa ons and require the operators to be able to describe what specific valve should be changed, how it should be changed, and what to
observe in order to monitor the effects of the change. Plant simulators (similar to flight simulators) are some mes involved in operator
training. These programs are sophis cated, real me process simulators that show a trainee operator how quickly changes in controlled
variables propagate through the process. It is also possible for such programs to display scenarios of process upsets so that operators can get
training in recognizing and correc ng such situa ons. These types of programs are very useful and cost‐effec ve in ini al operator training.
However, the use of P&IDs is s ll very important in this regard.
The P&ID is par cularly important for the development of start‐up procedures when the plant is not under the influence of the installed
process control systems. An example of a start‐up procedure is given in Example 1.10.
Example 1.10.
Consider the start‐up of the dis lla on column shown in Figure 1.7. What sequence would be followed? The procedure is beyond the scope of
this text, but it would be developed from a series of ques ons such as
What valve should be opened first?a.
What should be done when the temperature of ... reaches ...?b.
To what value should the controller be set?c.
When can the system be put on automa c control?d.
These last three sec ons have followed the development of a process from a simple BFD through the PFD and finally to the P&ID. Each step
showed addi onal informa on. This can be seen by following the progress of the dis lla on unit as it moves through the three diagrams
described.
Block Flow Diagram (BFD) (see Figure 1.1): The column was shown as a part of one of the three process blocks.1.
Process Flow Diagram (PFD) (see Figure 1.5): The column was shown as the following set of individual equipment: a tower, condenser,
reflux drum, reboiler, reflux pumps, and associated process controls.
2.
Piping and Instrumenta on Diagram (P&ID) (see Figure 1.7): The column was shown as a comprehensive diagram that includes
addi onal details such as pipe sizes, u lity streams, sample taps, numerous indicators, and so on. It is the only unit opera on on the
diagram.
3.
The value of these diagrams does not end with the start‐up of the plant. The design values on the diagram are changed to represent the
Diagrams for Understanding Chemical Processes | 1.1. Block Flow Diag... http://www.informit.com/articles/printerfriendly/1915161
19 of 34 18-Feb-14 12:29 PM

actual values determined under normal opera ng condi ons. These condi ons form a “base case” and are used to compare opera ons
throughout the life of the plant.
1.4. Addi onal Diagrams
During the planning and construc on phases of a new project, many addi onal diagrams are needed. Although these diagrams do not possess
addi onal process informa on, they are essen al to the successful comple on of the project. Computers are being used more and more to do
the tedious work associated with all of these drawing details. The crea ve work comes in the development of the concepts provided in the
BFD and the process development required to produce the PFD. The computer can help with the drawings but cannot create a new process.
Computers are valuable in many aspects of the design process where the size of equipment to do a specific task is to be determined.
Computers may also be used when considering performance problems that deal with the opera on of exis ng equipment. However, they are
severely limited in dealing with diagnos c problems that are required throughout the life of the plant.
The diagrams presented here are in both American Engineering and SI units. The most no ceable excep on is in the sizing of piping, where
pipes are specified in inches and pipe schedule. This remains the way they are produced and purchased in the United States. A process
engineer today must be comfortable with SI, conven onal metric, and American (formerly Bri sh, who now use SI exclusively) Engineering
units.
These addi onal diagrams are discussed briefly below.
A u lity flowsheet may be provided that shows all the headers for u lity inputs and outputs available along with the connec ons needed to
the process. It provides informa on on the flows and characteris cs of the u li es used by the plant.
Vessel sketches, logic ladder diagrams, wiring diagrams, site plans, structural support diagrams, and many other drawings are rou nely used
but add li le to our understanding of the basic chemical processes that take place.
Addi onal drawings are necessary to locate all of the equipment in the plant. Plot plans and eleva on diagrams are provided that locate the
placement and eleva on of all of the major pieces of equipment such as towers, vessels, pumps, heat exchangers, and so on. When
construc ng these drawings, it is necessary to consider and to provide for access for repairing equipment, removing tube bundles from heat
exchangers, replacement of units, and so on. What remains to be shown is the addi on of the structural support and piping.
Piping isometrics are drawn for every piece of pipe required in the plant. These drawings are 3‐D sketches of the pipe run, indica ng the
eleva ons and orienta on of each sec on of pipe. In the past, it was also common for comprehensive plants to build a scale model so the
system could be viewed in three dimensions and modified to remove any poten al problems. Over the past thirty years, scale models have
been replaced by three‐dimensional computer aided design (CAD) programs that are capable of represen ng the plant as‐built in three
dimensions. They provide an opportunity to view the local equipment topology from any angle at any loca on inside the plant. One can
actually “walk through” the plant and preview what will be seen when the plant is built. The ability to “view” the plant before construc on
will be made even more realis c with the help of virtual reality so ware. With this new tool, it is possible not only to walk through the plant
but also to “touch” the equipment, turn valves, climb to the top of dis lla on columns, and so on. In the next sec on, the informa on needed
to complete a preliminary plant layout design is reviewed, and the logic used to locate the process units in the plant and how the eleva ons of
different equipment are determined are briefly explained.
1.5. Three‐Dimensional Representa on of a Process
As men oned earlier, the major design work products, both chemical and mechanical, are recorded on two‐dimensional diagrams (PFD, P&ID,
etc.). However, when it comes to the construc on of the plant, there are many issues that require a three‐dimensional representa on of the
process. For example, the loca on of shell‐and‐tube exchangers must allow for tube bundle removal for cleaning and repair. Loca ons of
pumps must allow for access for maintenance and replacement. For compressors, this access may also require that a crane be able to remove
and replace a damaged drive. Control valves must be located at eleva ons that allow operator access. Sample ports and instrumenta on must
also be located conveniently. For anyone who has toured a moderate‐to‐large chemical facility, the complexity of the piping and equipment
layout is immediately apparent. Even for experienced engineers, the review of equipment and piping topology is far easier to accomplish in
3‐D than 2‐D. Due to the rapid increase in computer power and advanced so ware, such representa ons are now done rou nely using the
computer. In order to “build” an electronic representa on of the plant in 3‐D, all the informa on in the previously men oned diagrams must
be accessed and synthesized. This in itself is a daun ng task, and a complete accoun ng of this process is well beyond the scope of this text.
However, in order to give the reader a flavor of what can now be accomplished using such so ware, a brief review of the principles of plant
layout design will be given. A more detailed account involving a virtual plant tour of the dimethyl ether (DME) plant (Appendix B.1) is given on
the CD accompanying this book.
For a complete, detailed analysis of the plant layout, all equipment sizes, piping sizes, PFDs, P&IDs, and all other informa on should be
known. However, for this descrip on, a preliminary plant layout based on informa on given in the PFD of Figure B.1.1 is considered. Using this
figure and the accompanying stream tables and equipment summary table (Tables B.1.1 and B.1.3), the following steps are followed:
Diagrams for Understanding Chemical Processes | 1.1. Block Flow Diag... http://www.informit.com/articles/printerfriendly/1915161
20 of 34 18-Feb-14 12:29 PM

The PFD is divided into logical subsystems. For the DME process, there are three logical subsec ons, namely, the feed and reactor
sec on, the DME purifica on sec on, and the methanol separa on and recycle sec on. These sec ons are shown as do ed lines on
Figure 1.8.
Figure 1.8. Subsystems for Preliminary Plan Layout for DME Process
1.
For each subsystem, a preliminary plot plan is created. The topology of the plot plan depends on many factors, the most important of
which are discussed below.
In general, the layout of the plot plan can take one of two basic configura ons: the grade‐level, horizontal, in‐line arrangement and
the structure‐mounted ver cal arrangement [5]. The grade‐level, horizontal, in‐line arrangement will be used for the DME facility. In
this arrangement, the process equipment units are aligned on either side of a pipe rack that runs through the middle of the process
unit. The purpose of the pipe rack is to carry piping for u li es, product, and feed to and from the process unit. Equipment is located
on either side of the pipe rack, which allows for easy access. In addi on, ver cal moun ng of equipment is usually limited to a single
level. This arrangement generally requires a larger “footprint” and, hence, more land than does the structure‐mounted ver cal
arrangement. The general arrangement for these layout types is shown in Figure 1.9.
Figure 1.9. Different Types of Plant Layout: (a) Grade‐Mounted, Horizontal, In‐line Arrangement, and (b) Structure‐Mounted Ver cal
2.
Diagrams for Understanding Chemical Processes | 1.1. Block Flow Diag... http://www.informit.com/articles/printerfriendly/1915161
21 of 34 18-Feb-14 12:29 PM

Arrangement (Source: Process Plant Layout and Piping Design, by E. Bausbacher and R. Hunt, © 1994, reprinted by permission of
Pearson Educa on, Inc., Upper Saddle River, NJ)
The minimum spacing between equipment should be set early on in the design. These distances are set for safety purposes and should
be set with both local and na onal codes in mind. A comprehensive list of the recommended minimum distances between process
equipment is given by Bausbacher and Hunt [5]. The values for some basic process equipment are listed in Table 1.11.
Table 1.11. Recommended Minimum Spacing (in Feet) between Process Equipment for Refinery, Chemical, and
Petrochemical Plants
Pumps Compressors Reactors Towers and
Vessels
Exchangers
Pumps M 25 M M M
Compressors M 30 M M
Reactors M 15 M
Towers M M
Exchangers M
M = minimum for maintenance access
Source: Process Plant Layout and Piping Design, by E. Bausbacher and R. Hunt, © 1994, reprinted by
permission of Pearson Educa on, Inc., Upper Saddle River, NJ
The sizing of process equipment should be completed and the approximate loca on on the plot plan determined. Referring to Table
B.1.3 for equipment specifica ons gives some idea of key equipment sizes. For example, the data given for the reflux drums V‐202 and
V‐203, reactor R‐201, and towers T‐201 and T‐202 are sufficient to sketch these units on the plot plan. However, pump sizes must be
obtained from vendors or previous jobs, and addi onal calcula ons for heat exchangers must be done to es mate their required
footprint on the plot plan. Calcula ons to illustrate the es ma on of equipment footprints are given in Example 1.11.
Example 1.11.
Es mate the footprint for E‐202 in the DME process.
From Table B.1.3 the following informa on can be found:
Floa ng‐Head Shell‐and‐Tube design
Area = 171 m2
Hot Side—Temperatures: in at 364°C and out at 281°C
Cold Side—Temperatures: in at 154°C and out at 250°C
Choose a two‐shell pass and four‐tube pass exchanger
Area per shell = 171/2 = 85.5 m2
Using 12 , 1‐in OD tubes, 293 tubes per shell are needed
Assuming the tubes are laid out on a 1¼‐in square pitch, a 27‐in ID shell is required.
Assume that the front and rear heads (where the tube fluid turns at the end of the exchanger) are 30 in in diameter and require 2
each (including flanges), and that the two shells are stacked on top of each other. The footprint of the exchanger is given in Figure
E1.11.
Diagrams for Understanding Chemical Processes | 1.1. Block Flow Diag... http://www.informit.com/articles/printerfriendly/1915161
22 of 34 18-Feb-14 12:29 PM

Figure E1.11. Approximate Dimensions and Footprint of Exchanger E‐202
Next, the size of the major process lines must be determined. In order to es mate these pipe sizes, it is necessary to make use of some
heuris cs. A heuris c is a simple algorithm or hint that allows an approximate answer to be calculated. The preliminary design of a
piece of equipment might well use many such heuris cs, and some of these might conflict with each other. Like any simplifying
procedure, the result from a heuris c must be reviewed carefully. For preliminary purposes, the heuris cs from Chapter 11 can be
used to es mate approximate pipe sizes. Example 1.12 illustrates the heuris c for calcula ng pipe size.
Example 1.12.
Consider the suc on line to P‐202 A/B; what should be the pipe diameter?
From Table 11.8, 1(b) for liquid pump suc on, the recommended liquid velocity and pipe diameter are related by u = (1.3 + D (in)/6)
/s.
From Table B.1.1, the mass flowrate of the stream entering P‐202, = Stream 16 + Stream 10 = 2170 + 5970 = 8140 kg/h and the
density is found to be 800 kg/m3.
The volumetric flowrate is 8140/800 = 10.2 m3/h = 0.00283 m3/s= 0.0998 3/s.
The procedure is to calculate the velocity in the suc on line and compare it to the heuris c. Using this approach, the following table is
constructed:
Click to view larger image
Therefore, the pipe diameter that sa sfies both the heuris c and the con nuity equa on lies between 3 and 4 in. Taking a
conserva ve es mate, a 4‐in suc on line is chosen for P‐202.
The next step to consider is the placement of equipment within the plot plan. This placement must be made considering the required
access for maintenance of the equipment and also the ini al installa on. Although this step may seem elementary, there are many
cases [5] where the incorrect placement of equipment subsequently led to considerable cost overruns and major problems both
during the construc on of the plant and during maintenance opera ons. Consider the example shown in Figure 1.10(a), where two
vessels, a tower, and a heat exchanger are shown in the plot plan. Clearly, V‐1 blocks the access to the exchanger’s tube bundle, which
o en requires removal to change leaking tubes or to remove scale on the outside of the tubes. With this arrangement, the exchanger
would have to be li ed up ver cally and placed somewhere where there was enough clearance so that the tube bundle could be
removed. However, the second vessel, V‐2, and the tower T‐1 are located such that crane access is severely limited and a very tall (and
Diagrams for Understanding Chemical Processes | 1.1. Block Flow Diag... http://www.informit.com/articles/printerfriendly/1915161
23 of 34 18-Feb-14 12:29 PM

expensive) crane would be required. The reloca on of these same pieces of equipment, as shown in Figure 1.10(b), alleviates both
these problems. There are too many considera ons of this type to cover in detail in this text, and the reader is referred to Bausbacher
and Hunt [5] for more in‐depth coverage of these types of problems. Considering the DME facility, a possible arrangement for the feed
and reactor subsec on is shown in Figure 1.11.
Figure 1.10. The Effect of Equipment Loca on on the Ease of Access for Maintenance, Installa on, and Removal
Figure 1.11. Possible Equipment Arrangement for the Reactor and Feed Sec on of DME Facility, Unit 200
The eleva on of all major equipment is established. In general, equipment located at grade (ground) level is easier to access and
maintain and is cheaper to install. However, there are circumstances that dictate that equipment be elevated in order to provide
acceptable opera on. For example, the bo oms product of a dis lla on column is a liquid at its bubble point. If this liquid is fed to a
pump, then, as the pressure drops in the suc on line due to fric on, the liquid boils and causes the pumps to cavitate. To alleviate this
problem, it is necessary to elevate the bo om of the column rela ve to the pump inlet, in order to increase the Net Posi ve Suc on
Head Available (for more detail about NPSHA see Chapter 21). This can be done by digging a pit below grade for the pump or by
eleva ng the tower. Pump pits have a tendency to accumulate denser‐than‐air gases, and maintenance of equipment in such pits is
dangerous due to the possibility of suffoca on and poisoning (if the gas is poisonous). For this reason, towers are generally elevated
between 3 and 5 m (10 and 15 ) above ground level by using a “skirt.” This is illustrated in Figure 1.12. Another reason for eleva ng a
dis lla on column is also illustrated in Figure 1.12. O en a thermosiphon reboiler is used. These reboilers use the difference in density
between the liquid fed to the reboiler and the two‐phase mixture (saturated liquid‐vapor) that leaves the reboiler to “drive” the
circula on of bo oms liquid through the reboiler. In order to obtain an acceptable driving force for this circula on, the sta c head of
the liquid must be substan al, and a 3–5 m height differen al between the liquid level in the column and the liquid inlet to the
reboiler is typically sufficient. Examples showing when equipment eleva on is required are given in Table 1.12.
3.
Diagrams for Understanding Chemical Processes | 1.1. Block Flow Diag... http://www.informit.com/articles/printerfriendly/1915161
24 of 34 18-Feb-14 12:29 PM
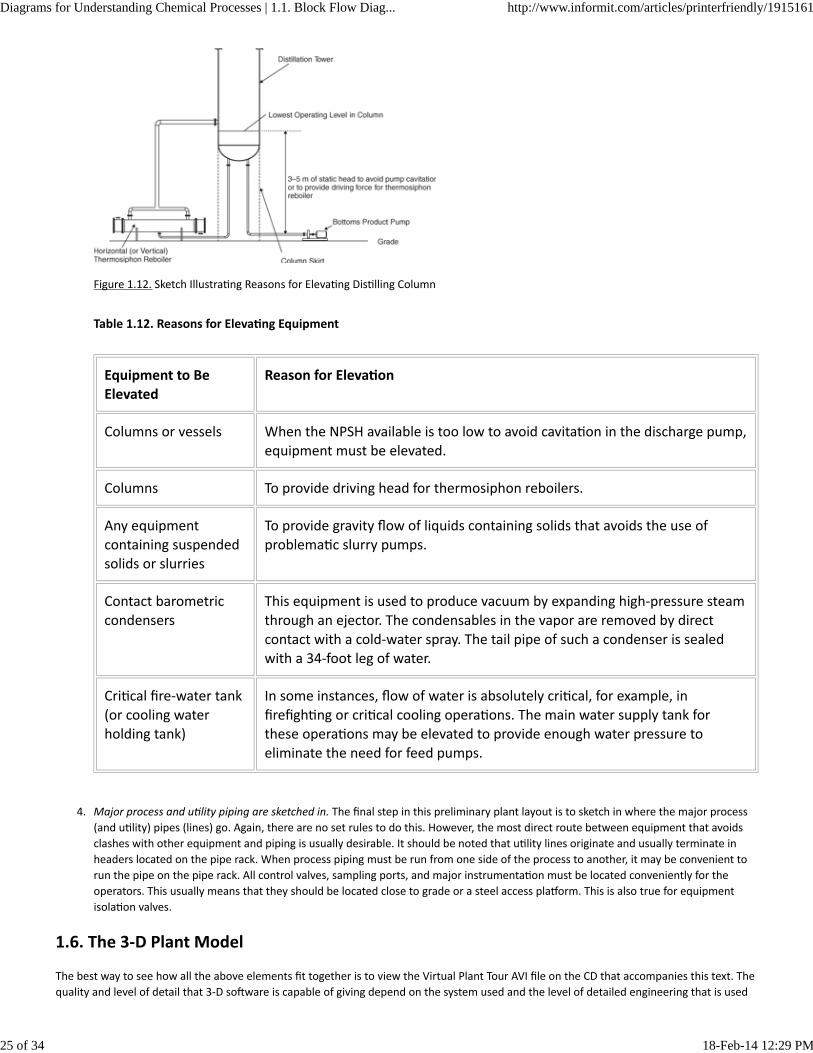
Figure 1.12. Sketch Illustra ng Reasons for Eleva ng Dis lling Column
Table 1.12. Reasons for Eleva ng Equipment
Equipment to BeElevated
Reason for Eleva on
Columns or vessels When the NPSH available is too low to avoid cavita on in the discharge pump,
equipment must be elevated.
Columns To provide driving head for thermosiphon reboilers.
Any equipment
containing suspendedsolids or slurries
To provide gravity flow of liquids containing solids that avoids the use of
problema c slurry pumps.
Contact barometric
condensers
This equipment is used to produce vacuum by expanding high‐pressure steam
through an ejector. The condensables in the vapor are removed by direct
contact with a cold‐water spray. The tail pipe of such a condenser is sealedwith a 34‐foot leg of water.
Cri cal fire‐water tank
(or cooling waterholding tank)
In some instances, flow of water is absolutely cri cal, for example, in
firefigh ng or cri cal cooling opera ons. The main water supply tank forthese opera ons may be elevated to provide enough water pressure to
eliminate the need for feed pumps.
Major process and u lity piping are sketched in. The final step in this preliminary plant layout is to sketch in where the major process
(and u lity) pipes (lines) go. Again, there are no set rules to do this. However, the most direct route between equipment that avoids
clashes with other equipment and piping is usually desirable. It should be noted that u lity lines originate and usually terminate in
headers located on the pipe rack. When process piping must be run from one side of the process to another, it may be convenient to
run the pipe on the pipe rack. All control valves, sampling ports, and major instrumenta on must be located conveniently for the
operators. This usually means that they should be located close to grade or a steel access pla orm. This is also true for equipment
isola on valves.
4.
1.6. The 3‐D Plant Model
The best way to see how all the above elements fit together is to view the Virtual Plant Tour AVI file on the CD that accompanies this text. The
quality and level of detail that 3‐D so ware is capable of giving depend on the system used and the level of detailed engineering that is used
Diagrams for Understanding Chemical Processes | 1.1. Block Flow Diag... http://www.informit.com/articles/printerfriendly/1915161
25 of 34 18-Feb-14 12:29 PM

to produce the model. Figures 1.13–1.15 were generated for the DME facility using the PDMS so ware package from Cadcentre, Inc. (These
figures and the Virtual_Plant_Tour.AVI file are presented here with permission of Cadcentre, Inc.) In Figure 1.13, an isometric view of the DME
facility is shown. All major process equipment, major process and u lity piping, and basic steel structures are shown. The pipe rack is shown
running through the center of the process, and steel pla orms are shown where support of elevated process equipment is required. The
dis lla on sec ons are shown to the rear of the figure on the far side of the pipe rack. The reactor and feed sec on is shown on the near side
of the pipe rack. The eleva on of the process equipment is be er illustrated in Figure 1.14, where the piping and structural steel have been
removed. The only elevated equipment apparent from this figure are the overhead condensers and reflux drums for the dis lla on columns.
The overhead condensers are located ver cally above their respec ve reflux drums to allow for the gravity flow of condensate from the
exchangers to the drums. Figure 1.15 shows the arrangement of process equipment and piping for the feed and reactor sec ons. The layout of
equipment corresponds to that shown in Figure 1.11. It should be noted that the control valve on the discharge of the methanol feed pumps
is located close to grade level for easy access.
Figure 1.13. Isometric View of Preliminary 3‐D Plant Layout Model for DME Process (Reproduced by Permission of Cadcentre, an Aveva Group
Company, from their Vantage/PDMS So ware)
Diagrams for Understanding Chemical Processes | 1.1. Block Flow Diag... http://www.informit.com/articles/printerfriendly/1915161
26 of 34 18-Feb-14 12:29 PM

Figure 1.14. 3‐D Representa on of Preliminary Equipment Layout for the DME Process (Reproduced by Permission of Cadcentre, an Aveva
Group Company, from their Vantage/PDMS So ware)
Figure 1.15. 3‐D Representa on of the Reactor and Feed Sec ons of the DME Process Model (Reproduced by Permission of Cadcentre, an
Aveva Group Company, from their Vantage/PDMS So ware)
1.7. Operator and 3‐D Immersive Training Simulators
1.7.1. Operator Training Simulators (OTS)
Up to this point in the chapter, the different elements and diagrams used in the specifica on and descrip on of a process have been covered.
The means by which the material balances, energy balances, and design calcula ons for the various unit opera ons, required to specify all the
design condi ons, have been carried out has not been covered. Indeed, the simula on of chemical processes using programs such as
CHEMCAD, Aspen Plus, PRO/II, HYSIS, and others is not addressed un l much later, in Chapter 13. Nevertheless, it should be clear that
extensive simula on of the process will be required to determine and to specify all of the condi ons needed in the design. Typically, these
simula ons are carried out under steady‐state condi ons and represent a single design opera ng point, or possibly are made for several
different opera ng points. The steady‐state simula on of the process is clearly very important from the standpoint of defining the design
condi ons and specifying the equipment parameters, such as vessel sizes, heat‐exchanger areas and du es, pipe sizes, and so on. However,
once the plant has been built, started up, and commissioned, it is rare that the process will operate at that design condi on for any given
period of me. Moreover, how the process can be started up or run at, for example, 65% or 110% of design capacity is not evident from the
original design. Nevertheless, the plant will be run at off‐design condi ons throughout its life. In order to help operators and engineers
Diagrams for Understanding Chemical Processes | 1.1. Block Flow Diag... http://www.informit.com/articles/printerfriendly/1915161
27 of 34 18-Feb-14 12:29 PM

understand how to start up and shut down the process, deal with emergencies, or operate at off‐design condi ons, an operator training
simulator (OTS) may be built.
The founda on of an OTS is a dynamic simula on (model) of the process to which a human machine interface (HMI) is connected. The HMI, in
its simplest form, is a pictorial representa on of the process that communicates with the dynamic model, and through it, process variables are
displayed. The HMI also displays all the controls for the process; an operator can control the process by changing these controls. An example
of an HMI is shown in Figure 1.16. This par cular example shows a por on of an acid‐gas recovery (AGR) unit for an OTS developed by the
Department of Energy to simulate an IGCC (Integrated Gasifica on Combined Cycle) coal‐fed power plant. Process variables calculated by the
dynamic model are displayed in boxes throughout the HMI. Operators can monitor the change in these variables with me just as they would
in a control room situa on. The only difference is that the process is simulated rather than actually opera ng. In general terms, the OTS
func ons for an operator just as a flight simulator does for a pilot or astronaut. Therefore, operators and engineers can gain opera onal
experience and understanding about a process or plant through the OTS but with the added benefit that any mistakes or errors can be
iden fied and corrected during training sessions without exposing personnel to any risks that might occur if training were to be done on the
actual plant.
Figure 1.16. Example of an HMI Interface for an OTS (Reproduced by Permission of the DOE’s Na onal Energy Technical Laboratory and
Invensys Systems Inc., Property and Copyright of Invensys plc, UK)
The star ng point for developing an OTS is the steady‐state simula on, the equipment informa on, and instrumenta on and control data. In
general, the P&IDs are used as the star ng point for the genera on of the HMI since they contain all the necessary informa on for the
controls and instrumenta on. The dynamic model is developed so that the steady‐state design condi on will be simulated when all the inputs
(feeds) are at their design values. Details of how dynamic simulators are used in process design are included in Chapter 17. Needless to say,
the development of a fully func oning dynamic model for a process that accurately reflects all the controls and valves in the process is a
substan al task that takes a team of engineers many months to accomplish.
1.7.2. 3‐D Immersive Training Simulators (ITS)
In Sec on 1.6, the concept of a 3‐D plant model was introduced. Such models are “constructed” in an “electronic” environment using precise
design data on the size, loca on and eleva on (x‐, y‐, and z‐coordinates), and orienta on of each piece of equipment. In addi on, the piping
arrangement and loca on of valves, nozzles, instruments, sample ports, drains, and so forth are all specified. Such a representa on allows the
engineer and operator to evaluate the accessibility of cri cal process components and to obtain a feel for how the plant will look (and
operate) when constructed. The engineer may access this informa on through either a 2‐D viewer or a 3‐D virtual environment (for example,
using 3‐D goggles). However, no ma er how the informa on is viewed, the resul ng images are essen ally sta c and are generally of low to
medium fidelity. Therefore, when viewing a 3‐D plant model, it will always be clear to the viewer that it is just a model, and that the
representa on of the 3‐D object is crude.
The visual enhancement of 3‐D models using sophis cated imaging so ware and overlaying photorealis c images on top of a skeleton of the
3‐D representa on are now not only possible but commonplace for higher‐end video games. Computer‐generated graphics are now so
advanced that, as any movie fan will a est, it is o en difficult to determine what is “real” and what is animated. This technology is now being
applied to develop 3‐D immersive training simulators (ITS) for chemical plants. As can be seen from Figure 1.17, the quality and realism
captured by computer‐generated graphics are truly amazing. Furthermore, the use of avatars to represent plant operators makes it possible
for a user to navigate through, interact with, and be truly immersed in the virtual plant.
Diagrams for Understanding Chemical Processes | 1.1. Block Flow Diag... http://www.informit.com/articles/printerfriendly/1915161
28 of 34 18-Feb-14 12:29 PM

Figure 1.17. An Example of a Computer‐Generated Image of a Horizontal Drum (Reproduced by Permission of the DOE’s Na onal Energy
Technical Laboratory and Invensys Systems Inc., Property and Copyright of Invensys plc, UK)
1.7.3. Linking the ITS with an OTS
The poten al for educa on and training of engineers, operators, and students using both the OTS and ITS appears to be limitless. Indeed,
these two systems can be linked together such that they can communicate, and the real‐ me opera on of the process, both in the control
room and outside in the plant, can be simulated in the virtual environment. Consider the following scenario that might occur during the
start‐up of a chemical process:
Feed to a dis lla on column from an on‐site storage drum has begun. The feed pump has been started and the flow through the pump
has been confirmed from the HMI display in the control room. The liquid feed flows into the top of the tower, and the liquid levels on
the dis lla on trays start to increase. The process appears to be working as described in the start‐up manual that the operator is
following. However, approximately 30 minutes a er the start of the feed pumps, a low‐level alarm sounds on the on‐site storage drum.
The operator monitors the level in the drum from the control room and determines that it is con nuing to fall and will cause the feed
pump to vapor lock (cavitate) if the situa on is not remedied. In reviewing the start‐up procedure, the operator determines that there
is a remote func on valve (one that cannot be operated remotely from the control room) that connects the on‐site storage drum to the
off‐site storage tank, and that this valve may have been closed inadvertently. She then contacts an operator in the field by walkie‐talkie
and asks him to check the status of the remote func on valve. The field operator walks to the storage drum, iden fies the tag name on
the valve, and confirms that the valve is indeed closed. The control room operator then instructs the field operator to open the valve,
which he does. The control room operator then confirms that the level in the drum has started to go back up and thanks the field
operator for his help.
This scenario might well represent an actual incident during a scheduled plant start‐up. However, this scenario could just as easily be
simulated in the virtual environment. The control room operator would be si ng in front of the HMI screen that is connected to the OTS. A
field operator could be si ng in the room next door with a walkie‐talkie and wearing 3‐D goggles connected to the ITS. The field operator
would move his avatar to the loca on of the on‐site storage drum and locate the remote func on valve. The field operator using his avatar
would then note the se ng of the valve and a er receiving instruc ons from the control room operator would open the valve. At this point,
the ITS would communicate to the OTS that a valve had been opened, and this would then allow the flow of product to con nue to the drum;
that is, the dynamic model of the process would respond to the valve being opened and model the flow to the drum. The control room
operator, monitoring the HMI, would see the result of the flow of product as an increase in the drum level.
Clearly, any number of scenarios involving control room operators and field operators could be implemented. Moreover, maintenance
opera ons, safety training, and a whole host of other operator func ons could be simulated‐all in the virtual plant.
Augmented Reality. From the previous example it is clear that any feasible scenario that might occur in the actual plant can be simulated in
the virtual environment. However, a series of cases can be simulated that would be almost impossible to simulate in the actual plant but are
easily accomplished in virtual reality. For example, it might be helpful to show a young engineer how a par cular piece of equipment works by
showing him or her the details of the internals of that equipment. In the actual plant, this opportunity might not be available un l a scheduled
plant shutdown occurs, and that might not happen for one or two years. However, in the virtual environment, the opera on of a given piece
of equipment can be easily displayed. In fact, the avatar can move into the plant and simply “strip away” the outer wall of a piece of
equipment and look inside to see what is happening. This addi onal feature is some mes referred to as augmented reality (AR). As an
example of AR, the opera on of a reboiler and a dis lla on column is illustrated in Figures 1.18(a) and 1.18(b), respec vely.
Diagrams for Understanding Chemical Processes | 1.1. Block Flow Diag... http://www.informit.com/articles/printerfriendly/1915161
29 of 34 18-Feb-14 12:29 PM

Figure 1.18. Augmented Reality in ITS: (a) Reboiler (b) Bubble‐Cap Dis lla on Column (Reproduced by Permission of the DOE’s Na onal Energy
Technical Laboratory and Invensys Systems Inc., Property and Copyright of Invensys plc, UK)
Another example of AR is the display of process data in the virtual plant. For example, if an operator wanted to check on the trend of a certain
process variable, say, the temperature in a reactor, or look at a schema c of a pump, the avatar can simply click on a piece of equipment and
display that trend, as shown in Figure 1.19. Clearly, in the virtual environment, there are very few limita ons on what informa on the
operator (avatar) can access.
Figure 1.19. An Avatar Can Access Process Trends and Observe Equipment Schema cs in AR (Reproduced by Permission of Invensys Systems
Inc., Property and Copyright of Invensys plc, UK)
Training for Emergencies, Safety, and Maintenance. The possibili es for training operators and engineers in the virtual plant environment are
unlimited. Of par cular importance are the areas of safety, emergency response, and rou ne maintenance. For example, the response of an
operator or team of operators to an emergency situa on can be monitored, recorded, and played back in the virtual plant. Any mistakes made
by the operator(s) can be analyzed, feedback given, and then the exercise can be repeated un l the correct response is achieved. Although
such training does not absolutely guarantee that when a real emergency arises in the plant the operators will respond correctly, it
nevertheless provides crucial emergency training under realis c condi ons without the fear of actual harm to personnel and equipment.
Furthermore, the more o en such scenarios are rehearsed, the more likely are operators to respond correctly when real emergencies occur in
the plant.
Corresponding scenarios for safety and maintenance training can also be implemented. O en these ac vi es must follow well‐defined
procedures, and again, the virtual environment offers a perfect venue to record, analyze, and provide feedback to personnel as they perform
these various tasks.
In summary, the use of the virtual plant environment (ITS linked to an OTS) provides unlimited opportuni es to a new genera on of engineers
and operators to learn and to train as process plant personnel and to hone their respec ve skills in an environment that is both realis c and
safe.
1.8. Summary
In this chapter, you have learned that the three principal types of diagrams used to describe the flow of chemical streams through a process
are the block flow diagram (BFD), the process flow diagram (PFD), and the piping and instrumenta on diagram (P&ID). These diagrams
describe a process in increasing detail.
Each diagram serves a different purpose. The block flow diagram is useful in conceptualizing a process or a number of processes in a large
complex. Li le stream informa on is given, but a clear overview of the process is presented. The process flow diagram contains all the
necessary informa on to complete material and energy balances on the process. In addi on, important informa on such as stream pressures,
equipment sizes, and major control loops is included. Finally, the piping and instrumenta on diagram contains all the process informa on
necessary for the construc on of the plant. These data include pipe sizes and the loca on of all instrumenta on for both the process and
Diagrams for Understanding Chemical Processes | 1.1. Block Flow Diag... http://www.informit.com/articles/printerfriendly/1915161
30 of 34 18-Feb-14 12:29 PM

u lity streams.
In addi on to the three diagrams, there are a number of other diagrams used in the construc on and engineering phase of a project.
However, these diagrams contain li le addi onal informa on about the process.
The logic for equipment placement and layout within the process was presented. The reasons for eleva ng equipment and providing access
were discussed, and a 3‐D representa on of a DME plant was presented. The concept of operator training simulators is presented and the role
of 3‐D immersive training systems is also introduced.
The PFD is the single most important diagram for the chemical or process engineer and will form the basis of much of the discussion covered
in this book.
What You Should Have Learned
The difference between and uses of the block flow diagram, the process flow diagram, the piping and instrumenta on diagram, plot
plans, eleva on diagrams, and piping isometrics
A method for drawing consistent process flow diagrams
How operator training systems and 3‐D graphic process representa ons are used to train operators and engineers
References
Kauffman, D., “Flow Sheets and Diagrams,” AIChE Modular Instruc on, Series G: Design of Equipment, series editor J. Beckman,
American Ins tute of Chemical Engineers, New York, 1986, Vol. 1, Chapter G.1.5. Reproduced by permission of the American Ins tute
of Chemical Engineers, AIChE copyright © 1986, all rights reserved.
1.
Graphical Symbols for Process Flow Diagrams, ASA Y32.11 (New York: American Society of Mechanical Engineers, 1961).2.
Aus n, D. G., Chemical Engineering Drawing Symbols (London: George Godwin, 1979).3.
Instrument Symbols and Iden fica on, Research Triangle Park, NC: Instrument Society of America, Standard ISA‐S5‐1, 1975.4.
Bausbacher, E., and R. Hunt, Process Plant Layout and Piping Design (Upper Saddle River, NJ: Pren ce Hall PTR, 1998).5.
Short Answer Ques ons
What are the three principal types of diagrams used by process engineers to describe the flow of chemicals in a process? On which of
these diagrams would you expect to see the following items?
The temperature and pressure of a process streama.
An overview of a mul ple‐unit processb.
A major control loopc.
A pressure indicatord.
A pressure‐relief valvee.
1.
A problem has occurred in the measuring element of a level‐indica ng controller in a batch reactor. To what principal diagram should
you refer in order to troubleshoot the problem?
2.
Why is it important for a process engineer to be able to review a three‐dimensional model (actual or virtual/electronic) of the plant
prior to the construc on phase of a project?
3.
Name five things that would affect the loca ons of different pieces of equipment when determining the layout of equipment in a
process unit.
4.
Why are accurate plant models (made of plas c parts) no longer made as part of the design process? What func on did these models
play and how is this func on now achieved?
5.
In the context of process modeling tools, what do OTS and ITS stand for?6.
What is augmented reality? Give one example of it.7.
Problems
There are two common reasons for eleva ng the bo om of a tower by means of a “skirt.” One reason is to provide enough NPSHA for
bo oms product pumps to avoid cavita on. What is the other reason?
8.
Which of the principal diagrams should be used to do the following:
Determine the number of trays in a dis lla on column?a.
Determine the top and bo om temperatures in a dis lla on column?b.
Validate the overall material balance for a process?c.
Check the instrumenta on for a given piece of equipment in a “pre‐start‐up” review?d.
Determine the overall material balance for a whole chemical plant?e.
9.
What is the purpose(s) of a pipe rack in a chemical process?10.
Diagrams for Understanding Chemical Processes | 1.1. Block Flow Diag... http://www.informit.com/articles/printerfriendly/1915161
31 of 34 18-Feb-14 12:29 PM

When would a structure‐mounted ver cal plant layout arrangement be preferred over a grade‐mounted, horizontal, in‐line
arrangement?
11.
A process that is being considered for construc on has been through several technical reviews; block flow, process flow, and piping
and instrumenta on diagrams are available for the process. Explain the changes that would have to be made to the three principal
diagrams if during a final preconstruc on review, the following changes were made:
The efficiency of a fired heater had been specified incorrectly as 92% instead of 82%.a.
A waste process stream flowrate (sent to a sludge pond) was calculated incorrectly and is now 30% greater than before.b.
It has been decided to add a second (backup) drive for an exis ng compressor.c.
The loca ons of several control valves have changed to allow for be er operator access.d.
12.
During a retrofit of an exis ng process, a vessel used to supply the feed pump to a batch reactor has been replaced because of
excessive corrosion. The vessel is essen ally iden cal to the original one, except it is now grounded differently to reduce the corrosion.
If the func on of the vessel (namely, to supply liquid to a pump) has not changed, answer the following ques ons:
Should the new vessel have a new equipment number, or should the old vessel number be used again? Explain your answer.a.
On which diagram or diagrams (BFD, PFD, or P&ID) should the change in the grounding setup be noted?b.
13.
Draw a sec on of a P&ID diagram for a vessel receiving a process liquid through an insulated 4‐in schedule‐40 pipe. The purpose of the
vessel is to store approximately 5 minutes of liquid volume and to provide “capacity” for a feed pump connected to the bo om of the
pump using a 6‐in schedule‐40 pipe. The diagram should include the following features:
The vessel is numbered V‐1402 and the pump(s) are P‐1407 A/B.a.
The discharge side of the pump is made of 4‐in schedule‐40 carbon steel pipe and all pipe is insulated.b.
A control valve is located in the discharge line of the pump, and a double block and bleed arrangement is used (see Problem
1.15 for more informa on).
c.
Both pumps and vessel have isola on (gate) valves.d.
The pumps should be equipped with drain lines that discharge to a chemical sewer.e.
The vessel is equipped with local pressure and temperature indicators.f.
The vessel has a pressure‐relief valve set to 50 psig that discharges to a flare system.g.
The tank has a drain valve and a sampling valve, both of which are connected to the tank through separate 2‐in schedule‐40 CS
lines.
h.
The tank level is used to control the flow of liquid out of the tank by adjus ng the se ng of the control valve on the discharge
side of the pump. The instrumenta on is similar to that shown for V‐104 in Figure 1.7.
i.
14.
A standard method for instrumen ng a control valve is termed the “double block and bleed,” which is illustrated in Figure P1.15.
Figure P1.15. Double Block and Bleed Arrangement for Problem 1.15
Under normal condi ons, valves a to c are open and valves d and e are closed. Answer the following:
Explain, carefully, the sequence of opening and closing valves required in order to change out the valve stem on the control
valve (valve b).
a.
What changes, if any, would you make to Figure P1.15 if the process stream did not contain a process chemical but contained
process water?
b.
It has been suggested that the bypass valve (valve d) be replaced with another gate valve to save money. Gate valves are cheap
but essen ally func on as on‐off valves. What do you recommend?
c.
What would be the consequence of elimina ng the bypass valve (valve d)?d.
15.
O en, during the dis lla on of liquid mixtures, some noncondensable gases are dissolved in the feed to the tower. These16.
Diagrams for Understanding Chemical Processes | 1.1. Block Flow Diag... http://www.informit.com/articles/printerfriendly/1915161
32 of 34 18-Feb-14 12:29 PM

noncondensables come out of solu on when heated in the tower and may accumulate in the overhead reflux drum. In order for the
column to operate sa sfactorily, these vapors must be periodically vented to a flare or stack. One method to achieve this ven ng
process is to implement a control scheme in which a process control valve is placed on the vent line from the reflux drum. A pressure
signal from the drum is used to trigger the opening or closing of the vent line valve. Sketch the basic control loop needed for this
ven ng process on a process flow diagram represen ng the top por on of the tower.
Repeat Problem 1.16, but create the sketch as a P&ID to show all the instrumenta on needed for this control loop.17.
Explain how each of the following statements might affect the layout of process equipment:
A specific pump requires a large NPSH.a.
The flow of liquid from an overhead condenser to the reflux drum is gravity driven.b.
Pumps and control valves should be located for easy access and maintenance.c.
Shell‐and‐tube exchanges may require periodic cleaning and tube bundle replacement.d.
Pipes located at ground level present a tripping hazard.e.
The prevailing wind is nearly always from the west.f.
18.
Es mate the footprint for a shell‐and‐tube heat exchanger from the following design data:
Area = 145 m2
Hot side temperatures: in at 300°C, out at 195°C
Cold side temperature: bfw at 105°C mps at 184°C
Use 12 , 1‐in OD tubes on a 1 1/4‐in square pitch, use a single shell‐and‐tube pass because of change of phase on shell side
Use a vapor space above boiling liquid = 3 mes liquid volume
19.
Make a sketch of a layout (plot plan only) of a process unit containing the following process equipment:
3 reactors (ver cal—diameter 1.3 m each)
2 towers (1.3 and 2.1 m in diameter, respec vely)
4 pumps (each moun ng pad is 1 m by 1.8 m)
4 exchangers (footprints of 4 m by 1 m, 3.5 m by 1.2 m, 3 m by 0.5 m, and 3.5 m by 1.1 m)
The two columns and the three reactors should all be aligned with suitable spacing and all the exchangers should have clearance for
tube bundle removal.
20.
Using the data from Table 1.7, es mate the footprints of all the equipment in the toluene HDA process.
For the shell‐and‐tube exchangers, assume 12 , 1.25 in tubes on a 1.5 in square pitch, and assume 2 addi onal length at
either end of the exchanger for tube return and feed header.
For double pipe exchangers, assume an 8‐in schedule‐20 OD and a 6‐in schedule‐40 ID pipe with a length of 12 including
u‐bend.
For the footprints of pumps, compressors, and fired heater, assume the following:
P‐101 use 2 m by 1 m, P‐102 use 2 m by 1 m
C‐101 (+D‐101) use 4 m by 2 m
H‐101 use 5 m by 5 m
21.
With the informa on from Problem 1.21 and the topology given in Figure 1.5, accurately sketch a plant layout (plot plan) of the
toluene HDA process using a grademounted, horizontal, in‐line arrangement similar to the one shown in Figure 1.9. You should
assume that the area of land available for this process unit is surrounded on three sides by an access road and that a pipe rack runs
along the fourth side. Use the informa on in Table 1.11 as a guide to placing equipment.
22.
What do the following symbols (as seen on a P&ID) indicate?
(a)
(b)
(c)
23.
Diagrams for Understanding Chemical Processes | 1.1. Block Flow Diag... http://www.informit.com/articles/printerfriendly/1915161
33 of 34 18-Feb-14 12:29 PM

(d)
(e)
Determine all the errors in the sec on of a P&ID shown in Figure P1.24.24.
Figure P1.24. A Sec on of a P&ID to Be Used in Problem 1.24
Diagrams for Understanding Chemical Processes | 1.1. Block Flow Diag... http://www.informit.com/articles/printerfriendly/1915161
34 of 34 18-Feb-14 12:29 PM