Embed Size (px)
Citation preview
Understanding Financial Statements
Presented by Andrew GreenseidPresident, Greenseid Consulting Group, LLC
Agenda
• Overview• Introduction• P&L• Balance Sheet• Cash Flow• Linking the Statements Together• Lemonade, Inc.• Conclusion
Overview
• What are financial statements?• Why are there 3 of them?
• Are there only 3?• What information do they provide?• How are they different from one another?• How does information flow from one to another?
•WHAT QUESTIONS DO YOU HAVE?

Introduction
• Andrew Greenseid• University of Wisconsin – Madison: BA in Philosophy• Carlson School of Management at the University of Minnesota: MBA
with concentrations in Finance and International Business• 19 years of finance experience• Greenseid Consulting Group, LLC formed in 2010
• Financial Modeling• Part-time, temporary Chief Financial Officer

3 Financial Statements
• Income Statement•Balance Sheet•Cash Flow Statement
Income Statement
AKA• Profit and Loss Statement• P&L• Earnings Report• Operating Statement• Revenue StatementEtc….
Income Statement
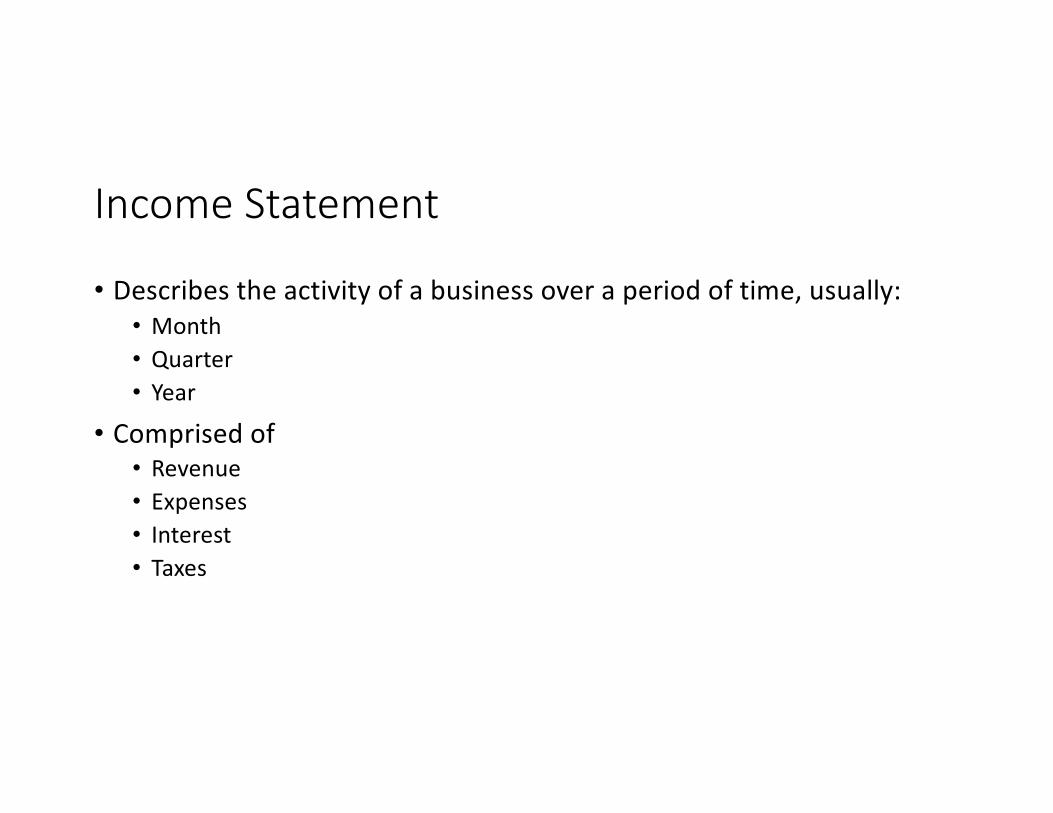
• Describes the activity of a business over a period of time, usually:• Month• Quarter• Year
• Comprised of• Revenue• Expenses• Interest• Taxes
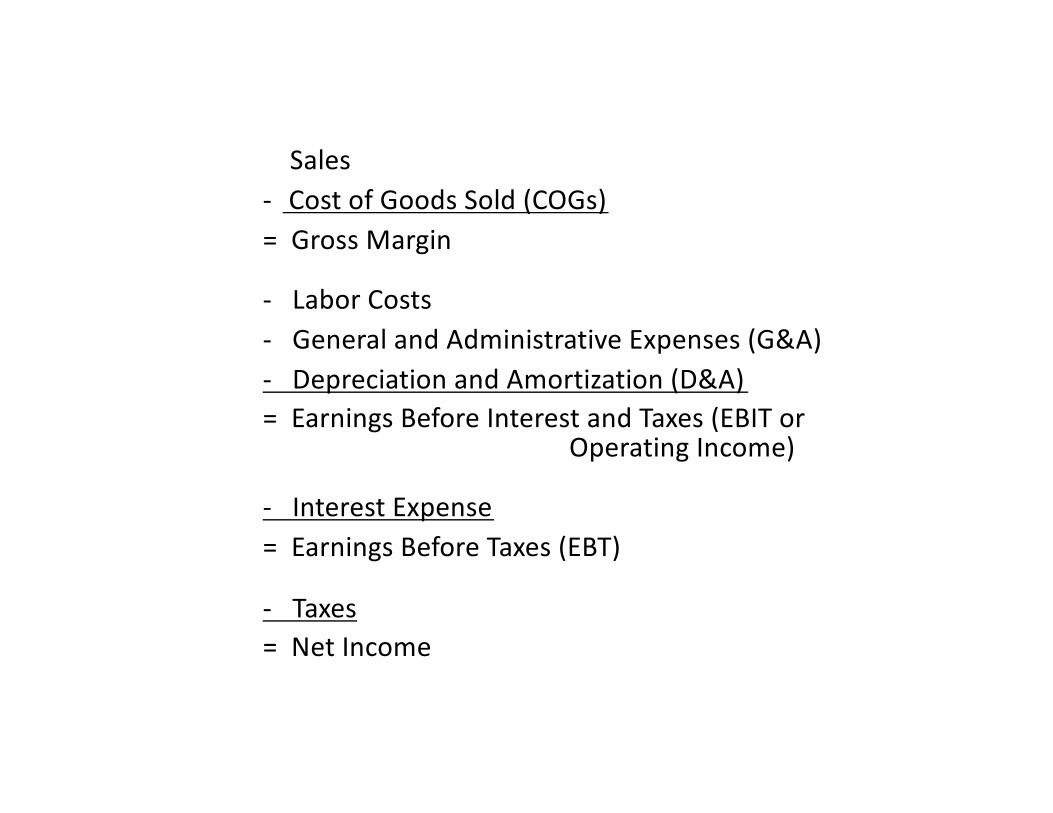
Sales- Cost of Goods Sold (COGs)= Gross Margin
- Labor Costs- General and Administrative Expenses (G&A)- Depreciation and Amortization (D&A)= Earnings Before Interest and Taxes (EBIT or
Operating Income)
- Interest Expense= Earnings Before Taxes (EBT)
- Taxes= Net Income
Capital vs.Expense
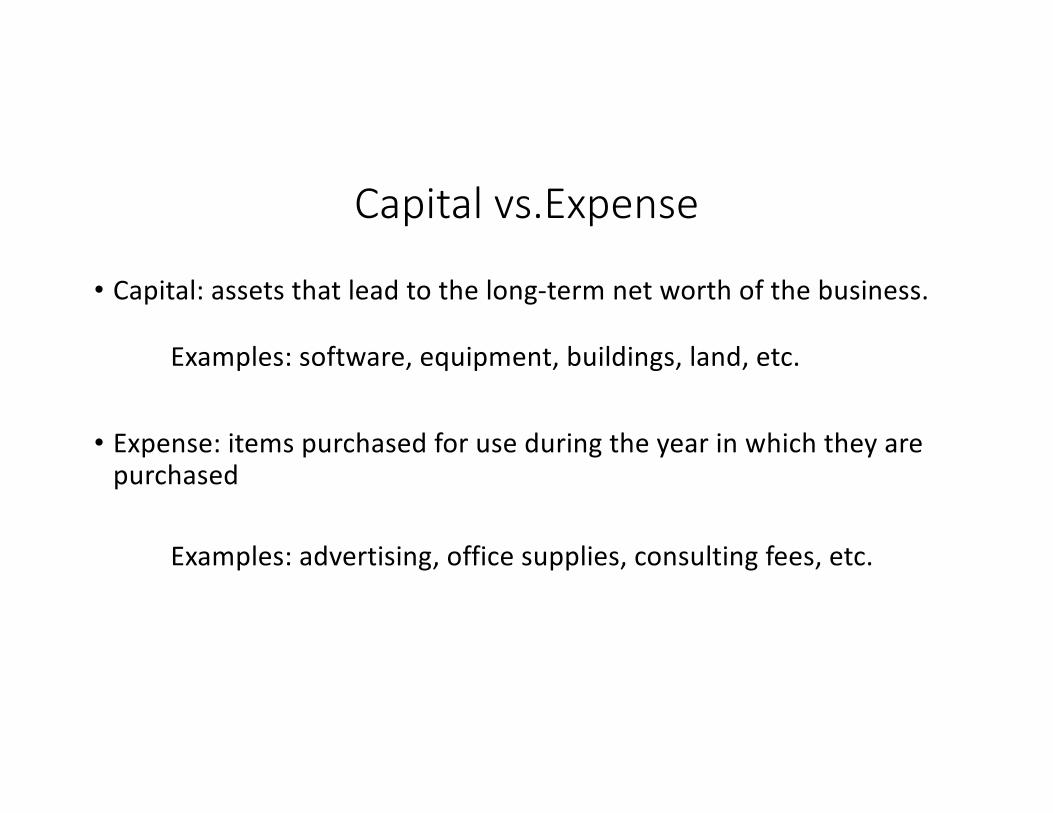
• Capital: assets that lead to the long-term net worth of the business.
Examples: software, equipment, buildings, land, etc.
• Expense: items purchased for use during the year in which they are purchased
Examples: advertising, office supplies, consulting fees, etc.
Lemonade, Inc.

Income Statement
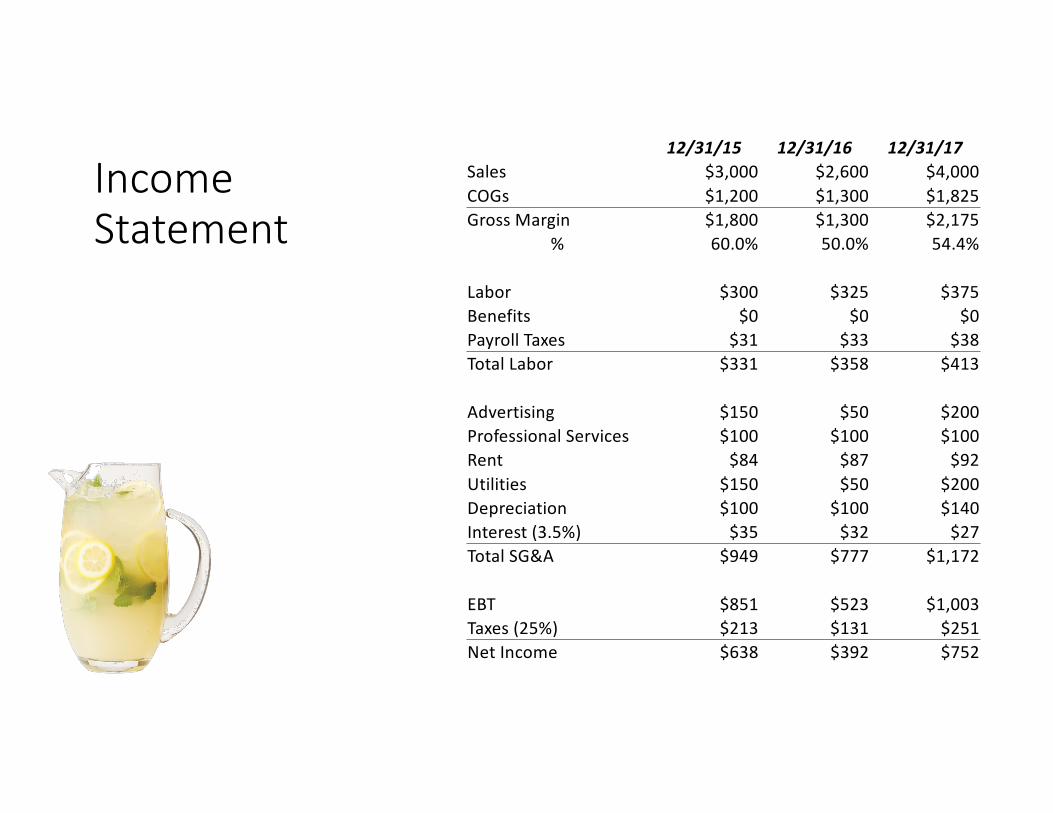
12/31/15 12/31/16 12/31/17Sales $3,000 $2,600 $4,000COGs $1,200 $1,300 $1,825Gross Margin $1,800 $1,300 $2,175
% 60.0% 50.0% 54.4%
Labor $300 $325 $375Benefits $0 $0 $0Payroll Taxes $31 $33 $38Total Labor $331 $358 $413
Advertising $150 $50 $200Professional Services $100 $100 $100Rent $84 $87 $92Utilities $150 $50 $200Depreciation $100 $100 $140Interest (3.5%) $35 $32 $27Total SG&A $949 $777 $1,172
EBT $851 $523 $1,003Taxes (25%) $213 $131 $251Net Income $638 $392 $752
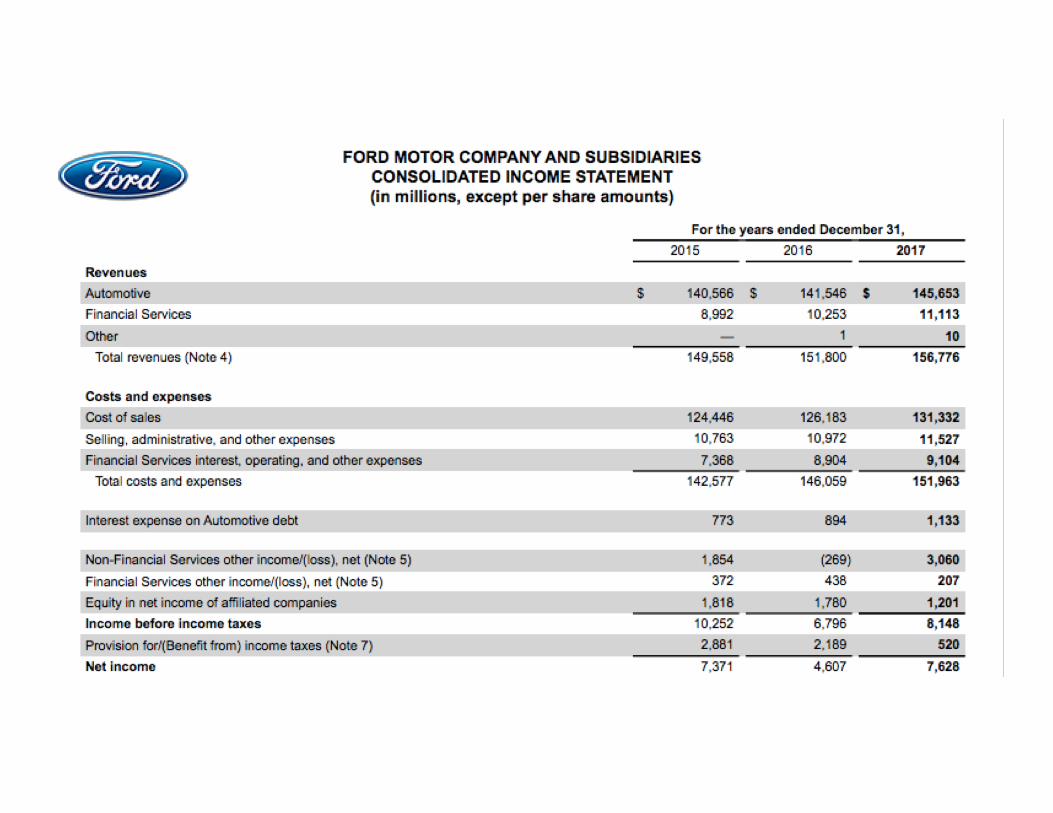
Exercise: Review Income Statements
• What is the same with these companies? What is different?• What jumps out? What requires further investigation?• How are these companies doing? Which is doing better?• What further information do you need?
BBaallaannccee SShheeeett
Assets = Liabilities + Equity
Everything you have = Everything you owe + Everything you own
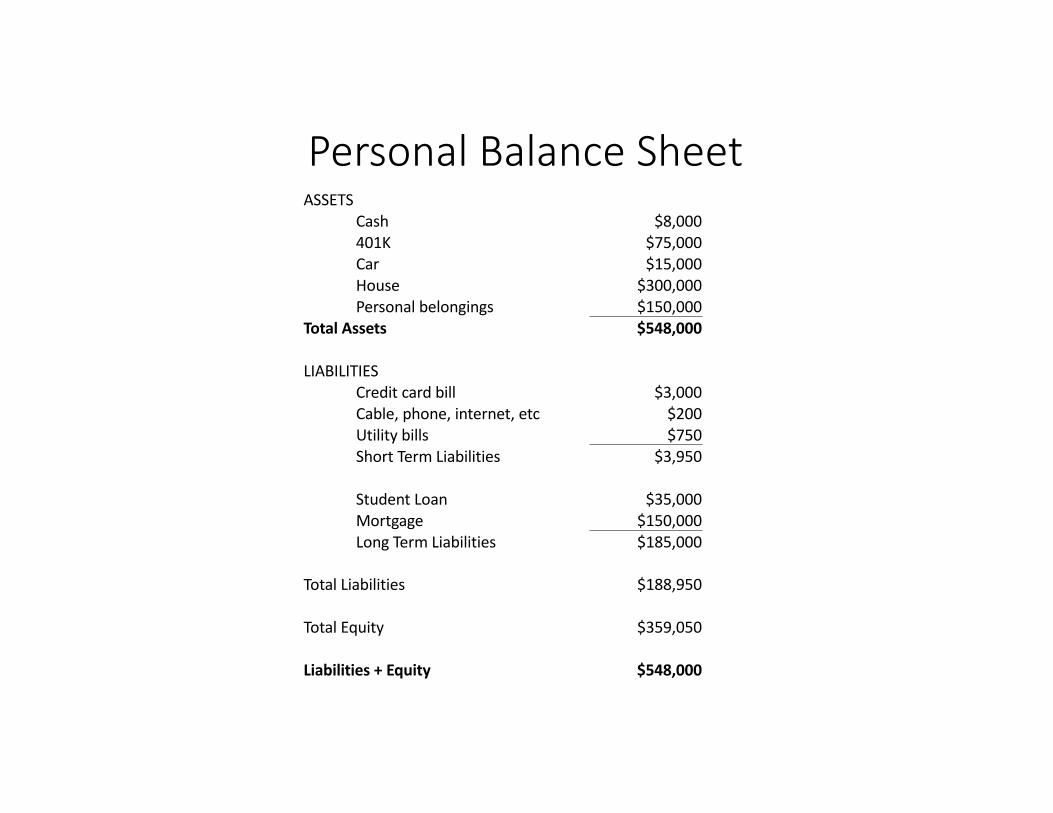
Personal Balance SheetASSETS
Cash $8,000401K $75,000Car $15,000House $300,000Personal belongings $150,000
Total Assets $548,000
LIABILITIESCredit card bill $3,000Cable, phone, internet, etc $200Utility bills $750Short Term Liabilities $3,950
Student Loan $35,000Mortgage $150,000Long Term Liabilities $185,000
Total Liabilities $188,950
Total Equity $359,050
Liabilities + Equity $548,000
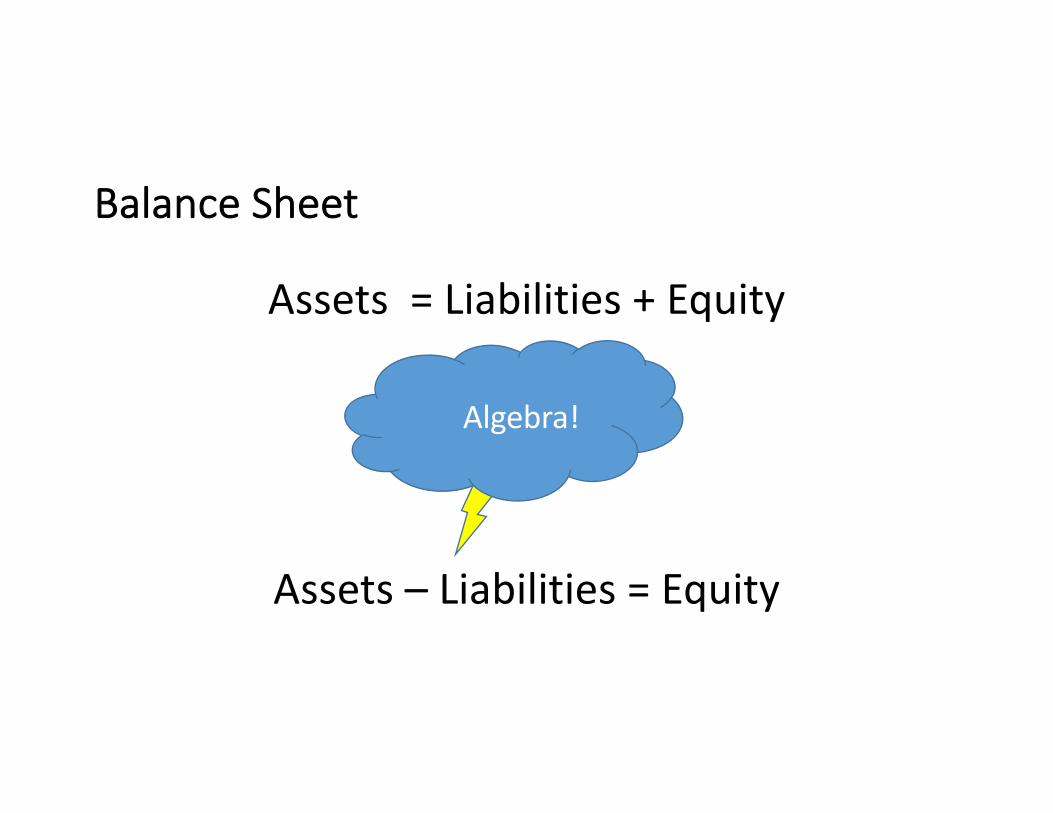
Assets = Liabilities + Equity
Assets – Liabilities = Equity
BBaallaannccee SShheeeett
Algebra!
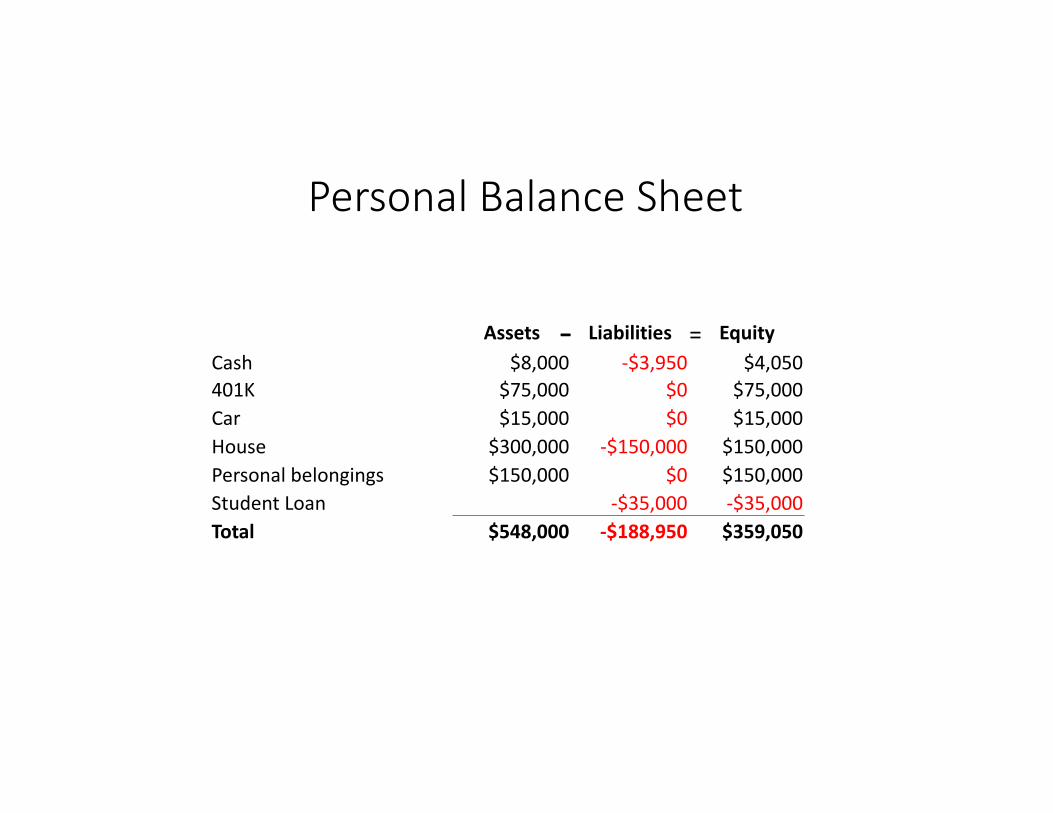
Assets Liabilities EquityCash $8,000 -$3,950 $4,050401K $75,000 $0 $75,000Car $15,000 $0 $15,000House $300,000 -$150,000 $150,000Personal belongings $150,000 $0 $150,000Student Loan -$35,000 -$35,000Total $548,000 -$188,950 $359,050
Personal Balance Sheet
- =
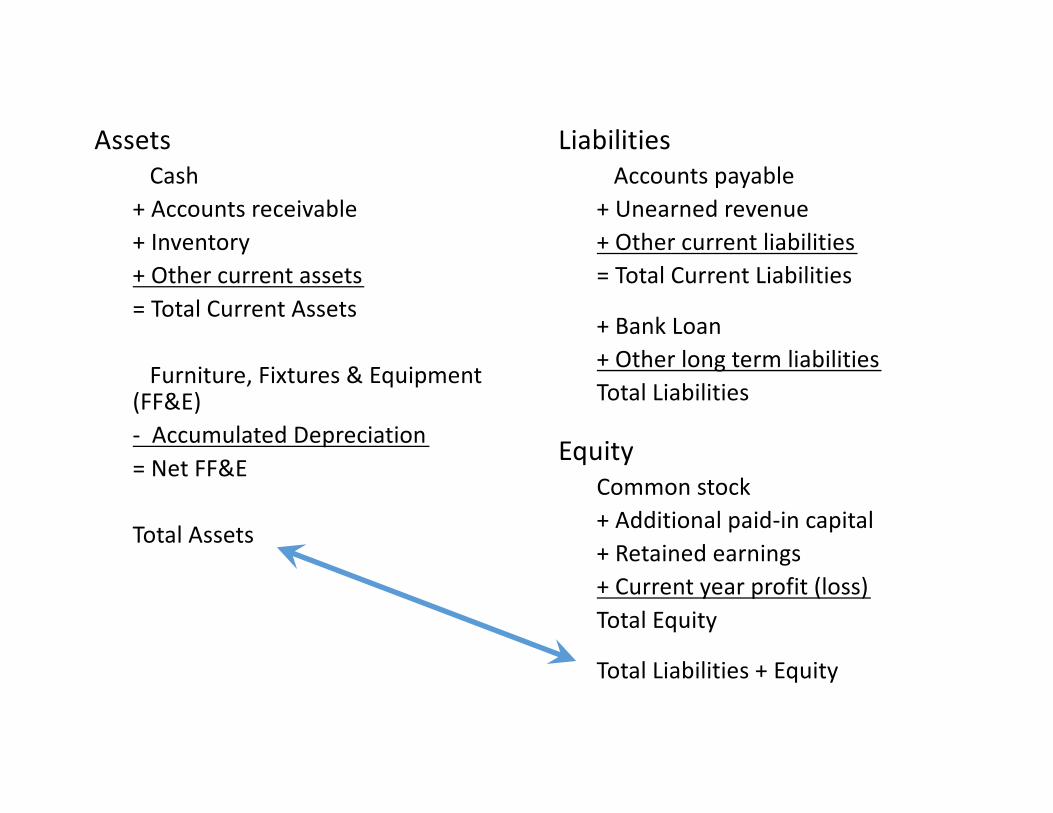
AssetsCash
+ Accounts receivable+ Inventory+ Other current assets= Total Current Assets
Furniture, Fixtures & Equipment (FF&E)- Accumulated Depreciation= Net FF&E
Total Assets
LiabilitiesAccounts payable
+ Unearned revenue+ Other current liabilities= Total Current Liabilities
+ Bank Loan+ Other long term liabilitiesTotal Liabilities
EquityCommon stock+ Additional paid-in capital+ Retained earnings+ Current year profit (loss)Total Equity
Total Liabilities + Equity
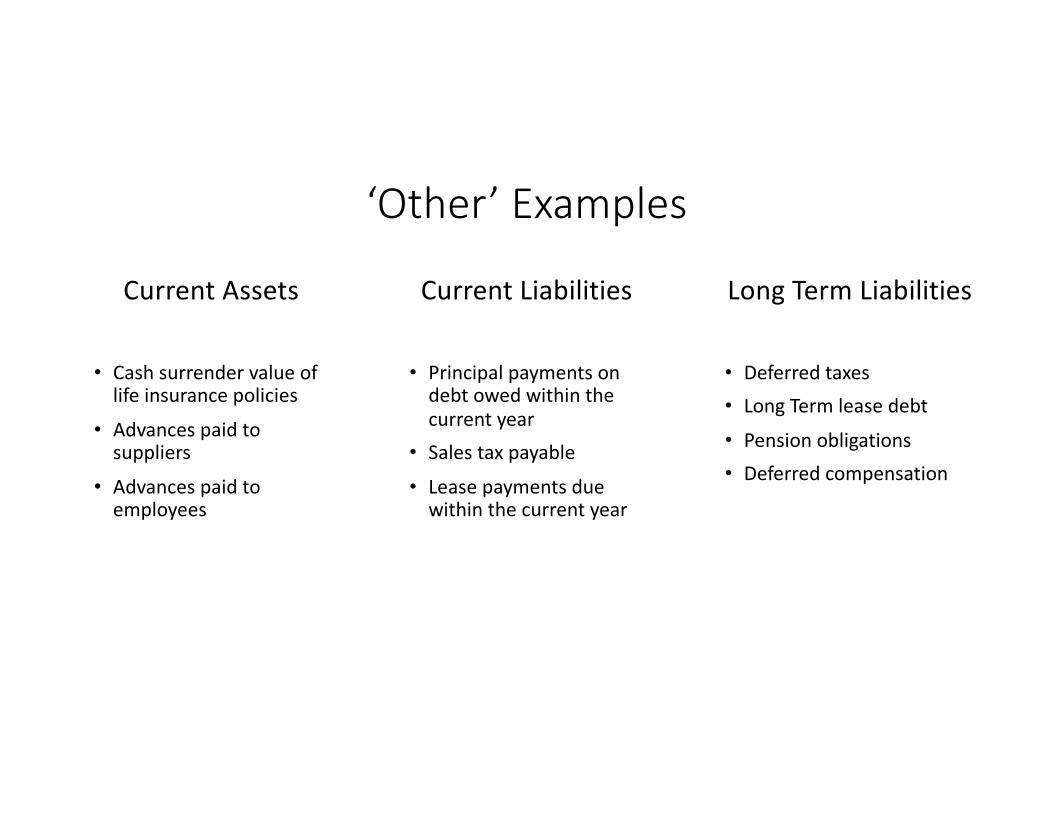
‘Other’ Examples
Current Assets
• Cash surrender value of life insurance policies
• Advances paid to suppliers
• Advances paid to employees
Current Liabilities
• Principal payments on debt owed within the current year
• Sales tax payable• Lease payments due
within the current year
Long Term Liabilities
• Deferred taxes• Long Term lease debt• Pension obligations• Deferred compensation
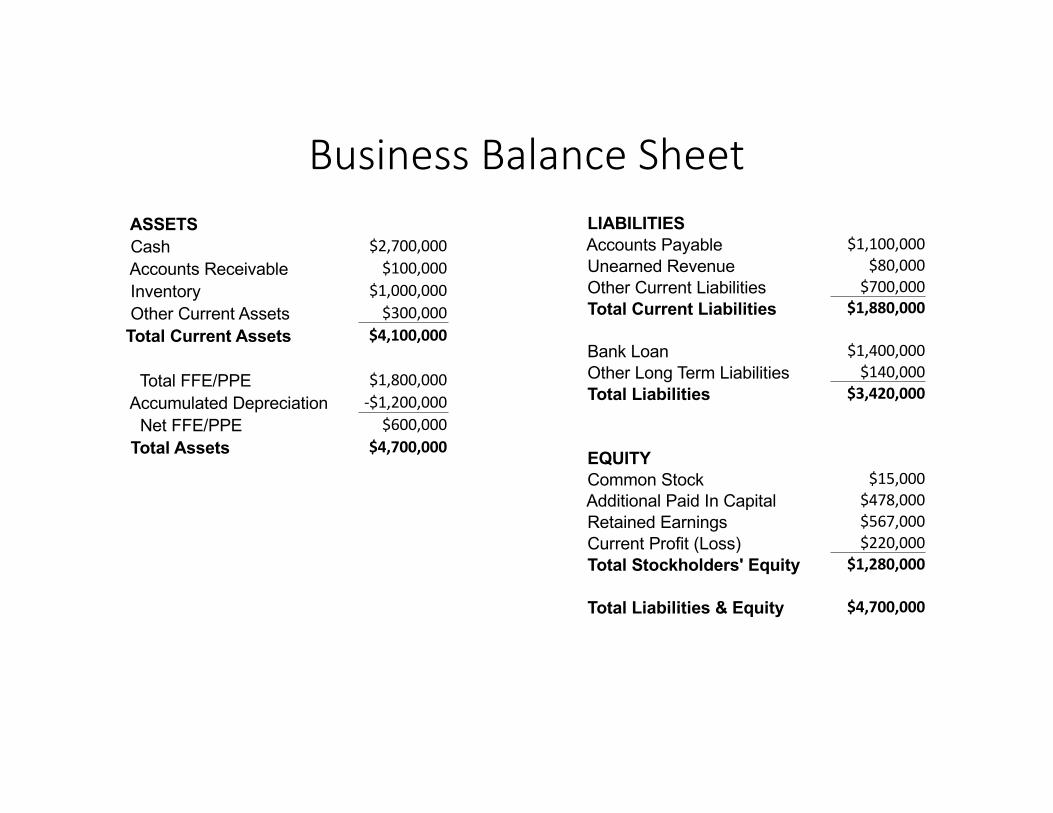
ASSETS Cash $2,700,000Accounts Receivable $100,000Inventory $1,000,000Other Current Assets $300,000Total Current Assets $4,100,000
Total FFE/PPE $1,800,000Accumulated Depreciation -$1,200,000
Net FFE/PPE $600,000Total Assets $4,700,000
LIABILITIES Accounts Payable $1,100,000Unearned Revenue $80,000Other Current Liabilities $700,000Total Current Liabilities $1,880,000
Bank Loan $1,400,000Other Long Term Liabilities $140,000Total Liabilities $3,420,000
EQUITY Common Stock $15,000Additional Paid In Capital $478,000Retained Earnings $567,000Current Profit (Loss) $220,000Total Stockholders' Equity $1,280,000
Total Liabilities & Equity $4,700,000
Business Balance Sheet
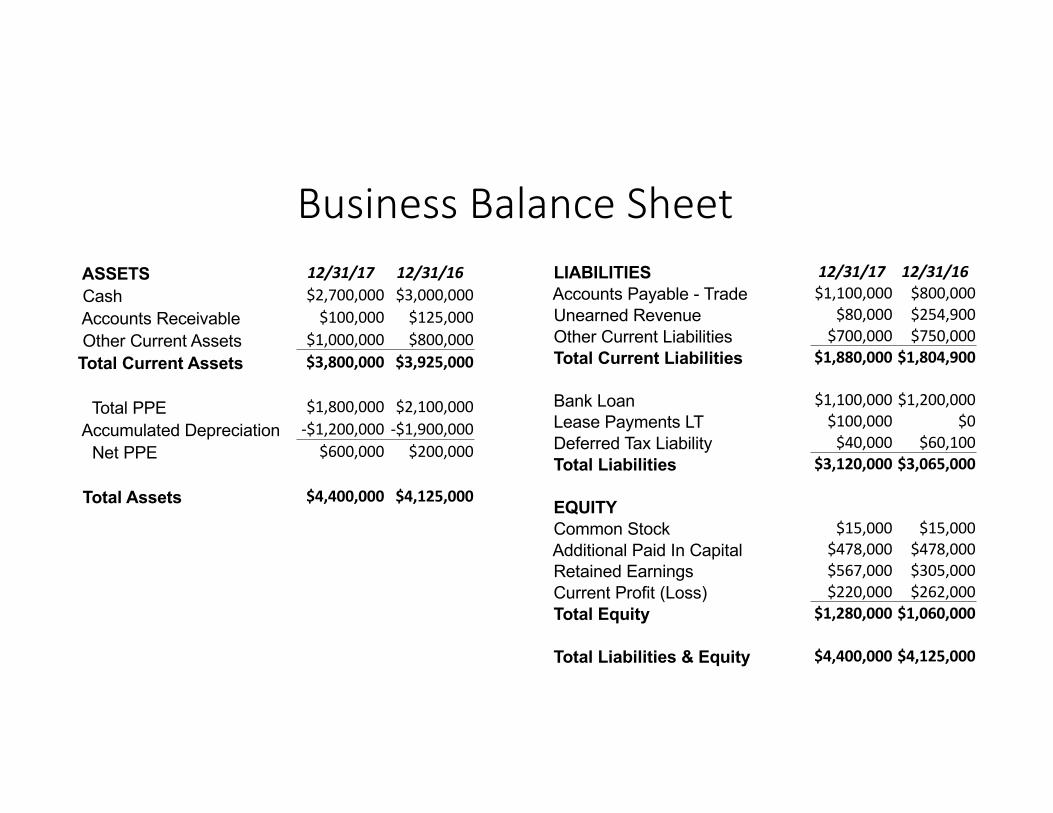
Business Balance SheetASSETS 12/31/17 12/31/16Cash $2,700,000 $3,000,000Accounts Receivable $100,000 $125,000Other Current Assets $1,000,000 $800,000Total Current Assets $3,800,000 $3,925,000
Total PPE $1,800,000 $2,100,000Accumulated Depreciation -$1,200,000 -$1,900,000
Net PPE $600,000 $200,000
Total Assets $4,400,000 $4,125,000
LIABILITIES 12/31/17 12/31/16Accounts Payable - Trade $1,100,000 $800,000Unearned Revenue $80,000 $254,900Other Current Liabilities $700,000 $750,000Total Current Liabilities $1,880,000 $1,804,900
Bank Loan $1,100,000 $1,200,000Lease Payments LT $100,000 $0Deferred Tax Liability $40,000 $60,100Total Liabilities $3,120,000 $3,065,000
EQUITY Common Stock $15,000 $15,000Additional Paid In Capital $478,000 $478,000Retained Earnings $567,000 $305,000Current Profit (Loss) $220,000 $262,000Total Equity $1,280,000 $1,060,000
Total Liabilities & Equity $4,400,000 $4,125,000
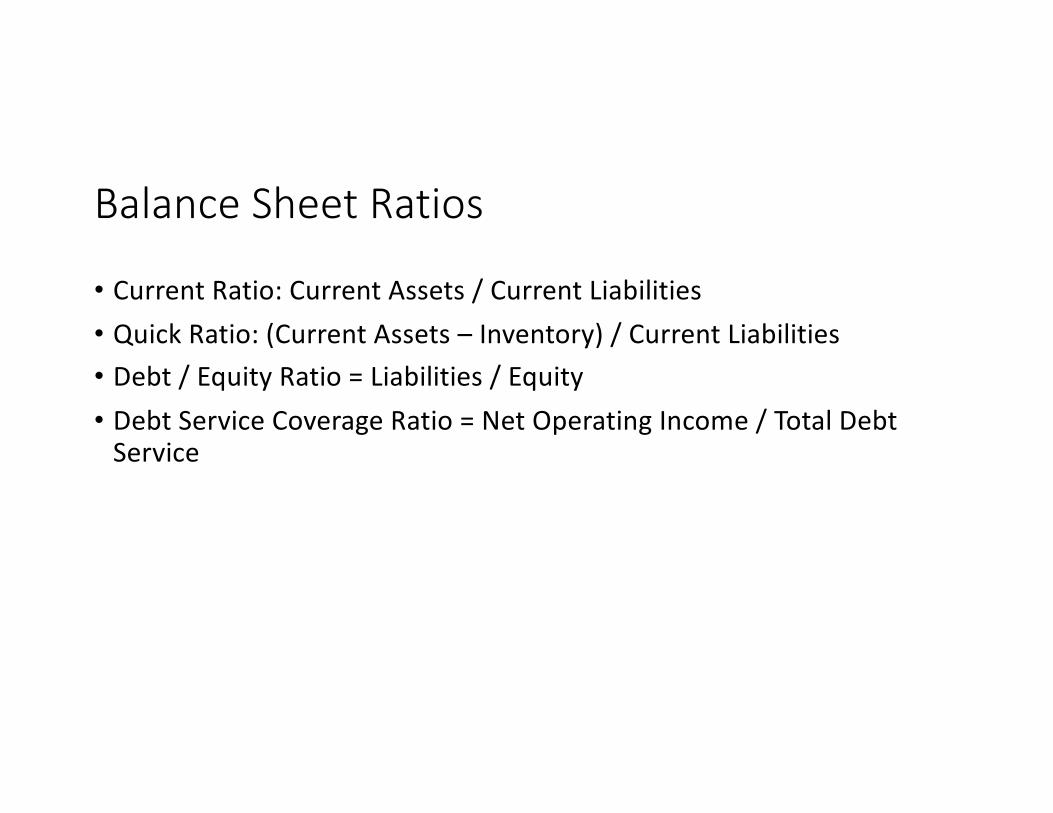
Balance Sheet Ratios
• Current Ratio: Current Assets / Current Liabilities• Quick Ratio: (Current Assets – Inventory) / Current Liabilities• Debt / Equity Ratio = Liabilities / Equity• Debt Service Coverage Ratio = Net Operating Income / Total Debt
Service

Business Balance SheetASSETS 12/31/17 12/31/16Cash $2,700,000 $3,000,000Accounts Receivable $100,000 $125,000Other Current Assets $1,000,000 $800,000Total Current Assets $3,800,000 $3,925,000
Total PPE $1,800,000 $2,100,000Accumulated Depreciation -$1,200,000 -$1,900,000
Net PPE $600,000 $200,000
Total Assets $4,400,000 $4,125,000
LIABILITIES 12/31/17 12/31/16Accounts Payable - Trade $1,100,000 $800,000Unearned Revenue $80,000 $254,900Other Current Liabilities $700,000 $750,000Total Current Liabilities $1,880,000 $1,804,900
Bank Loan $1,100,000 $1,200,000Lease Payments LT $100,000 $0Deferred Tax Liability $40,000 $60,100Total Liabilities $3,120,000 $3,065,000
EQUITY Common Stock $15,000 $15,000Additional Paid In Capital $478,000 $478,000Retained Earnings $567,000 $305,000Current Profit (Loss) $220,000 $262,000Total Equity $1,280,000 $1,060,000
Total Liabilities & Equity $4,400,000 $4,125,000
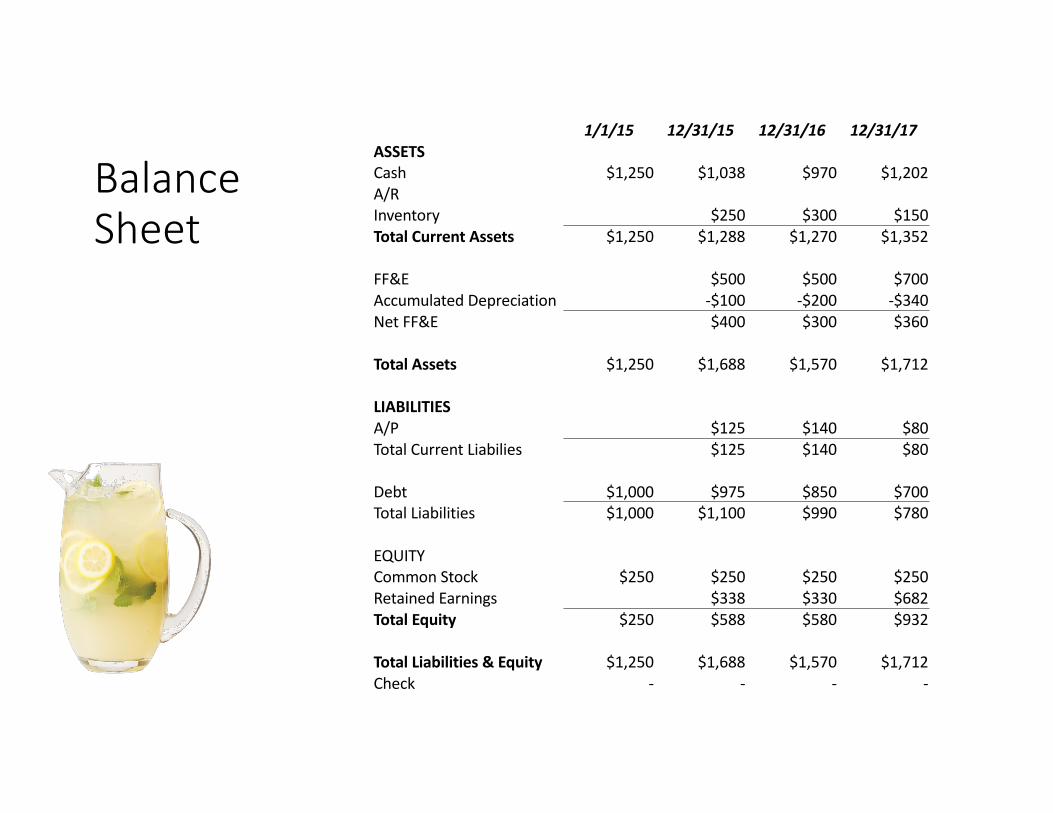
Balance Sheet
1/1/15 12/31/15 12/31/16 12/31/17ASSETSCash $1,250 $1,038 $970 $1,202A/RInventory $250 $300 $150Total Current Assets $1,250 $1,288 $1,270 $1,352
FF&E $500 $500 $700Accumulated Depreciation -$100 -$200 -$340Net FF&E $400 $300 $360
Total Assets $1,250 $1,688 $1,570 $1,712
LIABILITIESA/P $125 $140 $80Total Current Liabilies $125 $140 $80
Debt $1,000 $975 $850 $700Total Liabilities $1,000 $1,100 $990 $780
EQUITYCommon Stock $250 $250 $250 $250Retained Earnings $338 $330 $682Total Equity $250 $588 $580 $932
Total Liabilities & Equity $1,250 $1,688 $1,570 $1,712Check - - - -
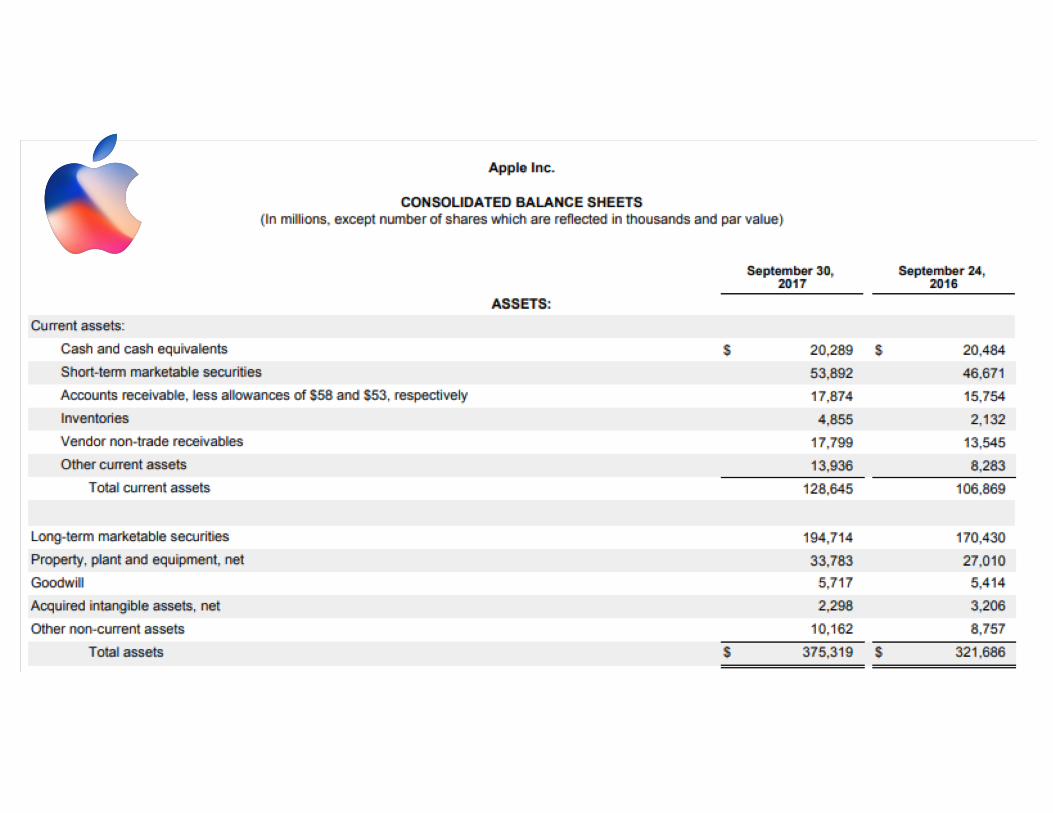
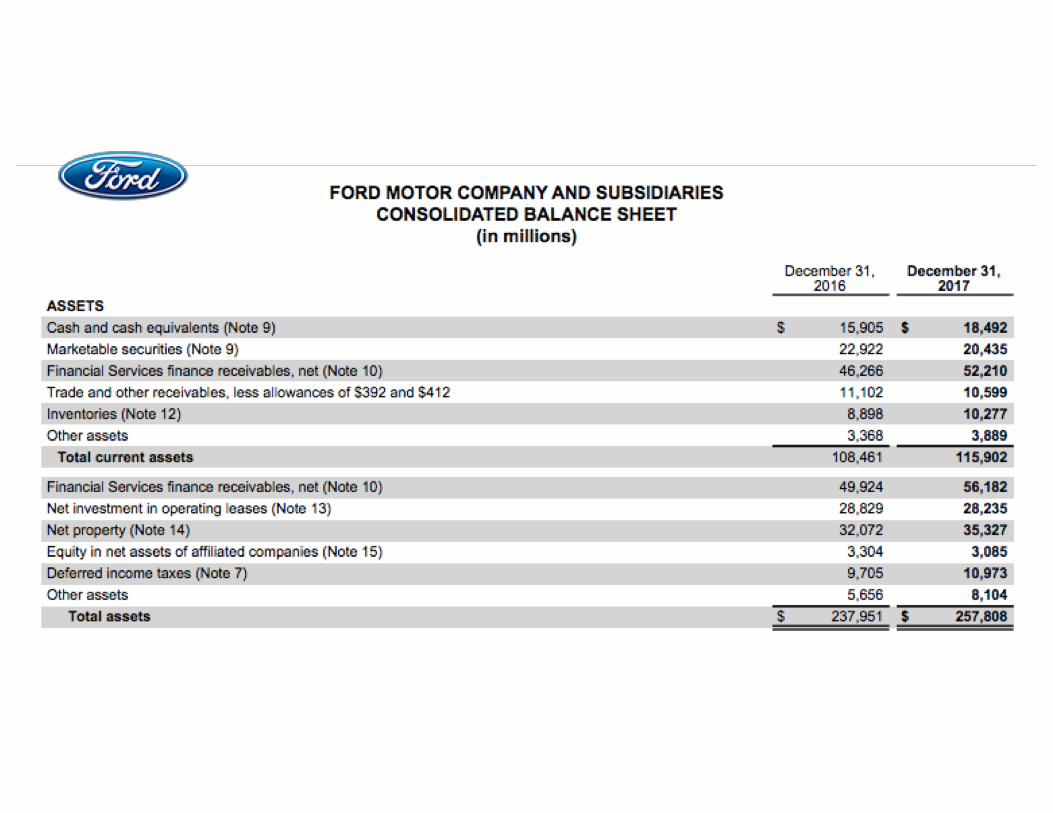
Exercise: Review Balance Sheets
• What is the same with these companies? What is different?• What jumps out? What requires further investigation?• How are these companies doing? Which is doing better?• What further information do you need?
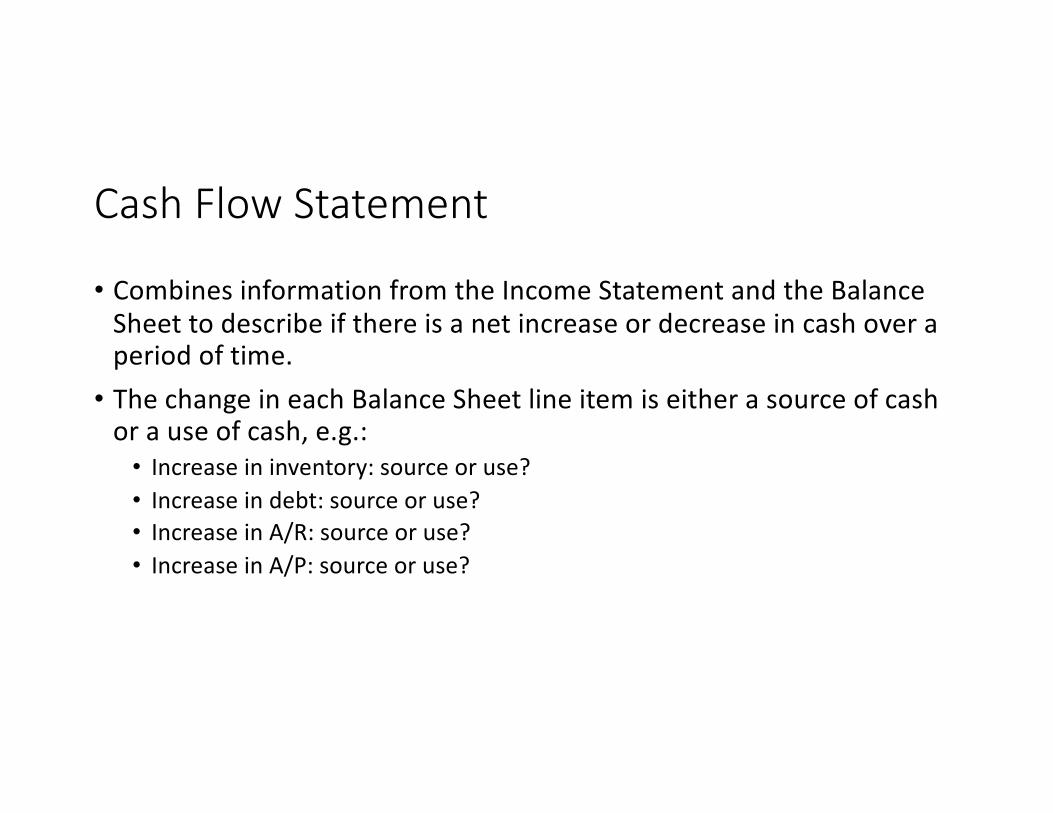
Cash Flow Statement
• Combines information from the Income Statement and the Balance Sheet to describe if there is a net increase or decrease in cash over a period of time.• The change in each Balance Sheet line item is either a source of cash
or a use of cash, e.g.:• Increase in inventory: source or use?• Increase in debt: source or use?• Increase in A/R: source or use?• Increase in A/P: source or use?
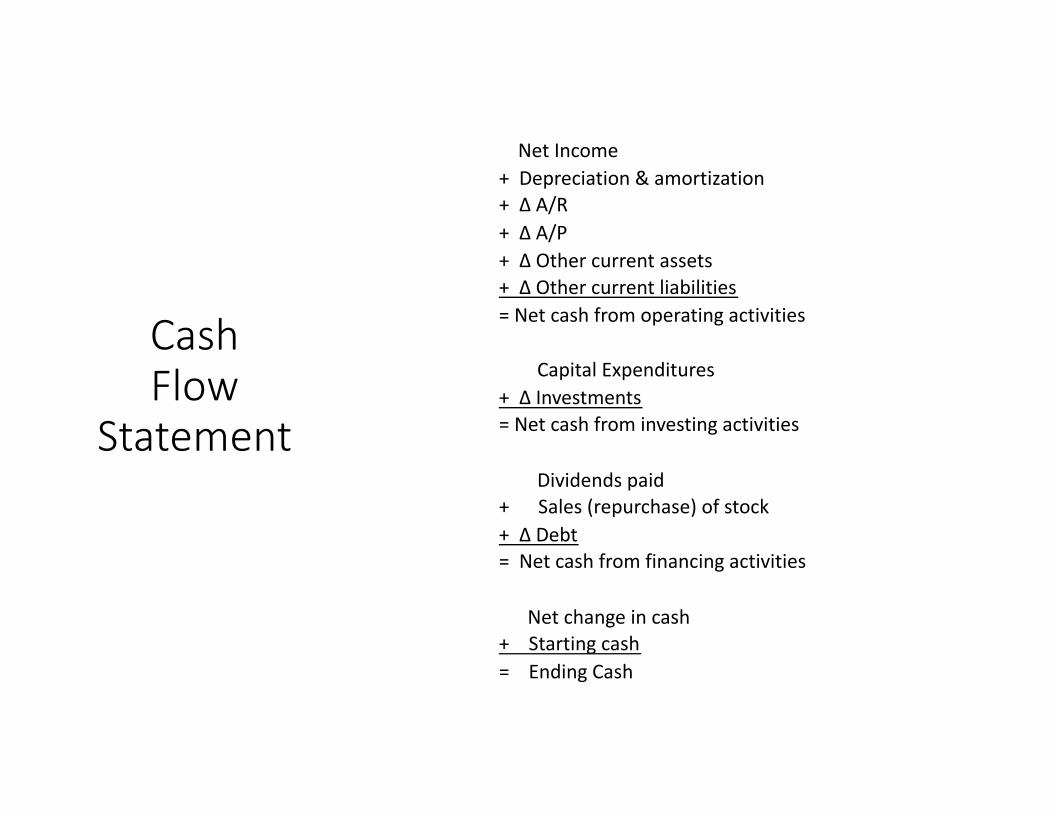
Net Income+ Depreciation & amortization+ ∆ A/R+ ∆ A/P+ ∆ Other current assets+ ∆ Other current liabilities= Net cash from operating activities
Capital Expenditures+ ∆ Investments= Net cash from investing activities
Dividends paid+ Sales (repurchase) of stock+ ∆ Debt= Net cash from financing activities
Net change in cash+ Starting cash= Ending Cash
CashFlow
Statement
Cash Flow Statement
• Net Income is the starting point• Depreciation & Amortization (D&A) get added back• Principal Payments not on Income Statement• Dividends not on Income Statement• Cash flows to Balance Sheet
Tying it all together….
• Lemonade, Inc.• Operate for 3 years• Income statement• Balance Sheet• Cash Flow Statement
Income Statement
12/31/15 12/31/16 12/31/17Sales $3,000 $2,600 $4,000COGs $1,200 $1,300 $1,825Gross Margin $1,800 $1,300 $2,175
% 60.0% 50.0% 54.4%
Labor $300 $325 $375Benefits $0 $0 $0Payroll Taxes $31 $33 $38Total Labor $331 $358 $413
Advertising $150 $50 $200Professional Services $100 $100 $100Rent $84 $87 $92Utilities $150 $50 $200Depreciation $100 $100 $140Interest (3.5%) $35 $32 $27Total SG&A $949 $777 $1,172
EBT $851 $523 $1,003Taxes (25%) $213 $131 $251Net Income $638 $392 $752

Balance Sheet
1/1/15 12/31/15 12/31/16 12/31/17ASSETSCash $1,250 $1,038 $970 $1,202A/RInventory $250 $300 $150Total Current Assets $1,250 $1,288 $1,270 $1,352
FF&E $500 $500 $700Accumulated Depreciation -$100 -$200 -$340Net FF&E $400 $300 $360
Total Assets $1,250 $1,688 $1,570 $1,712
LIABILITIESA/P $125 $140 $80Total Current Liabilies $125 $140 $80
Debt $1,000 $975 $850 $700Total Liabilities $1,000 $1,100 $990 $780
EQUITYCommon Stock $250 $250 $250 $250Retained Earnings $338 $330 $682Total Equity $250 $588 $580 $932
Total Liabilities & Equity $1,250 $1,688 $1,570 $1,712Check - - - -
CashFlow
Statement
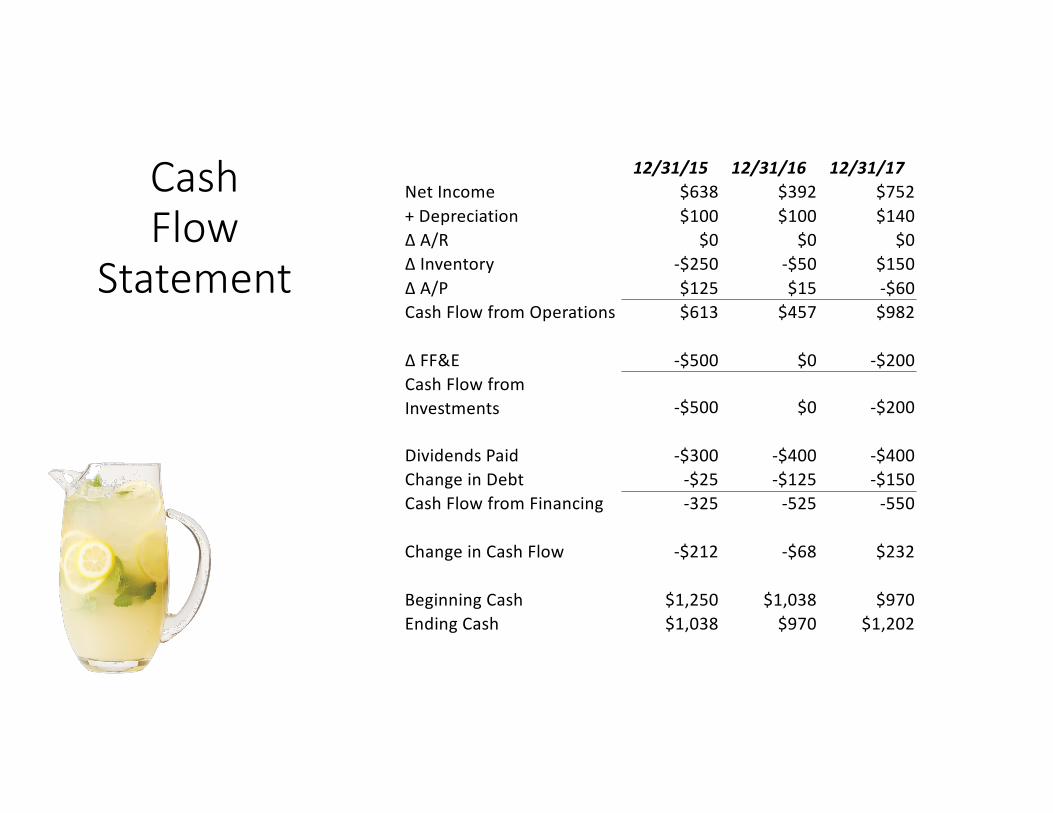
12/31/15 12/31/16 12/31/17Net Income $638 $392 $752+ Depreciation $100 $100 $140∆ A/R $0 $0 $0∆ Inventory -$250 -$50 $150∆ A/P $125 $15 -$60Cash Flow from Operations $613 $457 $982
∆ FF&E -$500 $0 -$200Cash Flow from Investments -$500 $0 -$200
Dividends Paid -$300 -$400 -$400Change in Debt -$25 -$125 -$150Cash Flow from Financing -325 -525 -550
Change in Cash Flow -$212 -$68 $232
Beginning Cash $1,250 $1,038 $970Ending Cash $1,038 $970 $1,202
Tying it all together
• As Inventory is sold, moves from Balance Sheet to Income Statement• Depreciation (IS) hits Accumulated Depreciation (BS) and
Depreciation add back (CFS)• Net income (IS) flows to Retained Earnings (BS) and Net Income (CFS)• Change in period balance sheet accounts reflected on cash flow
statement• Ending cash calculated on CFS is reflected as actual cash on Balance
Sheet
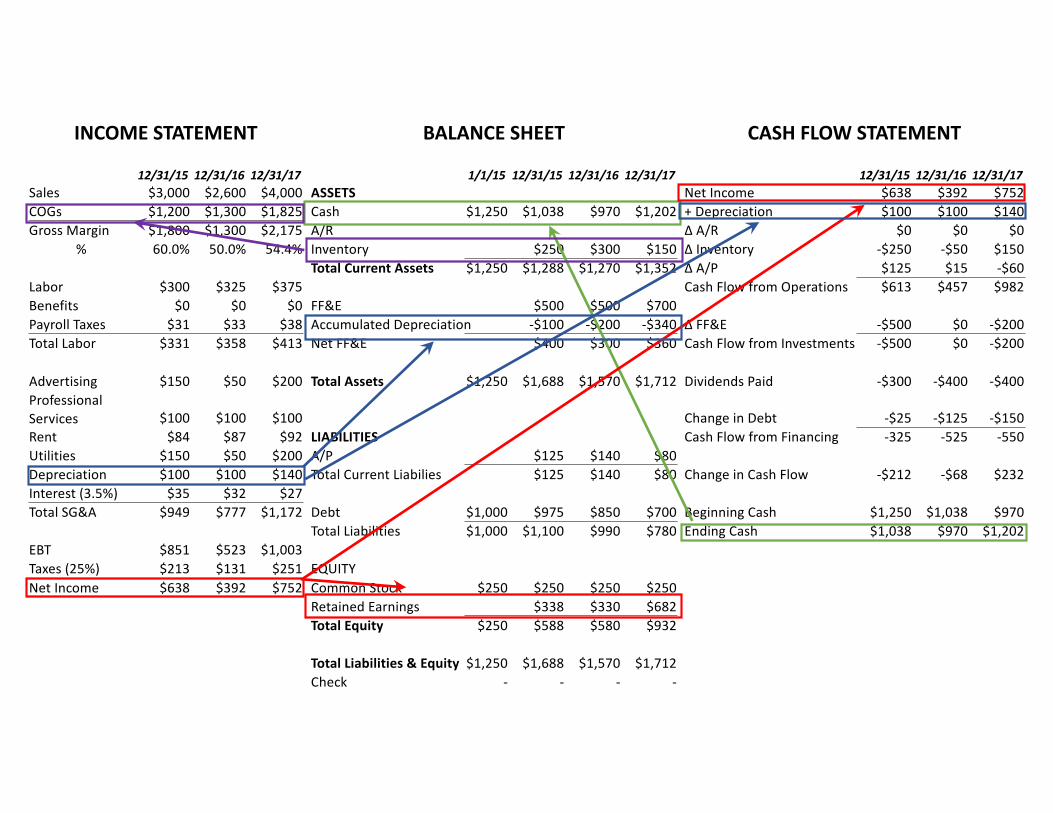
INCOME STATEMENT BALANCE SHEET CASH FLOW STATEMENT
12/31/15 12/31/16 12/31/17 1/1/15 12/31/15 12/31/16 12/31/17 12/31/15 12/31/16 12/31/17Sales $3,000 $2,600 $4,000 ASSETS Net Income $638 $392 $752COGs $1,200 $1,300 $1,825 Cash $1,250 $1,038 $970 $1,202 + Depreciation $100 $100 $140Gross Margin $1,800 $1,300 $2,175 A/R ∆ A/R $0 $0 $0
% 60.0% 50.0% 54.4% Inventory $250 $300 $150 ∆ Inventory -$250 -$50 $150Total Current Assets $1,250 $1,288 $1,270 $1,352 ∆ A/P $125 $15 -$60
Labor $300 $325 $375 Cash Flow from Operations $613 $457 $982Benefits $0 $0 $0 FF&E $500 $500 $700Payroll Taxes $31 $33 $38 Accumulated Depreciation -$100 -$200 -$340 ∆ FF&E -$500 $0 -$200Total Labor $331 $358 $413 Net FF&E $400 $300 $360 Cash Flow from Investments -$500 $0 -$200
Advertising $150 $50 $200 Total Assets $1,250 $1,688 $1,570 $1,712 Dividends Paid -$300 -$400 -$400Professional Services $100 $100 $100 Change in Debt -$25 -$125 -$150Rent $84 $87 $92 LIABILITIES Cash Flow from Financing -325 -525 -550Utilities $150 $50 $200 A/P $125 $140 $80Depreciation $100 $100 $140 Total Current Liabilies $125 $140 $80 Change in Cash Flow -$212 -$68 $232Interest (3.5%) $35 $32 $27Total SG&A $949 $777 $1,172 Debt $1,000 $975 $850 $700 Beginning Cash $1,250 $1,038 $970
Total Liabilities $1,000 $1,100 $990 $780 Ending Cash $1,038 $970 $1,202EBT $851 $523 $1,003Taxes (25%) $213 $131 $251 EQUITYNet Income $638 $392 $752 Common Stock $250 $250 $250 $250
Retained Earnings $338 $330 $682Total Equity $250 $588 $580 $932
Total Liabilities & Equity $1,250 $1,688 $1,570 $1,712Check - - - -

Q&A