Embed Size (px)
DESCRIPTION
Understanding Financial Statements. Prepared for Delaware Valley Grantmakers 11/2011. Katherine Reilly, CMA [email protected]. Introduction Why read financial reports? What do they tell you? Should they receive a grant? Would you want to be on the Board?. Agenda Financial Reports - PowerPoint PPT Presentation
Citation preview

Understanding Financial Statements
Prepared for Delaware Valley Grantmakers
11/2011
Katherine Reilly, CMA

Introduction
• Why read financial reports?• What do they tell you?
• Should they receive a grant?• Would you want to be on the Board?

AgendaFinancial Reports
Statement of Financial Position
Statement of Financial Activity
Statement of Cashflow
Statement of Functional Expenditure
Ratios
Audits vs 990
Operating Reserve
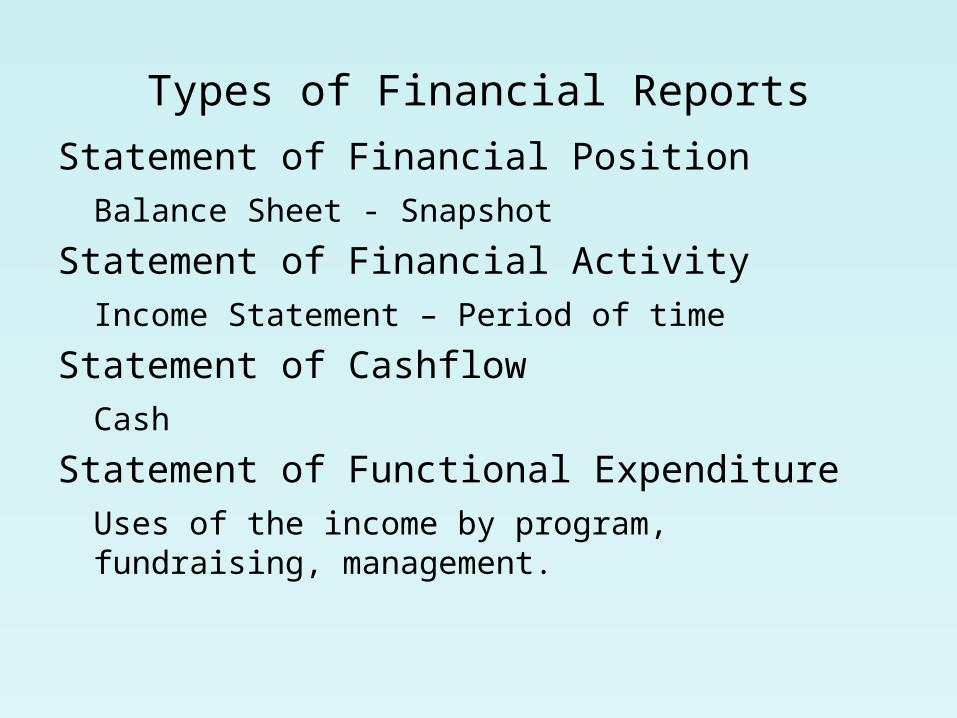
Types of Financial Reports
Statement of Financial Position
Balance Sheet - Snapshot
Statement of Financial Activity
Income Statement – Period of time
Statement of Cashflow
Cash
Statement of Functional Expenditure
Uses of the income by program, fundraising, management.
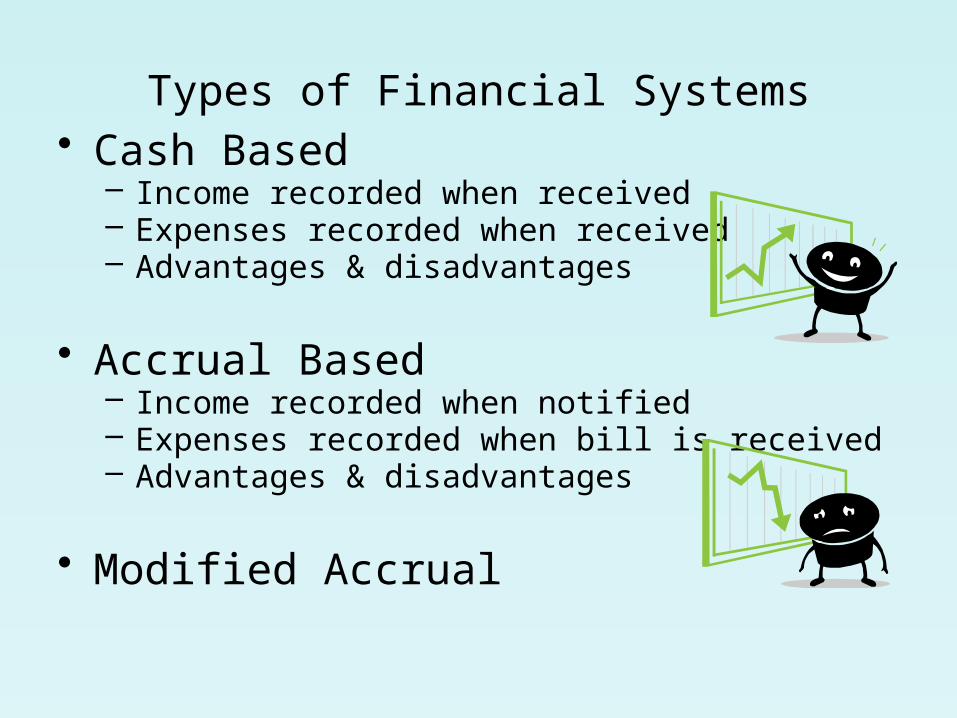
Types of Financial Systems• Cash Based
– Income recorded when received– Expenses recorded when received– Advantages & disadvantages
• Accrual Based– Income recorded when notified– Expenses recorded when bill is received– Advantages & disadvantages
• Modified Accrual
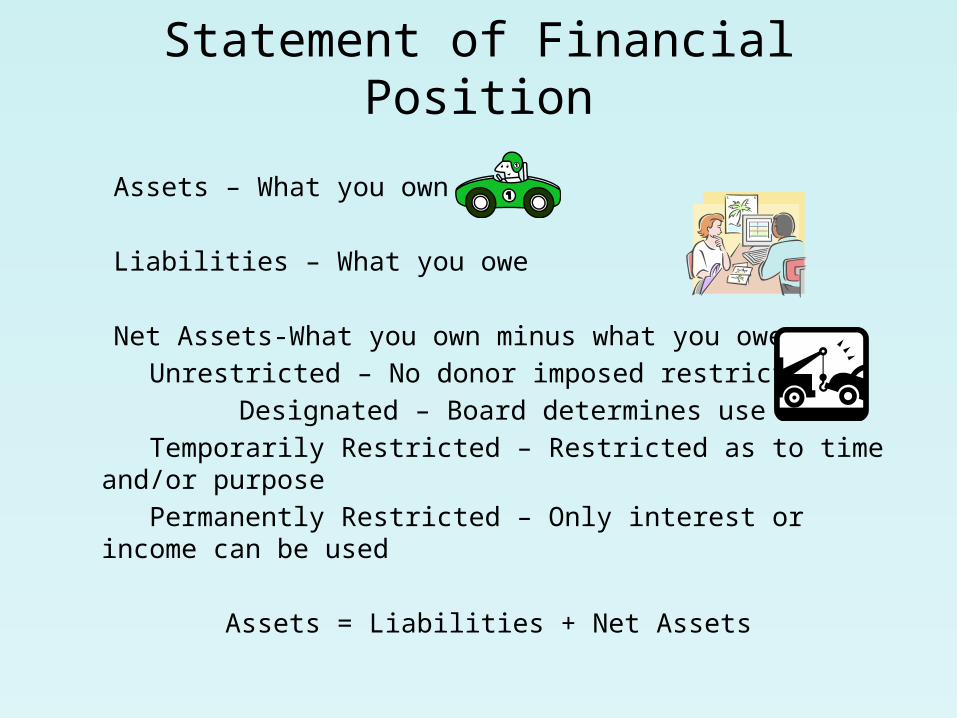
Statement of Financial Position
Assets – What you own
Liabilities – What you owe
Net Assets-What you own minus what you owe
Unrestricted – No donor imposed restrictions
Designated – Board determines use
Temporarily Restricted – Restricted as to time and/or purpose
Permanently Restricted – Only interest or income can be used
Assets = Liabilities + Net Assets

Statement of Financial Activity
Income – Contributions that arrive or is owed youContributions – Money, some in-kind contributionsUse of temporarily restricted fundsAccounts Receivable = Income
Expenses – OutflowAccounts Payable = Expenses
Net Income – Income minus expenses
2010 2009CURRENT ASSETS Cash and cash equivalents 103,000$ 80,000$ Accounts receivable, Fee for Service contracts, net of allowance for doubtful accounts of $25,000 and $40,000 at June 30, 2010 and 2009, respectively 850,000 700,000 Accounts receivable, other, net of allowance for doubtful accounts of $100,000 and $96,000 at June 30, 2010 and 2009, respectively 692,000 1,570,000 Total current assets 1,645,000$ 2,350,000$ PROPERTY AND EQUIPMENT Furniture and equipment 1,400,000 1,180,000 Leasehold improvements 220,000 220,000
1,620,000 1,400,000 Less accumulated depreciation and amortization 1,320,000 1,240,000 Total property and equipment 300,000 160,000
Total Assets 1,945,000$ 2,510,000$
LIABILITIES Accounts payable 605,000$ 400,000$ Deferred Revenue 45,000 Accrued salaries and vacation 947,000 750,000 Line of credit 100,000 250,000 Total current liabilities 1,697,000$ 1,400,000$ NET ASSETS Unrestricted 65,000$ 650,000$ Temporarily restricted 160,000 460,000 Total net assets 225,000$ 1,110,000$
Total Liabilities and Net Assets 1,922,000$ 2,510,000$
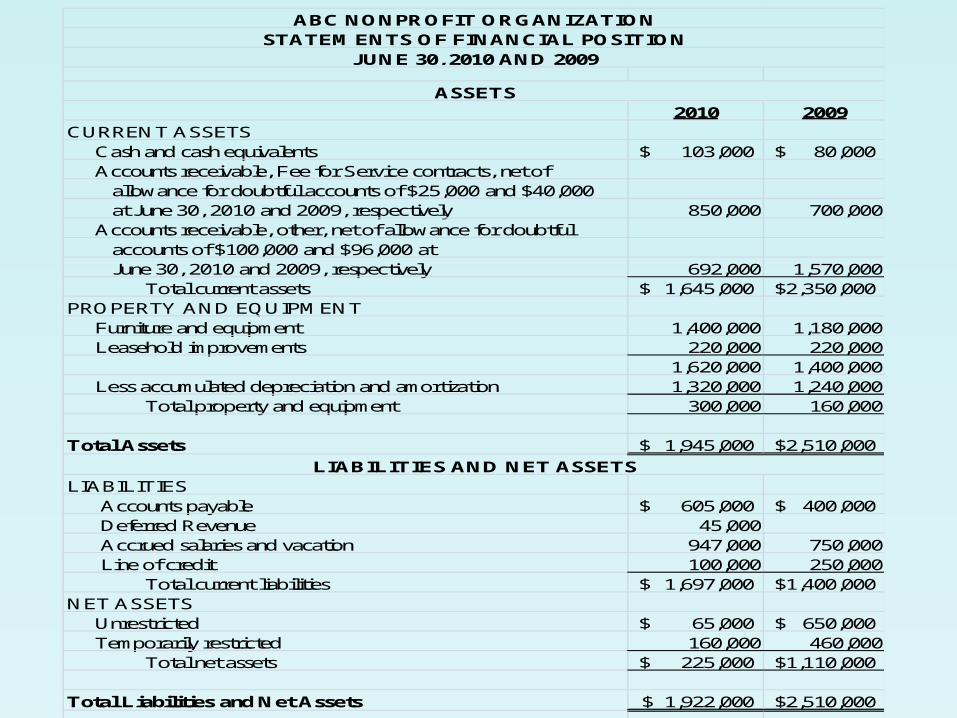
ABC NONPROFIT ORGANIZATIONSTATEMENTS OF FINANCIAL POSITION
JUNE 30, 2010 AND 2009
ASSETS
LIABILITIES AND NET ASSETS
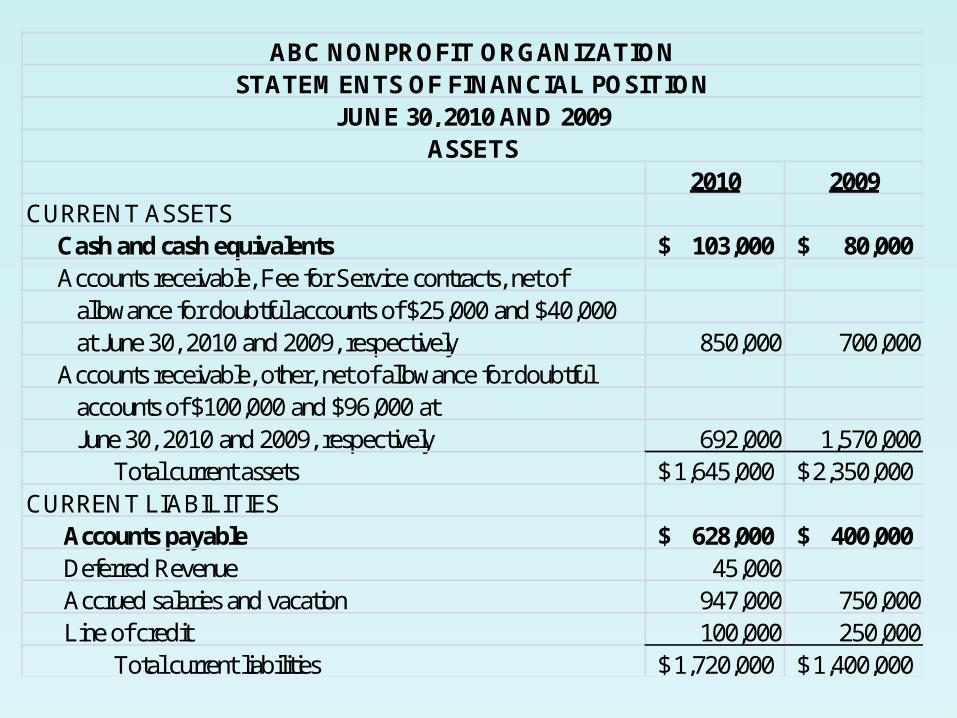
2010 2009CURRENT ASSETS Cash and cash equivalents 103,000$ 80,000$ Accounts receivable, Fee for Service contracts, net of allowance for doubtful accounts of $25,000 and $40,000 at June 30, 2010 and 2009, respectively 850,000 700,000 Accounts receivable, other, net of allowance for doubtful accounts of $100,000 and $96,000 at June 30, 2010 and 2009, respectively 692,000 1,570,000 Total current assets 1,645,000$ 2,350,000$ CURRENT LIABILITIES Accounts payable 628,000$ 400,000$ Deferred Revenue 45,000 Accrued salaries and vacation 947,000 750,000 Line of credit 100,000 250,000 Total current liabilities 1,720,000$ 1,400,000$
ABC NONPROFIT ORGANIZATIONSTATEMENTS OF FINANCIAL POSITION
JUNE 30, 2010 AND 2009ASSETS

2010 2009PROPERTY AND EQUIPMENT Furniture and equipment 1,400,000 1,180,000 Leasehold improvements 220,000 220,000
1,620,000 1,400,000 Less accumulated depreciation and amortization 1,320,000 1,240,000 Total property and equipment 300,000 160,000
ABC NONPROFIT ORGANIZATIONSTATEMENTS OF FINANCIAL POSITION
JUNE 30, 2010 AND 2009ASSETS
2010 2009
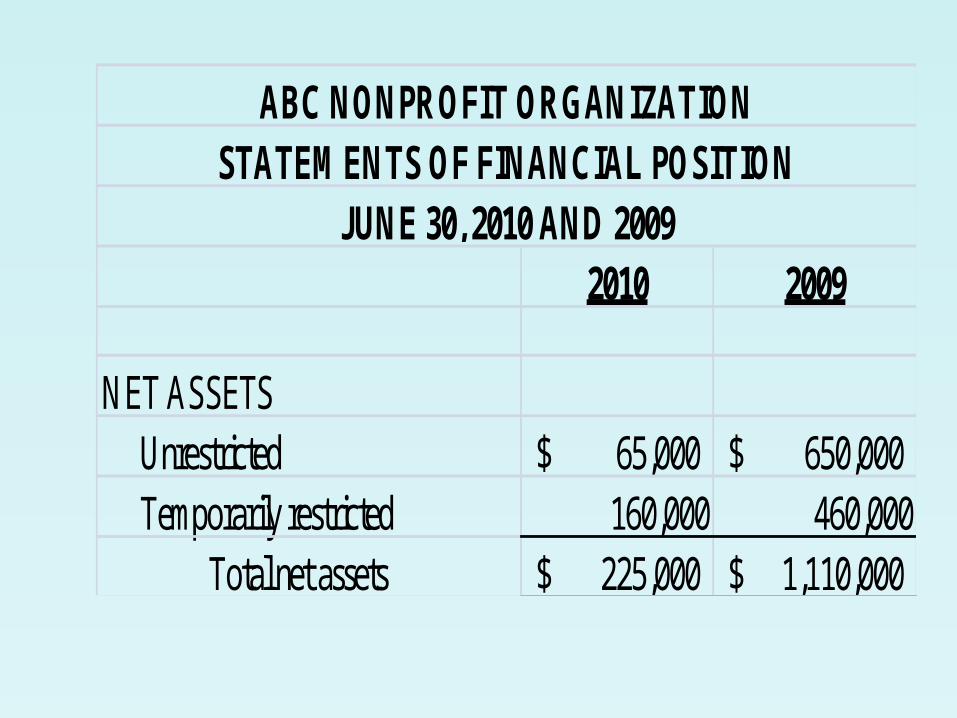
NET ASSETS Unrestricted 65,000$ 650,000$ Temporarily restricted 160,000 460,000 Total net assets 225,000$ 1,110,000$
ABC NONPROFIT ORGANIZATIONSTATEMENTS OF FINANCIAL POSITION
JUNE 30, 2010 AND 2009

2010 2009CURRENT ASSETS Cash and cash equivalents 103,000$ 80,000$ Accounts receivable, Fee for Service contracts, net of allowance for doubtful accounts of $25,000 and $40,000 at June 30, 2010 and 2009, respectively 850,000 700,000 Accounts receivable, other, net of allowance for doubtful accounts of $100,000 and $96,000 at June 30, 2010 and 2009, respectively 692,000 1,570,000 Total current assets 1,645,000$ 2,350,000$ PROPERTY AND EQUIPMENT Furniture and equipment 1,400,000 1,180,000 Leasehold improvements 220,000 220,000
1,620,000 1,400,000 Less accumulated depreciation and amortization 1,320,000 1,240,000 Total property and equipment 300,000 160,000
Total Assets 1,945,000$ 2,510,000$
LIABILITIES Accounts payable 605,000$ 400,000$ Deferred Revenue 45,000 Accrued salaries and vacation 947,000 750,000 Line of credit 100,000 250,000 Total current liabilities 1,697,000$ 1,400,000$ NET ASSETS Unrestricted 65,000$ 650,000$ Temporarily restricted 160,000 460,000 Total net assets 225,000$ 1,110,000$
Total Liabilities and Net Assets 1,922,000$ 2,510,000$
ABC NONPROFIT ORGANIZATIONSTATEMENTS OF FINANCIAL POSITION
JUNE 30, 2010 AND 2009
ASSETS
LIABILITIES AND NET ASSETS
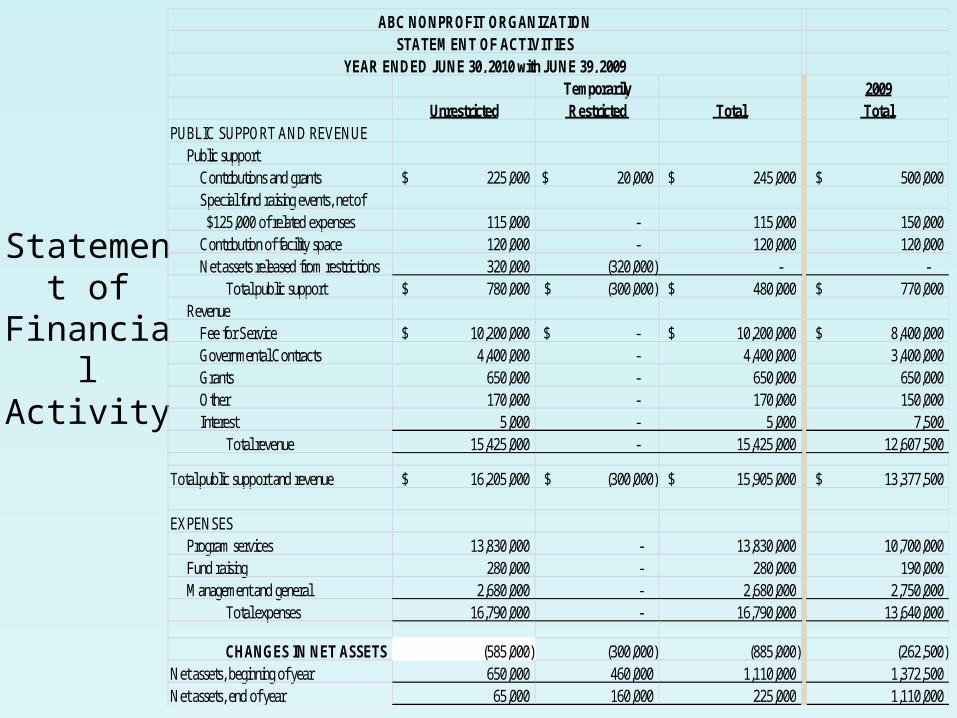
Statement of
Financial Activity
Temporarily 2009Unrestricted Restricted Total Total
PUBLIC SUPPORT AND REVENUE Public support Contributions and grants 225,000$ 20,000$ 245,000$ 500,000$ Special fund raising events, net of $125,000 of related expenses 115,000 - 115,000 150,000 Contribution of facility space 120,000 - 120,000 120,000 Net assets released from restrictions 320,000 (320,000) - - Total public support 780,000$ (300,000)$ 480,000$ 770,000$ Revenue Fee for Service 10,200,000$ -$ 10,200,000$ 8,400,000$ Governmental Contracts 4,400,000 - 4,400,000 3,400,000 Grants 650,000 - 650,000 650,000 Other 170,000 - 170,000 150,000 Interest 5,000 - 5,000 7,500 Total revenue 15,425,000 - 15,425,000 12,607,500
Total public support and revenue 16,205,000$ (300,000)$ 15,905,000$ 13,377,500$
EXPENSES Program services 13,830,000 - 13,830,000 10,700,000 Fund raising 280,000 - 280,000 190,000 Management and general 2,680,000 - 2,680,000 2,750,000 Total expenses 16,790,000 - 16,790,000 13,640,000
CHANGES IN NET ASSETS (585,000) (300,000) (885,000) (262,500)Net assets, beginning of year 650,000 460,000 1,110,000 1,372,500 Net assets, end of year 65,000 160,000 225,000 1,110,000
ABC NONPROFIT ORGANIZATIONSTATEMENT OF ACTIVITIES
YEAR ENDED JUNE 30, 2010 with JUNE 39, 2009

2010 2009 % Change
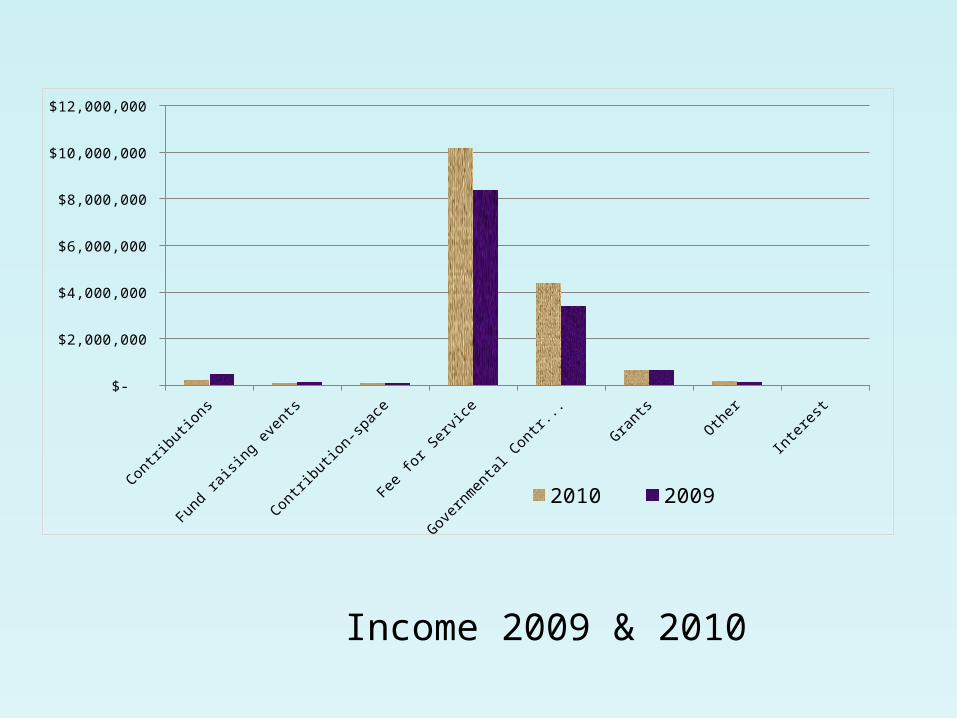
Contributions $ 245,000 $ 500,000 -51%Fund raising events 115,000 150,000 -23%Contribution-space 120,000 120,000 0%Fee for Service $ 10,200,000 $ 8,400,000 21%
Governmental Contracts 4,400,000 3,400,000 29%Grants 650,000 650,000 0%Other 170,000 150,000 13%Interest 5,000 7,500 -33%
15,905,000 13,377,500 19%
Income 2009 & 2010
Contri
butio
ns
Fund
raisi
ng e
vent
s
Contri
butio
n-sp
ace
Fee fo
r Ser
vice
Gov
ernm
enta
l Con
tract
s
Gra
nts
Oth
er
Inte
rest
$-
$2,000,000
$4,000,000
$6,000,000
$8,000,000
$10,000,000
$12,000,000
2010 2009
Income 2009 & 2010

Temporarily Restricted
PUBLIC SUPPORT AND REVENUE Public support Contributions and grants 20,000$ Special fund raising events, net of $125,000 of related expenses - Contribution of facility space - Net assets released from restrictions (320,000) Total public support (300,000)$ Revenue Fee for Service -$ Governmental Contracts - Grants - Other - Interest - Total revenue - Total public support and revenue (300,000)$ EXPENSES Program services - Fund raising - Management and general - Total expenses - CHANGES IN NET ASSETS (300,000)Net assets, beginning of year 460,000Net assets, end of year 160,000

Expenses
EXPENSES 2010 2009 %
change
Program services
13,830,000 10,700,000 29%
Fund raising
280,000 190,000 47%
Management and general
2,680,000 2,750,000 -3%
Total expenses
16,790,000 13,640,000 23%

Why do you need a balance sheet & an income statement
• Balance sheet• Cash position• Types of assets• Amount of liabilities• Net assets – Unrestricted vs restricted
• Income Statement• Current income – type and amount• Current expenses – type and amount• This year compared to last year and to budget

Linking Statements
NET ASSETS (Statement of Financial Position)2010 2009
Unrestricted 65,000$ 650,000$ Temporarily restricted 160,000 460,000 Total net assets 225,000$ 1,110,000$
Statement of Financial Activity Temporarily 2010 2009
Unrestricted Restricted Total Total CHANGES IN NET ASSETS (585,000) (300,000) (885,000) (262,500)Net assets, beginning of year 650,000 460,000 1,110,000 1,372,500 Net assets, end of year 65,000 160,000 225,000 1,110,000

Statement of Financial PositionStatement of Financial Position - Master Inc.Assets 2009 2008
Cash & Cash Equivalents 997,387 1,217,056 Accounts Recievable 616,346 662,707 Bequest Receivable 500,000 Prepaid Expenses 29,181 45,043 Inventory 63,831 64,821 Investments 19,796,636 17,131,263 Trusts 19,356,658 25,088,666 Property, Plant, Equipment 7,427,156 7,268,869
Total Assets 48,787,195 51,478,425 Liabilities and Net Assets
LiabilitiesAccounts Payable 366,427 484,843 Other Payable 152,030 166,387 Deferred Revenue 12,737 49,995 Funds held for others 314,707 396,257 Pension liability 654,551 644,121
Total Liabilities 1,500,452 1,741,603 Net Assets
Unrestricted 9,363,531 10,742,024 Temporarily Restricted 19,949,016 25,439,979 Permanently Restricted 17,974,196 13,554,819
Total Net Assets 47,286,743 49,736,822 Total Liabilities and Net Assets 48,787,195 51,478,425

Statement of
Financial Activity
Statement of Financial Activity - Master Inc.For the years ended June 30, 2009 & 2008
Temporarily Permanently 2009 2008Unrestricted Restricted Restricted Total Total
Support and RevenueGrants 314,053 314,053 292,795 Contracts 1,000,000 1,000,000 1,000,000 Contributions 426,711 128,237 554,948 512,523 Bequest 6,639,659 6,639,659 Board Support 272,822 272,822 254,657 Fee income 1,035,213 1,035,213 787,002 Investment income 1,780,430 452,565 2,232,995 2,364,298 Net Assets released 422,436 (422,436) -
Total Support and Revenue 5,251,665 158,366 6,639,659 12,049,690 5,211,275
ExpensesSalaries & Benefits 2,427,129 2,427,129 2,290,487 Training & travel 71,849 71,849 56,673 Volunter expenses 82,317 82,317 69,292 Event costs 1,639,393 1,639,393 1,735,118 Contracted Services 632,834 632,834 431,897 Communications 198,227 198,227 227,635 Rent 219,182 219,182 162,685 Insurance 34,581 34,581 38,752 Repairs & Maintenance 201,406 201,406 191,138 Depreciation 147,363 147,363 161,447 Miscellaneous 25,452 25,452 32,008
5,679,733 - - 5,679,733 5,397,132 Change in net assets (428,068) 158,366 6,639,659 6,369,957 (185,857)
Unrealized gains (losses) (950,425) (5,649,329) (2,220,282) (8,820,036) (4,684,558)
Net Assets beginning 10,742,024 25,439,979 13,554,819 49,736,822 54,607,237 Net Assets ending 9,363,531 19,949,016 17,974,196 47,286,743 49,736,822

Trends
2009 2008
Total Total % Change
Support and Revenue
Grants 314,053 292,795 7%
Contracts 1,000,000 1,000,000 0%
Contributions 554,948 512,523 8%
Board Support 272,822 254,657 7%
Fee income 1,035,213 787,002 32%
Investment income 2,232,995 2,364,298 -6%
Total Support and Revenue 5,410,031 5,211,275 4%
Expenses
Salaries & Benefits 2,427,129 2,290,487 6%
Training & travel 71,849 56,673 27%
Volunter expenses 82,317 69,292 19%
Event costs 1,639,393 1,735,118 -6%
Contracted Services 632,834 431,897 47%
Communications 198,227 227,635 -13%
Rent 219,182 162,685 35%
Insurance 34,581 38,752 -11%
Repairs & Maintenance 201,406 191,138 5%
Depreciation 147,363 161,447 -9%
Miscellaneous 25,452 32,008 -20%
5,679,733 5,397,132 5%
Bequest 6,639,659

Income Trends
Gra
nts
Contract
s
Contributio
ns
Board S
upport
Fee inco
me
Inve
stm
ent inco
me
-
500,000
1,000,000
1,500,000
2,000,000
2,500,000
2009 2008
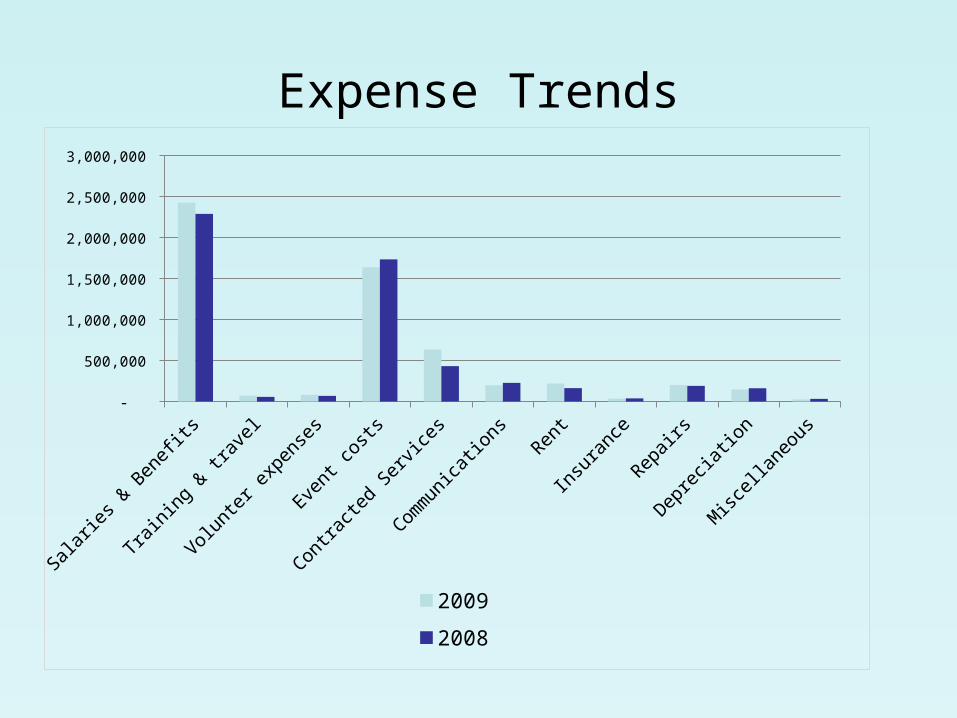
Expense Trends
Salarie
s & B
enefits
Train
ing &
trave
l
Volunte
r exp
enses
Event c
osts
Contract
ed Serv
ices
Comm
unicatio
nsRent
Insu
rance
Repairs
Deprecia
tion
Misc
ellaneous
-
500,000
1,000,000
1,500,000
2,000,000
2,500,000
3,000,000
2009
2008
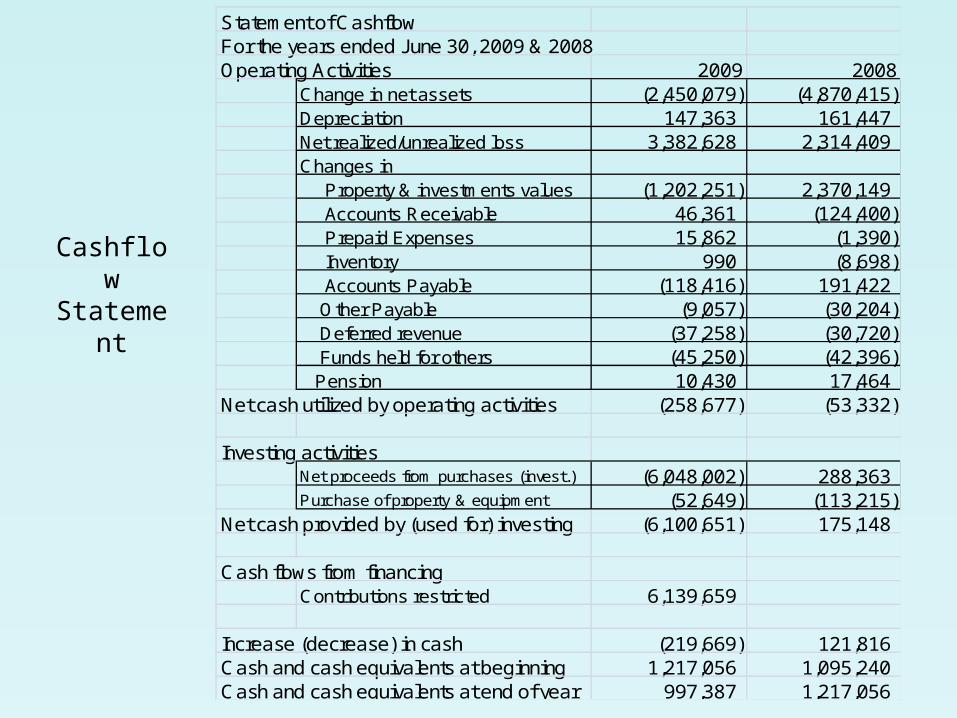
Cashflow Statement
Statement of CashflowFor the years ended June 30, 2009 & 2008Operating Activities 2009 2008
Change in net assets (2,450,079) (4,870,415) Depreciation 147,363 161,447 Net realized/unrealized loss 3,382,628 2,314,409 Changes in Property & investments values (1,202,251) 2,370,149 Accounts Receivable 46,361 (124,400) Prepaid Expenses 15,862 (1,390) Inventory 990 (8,698) Accounts Payable (118,416) 191,422 Other Payable (9,057) (30,204) Deferred revenue (37,258) (30,720) Funds held for others (45,250) (42,396) Pension 10,430 17,464
Net cash utilized by operating activities (258,677) (53,332)
Investing activitiesNet proceeds from purchases (invest.) (6,048,002) 288,363 Purchase of property & equipment (52,649) (113,215)
Net cash provided by (used for) investing (6,100,651) 175,148
Cash flows from financingContributions restricted 6,139,659
Increase (decrease) in cash (219,669) 121,816 Cash and cash equivalents at beginning 1,217,056 1,095,240 Cash and cash equivalents at end of year 997,387 1,217,056
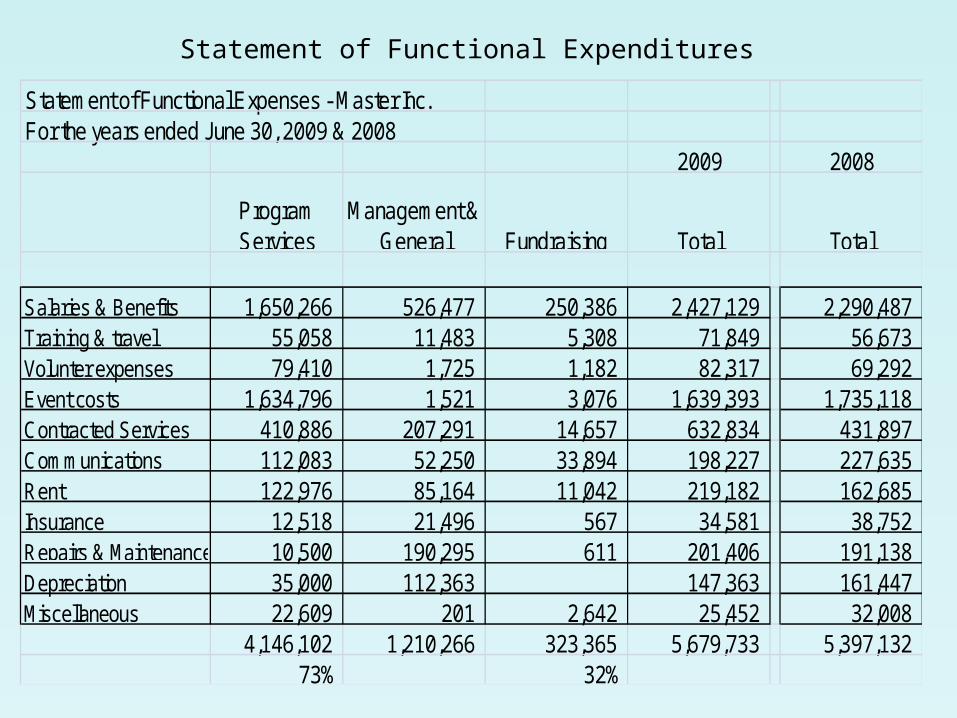
Statement of Functional Expenditures
Statement of Functional Expenses - Master Inc. For the years ended June 30, 2009 & 2008
2009 2008
Program Services
Management & General Fundraising Total Total
Salaries & Benefits 1,650,266 526,477 250,386 2,427,129 2,290,487 Training & travel 55,058 11,483 5,308 71,849 56,673 Volunter expenses 79,410 1,725 1,182 82,317 69,292 Event costs 1,634,796 1,521 3,076 1,639,393 1,735,118 Contracted Services 410,886 207,291 14,657 632,834 431,897 Communications 112,083 52,250 33,894 198,227 227,635 Rent 122,976 85,164 11,042 219,182 162,685 Insurance 12,518 21,496 567 34,581 38,752 Repairs & Maintenance 10,500 190,295 611 201,406 191,138 Depreciation 35,000 112,363 147,363 161,447 Miscellaneous 22,609 201 2,642 25,452 32,008
4,146,102 1,210,266 323,365 5,679,733 5,397,132 73% 32%

Project budget
Project BudgetIncome
Your foundation 50,000$ Other grant applications 80,000 Agency funds 22,000
Total Income 152,000$ Expenses
Salary & Benefits 60,000 Event costs 30,000 Contracted Services 18,000 Program materials 15,000 Office supplies 8,000 Communications costs 8,000 Rent 8,000 Transportation 3,500 Insurance 1,500
Total Expenses 152,000$ Net -$
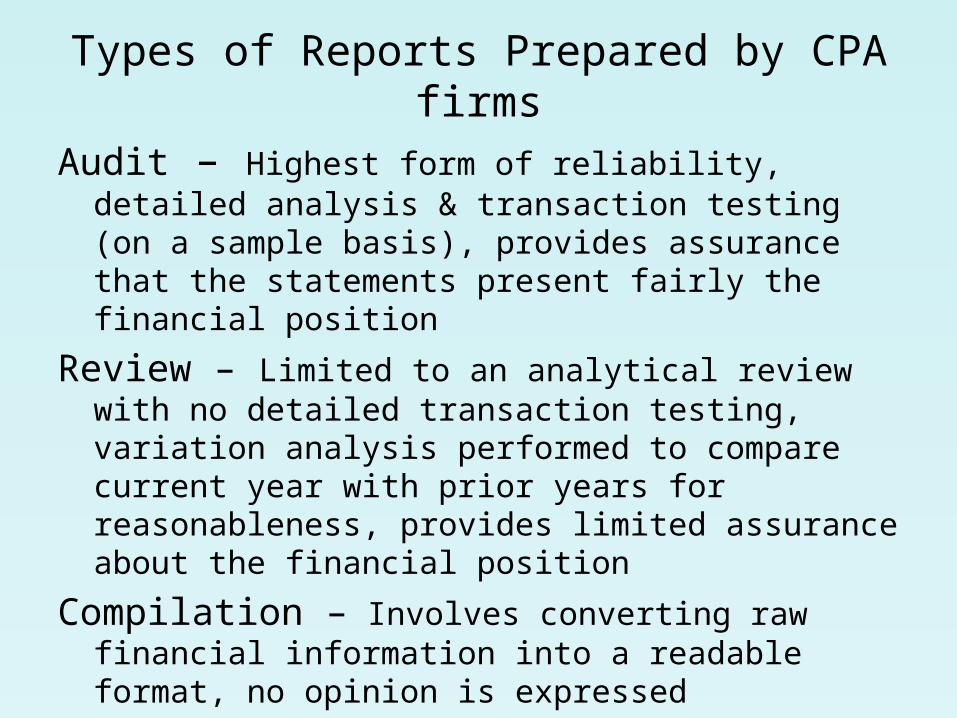
Types of Reports Prepared by CPA firms
Audit – Highest form of reliability, detailed analysis & transaction testing (on a sample basis), provides assurance that the statements present fairly the financial position
Review – Limited to an analytical review with no detailed transaction testing, variation analysis performed to compare current year with prior years for reasonableness, provides limited assurance about the financial position
Compilation – Involves converting raw financial information into a readable format, no opinion is expressed

Independent Auditors ReportTo the Board of Directors of the Hope Agency
We have audited the accompanying consolidated statement of financial position of Social Service Agency as of June 30, 2006, and the related consolidated statements of activities, functional expenses, and cash flows for the year then ended. These financial statements are the responsibility of the Organization's management. Our responsibility is to express an opinion on these financial statements based on our audit. The prior-year summarized comparative information has been derived from the Organization's 2005 financial statements and, in our report dated October 25, 2005, we expressed an unqualified opinion on those financial statements.
We conducted our audit in accordance with U.S. generally accepted auditing standards. Those standards require that we plan and perform the audit to obtain reasonable assurance about whether the financial statements are free of material misstatement. An audit includes examining, on a test basis, evidence supporting the amounts and disclosures in the financial statements. An audit also includes assessing the accounting principles used and significant estimates made by management, as well as evaluating the overall financial statement presentation. We believe that our audit provides a reasonable basis for our opinion.
In our opinion, the consolidated financial statements referred to above present fairly, in all material respects, the financial position of Social Service Agency and Affiliates at June 30, 2006, and the changes in their net assets and their cash flows for the year then ended, in conformity with U.S. generally accepted accounting principles.
Your Friendly Audit FirmPhiladelphia, Pennsylvania October 27, 2006
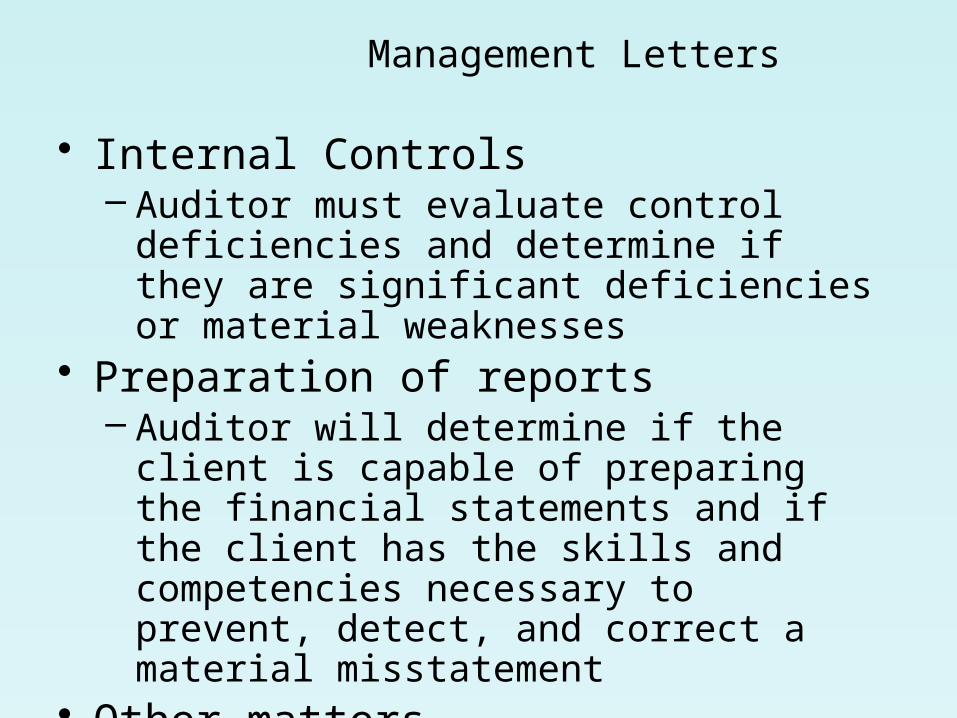
• Internal Controls– Auditor must evaluate control deficiencies
and determine if they are significant deficiencies or material weaknesses
• Preparation of reports– Auditor will determine if the client is capable
of preparing the financial statements and if the client has the skills and competencies necessary to prevent, detect, and correct a material misstatement
• Other matters
Management Letters

Audit & 990
Audit Form 990 990 p.1Total Total
Support and RevenueRental Revenue 1,617,242
Contributions & grants 553,554 (364,665) Program Service revenue 1,696,858 (79,616)
Investment income 5,073 Participation Fees 79,616 Contributions 188,889 Miscellaneous 510 Other 510
Total Support and Revenue 1,886,257 - 2,255,995
Total Expenses 1,369,916 1,476,798 (106,882)
Contributions permanently restricted 364,665 Investment income (loss) 8,073 Change in beneficial interest (3,000) Loss on disposition of assets (106,882)
Change in net assets 1,632,772 Total difference 779,197 779,197
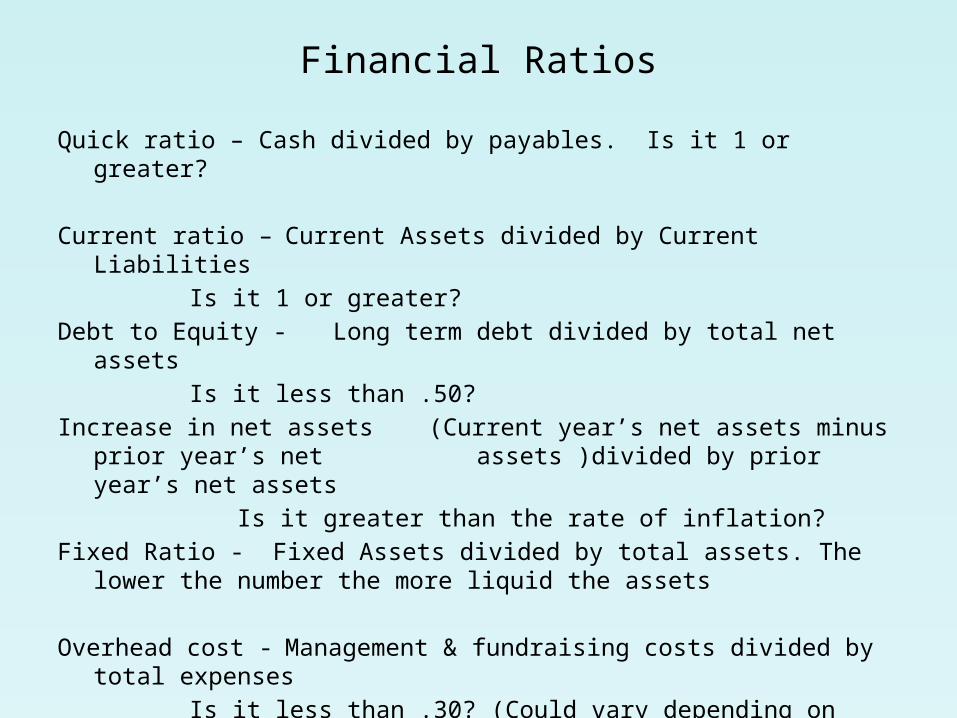
Financial Ratios
Quick ratio – Cash divided by payables. Is it 1 or greater?
Current ratio – Current Assets divided by Current Liabilities
Is it 1 or greater?
Debt to Equity - Long term debt divided by total net assets
Is it less than .50?
Increase in net assets (Current year’s net assets minus prior year’s net assets )divided by prior year’s net assets
Is it greater than the rate of inflation?
Fixed Ratio - Fixed Assets divided by total assets. The lower the number the more liquid the assets
Overhead cost - Management & fundraising costs divided by total expenses
Is it less than .30? (Could vary depending on type)

Ratios ABC Master
Quick ratio 0.16 1.92 Current Ratio 0.96 2.53 Debt to Equity None 0.01 Increase in net assets (0.80) (0.05) Fixed ratio 0.15 0.15 Overhead cost 0.18 0.27

Ratios ABC Master
Quick ratio 0.16 1.92 Current Ratio 0.96 2.53 Debt to Equity None 0.01 Increase in net assets (0.80) (0.05) Fixed ratio 0.15 0.15 Overhead cost 0.18 0.27

Operating Reserve Information
Operating Reserve Policy Toolkit for Nonprofit Organizations (September 2010
Sponsored by the National Center for Charitable Statistics, Center on Nonprofits and Philanthropy at the Urban Institute and United Way Worldwide
(http://www.nccs2.org)
Why does an organization need an operating reserve?
Unexpected shortfall in revenue
Unexpected demands on your resources
Unanticipated opportunities
Less than perfect judgment and foresight
A change in direction that is needed
Day to day fluctuations in income and expense
Seasonal fluctuations

Board Designated Operating Reserves
Board designated operating reserves are that portion of unrestricted net assets that the Board establishes for the organization to use in case of an emergency or an unexpected event.
According to the Nonprofit Operating Reserves Initiative Working Group the minimum operating reserve ratio should be 25% or three months of the annual expense budget.)
Funding the operating reserve – the funds must come from unrestricted income and need to represent cash that is set aside. One method is to “fund depreciation”, another is to set aside a certain amount each year.

Questions