Embed Size (px)
Citation preview

Understanding and Monitoring our Changing PlanetA Climate Technology White Paper
Sarrah Raza
Matt Bravante
Claire Curry
May 27, 2021

1 Understanding and Monitoring our Changing Planet
Contents
Understanding our changing planet: an introduction 2
Mapping and measuring carbon sinks 8
Monitoring and quantifying GHG emissions 16
Company-level measurement and reporting 22
Early-stage investment trends 30
2 Understanding and Monitoring our Changing Planet
Understanding our
changing planet: an
introduction

3 Understanding and Monitoring our Changing Planet
Introduction
BNEF Pioneers: hunting for innovation
This is one of three reports to be published following the 2021
BNEF Pioneers awards.
BloombergNEF’s annual Pioneers competition identifies and
recognizes innovators developing new technologies to tackle some
of the most important challenges in the fight against climate
change.
Each year, the Pioneers competition focuses on three innovation
challenges.
In 2021 the challenges are:
1. Optimizing commercial freight (research note available here)
2. Advancing materials and techniques for sustainable products
(research note available here)
3. Monitoring and understanding our changing planet (the
focus of this research note)
For more information about the Pioneers competition, please visit
https://about.bnef.com/bnefpioneers/
Understanding and monitoring our changing planet
In this paper we show that there are some important and urgent
challenges to understanding and monitoring our planet and its role in
climate change.
Specifically, we analyze technology innovations, and the early-stage
companies developing them, that would contribute significantly to
tackling these problems:
1. Mapping and measuring carbon sinks: How have humans
affected the ability of carbon sinks to absorb CO2, and how much
CO2 do carbon sinks absorb? (slides 8-15)
2. Monitoring and quantifying GHG emissions: What technologies
can provide us with better data to quantify methane and CO2?
How can we spot fugitive emissions and incorporate these into
calculations? (slides 16-21)
3. Company-level measurement and reporting: How can
companies track and measure their carbon footprints, assess
climate risk, and better plan for their future investments? (slides
22-29)
This paper provides data and context on the challenges, evaluates
some of the proposed innovations and suggests ways to overcome
potential blockers. We also highlight 64 startups that are leading the
charge in these areas. The final section examines cross-cutting
technologies that could accelerate innovation and outlines early-stage
investment trends for each of the three technology gaps.
Understanding our changing planet: an introduction
4 Understanding and Monitoring our Changing Planet
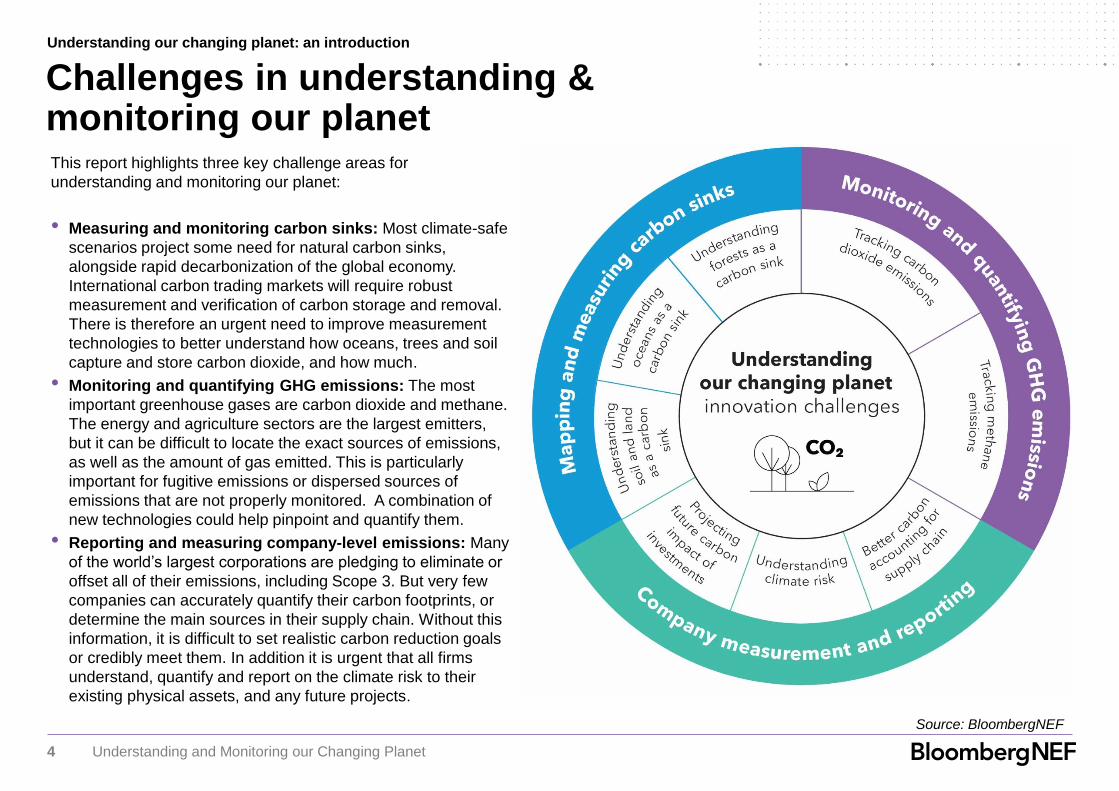
Challenges in understanding & monitoring our planet
Source: BloombergNEF
Understanding our changing planet: an introduction
This report highlights three key challenge areas for
understanding and monitoring our planet:
• Measuring and monitoring carbon sinks: Most climate-safe
scenarios project some need for natural carbon sinks,
alongside rapid decarbonization of the global economy.
International carbon trading markets will require robust
measurement and verification of carbon storage and removal.
There is therefore an urgent need to improve measurement
technologies to better understand how oceans, trees and soil
capture and store carbon dioxide, and how much.
• Monitoring and quantifying GHG emissions: The most
important greenhouse gases are carbon dioxide and methane.
The energy and agriculture sectors are the largest emitters,
but it can be difficult to locate the exact sources of emissions,
as well as the amount of gas emitted. This is particularly
important for fugitive emissions or dispersed sources of
emissions that are not properly monitored. A combination of
new technologies could help pinpoint and quantify them.
• Reporting and measuring company-level emissions: Many
of the world’s largest corporations are pledging to eliminate or
offset all of their emissions, including Scope 3. But very few
companies can accurately quantify their carbon footprints, or
determine the main sources in their supply chain. Without this
information, it is difficult to set realistic carbon reduction goals
or credibly meet them. In addition it is urgent that all firms
understand, quantify and report on the climate risk to their
existing physical assets, and any future projects.
5 Understanding and Monitoring our Changing Planet
Source: BloombergNEF, CB Insights
Understanding our changing planet: an introduction
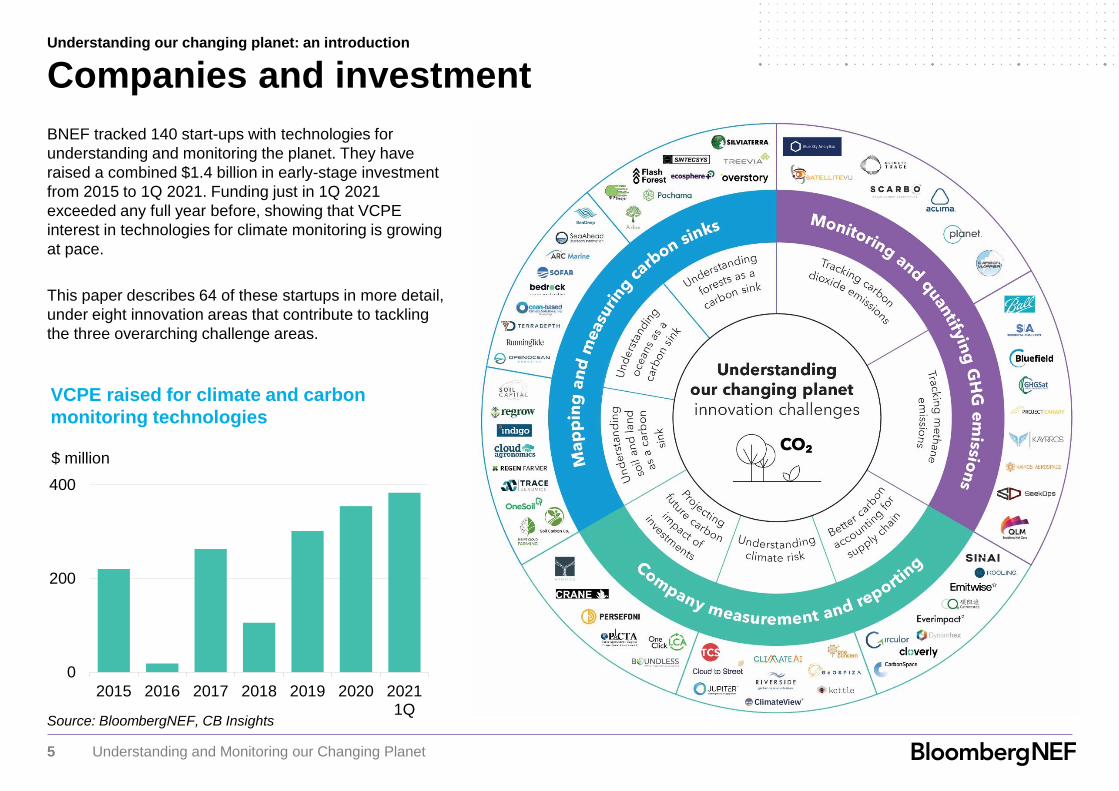
Companies and investment
VCPE raised for climate and carbon
monitoring technologies
BNEF tracked 140 start-ups with technologies for
understanding and monitoring the planet. They have
raised a combined $1.4 billion in early-stage investment
from 2015 to 1Q 2021. Funding just in 1Q 2021
exceeded any full year before, showing that VCPE
interest in technologies for climate monitoring is growing
at pace.
This paper describes 64 of these startups in more detail,
under eight innovation areas that contribute to tackling
the three overarching challenge areas.
0
200
400
2015 2016 2017 2018 2019 2020 20211Q
$ million

6 Understanding and Monitoring our Changing Planet
BNEF Pioneers 2021 Winners Challenge 3: Understanding and monitoring the planet
Planet operates the largest constellation of satellites globally, with more than 200
nanosatellites imaging the Earth daily at a 30-centimeter resolution. It provides spatial
data on forests, oceans, carbon dioxide, methane and more, to help understand global
and local change, through satellite imagery. Its analytics platform is sold to agriculture,
energy, forestry and other sectors. Tackles the challenges of mapping and
measuring carbon sinks and monitoring
and quantifying GHG emissions
Tackles the challenge of monitoring and
quantifying GHG emissions
Tackles the challenges of mapping and
measuring carbon sinks and company-
level measuring and reporting
Meeting the challenge of understanding our planet
QLM has developed a ground-based sensor that visualizes and quantifies greenhouse
gas emissions at source, with a focus on methane. This is particularly useful in the oil
and gas industry where there is urgency on this issue. The camera systems use
quantum single photon detection technology that works 24/7, without needing in-person
operation. Unlike other methane cameras, they can quantify the amount of methane
emitted by each leak/flare.
Pachama is a technology company focused on improving the credibility of forest carbon
markets. The company uses a combination of AI technology, satellite imagery and lidar
to more accurately measure carbon sequestration from forestry projects. The
company’s goal is to create a more liquid voluntary carbon market for landowners and
corporations looking to purchase offsets.
7 Understanding and Monitoring our Changing Planet
Technology
challenges
Routes to understanding and monitoring
the climate and planet

8 Understanding and Monitoring our Changing Planet
Mapping and measuring
carbon sinks
Monitoring and quantifying
GHG emissions
Company-level measurement and reporting

9 Understanding and Monitoring our Changing Planet
What is a carbon sink?
Oceans, rocks, soil and plants are natural carbon sinks
that continuously remove carbon from the atmosphere.
These natural environments are crucial to maintaining the
planet’s carbon concentrations in balance. On the one
hand, their preservation and management can help to
reduce carbon dioxide concentrations in the atmosphere.
On the other hand, anthropogenic activities such as
deforestation and human-induced weather changes are
decreasing the amount of carbon dioxide absorbed by
nature. Both of these effects require better measurement.
Why is it difficult to solve?
Until recently, scientists estimated global carbon ‘fluxes’ from the sum of country
reported data. However, unreported events such as deforestation can cause forest
carbon to fluctuate massively. Furthermore, voluntary carbon offset schemes are
increasingly notorious for over-stating the amount of carbon removed, and few
participants are incentivized to spotlight this issue.
Properly quantify carbon sinks requires regular, granular data and analytics that
are easy to access and use. While technologies such as nanosatellites, sensors,
lidar and artificial intelligence have matured in recent years, they are still expensive
and there are remaining technology gaps.
How big a problem is it?
Studies show that ocean and land carbon sinks absorb
annually over 50% of anthropogenic carbon dioxide
emissions. But researchers are unsure as to how climate
change is impacting this natural carbon absorption. It does
seem that climate change is depleting the size of this
carbon store and that certain valuable carbon sinks, such
as mangrove forests and kelp forests, are already
endangered. Mapping how much carbon land, oceans and
forests are absorbing, and their role in the carbon cycle is
important in understanding the efficacy of policies used to
protect forests or oceans, and enable global carbon
markets that rely on natural carbon capture. It will also
inform better practices and techniques for managing
natural carbon stores.
What should we tackle first?
Soil and land: The degradation of soil from unsustainable agriculture and other
development has released billions of tons of CO2 into the atmosphere. Only 3% of
North America’s tallgrass prairie remains and the world’s soils have lost between
50-70% of their original carbon stock.
Oceans: The ocean is a carbon sink for over 9 billion metric tons of CO2 per year.
As the amount of CO2 in the atmosphere grows, so has the ocean’s ability to
absorb CO2. However, it is not certain that it will continue to be a large store.
Warmer seawater is less able to absorb CO2 than colder. And increased storms are
destroying kelp forests, one of the most effective carbon sinks.
Forests: Recent research shows that the world’s forests absorb 16 billion metric
tons of CO2 per year. However, deforestation, fires and other disturbances cause
forests to emit half this absorbed CO2 – meaning net absorption is around 7 billion
tons. Only one major rainforest remains a strong carbon sink (the Congo), with the
Amazon and Southeast Asia forests becoming net carbon emitters due to humans.
Most climate-safe scenarios project some need for natural carbon sinks, alongside rapid decarbonization of the global economy.
International carbon trading markets will require robust measurement and verification of carbon storage and removal. There is
therefore an urgent need to improve measurement technologies to better understand how oceans, trees and soil capture and store
carbon dioxide, and how much.
Mapping and measuring carbon sinks
The need to map and measure carbon sinks

10 Understanding and Monitoring our Changing Planet
Forests absorb a net 7 billion metric tons of carbon dioxide annually. But their ability to work as a
large carbon sink is shrinking. A large swathe of the word’s rainforests are now net emitters.
Forests absorb carbon when standing or re-growing, but release it when cleared or degraded.
Deforestation, fires and drainage of peat soils all deplete a forest’s ability to sequester carbon.
New technologies such as satellites, sensors and lidar, plus new analytics methods, can help
quantify forest carbon storage and emissions from deforestation. The emergence of robust carbon
markets and regulation will both depend on better forest monitoring, and potentially help fund it.
LimitationsNew approaches and technologies
Transparent forestry carbon markets:
Using digital technologies to accurately
track tree growth and reforestation
should help boost transparency and
confidence in offset markets. These
markets in turn should help fund the
deployment of technology.
Corporate sustainability initiatives:
Growing calls for transparency should
help drive corporate investement, either
to examine specific forest destruction
issues, or to prove provenance of offsets.
Combining technologies: Combining
solutions like satellites and lidar will be
the most useful for monitoring forests.
This requires data standards and open-
data sharing initiatives.
New sensors: New nanosatellite
sensors (such as Capella Space’s radar
sensors), can see through forest fire
smoke.
Potential solutions
New remote sensing technologies are creating
opportunities to understand forest systems and
carbon projects.
Nano-satellites: These are now relatively
common and, for forests, can take photos and
videos from a height of 200km above the Earth.
Companies like Planet can produce images at a
30cm resolution using optical sensors. Such
satellites can quantify CO2 emissions by looking
at rates of deforestation, the spread of forest
fires and spot tree loss.
Sensors and cameras: Sensors, including lidar,
infrared spectroscopy and laser can be placed
on drones, airplanes, towers or on the ground to
capture information on forest fires and trees.
Artificial intelligence: AI and other advanced
analytics use data from these sensors and
cameras to understand sizes and species of
trees. This helps bring transparency to carbon
offset projects, with regard to the land that would
have been forested.
Insufficient political or commercial impetus:
Despite emergence of new technologies, there is
not much investment in monitoring of forests.
Parts of the Amazon or wildfire-prone California
are receiving attention, but large areas of
woodland will not be monitored with satellites and
sensors until regulation kicks in, or carbon
markets create a business case.
Technology barriers: The high costs of
launching satellites; infrequent images due to low
satellite revisit rates; the challenge of capturing
data through clouds or smoke, and the effort and
time to place ground sensors and cameras all
limit our understanding of forests. There is
usually low internet connectivity in remote areas
where forests are located, making IoT devices
difficult to use.
Geographic location of tropical forests:
Tropical forests are often located in countries with
limited carbon policy or domestic technology.
A new method for analyzing forest
carbon was used in January 2021, in a
study led by NASA. It built on NASA’s
Landsat-based Global Forest Change
product. Landsat imagery for 20,000
sites was combined with 700,000
LiDAR observations to create global
maps of forest carbon fluxes.
Mapping and measuring carbon sinks
Understanding forests as a carbon sink

11 Understanding and Monitoring our Changing Planet
NASA recently updated its forest carbon
database by taking new measurements
from the Amazon basin. It found that 27%
of the world’s net forest carbon sinks are
in national parks.
Uses aerial mapping software and
satellites to reforest 150 acres of
forest in the last year, using drones to
drop seeds. Goal is to plant 1+ billion
trees by 2028.
IoT sensors for forest
monitoring. The system
can identify a 23%
difference between areas
in terms of growth rate
within a single month.
Largest portfolio of forest carbon
projects globally, with 33 million tons
of carbon emissions avoided and 2.2
million hectares of forest protected
or restored
Satellites and aerial measurements
Data/AI platforms, carbon
offsets
Sensors
Mapping and measuring carbon sinks
Understanding forests as a carbon sink
Remote towers and analytics to
detect wildfires in Brazil. Aims to
have 3,000 towers across Brazil,
with partners such as Carbon
Pool and Brazilian Federal
Persecuttores
Combination of satellite
imagery and field
measurements to
determine size and
species of tree in every
forest for carbon markets
Verifies and monitors forest carbon
credits and then uses satellite data
to ensure that projects store as
much carbon as they claim.
Pachama was named as a BNEF
Pioneer in 2021.
Inventory tracking and management system
used by 21 corporate customers storing data
on trees. 7.9 million inventory items tracked
to date.

12 Understanding and Monitoring our Changing Planet
Oceans are the largest single natural carbon sink, absorbing over 9 billion metric tons of carbon dioxide annually
(25% of anthropogenic CO2 emissions). CO2 gas dissolves in the water and is consumed by plankton, corals,
fish, algae and other photosynthetic bacteria. As human activity impacts the oceans more and more – whether
through climate change or activity such as deep sea mining or building offshore wind farms – it is critical that we
understand more about it and how its carbon sink works. New technologies such as autonomous underwater
vehicles and IoT sensors are collecting data on marine life, temperature, wave pressure, plastic pollution and
more. But still over 80% of the ocean remains unmapped.
LimitationsNew approaches and technologies
More action against ocean pollution and
waste: If governments and corporates set
goals to reduce ocean waste, this should
increase the value of technologies that
monitor the oceans. It might stimulate both
surface and underwater autonomous
vehicles as part of projects with larger
companies and startups.
Maritime industry involvement:
Decabonization goals set by shipping
companies could kick start the funding of
ocean mapping projects that will help with
more efficient ship routing, and tangentially
help increase ocean data and maps.
Recognition of the ocean as a huge, and
highly efficient carbon sink: While
forestry carbon credits are a thing, ocean
carbon credits are not. Yet the ocean
absorbs (net) more carbon than trees and
can store carbon for longer. Communicating
this to corporates might help monetize
ocean monitoring technologies.
Potential solutions
New technologies can capture higher-resolution
ocean data, from more remote parts of the sea.
Other innovations use that data to stimulate CO2
absorption.
Deep sea and seafloor surveys: Autonomous
vehicles, both underwater and on the sea’s
surface, survey the topography and geology of
the seafloor, or collect information on melting
icecaps, oil spills and ocean acidification.
Advanced analytics: Analytics software can
simulate circulation patterns in the ocean to
analyze the exchange of CO2 between the ocean
and atmosphere. They can also create 3D
models of ecosystems to visualize marine life or
coral bleaching.
Stimulating carbon uptake: Some startups are
encouraging CO2 absorption through mixing cold
and warm water, encouraging kelp growth, or
building sustainable sea reefs. They collect data
to track their performance and sometimes create
carbon credits.
Only 80% of the ocean is mapped, and
seafloors have only begun to be mapped.
A lack of small and sustainable
autonomous vehicles: To date, it has been
difficult, and expensive, to operate vehicles
under the ocean. And they have often caused
greenhouse gas emissions and noise
pollution. Technology developments, such as
solar-powered ocean drones, are helping to
address this issue.
Oceans are hard, and expensive, to map:
While satellites are useful for ocean weather
forecasting, they are less useful for measuring
how much CO2 is in seawater. For this we
need ships and buoys, which can be costly to
deploy and maintain. They also contribute to
ocean waste. Most ocean measurements are
collected by researchers and collated into the
Surface Ocean CO2 Atlas (SOCAT). This work
relies on public funding or non-profits because
there is no monetized business model.
Mapping and measuring carbon sinks
Understanding oceans as a carbon sink

13 Understanding and Monitoring our Changing Planet
Attaches kelp to biodegradable buoys in the sea.
As kelp grows in weight, the buoys sink to the
ocean floor. With help from academics,
RunningTide measures the kelp’s carbon sink and
sells carbon credits to firms including Shopify.
Makes low-carbon concrete cubes as
sea reefs to encourage biodiversity
growth as a counter to offshore wind
development. Continually monitors
sites. In 2020, 100 cubes were
deployed in the U.K. funded by British
Government. 260 habitats deployed.
Supports ocean-tech startups by
providing sensor equipment, dock
facilities etc. Focused on ocean
sustainability through program with
New England Aquarium.
Uses enhanced imaging,
hyperspectral data and 3D
visualization to spot hazards
to marine life, invasive
organisms, coral bleaching
and harmful effects causing
climate change in the ocean.
Partners with the New
England Aquarium.
Ocean mapping and analytics
Stimulating carbon uptake
Startup platform for oceans
Mapping and measuring carbon sinks
Understanding oceans as a carbon sink
Ocean floor mapping
autonomous vehicle, with the
goal of launching a public
dataset to garner more accurate
climate models, better weather
predictions and exploration.
Wave-powered technology upwells
cold nutrient-rich seawater to
trigger phytoplankton growth that
absorbs CO2. Confirms amount
through real-time data platform led
by partner, Woods Hole and CLS.
Ocean sensors and data
platform for real-time information
on wave, wind, temperature,
currents and forecasts.
Customers include USGS,
WMO and IOOS.
Solar-powered autonomous ocean drone with
sensors. Sends data to clients in real-time,
who can control the direction of the vehicle.
These drones are used to detect oil spills,
map the Arctic and replace fuel burning
research vessels.

14 Understanding and Monitoring our Changing Planet
The Earth’s soils hold more carbon than the atmosphere and all living vegetation combined – about 2.5 trillion tons. Regenerative farming
practices hold huge potential to build soil health, sequester carbon and reward growers for ecosystem services. But because sequestration rates
vary based on geography, soil type and farming practices, accurate and cost-effective soil measurement is needed to better understand what
practices are most effective in local contexts. To date, accurate testing has remained expensive, limiting its use. New technologies such as
satellites and sensors are solving this problem.
Limitations
Soil carbon has been
underestimated: While it is a vital route
to reducing carbon dioxide in the
atmosphere, soil as a carbon sink is
taken less seriously than oceans and
forests due to a lack of data.
Degraded soil is often in poorer
countries: Some of the most degraded
soils, inefficient water use and lack of
high quality seed are found in sub-
Saharan Africa and South America. It is
therefore difficult to find funding and
incentives to measure soil carbon or
innovate with new technologies in these
regions, due to a lack of economic
resource and prioritization by
governments.
No obvious return on investment for
farmers storing carbon: To unlock
capital for these technologies, investors
need to see significant returns on soil
carbon investments.
New approaches and technologies
Regenerative agricultural practices can turn back
the carbon clock, reducing atmospheric CO2 while
boosting soil productivity and increasing resilience to
floods and drought. Techniques include planting crops
year-round and restoring degraded and eroded lands.
Avoiding deforestation and the farming of peatlands is
important, which are major reservoirs of carbon and
easily decompose upon drainage and cultivation.
Carbon markets have typically excluded agricultural
projects, until recently.
These all require new technologies that can track crop
yields, understand soil carbon through IoT sensors,
monitor agricultural land through satellites and lead to
precision agriculture methods.
● Remote sensing satellites: These provide data on
water content and availability of nutrients, enabling
farmers to manage inputs to increase crop yields,
decrease input costs and reduce soil degradation
through targeted fertilizing.
● Ground sensors: These can monitor crops, check
weather forecasts and calculate elements with free
apps. IoT sensors also measure soil moisture and
humidity.
Potential solutions
Financial incentives: Incentives or revenue
streams to encourage farmers to monitor and
maximize soil carbon, such as carbon offsets.
Carbon trading has the potential to bring a new
income stream to the agriculture sector.
Stricter government policy on land
degradation: For example, Australia suffers
from extreme heat and wildfires. Policy-
makers are creating programs that build and
stabilize soil carbon. ‘Regenerate Australia’
outlines a strategy to restore up to 740 million
acres.
More data sharing is essential, whether
incentives for researchers to study soil carbon,
or better programs and practices to promote
sharing between governments, businesses
and policy-makers.
Mapping and measuring carbon sinks
Understanding soil and land as a carbon sink

15 Understanding and Monitoring our Changing Planet
Precision ag for crop monitoring.
Ukraine is OneSoil’s largest market.
OneSoil currently tracks 71 million
hectares of land, mainly for wheat.
Merger of FluroSat and Dagan
to create a digital platform
combining agronomy and
scenario planning with
monitoring, reporting and
verification.
Precision ag startup
providing advanced soil
analytics and 3D soil
maps. Based in
Germany.
AI platform, RegenWorks, uses
analytics for agroforestry planning,
making landscape more resilient to
environmental extremes.
Precision agriculture and soil analytics
Creating carbon markets
Mapping and measuring carbon sinks
Understanding soil and land as a carbon sink
Provides carbon offsets and
trading incentives for farmers to
increase the carbon in their soil
A platform where farmers can earn
extra income from increasing soil
carbon, through selling credits.
Maple Leaf Foods and Epiphany
Craft Malt recently agreed to
purchase verified agricultural
carbon credits.
The mySoilCapital platform is a
data dashboard for farmers, and
advises on how to use their land
as a carbon sink, and sell
credits. A 50 hectare farm could
make $1,000/year in credits.
Most customers are based in
Belgium and France.
Soil insights and genomics to
determine soil health. Soil
microbiome data has been used by
agronomists such as Schweigert,
Nutrien Ag Solutions and Anez
Consulting
16 Understanding and Monitoring our Changing Planet
Mapping and
measuring carbon sinks
Monitoring and quantifying GHG
emissions
Company-level measurement and reporting
17 Understanding and Monitoring our Changing Planet
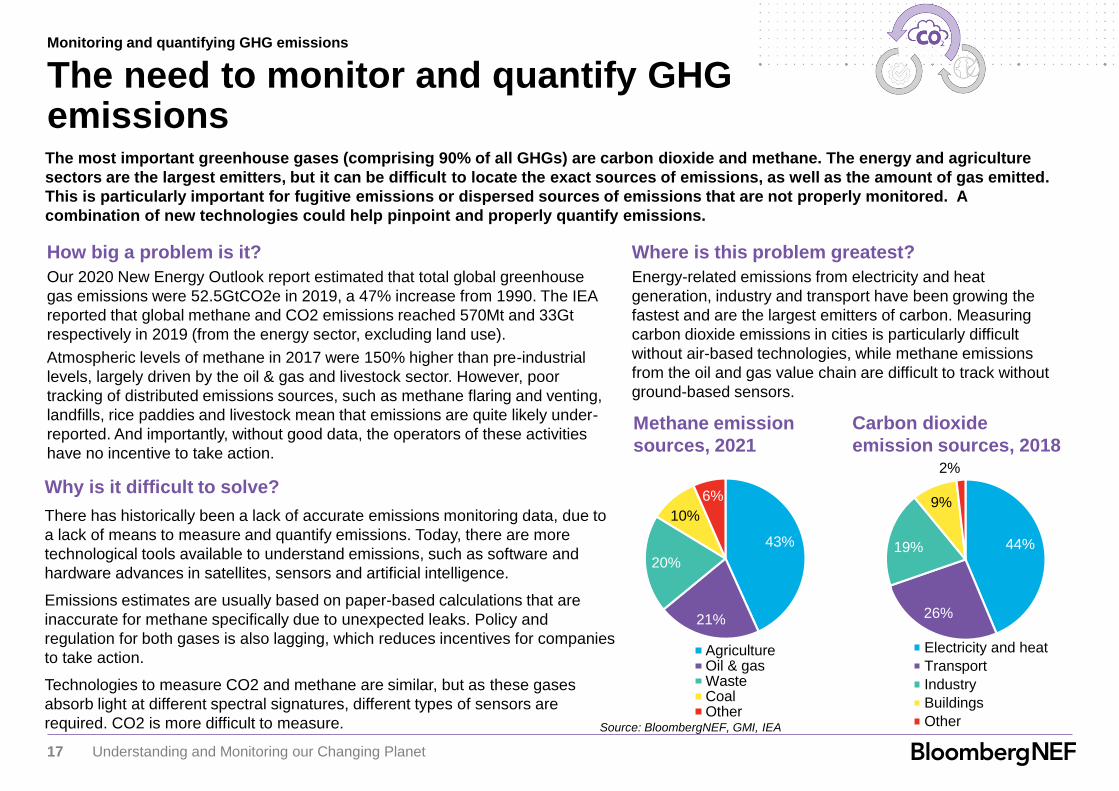
How big a problem is it?
Our 2020 New Energy Outlook report estimated that total global greenhouse
gas emissions were 52.5GtCO2e in 2019, a 47% increase from 1990. The IEA
reported that global methane and CO2 emissions reached 570Mt and 33Gt
respectively in 2019 (from the energy sector, excluding land use).
Atmospheric levels of methane in 2017 were 150% higher than pre-industrial
levels, largely driven by the oil & gas and livestock sector. However, poor
tracking of distributed emissions sources, such as methane flaring and venting,
landfills, rice paddies and livestock mean that emissions are quite likely under-
reported. And importantly, without good data, the operators of these activities
have no incentive to take action.
Methane emission
sources, 2021
The most important greenhouse gases (comprising 90% of all GHGs) are carbon dioxide and methane. The energy and agriculture
sectors are the largest emitters, but it can be difficult to locate the exact sources of emissions, as well as the amount of gas emitted.
This is particularly important for fugitive emissions or dispersed sources of emissions that are not properly monitored. A
combination of new technologies could help pinpoint and properly quantify emissions.
Why is it difficult to solve?
There has historically been a lack of accurate emissions monitoring data, due to
a lack of means to measure and quantify emissions. Today, there are more
technological tools available to understand emissions, such as software and
hardware advances in satellites, sensors and artificial intelligence.
Emissions estimates are usually based on paper-based calculations that are
inaccurate for methane specifically due to unexpected leaks. Policy and
regulation for both gases is also lagging, which reduces incentives for companies
to take action.
Technologies to measure CO2 and methane are similar, but as these gases
absorb light at different spectral signatures, different types of sensors are
required. CO2 is more difficult to measure.
Where is this problem greatest?
Energy-related emissions from electricity and heat
generation, industry and transport have been growing the
fastest and are the largest emitters of carbon. Measuring
carbon dioxide emissions in cities is particularly difficult
without air-based technologies, while methane emissions
from the oil and gas value chain are difficult to track without
ground-based sensors.
Monitoring and quantifying GHG emissions
The need to monitor and quantify GHG emissions
Source: BloombergNEF, GMI, IEA
Carbon dioxide
emission sources, 2018
43%
21%
20%
10%
6%
AgricultureOil & gasWasteCoalOther
44%
26%
19%
9%
2%
Electricity and heat
Transport
Industry
Buildings
Other

18 Understanding and Monitoring our Changing Planet
Limitations
Greenhouse gas sensors are still
nascent: It was not until 2019 that the ESA
launched Sentinel-5P and startups began
launching nanosatellites with gas sensors.
The miniaturization of satellites allowed this,
as well as instruments that can be flown on
satellites resisting extreme conditions.
High accuracy measurements and high
temporal frequency are expensive: It is
possible to get highly accurate
measurements that revisit a certain spot
once a week, but this is expensive.
Miniaturization of sensors and satellites, and
the falling launch costs for satellites, are
bringing down costs.
Inaccurate measurements: There are still
uncertainties with space-based
measurements. CO2 bands are
contaminated when very thin layers of clouds
are present and other aerosols lie in the
sensor’s path.
New approaches and technologies
Satellite technologies: New technologies are
better able to monitor CO2 emissions. ESA’s
Sentinel-2 and China’s TanSat were the first, using
optical imaging satellites to cover large areas but
at lower resolution. New, smaller and cheaper,
satellites are emerging with specialized gas or
optical sensors that can make more accurate daily
measurements above cities or industrial facilities.
For example, Planet’s optical satellites recognized
23% higher CO2 emissions from deforestation in
Peru.
Analytics platforms make sense of the data:
The data coming from satellites can be hard to
interpret or not useful on its own. Startups are
having success pulling in public and private
satellite data, combined with weather, economic
data and buildings data. These platforms can
calculate emissions factors for whole industries.
Ground-based IoT sensors: For capturing
accurate CO2 data in cities, or air pollution levels,
new forms of more accurate sensors are being
developed.
Technologies to track, understand and quantify CO2 emissions include optical and hyperspectral
satellites, carbon dioxide sensors and aggregated data platforms. Most CO2 emissions data are
currently estimated, and new technologies can help strengthen these estimates and provide
more accurate data. They can also make measurements of emissions sources that were
previously difficult to estimate, such as land-related emissions. Potential solutions
Joint projects with larger firms:
Collaboration to tackle the problem would
encourage CO2 tracking, eg, NASA
working with smaller startups to combine
their innovations with manufacturing
capacity and operations knowledge.
Reducing costs by using smaller
satellites: This, alongside sourcing
hardware in bulk, are now being done by
many startups such as GHGSat.
Public platforms with open-source
datasets: These allow governments and
non-profits to use the data to track their
emissions and enforce regulations.
Examples of this include ClimateTrace,
which plans to offer emissions data for
free.
Use spectral sensors: Instead of using
data from satellites such as Japan’s
GOSAT and NASA’s Orbiting Carbon
Observatory, governments should increase
use of spectral sensors such as GHGSat
and ESA’s. Better software that can
remove cloud cover will also help.
Monitoring and quantifying GHG emissions
Tracking carbon dioxide emissions

19 Understanding and Monitoring our Changing Planet
Analytics platform using satellite data, with
datasets on forest fires and CO2 emissions.
Used by companies to monitor their ESG data
and by third-party providers.
This coalition of organizations
aims to combine satellite
imagery of smoke from power
plants and factories with
infrared heat imaging and
nitrogen oxide sensor data, to
produce carbon emissions
data for individual power
plants.
Non-profit that outsources satellite
operation to Planet and other
companies, using the data to
measure carbon emissions across
forests and industry.
Measures air pollution and carbon
dioxide emissions in cities through
IoT sensors and its AI software
platform.
Corporates and cities focus
Forests and agriculture focus
Cross-industry
Monitoring and quantifying GHG emissions
Tracking carbon dioxide emissions
Emissions can be calculated using
optical nanosatellite data. Planet
found that carbon emissions
caused by deforestation in Peru
were 24% higher than those
reported by annual assessments.
Planet was named as a BNEF
Pioneer in 2021.
Project run by 8 EU organizations
to monitor emissions. Led by
Airbus Defence and Space,
project aims to overcome cost
barriers of satellites while creating
an accurate carbon dioxide and
methane sensor.
Thermal imaging satellites that can
calculate the CO2 emissions of
buildings and cities through
creating digital twins.

20 Understanding and Monitoring our Changing Planet
High costs: Using these technologies
regularly is difficult for oil and gas
companies to justify. Satellites are
expensive, costing up to $100,000/year per
asset for high resolution monitoring of the
facility. Drones and aircraft are cheaper at
around $1,000/year, however without
enough of a push from policy and
regulation, companies are unwilling to
spend this amount on measuring methane.
Scaling is difficult: Many of these new
technologies are developed by startups,
and being hardware-based are expensive
and slow to scale. Startups may struggle to
get their technology to suit large oil firms
without joining forces or attracting
significant new funding.
Underestimating the significance of
methane emissions has been a problem:
Kayrros found that 120Mt more methane
was leaking from the Permian than
expected, from combining satellite data with
other factors such as weather.
LimitationsNew approaches and technologiesSatellites and software platforms: Two types
of satellite are used for methane tracking:
optical satellites to spot large plumes over
regions, or sensitive hyperspectral satellites
that can spot methane locations down to the
facility level. Satellites can either be tasked to
one specific area, usually provided by a private
firm such as Satellogic, or data can be
ingested from larger organizations or
companies that use monitoring satellites, such
as Planet. Data can be bought from providers
such as Kayrros, which aggregates data from
multiple providers, ranging from daily revisit
rates to annual.
Aircraft and drone-mounted sensors: These
are used to find facility and regional data at
higher resolution than satellites, but can be
more expensive.
Ground-based measurements: Sensors are
used to pinpoint exact leak locations. These
include optical and laser-based imaging and/or
lidar. Usually these are hand-held and
therefore only used periodically, eg, quarterly.
Industry initiatives and partnerships to set
methane reduction goals: Industry initiatives
are running ahead of national regulations. Oil &
gas firms should build on their commitments to
accelerate technology deployment for methane
mitigation.
Expanding methane detection technologies
to other industries: Spreading to sectors
besides oil & gas (such as agriculture and
waste management) will help grow revenue
streams.
Reducing the cost of satellites and
manufacturing: Launch costs can be reduced
by sharing rides and miniaturizing satellites.
Methane emissions are a growing problem, and are more difficult to track and quantify than
carbon dioxide due to the small size of leaks or unregulated releases from oil and gas
equipment, landfill and cattle farming. Companies are trialing technologies including
satellites, drones, aircraft-based sensing and optical gas imaging, against a backdrop of
increasing pressure and commitments to solve the problem.
Potential solutions
Region Facility Leaks
Optical
satellites
Onshore Onshore
GHG
satellites
Onshore Onshore Onshore
Aircraft Onshore Onshore
Drones Onshore &
offshore
Onshore &
offshore
On-site
sensors
Onshore &
offshore
Source: BloombergNEF
Technology options for methane
tracking
Monitoring and quantifying GHG emissions
Tracking methane emissions

21 Understanding and Monitoring our Changing Planet
Aircraft-mounted sensors measure the absorption of
reflected sunlight by methane molecules. Can survey
100 square miles per plane per day.. Reduced two
kilotons of methane in 2019 from locating and
stopping leaks.
QLM has built a ground-based optical
and laser spectroscopy technique to
detect the location of methane leaks
and quantify the amount leaking,
without the need for a handheld device.
QLM was named as a BNEF Pioneer
in 2021.
GHGSat’s miniaturized methane
sensor has measured the
smallest methane emission from
space at 205kg/h, with a
constellation of two nanosatellites
monitoring industrial emissions.
GHGSat was named as a BNEF
Pioneer in 2020.
Uses data from 23 satellites, ground
sensors, government records and
weather, to deduce methane emissions
globally from 120,000 companies.
Drone-mounted sensors
Satellites and analytics platforms
Aircraft-mounted sensors
Ground sensors
Monitoring and quantifying GHG emissions
Tracking methane emissions
Drone-mounted sensors
used in oil and gas facilities
to locate leak locations. The
technology can locate exact
leak sources.
Lidar-based methane remote sensors
that can be mounted to planes or
satellites. High-resolution data offers
significant cost savings for mapping
leaks from oil and gas pipelines.
Kayrros’ ‘Methane Watch
Platform’ pulls in satellite
imagery from public
providers such as the ESA,
as well as private satellite
operators for facility/regional
emissions.
Spherical Analytics has the Climate
Action Engine (CAE) methane
emissions platform with Rocky
Mountain Institute, that ingests
different data sources to measure
methane in oil and gas facilities.

22 Understanding and Monitoring our Changing Planet
Mapping and measuring
carbon sinks
Monitoring and quantifying
GHG emissions
Company-level measurement and reporting

23 Understanding and Monitoring our Changing Planet
Many of the world’s largest corporations are pledging to eliminate or offset all of their emissions, including Scope 3, but very few
companies can accurately quantify their carbon footprints, or determine the main sources in their supply chain. Without this
information, it is difficult to set realistic carbon reduction goals or credibly meet them. In addition, financial institutions will need to
begin calculating the carbon impact of their portfolios, and any future investments they make. All corporations and financial institutions
will also need to understand, quantify and report on the climate risk to their existing physical assets, and any future projects.
How big a problem is it?
Corporates and financial institutions are
busy setting carbon reduction targets. To
meet any robust CO2 goal, firms must
improve their quantification of emissions,
particularly Scope 3. While Scope 1 and 2
are relatively easy to keep track of, the
inclusion of Scope 3 (emissions from
supply chain and customers) is what
makes a high quality net-zero target. Of
the 150 companies with net-zero targets
that BNEF tracks, only 66 address some,
or all, of their Scope 3. These firms score
an average of 4.75/10 in BNEFs net-zero
index (see chart), compared to 1.78/10 for
those without a Scope 3 goal.
The climate risk to physical assets globally
is immense. At least 60% of S&P 500
companies own assets at a high risk of
climate-change physical risk, yet very few
corporates understand the extent of the
risk or how to mitigate it.
Why is it difficult to solve?
Scope 3 emissions come from a
company’s suppliers and customers.
Collecting this data involves third-party
compliance, data standardization and
potential double counting. It is a complex
problem that only a few percent of
corporates tackle. Where they do
calculate it, it’s often a one-off carbon
footprint calculation done infrequently.
Quantifying climate risk is an even more
nascent area, with very little data and few
models available off-the-shelf.
Where is this problem greatest?
The least amount of information exists for
Scope 3 emissions in the supply chain.
While tech companies have ambitious
goals, their emissions are not significant
compared to energy companies (who often
have weaker goals excluding Scope 3). For
assessing climate risk, often physical
assets at most risk are those in poorer
countries without access to expensive
climate change models.
Company-level measurement and reporting
Company-level measurement and reporting
The CO2 impact, and level of ambition of
select net-zero corporate emission targets
Source: BloombergNEF. Corporate Net-Zero State of Play
(web| terminal).
0.00
0.04
0.08
0.12
0.16
0.20
0 2 4 6 8 10
MtCO2e per $ billion of revenue, per year
Utility Oil & Gas MaterialsTechnology Consumer Staples FinancialsHealth Care Industrials
Score
High impact, high ambition
Low impact, high ambition
High impact, low ambition
Low impact, low ambition

24 Understanding and Monitoring our Changing Planet
Limitations
Connecting with suppliers is hard: Many
carbon accounting tools use outdated information
because it is difficult to get real-time data from
third-party suppliers.
There are many standards: A variety of
standards, and complex methodologies, makes
calculating carbon footprints difficult. Carbon
footprinting technology providers may have to
design a product that adheres to all standards.
Only a few companies host large volumes of
supply chain data: SAP and Oracle sell most
supply-chain software and it is not easy to do
real-time calculations with them, or pull data from
these systems into third-party software.
New approaches and technologies
New satellite and sensor data: This will help customers track emissions from location-
specific assets (for their Scope 1 and 2) and from emissions hot spots in their supply chain
(such as upstream mines or pipelines). Using satellites and sensors means the emissions
data is accurate (and includes fugitives), rather than being calculated by using proxies.
New ways of data aggregation and integration: APIs, blockchain and the cloud have all
made it easier to safely share data between companies. To track Scope 3 will always involve
receiving data from third parties. For instance, blockchain is used to create an accurate digital
record of a material or product through it’s lifetime, including full carbon footprint.
AI for scenarios and recommendations: Newer carbon footprinting companies are offering
not just static results but models that show how corporates could improve their emissions
most easily.
Carbon accounting is the process by which organizations quantify their GHG emissions, so
that they may understand their climate impact and set goals to limit their emissions.
Innovations are required for accurately tracking supply chain, and customer, emissions.
Startups are innovating by aggregating fragmented supply chain data and integrating with
APIs, and using satellites and sensors to capture new data. These tools can show clients
their emissions weak spots and even model how best to reach corporate carbon goals.
Potential solutions
Cheaper IoT sensors: Lower-cost sensors
would make it more affordable to track
information about goods in real time.
Better analytics to model the impact on
carbon footprints: Advanced computing (or
quantum computers) could model the complex
impact of theoretical changes to supply chain
carbon footprints.
Global standards and rankings: Ultimately
convergence of standards and scores may be
needed to facilitate large-scale uptake of carbon
accounting platforms.Source: BloombergNEF
Carbon accounting software process, including innovation areas
Company-level measurement and reporting
Better carbon accounting for supply chains
Aggregate to create enterprise footprint
Convert activities to emissions values using emission factors
Company activity data through Excel or APIs
Use for reporting
Satellite and sensor dataThird-party supply
chain data
Scenario modelling & recommendations

25 Understanding and Monitoring our Changing Planet
Calculates emissions from business activities
such as flights and vehicle operations, by
integrating with existing enterprise systems.
Purchases offsets to match the client’s
emissions.
Recently released a database of
87,000 carbon emission factors for
clothing, travel, housing, food in over
260 countries. Customers including the
UN, Baidu, JD and Vanke use these
factors.
Carbon offsets Satellite and inventory data
Data from satellites,
sensors, traffic, buildings
and other IoT devices.
Customers include the
European Commission,
Manchester City Council,
GSMA and FI-Ware.
Emitwise assess corporate carbon
footprints using supply chain and
operations data. Can help clients
pinpoint where to make the biggest
impact on emissions, using machine
learning.
Digital twins and blockchain
Company-level measurement and reporting
Developing better carbon accounting methods
Measure carbon footprint for cities. 81% less
time spent on city-wide climate action
planning and reduced customer costs by
50%.
Uses blockchain to capture supply
chain data and builds digital twins
of materials as they go through
their lifetime. Clients and partners
include Volvo, Oracle, Mercedes,
Boeing. Focuses on ethics as well
as carbon emissions.
Combines satellite, sensor and inventory
data to measure emissions from
companies in agriculture, food, timber,
pulp and paper. Satellite data comes
from GOSAT, ESA’s Sentinel-5P and
OCO-2 satellites.
Consolidates GHG and financial
data from teams, facilities and
supply chain, in transport,
materials, utilities, buildings and
consumer goods industries.
26 Understanding and Monitoring our Changing Planet
Limitations No commonly accepted methodology for
assessing and prioritizing climate risk: This
is a very new area, with no set methodology or
criteria that identifies key thresholds in these
risks. Neither are there practices for what are
important criteria for managing these risks.
Limited number of companies: Due to the
complexity and cost of modeling climate risk,
there are very few companies in the space. A
few companies dominate the field and as
climate risk is so new, with most startups only
funded in the last three years, data can be
difficult to source for startups.
Weather is still extremely unpredictable: If
companies are paying a software provider to
model the impacts of a flood that may happen
in two years, they want this information to be
accurate. However, there is a limit to how
accurate climate risk data can be, and results
are inherently probabilistic.
New approaches and technologies
Climate model projections: All startups modelling
climate risk use climate model projections as a
baseline for the results. Ultimately, this projection
data is merged with customer asset data and then
processed with econometric impact/hazard
functions to model vulnerabilities. Software
providers can then deliver graphs and data on the
severity, location and timing of climate-related
risks.
AI for climate forecasts: AI advances are
enabling more accurate weather forecasts using
more historical data to plug into ML models. This
enhances climate models.
Predictive analytics and IoT sensors: While
companies have been including climate change in
scenarios, their projections are not site-specific.
Predictive analytics, combined with global sensor
data can provide real-time information on a specific
city or facility. Companies like Jupiter aim to
provide customers with detailed maps of how
climate change will impact a region up to 50 years
in advance.
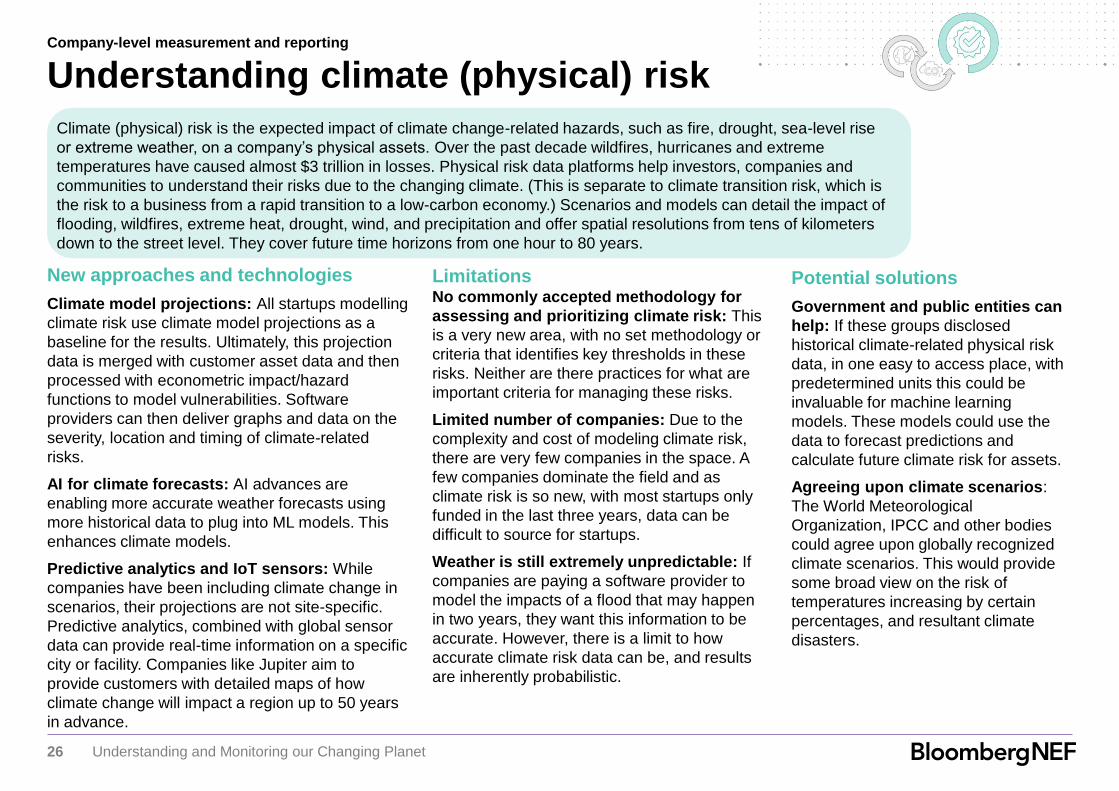
Climate (physical) risk is the expected impact of climate change-related hazards, such as fire, drought, sea-level rise
or extreme weather, on a company’s physical assets. Over the past decade wildfires, hurricanes and extreme
temperatures have caused almost $3 trillion in losses. Physical risk data platforms help investors, companies and
communities to understand their risks due to the changing climate. (This is separate to climate transition risk, which is
the risk to a business from a rapid transition to a low-carbon economy.) Scenarios and models can detail the impact of
flooding, wildfires, extreme heat, drought, wind, and precipitation and offer spatial resolutions from tens of kilometers
down to the street level. They cover future time horizons from one hour to 80 years.
Potential solutions
Government and public entities can
help: If these groups disclosed
historical climate-related physical risk
data, in one easy to access place, with
predetermined units this could be
invaluable for machine learning
models. These models could use the
data to forecast predictions and
calculate future climate risk for assets.
Agreeing upon climate scenarios:
The World Meteorological
Organization, IPCC and other bodies
could agree upon globally recognized
climate scenarios. This would provide
some broad view on the risk of
temperatures increasing by certain
percentages, and resultant climate
disasters.
Company-level measurement and reporting
Understanding climate (physical) risk
27 Understanding and Monitoring our Changing Planet
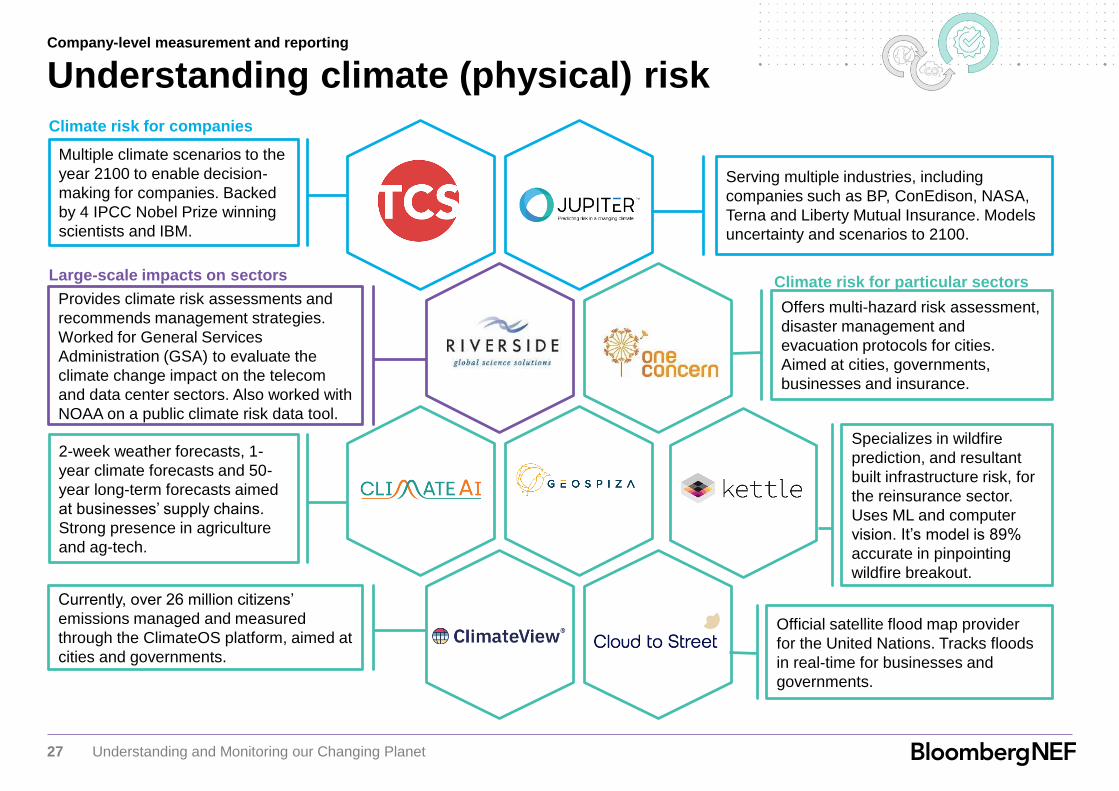
Serving multiple industries, including
companies such as BP, ConEdison, NASA,
Terna and Liberty Mutual Insurance. Models
uncertainty and scenarios to 2100.
Offers multi-hazard risk assessment,
disaster management and
evacuation protocols for cities.
Aimed at cities, governments,
businesses and insurance.
Specializes in wildfire
prediction, and resultant
built infrastructure risk, for
the reinsurance sector.
Uses ML and computer
vision. It’s model is 89%
accurate in pinpointing
wildfire breakout.
Official satellite flood map provider
for the United Nations. Tracks floods
in real-time for businesses and
governments.
Large-scale impacts on sectors
Climate risk for companies
Climate risk for particular sectors
Company-level measurement and reporting
Understanding climate (physical) risk
Multiple climate scenarios to the
year 2100 to enable decision-
making for companies. Backed
by 4 IPCC Nobel Prize winning
scientists and IBM.
Provides climate risk assessments and
recommends management strategies.
Worked for General Services
Administration (GSA) to evaluate the
climate change impact on the telecom
and data center sectors. Also worked with
NOAA on a public climate risk data tool.
2-week weather forecasts, 1-
year climate forecasts and 50-
year long-term forecasts aimed
at businesses’ supply chains.
Strong presence in agriculture
and ag-tech.
Currently, over 26 million citizens’
emissions managed and measured
through the ClimateOS platform, aimed at
cities and governments.

28 Understanding and Monitoring our Changing Planet
Corporations and investors also need to be able to project the sustainability impact of future
choices and investments. For asset owners this might mean modelling the carbon impact of
future building portfolios. For venture capitalists this might mean using tools to ensure their
startup investments provide an environmental return as well as financial. To project the future
carbon impact of an asset, or early-stage company, investors are turning to new analytical
tools. Today there is only a small demand for these complex tools but this should grow as more
investors sign up to climate pledges and disclosure mechanisms.
Lack of data makes projection
difficult: There is a lack of data for early-
stage companies and technologies
specifically, which makes it difficult to
create accurate projected emissions
reduction profiles.
LimitationsUsually only carbon dioxide emissions: Most
projection software is CO2-focused, forgetting the
other greenhouse gases.
Many of the tools are reliant upon data input
by the user: Currently, most popular tools are
reliant on data input by the user, with no external
verification. This raises questions as to how
accurate these tools are.
New approaches and technologies
Online projection models: New web tools will
take corporate data on assets under management,
or a VC portfolio, and personalize carbon emission
projections. Users can refine their projections by
inputting values about the target market.
Develop a view on the scaling potential of
early-stage technologies: These tools can take
data from startups to calculate the emissions
reduction potential for climate-tech startups, when
they scale. This could be used by impact investors
(see graphic).
Potential solutions
Standardizing early-stage technology
carbon abatement benefits: A public
database of carbon abatement values for
a range of the most common early-stage
technologies would help companies
standardize their models. As would
agreement on set units of abatement for
a variety of different technologies.
Align with TCFD and other standards:
Institutions that subscribe to TCFD
should find carbon projection tools
especially useful if their data outputs are
in line with the disclosure guidelines.
Company-level measurement and reporting
Projecting future carbon impact of investments
Example sustainability metrics for
a battery startup, evaluating key
criteria against industry standards
Source: ZincFive. Notes: Assessment done by Boundless. CROP is
‘carbon return on customer purchase’ and VOC is ‘volatile compound’
Legend: 1 = Low score, 10 = high score
ZincFive Li-ion
average
Lead acid
average
Sodium sulfur

29 Understanding and Monitoring our Changing Planet
Carbon accounting software used by
organizations such as Y Analytics to identify
carbon reduction initiatives. Use software to
analyze companies before they enter a VC
portfolio.
Launched by TPG VC firm, to ensure
that capital is directed at addressing
the UN SDGs and impact investing.
Will translate research to help
decision makers evaluate impact at
the front end of the capital allocation
process.
Evaluates emissions reduction
potential of early-stage companies
Software to evaluate carbon impact of
products, buildings and real estate portfolios.
Customers include the Norwegian
government and Grosvenor. Has over 10
million square feet of new construction
projects added to its platform every week.
Evaluating future carbon impact of planned
projects
Evaluating carbon impact of
investment portfolios
Company-level measurement and reporting
Projecting carbon impact of future investments
Paris Agreement Capital
Transition Assessment is a freely
accessible tool developed by 2
Degrees Investing Initiative for
investors to measure alignment
of portfolios with climate
scenarios. Aimed at many
sectors including oil, gas, coal,
power, steel, cement, aviation
etc.
Non-profit that was developed by
Prime Coalition to assess
emissions reduction potential of
early-stage companies in the
U.S. It is publicly available data
since April 2020 and is for
impact-focused investors to find
startups.
Provides research and data on a
company’s supply chain to
investors and funds. Uses company
footprint to create 100-year and
200-year global warming scenarios.
30 Understanding and Monitoring our Changing Planet
Early-stage
investment trends
For understanding and monitoring our
planet
31 Understanding and Monitoring our Changing Planet
Source: BloombergNEF, CB Insights. Note: bubbles represent deals over $5 million in each quarter.
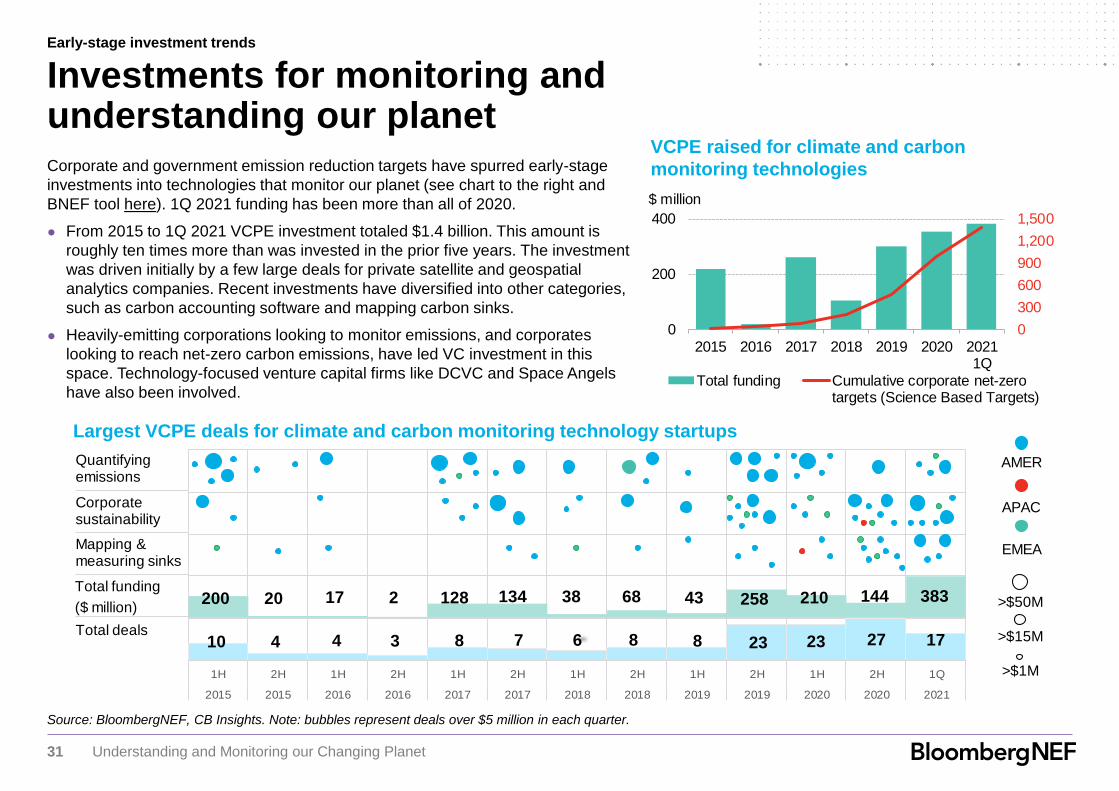
Investments for monitoring and understanding our planetCorporate and government emission reduction targets have spurred early-stage
investments into technologies that monitor our planet (see chart to the right and
BNEF tool here). 1Q 2021 funding has been more than all of 2020.
● From 2015 to 1Q 2021 VCPE investment totaled $1.4 billion. This amount is
roughly ten times more than was invested in the prior five years. The investment
was driven initially by a few large deals for private satellite and geospatial
analytics companies. Recent investments have diversified into other categories,
such as carbon accounting software and mapping carbon sinks.
● Heavily-emitting corporations looking to monitor emissions, and corporates
looking to reach net-zero carbon emissions, have led VC investment in this
space. Technology-focused venture capital firms like DCVC and Space Angels
have also been involved.
VCPE raised for climate and carbon
monitoring technologies
1H 2H 1H 2H 1H 2H 1H 2H 1H 2H 1H 2H 1Q
2015 2015 2016 2016 2017 2017 2018 2018 2019 2019 2020 2020 2021
Mapping & measuring sinks
Corporate sustainability
Quantifying emissions
>$50M
EMEA
Total funding
($ million)
Total deals
AMER
APAC
>$15M
>$1M
200 20 17 2 128 134 38 68 43 258 210 144 383
10 4 4 3 8 7 6 8 8 23 23 27 17
Early-stage investment trends
Largest VCPE deals for climate and carbon monitoring technology startups
0
300
600
900
1,200
1,500
0
200
400
2015 2016 2017 2018 2019 2020 20211Q
$ million
Total funding Cumulative corporate net-zerotargets (Science Based Targets)

32 Understanding and Monitoring our Changing Planet
VCPE investment trends for GHG monitoring
0
50
100
150
200
250
300
2015 2016 2017 2018 2019 2020 2021 1Q
$ million
Methane monitoring CO2 monitoing
Source: BloombergNEF, CB Insights. Note: Logos indicate most funded companies each year.
Investor spotlight: Data Collective VC
Venture capital investment into monitoring
emissions has been led by a combination of
corporations in the oil & gas sector and venture
capital firms focused on data and technology. Data
Collective VC, a technology-focused venture capital
firm, has helped spur some of the investment in the
early years.
● Founded in 2011, the firm has invested over $7.5
billion in companies using big data to change
various industries. Data Collective has a
geospatial division, through which it invests in
companies that monitor emissions.
● The firm has invested in multiple companies in
the space:
– Planet Labs’ series A, B and C rounds from
2013 to 2015
– Capella Space’s seed, series A and B rounds
from 2016 to 2018.
– Descartes Labs’s series A round in 2015
The most funded startups for GHG monitoring are nanosatellite firms, some of which have been raising VC funding for a decade. Roughly two-
thirds of this category’s capital was raised by three companies: Planet Labs ($367 million), Orbital Insights ($125 million) and Satellogic ($121
million).
These companies have built up high barriers to entry with a combination of complex intellectual property and expensive satellite constellations,
and it seems that investors are content following on their investments in the market leaders. In recent years there has also been funding into
ground-based sensors, drones and airplane startups, also tracking emissions.
VCPE investments into technologies monitoring emissions
Early-stage investment trends
33 Understanding and Monitoring our Changing Planet
VCPE investment trends for carbon sink mapping
0
15
30
45
60
2015 2016 2017 2018 2019 2020 2021 1Q
$ million
Soils Oceans ForestsSource: BloombergNEF, CB Insights. Note: Logos indicate most funded companies each year.
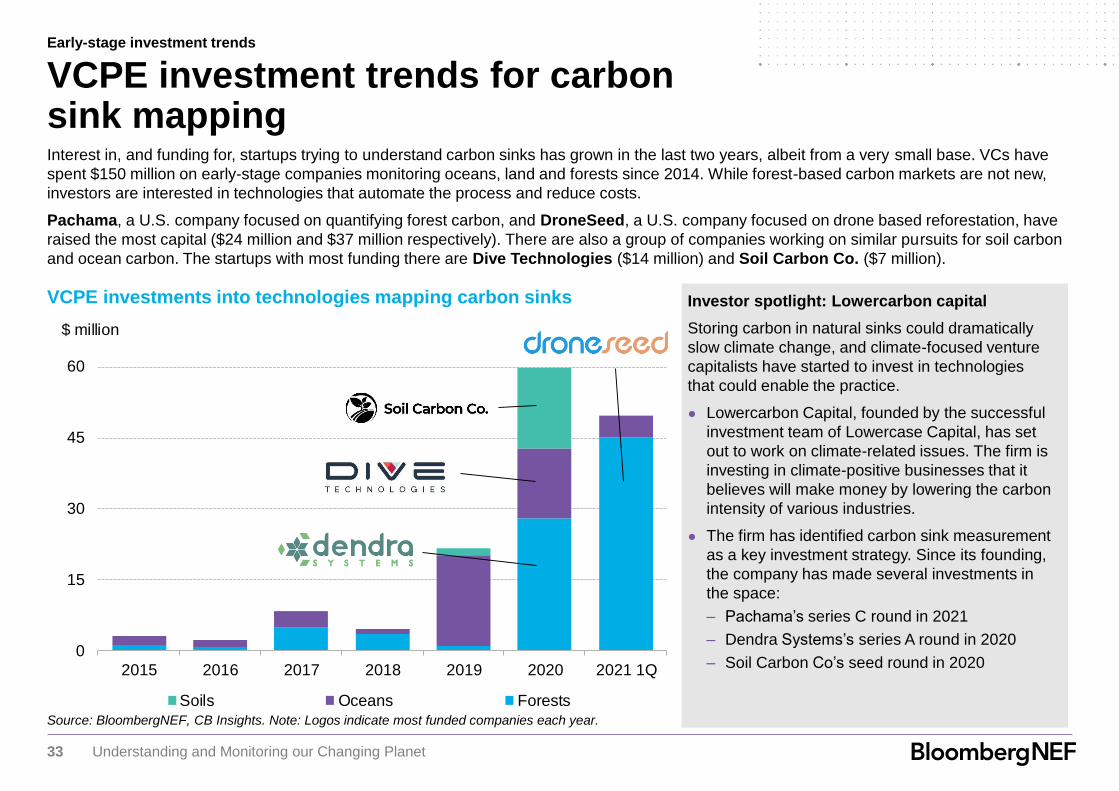
Investor spotlight: Lowercarbon capital
Storing carbon in natural sinks could dramatically
slow climate change, and climate-focused venture
capitalists have started to invest in technologies
that could enable the practice.
● Lowercarbon Capital, founded by the successful
investment team of Lowercase Capital, has set
out to work on climate-related issues. The firm is
investing in climate-positive businesses that it
believes will make money by lowering the carbon
intensity of various industries.
● The firm has identified carbon sink measurement
as a key investment strategy. Since its founding,
the company has made several investments in
the space:
– Pachama’s series C round in 2021
– Dendra Systems’s series A round in 2020
– Soil Carbon Co’s seed round in 2020
Interest in, and funding for, startups trying to understand carbon sinks has grown in the last two years, albeit from a very small base. VCs have
spent $150 million on early-stage companies monitoring oceans, land and forests since 2014. While forest-based carbon markets are not new,
investors are interested in technologies that automate the process and reduce costs.
Pachama, a U.S. company focused on quantifying forest carbon, and DroneSeed, a U.S. company focused on drone based reforestation, have
raised the most capital ($24 million and $37 million respectively). There are also a group of companies working on similar pursuits for soil carbon
and ocean carbon. The startups with most funding there are Dive Technologies ($14 million) and Soil Carbon Co. ($7 million).
VCPE investments into technologies mapping carbon sinks
Early-stage investment trends

34 Understanding and Monitoring our Changing Planet
VCPE investment trends for serving corporate climate concerns
Source: BloombergNEF, CB Insights. Note: Logos indicate most funded companies each year.
Investor spotlight: Liberty Mutual Strategic
Ventures & MS&AD Ventures
As corporations start to raise concerns about
climate change, the financial system that supports
them needs to better understand the associated
risks. Some companies within the insurance and
accounting industries have turned to startups to
help them better understand climate risk and carbon
accounting.
Liberty Mutual Strategic Ventures and MS&AD
Ventures are the strategic venture arms of global
insurance firms, Liberty Mutual and MS&AD. In
2020, both venture firms invested in climate risk
analytics startup Jupiter Intelligence.
● MS&AD is currently partnering with Jupiter
Intelligence to offer climate risk services in
Japan, and will look to expand its partnership.
● Liberty Mutual will use this new investment to
start to build new insurance products to help
mitigate and manage the risk of climate change.
0
100
200
300
2015 2016 2017 2018 2019 2020 2021 1Q
$ million
Carbon accounting Climate risk
Climate risk is becoming more of a concern in board rooms around the world, and entrepreneurs have started to respond. It is still early for this
group of technologies, with only two companies raising over $50 million dollars in the past five years (Spire and One Concern). With that said,
we believe that a combination of corporate interest and new data streams will drive more investment into this space. 1Q 2021 funding was so
large because of a $245 million investment in climate satellite and analytics company Spire, as the PIPE part of its SPAC. Investors include
BlackRock Advisors and Tiger Global Management.
Carbon accounting is perhaps a more popular topic than climate risk, yet the VC funding here is very small. While 14 carbon accounting startups
have raised money since early 2020, they are very early stage (mostly seed and series A). The most funded startup here is Persefoni.
VCPE investments in corporate sustainability technology startups
Early-stage investment trends

35 Understanding and Monitoring our Changing Planet
Copyright
© Bloomberg Finance L.P. 2021. This publication is the copyright of Bloomberg Finance L.P. in connection with BloombergNEF. No portion of this
document may be photocopied, reproduced, scanned into an electronic system or transmitted, forwarded or distributed in any way without prior
consent of BloombergNEF.
Disclaimer
The BloombergNEF ("BNEF"), service/information is derived from selected public sources. Bloomberg Finance L.P. and its affiliates, in providing
the service/information, believe that the information it uses comes from reliable sources, but do not guarantee the accuracy or completeness of
this information, which is subject to change without notice, and nothing in this document shall be construed as such a guarantee. The statements
in this service/document reflect the current judgment of the authors of the relevant articles or features, and do not necessarily reflect the opinion
of Bloomberg Finance L.P., Bloomberg L.P. or any of their affiliates (“Bloomberg”). Bloomberg disclaims any liability arising from use of this
document, its contents and/or this service. Nothing herein shall constitute or be construed as an offering of financial instruments or as investment
advice or recommendations by Bloomberg of an investment or other strategy (e.g., whether or not to “buy”, “sell”, or “hold” an investment). The
information available through this service is not based on consideration of a subscriber’s individual circumstances and should not be considered
as information sufficient upon which to base an investment decision. You should determine on your own whether you agree with the content. This
service should not be construed as tax or accounting advice or as a service designed to facilitate any subscriber’s compliance with its tax,
accounting or other legal obligations. Employees involved in this service may hold positions in the companies mentioned in the
services/information.
The data included in these materials are for illustrative purposes only. The BLOOMBERG TERMINAL service and Bloomberg data products (the
“Services”) are owned and distributed by Bloomberg Finance L.P. (“BFLP”) except (i) in Argentina, Australia and certain jurisdictions in the Pacific
islands, Bermuda, China, India, Japan, Korea and New Zealand, where Bloomberg L.P. and its subsidiaries (“BLP”) distribute these products, and
(ii) in Singapore and the jurisdictions serviced by Bloomberg’s Singapore office, where a subsidiary of BFLP distributes these products. BLP
provides BFLP and its subsidiaries with global marketing and operational support and service. Certain features, functions, products and services
are available only to sophisticated investors and only where permitted. BFLP, BLP and their affiliates do not guarantee the accuracy of prices or
other information in the Services. Nothing in the Services shall constitute or be construed as an offering of financial instruments by BFLP, BLP or
their affiliates, or as investment advice or recommendations by BFLP, BLP or their affiliates of an investment strategy or whether or not to “buy”,
“sell” or “hold” an investment. Information available via the Services should not be considered as information sufficient upon which to base an
investment decision. The following are trademarks and service marks of BFLP, a Delaware limited partnership, or its subsidiaries: BLOOMBERG,
BLOOMBERG ANYWHERE, BLOOMBERG MARKETS, BLOOMBERG NEWS, BLOOMBERG PROFESSIONAL, BLOOMBERG TERMINAL and
BLOOMBERG.COM. Absence of any trademark or service mark from this list does not waive Bloomberg’s intellectual property rights in that
name, mark or logo. All rights reserved. © 2021 Bloomberg.
Copyright and disclaimer

Coverage.
Clean energy
Advanced transport
Commodities
Digital industry
BloombergNEF (BNEF) is a leading provider
of primary research on clean energy,
advanced transport, digital industry,
innovative materials, and commodities.
BNEF’s global team leverages the world’s
most sophisticated data sets to create clear
perspectives and in-depth forecasts that
frame the financial, economic and policy
implications of industry-transforming trends
and technologies.
BNEF research and analysis is accessible
via web and mobile platforms, as well as on
the Bloomberg Terminal.
Client enquiries:
Bloomberg Terminal: press <Help> key twice
Email: [email protected]
Learn more:
about.bnef.com | @BloombergNEF