Embed Size (px)
Citation preview
Rwanda A. Definitions and sources of data The Rwanda National Assembly approved an investment code in 1998 (Law No. 14/98 of 18/12/1998) that defines all foreign investment in the country including foreign direct investment (FDI). In this code foreign investment is defined as any investment by a non-national with a minimum in fixed assets of $100,000. FDI data on Rwanda are collected by the National Bank of Rwanda. The International Monetary Fund also provides data on FDI in Rwanda in its balance-of-payments statistics. The Government of Rwanda pursues a friendly, liberal economic policy. The balance of natural resource reserves includes cassiterite, columbo-tantalite (coltan), wolfram, gold and sapphires, all of which are mined in small quantities. Cassiterite is the largest mineral deposit. Rwanda also has considerable tourist potential. The country’s main attractions are the North-western Virunga volcanoes and wildlife. The forests in the South-west of the country are suitable for hiking and bird watching. Lake Kivu is equally a main tourist destination, particularly the beautiful lakeside town of Kibuye. Kigali has several good quality hotels. Rwanda is quite active in the regional integration schemes in Africa. It is host to the Sub-regional development center of the Economic Commission for Africa. Therefore, it partakes in a number of regional integration agreements and eligible for a number of trade and investment initiatives, including the African Union, New Partnership for Africa's Development, the Community Investment Code of the Economic Community of the Great Lakes Countries, the Cotonou Agreement for the renegotiation of the partnership agreement between the African, Caribbean and Pacific and the European countries, the Economic Community of Central African States, the Common Market for Eastern and Southern Africa. The country belongs to a set of multilateral agreements including the Convention establishing the Multilateral Investment Guarantee Agency, Convention on the Settlement of Investment Disputes between States and Nationals of other states, the Paris Convention for the protection of Industrial Property and World Trade Organization.
Posting date: November 2006

B. Statistics on FDI and the operations of TNCs
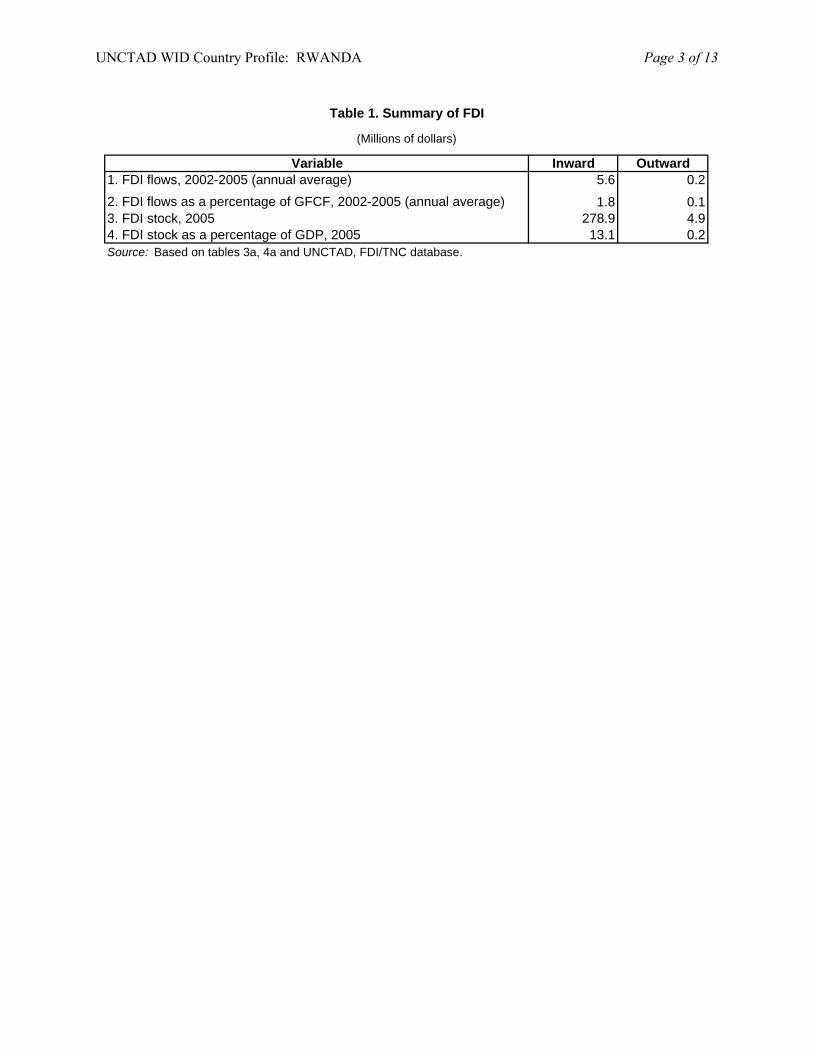
Table 1. Summary of FDI
(Millions of dollars)
Variable Inward Outward1. FDI flows, 2002-2005 (annual average) 5.6 0.22. FDI flows as a percentage of GFCF, 2002-2005 (annual average) 1.8 0.13. FDI stock, 2005 278.9 4.94. FDI stock as a percentage of GDP, 2005 13.1 0.2Source: Based on tables 3a, 4a and UNCTAD, FDI/TNC database.
UNCTAD WID Country Profile: RWANDA Page 3 of 13
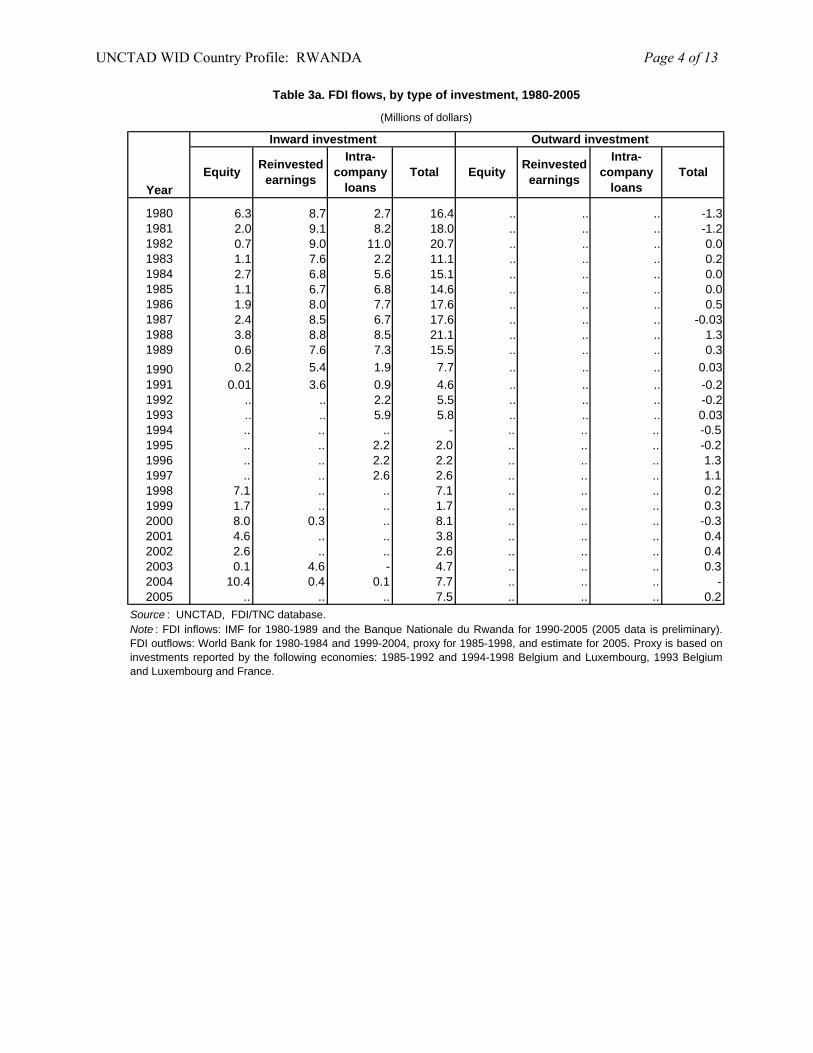
Table 3a. FDI flows, by type of investment, 1980-2005
(Millions of dollars)
Inward investment Outward investment
Year
1980 6.3 8.7 2.7 16.4 .. .. .. -1.31981 2.0 9.1 8.2 18.0 .. .. .. -1.21982 0.7 9.0 11.0 20.7 .. .. .. 0.01983 1.1 7.6 2.2 11.1 .. .. .. 0.21984 2.7 6.8 5.6 15.1 .. .. .. 0.01985 1.1 6.7 6.8 14.6 .. .. .. 0.01986 1.9 8.0 7.7 17.6 .. .. .. 0.51987 2.4 8.5 6.7 17.6 .. .. .. -0.031988 3.8 8.8 8.5 21.1 .. .. .. 1.31989 0.6 7.6 7.3 15.5 .. .. .. 0.31990 0.2 5.4 1.9 7.7 .. .. .. 0.031991 0.01 3.6 0.9 4.6 .. .. .. -0.21992 .. .. 2.2 5.5 .. .. .. -0.21993 .. .. 5.9 5.8 .. .. .. 0.031994 .. .. .. - .. .. .. -0.51995 .. .. 2.2 2.0 .. .. .. -0.21996 .. .. 2.2 2.2 .. .. .. 1.31997 .. .. 2.6 2.6 .. .. .. 1.11998 7.1 .. .. 7.1 .. .. .. 0.21999 1.7 .. .. 1.7 .. .. .. 0.32000 8.0 0.3 .. 8.1 .. .. .. -0.32001 4.6 .. .. 3.8 .. .. .. 0.42002 2.6 .. .. 2.6 .. .. .. 0.42003 0.1 4.6 - 4.7 .. .. .. 0.32004 10.4 0.4 0.1 7.7 .. .. .. -2005 .. .. .. 7.5 .. .. .. 0.2
Source : UNCTAD, FDI/TNC database. Note : FDI inflows: IMF for 1980-1989 and the Banque Nationale du Rwanda for 1990-2005 (2005 data is preliminary).FDI outflows: World Bank for 1980-1984 and 1999-2004, proxy for 1985-1998, and estimate for 2005. Proxy is based oninvestments reported by the following economies: 1985-1992 and 1994-1998 Belgium and Luxembourg, 1993 Belgiumand Luxembourg and France.
Equity Reinvested earnings
Intra-company
loansTotalEquity Reinvested
earnings
Intra-company
loansTotal
UNCTAD WID Country Profile: RWANDA Page 4 of 13

Year
1980 6.3 8.7 2.7 17.7 .. .. .. ..1981 2.0 9.1 8.2 19.2 .. .. .. ..1982 0.7 9.0 11.0 20.7 .. .. .. ..1983 1.1 7.6 2.2 10.9 .. .. .. ..1984 2.7 6.8 5.6 15.1 .. .. .. ..1985 1.1 6.7 6.8 14.6 .. .. .. ..1986 1.9 8.0 7.7 17.6 .. .. .. ..1987 2.4 8.5 6.7 17.6 .. .. .. ..1988 3.8 8.8 8.5 21.1 .. .. .. ..1989 0.6 7.6 7.3 15.5 .. .. .. ..1990 0.2 5.4 1.9 7.6 .. .. .. ..1991 0.0 3.6 0.9 4.6 .. .. .. ..1992 .. .. 2.2 2.2 .. .. .. ..1993 .. .. 5.9 5.9 .. .. .. ..1994 .. .. .. .. .. .. .. ..1995 .. .. 2.2 2.2 .. .. .. ..1996 .. .. 2.2 2.2 .. .. .. ..1997 .. .. 2.6 2.6 .. .. .. ..1998 7.1 .. .. 7.1 .. .. .. ..1999 1.7 .. .. 1.7 .. .. .. ..2000 8.0 0.3 .. 8.3 .. .. .. ..2001 4.6 .. .. 4.6 .. .. .. ..2002 2.6 .. .. 2.6 .. .. .. ..2003 4.7 .. .. 4.7 .. .. .. ..2004 7.7 .. .. 7.7 .. .. .. ..2005 7.5 .. .. 7.5 .. .. .. ..
Source: International Monetary Fund, Balance of Payments CD ROM, August 2006.
Equity Reinvested earnings
Intra-company
loansTotalEquity Reinvested
earnings
Intra-company
loansTotal
Table 3b. FDI flows, by type of investment, 1980-2005
(Millions of dollars)
Inward investment Outward investment
UNCTAD WID Country Profile: RWANDA Page 5 of 13
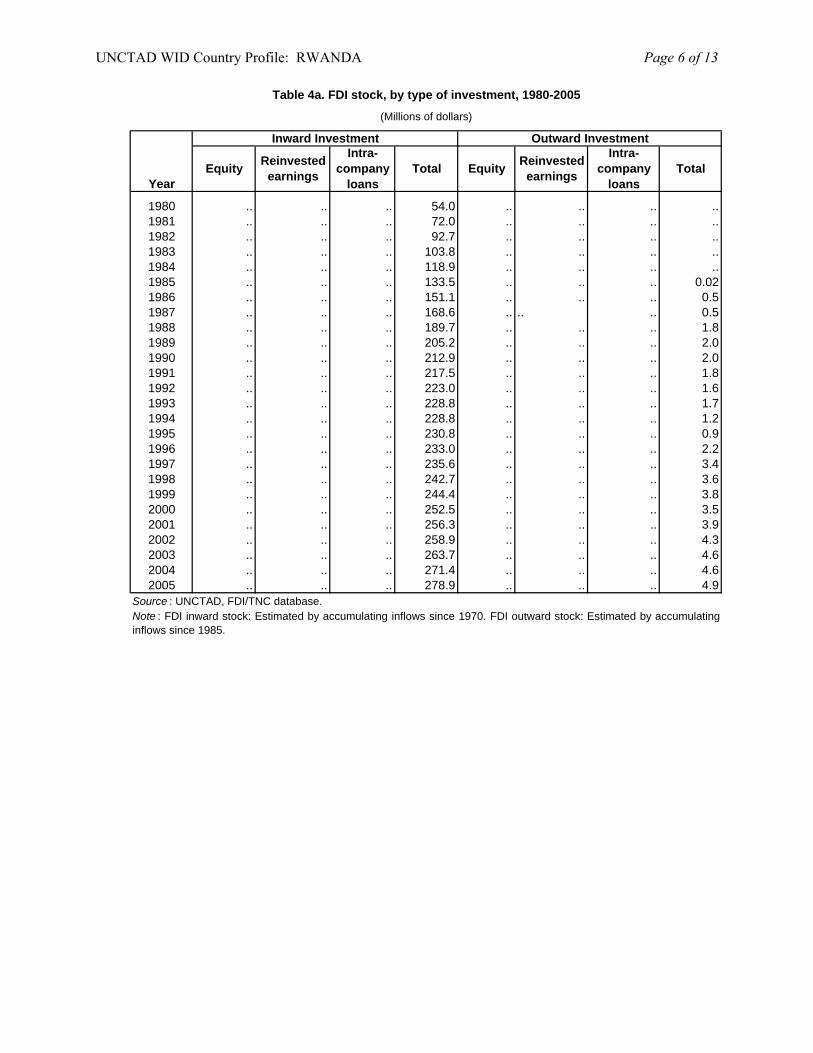
Table 4a. FDI stock, by type of investment, 1980-2005
(Millions of dollars)
Inward Investment Outward Investment
Year
1980 .. .. .. 54.0 .. .. .. ..1981 .. .. .. 72.0 .. .. .. ..1982 .. .. .. 92.7 .. .. .. ..1983 .. .. .. 103.8 .. .. .. ..1984 .. .. .. 118.9 .. .. .. ..1985 .. .. .. 133.5 .. .. .. 0.021986 .. .. .. 151.1 .. .. .. 0.51987 .. .. .. 168.6 .. .. .. 0.51988 .. .. .. 189.7 .. .. .. 1.81989 .. .. .. 205.2 .. .. .. 2.01990 .. .. .. 212.9 .. .. .. 2.01991 .. .. .. 217.5 .. .. .. 1.81992 .. .. .. 223.0 .. .. .. 1.61993 .. .. .. 228.8 .. .. .. 1.71994 .. .. .. 228.8 .. .. .. 1.21995 .. .. .. 230.8 .. .. .. 0.91996 .. .. .. 233.0 .. .. .. 2.21997 .. .. .. 235.6 .. .. .. 3.41998 .. .. .. 242.7 .. .. .. 3.61999 .. .. .. 244.4 .. .. .. 3.82000 .. .. .. 252.5 .. .. .. 3.52001 .. .. .. 256.3 .. .. .. 3.92002 .. .. .. 258.9 .. .. .. 4.32003 .. .. .. 263.7 .. .. .. 4.62004 .. .. .. 271.4 .. .. .. 4.62005 .. .. .. 278.9 .. .. .. 4.9
Source : UNCTAD, FDI/TNC database. Note : FDI inward stock: Estimated by accumulating inflows since 1970. FDI outward stock: Estimated by accumulatinginflows since 1985.
Equity Reinvested earnings
Intra-company
loansTotalEquity Reinvested
earnings
Intra-company
loansTotal
UNCTAD WID Country Profile: RWANDA Page 6 of 13
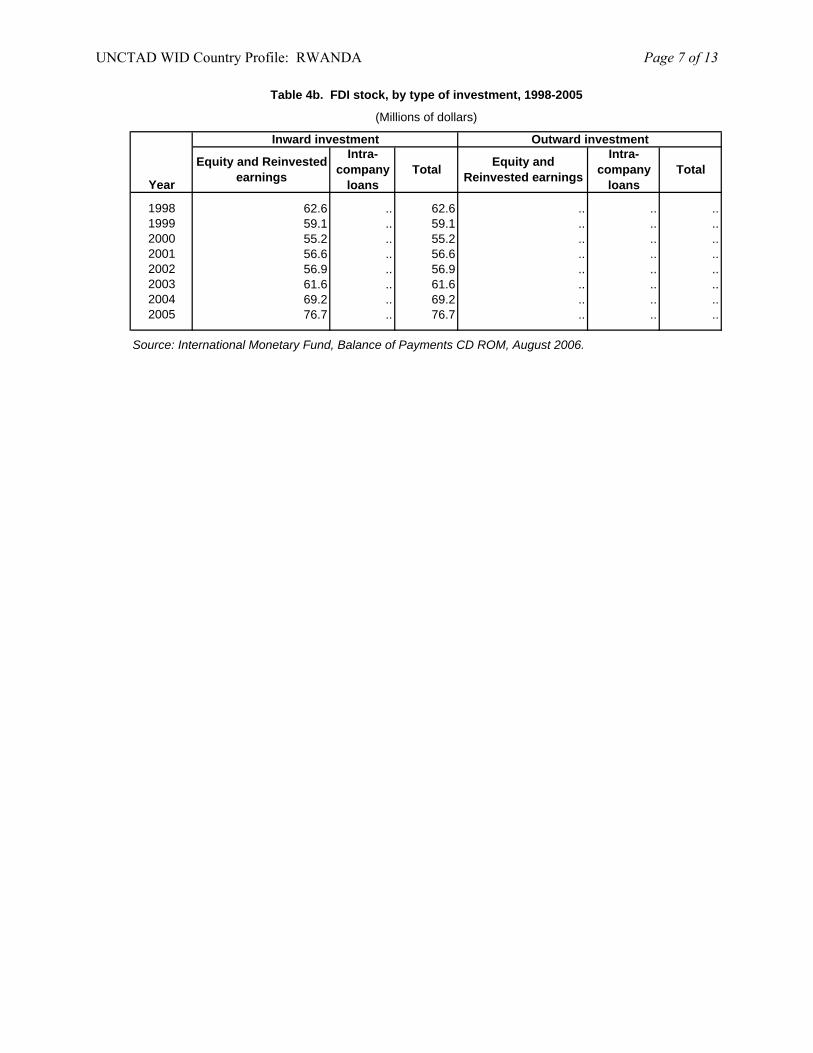
Year
1998 62.6 .. 62.6 .. .. ..1999 59.1 .. 59.1 .. .. ..2000 55.2 .. 55.2 .. .. ..2001 56.6 .. 56.6 .. .. ..2002 56.9 .. 56.9 .. .. ..2003 61.6 .. 61.6 .. .. ..2004 69.2 .. 69.2 .. .. ..2005 76.7 .. 76.7 .. .. ..
Source: International Monetary Fund, Balance of Payments CD ROM, August 2006.
Intra-company
loansTotalEquity and Reinvested
earnings
Intra-company
loansTotal Equity and
Reinvested earnings
Table 4b. FDI stock, by type of investment, 1998-2005
(Millions of dollars)
Inward investment Outward investment
UNCTAD WID Country Profile: RWANDA Page 7 of 13

Economy 1990 1991 1992 1993 1994 1995 1996 1997 1998 1999 2000 2001 2002 2003 2004Belgium / Luxembourg -1.2 0.3 0.5 -0.1 -0.8 3.0 0.3 1.3 -0.3 .. 0.9 -0.9 -2.7 -4.5 -6.3Germany -1.2 20.0 -2.5 5.9 .. .. 1.3 1.1 .. .. .. .. .. 2.3 1.2Source: UNCTAD, FDI/TNC database.Note: Data are based on information reported by the economies listed above.
Economy 1990 1991 1992 1993 1994 1995 1996 1997 1998Belgium / Luxembourg .. -0.2 -0.2 -0.1 -0.5 -0.2 1.3 1.2 0.2France .. .. .. 0.2 .. .. .. .. ..Source: UNCTAD, FDI/TNC database.Note: Data are based on information reported by the economies listed above.
Table 12. FDI stock of the United States in Rwanda, 1990-1993
Economy 1990 1991 1992 1993United States 1.0 2.0 2.0 2.0Source: UNCTAD, FDI/TNC database.Note: Data are based on information reported by the United States.
Table no. Variable 1990 1991 1992 199323 Number 1 1 1 130 Assets .. 7.0 7.0 ..45 Sales 4.0 4.0 4.0 ..
Source: UNCTAD, FDI/TNC database.Note: Data are based on information reported by the United States.
(Millions of dollars)
(Number and millions of dollars)
Tables 23, 30 and 45. The number, assets and sales of foreign affiliates of United States' TNCs in Rwanda,
Table 6. FDI flows in the host economy, by geographical origin, 1990-2004
(Millions of dollars)
Table 9. FDI flows abroad, by geographical destination, 1990-1998
(Millions of dollars)
UNCTAD WID Country Profile: RWANDA Page 8 of 13

Table 88. Largest affiliates of foreign TNCs in the host economy, 2004
(Millions of dollars and number)
Company Name Home economy Industry Sales Employees
A. Industrial
Brasseries et Limonaderies du Rwanda Switzerland Food products, beverages and tabacco 34 539Arab Contractors Egypt Construction .. 45
B. Tertiary
SGS Rwanda Switzerland Other business services .. ..
C. Finace and InsuranceAssets Employees
Banque Commerciale du Rwanda Belgium Finance 111 301 a
Banque de Kigali Belgium Finance 104 301 b
a 2001. b 2000.
Sources: http://www.sgs.com, The Banker's Almanac, 2003 (London, Reed Information Services Ltd, 2003); Thomson Analytics(http://analytics.thomsonib.com/); Thomson Analytics (http://analytics.thomsonib.com/).
UNCTAD WID Country Profile: RWANDA Page 9 of 13
C. Legal frameworks for transnational corporations In effort to improve the effectiveness of regulation of transnational corporations and foreign investment in the country, the government of Rwanda had adopted the following national, bilateral and multilateral legal instruments. I. National framework The Rwandan Investment Code (Law No. 14/98 of 18/12/1998), December 1998. Source: US Mission to Rwanda (http://www.usembkigali.net/rwanda/investment_climate.htm). Investment Law. Law 21/1987 of 5 August 1987, as amended by Law No. 07/90 of 31 January 1990. Source: Official Journal of the Republic of Rwanda, No. 3, 1 February 1990. Patents: Loi de février 1963, relative aux brevets. Arrêté ministériel no 5/10/67 de mai 1967 portant mesures d’exécution de la Loi du 25 février 1963 sur les brevets. Source: WIPO (http://www.wipo.org). Trade Marks: Loi de février 1963 relative aux marques de fabrique et de commerce. Arrêté ministériel no 10/63 de mai 1963 portant mesures d’exécution de la Loi du 25 février 1963 sur les marques de fabrique et de commerce. Arrêté ministériel no 3/10/67 de mai 1967 portant mesures d’exécution de la Loi de février 1963 sur les marques de fabrique et de commerce. Source: WIPO (http://www.wipo.org). Industrial Designs: Loi de février 1963 sur les dessins et modèles industriels. Arrêté ministériel no 4/10/67 de mai 1967 portant mesures d’exécution de la Loi de février 1963 sur les dessins et modèles industriels. Source: WIPO (http://www.wipo.org). Copyright: Loi no 27/1983 de novembre 1983 régissant le droit d’auteur. Source: WIPO (http://www.wipo.org). II. International Framework A. Rwanda is a party to the following multilateral and regional instruments: Paris Convention for the Protection of Industrial Property of 1883 (Revised at Brussels in 1900, Washington in 1911, The Hague in 1925, London in 1934, Lisbon in 1958 and Stockholm in 1967, and as amended in 1979). Signed in 1994. Convention on the Settlement of Investment Disputes between States and Nationals of other States of 1965. Entered into force on 14 October 1966 Convention Establishing the Multilateral Investment Guarantee Agency of 1985, entered into force on 12 April 1988. Marrakesh Agreement Establishing the World Trade Organisation of 15 April 1994. Entered into force on 1 January 1995. Agreement on Trade-Related Investment Measures. General Agreement on Trade in Services. Agreement on Trade Related Aspects of Intellectual Property Rights.
UNCTAD WID Country Profile: RWANDA Page 10 of 13

Treaty for the Establishment of the Economic Community of Central African States of 18 October 1983; entered into force in December 1984. Community Investment Code of the Economic Community of the Great Lakes Countries of 31 January 1982; entered into force on: 4 October 1987. Fourth ACP - EEC Convention (Lome IV) of 1989, entered into force on 1st March 1990. Charter on a Regime of Multinational Industrial Enterprises (MIEs) in the Preferential Trade Area for Eastern and Southern African States. Southern Africa Development Community (SADC). Treaty for the Establishment of the East African Community, 30 November 1999. Partnership Agreement between the Members of The African, Caribbean and Pacific Group of States, of the one part and the European Community and its member states, of the other part signed in Cotonou, Benin on 23 June 2000. B. Bilateral treaties 1. Bilateral investment treaties for the protection and promotion of investments: Switzerland 1963, Germany 1967, Belgium / Luxembourg 1983. 2. Bilateral treaties for the avoidance of double taxation: …
UNCTAD WID Country Profile: RWANDA Page 11 of 13

D. Sources of information Official National Bank of Rwanda (www.bct.gov.tn). Secondary Bennell, Paul (1997). "Foreign direct investment in Africa: rhetoric and reality", SAIS Review
(Summer/Fall), pp. 127-139.
Bennell, Paul (1997). "Privatization in Sub-Saharan Africa: progress and prospects during the 1990s",
World Development, vol. 25, no. 11, pp. 1785-1803.
Broll, U. (2003). "Foreign direct investment, credible policy: the role of risk sharing". International trade
journal, vol. XVII, No. 2., pp. 165 – 176.
Economist Intelligence Unit (EIU) (2002a).Country Profile: Rwanda (London: EIU Ltd.).
___________________(2002b).Country Report: Rwanda (London: EIU Ltd.), April.
___________________(2005a).Country Profile: Rwanda (London: EIU Ltd.).
___________________(2005b).Country Report: Rwanda (London: EIU Ltd.), April.
International Finance Corporation (IFC) (1997). Foreign direct investment, IFC: lessons of experience
series No. 5 (Washington D.C.: World Bank).
International Monetary Fund (IMF) (2006). IMF's Sub-Saharan Africa Regional Economic Outlook, March 10, 2006. (Washington D.C.: IMF).
Kirby, Robin (2003). Foreign exchange controls: foreign exchange management, pp. 23 – 27; FIAS:
South Asia FDI Roundtable (Washington D.C.: FIAS)
(http://www.fias.net/Conferences/030403%20Kirby.pdf).
Soderbom, M. and F. Teal (2004). "Size and Efficiency in Africa Manufacturing firms: Evidence from Firm-Level Panel Data." Journal of Development Economics, 73. pp 369 - 394.
United Nations Conference on Trade and Development (UNCTAD) (1995). Foreign Direct Investment in
Africa (Geneva: United Nations, United Nations publication, Sales No. E.95.II.A.6).
___________________(2000). Capital Flows and Growth in Africa (Geneva: UNCTAD/GDS/MDPB/7).
___________________(2003). FDI in Landlocked Developing Countries at a Glance (Geneva: UNCTAD/ITE/IIA/2003/5).
__________________ (2005a). Investor-Disputes Arising from Investment Treaties: A Review. UNCTAD Series of International Investment Policies for Development (UNCTAD/ITE/IIT/2005/4).
UNCTAD WID Country Profile: RWANDA Page 12 of 13
___________________(2005b). A Survey of Support by Investment Promotion Agencies to Linkages. Advisory Studies No. 18 (UNCTAD/ITE/IPC/2005/12).
___________________(2005c). FDI in least developed countries at a glance: 2005/2006
(UNCTAD/ITE/IIA/2005/17). United States Trade Representative (2006). 2006 Comprehensive Report on U.S. Trade and Investment Policy
Toward sub-Saharan Africa and Implementation of the Africa Growth and Opportunity Act: The Sixth of Eight Annual Reports, May 2006. (Washington D.C.: US Government).
World Bank (2002). Global Economic Prospects and the Developing Countries 2003: Investing to Unlock Opportunities (Washington D.C.: World Bank).
UNCTAD WID Country Profile: RWANDA Page 13 of 13