Embed Size (px)
Citation preview
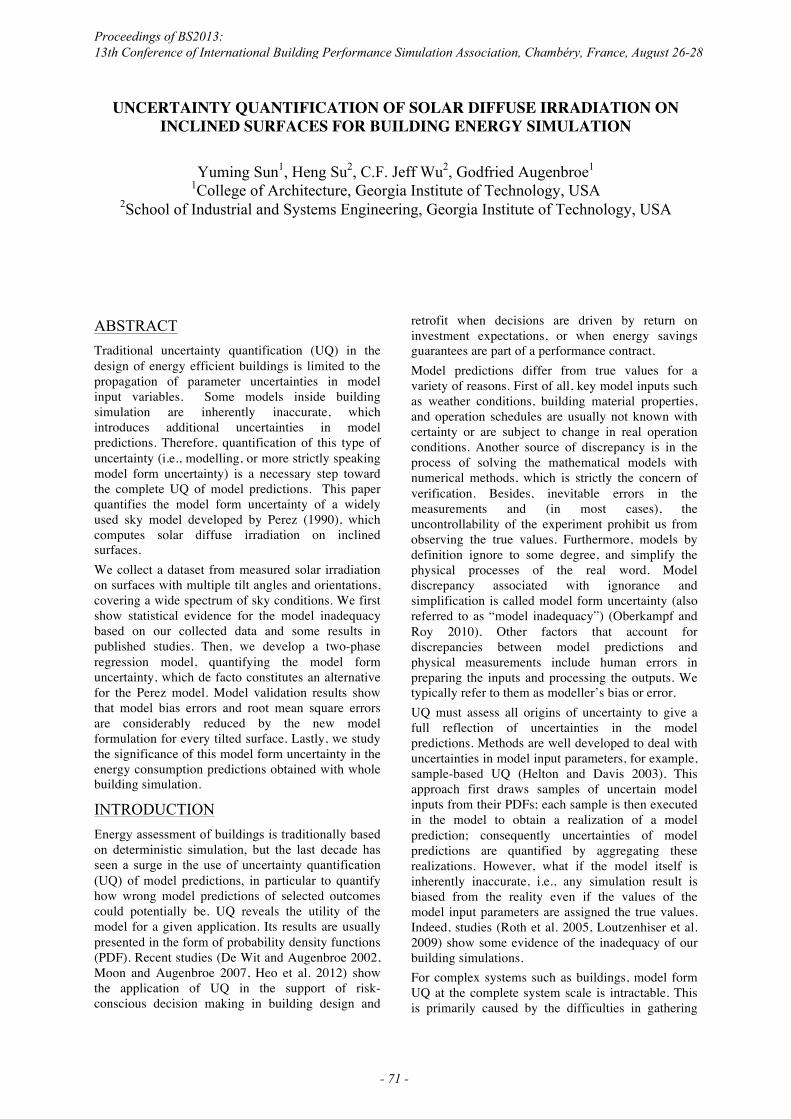
UNCERTAINTY QUANTIFICATION OF SOLAR DIFFUSE IRRADIATION ON INCLINED SURFACES FOR BUILDING ENERGY SIMULATION
Yuming Sun1, Heng Su2, C.F. Jeff Wu2, Godfried Augenbroe1
1College of Architecture, Georgia Institute of Technology, USA 2School of Industrial and Systems Engineering, Georgia Institute of Technology, USA
ABSTRACT Traditional uncertainty quantification (UQ) in the design of energy efficient buildings is limited to the propagation of parameter uncertainties in model input variables. Some models inside building simulation are inherently inaccurate, which introduces additional uncertainties in model predictions. Therefore, quantification of this type of uncertainty (i.e., modelling, or more strictly speaking model form uncertainty) is a necessary step toward the complete UQ of model predictions. This paper quantifies the model form uncertainty of a widely used sky model developed by Perez (1990), which computes solar diffuse irradiation on inclined surfaces. We collect a dataset from measured solar irradiation on surfaces with multiple tilt angles and orientations, covering a wide spectrum of sky conditions. We first show statistical evidence for the model inadequacy based on our collected data and some results in published studies. Then, we develop a two-phase regression model, quantifying the model form uncertainty, which de facto constitutes an alternative for the Perez model. Model validation results show that model bias errors and root mean square errors are considerably reduced by the new model formulation for every tilted surface. Lastly, we study the significance of this model form uncertainty in the energy consumption predictions obtained with whole building simulation.
INTRODUCTION Energy assessment of buildings is traditionally based on deterministic simulation, but the last decade has seen a surge in the use of uncertainty quantification (UQ) of model predictions, in particular to quantify how wrong model predictions of selected outcomes could potentially be. UQ reveals the utility of the model for a given application. Its results are usually presented in the form of probability density functions (PDF). Recent studies (De Wit and Augenbroe 2002, Moon and Augenbroe 2007, Heo et al. 2012) show the application of UQ in the support of risk-conscious decision making in building design and
retrofit when decisions are driven by return on investment expectations, or when energy savings guarantees are part of a performance contract. Model predictions differ from true values for a variety of reasons. First of all, key model inputs such as weather conditions, building material properties, and operation schedules are usually not known with certainty or are subject to change in real operation conditions. Another source of discrepancy is in the process of solving the mathematical models with numerical methods, which is strictly the concern of verification. Besides, inevitable errors in the measurements and (in most cases), the uncontrollability of the experiment prohibit us from observing the true values. Furthermore, models by definition ignore to some degree, and simplify the physical processes of the real word. Model discrepancy associated with ignorance and simplification is called model form uncertainty (also referred to as “model inadequacy”) (Oberkampf and Roy 2010). Other factors that account for discrepancies between model predictions and physical measurements include human errors in preparing the inputs and processing the outputs. We typically refer to them as modeller’s bias or error. UQ must assess all origins of uncertainty to give a full reflection of uncertainties in the model predictions. Methods are well developed to deal with uncertainties in model input parameters, for example, sample-based UQ (Helton and Davis 2003). This approach first draws samples of uncertain model inputs from their PDFs; each sample is then executed in the model to obtain a realization of a model prediction; consequently uncertainties of model predictions are quantified by aggregating these realizations. However, what if the model itself is inherently inaccurate, i.e., any simulation result is biased from the reality even if the values of the model input parameters are assigned the true values. Indeed, studies (Roth et al. 2005, Loutzenhiser et al. 2009) show some evidence of the inadequacy of our building simulations. For complex systems such as buildings, model form UQ at the complete system scale is intractable. This is primarily caused by the difficulties in gathering
Proceedings of BS2013: 13th Conference of International Building Performance Simulation Association, Chambéry, France, August 26-28
- 71 -
high-quality data in terms of both model input parameters and model outputs. An effective way of conducting UQ for complex systems is to develop a hierarchy structure that breaks down a complex system into subsystems and then into units. In current dynamic building simulation, such hierarchy is indeed the structure of some tools. For example, EnergyPlus (EnergyPlus 2012) is a collection of modules that work together to calculate the final outcomes. Each module performs a specific function that contains only a few physical processes. For instance, the calculation of diffuse solar irradiation on building surfaces deploys sky models formulated by a set of algebraic equations whose outcomes affect the boundary conditions of other modules. Fortunately, at module scale we can in many cases collect high quality physical observations. Hence, UQ of building model form should exploit this hierarchical composition, focusing first on the lowest-level component and moving successively to more complex levels.
How to infer model predictions from existing physical observations is usually the concern of statistics. Typically, model form UQ takes the form of a statistical model, e.g., regression, which correlates the discrepancies between model prediction and physical observations with some variables or model parameters.
This paper proposes a framework for the quantification of model form uncertainty based on physical observations. We demonstrate this framework in the UQ of the very well known sky model developed by Perez et al. (1990) , which predicts solar diffuse irradiation on inclined surfaces. We choose the Perez mode as the case study for two reasons. First, a number of studies have shown that this model performs adequately in some circumstances (Loutzenhiser et al. 2007), yet exhibits noticeable discrepancies in other circumstances (Diez-Mediavilla et al. 2005). Second, although solar irradiation is one of the most important boundary conditions for many components in the building model, we have not seen an effective approach that quantifies model form uncertainty of the Perez model, with the derived goal to improve the predictions given by the Perez 1990 model.
APPROACH
Formal approaches dealing with model form uncertainty can be categorized into two groups. In the first group a model is compared with a higher fidelity model. An application of this approach is shown in (Sun et al. 2013) for the UQ of building microclimate variables. Equation 1 describes its generic formulation. We denote the output of the low fidelity model by !! ! when the variable inputs take values ! = (!!,⋯ , !!) . The high fidelity model typically requires more input variables; we denote the high fidelity model by !! !,! when the additional
variables are given by ! = (!!,⋯ , !!). We denote model discrepancy by !"## !,! . !"## !,! = !! !,! − !!! ! + !! (1) where ! represents residual variations. This method requires superior domain knowledge in the given application context because it relies on a priori expert judgment regarding the selection of the high fidelity model. The approach has been successfully applied to the UQ of microclimate variables as a result of urban heat island (UHI) effect (Sun et al. 2013). The authors deploy a computer model from the meteorology domain as a high fidelity model to compute the UHI effect. If UHI is ignored in the standard model, the diff in (1) quantifies the influence of this (deliberate) ignorance on building simulation results. A preliminary UQ is usually followed by a sensitivity analysis (SA), which ranks the effects of different models on the quantities of interest. If a high fidelity model does not exist or is rejected because the SA identifies the diff to be the most influential for a certain use, we turn to our second approach, which implies that we focus on model form uncertainty, in which case we have to turn to physical measurements. Compared with Equation 1, the high fidelity model is now substituted by physical observations. We represent the relationship between model form uncertainty!!"##(!,!), the simulation model!! ! , and the physical observations !!"# in the following equation !"## !,! = !!"# − !! ! (2) It is noteworthy that adding new variables ! in this case is beneficial, yet demanding. It needs a good understanding of the shortcoming of the model at hand and relies on an effective method for physical experimental designs. On the other hand, adding new variables will lead to better representation of the model inadequacy and eventually lead to better physical models. Stating model inadequacy as equation (1) and (2) is not the only way (Park et al. 2010, Roy and Oberkampf 2011). We take this form not only for computational convenience but also because the results of !"##(!,!) are easy to interpret since they relate to the same physical units as the model outputs.
UNCERTAINTY QUANTIFICATION OF THE PEREZ MODEL In building energy models, the diffuse component of solar irradiation appears in the boundary condition of external building surfaces. In case of transparent surfaces it also appears in the boundary conditions of internal surfaces. In few cases, the diffuse component is directly measured for the orientation and tilt of every surface that appears in a model. Therefore, in current building energy studies, it is derived from other directly measured quantities and sky condition parameters. Typically, measured data are only
Proceedings of BS2013: 13th Conference of International Building Performance Simulation Association, Chambéry, France, August 26-28
- 72 -
available for horizontal surfaces. Thus, models were developed to derive solar irradiation on surfaces with any tilt angle and orientation from horizontal data, most notable the model developed by Perez et al. (1990). We refer to this model as the Perez model in this paper. We quantify the uncertainty of the Perez model for those cases where measurements of global horizontal solar irradiation and direct normal solar irradiation are available.
Perez Model
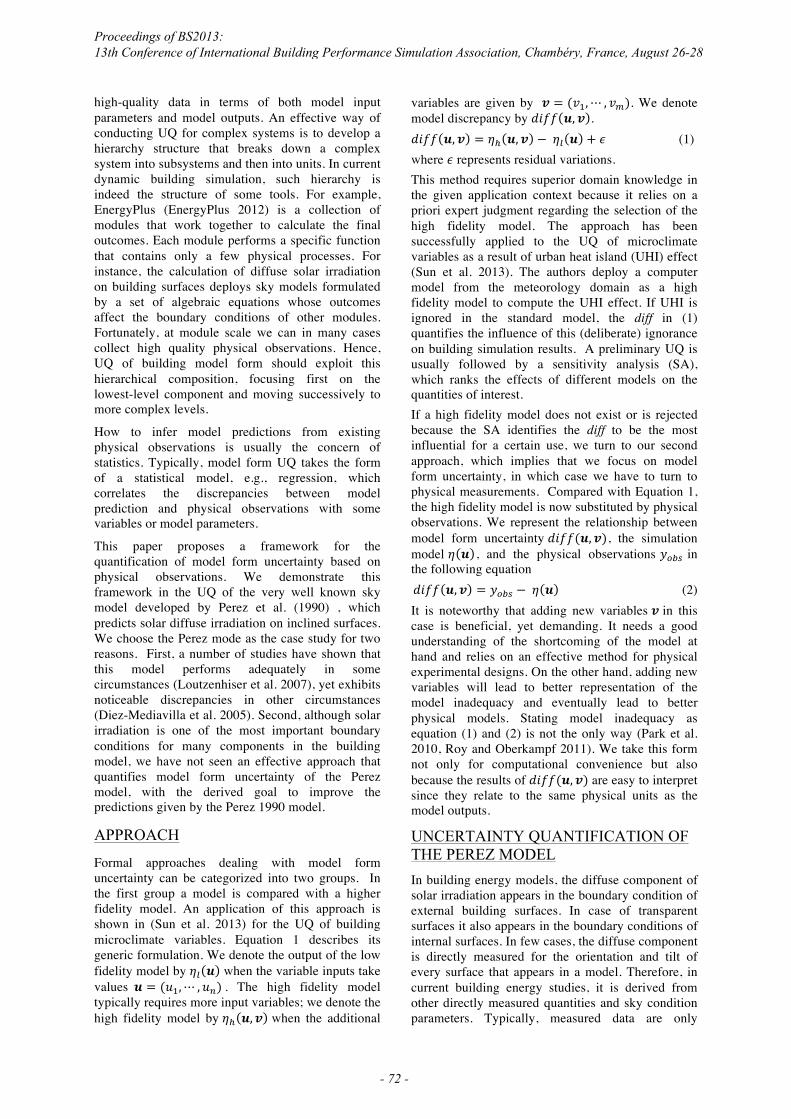
The Perez model postulates a simplified sky representation, in which the sky hemisphere is composed of a circumsolar disc and horizon band on an isotropic background. Each element has a parametric representation of solar irradiation with multiple coefficients, whose values were obtained through statistical regression analysis. Figure 1 shows its input-to-output relationship.
Experimental Data We use detailed measured data from a station of Solar Radiation Monitoring Laboratory at Eugene, Oregon (SRML) . The data includes simultaneous measurements of (1) global solar irradiation on horizontal surfaces, (2) diffuse solar irradiation on horizontal surfaces, (3) direct normal solar irradiation, (4) ground reflected solar irradiation, (5) global solar irradiation on south tilt surfaces at 30°, 45°, and 90°, and (6) global solar irradiation on a north vertical surface. Global solar irradiation (i.e., the sum of direct and diffuse) is measured with the Eppley Precision Spectral Pyranometer (PSP). Diffuse solar irradiation is measured with the shaded Eppley PSE with automatic trackers. Direct normal is measured with Eppley Normal Incident Pyrheliometer (NIP). The ground reflected solar irradiation is measured with the Eppley PSP facing the ground. Table 1 provides an overview of the specifications of the instruments.
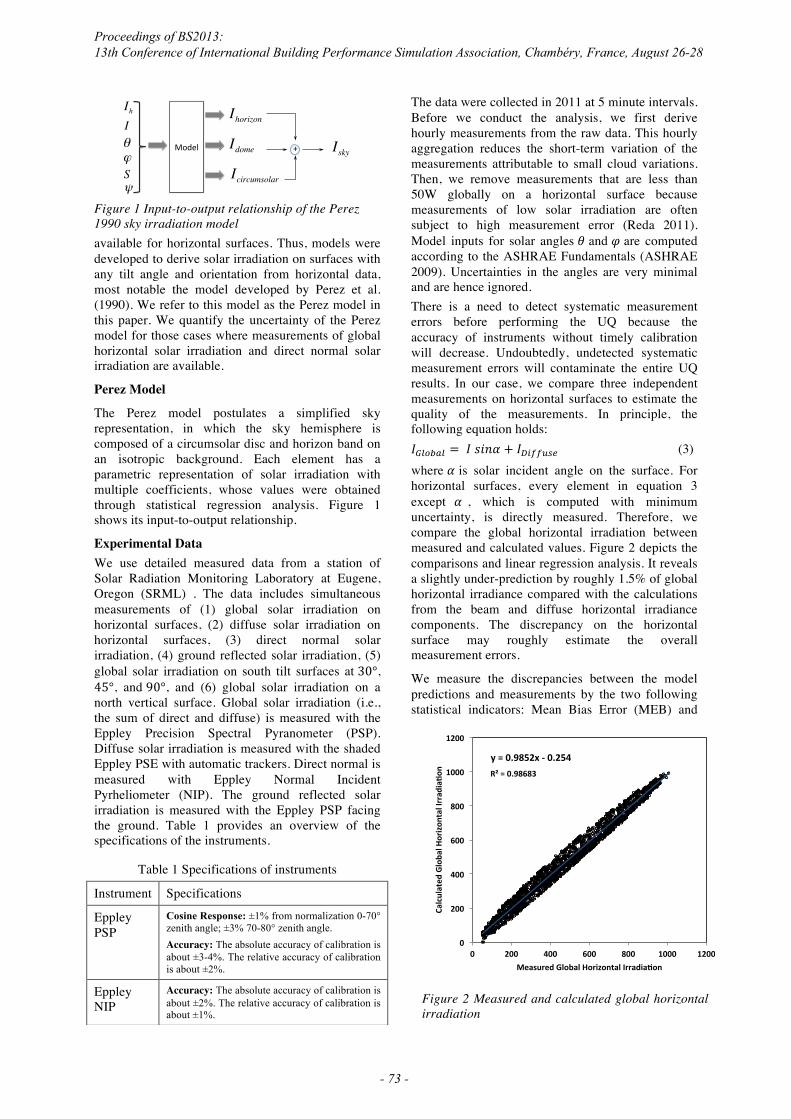
The data were collected in 2011 at 5 minute intervals. Before we conduct the analysis, we first derive hourly measurements from the raw data. This hourly aggregation reduces the short-term variation of the measurements attributable to small cloud variations. Then, we remove measurements that are less than 50W globally on a horizontal surface because measurements of low solar irradiation are often subject to high measurement error (Reda 2011). Model inputs for solar angles ! and ! are computed according to the ASHRAE Fundamentals (ASHRAE 2009). Uncertainties in the angles are very minimal and are hence ignored. There is a need to detect systematic measurement errors before performing the UQ because the accuracy of instruments without timely calibration will decrease. Undoubtedly, undetected systematic measurement errors will contaminate the entire UQ results. In our case, we compare three independent measurements on horizontal surfaces to estimate the quality of the measurements. In principle, the following equation holds: !!"#$%" = !!!!"#$ + !!"##$%& (3) where ! is solar incident angle on the surface. For horizontal surfaces, every element in equation 3 except ! , which is computed with minimum uncertainty, is directly measured. Therefore, we compare the global horizontal irradiation between measured and calculated values. Figure 2 depicts the comparisons and linear regression analysis. It reveals a slightly under-prediction by roughly 1.5% of global horizontal irradiance compared with the calculations from the beam and diffuse horizontal irradiance components. The discrepancy on the horizontal surface may roughly estimate the overall measurement errors.
We measure the discrepancies between the model predictions and measurements by the two following statistical indicators: Mean Bias Error (MEB) and
Figure 1 Input-to-output relationship of the Perez 1990 sky irradiation model
Table 1 Specifications of instruments
Instrument Specifications
Eppley PSP
Cosine Response: ±1% from normalization 0-70° zenith angle; ±3% 70-80° zenith angle.
Accuracy: The absolute accuracy of calibration is about ±3-4%. The relative accuracy of calibration is about ±2%.
Eppley NIP
Accuracy: The absolute accuracy of calibration is about ±2%. The relative accuracy of calibration is about ±1%.
Figure 2 Measured and calculated global horizontal irradiation
Model&
IhIθϕS
Isky
Ihorizon
Idome
Icircumsolar
+&
ψ
y"="0.9852x"+"0.254"R²"="0.98683"
0"
200"
400"
600"
800"
1000"
1200"
0" 200" 400" 600" 800" 1000" 1200"
Calculated
"Globa
l"Horizon
tal"Irrad
iaCo
n"
Measured"Global"Horizontal"IrradiaCon"
Proceedings of BS2013: 13th Conference of International Building Performance Simulation Association, Chambéry, France, August 26-28
- 73 -
Root Mean Square Error (RMSE).
!"# = (!! − !!)!!!!
! !!!!!!!!!!!!!!!!!!!!!!!!!!!!!!!!!!!!!!!!!!!!!!!!!(4)
!"#$ = 1! (!! − !!)!
!
!!!!!!!!!!!!!!!!!!!!!!!!!!!!!!!!!!!!!(5)
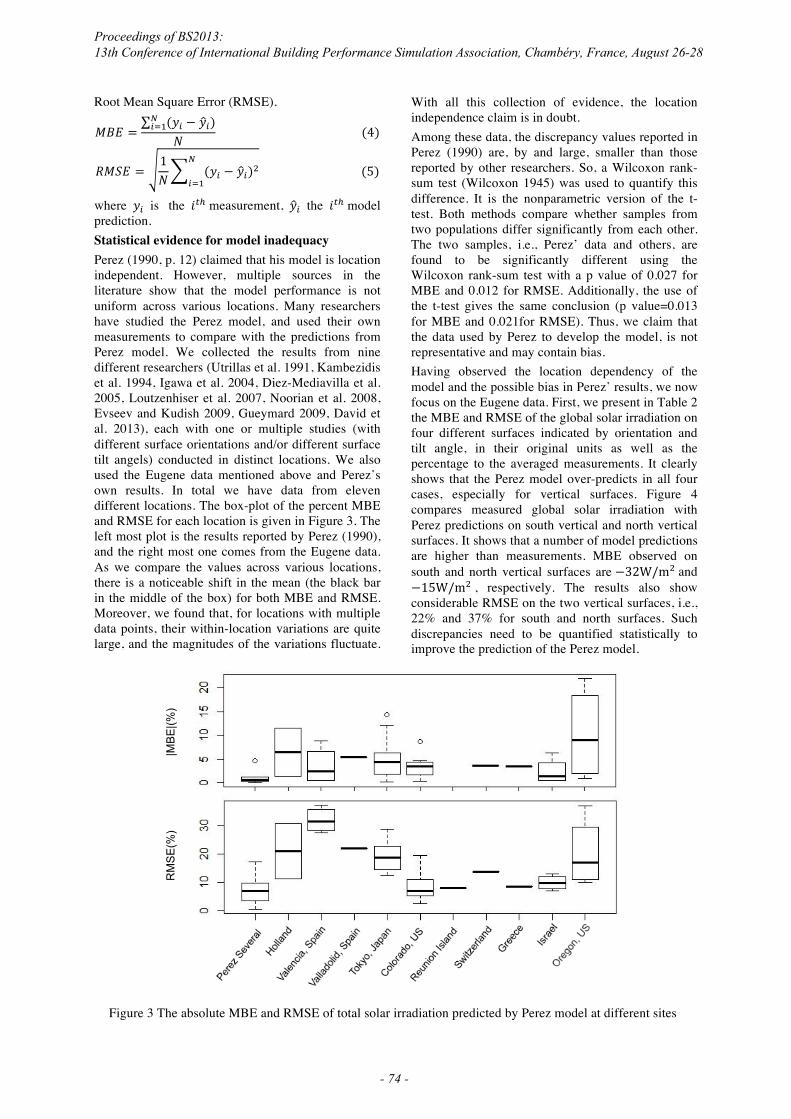
where !! is the !!! measurement, !! the !!! model prediction. Statistical evidence for model inadequacy Perez (1990, p. 12) claimed that his model is location independent. However, multiple sources in the literature show that the model performance is not uniform across various locations. Many researchers have studied the Perez model, and used their own measurements to compare with the predictions from Perez model. We collected the results from nine different researchers (Utrillas et al. 1991, Kambezidis et al. 1994, Igawa et al. 2004, Diez-Mediavilla et al. 2005, Loutzenhiser et al. 2007, Noorian et al. 2008, Evseev and Kudish 2009, Gueymard 2009, David et al. 2013), each with one or multiple studies (with different surface orientations and/or different surface tilt angels) conducted in distinct locations. We also used the Eugene data mentioned above and Perez’s own results. In total we have data from eleven different locations. The box-plot of the percent MBE and RMSE for each location is given in Figure 3. The left most plot is the results reported by Perez (1990), and the right most one comes from the Eugene data. As we compare the values across various locations, there is a noticeable shift in the mean (the black bar in the middle of the box) for both MBE and RMSE. Moreover, we found that, for locations with multiple data points, their within-location variations are quite large, and the magnitudes of the variations fluctuate.
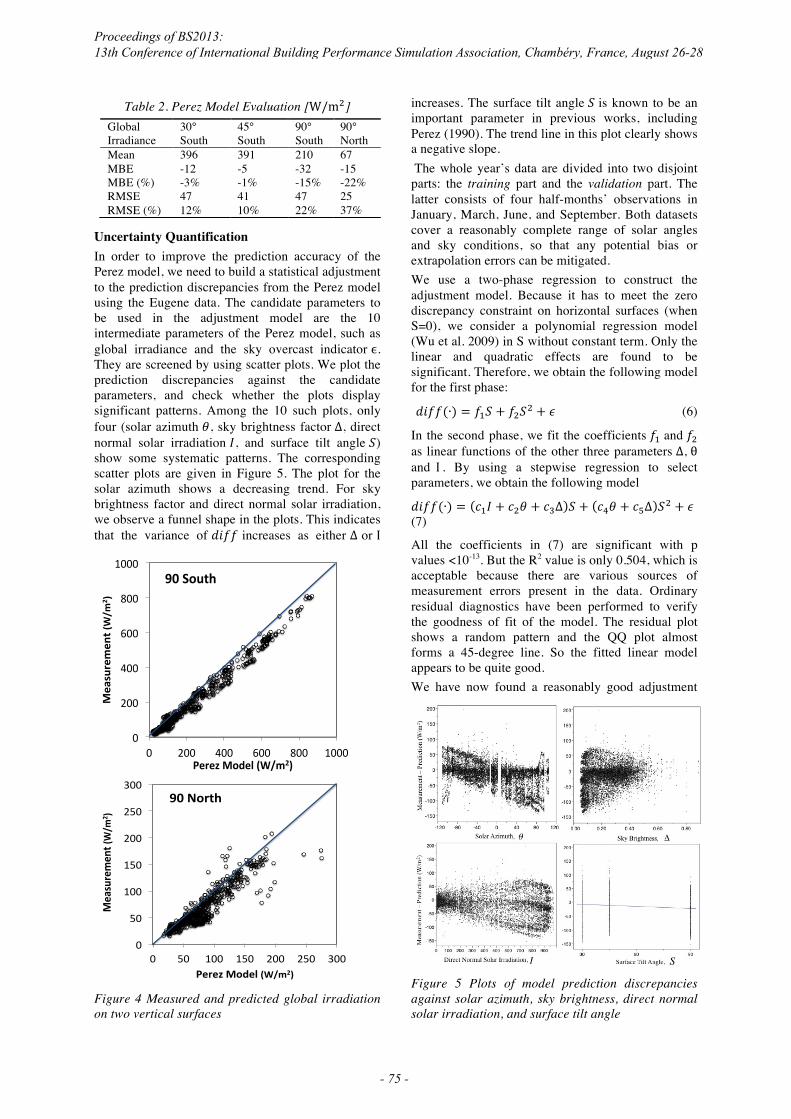
With all this collection of evidence, the location independence claim is in doubt. Among these data, the discrepancy values reported in Perez (1990) are, by and large, smaller than those reported by other researchers. So, a Wilcoxon rank-sum test (Wilcoxon 1945) was used to quantify this difference. It is the nonparametric version of the t-test. Both methods compare whether samples from two populations differ significantly from each other. The two samples, i.e., Perez’ data and others, are found to be significantly different using the Wilcoxon rank-sum test with a p value of 0.027 for MBE and 0.012 for RMSE. Additionally, the use of the t-test gives the same conclusion (p value=0.013 for MBE and 0.021for RMSE). Thus, we claim that the data used by Perez to develop the model, is not representative and may contain bias. Having observed the location dependency of the model and the possible bias in Perez’ results, we now focus on the Eugene data. First, we present in Table 2 the MBE and RMSE of the global solar irradiation on four different surfaces indicated by orientation and tilt angle, in their original units as well as the percentage to the averaged measurements. It clearly shows that the Perez model over-predicts in all four cases, especially for vertical surfaces. Figure 4 compares measured global solar irradiation with Perez predictions on south vertical and north vertical surfaces. It shows that a number of model predictions are higher than measurements. MBE observed on south and north vertical surfaces are −32W/m!!and −15W/m! , respectively. The results also show considerable RMSE on the two vertical surfaces, i.e., 22% and 37% for south and north surfaces. Such discrepancies need to be quantified statistically to improve the prediction of the Perez model.
Figure 3 The absolute MBE and RMSE of total solar irradiation predicted by Perez model at different sites
|MB
E|(%
) R
MS
E(%
)
Proceedings of BS2013: 13th Conference of International Building Performance Simulation Association, Chambéry, France, August 26-28
- 74 -
Uncertainty Quantification In order to improve the prediction accuracy of the Perez model, we need to build a statistical adjustment to the prediction discrepancies from the Perez model using the Eugene data. The candidate parameters to be used in the adjustment model are the 10 intermediate parameters of the Perez model, such as global irradiance and the sky overcast indicator ϵ. They are screened by using scatter plots. We plot the prediction discrepancies against the candidate parameters, and check whether the plots display significant patterns. Among the 10 such plots, only four (solar azimuth !, sky brightness factor ∆, direct normal solar irradiation !, and surface tilt angle !) show some systematic patterns. The corresponding scatter plots are given in Figure 5. The plot for the solar azimuth shows a decreasing trend. For sky brightness factor and direct normal solar irradiation, we observe a funnel shape in the plots. This indicates that the variance of !"## increases as either Δ or I
increases. The surface tilt angle ! is known to be an important parameter in previous works, including Perez (1990). The trend line in this plot clearly shows a negative slope. The whole year’s data are divided into two disjoint parts: the training part and the validation part. The latter consists of four half-months’ observations in January, March, June, and September. Both datasets cover a reasonably complete range of solar angles and sky conditions, so that any potential bias or extrapolation errors can be mitigated. We use a two-phase regression to construct the adjustment model. Because it has to meet the zero discrepancy constraint on horizontal surfaces (when S=0), we consider a polynomial regression model (Wu et al. 2009) in S without constant term. Only the linear and quadratic effects are found to be significant. Therefore, we obtain the following model for the first phase:
!"##(∙) = !!! + !!!! + ! (6)
In the second phase, we fit the coefficients !! and !! as linear functions of the other three parameters Δ, θ and I . By using a stepwise regression to select parameters, we obtain the following model
!"##(∙) = !!! + !!! + !!Δ ! + !!! + !!Δ !! + ! (7)
All the coefficients in (7) are significant with p values <10-13. But the R2 value is only 0.504, which is acceptable because there are various sources of measurement errors present in the data. Ordinary residual diagnostics have been performed to verify the goodness of fit of the model. The residual plot shows a random pattern and the QQ plot almost forms a 45-degree line. So the fitted linear model appears to be quite good. We have now found a reasonably good adjustment
Figure 4 Measured and predicted global irradiation on two vertical surfaces
Table 2. Perez Model Evaluation [W/m!] Global Irradiance
30° South
45° South
90° South
90° North
Mean 396 391 210 67 MBE -12 -5 -32 -15 MBE (%) -3% -1% -15% -22% RMSE 47 41 47 25 RMSE (%) 12% 10% 22% 37%
Figure 5 Plots of model prediction discrepancies against solar azimuth, sky brightness, direct normal solar irradiation, and surface tilt angle
0"
200"
400"
600"
800"
1000"
0" 200" 400" 600" 800" 1000"
Measuremen
t*(W/m
2 )*
Perez*Model*(W/m2)*
90*South*
0"
50"
100"
150"
200"
250"
300"
0" 50" 100" 150" 200" 250" 300"
Measuremen
t*(W/m
2 )*
Perez*Model*(W/m2)*
90*North*
Proceedings of BS2013: 13th Conference of International Building Performance Simulation Association, Chambéry, France, August 26-28
- 75 -
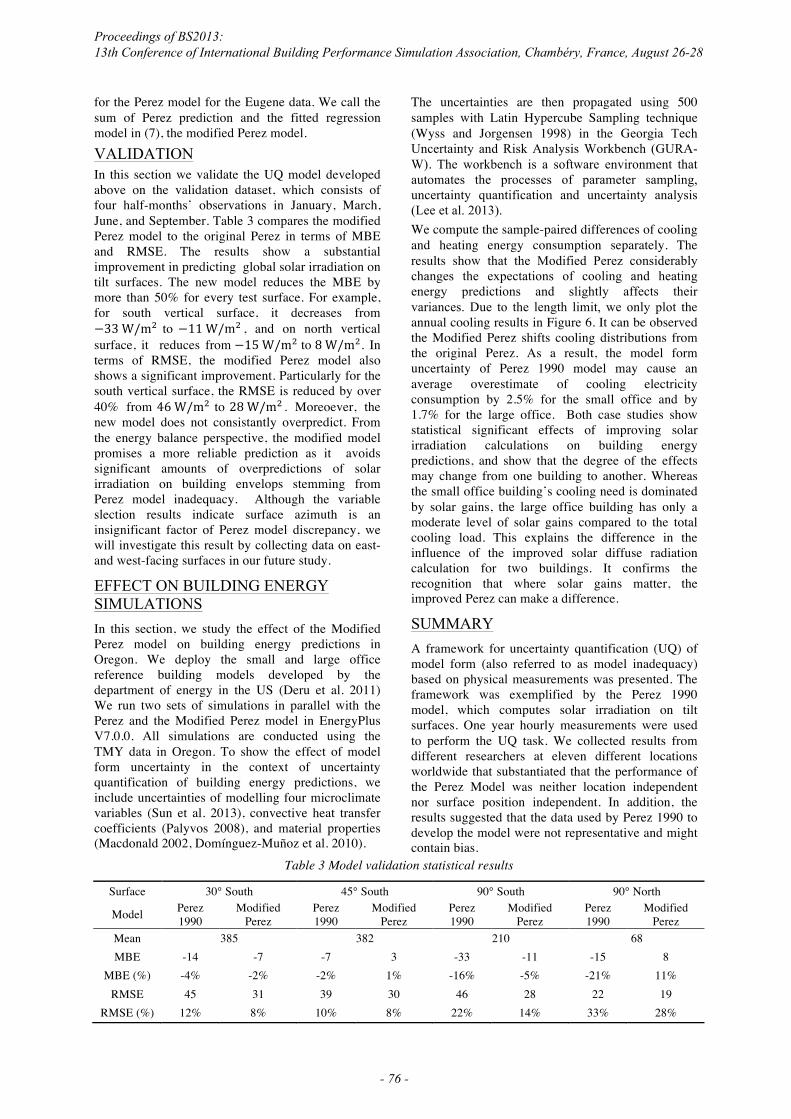
for the Perez model for the Eugene data. We call the sum of Perez prediction and the fitted regression model in (7), the modified Perez model. VALIDATION In this section we validate the UQ model developed above on the validation dataset, which consists of four half-months’ observations in January, March, June, and September. Table 3 compares the modified Perez model to the original Perez in terms of MBE and RMSE. The results show a substantial improvement in predicting global solar irradiation on tilt surfaces. The new model reduces the MBE by more than 50% for every test surface. For example, for south vertical surface, it decreases from −33!W/m! to −11!W/m! , and on north vertical surface, it reduces from −15!W/m! to 8!W/m!. In terms of RMSE, the modified Perez model also shows a significant improvement. Particularly for the south vertical surface, the RMSE is reduced by over 40% from 46!W/m! to 28!W/m! . Moreoever, the new model does not consistantly overpredict. From the energy balance perspective, the modified model promises a more reliable prediction as it avoids significant amounts of overpredictions of solar irradiation on building envelops stemming from Perez model inadequacy. Although the variable slection results indicate surface azimuth is an insignificant factor of Perez model discrepancy, we will investigate this result by collecting data on east- and west-facing surfaces in our future study.
EFFECT ON BUILDING ENERGY SIMULATIONS In this section, we study the effect of the Modified Perez model on building energy predictions in Oregon. We deploy the small and large office reference building models developed by the department of energy in the US (Deru et al. 2011) We run two sets of simulations in parallel with the Perez and the Modified Perez model in EnergyPlus V7.0.0. All simulations are conducted using the TMY data in Oregon. To show the effect of model form uncertainty in the context of uncertainty quantification of building energy predictions, we include uncertainties of modelling four microclimate variables (Sun et al. 2013), convective heat transfer coefficients (Palyvos 2008), and material properties (Macdonald 2002, Domínguez-Muñoz et al. 2010).
The uncertainties are then propagated using 500 samples with Latin Hypercube Sampling technique (Wyss and Jorgensen 1998) in the Georgia Tech Uncertainty and Risk Analysis Workbench (GURA-W). The workbench is a software environment that automates the processes of parameter sampling, uncertainty quantification and uncertainty analysis (Lee et al. 2013). We compute the sample-paired differences of cooling and heating energy consumption separately. The results show that the Modified Perez considerably changes the expectations of cooling and heating energy predictions and slightly affects their variances. Due to the length limit, we only plot the annual cooling results in Figure 6. It can be observed the Modified Perez shifts cooling distributions from the original Perez. As a result, the model form uncertainty of Perez 1990 model may cause an average overestimate of cooling electricity consumption by 2.5% for the small office and by 1.7% for the large office. Both case studies show statistical significant effects of improving solar irradiation calculations on building energy predictions, and show that the degree of the effects may change from one building to another. Whereas the small office building’s cooling need is dominated by solar gains, the large office building has only a moderate level of solar gains compared to the total cooling load. This explains the difference in the influence of the improved solar diffuse radiation calculation for two buildings. It confirms the recognition that where solar gains matter, the improved Perez can make a difference.
SUMMARY A framework for uncertainty quantification (UQ) of model form (also referred to as model inadequacy) based on physical measurements was presented. The framework was exemplified by the Perez 1990 model, which computes solar irradiation on tilt surfaces. One year hourly measurements were used to perform the UQ task. We collected results from different researchers at eleven different locations worldwide that substantiated that the performance of the Perez Model was neither location independent nor surface position independent. In addition, the results suggested that the data used by Perez 1990 to develop the model were not representative and might contain bias.
Table 3 Model validation statistical results
Surface 30° South 45° South 90° South 90° North
Model Perez 1990
Modified Perez
Perez 1990
Modified Perez
Perez 1990
Modified Perez
Perez 1990
Modified Perez
Mean 385 382 210 68 MBE -14 -7 -7 3 -33 -11 -15 8
MBE (%) -4% -2% -2% 1% -16% -5% -21% 11% RMSE 45 31 39 30 46 28 22 19
RMSE (%) 12% 8% 10% 8% 22% 14% 33% 28%
Proceedings of BS2013: 13th Conference of International Building Performance Simulation Association, Chambéry, France, August 26-28
- 76 -
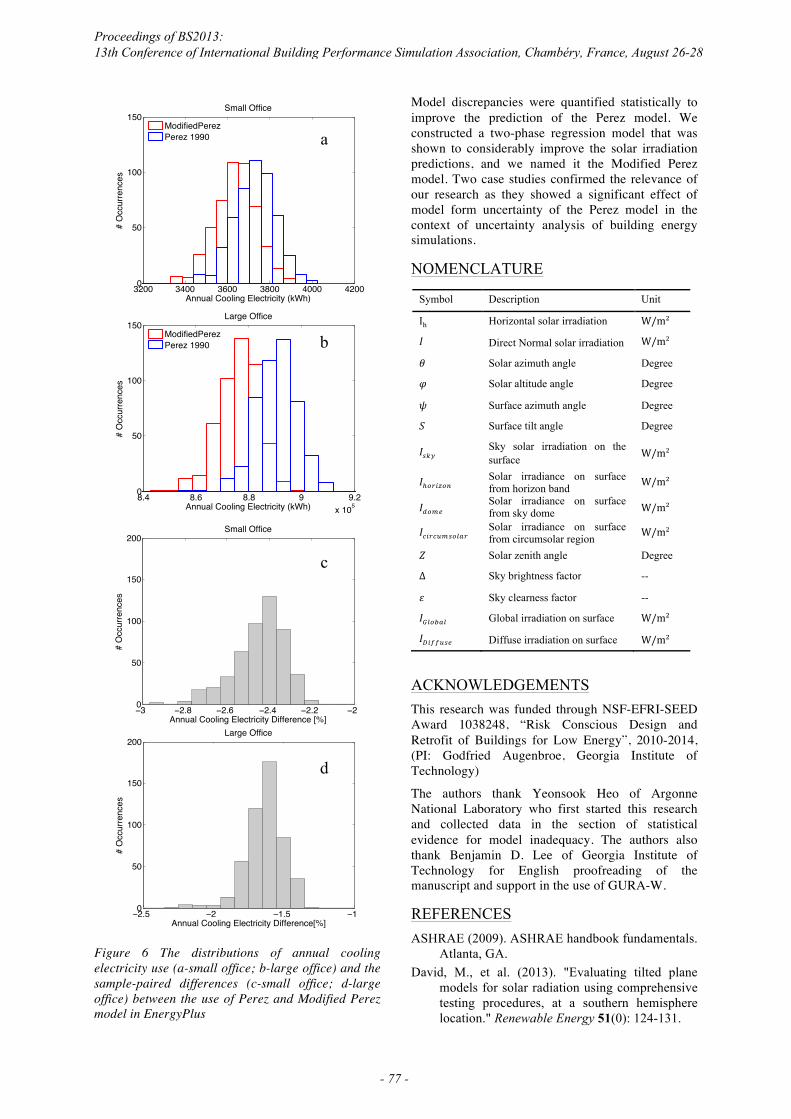
Figure 6 The distributions of annual cooling electricity use (a-small office; b-large office) and the sample-paired differences (c-small office; d-large office) between the use of Perez and Modified Perez model in EnergyPlus
Model discrepancies were quantified statistically to improve the prediction of the Perez model. We constructed a two-phase regression model that was shown to considerably improve the solar irradiation predictions, and we named it the Modified Perez model. Two case studies confirmed the relevance of our research as they showed a significant effect of model form uncertainty of the Perez model in the context of uncertainty analysis of building energy simulations.
NOMENCLATURE
ACKNOWLEDGEMENTS This research was funded through NSF-EFRI-SEED Award 1038248, “Risk Conscious Design and Retrofit of Buildings for Low Energy”, 2010-2014, (PI: Godfried Augenbroe, Georgia Institute of Technology)
The authors thank Yeonsook Heo of Argonne National Laboratory who first started this research and collected data in the section of statistical evidence for model inadequacy. The authors also thank Benjamin D. Lee of Georgia Institute of Technology for English proofreading of the manuscript and support in the use of GURA-W.
REFERENCES ASHRAE (2009). ASHRAE handbook fundamentals.
Atlanta, GA. David, M., et al. (2013). "Evaluating tilted plane
models for solar radiation using comprehensive testing procedures, at a southern hemisphere location." Renewable Energy 51(0): 124-131.
a
b
c
d
3200 3400 3600 3800 4000 42000
50
100
150
Annual Cooling Electricity (kWh)
# O
ccur
renc
esSmall Office
ModifiedPerezPerez 1990
−3 −2.8 −2.6 −2.4 −2.2 −20
50
100
150
200
Annual Cooling Electricity Difference [%]
# O
ccur
renc
es
Small Office
8.4 8.6 8.8 9 9.2x 10⁵
0
50
100
150
Annual Cooling Electricity (kWh)
# O
ccur
renc
es
Large Office
ModifiedPerezPerez 1990
−2.5 −2 −1.5 −10
50
100
150
200
Annual Cooling Electricity Difference[%]
# O
ccur
renc
es
Large Office
Symbol Description Unit
I! Horizontal solar irradiation W/m!
! Direct Normal solar irradiation W/m!
! Solar azimuth angle Degree
! Solar altitude angle Degree
! Surface azimuth angle Degree
! Surface tilt angle Degree
!!"# Sky solar irradiation on the surface W/m!
!!!"#$!% Solar irradiance on surface from horizon band W/m!
!!"#$ Solar irradiance on surface from sky dome W/m!
!!"#!$%&'()# Solar irradiance on surface from circumsolar region W/m!
! Solar zenith angle Degree
∆ Sky brightness factor --
! Sky clearness factor --
!!"#$%" Global irradiation on surface W/m!
!!"##$%& Diffuse irradiation on surface W/m!
Proceedings of BS2013: 13th Conference of International Building Performance Simulation Association, Chambéry, France, August 26-28
- 77 -
De Wit, S. and G. Augenbroe (2002). "Analysis of uncertainty in building design evaluations and its implications." Energy and Buildings 34(9): 951-958.
Deru, M., et al. (2011). U.S. Department of Energy Commercial Reference Building Models of the National Building Stock. National Renewable Energy Laboratory
Diez-Mediavilla, M., et al. (2005). "Measurement and comparison of diffuse solar irradiance models on inclined surfaces in Valladolid (Spain)." Energy Conversion and Management 46(13–14): 2075-2092.
Domínguez-Muñoz, F., et al. (2010). "Uncertainty in the thermal conductivity of insulation materials." Energy and Buildings 42(11): 2159-2168.
EnergyPlus. (2012). "Energyplus Engineering Reference." Retrieved 11/26, 2012.
Evseev, E. G. and A. I. Kudish (2009). "The assessment of different models to predict the global solar radiation on a surface tilted to the south." Solar Energy 83(3): 377-388.
Gueymard, C. A. (2009). "Direct and indirect uncertainties in the prediction of tilted irradiance for solar engineering applications." Solar Energy 83(3): 432-444.
Helton, J. C. and F. J. Davis (2003). "Latin hypercube sampling and the propagation of uncertainty in analyses of complex systems." Reliability Engineering and System Safety 81: 23-69.
Heo, Y., et al. (2012). "Quantitative risk management for energy retrofit projects." Journal of Building Performance Simulation: 1-12.
Igawa, N., et al. (2004). "Models of sky radiance distribution and sky luminance distribution." Solar Energy 77(2): 137-157.
Kambezidis, H. D., et al. (1994). "Measurements and models for total solar irradiance on inclined surface in Athens, Greece." Solar Energy 53(2): 177-185.
Lee, B. D., et al. (2013). Toward Better Prediction of Building Performance: A Workbench to Analyze Uncertainty in Building Simulation. 13th IBPSA Conference, Chambery, French (To be Published).
Loutzenhiser, P. G., et al. (2007). "Empirical validation of models to compute solar irradiance on inclined surfaces for building energy simulation." Solar Energy 81(2): 254-267.
Loutzenhiser, P. G., et al. (2009). "An empirical validation of window solar gain models and the associated interactions." International Journal of Thermal Sciences 48(1): 85-95.
Macdonald, I. A. (2002). Quantifying the effects of uncertainty in building simulation. Ph.D., University of Strathclyde.
Moon, H. J. and G. Augenbroe (2007). Application of probabilistic simulation and Bayesian
decision theory in the selection of mold remediation actions. Proceedings of the 10th IBPSA Conference, Beijing China.
Noorian, A. M., et al. (2008). "Evaluation of 12 models to estimate hourly diffuse irradiation on inclined surfaces." Renewable Energy 33(6): 1406-1412.
Oberkampf, W. L. and C. J. Roy (2010). Verification and validation in scientific computing. New York, Cambridge University Press.
Palyvos, J. A. (2008). "A survey of wind convection coefficient correlations for building envelope energy systems' modeling." Applied Thermal Engineering 28(8-9): 801-808.
Park, I., et al. (2010). "A Bayesian approach for quantification of model uncertainty." Reliability Engineering & System Safety 95(7): 777-785.
Perez, R., et al. (1990). "Modeling daylight availability and irradiance components from direct and global irradiance." Solar energy 44(5): 271-289.
Reda, I. (2011). "Method to Calculate Uncertainty Estimate of Measuring Shortwave Solar Irradiance using Thermopile and Semiconductor Solar Radiometers." 20 pp.; NREL Report No. TP-3B10-52194.
Roth, K., et al. (2005). "Energy impact of commercial building controls and performance diagnostics: market characterization, energy impact of building faults and energy savings potential." Prepared by TAIX LLC for the US Department of Energy. November. 412pp (Table 2–1).
Roy, C. J. and W. L. Oberkampf (2011). "A comprehensive framework for verification, validation, and uncertainty quantification in scientific computing." Computer Methods in Applied Mechanics and Engineering 200(25-28): 2131-2144.
SRML "http://solardat.uoregon.edu/SolarData.html." Sun, Y., et al. (2013). "Uncertainty quantification of
microclimate variables in building energy models." Journal of Building Performance Simulation: 1-16.
Utrillas, M. P., et al. (1991). "Evaluation of models for estimating solar irradiation on vertical surfaces at Valencia, Spain." Solar Energy 47(3): 223-229.
Wilcoxon, F. (1945). "Individual comparisons by ranking methods." Biometrics Bulletin 1(6): 80-83.
Wu, C. F. J., et al. (2009). Experiments planning, analysis, and optimization, second edition. Hoboken, N.J., Wiley,.
Wyss, G. D. and K. H. Jorgensen (1998). A User’s Guide to LHS: Sandia’s Latin Hypercube Sampling Software. Albuquerque, NM, Sandia National Laboratories.
Proceedings of BS2013: 13th Conference of International Building Performance Simulation Association, Chambéry, France, August 26-28
- 78 -