Embed Size (px)
Citation preview
Dave Siever page 1 copyright 2016
Diffuse Axonal Injuries, Interruptions and Treatment Using
Audio-Visual Entrainment
- Dave Siever, C.E.T.
Abstract
The concept of entrainment is a biological response in an organism to a stream of stimuli in
which the organism in some way shows a resonant response in frequency to the stimuli. The
concept Audio-Visual Entrainment (AVE) involves the presentation of a continuous stream of
visual flashes of light and pulses of auditory tones. This is purported to induce a brainwave
frequency response, matching that of the stimuli, also known as the frequency following
response and more recently, brainwave entrainment. The frequency model of AVE is what most
people think of when they consider AVE, however many other events occur simultaneously. The
frequency following aspect of AVE is only a small portion of AVE and sometimes it doesn’t
occur at all. Other effects of AVE include dissociation and hypnotic induction; autonomic
nervous system calming; increased cerebral blood flow; increased neurotransmitters and
unexpected brain-enhancing effects.
Concussions are typically categorized as the diffuse axonal traumatic brain injury (DA-TBI),
which is characterized by an interruption in the axonal pathways, either descending from the
neurons in the cortex to the thalamus or from the thalamus to the cortex. Given that DA-TBIs
rarely show on an MRI, it might be more precise to consider them as an interruption in signal
transmission rather than an injury. DA-TBIs impair both cognitive function and emotional
control, resulting in a spectrum of psychological disorders. EEG recordings of a person with a
DA-TBI show loss of alpha activity (the main thalamocortical rhythm), agitated beta activity and
aberrant delta and beta phase between the various cortical regions. Neurological deficits from
DA-TBIs, caused by either injury or fever, can remain for decades.
Through its various mechanisms of action, AVE can quickly re-excite these neurons and in turn,
reestablish the thalamocortical loops, thus restoring cognition, emotion control and affect.
Introduction
Audio-Visual Entrainment (AVE) is a technique using flashes of lights into the eyes and pulses
of tones into the ears at specific frequencies. The frequency of the lights and tones used are in the
brainwave frequency range from .5 to 40 Hz. AVE is one of the most intriguing stimulation
technologies as AVE devices have been shown to influence, in varying degrees, brain activity by
a myriad of influences, not simply frequency driving. Given these other effects, we could ponder
if we should simply rename the technique as audio-visual stimulation (AVS). Our senses are
constantly bombarded by AVS. Consider watching TV or sitting on a street corner watching the
traffic. These activities consist of abundant quantities of AVS, yet they don’t have much of an
impact on the brain. For instance, when AVE is randomized at ± 1 Hz (for example, 10 Hz
Dave Siever page 2 copyright 2016
would randomize from 9 to 11 Hz), entrainment is reported to provide a significant clinical
impact. At ± 2 Hz, the clinical effect is poor and at ± 3 Hz, the clinical effect is all but lost. So it
appears that the myriad of effects from AVS only occur when the stimulation is kept fairly
rhythmic and therefore entraining, hence AVE. For this reasoning, we will use the term AVE
throughout this article. Because AVE affects such a diverse range of neurological processes, it
has applications spanning from simple meditation and boosting cognition to the treatment of
complex issues such as depression, pain and diffuse axonal injuries (the most common type of
brain injury). But first, let’s understand the physiology of AVE.
Physiology of AVE
While clinicians often think of AVE as only entraining its frequency into the brain, a host of
complementary effects are occurring simultaneously, as shown below:
1. Brainwave entrainment;
2. Dissociation/hypnotic induction;
3. Autonomic nervous system calming (including heart rate variability);
4. Increased cerebral blood flow;
5. Increased neurotransmitter activity;
6. Unexpected effects.
(1) Brainwave Entrainment
One mechanism of action attributed to AVE, and to some degree all stimulation technologies, is
related to frequency driving of brainwave activity, known as the frequency following response
and more recently as entrainment. Entrainment occurs when a bodily rhythm reflects the rhythm
of the stimuli to which it is exposed. For example, brainwaves observed via EEG reflect the
dominant brainwave frequency duplicating the frequency of auditory, visual or tactile stimuli.
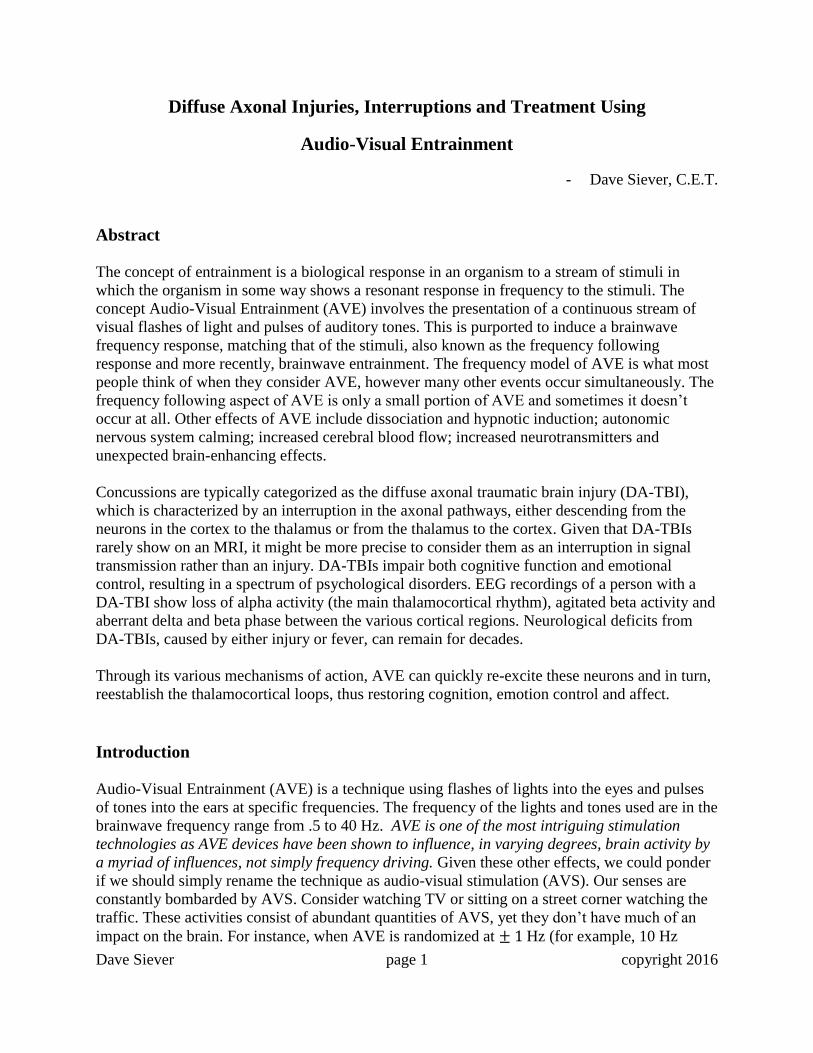
Photic driving of brainwaves was first discovered by Adrian and Matthews back in 1934, while
auditory entrainment was first demonstrated by Chatrian and colleagues in 1959. Photic
entrainment occurs best near one’s own natural alpha frequency (Toman, 1941; Kinney et al.,
1973). AVE utilizing square-wave photic stimulation should be avoided in those with
photosensitive epilepsy, where flashing lights of certain frequencies may trigger a seizure
(Ruuskanen-Uoti & Salmi, 1994; Erba, 2001; Trenité, et al., 2001) while sine-wave stimulation
does not produce harmonics and may well be safer for epileptics (Donker, et al., 1978; Regan,
1966; Townsend, 1973; Van der Tweel & Lunel, 1965). Figure 1 shows the EEG effects of
square-wave (xenon flash) photic entrainment at a variety of frequencies.
Dave Siever page 3 copyright 2016
Figure 1. EEG Showing Photic Entrainment (Kinney, et al, 1973).
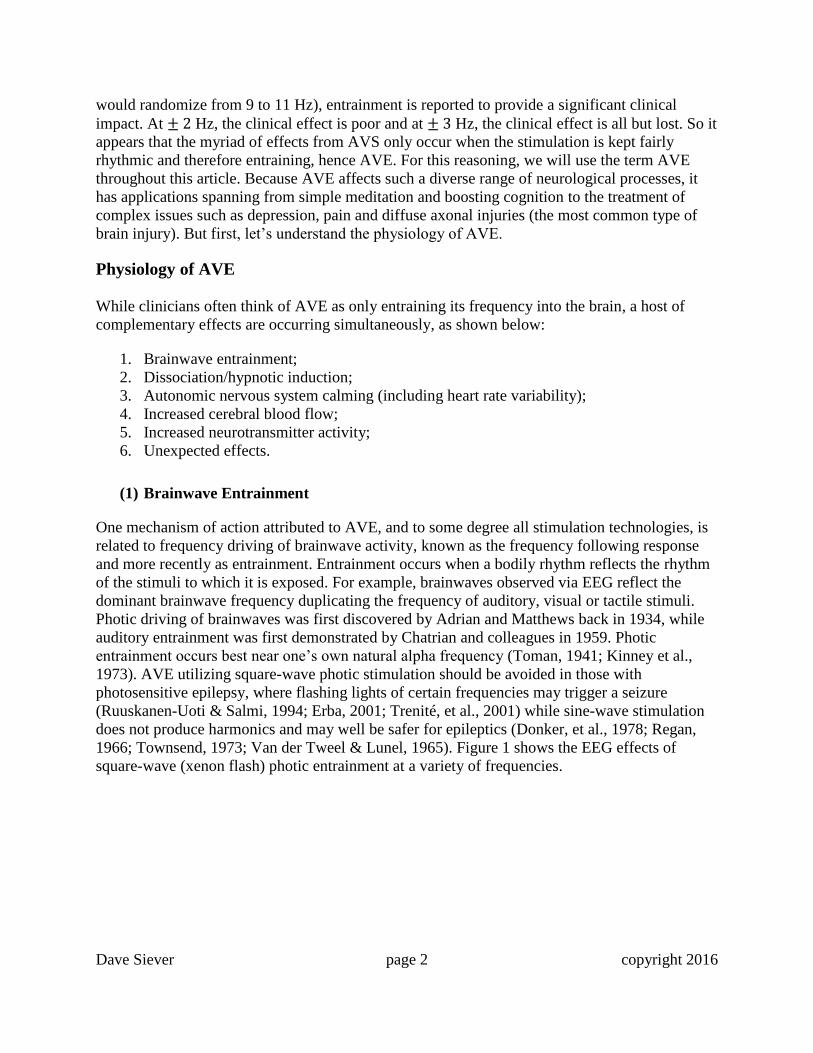
AVE effects are primarily associated with frontal, parietal, occipital brain regions and near the
vertex (Frederick, et al., 1999). For example, Figure 2 shows a qEEG (quantitative electro-
encephalograph), or "brain map" from the SKIL (Sterman-Kaiser Imaging Labs) database, in 1
Hz bins showing the frequency distribution of AVE at 8 Hz. The area within the circle at 8 Hz
shows maximal effects of AVE in central, frontal, and parietal regions (at 10µv in this case) as
referenced with the oval area on the legend. It is through associated influences on frontal brain
regions that AVE has been shown effective in reducing depression, anxiety, and attentional
disorders. A harmonic is also present at 16 Hz (the circled image), which is typical of semi-sine
wave (part sine/part square wave) stimulation.
Figure 2. Brain Map in 1 Hz Bins - During 8 Hz AVE (SKIL-Eyes Closed).
In as much as entrainment can enhance brainwaves at a particular frequency, entrainment can
also inhibit the half frequency of stimulation, which is useful for treating those with excess
brainwave activity at slower frequencies such as with depression, ADHD, struggling college
students and seniors with age-related cognitive decline (Siever 2003c). For instance, those with
ADHD show excess frontal theta (5 to 7 Hz) activity and too little SMR (12 to 15 Hz). By
stimulating in the frequency range of 12 to 15 Hz, the sensorimotor rhythm (SMR) activity over
Dave Siever page 4 copyright 2016
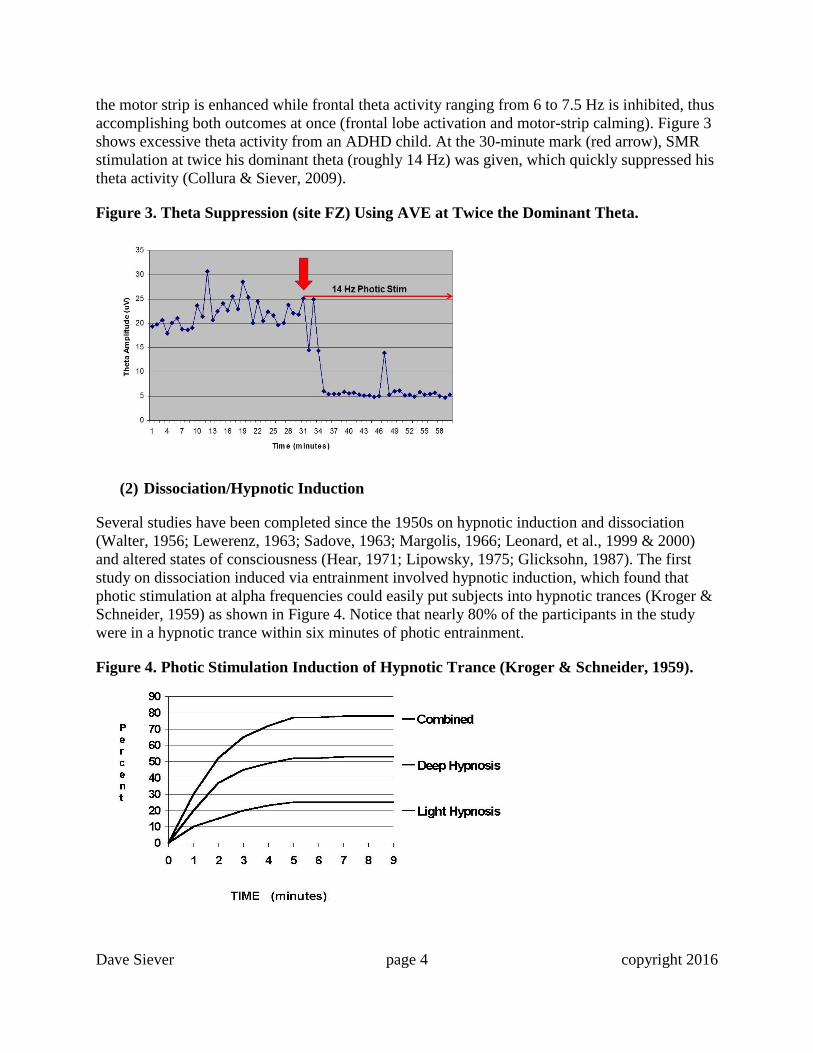
the motor strip is enhanced while frontal theta activity ranging from 6 to 7.5 Hz is inhibited, thus
accomplishing both outcomes at once (frontal lobe activation and motor-strip calming). Figure 3
shows excessive theta activity from an ADHD child. At the 30-minute mark (red arrow), SMR
stimulation at twice his dominant theta (roughly 14 Hz) was given, which quickly suppressed his
theta activity (Collura & Siever, 2009).
Figure 3. Theta Suppression (site FZ) Using AVE at Twice the Dominant Theta.
(2) Dissociation/Hypnotic Induction
Several studies have been completed since the 1950s on hypnotic induction and dissociation
(Walter, 1956; Lewerenz, 1963; Sadove, 1963; Margolis, 1966; Leonard, et al., 1999 & 2000)
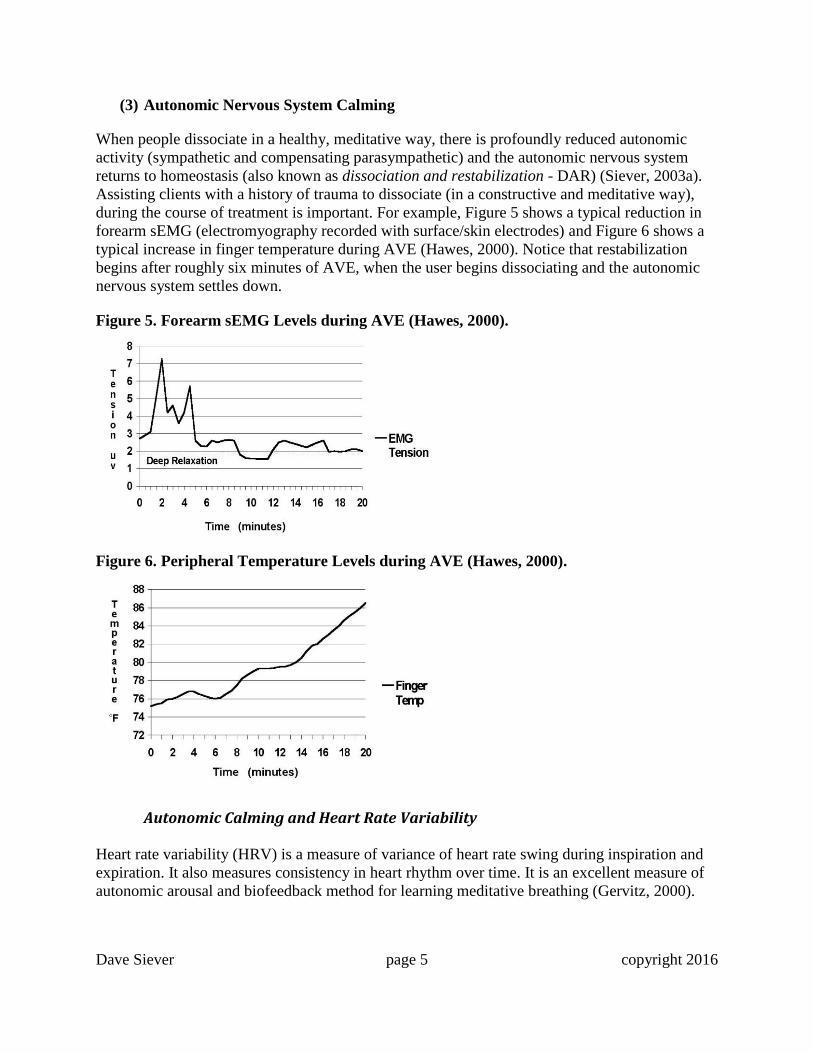
and altered states of consciousness (Hear, 1971; Lipowsky, 1975; Glicksohn, 1987). The first
study on dissociation induced via entrainment involved hypnotic induction, which found that
photic stimulation at alpha frequencies could easily put subjects into hypnotic trances (Kroger &
Schneider, 1959) as shown in Figure 4. Notice that nearly 80% of the participants in the study
were in a hypnotic trance within six minutes of photic entrainment.
Figure 4. Photic Stimulation Induction of Hypnotic Trance (Kroger & Schneider, 1959).
Dave Siever page 5 copyright 2016
(3) Autonomic Nervous System Calming
When people dissociate in a healthy, meditative way, there is profoundly reduced autonomic
activity (sympathetic and compensating parasympathetic) and the autonomic nervous system
returns to homeostasis (also known as dissociation and restabilization - DAR) (Siever, 2003a).
Assisting clients with a history of trauma to dissociate (in a constructive and meditative way),
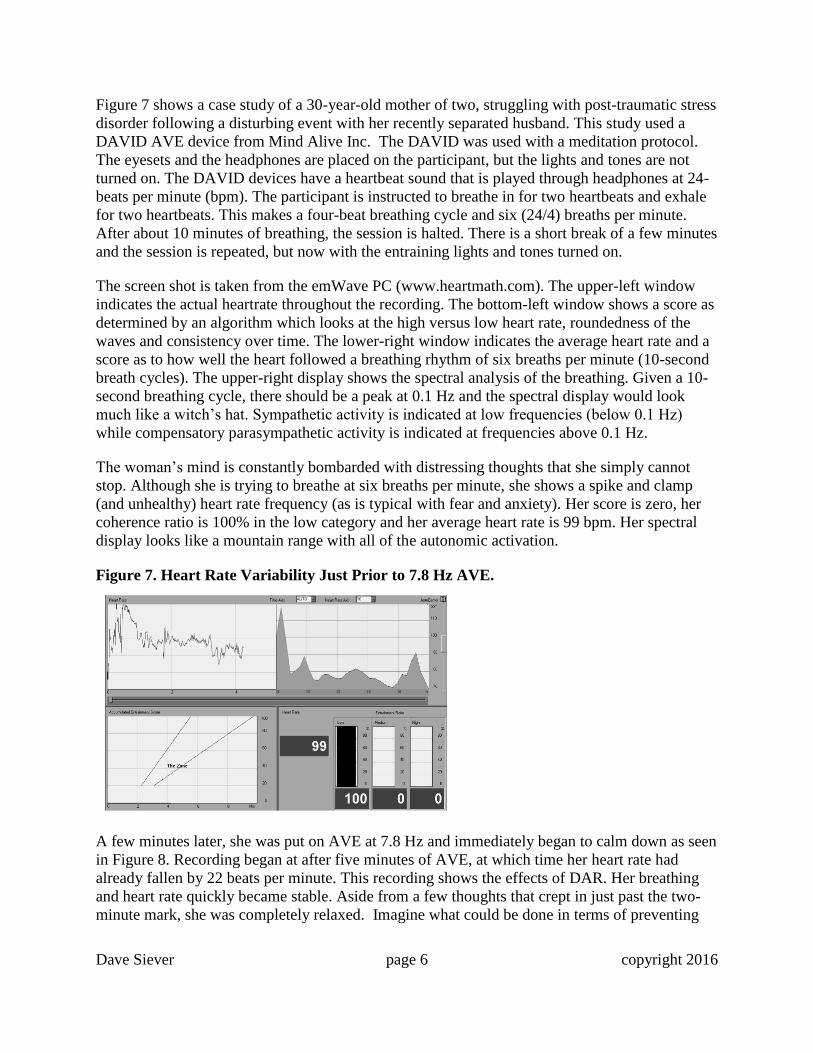
during the course of treatment is important. For example, Figure 5 shows a typical reduction in
forearm sEMG (electromyography recorded with surface/skin electrodes) and Figure 6 shows a
typical increase in finger temperature during AVE (Hawes, 2000). Notice that restabilization
begins after roughly six minutes of AVE, when the user begins dissociating and the autonomic
nervous system settles down.
Figure 5. Forearm sEMG Levels during AVE (Hawes, 2000).
Figure 6. Peripheral Temperature Levels during AVE (Hawes, 2000).
Autonomic Calming and Heart Rate Variability
Heart rate variability (HRV) is a measure of variance of heart rate swing during inspiration and
expiration. It also measures consistency in heart rhythm over time. It is an excellent measure of
autonomic arousal and biofeedback method for learning meditative breathing (Gervitz, 2000).
Dave Siever page 6 copyright 2016
Figure 7 shows a case study of a 30-year-old mother of two, struggling with post-traumatic stress
disorder following a disturbing event with her recently separated husband. This study used a
DAVID AVE device from Mind Alive Inc. The DAVID was used with a meditation protocol.
The eyesets and the headphones are placed on the participant, but the lights and tones are not
turned on. The DAVID devices have a heartbeat sound that is played through headphones at 24-
beats per minute (bpm). The participant is instructed to breathe in for two heartbeats and exhale
for two heartbeats. This makes a four-beat breathing cycle and six (24/4) breaths per minute.
After about 10 minutes of breathing, the session is halted. There is a short break of a few minutes
and the session is repeated, but now with the entraining lights and tones turned on.
The screen shot is taken from the emWave PC (www.heartmath.com). The upper-left window
indicates the actual heartrate throughout the recording. The bottom-left window shows a score as
determined by an algorithm which looks at the high versus low heart rate, roundedness of the
waves and consistency over time. The lower-right window indicates the average heart rate and a
score as to how well the heart followed a breathing rhythm of six breaths per minute (10-second
breath cycles). The upper-right display shows the spectral analysis of the breathing. Given a 10-
second breathing cycle, there should be a peak at 0.1 Hz and the spectral display would look
much like a witch’s hat. Sympathetic activity is indicated at low frequencies (below 0.1 Hz)
while compensatory parasympathetic activity is indicated at frequencies above 0.1 Hz.
The woman’s mind is constantly bombarded with distressing thoughts that she simply cannot
stop. Although she is trying to breathe at six breaths per minute, she shows a spike and clamp
(and unhealthy) heart rate frequency (as is typical with fear and anxiety). Her score is zero, her
coherence ratio is 100% in the low category and her average heart rate is 99 bpm. Her spectral
display looks like a mountain range with all of the autonomic activation.
Figure 7. Heart Rate Variability Just Prior to 7.8 Hz AVE.
A few minutes later, she was put on AVE at 7.8 Hz and immediately began to calm down as seen
in Figure 8. Recording began at after five minutes of AVE, at which time her heart rate had
already fallen by 22 beats per minute. This recording shows the effects of DAR. Her breathing
and heart rate quickly became stable. Aside from a few thoughts that crept in just past the two-
minute mark, she was completely relaxed. Imagine what could be done in terms of preventing

Dave Siever page 7 copyright 2016
the development of post-traumatic stress disorder if AVE devices were dispensed to people
experiencing natural disasters or acts of terrorism.
Figure 8. Heart Rate Variability during 7.8 Hz AVE.
(4) Increased Cerebral Blood Flow
Cerebral blood flow (CBF) is essential for good mental health and function. Measures of CBF
show that hypoperfusion of CBF is associated with many forms of mental disorders including
anxiety, depression, attentional and behavior disorders (Teicher, et. al., 2000), and impaired
cognitive function (Amen, 1998; Meyer, et al, 1994; Meier, et al, 2015). Some of the purported
beneficial effects of AVE have been attributed to increases in frontal region CBF (Fox &
Raichle, 1985; Fox, et al, 1988; Sappy-Marinier, et al., 1992). For example, Figure 9 shows an
increase of 28% in CBF within the striate cortex, a primary visual processing area within the
occiput. As an interesting note, maximal increases in CBF have been shown to occur when
stimulation techniques occur around 7.8 Hz, the “Schumann Resonance” of the earth (Balser &
Wagner, 1960).
Figure 9. Cerebral Blood Flow at Various Photic Entrainment Repetition Rates (Fox &
Raichle, 1985).
Dave Siever page 8 copyright 2016
(5) Increased Neurotransmitter Activity
Neurotransmitters affect all of brain functioning. Some neurotransmitters such as glutamate and
norepinephrine excite brain arousal while other neurotransmitters such as serotonin and GABA
calm the brain down. With long-term stress and depression, the “feel-good” neurotransmitters
such as dopamine, serotonin and norepinephrine shut down, leaving us feeling lethargic and sad.
For instance, Seasonal Affective Disorder (SAD) involves reduced levels of melatonin, a
neurotransmitter that regulates circadian rhythms and hibernation in animals. Melatonin slows
brainwaves and reduces CBF as it prepares us for sleep (Murphy, 1993). Endorphins are essential
for blocking pain and are the basis of analgesic medication. Low levels of serotonin are part of
most every psychiatric disorder. Moderate levels of norepinephrine (brain’s adrenaline) are
involved in mental vigilance. Norepinephrine is increased by caffeine, which is why we enjoy a
cup of coffee so much in the morning. A direct correlation between psychiatric disorders
including anxiety, depression, obsessive-compulsive disorder, schizophrenia, memory and
cognitive disorders has been linked to brain neurotransmitter action (Emmons, 2010; Arco &
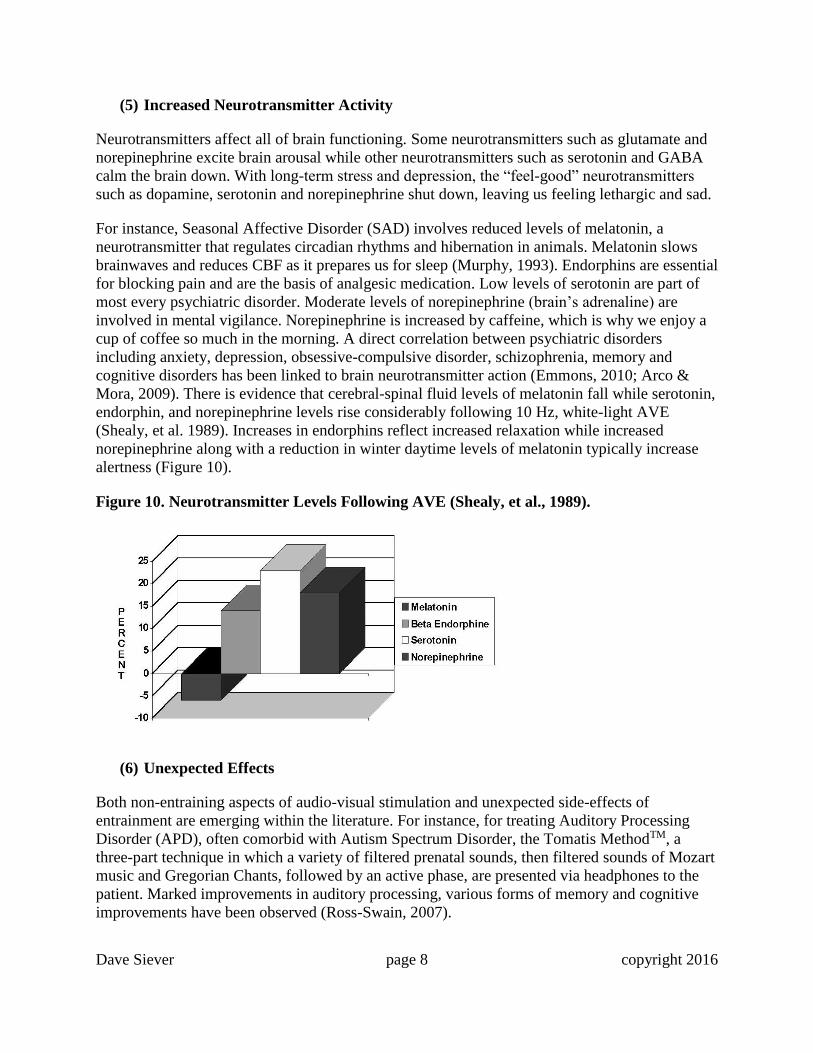
Mora, 2009). There is evidence that cerebral-spinal fluid levels of melatonin fall while serotonin,
endorphin, and norepinephrine levels rise considerably following 10 Hz, white-light AVE
(Shealy, et al. 1989). Increases in endorphins reflect increased relaxation while increased
norepinephrine along with a reduction in winter daytime levels of melatonin typically increase
alertness (Figure 10).
Figure 10. Neurotransmitter Levels Following AVE (Shealy, et al., 1989).
(6) Unexpected Effects
Both non-entraining aspects of audio-visual stimulation and unexpected side-effects of
entrainment are emerging within the literature. For instance, for treating Auditory Processing
Disorder (APD), often comorbid with Autism Spectrum Disorder, the Tomatis MethodTM, a
three-part technique in which a variety of filtered prenatal sounds, then filtered sounds of Mozart
music and Gregorian Chants, followed by an active phase, are presented via headphones to the
patient. Marked improvements in auditory processing, various forms of memory and cognitive
improvements have been observed (Ross-Swain, 2007).
Dave Siever page 9 copyright 2016
Intranasal Light Therapy (ILT) is a technique involving the shining of near infrared light into the
nasal cavity from a light-emitting diode (LED) mounted on a small clip. Ample evidence of ILT
has shown effectiveness in treating a multitude of neurological disorders including insomnia,
mild cognitive impairment, Alzheimer’s Disease, Parkinson’s Disease, schizophrenia, migraine
and stroke. The current theory of function has been based on optimizing the results for blood
irradiation, which may be holding back the brain’s potential for better neurological outcomes
(Lim, 2013). Although the main premise of entrained light is that the frequency of the light
pulses is affecting the brain, this does not preclude the fact that entrained light shines through the
skull and into the brain directly, as does light therapy.
Many studies on near infrared (NIR) light therapy for a variety of brain issues ranging from
depression to concussion have been emerging in recent years (Doidge, 2015). NIR light has been
shown to improve mitochondrial function in hypoxic cells, increase adenosine triphosphate
(ATP), important for cellular metabolism because it releases local nitric oxide, which in turn
increases regional CBF. A recent study utilizing an array of head mounted transcranial near-
infrared LEDs on people with mild traumatic brain injury, showed significant improvements in
cognitive performance, social, interpersonal and occupational functions (Naeser et al., 2014).
One of the most intriguing effects of entrained light involves the application of 40 Hz (gamma)
photic entrainment for one hour into the eyes of mice with the mouse equivalent of Alzheimer’s
Disease. This study showed that, within a few hours, beta-amyloid plaques were reduced in the
range of 50 to 70% and microglia cell body diameter increased by 166% from consuming the
beta-amyloid deposits (Iaccarino et al, 2016).
Clinical Research
Over the past several decades, AVE has been associated with several types of beneficial
outcomes spanning a wide variety of clinical applications: for SAD (Berg & Siever, 2009), for
improving concentration and memory in college students (Budzynski & Tang, 1998; Budzynski,
et al, 1999; Budzynski et al., 2007; Wuchrer, 2009), for reducing worry in college students
(Wolitzky-Taylor & Telch, 2010), for the treatment of ADD, ADHD and behavior disorders
(Carter & Russell, 1993; Joyce & Siever, 2000; Micheletti, 1999), for regaining motor control in
post aneurysm (Russell, 1996), for treating depression and risk of falling in seniors (Berg &
Siever, 2004), for treating Alzheimer’s (Budzynski, et al., 2002), for improving brain function
and memory in seniors (Williams, et al., 2006; Palmquist, 2014), for reducing chronic pain from
occupational injury (Gagnon & Boersma, 1992), for reducing symptoms of fibromyalgia (Berg et
al., 1999), for reducing symptoms of temporo-mandibular dysfunction (Manns, et al. 1981;
Morse & Chow, 1993; Thomas & Siever, 1989), for reducing anxiety during dental procedures
(Morse & Chow, 1993; Siever, 2003b), for treating PTSD in war vets (Trudeau, 1999), and for
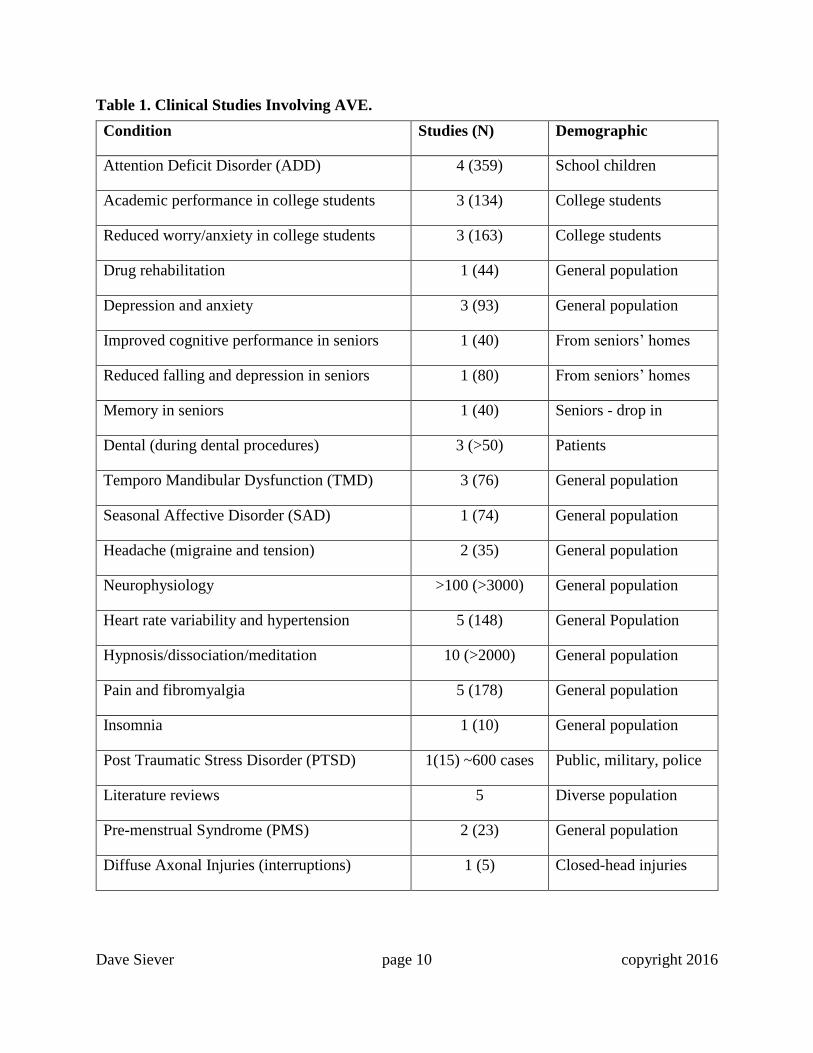
improving sleep (Tang, et al., 2016). Whereas there is not space in this brief review article to
describe all the studies cited, Table 1 lists a variety of clinical conditions, along with the number
of studies (and the size of the population), as well as the type of demographic.
Dave Siever page 10 copyright 2016
Table 1. Clinical Studies Involving AVE.
Condition Studies (N) Demographic
Attention Deficit Disorder (ADD) 4 (359) School children
Academic performance in college students 3 (134) College students
Reduced worry/anxiety in college students 3 (163) College students
Drug rehabilitation 1 (44) General population
Depression and anxiety 3 (93) General population
Improved cognitive performance in seniors 1 (40) From seniors’ homes
Reduced falling and depression in seniors 1 (80) From seniors’ homes
Memory in seniors 1 (40) Seniors - drop in
Dental (during dental procedures) 3 (>50) Patients
Temporo Mandibular Dysfunction (TMD) 3 (76) General population
Seasonal Affective Disorder (SAD) 1 (74) General population
Headache (migraine and tension) 2 (35) General population
Neurophysiology >100 (>3000) General population
Heart rate variability and hypertension 5 (148) General Population
Hypnosis/dissociation/meditation 10 (>2000) General population
Pain and fibromyalgia 5 (178) General population
Insomnia 1 (10) General population
Post Traumatic Stress Disorder (PTSD) 1(15) ~600 cases Public, military, police
Literature reviews 5 Diverse population
Pre-menstrual Syndrome (PMS) 2 (23) General population
Diffuse Axonal Injuries (interruptions) 1 (5) Closed-head injuries
Dave Siever page 11 copyright 2016
The Enigma of AVE
In this section, we turn our attention away from the traditional frequency driving effects of AVE
to mechanisms and principles that underlie the brain’s particular responses to entraining stimuli.
There are several potential mechanisms that relate to nonlinear frequency-specific responses.
In particular, network properties and nonlinear effects of AVE may produce results beyond
simple changes in arousal such as activation or relaxation. On the surface, a repetitive stimulus is
nothing more than the combination of many single stimuli. However, one nonlinear effect of
entrainment is the presence of a neuronal refractory period after each stimulus, which includes
the time that a neuron requires to repolarize completely. If a stimulus is presented within the
refractory period, the previous response to the next stimulus will be affected by that stimulus and
may extend beyond the simple vector-addition of the stimuli, so that the response is now
different.
But the function of the brain is acutely conditioned on factors such as synchrony, network
connectivity and self-organization so complex neural processes can, and do, occur. Whereas
physical processes such as blood flow, neurotransmitters, metabolic activity, and related
physiology might be expected to reorganize themselves in a predictable fashion, neuronal
network reactions to repetitive stimuli at various frequencies and via different modalities should
be expected to be much more complex.
Neuroplasticity
Neuroplasticity is the ability for the brain to modify the ways it responds to stimuli. Stimuli may
come from the environment or simply be thoughts one is thinking, which in turn can form
dendritic connections. Neurons and their synapses may be excitatory or inhibitory and linearity
of the response would be impossible to predict.
Neuroplastic effects of repetitive stimulation include those that involve changes in neuronal
responsivity and tendency to activate, even after the cessation of the stimulation. Hebb’s law
(1961) states that “cells that fire together, wire together” which further indicates that neural
networks change because of stimulated neuronal firing. But there is more to this story in that the
“neurons that fire out of sync, wire out of sync.” Often during learning, some neurons are firing
and wiring together while others are firing and wiring apart simultaneously. For instance,
cognitive training involves both learning a desired action and suppressing an undesired action.
Underlying mechanisms can include changes in receptor distribution and response, increases or
decreases in the number of synaptic connections, cellular protein synthesis and metabolic or even
anatomic changes. Once the neurons are off line, as with diffuse axonal interruptions, could
active neuroplastic changes take these neurons “permanently” off line such that a hard push is
required to reactivate them? A recent study in mice with intentionally damaged retinas and optic
nerves found substantial regeneration in the group of mice that received intense visual
stimulation (Lim et al, 2016), whereas the controls in a normal visual environment showed
insignificant regeneration.
Dave Siever page 12 copyright 2016
Repetitive stimulation, particularly when it produces metabolically significant activity such as
action potentials, can have both immediate and lasting effects on the brain. These effects would
be primarily due to the physical consequences of the increased activity of neurotransmitters,
transmembrane transport mechanisms, and the associated vascular, respiratory, and recovery
mechanisms. Vascular changes would include alterations in capillary structure and physiology
and changes in blood flow. The associated recovery mechanisms take care of the removal of
metabolic by-products, as well as the reuptake and transport of neurotransmitters. It is therefore
reasonable to expect that repetitive stimulation can have effects on, not only neurons, but also
associated structures including the glia, vascular structures, and other supportive tissues.
Clinical Examples of Enigmatic Effects of AVE
The five examples below indicate that the dissociative and CBF aspects of AVE are just as or
likely even more important than the frequency following effects. As mentioned above, AVE
affects CBF, neurotransmitters, dissociated states, and autonomic activity, all at the neuronal
level.
For many years, we have observed that ADHD children fall asleep during beta frequency AVE
and it is common for clients to fall into deep sleep with dual-frequency AVE of alpha/beta or
SMR/beta frequencies. This is counter-intuitive, as higher frequencies such as beta (14 to 35 Hz)
are typically associated with alertness, and yet AVE in the beta range, often puts the neuronally
hypo-aroused user into a deep sleep, which also makes AVE a valuable tool for assessing sleep
issues such as poor sleep-onset and sleep apnea.
Some Electro-Encephalography (EEG) and Quantitative EEG (qEEG) Terms
Before we start looking at the following case studies, we need to look at some definitions and to
note that we are only going to address EEG and qEEG techniques and we will only review qEEG
measures of greatest concern. There are a few methods for placing electrodes on the head. These
EEG recordings were made using electrodes placed according to the international 10-20 EEG
electrode placement system. This type of montage has 19 recording sites with two noise-
cancelling electrodes on the earlobes. The term 10-20 means that the electrodes are placed at
10% and 20% intervals between the nose and inion from front to back and between the ear canals
from side to side. The brainwaves being recorded are referenced against the ear inputs - this is
termed linked-ears or a referential recording (referenced against the ears as opposed to other
recording electrodes, known as a differential recording).
First, several minutes of EEG are recorded off the scalp. After these data have been saved as an
EEG file, that data is downloaded into qEEG analysis software. Artifacts relating to eye-blinks
and movements, plus muscle activity from jaw, neck and body movements are then removed
with the intention of leaving only true EEG activity. The quantity (q) of true EEG activity
remaining is processed with Fourier Frequency Analysis and other analysis such as coherence,
comodulation, phase, etc. These data may also be compared to a database which was created
using the exact same montage and with participants who were deemed psychologically normal
according to psychometric testing. The analyses in the following examples have been processed

Dave Siever page 13 copyright 2016
using the Sterman-Kaiser Imaging Labs (SKIL) qEEG software (Sterman & Kaiser, 1999;
Lorensen & Dickson, 2004; Johnstone, Gunkelman & Lunt, 2005; Kaiser, 2007; Kaiser, 2008;
Kaiser & Meckley, 2012).
The following qEEG analysis Figure 11 shows a picture of the electrode setup and Figure 12
shows the electrode cap being worn while experiencing AVE.
Figure 11. 10-20 Montage with Linked-Ears References (A1 and A2).
Figure 12. Person Wearing a 10-20 Electrode Cap While Using AVE.
Dave Siever page 14 copyright 2016
Absolute Magnitude: The average voltage amplitudes averaged over time. Shown in microvolts
(µv) for each frequency band.
Database Magnitude: The absolute magnitude in comparison to a database with the average
healthy population.
Comodulation: Spindles and wavelets generally appear with temporal synchrony across brain
regions. This measures the degree to which the spindles and wavelets are in alignment with
respect to time. For instance, alpha is an idling rhythm, so when alpha spindles throughout the
brain are in alignment, it means that the brain is taking small breaks together and processing
information together. When the spindles are out of alignment, a part of the brain may be sending
information to another part that is taking a break so the information doesn’t get there.
Conversely, a part of the brain may be requesting information and the part with the information
is taking a break and still it doesn’t get there. You see this a lot with people who have to be told
something twice before they understand it or having to always check twice when driving in order
to see traffic and road signs, or those who require a fair bit of time to recall someone’s name or
other information. Comodulation is compared against a normative database.
Delta Phase: This is a measure of the integrity of the white-matter extending from neurons to
other regions of the brain, particularly the thalamus and associated structures. This entire
thalamocortical synchronization loop normally takes 100 msec to complete. White-matter
damage slows and may even stop propagation of signals to and from the neurons and the
thalamus. When neurons lose this synchronization pulse from the thalamus, they begin to fire
randomly and completely out of sync with both damaged and intact regions of the brain. Imagine
you are at a concert and the band has encouraged the audience to clap to the beat of the song and
everyone is doing so at two claps per second (delta). However, there are a few people who can’t
seem to get the rhythm right and are clapping on the off-beat. They are still clapping at two claps
per second like everyone else, just 180° out of phase with the remaining audience. This would
show up as a delta phase issue.
Beta Phase: This is a measure of synchrony between cortical areas. It may also reflect a general
thalamocortical desynchrony of various Rich Club neuronal networks. These are densely packed
neurons segregated into 66 clusters or hubs (Hagmann, et al., 2008).
Dave Siever page 15 copyright 2016
Case Report 1 – Boosting Cerebral Blood Flow Effect
Giving a person with a slow dominant alpha brainwave the exact frequency of AVE can inhibit
the same frequency. This is believed by the author to possibly be due to the increase in CBF. An
inverse correlation between CBF and slow-wave EEG activity has been well established
(Teicher, et. al., 2000).
CLIENT INFORMATION:
Condition: ADD and Fibromyalgia YOB: 1987
Sex: Female Handedness: Right
Medications: None
HISTORY:
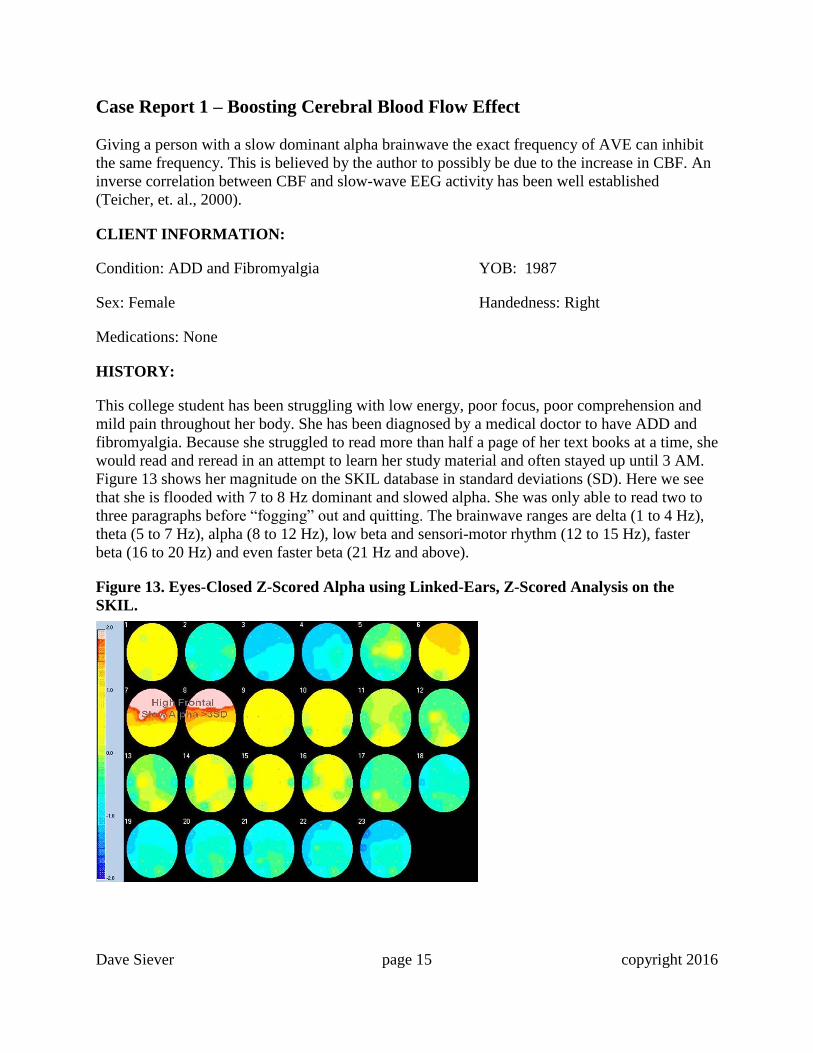
This college student has been struggling with low energy, poor focus, poor comprehension and
mild pain throughout her body. She has been diagnosed by a medical doctor to have ADD and
fibromyalgia. Because she struggled to read more than half a page of her text books at a time, she
would read and reread in an attempt to learn her study material and often stayed up until 3 AM.
Figure 13 shows her magnitude on the SKIL database in standard deviations (SD). Here we see
that she is flooded with 7 to 8 Hz dominant and slowed alpha. She was only able to read two to
three paragraphs before “fogging” out and quitting. The brainwave ranges are delta (1 to 4 Hz),
theta (5 to 7 Hz), alpha (8 to 12 Hz), low beta and sensori-motor rhythm (12 to 15 Hz), faster
beta (16 to 20 Hz) and even faster beta (21 Hz and above).
Figure 13. Eyes-Closed Z-Scored Alpha using Linked-Ears, Z-Scored Analysis on the
SKIL.
Dave Siever page 16 copyright 2016
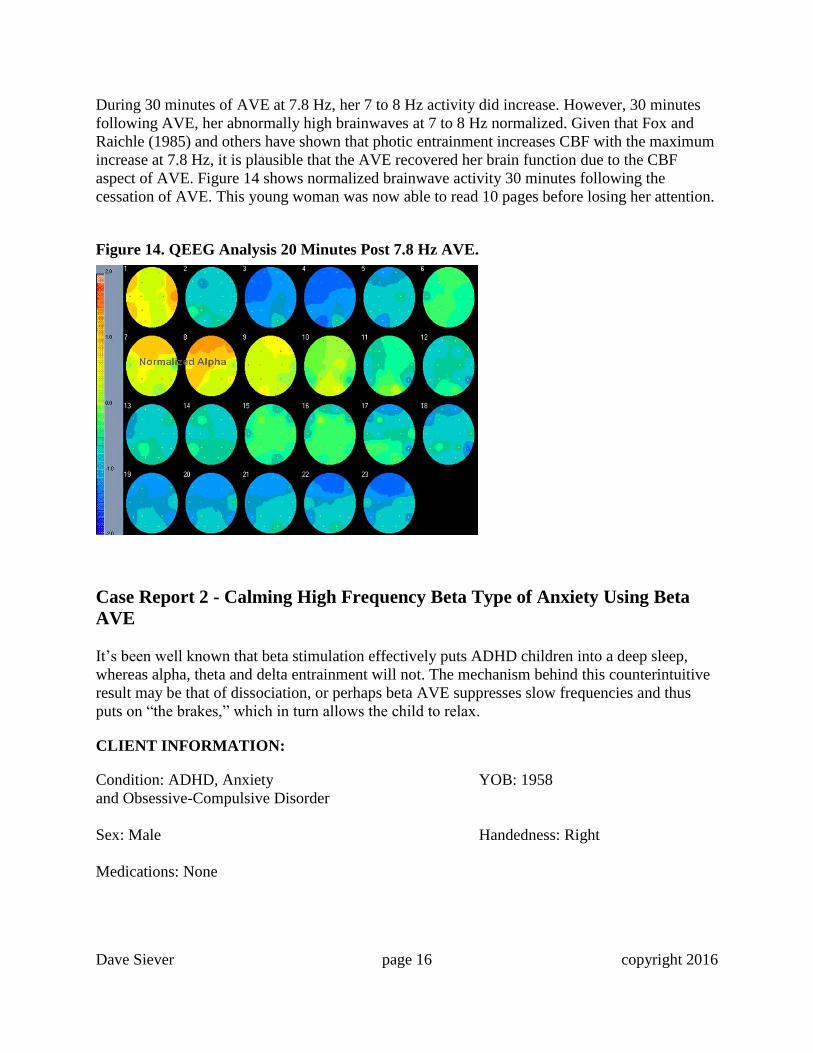
During 30 minutes of AVE at 7.8 Hz, her 7 to 8 Hz activity did increase. However, 30 minutes
following AVE, her abnormally high brainwaves at 7 to 8 Hz normalized. Given that Fox and
Raichle (1985) and others have shown that photic entrainment increases CBF with the maximum
increase at 7.8 Hz, it is plausible that the AVE recovered her brain function due to the CBF
aspect of AVE. Figure 14 shows normalized brainwave activity 30 minutes following the
cessation of AVE. This young woman was now able to read 10 pages before losing her attention.
Figure 14. QEEG Analysis 20 Minutes Post 7.8 Hz AVE.
Case Report 2 - Calming High Frequency Beta Type of Anxiety Using Beta
AVE
It’s been well known that beta stimulation effectively puts ADHD children into a deep sleep,
whereas alpha, theta and delta entrainment will not. The mechanism behind this counterintuitive
result may be that of dissociation, or perhaps beta AVE suppresses slow frequencies and thus
puts on “the brakes,” which in turn allows the child to relax.
CLIENT INFORMATION:
Condition: ADHD, Anxiety YOB: 1958
and Obsessive-Compulsive Disorder
Sex: Male Handedness: Right
Medications: None
Dave Siever page 17 copyright 2016
HISTORY:
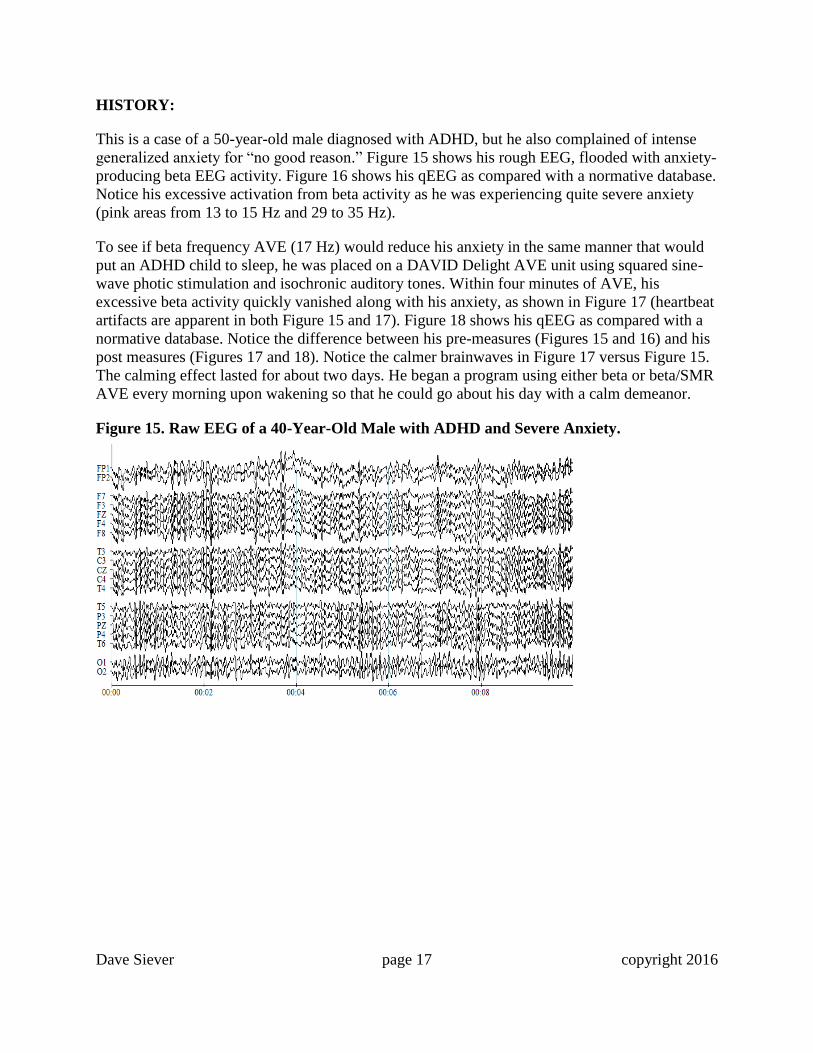
This is a case of a 50-year-old male diagnosed with ADHD, but he also complained of intense
generalized anxiety for “no good reason.” Figure 15 shows his rough EEG, flooded with anxiety-
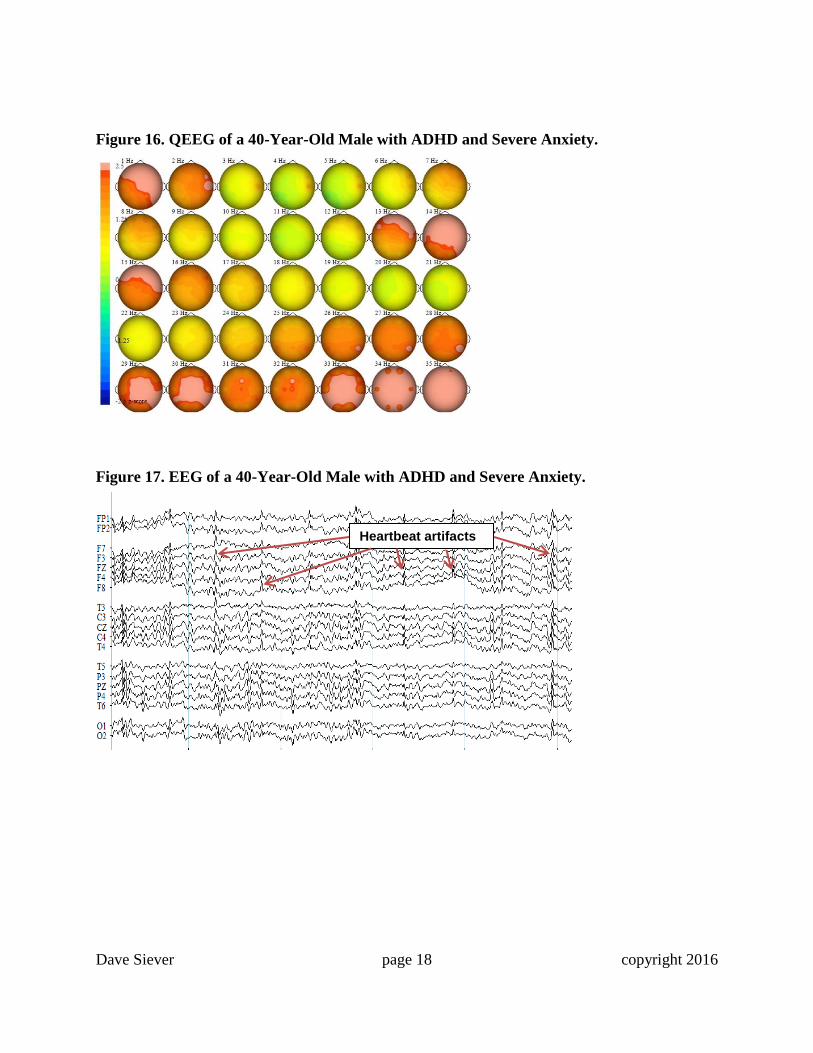
producing beta EEG activity. Figure 16 shows his qEEG as compared with a normative database.
Notice his excessive activation from beta activity as he was experiencing quite severe anxiety
(pink areas from 13 to 15 Hz and 29 to 35 Hz).
To see if beta frequency AVE (17 Hz) would reduce his anxiety in the same manner that would
put an ADHD child to sleep, he was placed on a DAVID Delight AVE unit using squared sine-
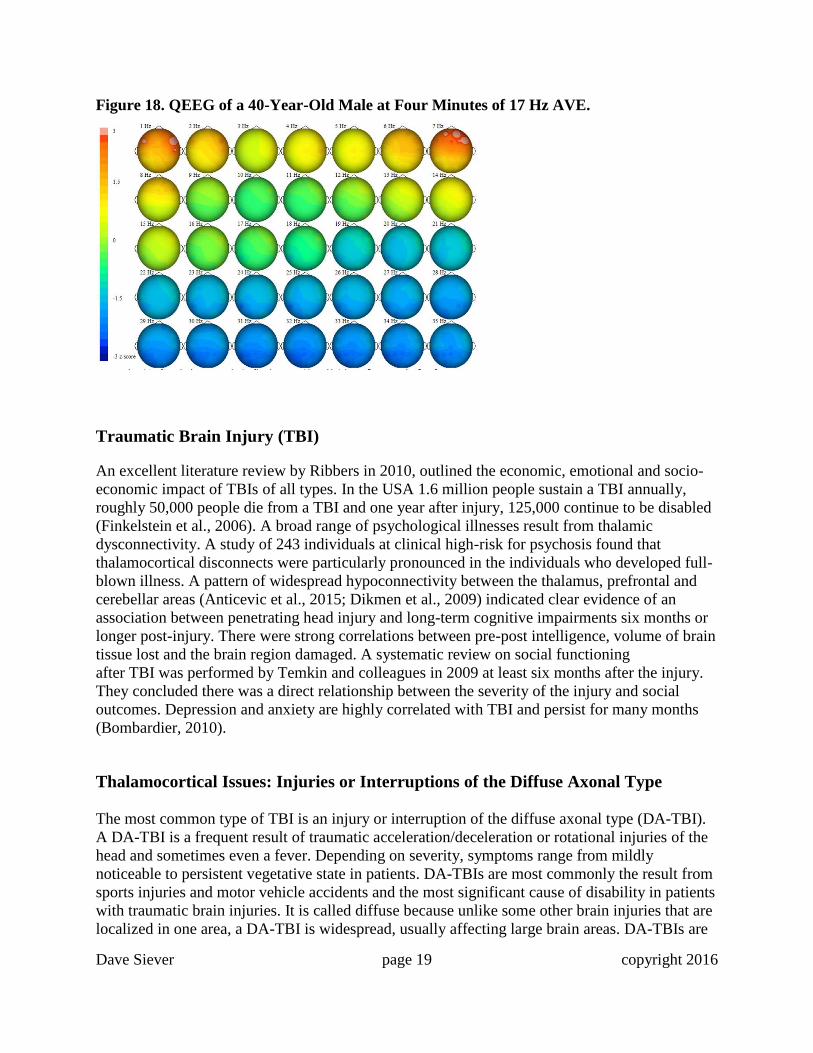
wave photic stimulation and isochronic auditory tones. Within four minutes of AVE, his
excessive beta activity quickly vanished along with his anxiety, as shown in Figure 17 (heartbeat
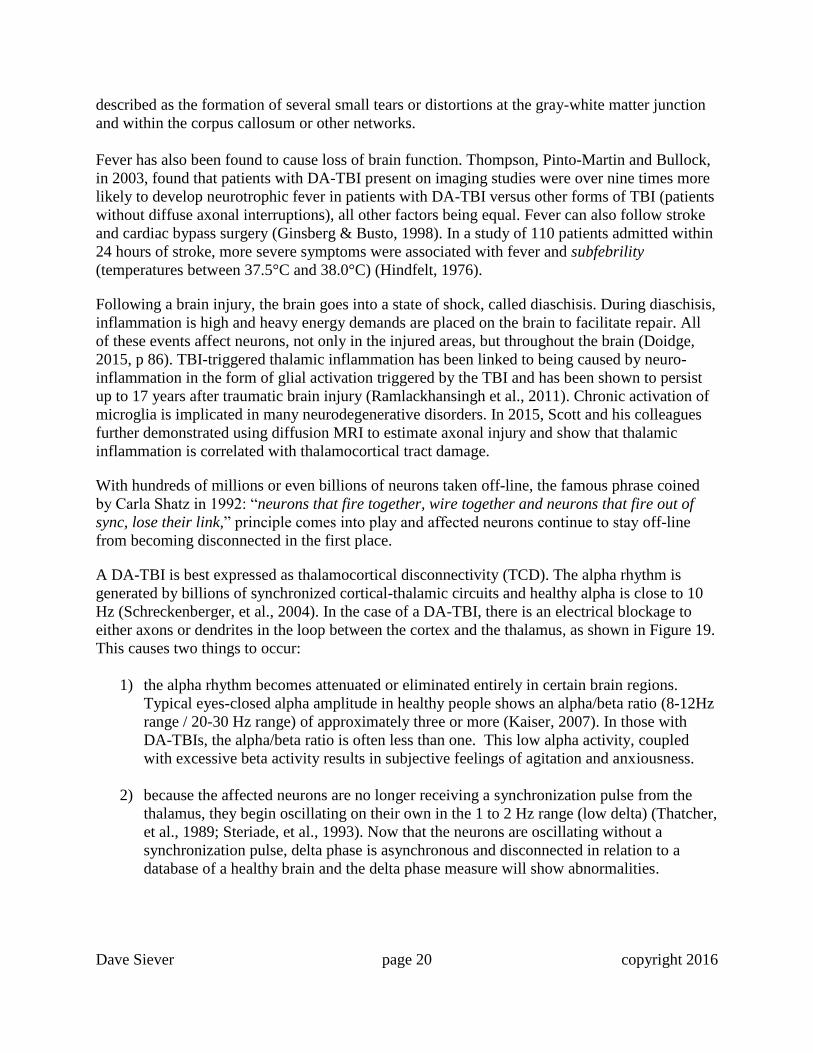
artifacts are apparent in both Figure 15 and 17). Figure 18 shows his qEEG as compared with a
normative database. Notice the difference between his pre-measures (Figures 15 and 16) and his
post measures (Figures 17 and 18). Notice the calmer brainwaves in Figure 17 versus Figure 15.
The calming effect lasted for about two days. He began a program using either beta or beta/SMR
AVE every morning upon wakening so that he could go about his day with a calm demeanor.
Figure 15. Raw EEG of a 40-Year-Old Male with ADHD and Severe Anxiety.
Dave Siever page 18 copyright 2016
Figure 16. QEEG of a 40-Year-Old Male with ADHD and Severe Anxiety.
Figure 17. EEG of a 40-Year-Old Male with ADHD and Severe Anxiety.
Heartbeat artifacts spindle waves
Dave Siever page 19 copyright 2016
Figure 18. QEEG of a 40-Year-Old Male at Four Minutes of 17 Hz AVE.
Traumatic Brain Injury (TBI)
An excellent literature review by Ribbers in 2010, outlined the economic, emotional and socio-
economic impact of TBIs of all types. In the USA 1.6 million people sustain a TBI annually,
roughly 50,000 people die from a TBI and one year after injury, 125,000 continue to be disabled
(Finkelstein et al., 2006). A broad range of psychological illnesses result from thalamic
dysconnectivity. A study of 243 individuals at clinical high-risk for psychosis found that
thalamocortical disconnects were particularly pronounced in the individuals who developed full-
blown illness. A pattern of widespread hypoconnectivity between the thalamus, prefrontal and
cerebellar areas (Anticevic et al., 2015; Dikmen et al., 2009) indicated clear evidence of an
association between penetrating head injury and long-term cognitive impairments six months or
longer post-injury. There were strong correlations between pre-post intelligence, volume of brain
tissue lost and the brain region damaged. A systematic review on social functioning
after TBI was performed by Temkin and colleagues in 2009 at least six months after the injury.
They concluded there was a direct relationship between the severity of the injury and social
outcomes. Depression and anxiety are highly correlated with TBI and persist for many months
(Bombardier, 2010).
Thalamocortical Issues: Injuries or Interruptions of the Diffuse Axonal Type
The most common type of TBI is an injury or interruption of the diffuse axonal type (DA-TBI).
A DA-TBI is a frequent result of traumatic acceleration/deceleration or rotational injuries of the
head and sometimes even a fever. Depending on severity, symptoms range from mildly
noticeable to persistent vegetative state in patients. DA-TBIs are most commonly the result from
sports injuries and motor vehicle accidents and the most significant cause of disability in patients
with traumatic brain injuries. It is called diffuse because unlike some other brain injuries that are
localized in one area, a DA-TBI is widespread, usually affecting large brain areas. DA-TBIs are
Dave Siever page 20 copyright 2016
described as the formation of several small tears or distortions at the gray-white matter junction
and within the corpus callosum or other networks.
Fever has also been found to cause loss of brain function. Thompson, Pinto-Martin and Bullock,
in 2003, found that patients with DA-TBI present on imaging studies were over nine times more
likely to develop neurotrophic fever in patients with DA-TBI versus other forms of TBI (patients
without diffuse axonal interruptions), all other factors being equal. Fever can also follow stroke
and cardiac bypass surgery (Ginsberg & Busto, 1998). In a study of 110 patients admitted within
24 hours of stroke, more severe symptoms were associated with fever and subfebrility
(temperatures between 37.5°C and 38.0°C) (Hindfelt, 1976).
Following a brain injury, the brain goes into a state of shock, called diaschisis. During diaschisis,
inflammation is high and heavy energy demands are placed on the brain to facilitate repair. All
of these events affect neurons, not only in the injured areas, but throughout the brain (Doidge,
2015, p 86). TBI-triggered thalamic inflammation has been linked to being caused by neuro-
inflammation in the form of glial activation triggered by the TBI and has been shown to persist
up to 17 years after traumatic brain injury (Ramlackhansingh et al., 2011). Chronic activation of
microglia is implicated in many neurodegenerative disorders. In 2015, Scott and his colleagues
further demonstrated using diffusion MRI to estimate axonal injury and show that thalamic
inflammation is correlated with thalamocortical tract damage.
With hundreds of millions or even billions of neurons taken off-line, the famous phrase coined
by Carla Shatz in 1992: “neurons that fire together, wire together and neurons that fire out of
sync, lose their link,” principle comes into play and affected neurons continue to stay off-line
from becoming disconnected in the first place.
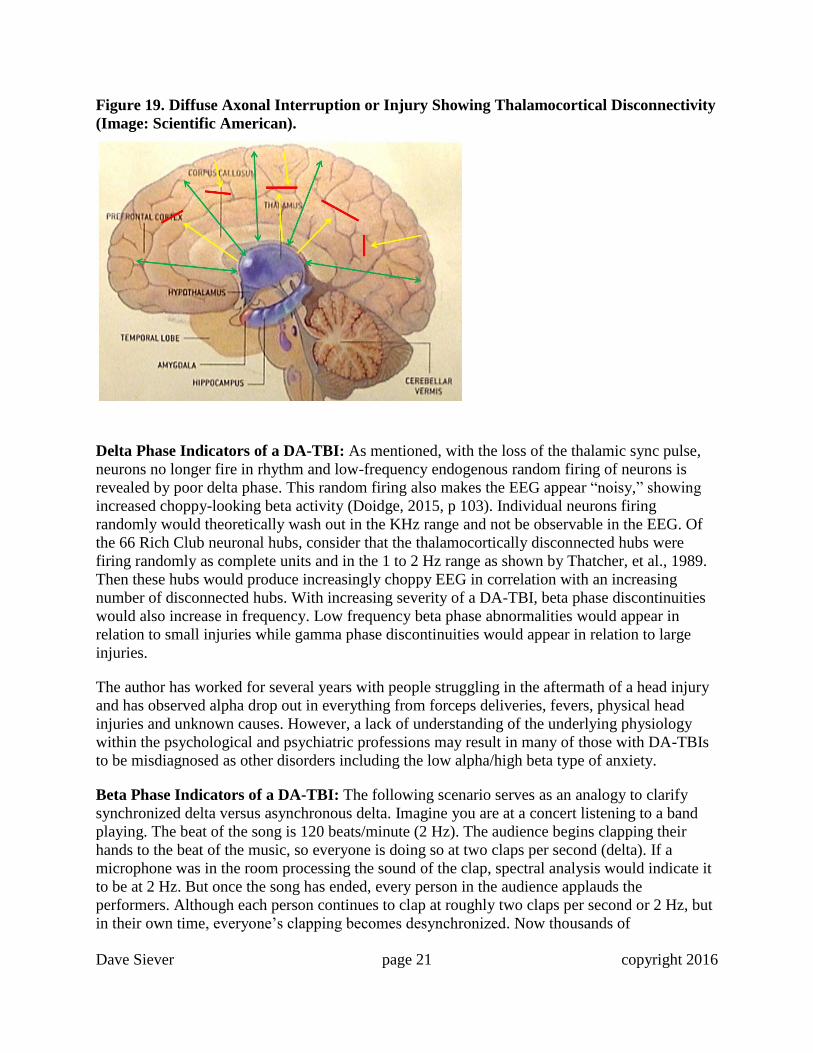
A DA-TBI is best expressed as thalamocortical disconnectivity (TCD). The alpha rhythm is
generated by billions of synchronized cortical-thalamic circuits and healthy alpha is close to 10
Hz (Schreckenberger, et al., 2004). In the case of a DA-TBI, there is an electrical blockage to
either axons or dendrites in the loop between the cortex and the thalamus, as shown in Figure 19.
This causes two things to occur:
1) the alpha rhythm becomes attenuated or eliminated entirely in certain brain regions.
Typical eyes-closed alpha amplitude in healthy people shows an alpha/beta ratio (8-12Hz
range / 20-30 Hz range) of approximately three or more (Kaiser, 2007). In those with
DA-TBIs, the alpha/beta ratio is often less than one. This low alpha activity, coupled
with excessive beta activity results in subjective feelings of agitation and anxiousness.
2) because the affected neurons are no longer receiving a synchronization pulse from the
thalamus, they begin oscillating on their own in the 1 to 2 Hz range (low delta) (Thatcher,
et al., 1989; Steriade, et al., 1993). Now that the neurons are oscillating without a
synchronization pulse, delta phase is asynchronous and disconnected in relation to a
database of a healthy brain and the delta phase measure will show abnormalities.
Dave Siever page 21 copyright 2016
Figure 19. Diffuse Axonal Interruption or Injury Showing Thalamocortical Disconnectivity
(Image: Scientific American).
Delta Phase Indicators of a DA-TBI: As mentioned, with the loss of the thalamic sync pulse,
neurons no longer fire in rhythm and low-frequency endogenous random firing of neurons is
revealed by poor delta phase. This random firing also makes the EEG appear “noisy,” showing
increased choppy-looking beta activity (Doidge, 2015, p 103). Individual neurons firing
randomly would theoretically wash out in the KHz range and not be observable in the EEG. Of
the 66 Rich Club neuronal hubs, consider that the thalamocortically disconnected hubs were
firing randomly as complete units and in the 1 to 2 Hz range as shown by Thatcher, et al., 1989.
Then these hubs would produce increasingly choppy EEG in correlation with an increasing
number of disconnected hubs. With increasing severity of a DA-TBI, beta phase discontinuities
would also increase in frequency. Low frequency beta phase abnormalities would appear in
relation to small injuries while gamma phase discontinuities would appear in relation to large
injuries.
The author has worked for several years with people struggling in the aftermath of a head injury
and has observed alpha drop out in everything from forceps deliveries, fevers, physical head
injuries and unknown causes. However, a lack of understanding of the underlying physiology
within the psychological and psychiatric professions may result in many of those with DA-TBIs
to be misdiagnosed as other disorders including the low alpha/high beta type of anxiety.
Beta Phase Indicators of a DA-TBI: The following scenario serves as an analogy to clarify
synchronized delta versus asynchronous delta. Imagine you are at a concert listening to a band
playing. The beat of the song is 120 beats/minute (2 Hz). The audience begins clapping their
hands to the beat of the music, so everyone is doing so at two claps per second (delta). If a
microphone was in the room processing the sound of the clap, spectral analysis would indicate it
to be at 2 Hz. But once the song has ended, every person in the audience applauds the
performers. Although each person continues to clap at roughly two claps per second or 2 Hz, but
in their own time, everyone’s clapping becomes desynchronized. Now thousands of
Dave Siever page 22 copyright 2016
desynchronized claps are reverberating throughout the auditorium and a roar envelopes the room.
And the larger the audience, the higher in pitch the “roar” appears (imagine the clatter from an
audience of 10 people versus the roar from an audience of 1000). These disconnected claps
would appear as high frequency noise, even though the sources are all at roughly 2 claps per
second (2 Hz). In the brain, once the neurons (at 1 to 2 Hz) are desynchronized and firing in their
own time, we would expect to see desynchronized beta and therefore a beta phase desynchrony.
So far, few analyses have been done, but observations have shown beta phase desynchrony in the
15 to 40 Hz range, with the desynchronized beta frequency dependent on the size of the TCD.
The larger the region of TCD the higher the frequency of beta phase discontinuity (n=10). These
discoveries are in their infancy and require more exploration.
DA-TBI Case Examples
The following three examples demonstrate the diversity of presenting symptoms of DA-TBIs.
We will review a young woman with anxiety and anorexia possibly resulting from a fever, a
woman with lost cognition following a motor-vehicle accident and a young man dealing with
binge alcoholism whose head injury as a child was a result of his skull being crushed by close to
2.5 cm (1”) after a fall.
The remarkable aspects of this population are just how similar their brainwaves are, as they all
show alpha dropout and poor delta phase. It’s true that there are mild variances between them;
the anorexic shows some signs of OCD and the young man with the childhood head injury shows
severe alpha loss and delta phase problems. Despite these small variances, the underlying nature
of a Da-TBI may manifest into a spectrum of disorders. Despite the clinical diagnosis, these
disorders should not be considered as entities in themselves until a DA-TBI has been ruled out.
AVE’s Surprise!
To reestablish the lost alpha activity, it always seemed logical to provide entrainment at an alpha
frequency. However, this technique has not been overly successful. What came as a surprise
were two things: 1) beta stimulation at 20 Hz would reestablish an alpha rhythm at around 10 Hz,
and; 2) dual frequency stimulation (where the left visual fields and left audio were presented at a
different frequency than the right side) would reestablish the alpha rhythm. This technique
provided left-side entrainment at SMR (12 to 15 Hz) and right-side entrainment at beta (20 Hz)
frequencies. A solid physiological explanation as to why it works is yet to be revealed. All we
know is that it produces fast and pronounced effects clinically.
Dave Siever page 23 copyright 2016
Case Report DA-TBI 1 – Interpersonal Anxiety and Mild Anorexia (with
OCD)
Research of Obsessive-Compulsive Disorder (OCD) showed similar brainwave signatures for
hoarders, counters, cutters, anorexics and ritualists. Brainwave signatures were primarily slowed
alpha with a locus over the anterior cingulate and delta phase issues similar to that of a DA-TBI
(Siever, 2013).
CLIENT INFORMATION:
Condition: Generalized Anxiety and YOB: 1997
Obsessive-Compulsive Disorder (with Anorexia)
Sex: Female Handedness: Right
Medications: 20 mg of Prozac
HISTORY:
This young woman struggled with social anxiety, mild obsessive-compulsiveness relating to her
anorexia and delayed sleep-onset insomnia for about three years. To the observer, she appeared
relaxed, peaceful and calm, but she was much more anxious than she appeared. She also had
quite a tense left-side masseter muscle. She was a light sleeper most of her life. As nervousness
grew about the challenges of entering college, her sleep-onset latency increased from
approximately 20 minutes to two hours and her desire to eat was diminished.
Assessments and Work Done
1) While it’s good to treat the qEEG, it’s most important to treat the client. Therefore, we have
the client track how they think things are going by completing a Symptoms Checklist-90-
Revised (SCL-90-R, a 90-question self-reported questionnaire) during treatment. An overall
score of 50 is the norm. Higher scores represent a poorer self-assessment than the normal
population while lower scores indicate better than normal. A score of 60 is one standard
deviation off the norm. Scores higher than 60 are considered clinical.
2) A 19-channel (10-20 montage), referential/linked-ears EEG and qEEG was completed for
eyes closed, eyes open, AVE with eyes closed and post AVE with eyes closed.
3) AVE at alpha/beta (left side at 10 Hz and right side at 19 to 21 Hz using headphones and split-
field eyesets) frequencies to inhibit her slow brainwaves was used while her brainwaves were
being recorded.
4) The client was given a DAVID Delight Pro, which uses a combination of AVE and Cranio-
electro stimulation (CES). CES presents a small electrical pulse across the cranium. The
resulting stimulus flows across the brain stem and primarily stimulates serotonin and endorphin
production making it beneficial for calming the mind and reducing pain.
Dave Siever page 24 copyright 2016
EEG and qEEG Analysis
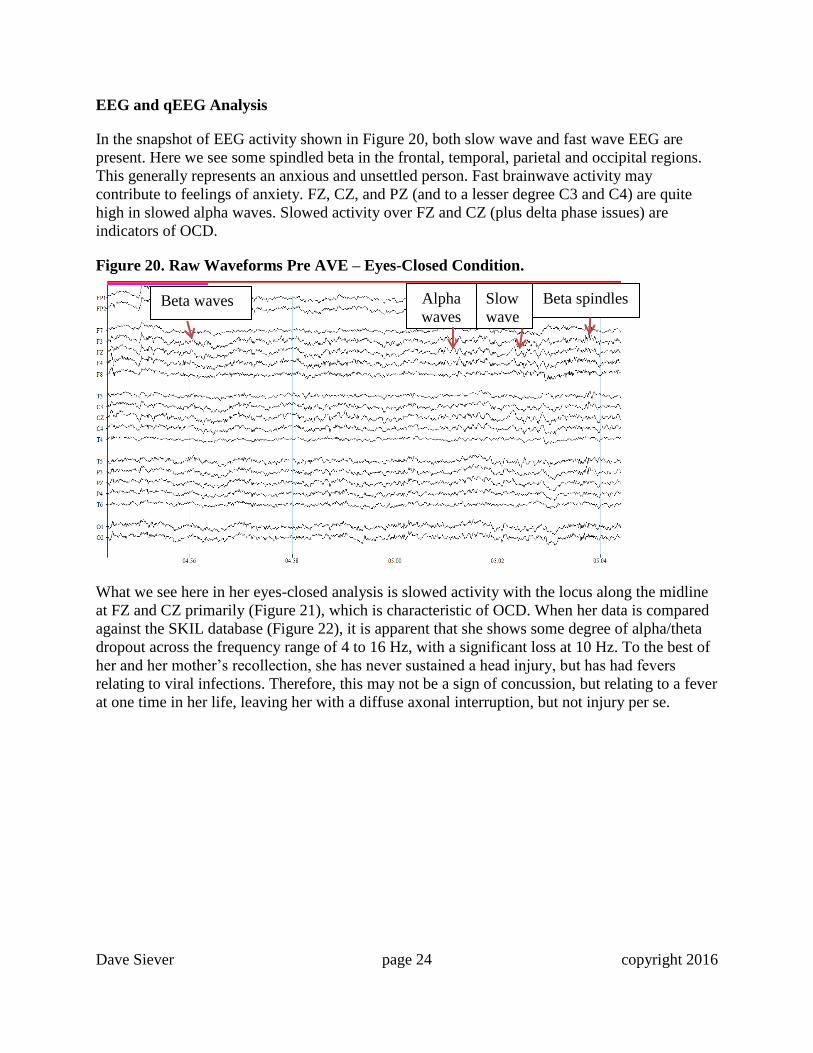
In the snapshot of EEG activity shown in Figure 20, both slow wave and fast wave EEG are
present. Here we see some spindled beta in the frontal, temporal, parietal and occipital regions.
This generally represents an anxious and unsettled person. Fast brainwave activity may
contribute to feelings of anxiety. FZ, CZ, and PZ (and to a lesser degree C3 and C4) are quite
high in slowed alpha waves. Slowed activity over FZ and CZ (plus delta phase issues) are
indicators of OCD.
Figure 20. Raw Waveforms Pre AVE – Eyes-Closed Condition.
What we see here in her eyes-closed analysis is slowed activity with the locus along the midline
at FZ and CZ primarily (Figure 21), which is characteristic of OCD. When her data is compared
against the SKIL database (Figure 22), it is apparent that she shows some degree of alpha/theta
dropout across the frequency range of 4 to 16 Hz, with a significant loss at 10 Hz. To the best of
her and her mother’s recollection, she has never sustained a head injury, but has had fevers
relating to viral infections. Therefore, this may not be a sign of concussion, but relating to a fever
at one time in her life, leaving her with a diffuse axonal interruption, but not injury per se.
Beta waves Slow
wave
s
Beta spindles Alpha
waves
Dave Siever page 25 copyright 2016
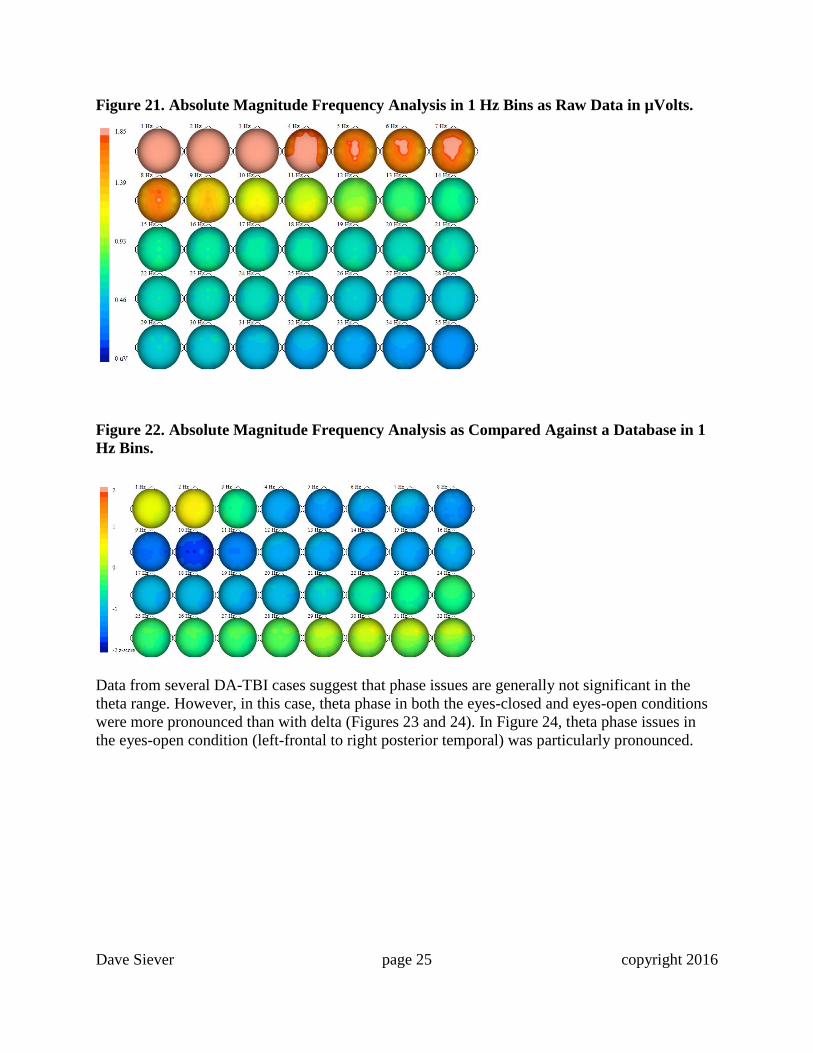
Figure 21. Absolute Magnitude Frequency Analysis in 1 Hz Bins as Raw Data in µVolts.
Figure 22. Absolute Magnitude Frequency Analysis as Compared Against a Database in 1
Hz Bins.
Data from several DA-TBI cases suggest that phase issues are generally not significant in the
theta range. However, in this case, theta phase in both the eyes-closed and eyes-open conditions
were more pronounced than with delta (Figures 23 and 24). In Figure 24, theta phase issues in
the eyes-open condition (left-frontal to right posterior temporal) was particularly pronounced.
Dave Siever page 26 copyright 2016
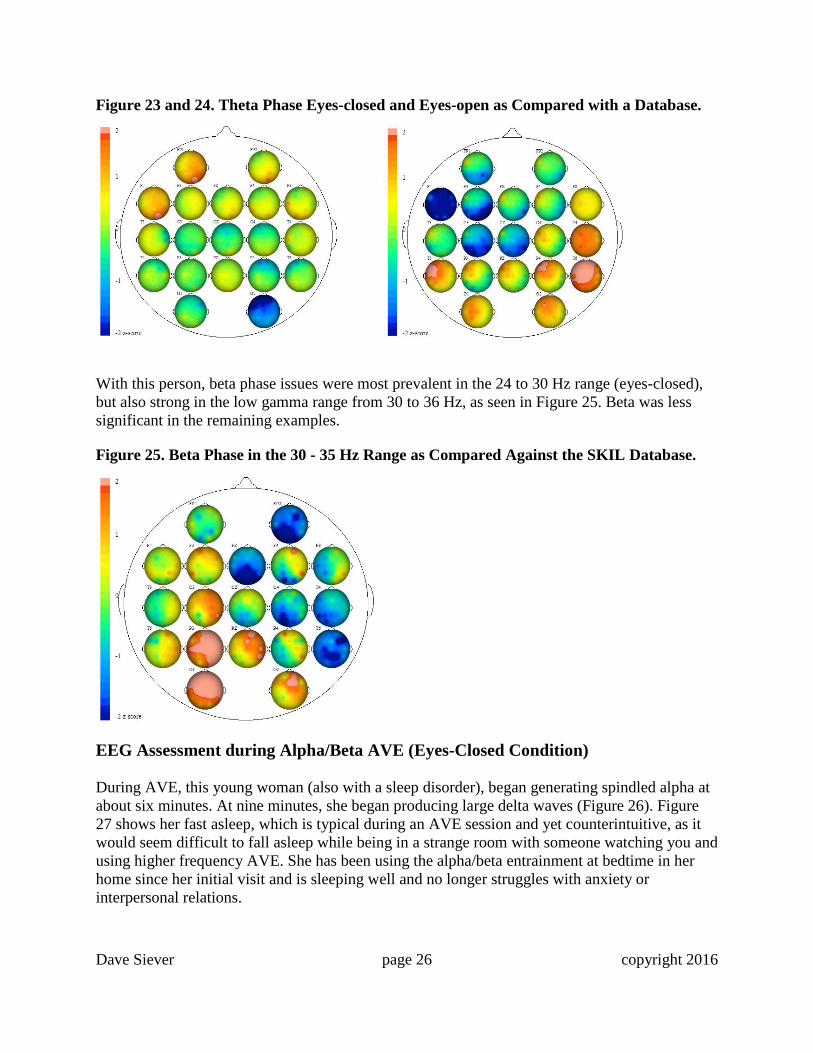
Figure 23 and 24. Theta Phase Eyes-closed and Eyes-open as Compared with a Database.
With this person, beta phase issues were most prevalent in the 24 to 30 Hz range (eyes-closed),
but also strong in the low gamma range from 30 to 36 Hz, as seen in Figure 25. Beta was less
significant in the remaining examples.
Figure 25. Beta Phase in the 30 - 35 Hz Range as Compared Against the SKIL Database.
EEG Assessment during Alpha/Beta AVE (Eyes-Closed Condition)
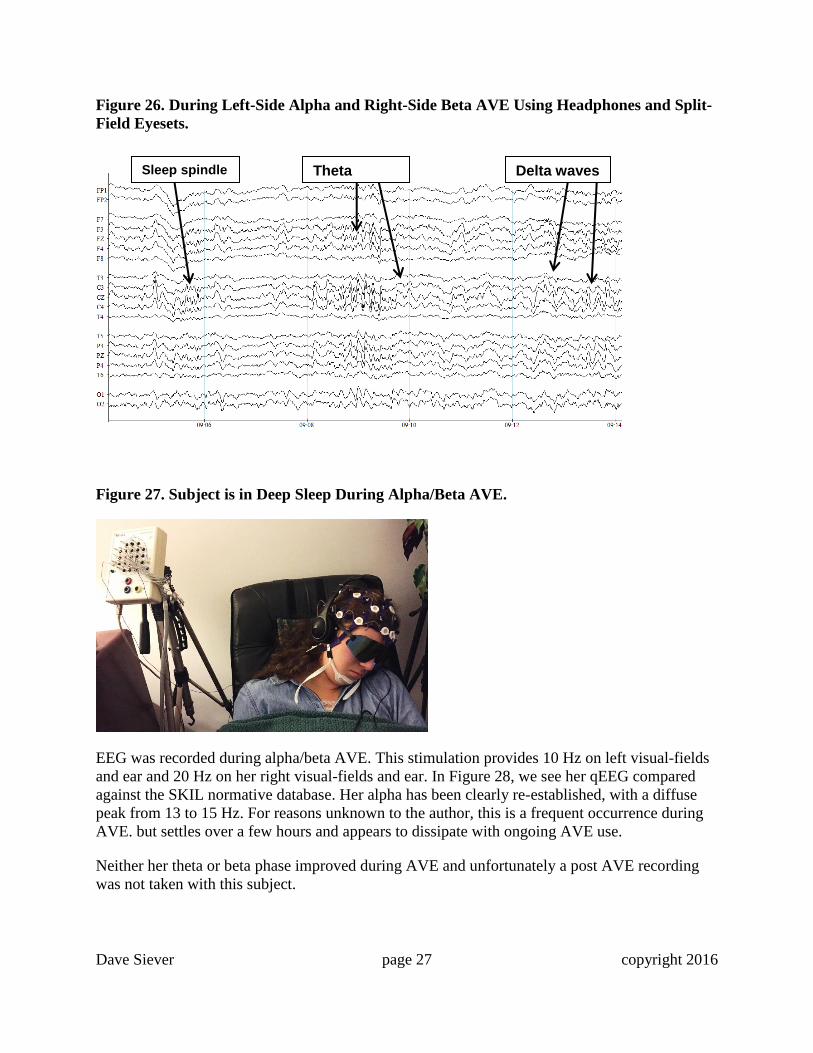
During AVE, this young woman (also with a sleep disorder), began generating spindled alpha at
about six minutes. At nine minutes, she began producing large delta waves (Figure 26). Figure
27 shows her fast asleep, which is typical during an AVE session and yet counterintuitive, as it
would seem difficult to fall asleep while being in a strange room with someone watching you and
using higher frequency AVE. She has been using the alpha/beta entrainment at bedtime in her
home since her initial visit and is sleeping well and no longer struggles with anxiety or
interpersonal relations.
Dave Siever page 27 copyright 2016
Figure 26. During Left-Side Alpha and Right-Side Beta AVE Using Headphones and Split-
Field Eyesets.
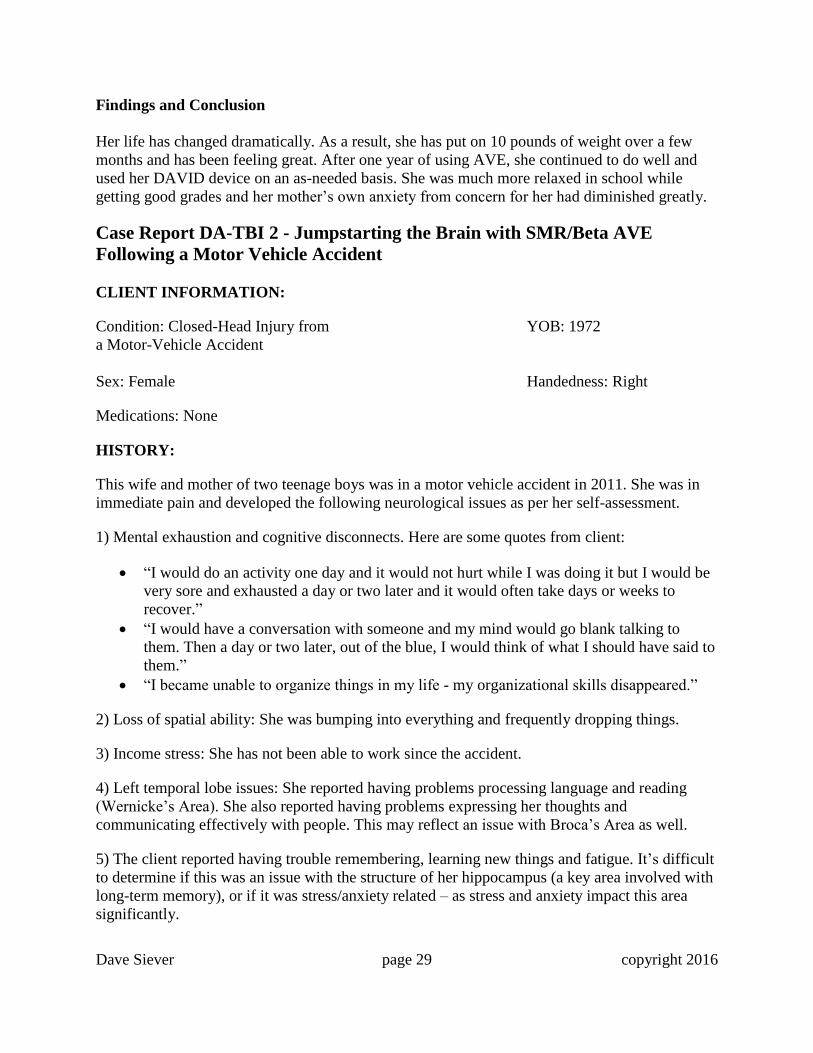
Figure 27. Subject is in Deep Sleep During Alpha/Beta AVE.
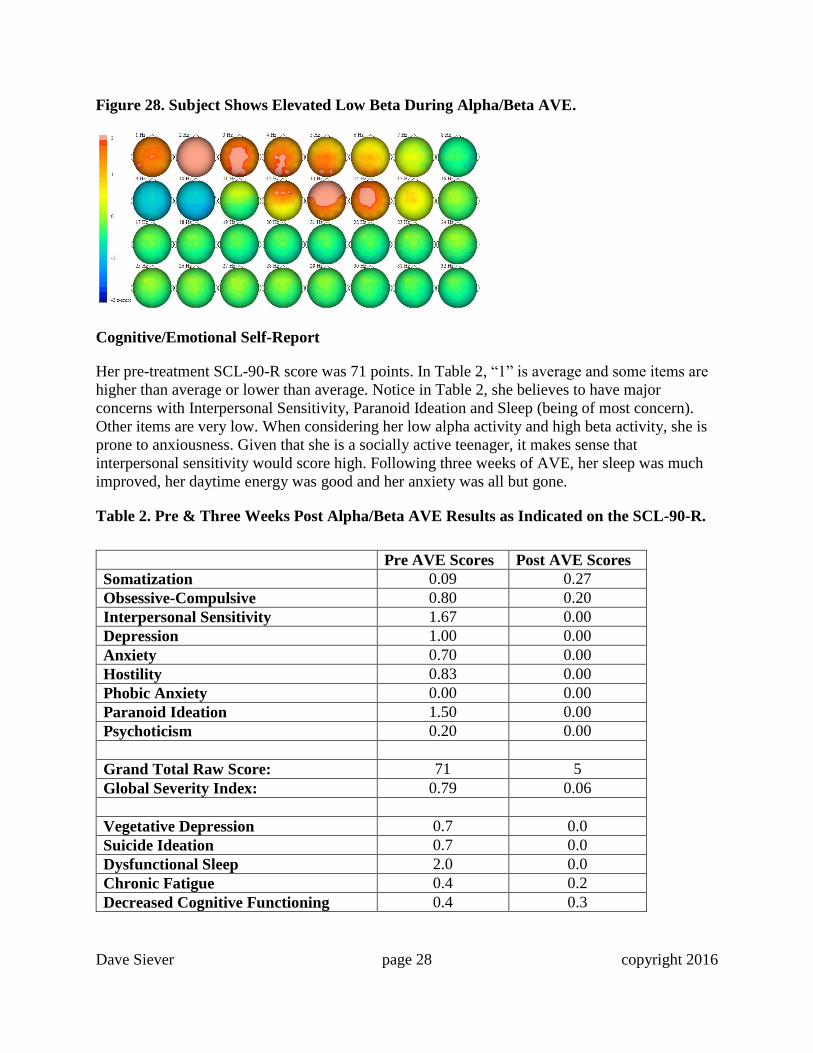
EEG was recorded during alpha/beta AVE. This stimulation provides 10 Hz on left visual-fields
and ear and 20 Hz on her right visual-fields and ear. In Figure 28, we see her qEEG compared
against the SKIL normative database. Her alpha has been clearly re-established, with a diffuse
peak from 13 to 15 Hz. For reasons unknown to the author, this is a frequent occurrence during
AVE. but settles over a few hours and appears to dissipate with ongoing AVE use.
Neither her theta or beta phase improved during AVE and unfortunately a post AVE recording
was not taken with this subject.
Delta waves Theta waves
Sleep spindle waves
Dave Siever page 28 copyright 2016
Figure 28. Subject Shows Elevated Low Beta During Alpha/Beta AVE.
Cognitive/Emotional Self-Report
Her pre-treatment SCL-90-R score was 71 points. In Table 2, “1” is average and some items are
higher than average or lower than average. Notice in Table 2, she believes to have major
concerns with Interpersonal Sensitivity, Paranoid Ideation and Sleep (being of most concern).
Other items are very low. When considering her low alpha activity and high beta activity, she is
prone to anxiousness. Given that she is a socially active teenager, it makes sense that
interpersonal sensitivity would score high. Following three weeks of AVE, her sleep was much
improved, her daytime energy was good and her anxiety was all but gone.
Table 2. Pre & Three Weeks Post Alpha/Beta AVE Results as Indicated on the SCL-90-R.
Pre AVE Scores Post AVE Scores
Somatization 0.09 0.27
Obsessive-Compulsive 0.80 0.20
Interpersonal Sensitivity 1.67 0.00
Depression 1.00 0.00
Anxiety 0.70 0.00
Hostility 0.83 0.00
Phobic Anxiety 0.00 0.00
Paranoid Ideation 1.50 0.00
Psychoticism 0.20 0.00
Grand Total Raw Score: 71 5
Global Severity Index: 0.79 0.06
Vegetative Depression 0.7 0.0
Suicide Ideation 0.7 0.0
Dysfunctional Sleep 2.0 0.0
Chronic Fatigue 0.4 0.2
Decreased Cognitive Functioning 0.4 0.3
Dave Siever page 29 copyright 2016
Findings and Conclusion
Her life has changed dramatically. As a result, she has put on 10 pounds of weight over a few
months and has been feeling great. After one year of using AVE, she continued to do well and
used her DAVID device on an as-needed basis. She was much more relaxed in school while
getting good grades and her mother’s own anxiety from concern for her had diminished greatly.
Case Report DA-TBI 2 - Jumpstarting the Brain with SMR/Beta AVE
Following a Motor Vehicle Accident
CLIENT INFORMATION:
Condition: Closed-Head Injury from YOB: 1972
a Motor-Vehicle Accident
Sex: Female Handedness: Right
Medications: None
HISTORY:
This wife and mother of two teenage boys was in a motor vehicle accident in 2011. She was in
immediate pain and developed the following neurological issues as per her self-assessment.
1) Mental exhaustion and cognitive disconnects. Here are some quotes from client:
“I would do an activity one day and it would not hurt while I was doing it but I would be
very sore and exhausted a day or two later and it would often take days or weeks to
recover.”
“I would have a conversation with someone and my mind would go blank talking to
them. Then a day or two later, out of the blue, I would think of what I should have said to
them.”
“I became unable to organize things in my life - my organizational skills disappeared.”
2) Loss of spatial ability: She was bumping into everything and frequently dropping things.
3) Income stress: She has not been able to work since the accident.
4) Left temporal lobe issues: She reported having problems processing language and reading
(Wernicke’s Area). She also reported having problems expressing her thoughts and
communicating effectively with people. This may reflect an issue with Broca’s Area as well.
5) The client reported having trouble remembering, learning new things and fatigue. It’s difficult
to determine if this was an issue with the structure of her hippocampus (a key area involved with
long-term memory), or if it was stress/anxiety related – as stress and anxiety impact this area
significantly.

Dave Siever page 30 copyright 2016
6) Given the client’s brain showed desynchronization across most regions in coherence,
comodulation and phase, she would struggle to focus on daily issues. Cognitive functioning
involves the simultaneous integration of several brain areas. This explains why she struggled to
organize her thoughts and actions.
Assessments and Work Done
1) SCL-90-R was recorded before AVE and three weeks and twelve weeks after AVE use.
2) A 19-channel (10-20 montage), referential/linked-ears EEG and qEEG was completed.
3) AVE at SMR/beta (left side at 14 Hz and right side at 20 Hz using headphones and split-field
eyesets) frequencies to inhibit her slow brainwaves was used during EEG recording.
4) The client was given a Delight Pro, which uses a combination of AVE and CES, to clear her
head and reduce her pain.
5) One month later, she was placed on several applications of transcranial DC Stimulation
(tDCS) over T5 to help improve language and name recall. TDCS is the application of a direct
current used to excite neuronal activity and performance. There are about 800 studies on tDCS to
date with many of them showing clinical improvements such as motor and aphasias resulting
from stroke.
EEG/qEEG Analysis (Eyes-Closed Condition)
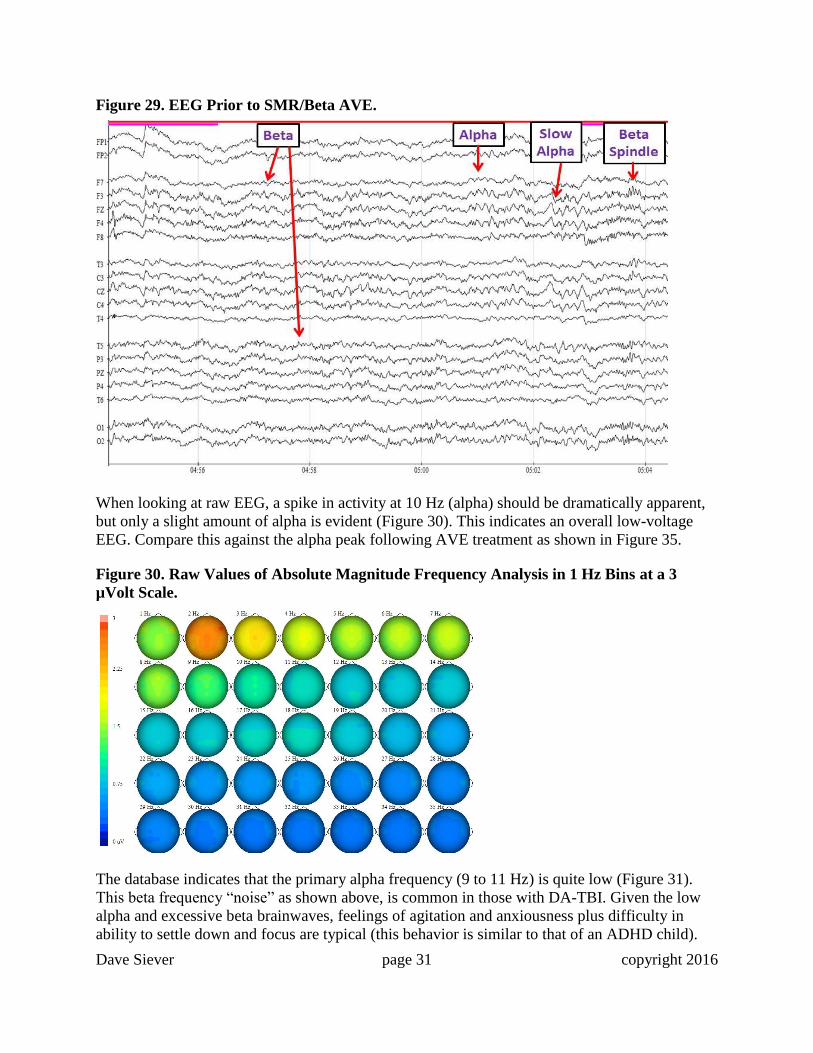
Referring to Figure 29, we see plenty of eye twitches. Note the ticks on FP1 and FP2, F7 and F8.
This generally represents anxiety or sensitivity to anxiety. In this snapshot, small quantities of
alpha waves are present only on certain channels and both slowed alpha waves and beta waves
are present. Both of these abnormal brainwaves contribute to feelings of anxiety. Fast waves are
often a side effect of too many slow waves and by speeding up the brain, the fast waves will
diminish. FZ and CZ are high in slowed alpha. All channels are high in random beta and beta
spindle activity.
Dave Siever page 31 copyright 2016
Figure 29. EEG Prior to SMR/Beta AVE.
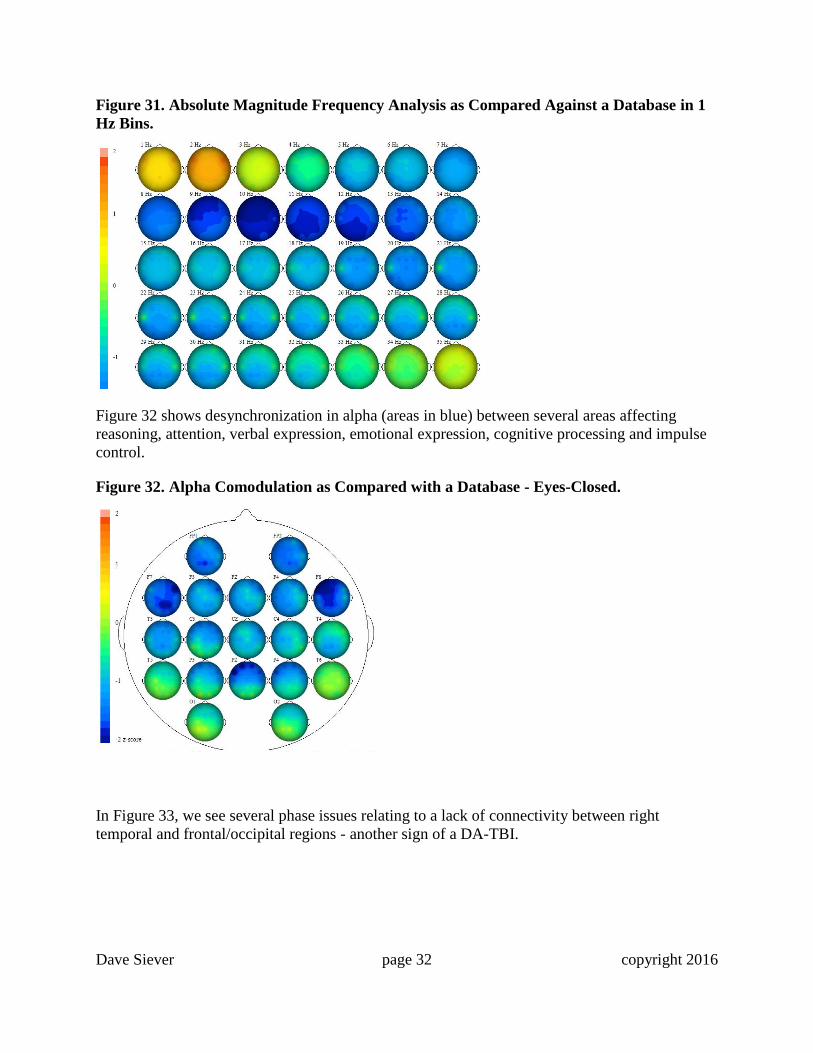
When looking at raw EEG, a spike in activity at 10 Hz (alpha) should be dramatically apparent,
but only a slight amount of alpha is evident (Figure 30). This indicates an overall low-voltage
EEG. Compare this against the alpha peak following AVE treatment as shown in Figure 35.
Figure 30. Raw Values of Absolute Magnitude Frequency Analysis in 1 Hz Bins at a 3
µVolt Scale.
The database indicates that the primary alpha frequency (9 to 11 Hz) is quite low (Figure 31).
This beta frequency “noise” as shown above, is common in those with DA-TBI. Given the low
alpha and excessive beta brainwaves, feelings of agitation and anxiousness plus difficulty in
ability to settle down and focus are typical (this behavior is similar to that of an ADHD child).
Dave Siever page 32 copyright 2016
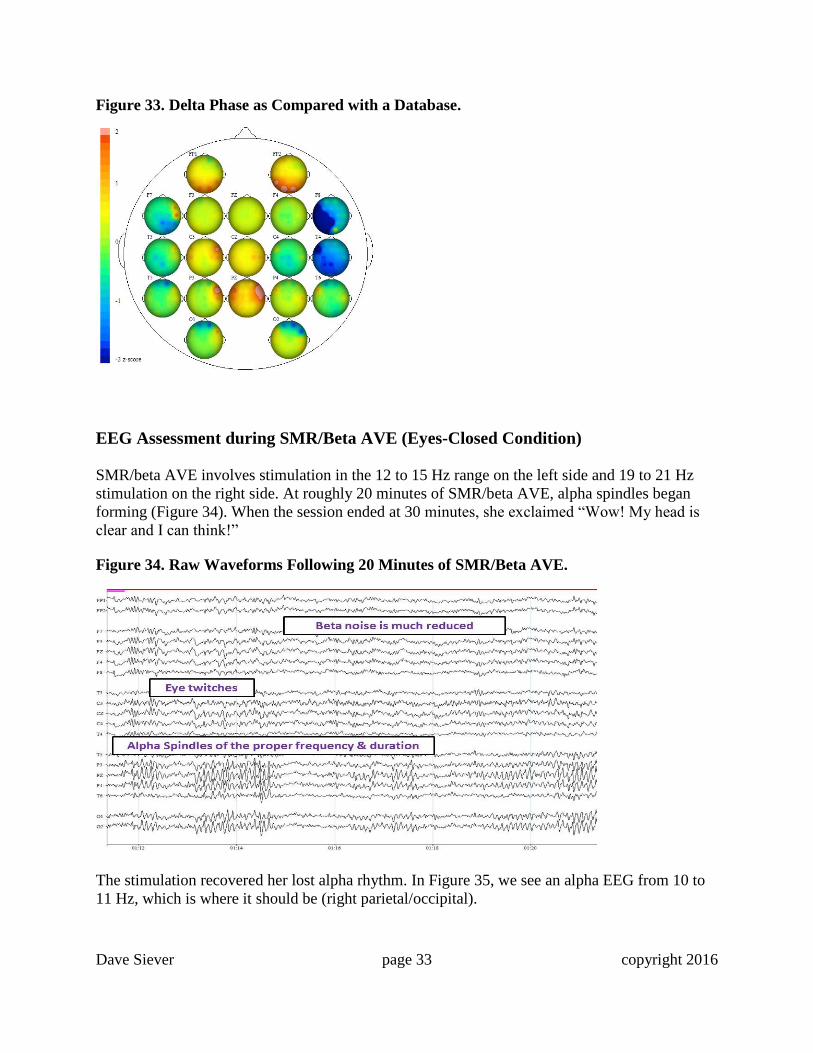
Figure 31. Absolute Magnitude Frequency Analysis as Compared Against a Database in 1
Hz Bins.
Figure 32 shows desynchronization in alpha (areas in blue) between several areas affecting
reasoning, attention, verbal expression, emotional expression, cognitive processing and impulse
control.
Figure 32. Alpha Comodulation as Compared with a Database - Eyes-Closed.
In Figure 33, we see several phase issues relating to a lack of connectivity between right
temporal and frontal/occipital regions - another sign of a DA-TBI.
Dave Siever page 33 copyright 2016
Figure 33. Delta Phase as Compared with a Database.
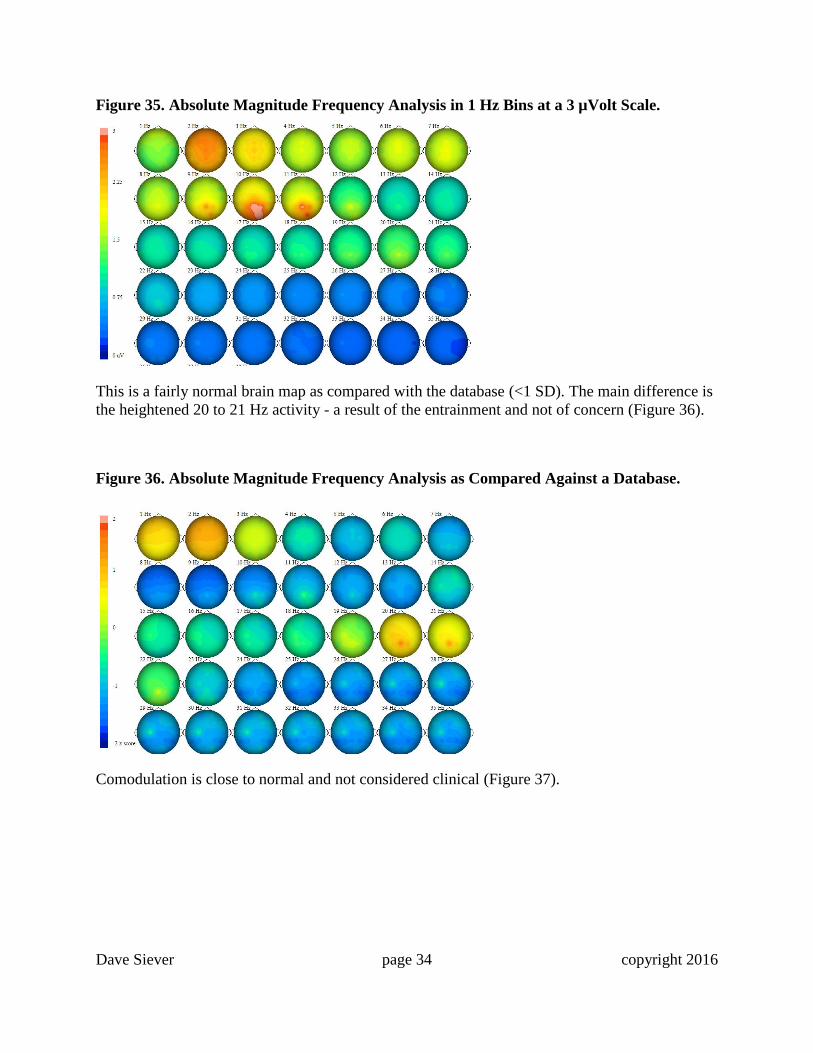
EEG Assessment during SMR/Beta AVE (Eyes-Closed Condition)
SMR/beta AVE involves stimulation in the 12 to 15 Hz range on the left side and 19 to 21 Hz
stimulation on the right side. At roughly 20 minutes of SMR/beta AVE, alpha spindles began
forming (Figure 34). When the session ended at 30 minutes, she exclaimed “Wow! My head is
clear and I can think!”
Figure 34. Raw Waveforms Following 20 Minutes of SMR/Beta AVE.
The stimulation recovered her lost alpha rhythm. In Figure 35, we see an alpha EEG from 10 to
11 Hz, which is where it should be (right parietal/occipital).
Dave Siever page 34 copyright 2016
Figure 35. Absolute Magnitude Frequency Analysis in 1 Hz Bins at a 3 µVolt Scale.
This is a fairly normal brain map as compared with the database (<1 SD). The main difference is
the heightened 20 to 21 Hz activity - a result of the entrainment and not of concern (Figure 36).
Figure 36. Absolute Magnitude Frequency Analysis as Compared Against a Database.
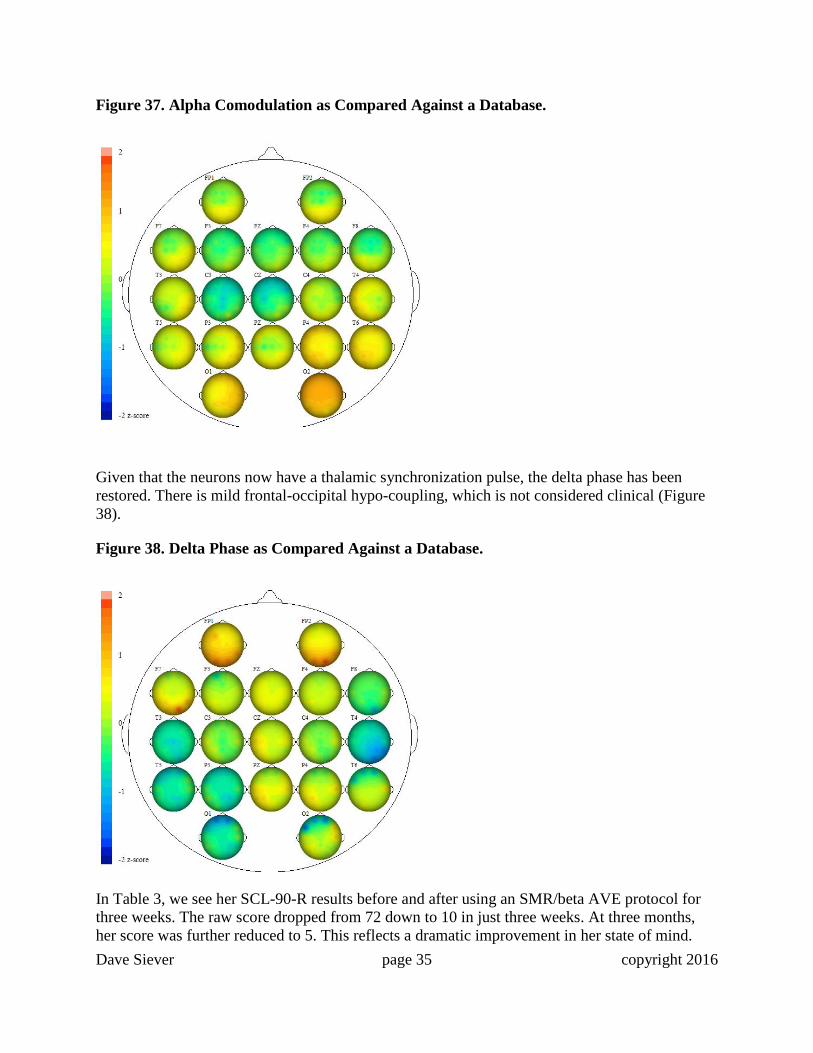
Comodulation is close to normal and not considered clinical (Figure 37).
Dave Siever page 35 copyright 2016
Figure 37. Alpha Comodulation as Compared Against a Database.
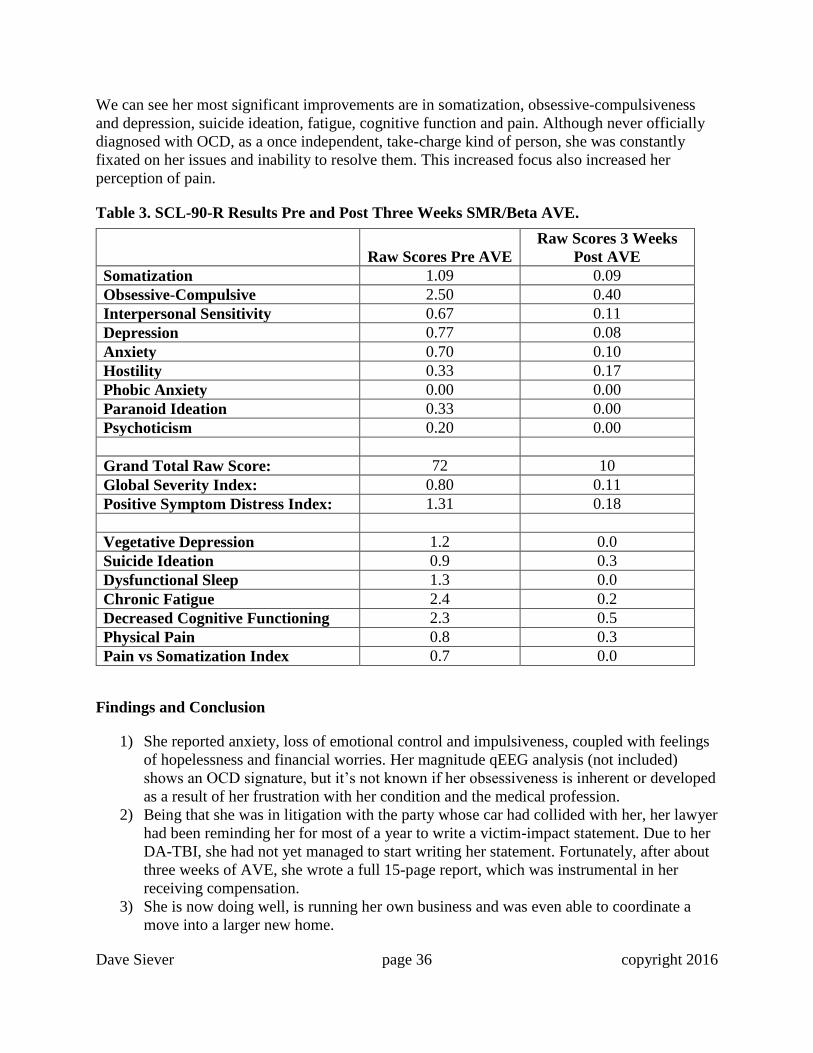
Given that the neurons now have a thalamic synchronization pulse, the delta phase has been
restored. There is mild frontal-occipital hypo-coupling, which is not considered clinical (Figure
38).
Figure 38. Delta Phase as Compared Against a Database.
In Table 3, we see her SCL-90-R results before and after using an SMR/beta AVE protocol for
three weeks. The raw score dropped from 72 down to 10 in just three weeks. At three months,
her score was further reduced to 5. This reflects a dramatic improvement in her state of mind.
Dave Siever page 36 copyright 2016
We can see her most significant improvements are in somatization, obsessive-compulsiveness
and depression, suicide ideation, fatigue, cognitive function and pain. Although never officially
diagnosed with OCD, as a once independent, take-charge kind of person, she was constantly
fixated on her issues and inability to resolve them. This increased focus also increased her
perception of pain.
Table 3. SCL-90-R Results Pre and Post Three Weeks SMR/Beta AVE.
Raw Scores Pre AVE
Raw Scores 3 Weeks
Post AVE
Somatization 1.09 0.09
Obsessive-Compulsive 2.50 0.40
Interpersonal Sensitivity 0.67 0.11
Depression 0.77 0.08
Anxiety 0.70 0.10
Hostility 0.33 0.17
Phobic Anxiety 0.00 0.00
Paranoid Ideation 0.33 0.00
Psychoticism 0.20 0.00
Grand Total Raw Score: 72 10
Global Severity Index: 0.80 0.11
Positive Symptom Distress Index: 1.31 0.18
Vegetative Depression 1.2 0.0
Suicide Ideation 0.9 0.3
Dysfunctional Sleep 1.3 0.0
Chronic Fatigue 2.4 0.2
Decreased Cognitive Functioning 2.3 0.5
Physical Pain 0.8 0.3
Pain vs Somatization Index 0.7 0.0
Findings and Conclusion
1) She reported anxiety, loss of emotional control and impulsiveness, coupled with feelings
of hopelessness and financial worries. Her magnitude qEEG analysis (not included)
shows an OCD signature, but it’s not known if her obsessiveness is inherent or developed
as a result of her frustration with her condition and the medical profession.
2) Being that she was in litigation with the party whose car had collided with her, her lawyer
had been reminding her for most of a year to write a victim-impact statement. Due to her
DA-TBI, she had not yet managed to start writing her statement. Fortunately, after about
three weeks of AVE, she wrote a full 15-page report, which was instrumental in her
receiving compensation.
3) She is now doing well, is running her own business and was even able to coordinate a
move into a larger new home.
Dave Siever page 37 copyright 2016
Case Report DAI 3 - Jumpstarting the Brain of a Binge Alcoholic Using
Alpha/Beta AVE
A low alpha/high beta EEG signature is typically associated with a tendency towards alcoholism.
However, research has yet to determine if there is a phenotype of the low alpha/high beta type
exclusive of DA-TBI causes of alcoholism. In this case, it is certain that DAI is a contributing or
the sole cause of the alcoholism. It’s possible that all low alpha/high beta signatures may lead to
alcoholism simply to calm down an agitated and unsettled brain, whatever the cause.
CLIENT INFORMATION:
Condition: Alcoholism, Anxiety, Poor Sleep YOB: 1984
Sex: Male Handedness: Right
Medications: 75 mg of Effexor
HISTORY:
This 31-year-old man has been struggling with alcoholism for many years. He has poor grammar
and difficulty maintaining employment due to his drinking. He was excessively aberrant in other
measures such as comodulation and coherence, but for the purpose of this article, the focus of
this investigation will remain with magnitude and phase as these are the main measures
presumed to be vital in assessing DA-TBIs. The client’s initial EEG-based gains were not as
great as in the previous cases. However, his clinical improvements as indicated on the SCL-90-R
combined with his reduced abusing of alcohol point to signs that the AVE was helping.
Following his EEG assessment, he was asked if he had ever sustained a head injury. Here is his
history in his words:
“Closed-head injury from a young childhood fall.”
“In Grade 1, I had a slide accident with major trauma to my left skull. Caved it in about
two cm. I was in and out of consciousness. I don’t feel like it has affected me and my life
has been normal since. I’ve always lacked motivation.”
“We were in an inner tube being pulled by a skidoo. My leg got caught in the middle of
the tube and I was sucked under. I was knocked unconscious.”
“Since high school, I had trouble socializing and was often a loner and binge drinking on
weekends and then later on during the week.”
“In 2013, I lost my license in July from a DUI,” (driving under the influence of alcohol).
“In 2014, I spent six months at a treatment center.”
“In 2015, I spent seven weeks in rehab. I snuck in alcohol and was kicked out.”
“February 4, 2016. That was my last drink. Then I spent five days in detox.”
Dave Siever page 38 copyright 2016
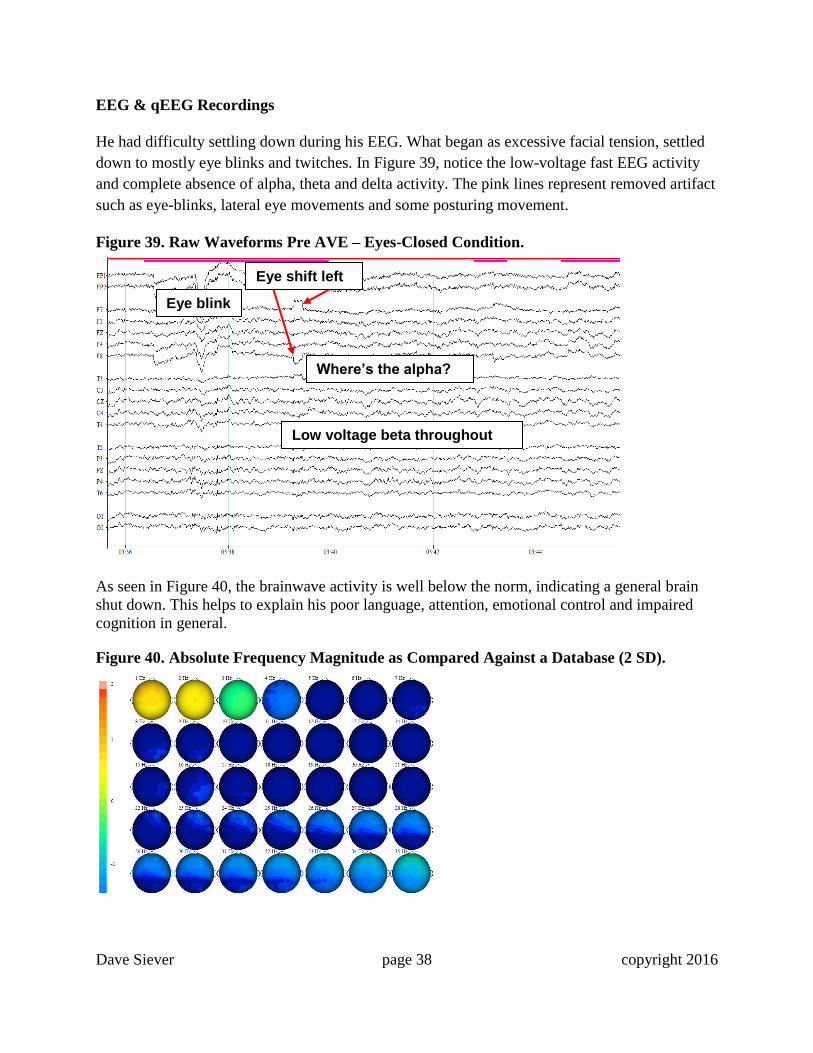
EEG & qEEG Recordings
He had difficulty settling down during his EEG. What began as excessive facial tension, settled
down to mostly eye blinks and twitches. In Figure 39, notice the low-voltage fast EEG activity
and complete absence of alpha, theta and delta activity. The pink lines represent removed artifact
such as eye-blinks, lateral eye movements and some posturing movement.
Figure 39. Raw Waveforms Pre AVE – Eyes-Closed Condition.
As seen in Figure 40, the brainwave activity is well below the norm, indicating a general brain
shut down. This helps to explain his poor language, attention, emotional control and impaired
cognition in general.
Figure 40. Absolute Frequency Magnitude as Compared Against a Database (2 SD).
Low voltage beta throughout
Where’s the alpha?
Eye shift left
Eye blink
Dave Siever page 39 copyright 2016
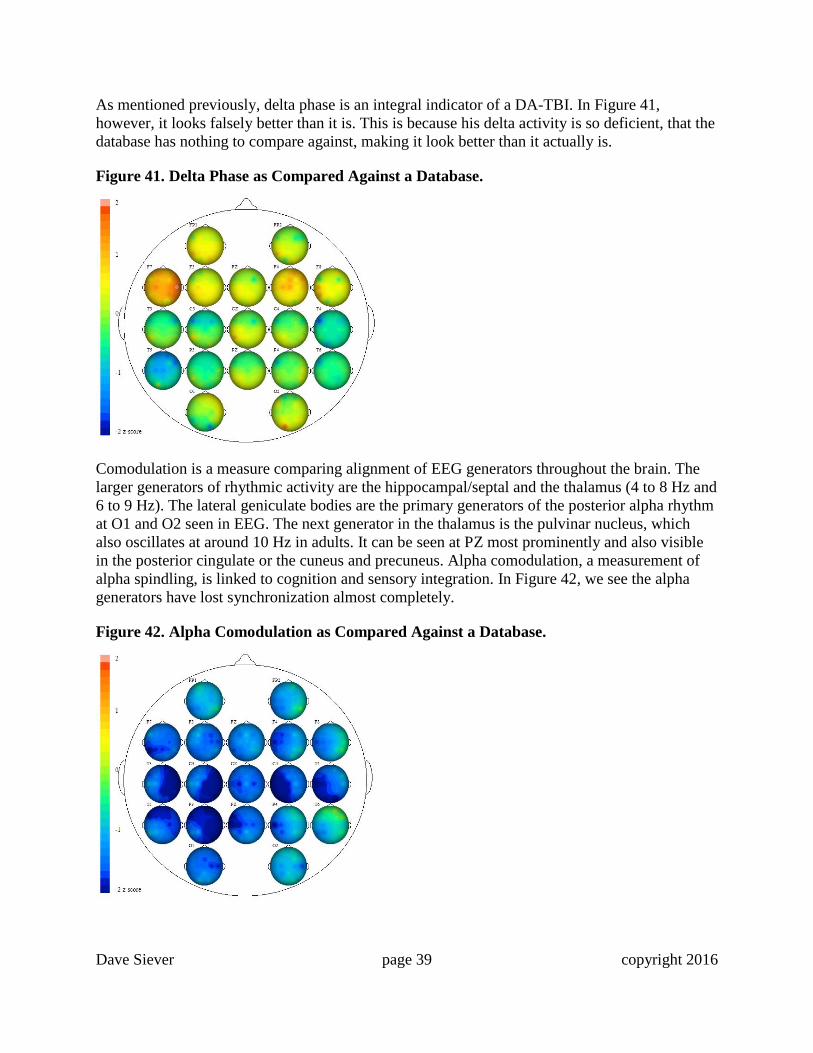
As mentioned previously, delta phase is an integral indicator of a DA-TBI. In Figure 41,
however, it looks falsely better than it is. This is because his delta activity is so deficient, that the
database has nothing to compare against, making it look better than it actually is.
Figure 41. Delta Phase as Compared Against a Database.
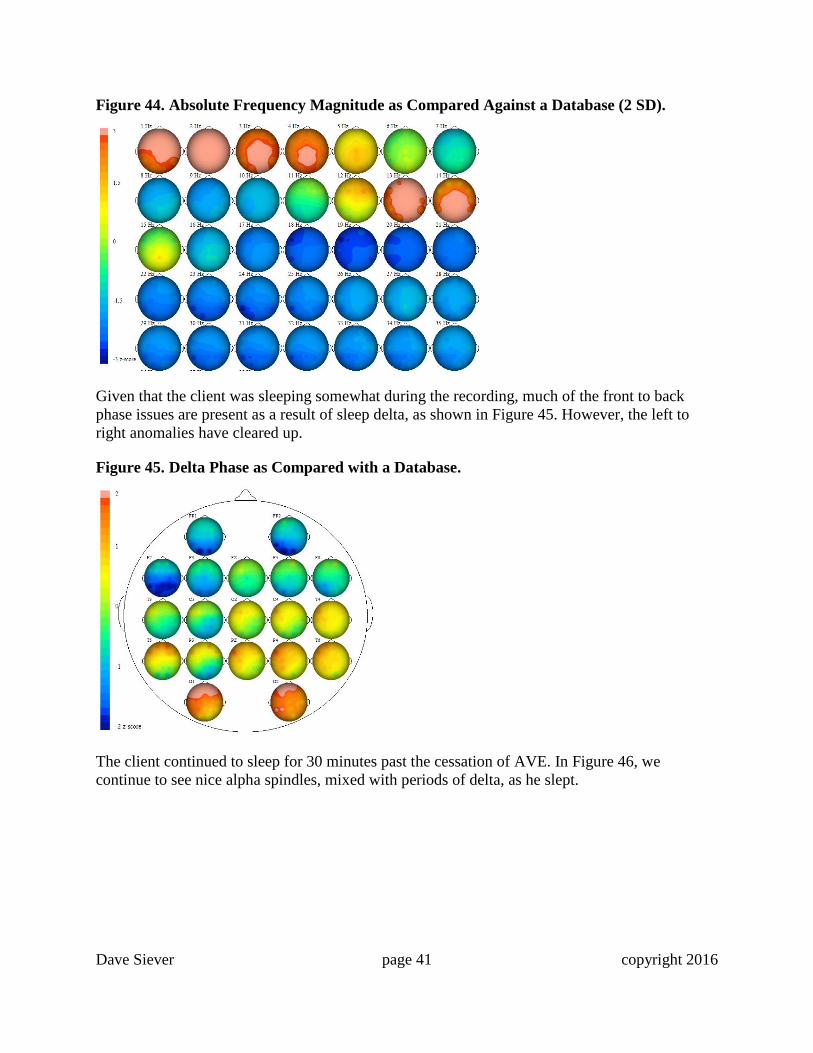
Comodulation is a measure comparing alignment of EEG generators throughout the brain. The
larger generators of rhythmic activity are the hippocampal/septal and the thalamus (4 to 8 Hz and
6 to 9 Hz). The lateral geniculate bodies are the primary generators of the posterior alpha rhythm
at O1 and O2 seen in EEG. The next generator in the thalamus is the pulvinar nucleus, which
also oscillates at around 10 Hz in adults. It can be seen at PZ most prominently and also visible
in the posterior cingulate or the cuneus and precuneus. Alpha comodulation, a measurement of
alpha spindling, is linked to cognition and sensory integration. In Figure 42, we see the alpha
generators have lost synchronization almost completely.
Figure 42. Alpha Comodulation as Compared Against a Database.

Dave Siever page 40 copyright 2016
Given that alcoholics generally show a marker for depression, qEEG analysis shows that
depression-related substance abuse often entails alpha asymmetry between the left and right
dorsal-lateral pre-frontal cortexes (F3 alpha > F4 alpha in the 8 to 11 Hz range typically), so the
Mood Booster protocol was administered even though this asymmetry was not observable in his
qEEG. This protocol delivers stimulation to the left field using frequencies in the alpha band at
10 Hz and stimulation to the right field using frequencies in the beta range of 19 to 21 Hz. It has
been shown that AVE quite effectively inhibits the half frequency of stimulation and therefore
suppresses aberrant alpha. Given that the AVE was administered prior to the analysis being done,
it turned out the client did not show any signs of depression and so the SMR/beta might have
been a better choice. However, alpha/beta stimulation produced remarkable results, nonetheless.
In Figure 43, we see recovered alpha spindling and some delta as he was falling in and out of
sleep.
Figure 43. Raw Waveforms during 20 Minutes of Left-Side 10 Hz and Right-Side 19 to 21
Hz AVE at the 15-Minute Mark.
During alpha/beta AVE, we observe significant increases in the delta and the SMR/low beta
band from 12 to 15 Hz (Figure 44). The delta activity (1 to 4 Hz) is present throughout the qEEG
as the client fell into a deep sleep. We see that the alpha rhythm is fast. Given that slowed
activity in any particular location is not evident, this indicates that he likely never sustained a
significant grey-matter injury often seen in closed-head injuries and stroke – and this is good. We
see the dark blue areas have faded indicating an increase to normalcy across the board of qEEG
activity. Alpha activity is best near 10 Hz. The abundant activity seen at 13 to 14 Hz will
hopefully settle down over time.
Fast Alpha Fast Alpha
Delta Theta
Dave Siever page 41 copyright 2016
Figure 44. Absolute Frequency Magnitude as Compared Against a Database (2 SD).
Given that the client was sleeping somewhat during the recording, much of the front to back
phase issues are present as a result of sleep delta, as shown in Figure 45. However, the left to
right anomalies have cleared up.
Figure 45. Delta Phase as Compared with a Database.
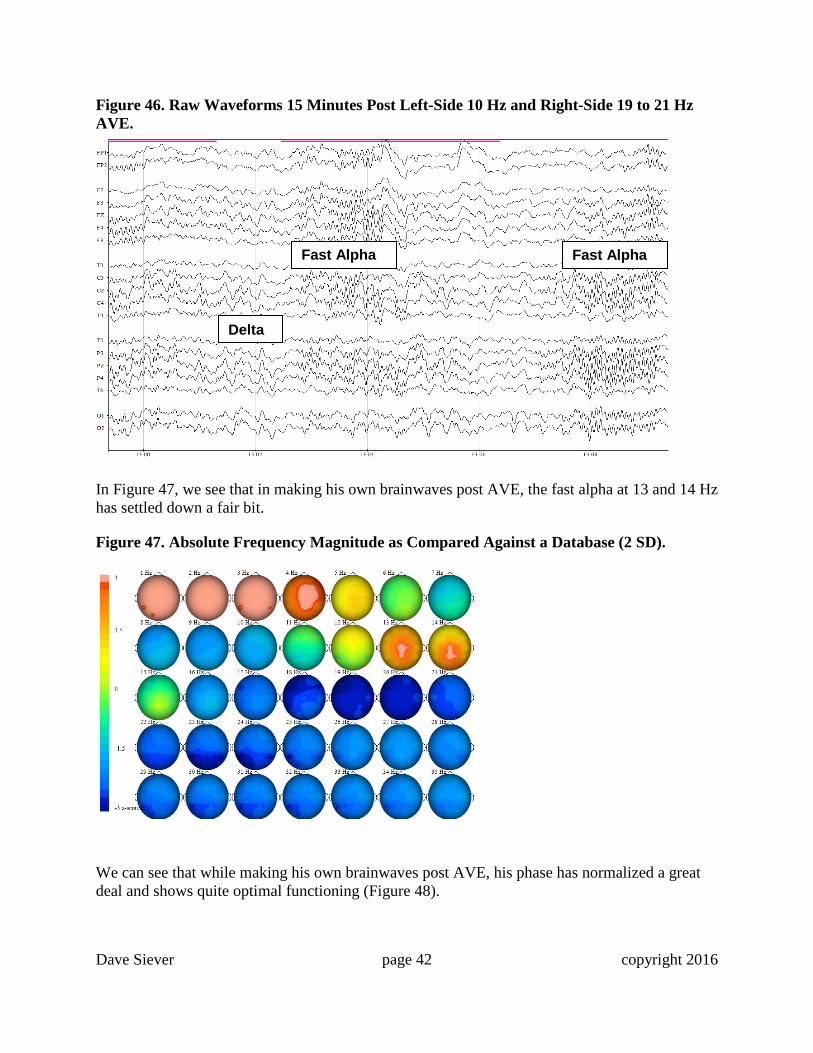
The client continued to sleep for 30 minutes past the cessation of AVE. In Figure 46, we
continue to see nice alpha spindles, mixed with periods of delta, as he slept.
Dave Siever page 42 copyright 2016
Figure 46. Raw Waveforms 15 Minutes Post Left-Side 10 Hz and Right-Side 19 to 21 Hz
AVE.
In Figure 47, we see that in making his own brainwaves post AVE, the fast alpha at 13 and 14 Hz
has settled down a fair bit.
Figure 47. Absolute Frequency Magnitude as Compared Against a Database (2 SD).
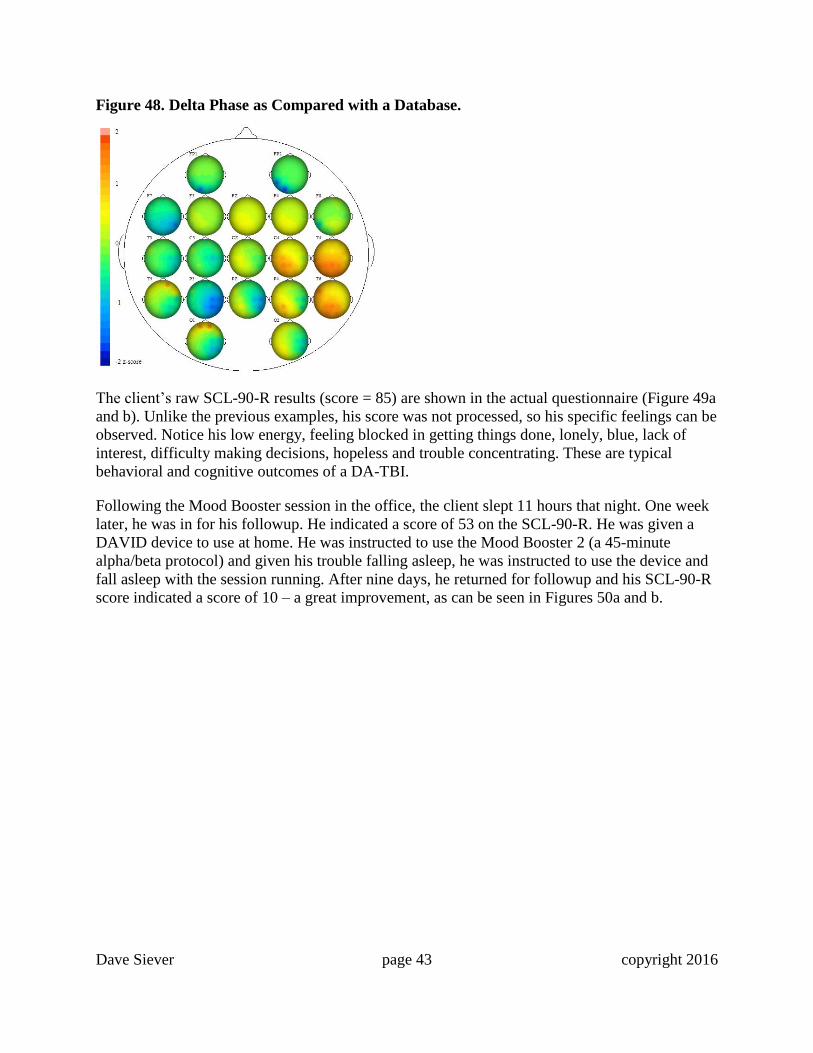
We can see that while making his own brainwaves post AVE, his phase has normalized a great
deal and shows quite optimal functioning (Figure 48).
Fast Alpha Fast Alpha
Delta
Dave Siever page 43 copyright 2016
Figure 48. Delta Phase as Compared with a Database.
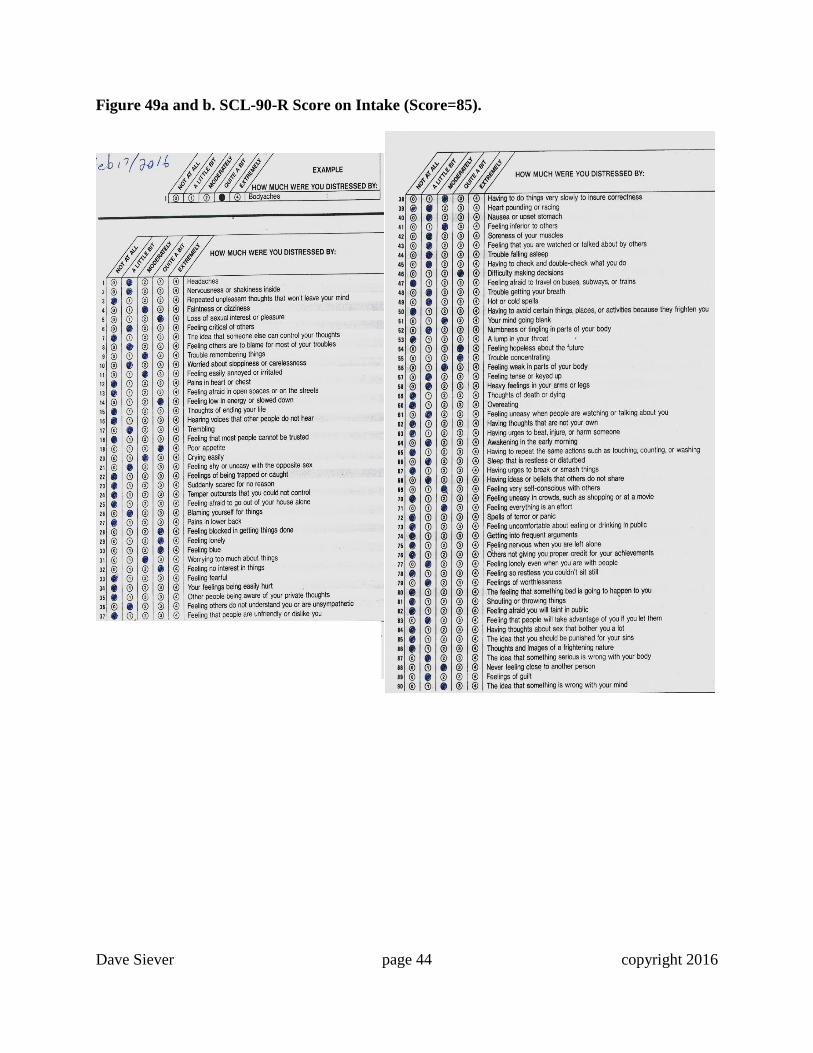
The client’s raw SCL-90-R results (score = 85) are shown in the actual questionnaire (Figure 49a
and b). Unlike the previous examples, his score was not processed, so his specific feelings can be
observed. Notice his low energy, feeling blocked in getting things done, lonely, blue, lack of
interest, difficulty making decisions, hopeless and trouble concentrating. These are typical
behavioral and cognitive outcomes of a DA-TBI.
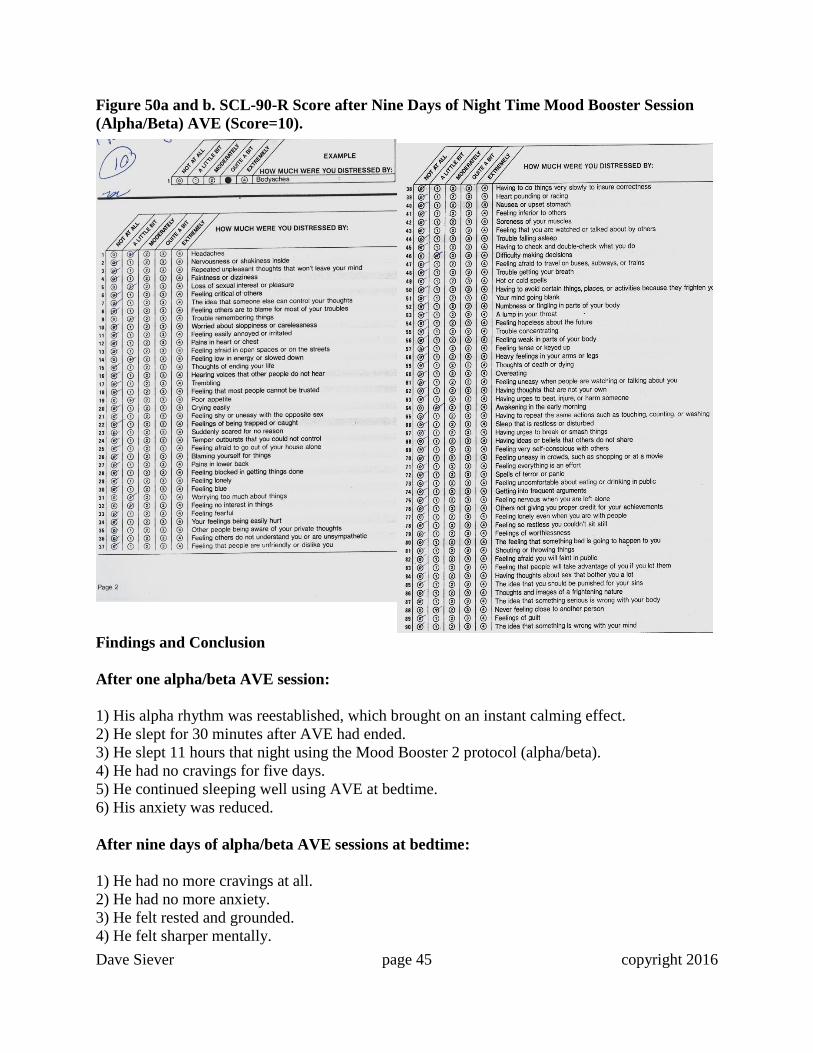
Following the Mood Booster session in the office, the client slept 11 hours that night. One week
later, he was in for his followup. He indicated a score of 53 on the SCL-90-R. He was given a
DAVID device to use at home. He was instructed to use the Mood Booster 2 (a 45-minute
alpha/beta protocol) and given his trouble falling asleep, he was instructed to use the device and
fall asleep with the session running. After nine days, he returned for followup and his SCL-90-R
score indicated a score of 10 – a great improvement, as can be seen in Figures 50a and b.
Dave Siever page 44 copyright 2016
Figure 49a and b. SCL-90-R Score on Intake (Score=85).
Dave Siever page 45 copyright 2016
Figure 50a and b. SCL-90-R Score after Nine Days of Night Time Mood Booster Session
(Alpha/Beta) AVE (Score=10).
Findings and Conclusion
After one alpha/beta AVE session:
1) His alpha rhythm was reestablished, which brought on an instant calming effect.
2) He slept for 30 minutes after AVE had ended.
3) He slept 11 hours that night using the Mood Booster 2 protocol (alpha/beta).
4) He had no cravings for five days.
5) He continued sleeping well using AVE at bedtime.
6) His anxiety was reduced.
After nine days of alpha/beta AVE sessions at bedtime:
1) He had no more cravings at all.
2) He had no more anxiety.
3) He felt rested and grounded.
4) He felt sharper mentally.
Dave Siever page 46 copyright 2016
He has relapsed with alcohol a couple of times since, but gradually gained control over his
emotions, anxiety and cravings. As of August, 2016, he had been completely free of any alcohol
consumption for two months! (Notice his markings on his SCL-90-R was much lighter after nine
days of AVE treatment).
Conclusion
In summary, we do not yet have a complete understanding of the underlying mechanisms of
repetitive stimuli and their effects on the brain. Many events are occurring simultaneously. With
regards to deep brain structures, these findings are both new and exciting. Various Veterans
Affairs’ centers in the USA have noted that troops using AVE not only recover from PTSD, but
also improve cognitively from DA-TBIs relating to shock waves from detonated explosives.
Unfortunately, work with veterans has not had EEG or qEEG backing as proof of concept. Had it
done so, these discoveries may have been revealed a decade ago.
The ability of AVE to jump start the cortico-thalamic loop has been compared with using a set of
electrified paddles to jump start a heart in fibrillation. It is clear that the effects go well beyond
simply “vibrating” the system and involve complex information-rich processes. The fact that
repetitive stimuli can have effects on mental and emotional states speaks to the fact that the
involvement of functional networks is of paramount importance. It’s possible that AVE re-
excites the Rich Club Neuronal Networks in the brain (Hagmann, et al., 2008).
One of the clinical concerns with head injury has to do with treating pre-existing conditions prior
to treating the brain injury. However, in the three DA-TBI cases shown here, the anorexia,
anxiety and binge drinking were ALL side effects of their brain injuries. These are NOT separate
issues. They MUST be considered to be a spectrum of disorders concurrent with a DA-TBI.
Results shown in this article lend credence to the idea that we should be able to create a bottom-
up analysis that puts repetitive stimuli in an objective and physiologically-based framework
which will illuminate why such stimulation has the observed effects on how we think, feel, and
perform in a myriad of situations.
The advantages of using the DAVID devices is that they show effectiveness in restoring brain
function that has been suspended by a DA-TBI. The devices are safe, portable and low cost and
can be sent home with a patient with minimal instruction. Figure 51 shows a DAVID Delight Pro
system, which also includes CES, an electrical stimulation technique which delivers a small
current across the brainstem. CES has been shown to liberate neurotransmitters, particularly
serotonin and endorphins. Over 200 studies (~50 double-blind) have been completed on CES,
covering drug abuse, depression, anxiety and insomnia. It is often used as an adjunct to AVE in
more severe clinical cases involving PTSD, depression and brain injury.

Dave Siever page 47 copyright 2016
Figure 51. DAVID Delight Pro Device.
References
Adrian, E. & Matthews, B. (1934) The Berger rhythm: Potential changes from the occipital lobes
in man. Brain, 57, 355-384.
Amen, D. (1998). Change your brain, change your life. New York: Three Rivers Press.
Anticevic, A., Haut, K., Murray, J., Repovs, G., Yang, G., Diehl, C., McEwen, S., Bearden, C.,
Addington, J., Goodyear, B., Cadenhead, K., Mirzakhanian, H., Cornblatt, B., Olvet, D.,
Mathalon, D., McGlashan, T., Perkins, D., Belger, A., Seidman, L., Tsuang, M., van Erp, T.,
Walker, E., Hamann, S., Woods, S., Qiu, M., & Cannon, T. (2015). Association of thalamic
dysconnectivity and conversion to psychosis in youth and young adults at elevated clinical risk.
JAMA Psychiatry, 72(9):882-891.
Arco, A. & Mora, F. (2009). Neurotransmitters and prefrontal cortex-limbic system interactions:
implications for plasticity and psychiatric disorders. Journal of Neural Transmission, 116, 941-
952.
Balser, M. & Wagner, C. (1960). "Observations of Earth–ionosphere cavity resonances". Nature
188 (4751): 638–641.
Dave Siever page 48 copyright 2016
Berg, K., Mueller, H., Seibel, D., & Siever, D. (1999). Outcome of medical methods, audio-
visual entrainment, and nutritional supplementation in the treatment of fibromyalgia syndrome.
Unpublished manuscript. Edmonton, Alberta, Canada, Mind Alive Inc.
Berg, K. & Siever, D. (2004). The effect of audio-visual entrainment in depressed community-
dwelling senior citizens who fall. Unpublished manuscript. Edmonton, Alberta, Canada, Mind
Alive Inc.
Berg, K. & Siever, D. (2009) A controlled comparison of audio-visual entrainment for treating
seasonal affective disorder (SAD). Journal of Neurotherapy, 13 (3), 166-175.
Bombardier, C., Fann, J., Temkin, N., Esselman, P., Barber, J., & Dikmen, S. (2010). Rates of
Major Depressive Disorder and Clinical Outcomes Following Traumatic Brain Injury. JAMA,
303, 19, 1938-1945.
Budzynski, T. & Tang, J. (1998). Bio-light effects on the electroencephalogram (EEG).
SynchroMed Report. Seattle, WA.
Budzynski, T., Jordy, J., Budzynski, H., Tang, H., & Claypoole, K. (1999). Academic
performance enhancement with photic stimulation and EDR feedback. Journal of Neurotherapy,
3, 11-21.
Budzynski, T., Budzynski, H., & Sherlin, L. (2002). Audio visual stimulation (AVS) in an
Alzheimer's patient as documented by quantitative electroencephalography (QEEG) and low
resolution electromagnetic brain tomography (LORETA) [Abstract]. Journal of Neurotherapy,
6(1), 54.
Budzynski, T., Budzynski, H., & Tang, H. (2007). Brain brightening. In J. R. Evans (Ed.),
Handbook of neurofeedback: Dynamics and clinical applications (pp. 231-265). New York, NY:
Haworth Press.
Carter, J. & Russell, H. (1993). A pilot investigation of auditory and visual entrainment of brain
wave activity in learning disabled boys. Texas Researcher. 4, 65-72.
Chatrian, G., Petersen, M., & Lazarte, J. (1959). Response to clicks from the human brain: Some
depth electrographic observations. Electroencephalography and Clinical Neurophysiology, 12,
479-489.
Collura, T. & Siever, D. (2009). Audio-visual entrainment in relation to mental health and EEG.
In T. Budzynski, H. Budzynski, J. Evans, & A. Abarbanel (Eds.), Introduction to quantitative
EEG and neurofeedback: Advanced theory and applications (2nd ed., pp. 193–223). Boston:
Elsevier.
Dikmen, S., Corrigan, J., Levin, H., Machamer, J., Stiers, W., & Weisskopf, M. (2009).
Cognitive outcome following traumatic brain injury. Journal of Head Trauma Rehabilitation, 24,
430-438.

Dave Siever page 49 copyright 2016
Doidge, N. (2015). The Brain’s Way of Healing. Viking Books. NY, NY.
Donker, D., Njio, L., Storm Van Leeuwen, W., & Wieneke, G. (1978). Interhemispheric
relationships of responses to sine wave modulated light in normal subjects and patients.
Encephalography and Clinical Neurophysiology, 44, 479-489.
Emmons, H. (2010). The Chemistry of Calm. Simon & Schuster.
Erba, G. (2001). Preventing seizures from “Pocket Monsters” A way to control reflex epilepsy.
Neurology, 57 (10), 1747-1748.
Finkelstein, E., Corso, P., & Miller, T. (2006). The incidence and economic burden of Injuries in
the United States. New York: Oxford University Press.
Fox, P. & Raichle, M. (1985). Stimulus rate determines regional blood flow in striate cortex.
Annals of Neurology, 17, (3), 303-305.
Fox, P., Raichle, M., Mintun, M., & Dence, C. (1988). Nonoxidative glucose consumption
during focal physiologic neural activity. Science, 241, 462-464.
Frederick, J., Lubar, J., Rasey, H., Brim, S., & Blackburn, J. (1999). Effects of 18.5 Hz
audiovisual stimulation on EEG amplitude at the vertex. Journal of Neurotherapy, 3 (3), 23-27.
Gagnon, C. & Boersma, F. (1992). The use of repetitive audio-visual entrainment in the
management of chronic pain. Medical Hypnoanalysis Journal, 7, 462-468.
Gervitz, R. (2000). Resonant frequency training to restore homeostasis for treatment of
psychophysiological disorders. Biofeedback, 27, 7-9.
Ginsberg, M. & Busto, R. (1998). Combating hyperthermia in acute stroke: A significant clinical
concern. Stroke, 29, 529-534
Glicksohn, J. (1986). Photic driving and altered states of consciousness: An exploratory study.
Imagination, Cognition and Personality, 6, 167-182.
Hagmann, P., Cammoun, L., Gigandet, X., Meuli, R., Honey, C., Wedeen, V., Sporns, O. (2008).
Mapping the Structural Core of Human Cerebral Cortex. PLoS Biology, 6, (7), 1479-1493.
Hawes, T. (2000). Chapter 14: Using light and sound technology to access “The Zone” in sports
and beyond. In: Siever, D., The Rediscovery of Audio-visual Entrainment Technology.
Edmonton, Alberta, Canada, Mind Alive Inc.
Hear, J. (1971). Field dependency in relation to altered states of consciousness produced by
sensory-overload. Perception and Motor Skills, 33, 192-194.

Dave Siever page 50 copyright 2016
Hebb, D.O. (1961). "Distinctive features of learning in the higher animal". In J. F. Delafresnaye
(Ed.). Brain Mechanisms and Learning. London: Oxford University Press.
Hindfelt, B. (1976). The prognostic significance of subfebrility and fever in ischemic cerebral
infarction. Acta Neurolica Scandanavica, 53, 72–79.
Iaccarino, H., Singer, A., Martorel, A., Rudenko, A., Gao, F., Gillingham, T., Mathys, H., Seo,
J., Kritskiy, O., Abdurrob, F., Adaikkan, C., Canter, R., Rueda, R., Brown, E., Boyden, E., Tsai,
L. (2016). Gamma frequency entrainment attenuates amyloid load and modifies microglia.
Nature, 540, 230-251.
Joyce, M. & Siever, D. (2000). Audio-visual entrainment program as a treatment for behavior
disorders in a school setting. Journal of Neurotherapy, 4 (2), 9-25.
Johnstone, J., Gunkelman, J., & Lunt, J. (2005). Clinical database development: characterization
of EEG phenotypes. Clin. EEG Neurosci. 36, 99-107.
Kaiser, D. & Meckley, A. (2012). An Introduction to neurotherapy. In L. L'Abate and D. A.
Kaiser (eds), Handbook of Technology in Psychology, Psychiatry, and Neurology: Theory,
Research, and Practice. Hauppauge, NY: Nova Science Publishers.
Kaiser, D. (2007). Proprietary C++ software application for Microsoft Windows, Sterman-Kaiser
Imaging Laboratory, Inc., Churchville, NY
Kaiser, D. (2008). Functional connectivity and aging: Comodulation and coherence differences. J
Neurotherapy, 12 (2/3).
Kinney, J., McKay, C., Mensch, A., & Luria, S. (1973). Visual evoked responses elicited by
rapid stimulation. Encephalography and Clinical Neurophysiology, 34, 7-13.
Kroger, W. & Schneider, S. (1959). An electronic aid for hypnotic induction: A preliminary
report. International Journal of Clinical and Experimental Hypnosis, 7, 93-98.
Leonard, K., Telch, M., & Harrington, P. (1999). Dissociation in the laboratory: A comparison of
strategies. Behaviour Research and Therapy, 37, 49-61.
Leonard, K., Telch, M., & Harrington, P. (2000). Fear response to dissociation challenge.
Anxiety, Stress, and Coping, 13, 355-369.
Lewerenz, C. (1963). A factual report on the brain wave synchronizer. Hypnosis Quarterly, 6 (4),
23.
Lim, J., Stafford, B., Nguyen, P., Lien, B., Wang, C., Zukor, K., He, Z. & Huberman, A. (2016).
Neural activity promotes long-distance, target-specific regeneration of adult retinal axons.
Nature Neuroscience, 01 June 2016. Published online 11 July 2016.
Dave Siever page 51 copyright 2016
Lim, L. (2013). The Potential of Intranasal Light Therapy for Brain Stimulation. Presented at the
North American Association for Photobiomodulation Therapy (NAALT) Conference, Palm
Beach Gardens, Florida, February 2, 2013.
Lipowsky, Z. (1975). Sensory and information inputs over-load: behavioral effects.
Comprehensive Psychiatry, 16, 199-221.
Lorensen, T., & Dickson, P. (2004). Quantitative EEG Normative Databases: A Comparative
Investigation. J. Neurotherapy 8, 53-68.
Manns, A., Miralles, R., & Adrian, H. (1981). The application of audiostimulation and
electromyographic biofeedback to bruxism and myofascial pain-dysfunction syndrome. Oral
Surgery, 52 (3), 247-252.
Margolis, B. (1966, June). A technique for rapidly inducing hypnosis. CAL (Certified Akers
Laboratories), 21-24.
Meier, T., Bellgowan, P., Singh, R., Kuplicki, R., Polanski, D., & Mayer, A. (2015). Recovery of
Cerebral Blood Flow Following Sports-Related Concussion. JAMA Neurol.72, 5, 530-538.
Meyer, J., Takashima, S., Terayama, Y., Obara, K., Muramatsu, K., & Weathers, S. (1994). CT
changes associated with normal aging of the human brain. Journal of the Neurological Sciences,
123, 1-2, 200-8.
Micheletti, L. (1999). The Use of Auditory and Visual Stimulation for the Treatment of
Attention Deficit Hyperactivity Disorder in Children. University of Houston. Ph.D. dissertation,
unpublished. Edmonton, Alberta, Canada, Mind Alive Inc
Morse, D. & Chow, E. (1993). The effect of the RelaxodontTM brain wave synchronizer on
endodontic anxiety: evaluation by galvanic skin resistance, pulse rate, physical reactions, and
questionnaire responses. International Journal of Psychosomatics, 40 (1-4), 68-76.
Naeser, M., Zafonte, R., Krengel, M., Martin, P., Frazier, J., Hamblin, M., Knight, J., Meehan,
W. 3rd, & Baker, E. (2014). Significant improvements in cognitive performance post-
transcranial, red/near-infrared light-emitting diode treatments in chronic, mild traumatic brain
injury: open-protocol study. Journal of Neurotrauma, 1;31(11):1008-17.
Palmquist, C. (2014). Brain brightening with audio-visual entrainment for memory enhancement
in the middle-aged and senior population. Ph.D. dissertation, Saybrook University, California.
Ramlackhansingh, A., Brooks, D., Greenwood, R., Bose, S., Turkheimer, F., Kinnunen, K.,
Gentleman, S., Heckemann, R., Gunanayagam, K., Gelosa, G., & Sharp, D. (2011).
Inflammation after trauma: microglial activation and traumatic brain injury. Annals of
Neurology, 70(3), 374–83. doi:10.1002/ana.22455.

Dave Siever page 52 copyright 2016
Regan, D. (1966). Some characteristics of average steady-state and transient responses evoked
by modulated light. Electroencephalogy and Clinical Neurophysiology, 20, 238-248.
Ribbers, G. (2010). Brain injury: Long term outcome after traumatic brain injury. In: J.H. Stone,
M. Blouin (editors), International Encyclopedia of Rehabilitation. Buffalo, NY: Center for
International Rehabilitation Research Information and Exchange (CIRRIE).
Ross-Swain, D. (2007). The Effects of Auditory Stimulation on Auditory Processing Disorder: A
Summary of the Findings. The International Journal of Listening, 27, 2, 140-155.
Russell, H. (1996). Entrainment combined with multimodal rehabilitation of a 43-year-old
severely impaired postaneurysm patient. Biofeedback and Self Regulation, 21, 4.
Ruuskanen-Uoti, H. & Salmi, T. (1994, January). Epileptic seizure induced by a product
marketed as a “Brainwave Synchronizer.” Neurology, 44, 180.
Sadove, M.S. (1963, July). Hypnosis in anaesthesiology. Illinois Medical Journal, 39-42.
Sappey-Marinier, D., Calabrese, G., Fein, G., Hugg, J., Biggins, C., & Weiner, M. (1992). Effect
of photic stimulation on human visual cortex lactate and phosphates using 1H and 31P magnetic
resonance spectroscopy. Journal of Cerebral Blood Flow and Metabolism, 12 (4), 584-592.
Schreckenberger, M., Lange-Asschenfeld, C., Lochmanna, M., Mann, K., Siessmeiera, T.,
Buchholza, H., Bartensteina, P., & Gründer, G. (2004). The thalamus as the generator and
modulator of EEG alpha rhythm: a combined PET/EEG study with lorazepam challenge in
humans. NeuroImage, 22, 2, 637–644.
Scott, G., Peter, J., Hellyer, P., Ramlackhansingh, A., Brooks, D., Matthews, P., & Sharp, D.
(2015). Thalamic inflammation after brain trauma is associated with thalamo-cortical white
matter damage. Journal of Neuroinflammation, 12, 224.
Shatz, Carla J. (1992). "The Developing Brain." Scientific American. United States. pp. 60–67.
Shealy, N., Cady, R., Cox, R., Liss, S., Clossen, W., & Veehoff, D. (1989). A comparison of
depths of relaxation produced by various techniques and neurotransmitters produced by
brainwave entrainment. Shealy and Forest Institute of Professional Psychology. Unpublished
manuscript.
Siever, D. (2003a). Audio-visual entrainment: History and physiological mechanisms.
Biofeedback. 31, 2, 21-27.
Siever, D. (2003b). Audio visual entrainment: Dental studies. Biofeedback, 31(3), 29-32.
Siever, D. (2003c). Applying audio-visual entrainment technology for attention and learning.
Biofeedback, 31, 4, 24-29.
Dave Siever page 53 copyright 2016
Siever, D. (2013). ISNR Proceedings 21st Conference, Dallas, TX.
Steriade, M., Nuñez, A., & Amzica, F. (1993). Intracellular analysis of relations between the
slow (<1 Hz) neocortical oscillations and other sleep rhythms of electroencephalogram. J
Neurosci 13:3266-3283.
Sterman, M. & Kaiser, D. (1999). Topographic analysis of spectral density co-variation:
normative database & clinical assessment. Clinical Neurophysiology, 110 (S1), S80.
Tang, H., Riegel, B., McCurry, S., & Vitiello, M. (2016). Open-Loop Audio-Visual Stimulation
(AVS): A Useful Tool for Management of Insomnia? Applied Psychophysiology and
Biofeedback, 41 (1): 39-46
Teicher, M., Anderson, C., Polcari, A., Glod, C., Maas, L., & Renshaw, P. (2000). Functional
deficits in basal ganglia of children with attention-deficit/hyperactivity disorder shown with
functional magnetic resonance imaging relaxometry. Nature Medicine, 6 (4), 470-473.
Temkin, N., Corrigan, J., Dikmen, S., & Machamer, J. (2009). Social functioning after traumatic
brain injury. Journal of Head Trauma Rehabilitation, 24, 6, 460-467.
Thatcher, R., Walker, R., Gerson, I., & Geisler, F. (1989). EEG discriminant
analyses of mild head trauma. Electroencephalography and Clinical Neurophysiology,
73 (2), 94-106.
Thomas, N. & Siever, D. (1989). The effect of repetitive audio/visual stimulation on
skeletomotor and vasomotor activity. In D. Waxman, D. Pederson, I. Wilkie, & P. Meller (Eds.),
Hypnosis: 4th European Congress at Oxford (pp. 238-245). London, UK: Whurr Publishers.
Thompson, H., Pinto-Martin, J. & Bullock, M. (2003). Neurogenic fever after traumatic brain
injury: an epidemiological study. Journal of Neurology Neurosurgery & Psychiatry, 74, 614–619
Toman, J. (1941). Flicker potentials and the alpha rhythm in man. Journal of Neurophysiology,
4, 51-61.
Townsend, R. (1973). A device for generation and presentation of modulated light stimuli.
Electroencephalography and Clinical Neurophysiology, 34, 97-99.
Trenité, D., Guerrini, R., Binnie, C., & Genton, P. (2001). Visual sensitivity and epilepsy: a
proposed terminology and classification for clinical and EEG phenomenology. Epilepsia, 42(5),
692-701.
Trudeau, D. (1999). A Trial of 18 Hz Audio-Visual Stimulation (AVS) on Attention and
Concentration In Chronic Fatigue Syndrome (CFS). Proceedings of the Annual Conference for
the International Society for Neuronal Regulation.
Dave Siever page 54 copyright 2016
Van Der Tweel, L. & Lunel, H. (1965). Human visual responses to sinusoidally modulated light.
Encephalography and Clinical Neurophysiology, 18, 587-598.
Walter, W. (1956). Color illusions and aberrations during stimulation by flickering light. Nature,
177, 710.
Williams, J., Ramaswamy, D., & Oulhaj, A. (2006). 10 Hz flicker improves recognition memory
in older people. BMC Neuroscience, 7(21), 1-7.
Wolitzky-Taylor, K. & Telch, M. (2010). Efficacy of self-administered treatments for
pathological academic worry: A randomized controlled trial. Behaviour Research and Therapy,
48, 840-850.
Wuchrer, V. (2009). Study on memory and concentration. Conducted at the Psychological
Institute of the Friedrich-Alexander University Erlangen-Nürnberg. Unpublished manuscript.
Edmonton, Alberta, Canada, Mind Alive Inc.

![Traumatic brain injury-induced cerebral microbleeds in the ......diffuse axonal injury [ 7, 9, 25, 44]. Mechanical distortion of endothelial cells leads to disruption of the BBB and](https://img.pdfslide.us/doc/110x75/609a0f431b44ac1253479b51/traumatic-brain-injury-induced-cerebral-microbleeds-in-the-diffuse-axonal.jpg)