Embed Size (px)
Citation preview

UNAUDITED INTERIM REPORT FOR THE6 MONTHS PERIOD ENDED 30 SEPTEMBER 2015
LAPORAN INTERIM TIDAK DIAUDIT BAGI TEMPOH
6 BULAN BERAKHIR 30 SEPTEMBER 2015
MANAGER:BIMB INVESTMENT MANAGEMENT BERHAD (276246-X)

2
Table of Contents
No. Particulars Page
1.0 Manager‟s Report 3
1.1
Fund Name/ Fund Type/ Fund Category/ Fund Investment
Objective/ Fund Performance Benchmark/ Fund Distribution Policy
3
1.2 Performance for the 6 months period ended 30 September
2015 4
1.3 Economic and Market Review 6
1.4 Market Outlook And Strategy 8
1.5 Asset Allocation as at 30 September 2015 10
1.6 Other Performance Data for the 6 months period ended 30 September 2015
11
1.7 Unit Holdings as at 30 September 2015 12
1.8 Policy on Rebate And Soft Commission 12
2.0 Trustee‟s Report 24
3.0 Shariah Committee‟s Report 25
4.0 Directors‟ Declaration Report 26
5.0 Unaudited Financial Statements 27
6.0 Corporate Directory 55

3
1.0 Manager’s Report
Dear Unit Holders,
We are pleased to present the Manager‟s report of BIMB i Flexi Fund for the 6 months
period ended 30 September 2015
1.1 Fund Name/ Fund Type/ Fund Category/ Fund Investment Objective/ Fund
Performance Benchmark/ Fund Distribution Policy
Fund Name BIMB i Flexi Fund
Fund Type Growth
Fund Category Shariah-compliant mixed asset
Fund Investment Objective
The Fund seeks to achieve long term1 capital growth by
investing in a diversified portfolio of Shariah-compliant securities.
Note: Any material change to the investment objective of the
Fund would require Unit Holders’ approvals.
Fund Performance Benchmark
The selected performance benchmark for this Fund is
based on 50:50 ratios of the FBM Emas Shariah Index and 12-month General Investment Account (GIA) rate of Bank Islam Malaysia Berhad.
Note: The benchmark reflects the investment and asset allocation
strategies of the Fund, where the Fund is allowed to invest its asset in Shariah-compliant equities as well as Sukuk and Islamic money market instruments, depending on the
outlook of the market. The risk profile of the Fund is not the same as the risk profile of the performance benchmark.
Fund Distribution Policy
The distribution of income is incidental.
1 Long term in this context refers to a period of more than five (5) years.

4
1.2 Performance for the 6 months period ended 30 September 2015
1.2.1 Performance review
For the period under review, BIMB i Flexi Fund (“the Fund”) registered a return of -12.94%
as compared to its Benchmark‟s return of -3.87%.
The selected performance benchmark for the Fund is 50:50 ratio of the FBM Emas
Shariah Index and 12-month Bank Islam General Investment Account (GIA) rates.
Our strategy has remained to focus on well-established companies that could potentially
pay sustainable dividends and have better prospects for earnings growth and capital
appreciation.
As at 30 September 2015, the Fund has 37.8% exposure to equities, 9.9% to Sukuk and
52.3% in short term investments, cash and cash equivalents. The total Net Asset Value
(NAV) of the Fund is RM10.3 million whereas the NAV per unit of the Fund is RM0.2159.
For the period under review, there were higher cash allocations to the Fund, executed as
a tactical move to preserve unit holders‟ value as adverse market conditions prevailed.
Moving forward, the Manager will resume investing in companies with good earnings
visibility, strong balance sheet, and high dividend yield with good valuation prospects
given the suitable opportunity arises.
For the financial period under review, there were no significant changes to the state of
affairs of the Fund and no circumstances that materially affect the interest of unit holders
that have taken place up to the date of this Manager‟s report.
1.2.2 Total return and average total return for the respective period ended 30 September
2015
BIMB i Flexi Fund Benchmark
Total Return
(%)
Average Total
Return
(%)
Total Return
(%)
Average Total
Return
(%)
1 year Period -12.91 -12.91 -3.25 -3.25
6-Months Period -12.94 N/A -3.87 N/A

5
1.2.3 Total return for the financial year
Total Return
BIMB i Flexi Fund (%)
Benchmark (%)
25 March 2014 (Date of
commencement) to 31 March 2015 -0.80
2.17
Figure 1: Fund and Benchmark Total Return for the financial period from 25 March
2014 (date of commencement) to 31 March 2015
Note:
Data Source : BIMB Investment Management Berhad
Data verified by : Novagni Analytics & Advisory Sdn. Bhd. (formerly known
as Perkasa Normandy Advisers Sdn. Bhd.)
Benchmark : 50: 50 FBM Emas Shariah Index &
12-month General Investment Account (GIA) rate of Bank
Islam Malaysia Berhad

6
Notes:
1. Total Return of the Fund has been verified by Novagni Analytics & Advisory Sdn.
Bhd. (formerly known as Perkasa Normandy Advisers Sdn. Bhd.) (363145-w)
2. Average Total return is derived by this formula:
Total Return
Number of Years under Review
Past performance is not necessarily indicative of future performance and unit prices and
investment returns may go down, as well as up.
1.3 Economic and Market Review
1.3.1 Economy
a) Global
The United States („US‟) Gross Domestic Product (GDP) grew at a rate of 3.7%
in the second quarter of 2015 as compared to 0.6% growth in the first quarter
of 2015 and 2.1% in the fourth quarter of 2014. The second quarter reflected
positive contributions from personal consumption expenditures, exports, state
and local government spending and fixed assets investments. American
households and businesses, backed by gains in employment, rising home
prices and lower fuel costs had contributed to the pace of expansion during the
quarter.
US headline inflation rate declined to -0.1% in August from 0.1% in April 2015
due to lower energy prices. US core inflation rate remained stable at 1.8% from
April thru September 2015.
US unemployment rate fell to 5.1% in August from 5.4% in April 2015,
supported by rising incomes, consumer spending and economic growth
The Euro zone economy grew by 0.4% in the second quarter of 2015 as
compared to 0.5% in the first quarter 2015 and 0.4% in the fourth quarter of
2014.Germany‟s economic growth improved while France and Italy‟s stagnated
as economic disparities between the 19-nation economy persist.
Euro zone‟s annual inflation declined to -0.1% in September from 0.0% in April
2015 as falling energy prices offset rises in industrial goods.
The Euro zone unemployment rate fell to 10.8% in August from 11.1% in April
2015 due to significant improvement of unemployment rate in Italy, Spain and
Portugal.

7
The Chinese economy maintained a growth rate of 7.0% for the second quarter
of 2015, maintaining comparable economic growth rate to the first quarter of
2015 as China‟s ruling Communist party moves towards a more sustainable
economic model based on domestic consumption instead of trade and
investment. China‟s first and second quarter‟s economic growth in 2015 was
the weakest performance since the global economic crisis.
(Source: Bloomberg, Bank Negara Malaysia and RHB Research Institute Sdn Bhd)
b) Local
The Malaysian economy moderated at 4.9 % in the second quarter of 2015
underpinned by notable impact from the Goods and Services Tax (GST), weak
commodity prices and challenging external demand among others. The 2015
second quarter‟s growth was the weakest since 3rd
quarter 2013 compared to
5.6% in the first quarter of 2015 and 5.7% in the fourth quarter of 2014.
Malaysia‟s headline inflation in August increased to 3.1% from 1.8% in April
2015 due to the continued effects of Goods and Services Tax (GST),
implemented on 1st April 2015.
Bank Negara‟s international reserve stood at USD 93.3 billion as at 30
September from US$105.8 billion in April 2015 as a result of capital flight
outside domestic economy. At these levels, the foreign exchange reserves are
sufficient to finance 8.6 months of retained imports and cover 1.2 times the
short term external debt of the nation.
Loan growth gained from 8.8% in April to 9.7% in September 2015 due to
higher lending to real estate, finance, insurance, transport and construction
sectors.
(Source: Bloomberg, Bank Negara Malaysia and RHB Research Institute Sdn Bhd)
1.3.2 Market Review
Equity
FTSE Bursa Malaysia EMAS Shariah Index (“FBM Shariah Index”) commenced the
period under review at 13,122.2 points and reached the highest of 13,388.9 points on
27th April 2015. The FBM Shariah index declined to the lowest of 10,705.63 points on 25
August 2015 before closing at 11,889.1 points on 30th September 2015. For the period
under review, the FBM Shariah index declined 1233.1 points or 9.40% whereas the FBM
KLCI index declined 209.7 points or 11.5% to close at 1,621.0 points. Among the key
factors that contributed to the movement of the index are highlighted below:
Oil price recovery of more than 40% from USD 46.59 on 13 January 2015 to USD
66.78 per barrel on 30 April 2015.

8
In May thru June, continued selling pressure from foreign institutions on mounting
concerns over the outcome of Fitch‟s announcement on Malaysia‟s sovereign
rating together with the possible negative outcome of Greece exiting the Euro
zone.
On 30 Jun 2015, Fitch affirmed Malaysia‟s sovereign credit rating at “A-” with
outlook upgraded to “Stable” on the backs of improving fiscal position, financing
flexibility and favorable GDP growth.
In early August, the Ringgit depreciated further against the US dollar as foreign
investors flee domestic equity and bond markets as fear of U.S interest rate hike
escalated. This was also underpinned by the growing concerns of the domestic
political landscape that continue to remain fluid.
In late August, the Shanghai and Shenzhen stock exchange tumble over
concerns of China‟s economic hard landing that triggered a regional sell-off
throughout Asia. This has subsequently led to a contagion effect in Europe and
the U.S. Worries over China‟s weaker consumption have also eroded oil prices
that plunged to a six-and-a-half year low of USD42.51 per barrel, adding concerns
to the global oil supply glut.
In August alone, the Ringgit had depreciated 9.7% from USD/MYR 3.82 to
USD/MYR 4.19 in light of the unfolding events during the month. Speculation over
the timing of the US interest rate hike remains uncertain in August and poses
further market volatility risk in the near term as the Ringgit continues to devalue.
Collectively, the August sell-off had erased 7% to 10% of global market
capitalization.
The U.S. Federal Reserve declined to raise interest rates in September on the
back of deteriorating global economic conditions given any possibility of monetary
tightening may interrupt global growth. During the month, global markets rallied as
investors‟ price in a deferred interest rate hike by the U.S. Federal Reserve.
(Source: Bloomberg and RHB Research Institute Sdn Bhd)
1.4 Market Outlook and Strategy
Equity
The equity market outlook is expected to experience continual volatility in 2015.
Notwithstanding the QE (Quantitative Easing) in Euro zone and Japan, global
economic recovery will face headwind from multiple aspects including the
strengthening US Dollar, potential US interest rate hike, concerns over China‟s
economic slow-down and currency devaluation along with global oil production
glut affecting oil prices.

9
On the domestic front, the Bursa Malaysia should be supported by domestic
liquidity and strong buying support from local funds. The uncertainties over the US
interest rate hike may induce volatility within the local bourse and incite capital
flight outside Malaysia‟s economic borders, deepening the Ringgit‟s devaluation.
The weakening crude oil price may also pose larger repercussion on the country‟s
oil and gas industry as well as its fiscal position in the near term.
Fundamentally, the Malaysian economy is in good stead to grow at 4.0% to 5.5%
in 2015 as domestic demand remains the growth driver supported by broad-based
capital spending by both the private and public sectors. The Malaysian
government had taken necessary steps to strengthen the economy, stabilise the
currency, and restore investor confidence, affirming that both the banking system
and the capital market are resilient and able to cope with potential economic
uncertainty.
Currently, the Fund is adopting a temporary defensive strategy via maintaining
higher cash portion within its portfolio. The equity strategy remains to invest in
companies with good earnings visibility, strong balance sheet, and high dividend
yield with good valuation prospects given the suitable opportunity arise.
Sukuk
The Ringgit Islamic Debt Securities (IDS) market is expected to be volatile. The
continued reduction in accommodative monetary policy by the Federal Reserve in
the United States and weak Ringgit will be negative for IDS price. However, the
ample liquidity in the domestic market and demand from local institutions will
support the IDS market.
Bank Negara Malaysia decided to maintain the Overnight Policy Rate (OPR) at
3.25% at the Monetary Policy Committee (MPC) meeting 11 September 2015. The
MPC statement stated that future changes in OPR will depend on economic data on
growth and inflation as well as risks of destabilising financial imbalances. Moving
forward, the OPR is expected to remain unchanged at least until Q1 2016.
Headline inflation is expected to trend higher due to GST. The lower fuel prices will
partially offset other domestic cost factors. While month-on-month headline inflation
would be subjected to the volatility in global oil prices, underlying inflation is
expected to remain contained amid the stable domestic demand conditions.
Inflation is expected to be between 2.5% to 3.5% in the next 12 months.
(Source: Bloomberg and RHB Research Institute Sdn Bhd)
10
1.5 Asset Allocation as at 30 September 2015 and as at 31 March 2015
BIMB i Flexi Fund 30.9.2015
(%)
31.3.2015
(%)
Investment in Quoted Securities
Construction 3.0 9.5
Consumer products - 6.5
Finance 2.3 1.4
Industrial products 3.6 10.3
Infrastructure 2.6 12.8
Plantation - 8.9
Properties 10.5 6.1
Technology 1.1 3.4
Trading and services 14.7 34.3
37.8 93.2
INVESTMENT IN ISLAMIC DEBT SECURITIES: 9.9 -
CASH AND SHORT TERM INVESTMENTS: 52.3 6.8
100.0 100.0

11
1.6 Other Performance Data for the 6 months period ended 30 September 2015 and
last financial year ended 31 March 2015
BIMB i Flexi Fund 6 months ended
30.9.2015 31.3.2015
Unit Prices (RM)
Highest NAV per unit for the period 0.2547 0.2555
Lowest NAV per unit for the period 0.2052 0.2269
Net Asset Value (NAV) and Units in
Circulation (UIC) as at the End of the Period
Total NAV (RM) 10,328,044 15,802,032
Units in Circulation (UIC) 47,833,224 63,707,317
NAV per unit (RM) 0.2159 0.2480
Return of Fund (%)(a)
Capital Growth (%)(b)
-12.94 -0.80
Income Return (%)(c)
- -
Return of Fund (%) -12.94 -0.80
Management Expense Ratio (MER) (%)(d)
1.92 1.71
Portfolio Turnover Ratio (PTR) (times)(e)
3.37 11.69
Note:
a) Return of the Fund = NAV per unit (end of period) - 1 NAV per unit (opening of period)
b) Capital Growth = Total Return of the Fund – Income Return
c) Income Return = {Income Distribution per Unit / NAV per Unit @
opening of period} x 100
d) Management
Expenses Ratio
= The Management Expenses Ratio is the total
management expenses expressed as an annual
percentage of the Fund‟s average Net Asset Value
of the Fund calculated on a daily basis.
e) Portfolio Turnover
Ratio
= It represents the average of the total acquisitions
and disposals of the investment in the Fund for the
interim period over the average Net Asset Value of
the Fund calculated on a daily basis.

12
1.7 Unit Holdings as at 30 September 2015
Size of Holdings
BIMB i Flexi Fund
No. of Unit Holders No. of Units Held
No. % Units %
5,000 and below 21 22.34 79,599.41 0.17
5,001 to 10,000 9 9.57 67,145.72 0.14
10,001 to 50,000 45 47.87 1,198,519.48 2.51
50,001 to 500,000 16 17.02 3,008,114.05 6.29
500,001 and above * 3 3.20 43,479,845.87 90.89
Units Held by Holders 94 100.00 47,833,224.53 100.00
Unit Held by Manager 0 0.00 0.00 0.00
Grand Total for The Fund 94 100.00 47,833,224.53 100.00
* Included under this category are nominee accounts
1.8 Policy on Rebate and Soft Commission
Any stock broking rebates received by the Manager will be directed into the account of
the Fund. Any soft commissions received from the broker which are in the form of
research and advisory services that assist in the decision-making process relating to the
Fund‟s investment may be retained by the Manager. The Manager received soft
commission from brokers in the form of research and advisory services during the period
under review.
For and on behalf of
The Manager
BIMB INVESTMENT MANAGEMENT BERHAD
Date: 30 November 2015

13
1.0 Laporan Pengurus
Para Pemegang Unit yang Dihormati,
Kami dengan sukacitanya membentangkan Laporan Pengurus BIMB i Flexi Fund bagi
tempoh 6 bulan berakhir pada 30 September 2015.
1.1 Nama Dana/ Jenis Dana/ Kategori Dana/ Objektif Pelaburan Dana/ Penanda Aras
Dana/ Polisi Agihan Dana
Nama Dana BIMB i Flexi Fund
Jenis Dana Dana Pertumbuhan
Kategori Dana Aset Campuran berlandaskan Shariah
Objektif Pelaburan Dana
Tujuan utama Dana ini adalah untuk mencapai pertumbuhan modal dalam jangkamasa panjang
1 dengan melabur dalam
pelbagai portfolio sekuriti patuh Syariah. Nota: Sebarang perubahan ketara kepada objektif pelaburan Dana memerlukan kelulusan daripada Pemegang Unit.
Penanda Aras Dana
Penanda aras prestasi terpilih bagi dana ini adalah berdasarkan
kepada nisbah 50:50 Indeks FBM Emas Syariah dan pulangan 12 bulan Akaun Pelaburan Am (GIA) Bank Islam Malaysia Berhad.
Nota: Penanda aras ini mencerminkan strategi pelaburan dan peruntukan aset Dana, di mana Dana dibenarkan untuk
melaburkan asetnya ke dalam ekuiti patuh Shariah, Sukuk dan instrumen pasaran wang Islam, bergantung kepada prospek pasaran. Profil risiko Dana tidak sama dengan profil risiko
penanda aras prestasi.
Polisi Agihan
Dana Pengagihan pendapatan adalah sampingan
1 Jangkamasa panjang dalam konteks ini merujuk kepada tempoh lebih dari lima (5) tahun.

14
1.2 Pencapaian Dana bagi tempoh 6 bulan berakhir 30 September 2015.
1.2.1 Kajian Pencapaian
Bagi tempoh kewangan dalam kajian, BIMB i Flexi Fund ("Dana") mencatatkan
pulangan sebanyak -12.94% berbanding penanda arasnya sebanyak -3.87%.
Penanda aras terpilih prestasi Dana ialah nisbah 50:50 Indeks Syariah Emas
FBM dan kadar 12-bulan Akaun Pelaburan Am (GIA) Bank Islam.
Kami mempunyai strategi yang secara konsistennya memberikan tumpuan
kepada syarikat-syarikat yang sudah terkemuka yang berpotensi untuk
membayar dividen secara berkekalan dan mempunyai prospek pertumbuhan
pendapatan dan peningkatan modal yang lebih baik.
Sehingga 30 September 2015, Dana mempunyai pendedahan dalam ekuiti
sebanyak 37.8%, 9.9% dalam Sukuk dan 52.3% dalam pelaburan jangka
pendek dan wang tunai. Jumlah Nilai Aset Bersih (NAB) Dana ialah RM10.3
juta manakala NAB seunit dana ialah RM0.2159.
Bagi tempoh kewangan ini, Dana mendapat peruntukan tunai yang lebih tinggi
sebagai langkah taktikal untuk mengekalkan nilai para pemegang unit
berikutan keadaan pasaran yang terus menjejaskan. Dalam melangkah ke
hadapan, Pengurus akan meneruskan pelaburannya dalam syarikat-syarikat
yang dilihat memberikan pendapatan yang baik, keadaan kewangan yang
kukuh, dan hasil dividen yang tinggi dengan prospek penilaian yang baik
apabila timbulnya peluang-peluang yang sesuai.
Bagi tempoh kewangan ini, tidak terdapat sebarang perubahan ketara dalam
hal ehwal pengurusan Dana dan tiada berlakunya sebarang keadaan yang
menjejaskan kepentingan para pemegang unit sehingga tarikh Laporan
Pengurus disediakan.
1.2.2 Jumlah pulangan dan purata jumlah pulangan bagi setiap tempoh kewangan
berakhir 30 September 2015
BIMB i Flexi Fund Penanda Aras
Jumlah
Pulangan (%)
Purata
Jumlah Pulangan
(%)
Jumlah
Pulangan (%)
Purata
Jumlah Pulangan
(%)
Jangkamasa 1 tahun -12.91 -12.91 -3.25 -3.25
Jangkamasa 6-Bulan -12.94 N/A -3.87 N/A
15
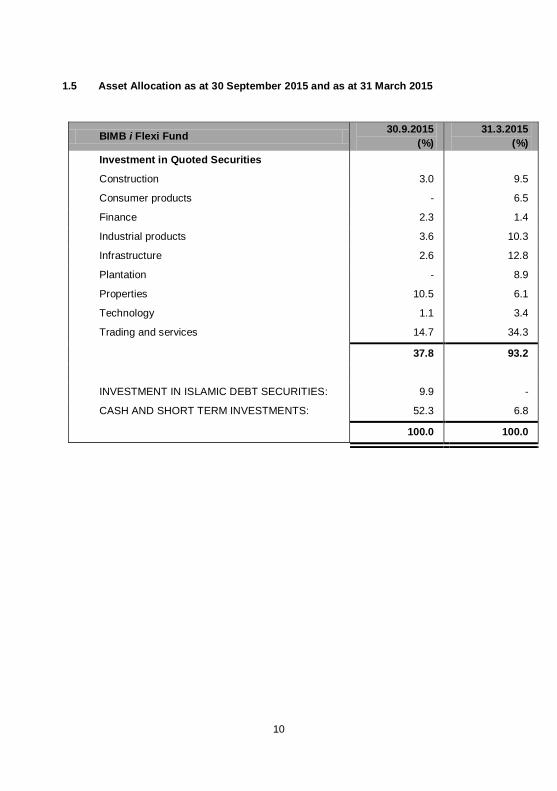
1.2.3 Jumlah pulangan bagi tempoh kewangan
Jumlah Pulangan
BIMB i Flexi Fund (%) Penanda Aras (%)
25 Mac 2014 (Tarikh
pelancaran) hingga 31
Mac 2015
-0.80 2.17
Rajah 1: Pulangan Dana dan Pulangan Penanda Aras bagi tempoh dari 25 Mac 2014
(tarikh pelancaran) sehingga 31 Mac 2015.
Nota:
Sumber Data : BIMB Investment Management Berhad
Data disahkan oleh : Novagni Analytics & Advisor Sdn. Bhd. (dahulunya dikenali
sebagai Perkasa Normandy Managers Sdn.Bhd)
Penanda Aras : 50: 50 Indeks FBM Emas Shariah dan pulangan
12-bulan Akaun Pelaburan Am, Bank Islam Malaysia
Berhad

16
Nota:
1. Jumlah Pulangan telah disahkan oleh Novagni Analytics & Advisor Sdn. Bhd.
(dahulunya dikenali sebagai Perkasa Normandy Managers Sdn. Bhd.) (363145-w)
2. Jumlah Pulangan Purata adalah berpandukan formula berikut:
Jumlah Pulangan
Bilangan Tahun Bawah Kajian
Prestasi masa lepas tidak semestinya menjadi petunjuk prestasi masa depan dan harga
unit serta pulangan pelaburan mungkin turun dan naik.
1.3 Ekonomi dan Kajian Pasaran
1.3.1 Ekonomi
a) Global
Keluaran Dalam Negara Kasar (GDP) Amerika Syarikat ('AS') telah
berkembang sebanyak 3.7% dalam suku kedua 2015 berbanding dengan
pertumbuhan 0.6% dalam suku pertama 2015 dan 2.1% dalam suku keempat
tahun 2014. Prestasi suku kedua mencerminkan sumbangan positif daripada
perbelanjaan penggunaan individu, eksport, perbelanjaan kerajaan negeri dan
tempatan dan aset tetap pelaburan. Isi rumah dan perniagaan negara itu,
peningkatan dalam guna tenaga, kenaikan harga rumah dan kos bahan api
yang lebih rendah telah menyumbang kepada peningkatan kadar
pertumbuhan pada suku tersebut.
Kadar inflasi utama Amerika Syarikat menurun kepada -0.1% dalam bulan
Ogos daripada 0.1% pada bulan April 2015 disebabkan oleh harga bahan api
yang lebih rendah. Kadar inflasi teras AS kekal stabil pada 1.8% daripada
bulan April hingga September 2015
Kadar pengangguran AS jatuh kepada 5.1% dalam bulan Ogos 2015 daripada
5.4% dalam bulan April 2015, disokong oleh peningkatan pendapatan,
perbelanjaan pengguna dan pertumbuhan ekonomi
Ekonomi Euro zon meningkat sebanyak 0.4% pada suku kedua 2015
berbanding 0.5% pada suku pertama 2015 dan 0.4% pada suku keempat
2014. Pertumbuhan ekonomi Jerman bertambah baik manakala Perancis dan
Itali pula terbantut dalam keadaan ketaksamaan ekonomi yang berterusan
dalam kalangan 19 buah negara anggotanya.

17
Kadar inflasi tahunan Zon Euro merosot kepada -0.1% pada bulan September
daripada 0.0% pada bulan April 2015 apabila kejatuhan harga bahan api
mengimbangi kenaikan dalam barangan industri.
Kadar pengangguran zon Euro jatuh kepada 10.8% pada bulan Ogos daripada
11.1% pada bulan September 2015 disebabkan oleh peningkatan yang ketara
dalam kadar pengangguran di Itali, Sepanyol dan Portugal.
Kadar pertumbuhan ekonomi China kekal sebanyak 7.0% pada suku kedua
2015, berada pada paras setanding dengan suku pertama sebelumnya
apabila parti komunis yang memerintah China bergerak ke arah mencapai
model ekonomi yang lebih mampan berdasarkan kepada penggunaan
domestik dan bukan lagi kepada perdagangan dan pelaburan. Kadar
pertumbuhan China pada suku pertama dan kedua tahun 2015 merupakan
yang paling lemah sejak krisis ekonomi global.
(Sumber: Bloomberg, Bank Negara Malaysia dan RHB Research Institute Sdn Bhd)
b) Dalam Negara
Ekonomi Malaysia berkembang dalam kadar yang sederhana iaitu 4.9% pada
suku kedua 2015 diperkuatkan oleh antaranya kesan ketara daripada cukai
barangan dan perkhidmatan (GST), harga komoditi yang lemah dan permintaan
luar yang mencabar antara lain. Pertumbuhan suku kedua 2015 adalah yang
paling lemah sejak suku ketiga 2013 berbanding dengan 5.6% pada suku
pertama 2015 dan 5.7% pada suku keempat 2014.
Kadar inflasi utama Malaysia pada bulan Ogos meningkat kepada 3.1%
daripada 1.8% pada bulan April 2015 disebabkan oleh kesan berterusan Cukai
Barangan dan Perkhidmatan (GST), yang dilaksanakan pada 1 April 2015.
Rizab antarabangsa Bank Negara Malaysia berjumlah AS$93.3 bilion pada 30
September daripada AS$ 105.8 bilion pada bulan April 2015 akibat pengaliran
keluar modal daripada ekonomi domestik. Pada tahap ini, rizab pertukaran
asing adalah memadai untuk membiayai 8.6 bulan import tertangguh dan
menampung 1.2 kali hutang luar negara bagi tempoh jangka pendek.
Pertumbuhan pinjaman meningkat daripada 8.8% pada bulan April 2015
kepada 9.7% pada bulan September 2015 berikutan pinjaman yang diberikan
kepada hartanah, kewangan, insurans, pengangkutan dan pembinaan.
(Sumber: Bloomberg, Bank Negara Malaysia dan RHB Research Institute Sdn Bhd)

18
1.3.2 Kajian Pasaran
Ekuiti
Indeks Syariah EMAS FTSE Bursa Malaysia ("FBM Syariah indeks") memasuki tempoh
kajian pada paras 13,122.2 mata dan mencapai paras tertingginya iaitu 13,388.9 mata
pada 27 April 2015. FBM Syariah indeks jatuh ke paras terendahnya iaitu 10,705.63
mata pada 25 Ogos 2015 sebelum ditutup kepada 11,889.1 mata pada 30 September
2015. Bagi tempoh kajian, FBM Syariah indeks jatuh kepada 1,233,1 mata atau 9.40%
manakala FBM KLCI indeks susut 209.7 mata atau 11.5% untuk ditutup pada 1,621.0
mata. Antara faktor utama yang menyumbang kepada pergerakan indeks dinyatakan di
bawah:
Harga minyak mentah kembali pulih lebih daripada 40% daripada AS$46.59 pada
13 Januari 2015 kepada AS$66.78 setong pada 30 April 2015.
Pada bulan Mei hingga Jun, tekanan jualan terus berlaku daripada institusi-
institusi asing dengan memuncakkan kebimbangan berkaitan keputusan
pengumuman Fitch terhadap penarafan kedaulatan Malaysia bersama-sama
dengan kemungkinan yang negatif Greece keluar dari zon Euro.
Pada 30 Jun 2015, Fitch mengesahkan penarafan kredit berdaulat Malaysia
kepada "A-" dengan tinjauan peningkatan taraf kepada "stabil" berikutan
kedudukan fiskal yang semakin baik , fleksibiliti pembiayaan dan pertumbuhan
KDNK yang menggalakkan.
Pada awal bulan Ogos, nilai mata wang Ringgit terus susut berbanding mata
wang dolar AS kerana pelabur asing “lari” daripada pasaran ekuiti dan bon
domestik kerana meningkatnya kebimbangan mereka terhadap kenaikan kadar
faedah AS. Ini juga disokong oleh kekhuatiran yang semakin meningkat tentang
landskap politik dalam negeri yang terus berubah-ubah.
Pada akhir bulan Ogos, bursa saham Shanghai dan Shenzhen menjunam
disebabkan oleh kebimbangan terhadap kejatuhan mendadak ekonomi China
yang mencetuskan penjualan secara besar-besaran seluruh rantau Asia.
Keadaan ini, membawa kepada kesan penularan di Eropah dan AS.
Kebimbangan terhadap penggunaan yang lemah di China juga menyebabkan
terjejasnya harga minyak yang menjunam ke paras rendah dalam masa enam
setengah tahun iaitu AS$42.51 setong, sekali gus meningkatkan kebimbangan
kepada berlakunya lebihan bekalan minyak global.
Bagi bulan Ogos sahaja, Ringgit telah menyusut sebanyak 9.7% daripada AS$
/RM3.82 kepada AS$ /RM4.19 dengan berlakunya peristiwa-peristiwa tertentu
pada bulan itu. Spekulasi berlakunya kenaikan kadar faedah AS terus tidak
dapat dipastikan dalam bulan Ogos dan mendedahkan lagi kepada berlakunya
risiko turun naik pasaran dalam tempoh terdekat apabila mata wang Ringgit terus
mengalami penurunan nilai. Secara kolektifnya, penjualan besar-besaran yang

19
berlaku pada bulan Ogos, telah menghakis 7% hingga 10% daripada
permodalan pasaran global.
Rizab Persekutuan AS enggan menaikkan kadar faedah pada bulan September
berikutan keadaan ekonomi global yang semakin buruk memandangkan
sebarang usaha mengetatkan dasar kewangan akan menjejas pertumbuhan
global. Pada bulan ini, pasaran global meningkat apabila harga pelabur berada
dalam kenaikan kadar faedah tertunda oleh Rizab Persekutuan AS.
(Sumber: Bloomberg dan RHB Research Institute Sdn Bhd)
1.4 Tinjauan Pasaran dan Strategi
Ekuiti
Tinjauan pasaran ekuiti dijangkakan tidak menentu pada tahun 2015. Meskipun
terdapat kelonggaran kuantitatif (QE) di zon Euro dan Jepun, pemulihan ekonomi
sejagat akan berdepan dengan halangan daripada pelbagai aspek termasuk
pengukuhan dolar AS, potensi kenaikan kadar faedah, kebimbangan tentang
pertumbuhan perlahan ekonomi China dan penilaian semula mata wang
bersama-sama dengan terdapat lebihan pengeluaran minyak mentah yang
menjejaskan harga komoditi itu.
Di dalam negara , Bursa Malaysia dilihat mampu mendapat sokongan mudah
tunai domestik dan juga sokongan belian kukuh daripada dana-dana tempatan.
Ketidakpastian terhadap kenaikan kadar faedah AS boleh menyebabkan
berlakunya keadaan turun naik dalam bursa tempatan dan membawa kepada
modal “lari” keluar daripada sempadan ekonomi Malaysia, menurunkan lagi nilai
mata wang Ringgit. Kejatuhan harga minyak mentah boleh menimbulkan kesan
lebih besar kepada industri minyak dan gas negara ini dan juga kedudukan fiskal
dalam jangka masa terdekat.
Pada dasarnya , ekonomi Malaysia berada dalam kedudukan yang baik untuk
berkembang pada kadar 4.0% hingga 5.5% pada tahun 2015 kerana permintaan
domestik kekal menjadi pemacu kepada pertumbuhan dengan sokongan
perbelanjaan modal secara menyeluruh oleh sektor awam dan swasta. Kerajaan
Malaysia telah mengambil langkah-langkah yang perlu untuk mengukuhkan
ekonomi, menstabilkan mata wang, memulihkan keyakinan pelabur ,
mengesahkan bahawa sistem perbankan dan pasaran modal adalah berdaya
tahan dan berupaya untuk menghadapi sebarang potensi ketidaktentuan
ekonomi .
Pada masa ini, Dana menerima pakai strategi defensif yang bersifat sementara
dengan mengekalkan sebahagian besar pegangan tunai dalam portfolionya .
Strategi ekuiti kekal ditumpukan kepada melabur dalam syarikat-syarikat yang
menawarkan prospek pendapatan yang baik, lembaran kira-kira yang kukuh, dan
hasil dividen yang tinggi dengan prospek penilaian yang baik sekiranya adanya
peluang-peluang yang dirasakan sesuai.

20
Sukuk
Pasaran sekuriti hutang Islam (IDS) dalam mata wang Ringgit dijangka tidak
menentu . Pengurangan berterusan dalam dasar monetari yang akomodatif oleh
Rizab Persekutuan di Amerika Syarikat dan kelemahan nilai mata wang Ringgit
akan memberikan impak negatif kepada harga IDS. Walau bagaimanapun, mudah
tunai yang lebih daripada mencukupi dalam pasaran domestik dan permintaan
institusi domestik akan menyokong pasaran IDS .
Bank Negara memutuskan untuk mengekalkan Kadar Dasar Semalaman (OPR)
pada paras 3.25 % dalam mesyuarat Jawatankuasa Dasar Kewangan (MPC) yang
diadakan pada 11 September 2015. MPC dalam kenyataannya berkata, perubahan
OPR pada masa depan akan bergantung kepada data ekonomi tentang
pertumbuhan dan inflasi serta risiko ketidakstabilan akibat ketidakseimbangan
kewangan yang menjejaskan.
Kadar inflasi utama dijangka berada dalam aliran meningkat berikutan
pelaksanaan GST. Harga bahan api yang lebih rendah akan mengimbangi
sebahagian faktor kos domestic yang lain. Walaupun inflasi bulanan tertakluk
kepada turun naik harga minyak global , inflasi asas dijangka kekal terkawal di
tengah-tengah permintaan dalam negeri yang stabil. Kadar inflasi dijangka antara
2.5% kepada 3.5% dalam tempoh 12 bulan akan datang.
(Sumber: Bloomberg dan RHB Research Institute Sdn Bhd)

21
1.5 Peruntukan Aset pada 30 September 2015 dan pada 31 Mac 2015
BIMB i Flexi Fund 30.9.2015
(%) 31.3.2015
(%)
Pelaburan Sekuriti Tersiarharga:
Pembinaan 3.0 9.5
Barangan pengguna - 6.5
Kewangan 2.3 1.4
Barangan industri 3.6 10.3
Infrastruktur 2.6 12.8
Perladangan - 8.9
Hartanah 10.5 6.1
Teknologi 1.1 3.4
Perdagangan dan perkhidmatan 14.7 34.3
37.8 93.2
PELABURAN DALAM SEKURITI HUTANG SECARA ISLAM: 9.9 -
TUNAI DAN PELABURAN JANGKA PENDEK: 52.3 6.8
100.0 100.0

22
1.6 Lain-lain data prestasi bagi tempoh 6 bulan berakhir 30 September 2015 dan tahun
kewangan berakhir 31 Mac 2015
BIMB i Flexi Fund 6 bulan berakhir
30.9.2015 31.3.2015
Harga Unit (RM)
NAB tertinggi seunit dalam tempoh 0.2547 0.2555
NAB terendah seunit dalam tempoh 0.2052 0.2269
Nilai Aset Bersih (NAB) dan Unit Dalam Edaran (UDE) pada Akhir Tempoh
Jumlah NAB (RM) 10,328,044 15,802,032
Unit Dalam Edaran (UDE) 47,833,224 63,707,317
NAB seunit (RM) 0.2159 0.2480
Jumlah Pulangan Dana (%)(a)
Pertumbuhan Modal (%)(b)
-12.94 -0.80
Pulangan Pendapatan (%)(c)
- -
Pulangan Dana -12.94 -0.80
Nisbah Perbelanjaan Pengurusan (NPP) (%)(d)
1.92 1.71
Nisbah Pusing Ganti Portfolio (NPG) (Kali)(e)
3.37 11.69
Nota:-
a) Pulangan ke atas Dana = Harga seunit (pada akhir tempoh) - 1
Harga seunit (pada awal tempoh)
b) Pertumbuhan Modal = Jumlah Pulangan Dana – Pulangan Pendapatan
c) Pulangan Pendapatan = {Pengagihan Pendapatan Se Unit / NAB se unit
pada awal tempoh} x 100
d) Nisbah Perbelanjaan
Pengurusan
= Ia dikira dengan mengambil jumlah perbelanjaan
pengurusan sepertimana yang dinyatakan sebagai
peratusan tahunan daripada jumlah purata Nilai
Aset Bersih Dana yang dikira pada asas harian.
e) Nisbah Pusing Ganti
Portfolio
= Ia dikira dengan mengambil purata jumlah
perolehan dan pelupusan pelaburan dalam Dana
bagi tempoh setengah tahun dibahagi dengan
purata Nilai Aset Bersih Dana yang dikira pada
asas harian.

23
1.7 Pecahan Pegangan Unit pada 30 September 2015
Saiz Dipegang
BIMB i Flexi Fund
Bilangan Pemegang Unit Bilangan Pegangan Unit
Bilangan % Bilangan Unit %
5,000 dan ke bawah 21 22.34 79,599.41 0.17
5,001 hingga 10,000 9 9.57 67,145.72 0.14
10,001 hingga 50,000 45 47.87 1,198,519.48 2.51
50,001 hingga 500,000 16 17.02 3,008,114.05 6.29
500,001 dan ke atas * 3 3.20 43,479,845.87 90.89
Unit yang dipegang oleh Pemegang unit
94 100.00 47,833,224.53 100.00
Unit yang dipegang oleh Pengurus
0 0.00 0.00 0.00
Jumlah Keseluruhan Dana
94 100.00 47,833,224.53 100.00
* Akaun penama juga termasuk di bawah kategori ini
1.8 Polisi Rebat dan Komisyen Bukan Tunai
Sebarang rebat broker saham yang diterima oleh Pengurus akan dimasukkan ke akaun
Dana. Apa-apa komisyen bukan tunai yang diterima daripada broker dalam bentuk
perkhidmatan penyelidikan dan nasihat yang membantu dalam proses membuat
keputusan yang berkaitan dengan pelaburan Dana boleh disimpan oleh Pengurus.
Pengurus menerima komisen bukan tunai daripada broker dalam bentuk perkhidmatan
penyelidikan dan khidmat nasihat bagi tempoh dalam kajian.
Untuk dan bagi pihak Pengurus
BIMB INVESTMENT MANAGEMENT BERHAD
Tarikh:
Nota:
Laporan ini telah diterjemahkan daripada laporan asal (dalam Bahasa Inggeris). Jika
terdapat perbezaan, sila rujuk kepada laporan Bahasa Inggeris.

24
2.0 Trustee’s Report
To the Unit Holders of
BIMB i FLEXI FUND
We, AMANAHRAYA TRUSTEES BERHAD, have acted as Trustee of BIMB i FLEXI FUND for
the 6-month period ended 30 September 2015. In our opinion, BIMB INVESTMENT
MANAGEMENT BERHAD, the Manager, has managed BIMB i FLEXI FUND in accordance
with the limitations imposed on the investment powers of the management company and the
Trustee under the Deed, other provisions of the Deed, the applicable Guidelines on Unit Trust
Funds, the Capital Markets and Services Act 2007 and other applicable laws for the period
ended on that date.
We are of the opinion that:
(a) the procedures and processes employed by the Manager to value and/or price the
units of BIMB i FLEXI FUND are adequate and that such valuation/pricing is carried
out in accordance with the Deed and other regulatory requirement; and
(b) creation and cancellation of units are carried out in accordance with the Deed and
other regulatory requirement.
Yours faithfully
AMANAHRAYA TRUSTEES BERHAD
____________________
HABSAH BINTI BAKAR
Chief Executive Officer
Kuala Lumpur, Malaysia
Date: 30 November 2015
25
3.0 Shariah Committee’s Report
UNAUDITED INTERIM REPORT FOR THE 6-MONTH PERIOD
ENDED 30 SEPTEMBER 2015
يب ٱب ٱلر س م ـ ب ٱلر ب يب ب س
To the Unit Holders of
BIMB i Flexi Fund
We have acted as the Shariah Committee of BIMB i Flexi Fund.
Our responsibilities are to ensure that the procedures and processes employed by BIMB
Investment Management Berhad and that the provisions of the Deed dated 27 March 2013
are in accordance with Shariah principles.
In our opinion, BIMB Investment Management Berhad has managed BIMB i Flexi Fund in
accordance with Shariah principles and complied with applicable guidelines, rulings or
decisions issued by the Securities Commission pertaining to Shariah matters for the 6-
month period ended 30 September 2015.
In addition, we also confirm that the investment portfolio of BIMB i Flexi Fund comprises
securities which have been classified as Shariah-compliant by the Shariah Advisory
Council (SAC) of the Securities Commission, as the case may be and that all deposits and
money market instruments placed by the Fund are Shariah-compliant.
أعٱي واهللا
For and on behalf of the Shariah Committee
………………………………………………..
USTAZ DR. AHMAD SHAHBARI@SOBRI SALAMON
(Chairman)
………………………………………………..
USTAZ DR. YUSOF RAMLI
(Committee Member)
………………………………………………..
USTAZAH DR. ASMAK AB. RAHMAN
(Committee Member)
Date: 30 November 2015

26
4.0 Directors’ Declaration
UNAUDITED INTERIM REPORT FOR THE 6-MONTH PERIOD
ENDED 30 SEPTEMBER 2015
To the Unit Holders of
BIMB i Flexi Fund
We, Mustapha Bin Hamat and Najmuddin Bin Mohd Lutfi, being two of the directors of the
Manager, BIMB Investment Management Berhad, for BIMB i Flexi Fund do hereby state
that in our opinion, the accompanying Statement of Financial Position, Statement of Profit
or Loss and Other Comprehensive Income, Statement of Changes in Net Asset Value and
Statement of Cash Flows are drawn up so as to give true and fair view of the Statement of
Financial Position of the Fund as at 30 September 2015 and Statement of Profit or Loss
and Other Comprehensive Income, Statement of Changes in Net Asset Value and
Statement of Cash Flows for the period ended on that date.
For and on behalf on the Board of Directors,
……………………………………………
MUSTAPHA BIN HAMAT
(Non Executive Independent Director)
…………………………………………..
NAJMUDDIN BIN MOHD LUTFI
(Chief Executive Officer)
Date: 30 November 2015

27
5.0 Unaudited Financial Statements
Fair Value of Financial Instruments
All Assets and Liabilities of the Fund are carried at fair values. The accounting policies on
recognition and measurement of the fair value for the Fund‟s investments are disclosed in
their respective accounting policies.
The fair value for the amount due to the Manager and Trustee, cash at bank, sundry
receivables, sundry payables and accruals approximate their respective carrying
amounts as at the balance sheet date due to the relatively short-term maturity of these
Financial Instruments.
28
BIMB i Flexi Fund
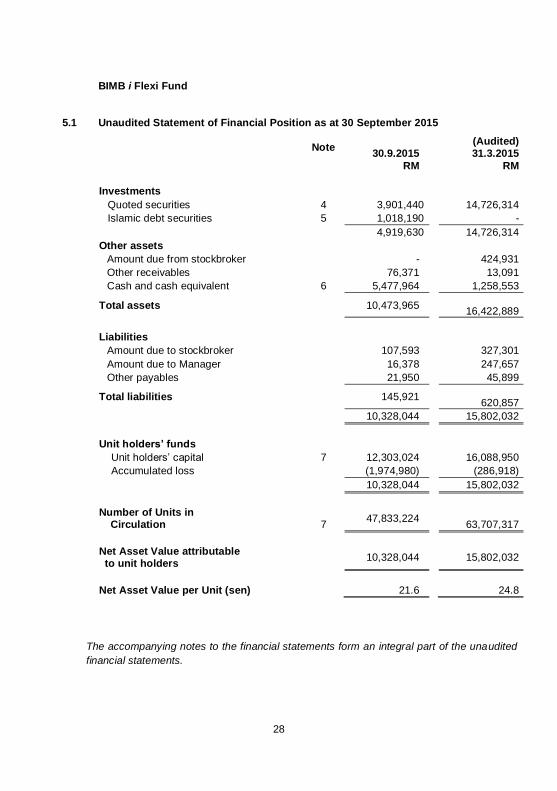
5.1 Unaudited Statement of Financial Position as at 30 September 2015
The accompanying notes to the financial statements form an integral part of the unaudited
financial statements.
Note 30.9.2015
(Audited) 31.3.2015
RM RM
Investments
Quoted securities 4 3,901,440 14,726,314
Islamic debt securities 5 1,018,190 -
4,919,630 14,726,314
Other assets
Amount due from stockbroker - 424,931
Other receivables 76,371 13,091
Cash and cash equivalent 6 5,477,964 1,258,553
Total assets 10,473,965 16,422,889
Liabilities
Amount due to stockbroker 107,593 327,301
Amount due to Manager 16,378 247,657
Other payables 21,950 45,899
Total liabilities 145,921 620,857
10,328,044 15,802,032
Unit holders’ funds
Unit holders‟ capital 7 12,303,024 16,088,950
Accumulated loss (1,974,980) (286,918)
10,328,044 15,802,032
Number of Units in Circulation 7
47,833,224
63,707,317
Net Asset Value attributable to unit holders
10,328,044 15,802,032
Net Asset Value per Unit (sen) 21.6 24.8

29
5.2 Unaudited Statement of Profit or Loss and Other Comprehensive Income for the
6 months financial period ended 30 September 2015
Note 1.4.2015
to 30.9.2015
25.3.2014
to 30.9.2014
RM RM
Income
(Loss) / Gain on sale of shares (1,533,034) 19,498
Gross dividends from shares quoted in Malaysia
270,328 119,521
Income from Islamic debt securities 1,293 -
Income from short term investments 22,031 56,779
Hibah from Al-Wadiah account 490 628
Net unrealised loss from financial instruments at fair value through profit or
loss
(323,730) (317,541)
(1,562,622) (121,115)
Less : Amortisation of premium (371) -
Gross loss (1,562,993) (121,115)
Expenses
Manager‟s fee 8 97,645 98,052
Trustee‟s fee 9 3,255 3,268
Audit fee 4,990 5,040
Tax agent fee 1,501 1,392
Administrative expenses 17,678 5,368
125,069 113,120
Net loss before taxation (1,688,062) (234,235)
Tax expense - -
Net loss after taxation (1,688,062) (234,235)
Other comprehensive income for the period - -
Total comprehensive loss for the period (1,688,062) (234,235)
Total comprehensive loss for the period
consist of:
Realised (loss)/income (1,364,332) 83,306
Unrealised amount (323,730) (317,541)
(1,688,062) (234,235)
The accompanying notes to the financial statements form an integral part of the unaudited
financial statements.

30
5.3 Unaudited Statement of Changes in Net Asset Value for the 6 months financial
period ended 30 September 2015
Unit holders’
capital (RM)
Accumulated
loss (RM)
Total
(RM)
At date of commencement
Movement in unit holders‟
contribution
Creation of units 20,359,284 - 20,359,284
Cancellation of units (346,370) - (346,370)
Total attributable to unit holders
20,012,914 - 20,012,914
Net loss for the period - (234,235) (234,235)
As at 30 September 2014 20,012,914 (234,235) (19,778,679)
Unit holders’
capital (RM)
Accumulated
loss (RM)
Total
(RM)
As at 1 April 2015 16,088,950 (286,918) 15,802,032
Movement in unit holders‟
contribution
Creation of units 33,861 - 33,861
Cancellation of units (3,819,787) - (3,819,787)
Total attributable to unit holders
(3,785,926) - (3,785,926)
Net loss for the period - (1,688,062) (1,688,062)
As at 30 September 2015 12,303,024 (1,974,980) 10,328,044
The accompanying notes to the financial statements form an integral part of the
unaudited financial statements.

31
5.4 Unaudited Statement of Cash Flows for the 6 months financial period ended
30 September 2015
1.4.2015
to 30.9.2015
25.3.2014
to 30.9.2014
RM RM
Cash flows from operating activities
Dividend received 225,396 103,894
Profit received from debt securities and short
term investments 5,465 54,959
Payment for other fee and expenses (15,659) (328)
Audit fee paid (11,000) -
Trustee fee paid (3,472) (2,402)
Manager‟s fee paid (104,172) (72,072)
Proceeds from sale of investments 17,657,258 4,493,722
Purchase of investments (8,483,887) (16,810,772)
Purchase of debt securities (1,018,600) -
Net cash generated/(used in) operating activities
8,251,329 (12,232,999)
Cash flows from financing activities
Creation of units 33,861 20,311,475
Cancellation of units (4,065,779) (337,451)
Net cash (used in)/generated from financing
activities (4,031,918) 19,974,024
Net increase in cash and cash equivalents 4,219,411 7,741,025
Cash and cash equivalents as at 1 April and at date of commencement
1,258,553 -
Cash and cash equivalents at 30 September
5,477,964 7,741,025
Cash and cash equivalents comprise:
Cash at bank 275,878 426,150
Short term investments 5,202,086 7,314,875
5,477,964 7,741,025
The accompanying notes to the financial statements form an integral part of the
unaudited financial statements.
32
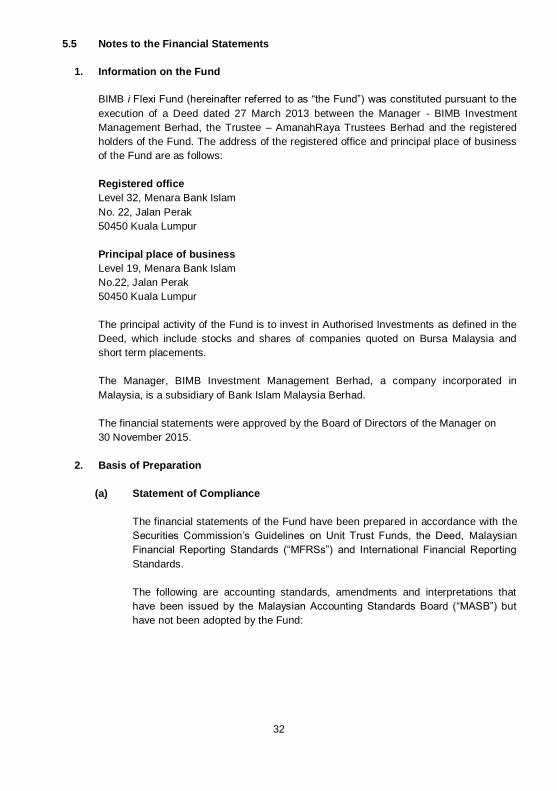
5.5 Notes to the Financial Statements
1. Information on the Fund
BIMB i Flexi Fund (hereinafter referred to as “the Fund”) was constituted pursuant to the
execution of a Deed dated 27 March 2013 between the Manager - BIMB Investment
Management Berhad, the Trustee – AmanahRaya Trustees Berhad and the registered
holders of the Fund. The address of the registered office and principal place of business
of the Fund are as follows:
Registered office
Level 32, Menara Bank Islam
No. 22, Jalan Perak
50450 Kuala Lumpur
Principal place of business
Level 19, Menara Bank Islam
No.22, Jalan Perak
50450 Kuala Lumpur
The principal activity of the Fund is to invest in Authorised Investments as defined in the
Deed, which include stocks and shares of companies quoted on Bursa Malaysia and
short term placements.
The Manager, BIMB Investment Management Berhad, a company incorporated in
Malaysia, is a subsidiary of Bank Islam Malaysia Berhad.
The financial statements were approved by the Board of Directors of the Manager on
30 November 2015.
2. Basis of Preparation
(a) Statement of Compliance
The financial statements of the Fund have been prepared in accordance with the
Securities Commission‟s Guidelines on Unit Trust Funds, the Deed, Malaysian
Financial Reporting Standards (“MFRSs”) and International Financial Reporting
Standards.
The following are accounting standards, amendments and interpretations that
have been issued by the Malaysian Accounting Standards Board (“MASB”) but
have not been adopted by the Fund:

33
2. Basis of Preparation
(a) Statement of Compliance (continued)
MFRSs, Interpretations and amendments effective for annual periods beginning
on or after 1 January 2016
Amendments to MFRS 5, Non-current Assets Held for Sale and Discontinued
Operations (Annual Improvements 2012-2014 Cycle)
Amendments to MFRS 7, Financial Instruments: Disclosures (Annual
Improvements 2012-2014 Cycle)
Amendments to MFRS 10, Consolidated Financial Statements and MFRS 128,
Investments in Associates and Joint Ventures – Sale or Contribution of Assets
between an Investor and its Associate or Joint Venture
Amendments to MFRS 10, Consolidated Financial Statements, MFRS 12,
Disclosure of Interests in Other Entities and MFRS 128, Investments in
Associates and Joint Ventures – Investment Entities: Applying the Consolidation
Exception
Amendments to MFRS 11, Joint Arrangements – Accounting for Acquisitions of
Interests in Joint Operations
MFRS 14, Regulatory Deferral Accounts
Amendments to MFRS 101, Presentation of Financial Statements – Disclosure
Initiative
Amendments to MFRS 116, Property, Plant and Equipment and MFRS 138,
Intangible Assets – Clarification of Acceptable Methods of Depreciation and
Amortisation
Amendments to MFRS 116, Property, Plant and Equipment and MFRS 141,
Agriculture – Agriculture: Bearer Plants
Amendments to MFRS 119, Employee Benefits (Annual Improvements 2012-2014
Cycle)
Amendments to MFRS 127, Separate Financial Statements – Equity Method in
Separate Financial Statements
Amendments to MFRS 134, Interim Financial Reporting (Annual Improvements
2012-2014 Cycle)
MFRSs, Interpretations and amendments effective for annual periods beginning
on or after 1 January 2017
MFRS 15, Revenue from Contracts with Customers
MFRSs, Interpretations and amendments effective for annual periods beginning
on or after 1 January 2018
MFRS 9, Financial Instruments (2014)

34
2. Basis of Preparation (continued)
(a) Statement of Compliance (continued)
The Fund plans to apply the abovementioned accounting standards, amendments
and interpretations:
from the annual period beginning on 1 April 2016 for those accounting
standards, amendments or interpretations that are effective for annual periods
beginning on or after 1 January 2016 except for MFRS 5, MFRS 10, MFRS 11,
MFRS 14, MFRS 116, MFRS 119, MFRS 127 and MFRS 134 which are not
applicable to the Fund.
from the annual period beginning on 1 April 2017 for those accounting
standards, amendments or interpretations that are effective for annual periods
beginning on or after 1 January 2017.
from the annual period beginning on 1 April 2018 for those accounting
standards, amendments or interpretations that are effective for annual periods
beginning on or after 1 January 2018.
The Fund is currently assessing the financial impact of adopting the abovementioned
standards, amendments and interpretations.
(b) Basis of Measurement
The financial statements are prepared on the historical cost basis except as disclosed
in note 3(a).
(c) Functional and Presentation Currency
These financial statements are presented in Ringgit Malaysia (RM), which is the
Fund‟s functional currency.
(d) Use of Estimates and Judgments
The preparation of financial statements in conformity with MFRSs requires
management to make judgments, estimates and assumptions that affect the
application of accounting policies and the reported amounts of assets, liabilities,
income and expenses. Actual results may differ from these estimates.
Estimates and underlying assumptions are reviewed on an ongoing basis. Revisions
to accounting estimates are recognised in the period in which the estimate is revised
and in any future periods effected.
There are no significant areas of estimation uncertainty and critical judgments in
applying accounting policies that have significant effect on the amounts recognised in
the financial statements.

35
3. Significant Accounting Policies
The accounting policies set out below have been applied consistently to the periods
presented in these financial statements, unless otherwise stated.
(a) Financial instruments
(i) Initial recognition and measurement
A financial instrument is recognised in the statement of financial position when,
and only when, the Fund becomes a party to the contractual provisions of the
instrument.
A financial instrument is recognised initially, at its fair value plus, in the case of a
financial instrument not at fair value through profit or loss, transaction costs that
are directly attributable to the acquisition or issue of the financial instrument.
(ii) Financial instrument categories and subsequent measurement
The Fund categories financial instruments as follows:
Financial assets
(a) Financial assets at fair value through profit or loss
Fair value through profit or loss category comprises financial assets that are
held for trading, or financial assets that are specifically designated into this
category upon initial recognition. These include quoted securities and
Islamic debt securities.
Financial assets categorised as fair value through profit or loss are
subsequently measured at their fair values with the gain or loss recognised
in the statement of profit or loss and other comprehensive income.
(b) Financing and receivables
Financing and receivables category are debt instruments that are not
quoted in an active market and these comprises other receivables, amount
due from stockbroker, amount due from Manager, cash at bank and short
term investments. Financial assets categorised as financing and
receivables are subsequently measured at amortised cost using the
effective profit method.
All financial assets except for those measured at fair value through profit or loss,
are subject to review for impairment, Note 3(d).
36
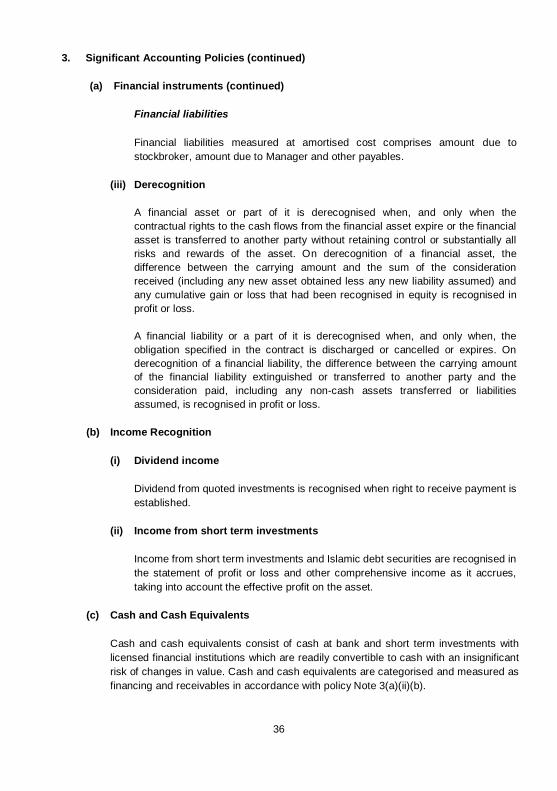
3. Significant Accounting Policies (continued)
(a) Financial instruments (continued)
Financial liabilities
Financial liabilities measured at amortised cost comprises amount due to
stockbroker, amount due to Manager and other payables.
(iii) Derecognition
A financial asset or part of it is derecognised when, and only when the
contractual rights to the cash flows from the financial asset expire or the financial
asset is transferred to another party without retaining control or substantially all
risks and rewards of the asset. On derecognition of a financial asset, the
difference between the carrying amount and the sum of the consideration
received (including any new asset obtained less any new liability assumed) and
any cumulative gain or loss that had been recognised in equity is recognised in
profit or loss.
A financial liability or a part of it is derecognised when, and only when, the
obligation specified in the contract is discharged or cancelled or expires. On
derecognition of a financial liability, the difference between the carrying amount
of the financial liability extinguished or transferred to another party and the
consideration paid, including any non-cash assets transferred or liabilities
assumed, is recognised in profit or loss.
(b) Income Recognition
(i) Dividend income
Dividend from quoted investments is recognised when right to receive payment is
established.
(ii) Income from short term investments
Income from short term investments and Islamic debt securities are recognised in
the statement of profit or loss and other comprehensive income as it accrues,
taking into account the effective profit on the asset.
(c) Cash and Cash Equivalents
Cash and cash equivalents consist of cash at bank and short term investments with
licensed financial institutions which are readily convertible to cash with an insignificant
risk of changes in value. Cash and cash equivalents are categorised and measured as
financing and receivables in accordance with policy Note 3(a)(ii)(b).

37
3. Significant Accounting Policies (continued)
(d) Impairment
Financial assets
All financial assets (except for financial assets categorised as fair value through profit
or loss) are assessed at each reporting date whether there is any objective evidence
of impairment as a result of one or more events having an impact on the estimated
future cash flows of the asset. Losses expected as a result of future events, no matter
how likely, are not recognised.
An impairment loss in respect of financing and receivables is recognised in profit or
loss and is measured as the difference between the asset‟s carrying amount and the
present value of estimated future cash flows discounted at the asset‟s original
effective profit rate. The carrying amount of the asset is reduced through the use of
an allowance account.
(e) Taxation
Tax expense comprises current and deferred tax. Tax expense is recognised in the
statement of profit or loss and other comprehensive income except to the extent that it
relates to items recognised directly in equity, in which case it is recognised in equity.
Current tax is the expected tax payable on the taxable income for the year, using tax
rates enacted or substantively enacted at the statement of financial position date, and
any adjustment to tax payable in respect of previous years.
(f) Unit holders’ capital
The Fund issues cancellable units, which are cancelled at the holder‟s option and are
classified as equity. Cancellable units can be put back to the Fund at any time for
cash equal to a proportionate share of the Fund‟s net asset value. The outstanding
units is carried at the redemption amount that is payable at the financial position date
if the holder exercises the right to put the unit back to the Fund.
Units are created and cancelled at the holder‟s option at prices based on the Fund‟s
net assets value per unit at the time of creation or cancellation. The Fund‟s net assets
value per unit is calculated by dividing the net assets attributable to unit holders with
the total number of outstanding units. In accordance with the Securities Commission‟s
Guidelines on Unit Trust Funds in Malaysia, investment positions are valued based on
the last traded market price for the purpose of determining the net assets value per
unit for creations and cancellations.

38
3. Significant Accounting Policies (continued)
(f) Unit holders’ capital (continued)
The units in the Fund are puttable instruments, classified as equity, which entitle the
unit holders to a pro-rata share of the net asset of the Fund. The units are
subordinated and have identical features. There is no contractual obligation to deliver
cash or another financial asset other than the obligation on the Fund to repurchase
the units. The total expected cash flows from the units are based on the change in the
net asset of the Fund.
(g) Distribution
Distributions are at the discretion of the Fund. A distribution to the Fund‟s unit holders
is accounted for as a deduction from realised reserves except when realised reserves
is not enough, it will be sourced out of distribution equalisation. The mode of the
income distribution is via creation of additional units based on NAV as at the date one
month after the accrual date. A proposed distribution is recognised in equity in the
period in which they are declared.
(h) Net Asset Value
As the distribution is to be reinvested, for this Fund, the Net Assets Value is calculated
after deducting the retained earnings allocated for distribution.

39
3. Significant Accounting Policies (continued)
(i) Fair value measurement
The fair value of an asset or a liability, except for share-based payment and lease
transactions, is determined as the price that would be received to sell an asset or
paid to transfer a liability in an orderly transaction between market participants at the
measurement date. The measurement assumes that the transaction to sell the asset
or transfer the liability takes place either in the principal market or in the absence of a
principal market, in the most advantageous market.
For non-financial asset, the fair value measurement takes into account a market
participant‟s ability to generate economic benefits by using the asset in its highest
and best use or by selling it to another market participant that would use the asset in
its highest and best use.
When measuring the fair value of an asset or a liability, the Fund uses observable
market data as far as possible. Fair value are categorised into different levels in a fair
value hierarchy based on the input used in the valuation technique as follows:
Level 1: quoted prices (unadjusted) in active markets for identical assets or
liabilities that the Fund can access at the measurement date.
Level 2: inputs other than quoted prices included within Level 1 that are
observable for the asset or liability, either directly or indirectly.
Level 3: unobservable inputs for the asset or liability.
The Fund recognises transfers between levels of the fair value hierarchy as of the
date of the event or change in circumstances that caused the transfers.

40
4. Quoted Investments
As at 30 September 2015 Company’s Name
Number of shares
held Cost
RM
Market value
RM
Percentage
of value of funds at
30.9.2015
%
(A) Main Market
(i) Construction
WCT Holdings Bhd. 227,711 448,868 311,964 3.02
(ii) Finance
Syarikat Takaful
Malaysia Bhd. 64,000 256,994 241,280 2.34
(iii) Industrial products
Petronas Chemicals
Group Bhd. 37,000 246,110 227,180 2.20
Petronas Gas Bhd. 6,700 159,396 147,132 1.42
405,506 374,312 3.62
(iv) Infrastructure
DiGi.Com Bhd. 48,100 277,479 266,955 2.58
(v) Properties
Eastern & Oriental
Bhd. 41,000 79,728 64,780 0.63
Malaysian Resources Corporation Bhd.
180,000 303,649 212,400 2.06
Matrix Concepts Holdings Bhd.
74,667 208,760 170,987 1.66
Sunway Bhd. 174,500 612,574 549,675 5.32
UEM Sunrise Bhd. 69,500 149,908 85,485 0.83
1,354,619 1,083,327 10.50
(vi) Technology
Unisem (M) Bhd. 55,000 107,576 111,650 1.08

41
4. Quoted Investments (continued)
As at 30 September 2015
Company’s Name
Number of
shares
held
Cost
RM
Market value
RM
Percentage
of value of funds at
30.9.2015
%
(A) Main Market (continued)
(vii) Trading and services
Axiata Group Bhd. 93,957 645,984 544,951 5.28
Dayang Enterprise Holdings Bhd.
61,000 186,916 102,480 0.99
Sime Darby Bhd. 54,000 502,643 420,660 4.07
Tenaga Nasional Bhd. 29,500 378,709 354,590 3.43
UMW Oil & Gas Corporation Bhd.
76,300 261,553 89,271 0.87
1,975,805 1,511,952 14.64
Total portfolio investment as at 30 September 2015
4,826,847 3,901,440 37.78
42
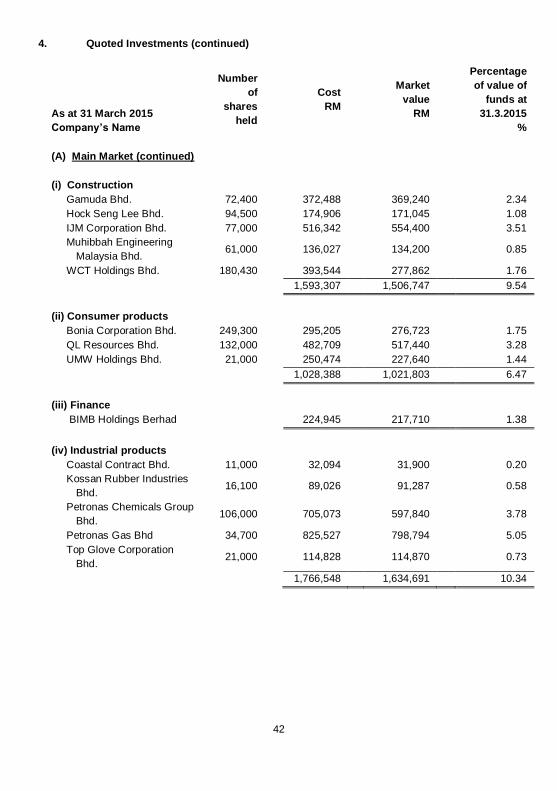
4. Quoted Investments (continued)
As at 31 March 2015
Company’s Name
Number
of
shares
held
Cost
RM
Market
value
RM
Percentage
of value of
funds at
31.3.2015
%
(A) Main Market (continued)
(i) Construction
Gamuda Bhd. 72,400 372,488 369,240 2.34
Hock Seng Lee Bhd. 94,500 174,906 171,045 1.08
IJM Corporation Bhd. 77,000 516,342 554,400 3.51
Muhibbah Engineering
Malaysia Bhd. 61,000 136,027 134,200 0.85
WCT Holdings Bhd. 180,430 393,544 277,862 1.76
1,593,307 1,506,747 9.54
(ii) Consumer products
Bonia Corporation Bhd. 249,300 295,205 276,723 1.75
QL Resources Bhd. 132,000 482,709 517,440 3.28
UMW Holdings Bhd. 21,000 250,474 227,640 1.44
1,028,388 1,021,803 6.47
(iii) Finance
BIMB Holdings Berhad 224,945 217,710 1.38
(iv) Industrial products
Coastal Contract Bhd. 11,000 32,094 31,900 0.20
Kossan Rubber Industries
Bhd. 16,100 89,026 91,287 0.58
Petronas Chemicals Group
Bhd. 106,000 705,073 597,840 3.78
Petronas Gas Bhd 34,700 825,527 798,794 5.05
Top Glove Corporation
Bhd. 21,000 114,828 114,870 0.73
1,766,548 1,634,691 10.34
43
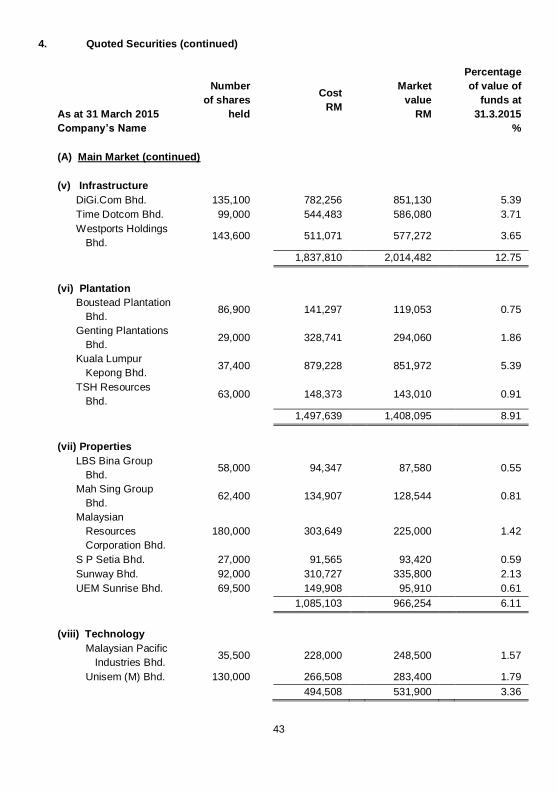
4. Quoted Securities (continued)
As at 31 March 2015
Company’s Name
Number
of shares
held
Cost
RM
Market
value
RM
Percentage
of value of
funds at
31.3.2015
%
(A) Main Market (continued)
(v) Infrastructure
DiGi.Com Bhd. 135,100 782,256 851,130 5.39
Time Dotcom Bhd. 99,000 544,483 586,080 3.71
Westports Holdings
Bhd. 143,600 511,071 577,272 3.65
1,837,810 2,014,482 12.75
(vi) Plantation
Boustead Plantation
Bhd. 86,900 141,297 119,053 0.75
Genting Plantations
Bhd. 29,000 328,741 294,060 1.86
Kuala Lumpur
Kepong Bhd. 37,400 879,228 851,972 5.39
TSH Resources
Bhd. 63,000 148,373 143,010 0.91
1,497,639 1,408,095 8.91
(vii) Properties
LBS Bina Group
Bhd. 58,000 94,347 87,580 0.55
Mah Sing Group
Bhd. 62,400 134,907 128,544 0.81
Malaysian
Resources
Corporation Bhd.
180,000 303,649 225,000 1.42
S P Setia Bhd. 27,000 91,565 93,420 0.59
Sunway Bhd. 92,000 310,727 335,800 2.13
UEM Sunrise Bhd. 69,500 149,908 95,910 0.61
1,085,103 966,254 6.11
(viii) Technology
Malaysian Pacific
Industries Bhd. 35,500 228,000 248,500 1.57
Unisem (M) Bhd. 130,000 266,508 283,400 1.79
494,508 531,900 3.36

44
4. Quoted Securities (continued)
As at 31 March 2015
Company’s Name
Number
of shares
held
Cost
RM
Market
value
RM
Percentage
of value of
funds at
31.3.2015
%
(A) Main Market (continued)
(ix) Trading and services
Axiata Group Bhd. 124,100 856,322 878,628 5.56
Brahims Holdings Bhd. 220,600 367,666 185,304 1.17
Dayang Enterprise
Holdings Bhd. 61,000 186,916 142,130 0.90
Dialog Group Bhd. 395,180 708,624 624,385 3.95
IHH Healthcare Bhd. 61,900 305,917 372,019 2.35
KPJ Healthcare Bhd. 26,000 110,079 110,760 0.70
Maxis Bhd. 49,000 332,582 352,310 2.23
MMC Corporation Bhd. 61,000 151,396 154,330 0.98
Sime Darby Bhd. 71,000 663,796 658,170 4.17
SapuraKencana
Petroleum Bhd. 24,600 103,370 58,056 0.37
Tenaga Nasional Bhd. 56,500 729,986 811,340 5.13
TH Heavy Engineering
Bhd. 372,500 295,523 126,650 0.80
Telekom Malaysia Bhd. 108,000 737,248 785,160 4.97
UMW Oil & Gas
Corporation Bhd. 49,300 195,422 113,390 0.72
Uzma Bhd. 25,000 54,935 52,000 0.33
5,799,782 5,424,632 34.33
Total portfolio investment
as at 31 March 2015 15,328,030 14,726,314 93.19

45
5. Islamic Debt Securities
Issuer
Maturity
date
Rating*
Cost
Market
value
Percentage
of value
of Funds at
30.9.2015
As at 30
September
2015
RM RM %
Malakoff
Power
Berhad 28.12.2016 AA3 1,018,600 1,018,190 9.86
* Rating is either by Rating Agency Malaysia Berhad or Malaysian Rating Corporation
Berhad, whichever applicable.
6. Cash and cash equivalents
As at
30.9.2015 RM
As at 31.3.2015
RM
Short term placements in licensed financial institutions:
Commodity Murabahah 2,502,086 -
Term Deposit-i (Tawarruq)-Special* - 1,013,355
Term Deposit 2,700,000 -
5,202,086 1,013,355
Cash at bank* 275,878 245,198
5,477,964 1,258,553
* Term Deposit-i (Tawarruq) - Special and cash at bank are placed with a related party,
Bank Islam Malaysia Berhad.
7. Unit holders’ Capital
1.4.2015 to 30.9.2015 25.3.2014 to 31.3.2015
No. of units (RM) No. of units (RM)
At beginning of the period/ commencement
63,707,317 16,088,950 - -
Creation during the period/year
152,040 33,861 82,464,105 20,670,986
Cancellation during the
period/year (16,026,133) (3,819,787) (18,756,788) (4,582,036)
At end of the period/year 47,833,224 12,303,024 63,707,317 16,088,950

46
8. Manager’s Fee
For the 6 months financial period ended 30 September 2015, the manager fee is recognised
at a rate of 1.50% per annum (30 September 2014: 1.50% per annum).
The manager‟s fee payable to the Manager of the Fund on a monthly basis, computed
based on the net asset value of the Fund calculated on a daily basis.
9. Trustee’s Fee
For the 6 months financial period ended 30 September 2015, the trustee fee is recognised
at a rate of 0.05% per annum (30 September 2014: 0.05% per annum).
The trustee‟s fee payable to the Trustee of the Fund on a monthly basis, computed based
on the net asset value of the Fund calculated on a daily basis.
10. Units held by related parties
The Manager and related party of the Manager do not hold any unit in the Fund as at 30
September 2015 (30 September 2014: Nil).

47
11. Transactions with related and other stock broking companies
1.4.2015 to 30.9.2015
Value of
trade
Percentage
of total
trade
Brokerage
fee
Percentage
of total
brokerage
fee
RM % RM %
BIMB Securities Sdn. Bhd.* 4,438,507 16.82 15,524 17.31
TA Securities Holdings
Berhad 3,746,833 14.20 12,818 14.29
Maybank Investment Bank
Berhad 3,146,612 11.92 11,929 13.30
Public Investment Bank
Berhad. 3,146,123 11.92 10,944 12.20
RHB Investment Bank
Berhad 3,049,828 11.56 10,373 11.56
Hong Leong Investment
Bank Berhad. 2,316,689 8.78 7,725 8.61
CIMB Investment Bank
Berhad 1,293,751 4.90 5,652 6.30
AmInvestment Bank Berhad 1,293,017 4.90 4,430 4.94
Kenanga Investment Bank
Berhad 1,147,228 4.35 4,083 4.55
Hong Leong Islamic Bank
Berhad 1,018,600 3.86 - -
Others
1,791,834
6.79
6,232
6.94
26,389,022 100.00 89,710 100.00
* Transactions with the related party have been entered into in the normal course of
business and have been transacted at arm‟s lengths basis.

48
11. Transactions with related and other stock broking companies (continued)
25.3.2014 to 30.9.2014
Value of
trade
Percentage
of total trade
Brokerage
fee
Percentage
of total
brokerage
fee
RM % RM %
TA Securities Holdings Bhd. 3,554,013 16.21 12,702 16.34
Maybank Investment Bank
Berhad. 3,268,131 14.91 11,331 14.58
MIDF Amanah Investment
Bank Berhad. 2,929,931 13.37 10,445 13.44
Kenanga Investment Bank
Berhad. 2,502,491 11.42 8,907 11.46
Hong Leong Investment
Bank Berhad. 2,446,519 11.16 8,704 11.20
RHB Investment Bank
Berhad. 2,323,720 10.60 8,198 10.55
CIMB Investment Bank
Berhad. 1,818,933 8.30 6,475 8.33
BIMB Securities Sdn Bhd.* 1,638,382 7.47 5,846 7.52
AmInvestment Bank
Berhad. 1,364,976 6.23 4,855 6.25
Public Investment Bank
Berhad. 73,122 0.33 260 0.33
Others 3,554,013 16.21 12,702 16.34
21,920,218 100.00 77,723 100.00
* Transactions with the related party have been entered into in the normal course of
business and have been transacted at arm‟s lengths basis.
12. Management Expense Ratio (“MER”)
The management expense ratio for the 6 months financial period is 1.92% (30 September
2014: 1.71%). Management expense ratio is the ratio of total fees and recovered expenses
of the Fund expressed as a percentage of the Fund‟s average net asset value. It is a total
management expenses expressed as an annual percentage of the Fund‟s average net
asset value.
13. Portfolio Turnover Ratio (“PTR”)
The portfolio turnover ratio for the 6 months financial period is 3.37 times (30 September 2014: 0.86 times). It represents the average of total acquisitions and disposals of the investments in the Fund for the financial period over the average net asset value of the
Fund calculated on a daily basis.

49
14. Financial Instruments
14.1 Categories of financial instruments
The table below provides an analysis of financial instruments categorised as follows: (a) Financing and receivables (F&R);
(b) Fair value through profit or loss (FVTPL);
(c) Other financial liabilities measured at amortised cost (OL).
Carrying
amount
RM
F&R/
(OL)
RM
FVTPL
RM
As at 30.9 2015
Financial assets
Quoted securities 3,901,440 - 3,901,440
Islamic debt securities 1,018,190 - 1,018,190
Receivables 76,371 76,371 -
Cash and cash equivalents 5,477,964 5,477,964 -
10,473,965 5,554,335 4,919,630
Financial liabilities
Payables (145,921) (145,921) -
As at 31.3.2015
Financial assets
Quoted securities 14,726,314 - 14,726,314
Receivables 438,022 438,022 -
Cash and cash equivalents 1,258,553 1,258,553 -
16,422,889 1,696,575 14,726,314
Financial liabilities
Payables (620,857) (620,857) -
50
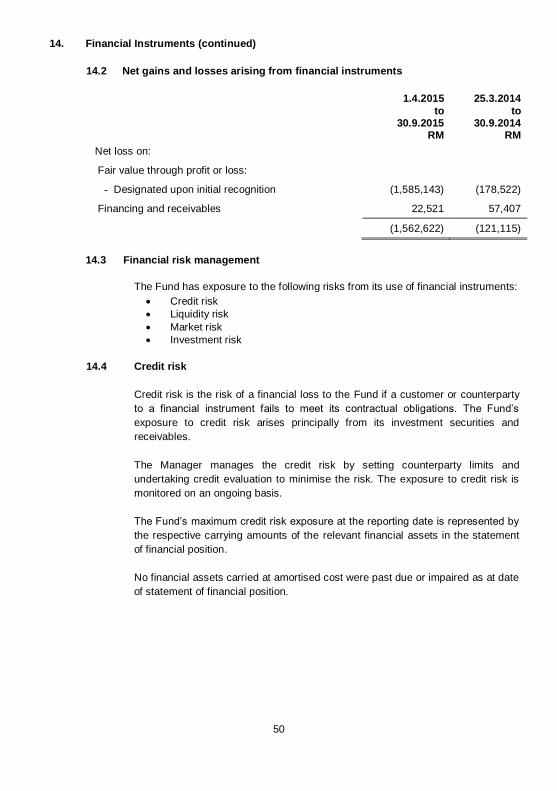
14. Financial Instruments (continued)
14.2 Net gains and losses arising from financial instruments
1.4.2015
to 30.9.2015
RM
25.3.2014
to 30.9.2014
RM
Net loss on:
Fair value through profit or loss:
- Designated upon initial recognition (1,585,143) (178,522)
Financing and receivables 22,521 57,407
(1,562,622) (121,115)
14.3 Financial risk management
The Fund has exposure to the following risks from its use of financial instruments:
Credit risk
Liquidity risk
Market risk
Investment risk
14.4 Credit risk
Credit risk is the risk of a financial loss to the Fund if a customer or counterparty
to a financial instrument fails to meet its contractual obligations. The Fund‟s
exposure to credit risk arises principally from its investment securities and
receivables.
The Manager manages the credit risk by setting counterparty limits and
undertaking credit evaluation to minimise the risk. The exposure to credit risk is
monitored on an ongoing basis.
The Fund‟s maximum credit risk exposure at the reporting date is represented by
the respective carrying amounts of the relevant financial assets in the statement
of financial position.
No financial assets carried at amortised cost were past due or impaired as at date
of statement of financial position.

51
14. Financial Instruments (continued)
14.5 Liquidity risk
Liquidity risk is the risk that the Fund will not be able to meet its financial
obligations as they fall due. The Fund‟s exposure to liquidity risk arises principally
from its various payables which are due within one year.
The Fund maintains sufficient level of liquid assets, after consultation with the
Trustee, to meet anticipated payments and cancellation of units by unit holders.
Liquid assets comprise cash and other instruments, which are capable of being
converted into cash within 7 days.
14.6 Market risk
Market risk is the risk that changes in market prices, such as profit rates and
market prices will affect the Fund‟s financial position or cash flows.
Profit rate risk
The profit rate profile of the Fund‟s significant profit-bearing financial instruments,
based on carrying amounts as at the end of reporting period was:
Fixed rate instruments As at
30.9.2015 RM
As at 31.3.2015
RM
Islamic debt securities 1,018,190 -
Short term investments 5,202,086 1,013,355
Fair value sensitivity analysis for fixed rate instruments
The Fund account for the Islamic debt securities at fair value through profit and
loss.
An increase of 100 basis points (bps) in profit rates at the end of the reporting
period would have decreased on the unit holders‟ fund and statement of
comprehensive income by RM 12,009 (30 September 2014: Nil). A decrease of
100 basis point (bps) in profit rates would have equal but opposite effect on the
equity and statement on comprehensive income respectively.
52
14. Financial Instruments (continued)
14.6 Market risk (continued)
Market price risk
Equity price risk arises from the Fund‟s investments in equity securities.
Risk management objectives, policies and processes for managing the risk
The Fund is restricted to invest in securities issued by any issuer of not more than
a certain percentage of its net asset value. Under such restriction, the exposure
risk to the securities of any issuer is mitigated.
Equity price risk sensitivity analysis
This analysis assumes that all other variables remain constant and the Fund‟s
equity investments are positively correlated to each other.
A 5% strengthening in the equity prices at the end of the reporting period would
have increased the net asset value and unit holders‟ fund by RM195,072 (30
September 2014: RM597,455). A 5% weakening in equity prices would have had
equal but opposite effect on the net asset value and unit holders‟ fund
respectively.
14.7 Investment risk
Investments are bound by regulatory guidelines that govern the maximum
securities holdings and maximum liquid assets holdings.
Investment risks for equity funds consist primarily of market risk, specific stock
risk and liquidity risk. The mechanism employed to control investment risk for
equity funds is by placing acceptable stock and sector limits.
Fixed income risks are in the form of profit rate and credit risks. To manage these
risks, investments will be in investment grade sukuk.
Risk management objectives, policies and processes for managing the risk
The Manager has written policies and guidelines on risk management, which set
out the overall investment risks strategies and general risk management
philosophies. These processes monitor, measure and control risks associated
with the business. Matters relating to investment risks in respect of Funds
portfolio are discussed during the Investment Committee meetings of the
Manager held at least 6 times a year.

53
14. Financial Instruments (continued)
14.8 Fair value of financial instruments
The carrying amounts of cash and cash equivalents, short term receivables and
payables approximate fair values due to the relatively short term nature of these
financial instruments.
The table below analyses financial instruments carried at fair value for which fair
value is disclosed, together with their fair values and carrying amounts shown in
the statement of financial position.
Fair value of financial instruments
carried at fair value
Carrying
Level 1 Level 2 Level 3 Total amount
(RM) (RM) (RM) (RM) (RM)
As at 30.9.2015
Financial assets
Quoted securities 3,901,440 - - 3,901,440 3,901,440
Islamic debt
securities - 1,018,190 - 1,018,190 1,018,190
3,901,440 1,018,190 - 4,919,630 4,919,630
As at 31.3.2015
Financial assets
Quoted securities 14,726,314 - - 14,726,314 14,726,314
Policy on transfer between levels
The fair value of an asset to be transferred between levels is determined as of
the date of the event or change in circumstances that caused the transfer.
Level 1 fair value
Level 1 fair value is derived from quoted price (unadjusted) in active markets for
identical financial assets or liabilities that the entity can access at the
measurement date.
Quoted equities
Quoted equities in Malaysia are valued at a bid price quoted on the Bursa
Malaysia at the date of the statement of financial position, in accordance with the
Deed. Unrealised gain or loss is taken to statement of profit or loss and other
comprehensive income.

54
14. Financial Instruments (continued)
14.8 Fair value of financial instruments (continued)
Level 2 fair value
Level 2 fair value is estimated using inputs other than quoted prices included
within Level 1 that are observable for the financial assets or liabilities, either
directly or indirectly.
Islamic debt securities
Islamic debt securities issued by Malaysian corporations and rated by the Rating
Agency of Malaysia Berhad are carried at fair value. In arising at fair value
gain/loss, the acquisition cost is adjusted for the amortisation of any premium or
accretion of any discount over their par values at the time of acquisition. The
premium or discount is amortised or accreted on a yield to maturity basis over the
remaining term of the investments from the date of acquisition.
This adjusted cost (carrying value) is then revalued to reflect its fair value
(indicative market value) using the fair price quoted by an independent bond
pricing agency (BPA) registered with the Securities Commission. If such
quotations are not available, it will be valued on a weekly basis or as and when
appropriate by reference to average indicative yield quoted by the three reputable
financial institutions in over-the-counter markets as the close of trading. These
institutions include investments banks and commercial banks.
Transfers between Level 1 and Level 2 fair values
There has been no transfer between Level 1 and 2 fair values during the financial
period.
Level 3 fair value
Level 3 fair value is estimated using unobservable inputs for the financial assets
and liabilities.
15. Capital Management
The Fund‟s capital is represented by the unit holders‟ fund in the statement of financial
position. The Manager of the Fund monitors the adequacy of capital on an ongoing basis.
There is no external capital requirement imposed on the Fund.

55
6.0 Corporate Directory
Manager BIMB Investment Management Berhad
Registered Office
Level 32, Menara Bank Islam, No. 22, Jalan Perak
50450, Kuala Lumpur
Business Office
Level 19, Menara Bank Islam, No. 22, Jalan Perak
50450, Kuala Lumpur
Board of Directors
Dato‟ Sri Zukri Samat (Chairman – Non-Executive Non
Independent Director)
Mustapha Hamat (Non-Executive Independent Director)
Dato‟ Ghazali Awang (Non-Executive Independent Director)
Datuk Noripah binti Kamso
(Non-Executive Independent Director)
Dr. Mohd Hatta bin Dagap (Non-Executive Independent
Director)
Malkiat Singh @ Malkit Singh Maan (Non-Executive Non
Independent Director)
Khairul Kamarudin (Non-Executive Non Independent Director)
Najmuddin bin Mohd Lutfi (Chief Executive Officer)
Investment Committee Dato‟ Ghazali Awang (Chairman - Independent Member)
Mustapha Hamat (Independent Member)
Khairul Muzamel Perera Abdullah (Non Independent Member)
Audit Committee Mustapha Hamat (Chairman - Independent Member)
Dato‟ Ghazali Awang (Independent Member)
Malkiat Singh @ Malkit Singh Maan (Non-Executive Non
Independent Member)
Shariah Committee Ustaz Dr. Ahmad Shahbari @ Sobri Salamon
Ustaz Dr. Yusof Ramli
Ustazah Dr. Asmak Ab. Rahman
Company Secretary Norhidayati Mohamat Salim (MIA 27364)
Level 32, Menara Bank Islam, No. 22, Jalan Perak 50450,
Kuala Lumpur
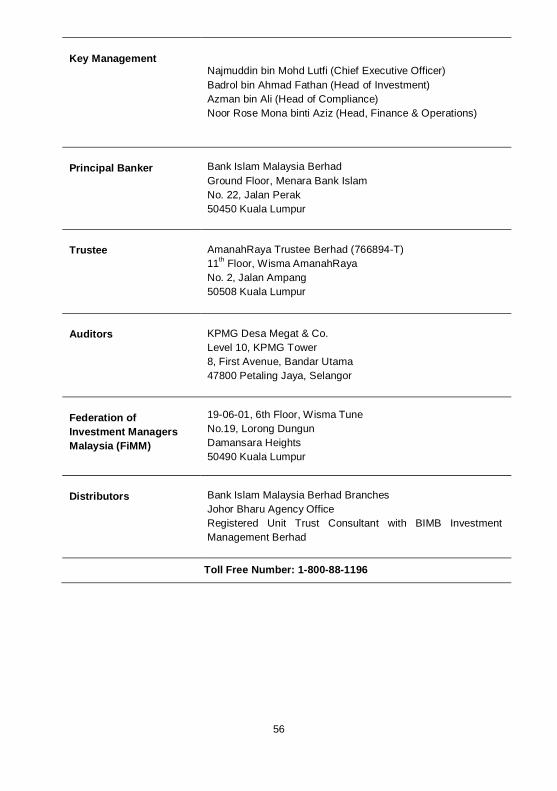
56
Key Management Najmuddin bin Mohd Lutfi (Chief Executive Officer)
Badrol bin Ahmad Fathan (Head of Investment)
Azman bin Ali (Head of Compliance)
Noor Rose Mona binti Aziz (Head, Finance & Operations)
Principal Banker Bank Islam Malaysia Berhad
Ground Floor, Menara Bank Islam
No. 22, Jalan Perak
50450 Kuala Lumpur
Trustee AmanahRaya Trustee Berhad (766894-T)
11th Floor, Wisma AmanahRaya
No. 2, Jalan Ampang
50508 Kuala Lumpur
Auditors KPMG Desa Megat & Co.
Level 10, KPMG Tower
8, First Avenue, Bandar Utama
47800 Petaling Jaya, Selangor
Federation of
Investment Managers
Malaysia (FiMM)
19-06-01, 6th Floor, Wisma Tune
No.19, Lorong Dungun
Damansara Heights
50490 Kuala Lumpur
Distributors Bank Islam Malaysia Berhad Branches
Johor Bharu Agency Office
Registered Unit Trust Consultant with BIMB Investment
Management Berhad
Toll Free Number: 1-800-88-1196

Toll Free Number: 1-800-88-1196Call Centre: 03-26 900 900
Level 19, Menara Bank Islam,No. 22 Jalan Perak, 50450 Kuala Lumpur
03-2161 2524 / 2924
www.bimbinvestment.com.my