Embed Size (px)
Citation preview
MANAGER:BIMB INVESTMENT MANAGEMENT BERHAD (276246-X)
BIMB i GROWTH
INTERIM REPORT FOR THE 6 MONTHS PERIOD ENDED 31 DECEMBER 2018
LAPORAN INTERIM BAGI TEMPOH 6 BULAN BERAKHIR 31 DISEMBER 2018
2
Table of Content
Section Particulars Page
1.0 Manager’s Report 3
1.1
Fund Name/ Fund Type/ Fund Category/ Fund
Investment Objective/ Fund Performance
Benchmark/ Fund Distribution Policy
3
1.2 Performance for the Financial Period from 1 July
2018 to 31 December 2018 4
1.3 Economic and Market Review 7
1.4 Market Outlook And Strategy 9
1.5 Asset Allocation as at 31 December 2018 10
1.6 Other Performance Data for the Financial Period
from 1 July 2018 to 31 December 2018 11
1.7 Unit Holdings as at 31 December 2018 12
1.8 Policy on Rebate And Soft Commission 12
2.0 Trustee’s Report 23
3.0 Shariah Committee’s Report 24
4.0 Directors’ Declaration Report 25
5.0 Financial Statements (Unaudited) 26
6.0 Corporate Directory 55
3
1.0 Manager’s Report
Dear Unit Holders,
We are pleased to present the Manager’s report of BIMB i Growth for the 6 months
period ended 31 December 2018.
1.1 Fund Name/ Fund Type/ Fund Category/ Fund Investment Objective/ Fund
Performance Benchmark/ Fund Distribution Policy
Fund Name BIMB i Growth
Fund Type Aggressive growth
Fund Category Equity
Fund
Investment
Objective
To provide a medium and long term return through capital
appreciation and income distribution.
Note:
The capital appreciation is the primary objective while income
distribution is the secondary objective of the Fund.
Any material change to the investment objective of the Fund
would require Unit Holder’s approval.
Fund
Performance
Benchmark
The selected performance benchmark for this Fund is the
FBM Emas Shariah Index comprising Bursa Malaysia Main
Market stocks that have been classified as Shariah-compliant
securities by the Shariah Advisory Council (SAC) of the
Securities Commission Malaysia. The rationale is to reflect
the Fund’s major proportion of investments in equity of up to
98% of its Net Asset Value (NAV) in Shariah-compliant
securities. Information on the benchmark can be obtained
from Bursa Malaysia website.
Fund
Distribution
Policy
As income distribution is the secondary objective of the Fund,
distribution of income (if any) is incidental.
Payment Mode for
Income
Distribution
Payment into Unit Holders’ bank account or reinvestment.
4
1.2 Performance for the 6 Months Period Ended31 December 2018
1.2.1 Performance review
For the financial period under review, BIMB i Growth (the Fund) registered a return of
-14.52% as compared to its benchmark’s return of -4.86%.
During the period under review, the Fund has an overweight position on the exports
sector, benefitting from organic growth and currency translation effects of the sector.
However, the global technology sell-off that occurred in late 2018 has affected the
performance of the Fund temporarily. The Fund’s performance is forecasted to
recover as the demand for global semi-conductor and technology products would
continue to be robust in the long term.
The Fund was 63.01% invested in equities at the end of the period under review, as
compared to 87.71% invested as at 30 June 2018. The Fund’s total Net Asset Value
(NAV) as at 31 December 2018 was RM28,321,013 or 30.31 sen per unit as
compared to RM35,010,323 or 35.46 sen per unit as at 30 June 2018.
The selected performance benchmark for this Fund is the FBM Emas Shariah Index
comprising Bursa Malaysia Main Market stocks that have been classified as Shariah-
compliant securities by the SAC.
For the period from 1 July 2018 to 31 December 2018, there were no significant
changes to the state of affairs of the Fund and no circumstances that materially affect
the interest of Unit Holders that have taken place up to the date of this Manager’s
Report.
5
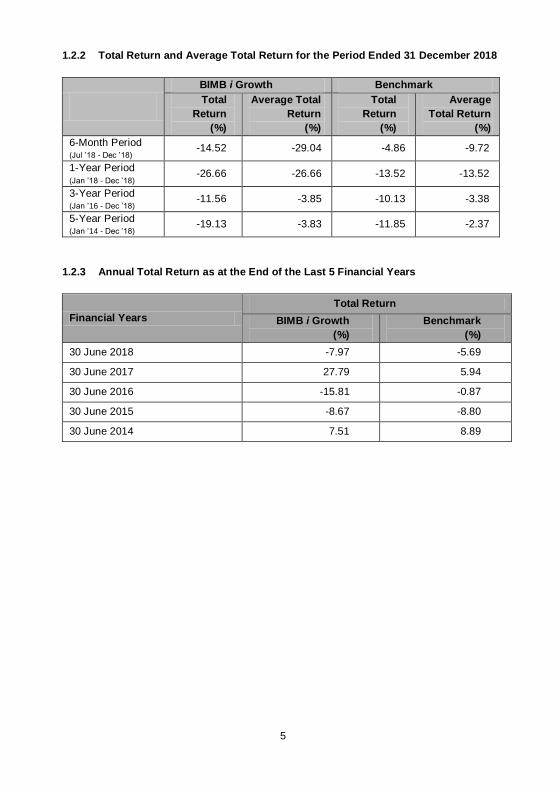
1.2.2 Total Return and Average Total Return for the Period Ended 31 December 2018
BIMB i Growth Benchmark
Total
Return
(%)
Average Total
Return
(%)
Total
Return
(%)
Average
Total Return
(%)
6-Month Period (Jul ’18 - Dec ’18)
-14.52 -29.04 -4.86 -9.72
1-Year Period (Jan ’18 - Dec ’18)
-26.66 -26.66 -13.52 -13.52
3-Year Period (Jan ’16 - Dec ’18)
-11.56 -3.85 -10.13 -3.38
5-Year Period (Jan ’14 - Dec ’18)
-19.13 -3.83 -11.85 -2.37
1.2.3 Annual Total Return as at the End of the Last 5 Financial Years
Financial Years
Total Return
BIMB i Growth
(%)
Benchmark
(%)
30 June 2018 -7.97 -5.69
30 June 2017 27.79 5.94
30 June 2016 -15.81 -0.87
30 June 2015 -8.67 -8.80
30 June 2014 7.51 8.89
6
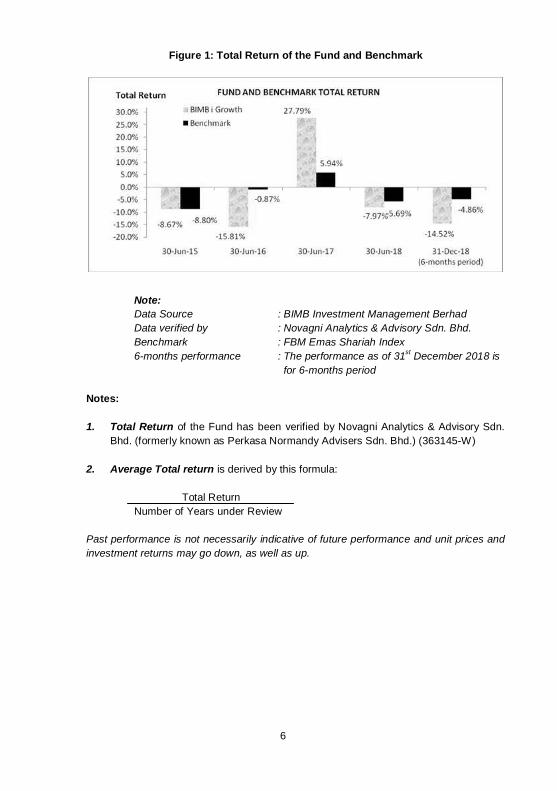
Figure 1: Total Return of the Fund and Benchmark
Note:
Data Source : BIMB Investment Management Berhad
Data verified by : Novagni Analytics & Advisory Sdn. Bhd.
Benchmark : FBM Emas Shariah Index
6-months performance : The performance as of 31st December 2018 is
for 6-months period
Notes:
1. Total Return of the Fund has been verified by Novagni Analytics & Advisory Sdn.
Bhd. (formerly known as Perkasa Normandy Advisers Sdn. Bhd.) (363145-W)
2. Average Total return is derived by this formula:
Total Return
Number of Years under Review
Past performance is not necessarily indicative of future performance and unit prices and
investment returns may go down, as well as up.
7
1.3 Economic and Market Review
1.3.1 Economy
Global
United States (US) Gross Domestic Product (GDP) registered a growth of 3.4%
in the third quarter of 2018 as compared to 4.2% in the second quarter of 2018
and 2.2% in the first quarter of 2018. The third quarter economic growth was
supported by a strong consumer spending, surge in inventory investment and
higher government spending, however was offset by the tariff-related drop in
soybean exports. The US inflation rate fell to 1.9% in December 2018 as
compared to 2.9% in June 2018. US unemployment rate continues to improve to
3.9% in December 2018 as compared to 4.0% in June 2018.
The Euro zone economy grew by 0.2% for the third quarter 2018, compared to
0.4% in the second quarter of 2018 and also 0.4% in the first quarter of 2018.
During the quarter, the Euro zone’s economic performance was significantly
affected by the global trade uncertainty and partly due to Italy’s economy
stagnating growth. The Euro zone inflation rate declined to 1.6% in December
2018 as compared to 2.0% in June 2018. Unemployment in the Euro zone has
fallen to 7.9% in November 2018 from 8.2% in June 2018.
The Chinese economy grew by 6.5% for the third quarter of 2018, compared to
6.7% in the second quarter of 2018 and 6.8% in the first quarter of 2018. The
lower economic expansion was the result of the trade war effect with the U.S.
amid Beijing's efforts to contain debt risk that has affected its domestic economic
growth.
(Source: Bloomberg, Bank Negara Malaysia, and RHB Research Institute Sdn Bhd)
Local
The Malaysian economy grew at 4.4% in the third quarter of 2018, compared to
4.5% the second quarter of 2018 and 5.4% in the first quarter of 2018. The GDP
result was affected by the supply disruption for the mining and agriculture sector,
although the private sector continued to be the primary driver of growth for the
period. Malaysia’s inflation on the other hand declined to 0.2% in December
2018, compared to 0.8% in June 2018, due to a decline in oil prices.
Bank Negara Malaysia’s Monetary Policy Committee (MPC) had decided to
maintain the Overnight Policy Rate (OPR) at 3.25% during its November 2018
meeting to accommodate and support growth prospect for the country. The
international reserves of Bank Negara Malaysia amounted to USD101.4 billion as
at 31 December 2018. The reserves position is sufficient to finance 7.4 months of
retained imports and is 1.0 time the short-term external debt.
8
(Source: Bloomberg, Bank Negara Malaysia and RHB Research Institute Sdn Bhd)
1.3.2 Market Review
Equity
FTSE Bursa Malaysia EMAS Shariah Index (“FBM Shariah Index”) commenced the period
under review at 12,093.21 points and reached the highest point of 12,958.41 on
28 August 2018. Subsequently, the FBM Shariah Index’s declined to the lowest point of
11,068.25 on the 18 December 2018 before closing at 11,504.43 points on 31 December
2018. For the period under review, the FBM Shariah Index was down by 588.78 points or
-4.86%. Among the key factors that contributed to the movement of the index are
highlighted below:
In September 2018, The Federal Open Market Committee (FOMC) increased
the Fed funds rate by 25 basis points to a range between 2% to 2.25%, with one
more hike projection by year end and three possible hikes in 2019. Federal
Reserve officials have collectively revise GDP estimation higher to 3.1% for
2018 and 2.5% for 2019 compared to previous projections.
President Trump and President Xi agreed on a temporary truce after their G20
meeting in end November 2018. As previously announced, the US will
temporarily hold off the increase of 10% tariff to 25% on USD200 billion of
Chinese imports on January 1, 2019. There will be a 90-day period of
negotiation to address trade imbalances, China’s structural changes and other
pertinent issues.
(Source: Bloomberg and RHB Research Institute Sdn Bhd)
9
1.4 Market Outlook and Strategy
For year 2019, the Malaysian equities are expected to be resilient amid a
challenging economic growth environment due to factors such as the outcome of
the US China trade war talks, Federal Reserve rate hike execution, weakening of
global and domestic GDP growth, uneven path of global crude oil price recovery
as well as lower construction sector activity in Malaysia.
For the year, global market sentiment will hinge on two main factors,
predominantly the outcome of US-China trade war talks and the frequency of
Federal Reserve rate hike execution. Overall we are positive that the domestic
export sector that will be the beneficiary of global consumer demand on
technology products. The electrical and electronics sector’s exposure over the
fast growing automotive sector will also gain from the resilient consumer
spending stemming from regional GDP growth, notwithstanding at a lower rate.
Consequently, it is anticipated that, the stronger external demand is expected to
spill over to the domestic economy, while domestic demand will continue to be
the engine of growth, anchored by strong consumer spending and investments.
We project Malaysia’s real GDP growth to be sustained at a moderate 4.6% for
2019 with the Central Bank will likely to maintain the OPR at 3.25% for 2019.
Based on market’s expectation, the FBMKLCI might fall to a low of 1498 pts,
should global equity market performance worsens, while a base case scenario is
pointing towards FBM KLCI target of 1800 pts by year end.
10
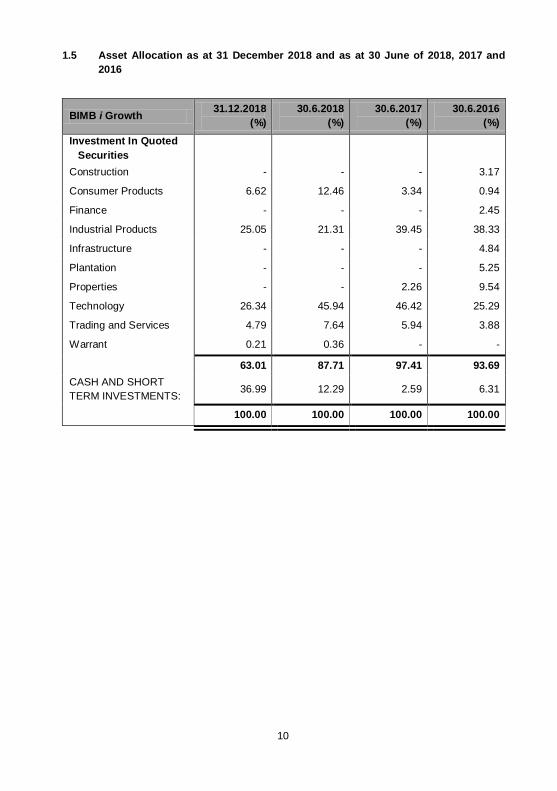
1.5 Asset Allocation as at 31 December 2018 and as at 30 June of 2018, 2017 and
2016
BIMB i Growth 31.12.2018
(%)
30.6.2018
(%)
30.6.2017
(%)
30.6.2016
(%)
Investment In Quoted
Securities
Construction - - - 3.17
Consumer Products 6.62 12.46 3.34 0.94
Finance - - - 2.45
Industrial Products 25.05 21.31 39.45 38.33
Infrastructure - - - 4.84
Plantation - - - 5.25
Properties - - 2.26 9.54
Technology 26.34 45.94 46.42 25.29
Trading and Services 4.79 7.64 5.94 3.88
Warrant 0.21 0.36 - -
63.01 87.71 97.41 93.69
CASH AND SHORT
TERM INVESTMENTS: 36.99 12.29 2.59 6.31
100.00 100.00 100.00 100.00
11
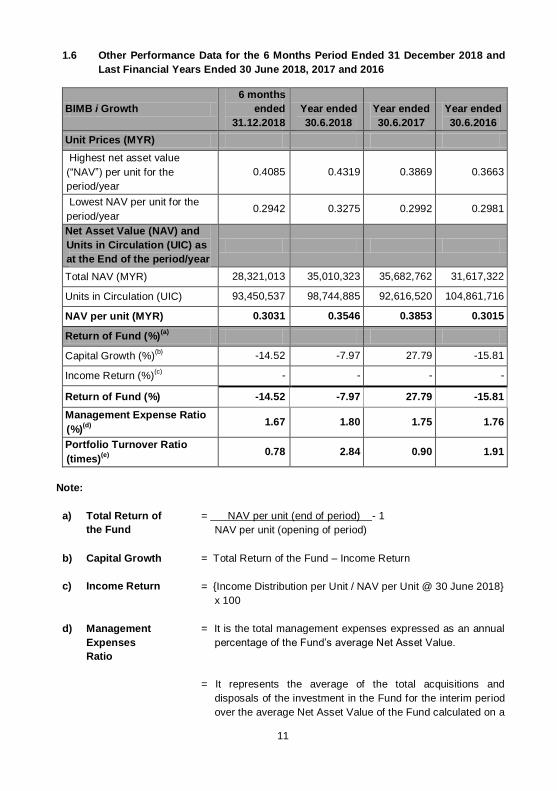
1.6 Other Performance Data for the 6 Months Period Ended 31 December 2018 and
Last Financial Years Ended 30 June 2018, 2017 and 2016
BIMB i Growth
6 months
ended
31.12.2018
Year ended
30.6.2018
Year ended
30.6.2017
Year ended
30.6.2016
Unit Prices (MYR)
Highest net asset value
(“NAV”) per unit for the
period/year
0.4085 0.4319 0.3869 0.3663
Lowest NAV per unit for the
period/year 0.2942 0.3275 0.2992 0.2981
Net Asset Value (NAV) and
Units in Circulation (UIC) as
at the End of the period/year
Total NAV (MYR) 28,321,013 35,010,323 35,682,762 31,617,322
Units in Circulation (UIC) 93,450,537 98,744,885 92,616,520 104,861,716
NAV per unit (MYR) 0.3031 0.3546 0.3853 0.3015
Return of Fund (%)(a)
Capital Growth (%)(b)
-14.52 -7.97 27.79 -15.81
Income Return (%)(c)
- - - -
Return of Fund (%) -14.52 -7.97 27.79 -15.81
Management Expense Ratio
(%)(d)
1.67 1.80 1.75 1.76
Portfolio Turnover Ratio
(times)(e)
0.78 2.84 0.90 1.91
Note:
a) Total Return of
the Fund
= NAV per unit (end of period) - 1
NAV per unit (opening of period)
b) Capital Growth = Total Return of the Fund – Income Return
c) Income Return = {Income Distribution per Unit / NAV per Unit @ 30 June 2018}
x 100
d) Management
Expenses
Ratio
= It is the total management expenses expressed as an annual
percentage of the Fund’s average Net Asset Value.
= It represents the average of the total acquisitions and
disposals of the investment in the Fund for the interim period
over the average Net Asset Value of the Fund calculated on a
12
daily basis.
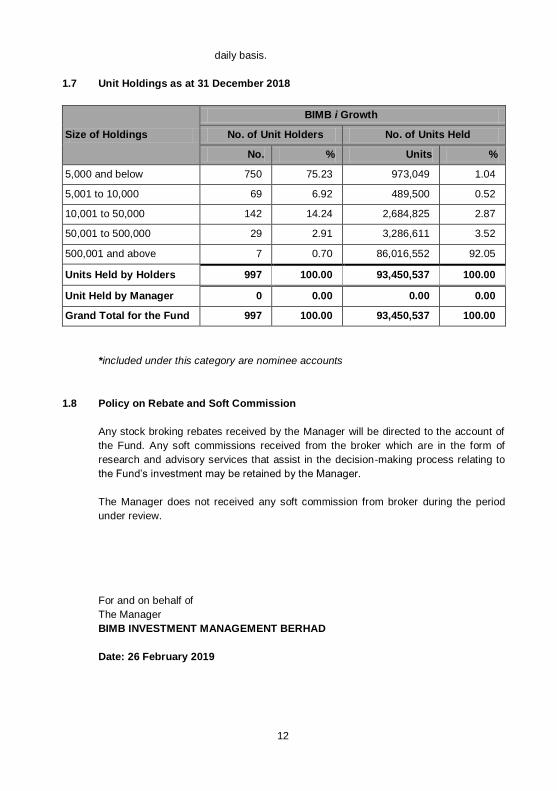
1.7 Unit Holdings as at 31 December 2018
Size of Holdings
BIMB i Growth
No. of Unit Holders No. of Units Held
No. % Units %
5,000 and below 750 75.23 973,049 1.04
5,001 to 10,000 69 6.92 489,500 0.52
10,001 to 50,000 142 14.24 2,684,825 2.87
50,001 to 500,000 29 2.91 3,286,611 3.52
500,001 and above 7 0.70 86,016,552 92.05
Units Held by Holders 997 100.00 93,450,537 100.00
Unit Held by Manager 0 0.00 0.00 0.00
Grand Total for the Fund 997 100.00 93,450,537 100.00
*included under this category are nominee accounts
1.8 Policy on Rebate and Soft Commission
Any stock broking rebates received by the Manager will be directed to the account of
the Fund. Any soft commissions received from the broker which are in the form of
research and advisory services that assist in the decision-making process relating to
the Fund’s investment may be retained by the Manager.
The Manager does not received any soft commission from broker during the period
under review.
For and on behalf of
The Manager
BIMB INVESTMENT MANAGEMENT BERHAD
Date: 26 February 2019
13
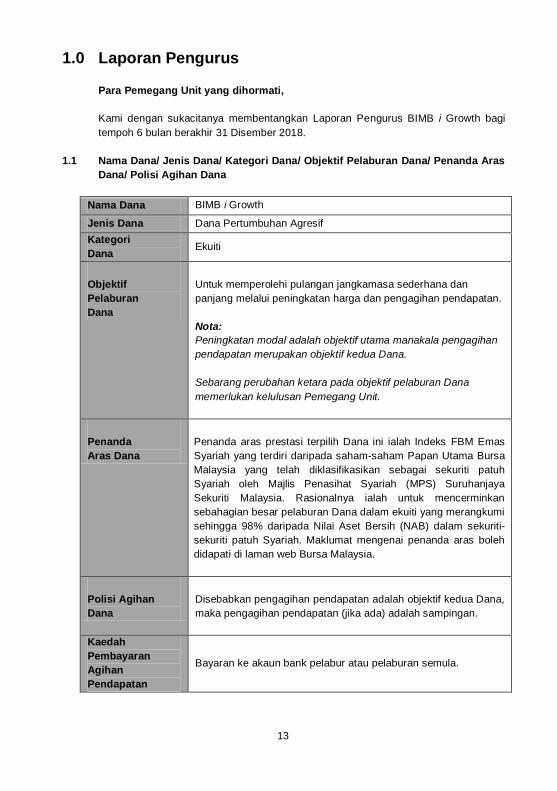
1.0 Laporan Pengurus
Para Pemegang Unit yang dihormati,
Kami dengan sukacitanya membentangkan Laporan Pengurus BIMB i Growth bagi
tempoh 6 bulan berakhir 31 Disember 2018.
1.1 Nama Dana/ Jenis Dana/ Kategori Dana/ Objektif Pelaburan Dana/ Penanda Aras
Dana/ Polisi Agihan Dana
Nama Dana BIMB i Growth
Jenis Dana Dana Pertumbuhan Agresif
Kategori
Dana Ekuiti
Objektif
Pelaburan
Dana
Untuk memperolehi pulangan jangkamasa sederhana dan
panjang melalui peningkatan harga dan pengagihan pendapatan.
Nota:
Peningkatan modal adalah objektif utama manakala pengagihan
pendapatan merupakan objektif kedua Dana.
Sebarang perubahan ketara pada objektif pelaburan Dana
memerlukan kelulusan Pemegang Unit.
Penanda
Aras Dana
Penanda aras prestasi terpilih Dana ini ialah Indeks FBM Emas
Syariah yang terdiri daripada saham-saham Papan Utama Bursa
Malaysia yang telah diklasifikasikan sebagai sekuriti patuh
Syariah oleh Majlis Penasihat Syariah (MPS) Suruhanjaya
Sekuriti Malaysia. Rasionalnya ialah untuk mencerminkan
sebahagian besar pelaburan Dana dalam ekuiti yang merangkumi
sehingga 98% daripada Nilai Aset Bersih (NAB) dalam sekuriti-
sekuriti patuh Syariah. Maklumat mengenai penanda aras boleh
didapati di laman web Bursa Malaysia.
Polisi Agihan
Dana
Disebabkan pengagihan pendapatan adalah objektif kedua Dana,
maka pengagihan pendapatan (jika ada) adalah sampingan.
Kaedah
Pembayaran
Agihan
Pendapatan
Bayaran ke akaun bank pelabur atau pelaburan semula.
14
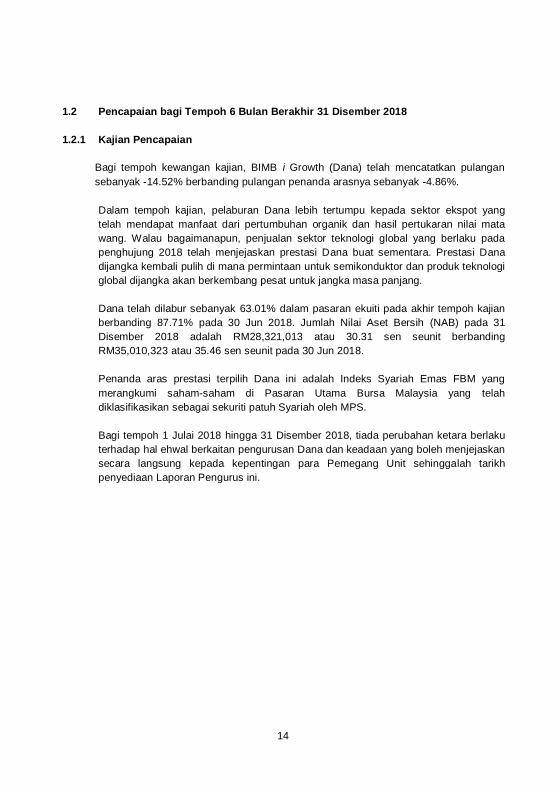
1.2 Pencapaian bagi Tempoh 6 Bulan Berakhir 31 Disember 2018
1.2.1 Kajian Pencapaian
Bagi tempoh kewangan kajian, BIMB i Growth (Dana) telah mencatatkan pulangan
sebanyak -14.52% berbanding pulangan penanda arasnya sebanyak -4.86%.
Dalam tempoh kajian, pelaburan Dana lebih tertumpu kepada sektor ekspot yang
telah mendapat manfaat dari pertumbuhan organik dan hasil pertukaran nilai mata
wang. Walau bagaimanapun, penjualan sektor teknologi global yang berlaku pada
penghujung 2018 telah menjejaskan prestasi Dana buat sementara. Prestasi Dana
dijangka kembali pulih di mana permintaan untuk semikonduktor dan produk teknologi
global dijangka akan berkembang pesat untuk jangka masa panjang.
Dana telah dilabur sebanyak 63.01% dalam pasaran ekuiti pada akhir tempoh kajian
berbanding 87.71% pada 30 Jun 2018. Jumlah Nilai Aset Bersih (NAB) pada 31
Disember 2018 adalah RM28,321,013 atau 30.31 sen seunit berbanding
RM35,010,323 atau 35.46 sen seunit pada 30 Jun 2018.
Penanda aras prestasi terpilih Dana ini adalah Indeks Syariah Emas FBM yang
merangkumi saham-saham di Pasaran Utama Bursa Malaysia yang telah
diklasifikasikan sebagai sekuriti patuh Syariah oleh MPS.
Bagi tempoh 1 Julai 2018 hingga 31 Disember 2018, tiada perubahan ketara berlaku
terhadap hal ehwal berkaitan pengurusan Dana dan keadaan yang boleh menjejaskan
secara langsung kepada kepentingan para Pemegang Unit sehinggalah tarikh
penyediaan Laporan Pengurus ini.
15
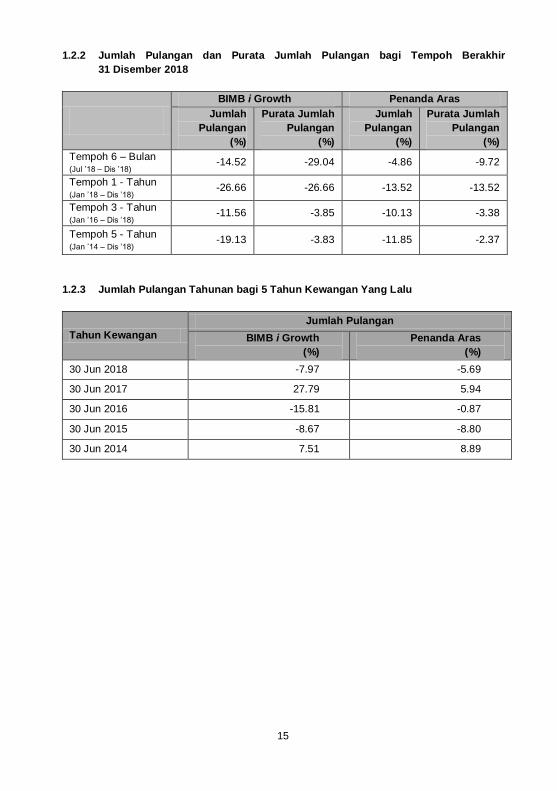
1.2.2 Jumlah Pulangan dan Purata Jumlah Pulangan bagi Tempoh Berakhir
31 Disember 2018
BIMB i Growth Penanda Aras
Jumlah
Pulangan
(%)
Purata Jumlah
Pulangan
(%)
Jumlah
Pulangan
(%)
Purata Jumlah
Pulangan
(%)
Tempoh 6 – Bulan (Jul ’18 – Dis ’18)
-14.52 -29.04 -4.86 -9.72
Tempoh 1 - Tahun (Jan ’18 – Dis ’18)
-26.66 -26.66 -13.52 -13.52
Tempoh 3 - Tahun (Jan ’16 – Dis ’18)
-11.56 -3.85 -10.13 -3.38
Tempoh 5 - Tahun (Jan ’14 – Dis ’18)
-19.13 -3.83 -11.85 -2.37
1.2.3 Jumlah Pulangan Tahunan bagi 5 Tahun Kewangan Yang Lalu
Tahun Kewangan
Jumlah Pulangan
BIMB i Growth
(%)
Penanda Aras
(%)
30 Jun 2018 -7.97 -5.69
30 Jun 2017 27.79 5.94
30 Jun 2016 -15.81 -0.87
30 Jun 2015 -8.67 -8.80
30 Jun 2014 7.51 8.89
16
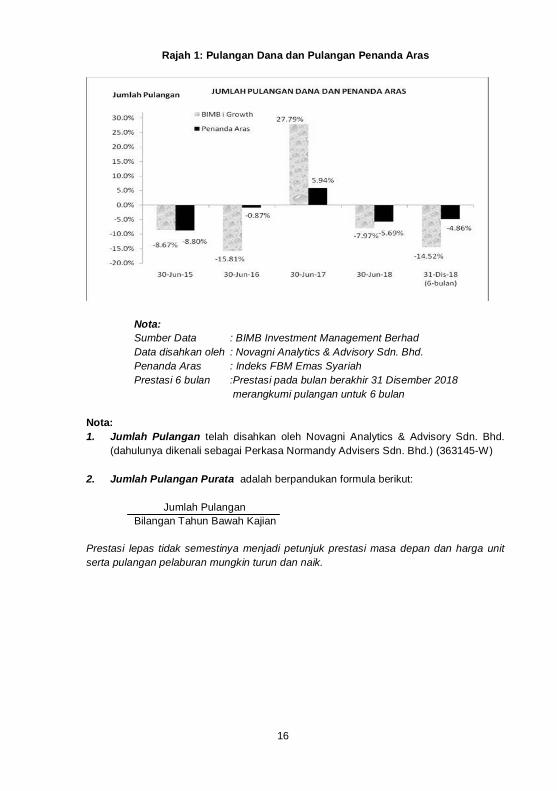
Rajah 1: Pulangan Dana dan Pulangan Penanda Aras
Nota:
Sumber Data : BIMB Investment Management Berhad
Data disahkan oleh : Novagni Analytics & Advisory Sdn. Bhd.
Penanda Aras : Indeks FBM Emas Syariah
Prestasi 6 bulan :Prestasi pada bulan berakhir 31 Disember 2018
merangkumi pulangan untuk 6 bulan
Nota:
1. Jumlah Pulangan telah disahkan oleh Novagni Analytics & Advisory Sdn. Bhd.
(dahulunya dikenali sebagai Perkasa Normandy Advisers Sdn. Bhd.) (363145-W)
2. Jumlah Pulangan Purata adalah berpandukan formula berikut:
Jumlah Pulangan
Bilangan Tahun Bawah Kajian
Prestasi lepas tidak semestinya menjadi petunjuk prestasi masa depan dan harga unit
serta pulangan pelaburan mungkin turun dan naik.
17
1.3 Ekonomi dan Kajian Pasaran
1.3.1 Ekonomi
a) Global
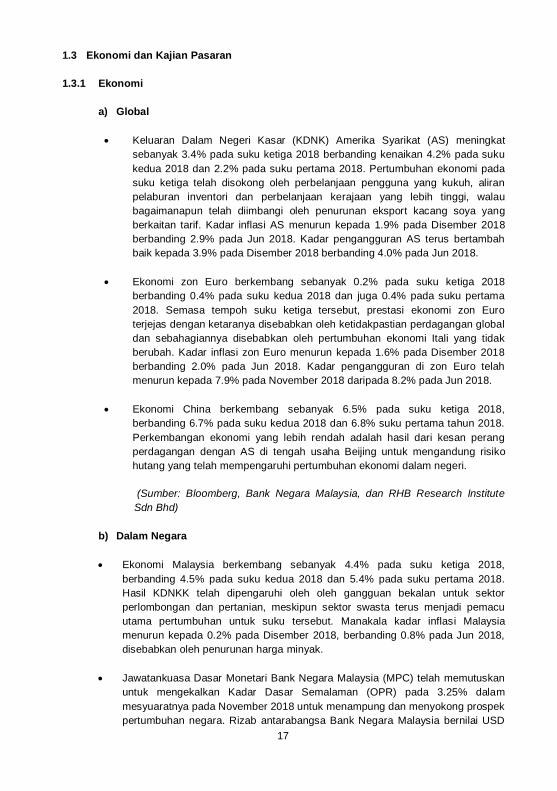
Keluaran Dalam Negeri Kasar (KDNK) Amerika Syarikat (AS) meningkat
sebanyak 3.4% pada suku ketiga 2018 berbanding kenaikan 4.2% pada suku
kedua 2018 dan 2.2% pada suku pertama 2018. Pertumbuhan ekonomi pada
suku ketiga telah disokong oleh perbelanjaan pengguna yang kukuh, aliran
pelaburan inventori dan perbelanjaan kerajaan yang lebih tinggi, walau
bagaimanapun telah diimbangi oleh penurunan eksport kacang soya yang
berkaitan tarif. Kadar inflasi AS menurun kepada 1.9% pada Disember 2018
berbanding 2.9% pada Jun 2018. Kadar pengangguran AS terus bertambah
baik kepada 3.9% pada Disember 2018 berbanding 4.0% pada Jun 2018.
Ekonomi zon Euro berkembang sebanyak 0.2% pada suku ketiga 2018
berbanding 0.4% pada suku kedua 2018 dan juga 0.4% pada suku pertama
2018. Semasa tempoh suku ketiga tersebut, prestasi ekonomi zon Euro
terjejas dengan ketaranya disebabkan oleh ketidakpastian perdagangan global
dan sebahagiannya disebabkan oleh pertumbuhan ekonomi Itali yang tidak
berubah. Kadar inflasi zon Euro menurun kepada 1.6% pada Disember 2018
berbanding 2.0% pada Jun 2018. Kadar pengangguran di zon Euro telah
menurun kepada 7.9% pada November 2018 daripada 8.2% pada Jun 2018.
Ekonomi China berkembang sebanyak 6.5% pada suku ketiga 2018,
berbanding 6.7% pada suku kedua 2018 dan 6.8% suku pertama tahun 2018.
Perkembangan ekonomi yang lebih rendah adalah hasil dari kesan perang
perdagangan dengan AS di tengah usaha Beijing untuk mengandung risiko
hutang yang telah mempengaruhi pertumbuhan ekonomi dalam negeri.
(Sumber: Bloomberg, Bank Negara Malaysia, dan RHB Research Institute
Sdn Bhd)
b) Dalam Negara
Ekonomi Malaysia berkembang sebanyak 4.4% pada suku ketiga 2018,
berbanding 4.5% pada suku kedua 2018 dan 5.4% pada suku pertama 2018.
Hasil KDNKK telah dipengaruhi oleh oleh gangguan bekalan untuk sektor
perlombongan dan pertanian, meskipun sektor swasta terus menjadi pemacu
utama pertumbuhan untuk suku tersebut. Manakala kadar inflasi Malaysia
menurun kepada 0.2% pada Disember 2018, berbanding 0.8% pada Jun 2018,
disebabkan oleh penurunan harga minyak.
Jawatankuasa Dasar Monetari Bank Negara Malaysia (MPC) telah memutuskan
untuk mengekalkan Kadar Dasar Semalaman (OPR) pada 3.25% dalam
mesyuaratnya pada November 2018 untuk menampung dan menyokong prospek
pertumbuhan negara. Rizab antarabangsa Bank Negara Malaysia bernilai USD
18
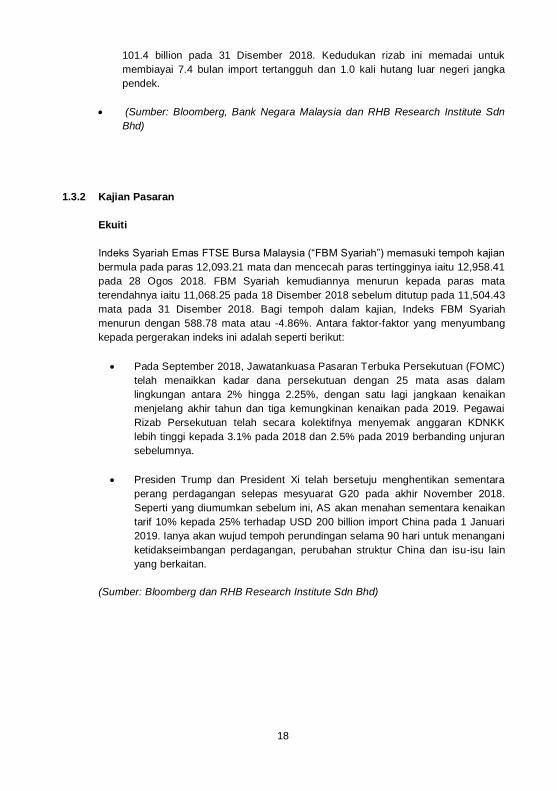
101.4 billion pada 31 Disember 2018. Kedudukan rizab ini memadai untuk
membiayai 7.4 bulan import tertangguh dan 1.0 kali hutang luar negeri jangka
pendek.
(Sumber: Bloomberg, Bank Negara Malaysia dan RHB Research Institute Sdn
Bhd)
1.3.2 Kajian Pasaran
Ekuiti
Indeks Syariah Emas FTSE Bursa Malaysia (“FBM Syariah”) memasuki tempoh kajian
bermula pada paras 12,093.21 mata dan mencecah paras tertingginya iaitu 12,958.41
pada 28 Ogos 2018. FBM Syariah kemudiannya menurun kepada paras mata
terendahnya iaitu 11,068.25 pada 18 Disember 2018 sebelum ditutup pada 11,504.43
mata pada 31 Disember 2018. Bagi tempoh dalam kajian, Indeks FBM Syariah
menurun dengan 588.78 mata atau -4.86%. Antara faktor-faktor yang menyumbang
kepada pergerakan indeks ini adalah seperti berikut:
Pada September 2018, Jawatankuasa Pasaran Terbuka Persekutuan (FOMC)
telah menaikkan kadar dana persekutuan dengan 25 mata asas dalam
lingkungan antara 2% hingga 2.25%, dengan satu lagi jangkaan kenaikan
menjelang akhir tahun dan tiga kemungkinan kenaikan pada 2019. Pegawai
Rizab Persekutuan telah secara kolektifnya menyemak anggaran KDNKK
lebih tinggi kepada 3.1% pada 2018 dan 2.5% pada 2019 berbanding unjuran
sebelumnya.
Presiden Trump dan President Xi telah bersetuju menghentikan sementara
perang perdagangan selepas mesyuarat G20 pada akhir November 2018.
Seperti yang diumumkan sebelum ini, AS akan menahan sementara kenaikan
tarif 10% kepada 25% terhadap USD 200 billion import China pada 1 Januari
2019. Ianya akan wujud tempoh perundingan selama 90 hari untuk menangani
ketidakseimbangan perdagangan, perubahan struktur China dan isu-isu lain
yang berkaitan.
(Sumber: Bloomberg dan RHB Research Institute Sdn Bhd)
19
1.4 Tinjauan Pasaran dan Strategi
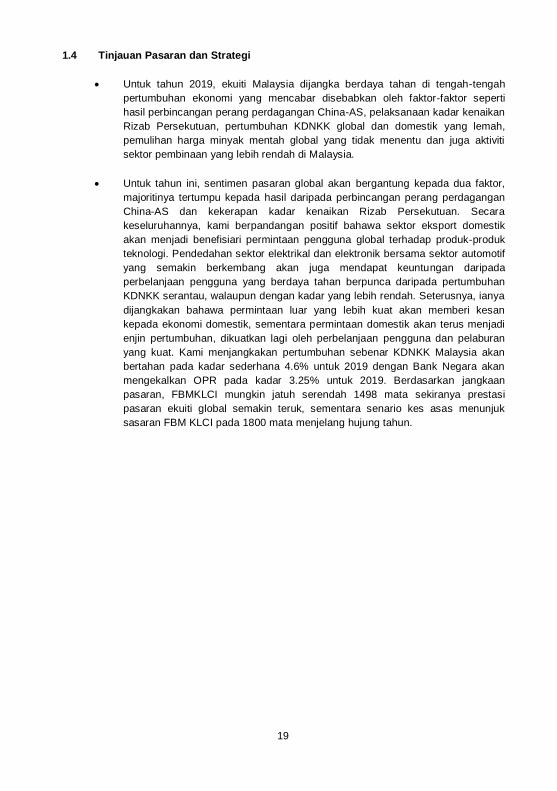
Untuk tahun 2019, ekuiti Malaysia dijangka berdaya tahan di tengah-tengah
pertumbuhan ekonomi yang mencabar disebabkan oleh faktor-faktor seperti
hasil perbincangan perang perdagangan China-AS, pelaksanaan kadar kenaikan
Rizab Persekutuan, pertumbuhan KDNKK global dan domestik yang lemah,
pemulihan harga minyak mentah global yang tidak menentu dan juga aktiviti
sektor pembinaan yang lebih rendah di Malaysia.
Untuk tahun ini, sentimen pasaran global akan bergantung kepada dua faktor,
majoritinya tertumpu kepada hasil daripada perbincangan perang perdagangan
China-AS dan kekerapan kadar kenaikan Rizab Persekutuan. Secara
keseluruhannya, kami berpandangan positif bahawa sektor eksport domestik
akan menjadi benefisiari permintaan pengguna global terhadap produk-produk
teknologi. Pendedahan sektor elektrikal dan elektronik bersama sektor automotif
yang semakin berkembang akan juga mendapat keuntungan daripada
perbelanjaan pengguna yang berdaya tahan berpunca daripada pertumbuhan
KDNKK serantau, walaupun dengan kadar yang lebih rendah. Seterusnya, ianya
dijangkakan bahawa permintaan luar yang lebih kuat akan memberi kesan
kepada ekonomi domestik, sementara permintaan domestik akan terus menjadi
enjin pertumbuhan, dikuatkan lagi oleh perbelanjaan pengguna dan pelaburan
yang kuat. Kami menjangkakan pertumbuhan sebenar KDNKK Malaysia akan
bertahan pada kadar sederhana 4.6% untuk 2019 dengan Bank Negara akan
mengekalkan OPR pada kadar 3.25% untuk 2019. Berdasarkan jangkaan
pasaran, FBMKLCI mungkin jatuh serendah 1498 mata sekiranya prestasi
pasaran ekuiti global semakin teruk, sementara senario kes asas menunjuk
sasaran FBM KLCI pada 1800 mata menjelang hujung tahun.
20
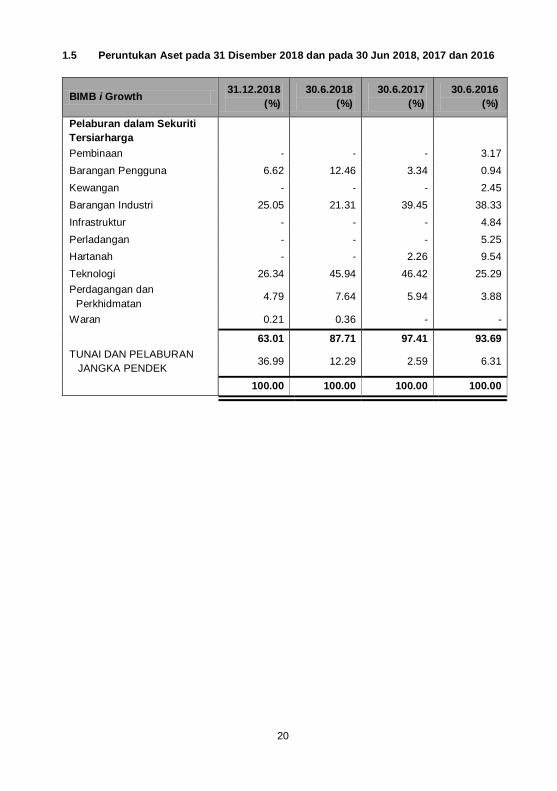
1.5 Peruntukan Aset pada 31 Disember 2018 dan pada 30 Jun 2018, 2017 dan 2016
BIMB i Growth 31.12.2018
(%)
30.6.2018
(%)
30.6.2017
(%)
30.6.2016
(%)
Pelaburan dalam Sekuriti
Tersiarharga
Pembinaan - - - 3.17
Barangan Pengguna 6.62 12.46 3.34 0.94
Kewangan - - - 2.45
Barangan Industri 25.05 21.31 39.45 38.33
Infrastruktur - - - 4.84
Perladangan - - - 5.25
Hartanah - - 2.26 9.54
Teknologi 26.34 45.94 46.42 25.29
Perdagangan dan
Perkhidmatan 4.79 7.64 5.94 3.88
Waran 0.21 0.36 - -
63.01 87.71 97.41 93.69
TUNAI DAN PELABURAN
JANGKA PENDEK 36.99 12.29 2.59 6.31
100.00 100.00 100.00 100.00
21
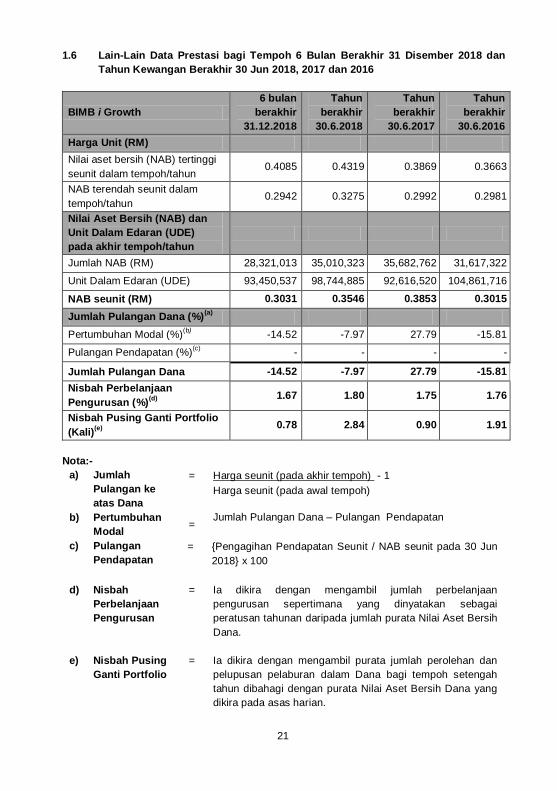
1.6 Lain-Lain Data Prestasi bagi Tempoh 6 Bulan Berakhir 31 Disember 2018 dan
Tahun Kewangan Berakhir 30 Jun 2018, 2017 dan 2016
BIMB i Growth
6 bulan
berakhir
31.12.2018
Tahun
berakhir
30.6.2018
Tahun
berakhir
30.6.2017
Tahun
berakhir
30.6.2016
Harga Unit (RM)
Nilai aset bersih (NAB) tertinggi
seunit dalam tempoh/tahun 0.4085 0.4319 0.3869 0.3663
NAB terendah seunit dalam
tempoh/tahun 0.2942 0.3275 0.2992 0.2981
Nilai Aset Bersih (NAB) dan
Unit Dalam Edaran (UDE)
pada akhir tempoh/tahun
Jumlah NAB (RM) 28,321,013 35,010,323 35,682,762 31,617,322
Unit Dalam Edaran (UDE) 93,450,537 98,744,885 92,616,520 104,861,716
NAB seunit (RM) 0.3031 0.3546 0.3853 0.3015
Jumlah Pulangan Dana (%)(a)
Pertumbuhan Modal (%)(b)
-14.52 -7.97 27.79 -15.81
Pulangan Pendapatan (%)(c)
- - - -
Jumlah Pulangan Dana -14.52 -7.97 27.79 -15.81
Nisbah Perbelanjaan
Pengurusan (%)(d)
1.67 1.80 1.75 1.76
Nisbah Pusing Ganti Portfolio
(Kali)(e)
0.78 2.84 0.90 1.91
Nota:-
a) Jumlah
Pulangan ke
atas Dana
= Harga seunit (pada akhir tempoh) - 1
Harga seunit (pada awal tempoh)
b) Pertumbuhan
Modal =
Jumlah Pulangan Dana – Pulangan Pendapatan
c) Pulangan
Pendapatan
= {Pengagihan Pendapatan Seunit / NAB seunit pada 30 Jun
2018} x 100
d) Nisbah
Perbelanjaan
Pengurusan
= Ia dikira dengan mengambil jumlah perbelanjaan
pengurusan sepertimana yang dinyatakan sebagai
peratusan tahunan daripada jumlah purata Nilai Aset Bersih
Dana.
e) Nisbah Pusing
Ganti Portfolio
= Ia dikira dengan mengambil purata jumlah perolehan dan
pelupusan pelaburan dalam Dana bagi tempoh setengah
tahun dibahagi dengan purata Nilai Aset Bersih Dana yang
dikira pada asas harian.
22
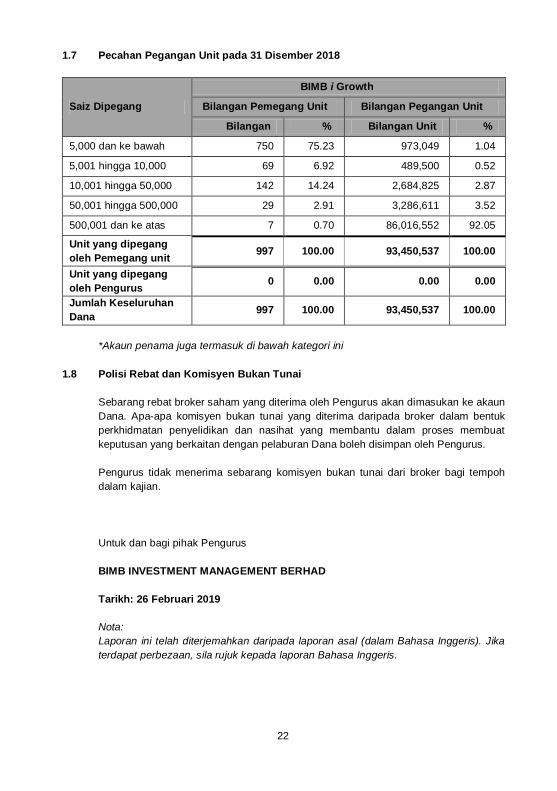
1.7 Pecahan Pegangan Unit pada 31 Disember 2018
Saiz Dipegang
BIMB i Growth
Bilangan Pemegang Unit Bilangan Pegangan Unit
Bilangan % Bilangan Unit %
5,000 dan ke bawah 750 75.23 973,049 1.04
5,001 hingga 10,000 69 6.92 489,500 0.52
10,001 hingga 50,000 142 14.24 2,684,825 2.87
50,001 hingga 500,000 29 2.91 3,286,611 3.52
500,001 dan ke atas 7 0.70 86,016,552 92.05
Unit yang dipegang
oleh Pemegang unit 997 100.00 93,450,537 100.00
Unit yang dipegang
oleh Pengurus 0 0.00 0.00 0.00
Jumlah Keseluruhan
Dana 997 100.00 93,450,537 100.00
*Akaun penama juga termasuk di bawah kategori ini
1.8 Polisi Rebat dan Komisyen Bukan Tunai
Sebarang rebat broker saham yang diterima oleh Pengurus akan dimasukan ke akaun
Dana. Apa-apa komisyen bukan tunai yang diterima daripada broker dalam bentuk
perkhidmatan penyelidikan dan nasihat yang membantu dalam proses membuat
keputusan yang berkaitan dengan pelaburan Dana boleh disimpan oleh Pengurus.
Pengurus tidak menerima sebarang komisyen bukan tunai dari broker bagi tempoh
dalam kajian.
Untuk dan bagi pihak Pengurus
BIMB INVESTMENT MANAGEMENT BERHAD
Tarikh: 26 Februari 2019
Nota:
Laporan ini telah diterjemahkan daripada laporan asal (dalam Bahasa Inggeris). Jika
terdapat perbezaan, sila rujuk kepada laporan Bahasa Inggeris.
23
2.0 Trustee’s Report
For The Financial Period Ended 31 December 2018
To The Unitholders of BIMB i Growth
We have acted as Trustee for BIMB i Growth (“the Fund”) for the financial period ended
31 December 2018. To the best of our knowledge, BIMB Investment Management Berhad
(“the Manager”) has managed the Fund in the financial period under review in accordance
with the following:
1. Limitations imposed on the investment powers of the Manager under the deeds, securities
laws and Guidelines on Unit Trust Funds;
2. Valuation and pricing of the Fund are carried out in accordance with the deeds and any
regulatory requirement; and
3. Creation and cancellation of units are carried out in accordance with the deeds and any
regulatory requirement.
For Maybank Trustees Berhad
(Company No.:5004-P)
………………………
Bernice K M Lau
Head, Operations
Kuala Lumpur, Malaysia
Date: 26 February 2019
24
3.0 Shariah Committee’s Report
INTERIM REPORT FOR THE 6 MONTHS PERIOD
ENDED 31 DECEMBER 2018
To the Unit Holders of
BIMB i Growth
We have acted as the Shariah Committee of BIMB i Growth.
Our responsibilities are to ensure that the procedures and processes employed by BIMB
Investment Management Berhad and that the provisions of the Deed dated 17 May 1994
and the Supplementary deeds are in accordance with Shariah principles.
In our opinion, BIMB Investment Management Berhad has managed BIMB i Growth in
accordance with Shariah principles and complied with applicable guidelines, rulings or
decisions issued by the Securities Commission pertaining to Shariah matters for the
financial period from 1 July 2018 to 31 December 2018.
In addition, we also confirm that the investment portfolio of BIMB i Growth comprises
securities which have been classified as Shariah-compliant by the Shariah Advisory
Council (SAC) of the Securities Commission, as the case may be and that all deposits
and money market instruments placed by the Fund are Shariah-compliant which have
been classified by the SAC of Bank Negara Malaysia.
For and on behalf of the Shariah Committee
………………………………………………..
USTAZ DR. AHMAD SHAHBARI@SOBRI SALAMON
(Chairman)
………………………………………………..
USTAZ DR. YUSOF RAMLI
(Committee Member)
………………………………………………..
USTAZAH DR. ASMAK AB. RAHMAN
(Committee Member)
Date: 26 February 2019

25
4.0 Directors’ Declaration Report
INTERIM REPORT FOR THE 6 MONTHS PERIOD
ENDED 31 DECEMBER 2018
To the Unit Holders of
BIMB i Growth
We, Dato’ Ghazali bin Awang and Najmuddin bin Mohd Lutfi, being two of the directors
of the Manager, BIMB Investment Management Berhad, for BIMB i Growth do hereby
state that in our opinion, the accompanying Statement of Financial Position, Statement of
Profit or Loss and Other Comprehensive Income, Statement of Changes in Net Asset
Value and Statement of Cash Flows are drawn up so as to give a true and fair view of
the Statement of Financial Position of the Fund as at 31 December 2018 and Statement
of Profit or Loss and Other Comprehensive Income, Statement of Changes in Net Asset
Value and Statement of Cash Flows for the period ended on that date.
For and on behalf on the Board of Directors,
……………………………………………
DATO’ GHAZALI BIN AWANG
(Non-Executive Independent Director)
…………………………………………..
NAJMUDDIN BIN MOHD LUTFI
(Chief Executive Officer)
Date: 26 February 2019

26
5.0 Financial Statement (Unaudited)
Fair Value of Financial Instruments
All Assets and Liabilities of the Fund are carried at fair values. The accounting policies
on recognition and measurement of the fair value for the Fund’s investments are
disclosed in their respective accounting policies.
The fair value for the amount due from stockbroker, amount due from/(to) the Manager
and Trustee, cash at bank, sundry receivables, sundry payables and accruals
approximate their respective carrying amounts as at the balance sheet date due to the
relatively short-term maturity of these Financial Instruments.
27
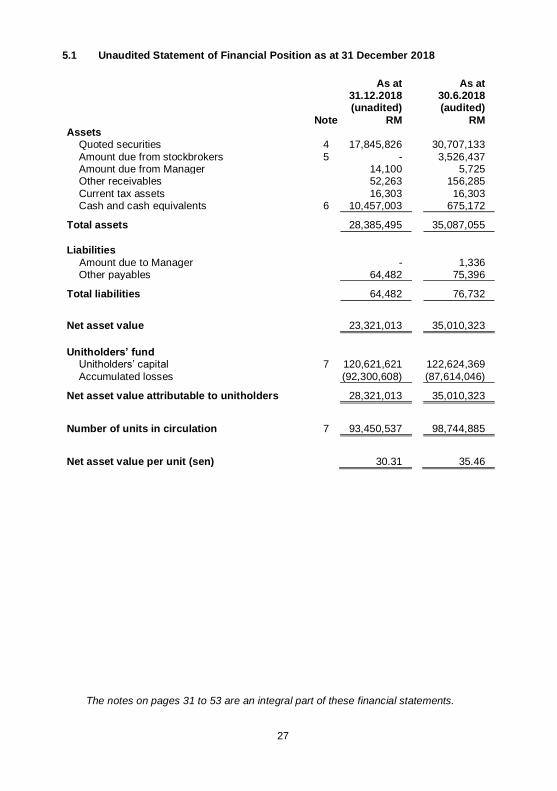
5.1 Unaudited Statement of Financial Position as at 31 December 2018
Note
As at 31.12.2018 (unadited)
RM
As at 30.6.2018 (audited)
RM Assets Quoted securities 4 17,845,826 30,707,133
Amount due from stockbrokers 5 - 3,526,437 Amount due from Manager 14,100 5,725 Other receivables 52,263 156,285
Current tax assets 16,303 16,303 Cash and cash equivalents 6 10,457,003 675,172
Total assets 28,385,495 35,087,055
Liabilities
Amount due to Manager - 1,336 Other payables 64,482 75,396
Total liabilities 64,482 76,732
Net asset value 23,321,013 35,010,323
Unitholders’ fund Unitholders’ capital 7 120,621,621 122,624,369
Accumulated losses (92,300,608) (87,614,046)
Net asset value attributable to unitholders 28,321,013 35,010,323
Number of units in circulation 7 93,450,537 98,744,885
Net asset value per unit (sen) 30.31 35.46
The notes on pages 31 to 53 are an integral part of these financial statements.
28
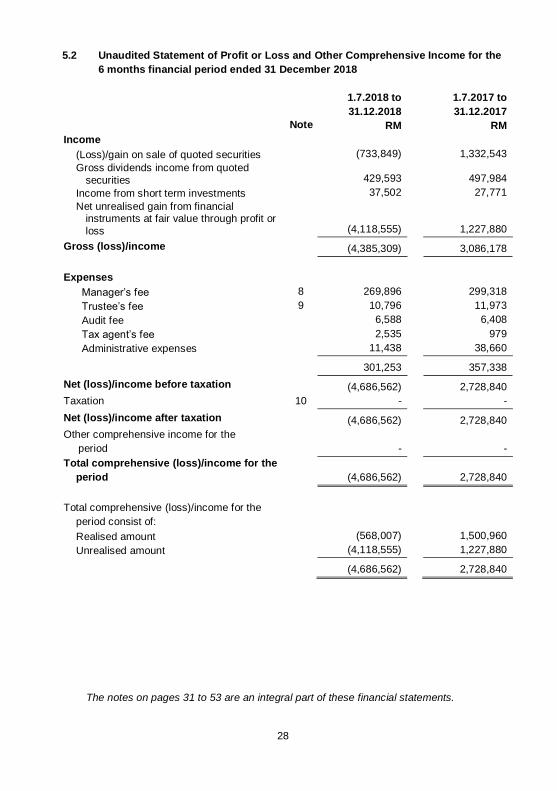
5.2 Unaudited Statement of Profit or Loss and Other Comprehensive Income for the
6 months financial period ended 31 December 2018
Note
1.7.2018 to
31.12.2018
RM
1.7.2017 to
31.12.2017
RM
Income
(Loss)/gain on sale of quoted securities (733,849) 1,332,543
Gross dividends income from quoted
securities
429,593
497,984
Income from short term investments 37,502 27,771
Net unrealised gain from financial instruments at fair value through profit or
loss
(4,118,555)
1,227,880
Gross (loss)/income (4,385,309) 3,086,178
Expenses
Manager’s fee 8 269,896 299,318
Trustee’s fee 9 10,796 11,973
Audit fee 6,588 6,408
Tax agent’s fee 2,535 979
Administrative expenses 11,438 38,660
301,253 357,338
Net (loss)/income before taxation (4,686,562) 2,728,840
Taxation 10 - -
Net (loss)/income after taxation (4,686,562) 2,728,840
Other comprehensive income for the
period
-
-
Total comprehensive (loss)/income for the
period
(4,686,562)
2,728,840
Total comprehensive (loss)/income for the
period consist of:
Realised amount (568,007) 1,500,960
Unrealised amount (4,118,555) 1,227,880
(4,686,562) 2,728,840
The notes on pages 31 to 53 are an integral part of these financial statements.
29
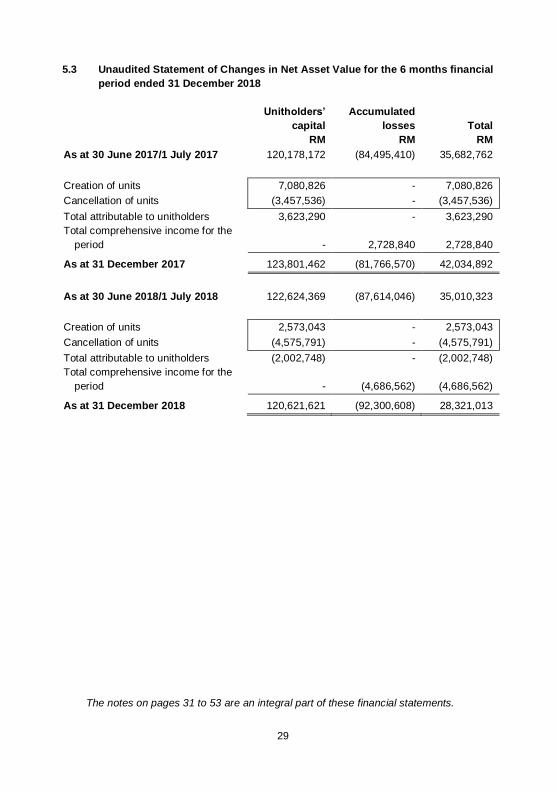
5.3 Unaudited Statement of Changes in Net Asset Value for the 6 months financial
period ended 31 December 2018
Unitholders’
capital
RM
Accumulated
losses
RM
Total
RM
As at 30 June 2017/1 July 2017 120,178,172 (84,495,410) 35,682,762
Creation of units 7,080,826 - 7,080,826
Cancellation of units (3,457,536) - (3,457,536)
Total attributable to unitholders 3,623,290 - 3,623,290
Total comprehensive income for the
period - 2,728,840 2,728,840
As at 31 December 2017 123,801,462 (81,766,570) 42,034,892
As at 30 June 2018/1 July 2018 122,624,369 (87,614,046) 35,010,323
Creation of units 2,573,043 - 2,573,043
Cancellation of units (4,575,791) - (4,575,791)
Total attributable to unitholders (2,002,748) - (2,002,748)
Total comprehensive income for the
period - (4,686,562) (4,686,562)
As at 31 December 2018 120,621,621 (92,300,608) 28,321,013
The notes on pages 31 to 53 are an integral part of these financial statements.
30
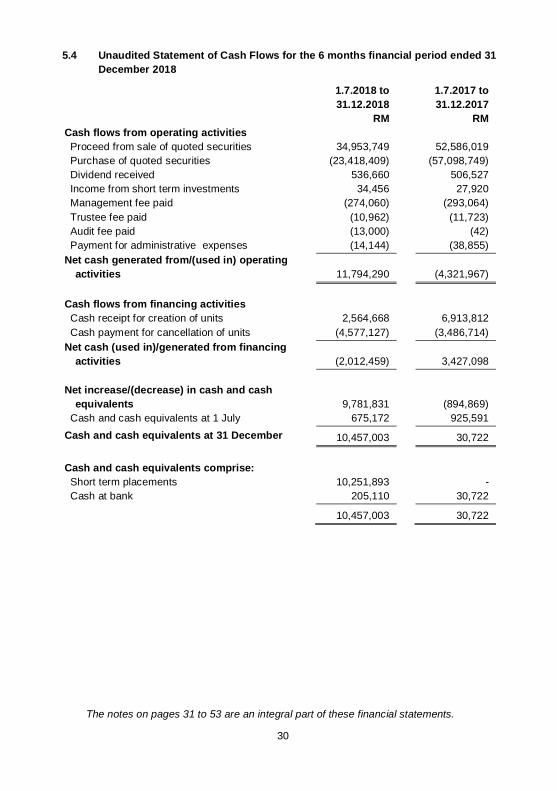
5.4 Unaudited Statement of Cash Flows for the 6 months financial period ended 31
December 2018
1.7.2018 to
31.12.2018
RM
1.7.2017 to
31.12.2017
RM
Cash flows from operating activities
Proceed from sale of quoted securities 34,953,749 52,586,019
Purchase of quoted securities (23,418,409) (57,098,749)
Dividend received 536,660 506,527
Income from short term investments 34,456 27,920
Management fee paid (274,060) (293,064)
Trustee fee paid (10,962) (11,723)
Audit fee paid (13,000) (42)
Payment for administrative expenses (14,144) (38,855)
Net cash generated from/(used in) operating
activities 11,794,290
(4,321,967)
Cash flows from financing activities
Cash receipt for creation of units 2,564,668 6,913,812
Cash payment for cancellation of units (4,577,127) (3,486,714)
Net cash (used in)/generated from financing
activities (2,012,459)
3,427,098
Net increase/(decrease) in cash and cash
equivalents 9,781,831
(894,869)
Cash and cash equivalents at 1 July 675,172 925,591
Cash and cash equivalents at 31 December 10,457,003 30,722
Cash and cash equivalents comprise:
Short term placements 10,251,893 -
Cash at bank 205,110 30,722
10,457,003 30,722
The notes on pages 31 to 53 are an integral part of these financial statements.
31
5.5 Unaudited notes to the Financial Statements
1. Information on the Fund
BIMB i Growth (hereinafter referred to as “the Fund”) was constituted pursuant to the
execution of a Deed dated 17 May 1994 and the various Supplemental Deeds
between the Manager - BIMB Investment Management Berhad, the Trustee -
Maybank Trustees Berhad and the registered unitholders of the Fund.
The principal activity of the Fund is to invest in authorised investments as defined in
the Deed, which include investments in stocks and shares of companies quoted on
Bursa Malaysia and short term placements.
The Manager, BIMB Investment Management Berhad, a company incorporated in
Malaysia, is a subsidiary of Bank Islam Malaysia Berhad.
The financial statements were approved by the Board of Directors of the Manager on
XXX February 2019.
2. Basis of preparation
(a) Statement of compliance
The financial statements of the Fund have been prepared in accordance with
Malaysian Financial Reporting Standards (“MFRS”), International Financial
Reporting Standards (“IFRS”), the Deed and Securities Commission’s Guidelines
on Unit Trust Funds (“Guidelines”) in Malaysia.
This is the first set of the Fund’s annual financial statements in which MFRS 9
Financial Instruments and MFRS 15 Revenue from Contracts with Customers
has been applied. There were no material impact arising from the adoption of
MFRS 15 and MFRS 9 on the Fund’s financial statements other than the change
in accounting policies as disclosed in Note 3.
The following are accounting standards, interpretations and amendments that
have been issued by the Malaysian Accounting Standards Board (“MASB”) but
have not been adopted by the Fund:
32
2. Basis of preparation (continued)
(a) Statement of compliance (continued)
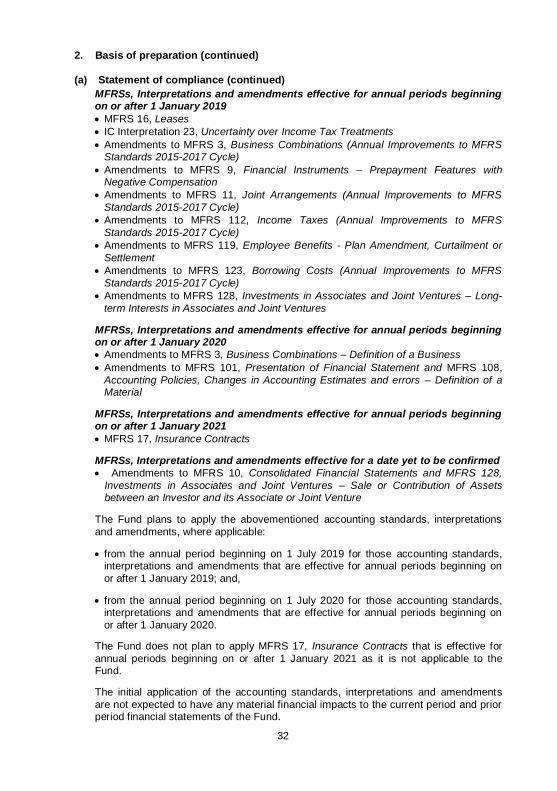
MFRSs, Interpretations and amendments effective for annual periods beginning on or after 1 January 2019
MFRS 16, Leases
IC Interpretation 23, Uncertainty over Income Tax Treatments
Amendments to MFRS 3, Business Combinations (Annual Improvements to MFRS Standards 2015-2017 Cycle)
Amendments to MFRS 9, Financial Instruments – Prepayment Features with Negative Compensation
Amendments to MFRS 11, Joint Arrangements (Annual Improvements to MFRS
Standards 2015-2017 Cycle)
Amendments to MFRS 112, Income Taxes (Annual Improvements to MFRS
Standards 2015-2017 Cycle)
Amendments to MFRS 119, Employee Benefits - Plan Amendment, Curtailment or
Settlement
Amendments to MFRS 123, Borrowing Costs (Annual Improvements to MFRS
Standards 2015-2017 Cycle)
Amendments to MFRS 128, Investments in Associates and Joint Ventures – Long-
term Interests in Associates and Joint Ventures
MFRSs, Interpretations and amendments effective for annual periods beginning on or after 1 January 2020
Amendments to MFRS 3, Business Combinations – Definition of a Business
Amendments to MFRS 101, Presentation of Financial Statement and MFRS 108,
Accounting Policies, Changes in Accounting Estimates and errors – Definition of a Material
MFRSs, Interpretations and amendments effective for annual periods beginning on or after 1 January 2021
MFRS 17, Insurance Contracts
MFRSs, Interpretations and amendments effective for a date yet to be confirmed
Amendments to MFRS 10, Consolidated Financial Statements and MFRS 128,
Investments in Associates and Joint Ventures – Sale or Contribution of Assets between an Investor and its Associate or Joint Venture
The Fund plans to apply the abovementioned accounting standards, interpretations
and amendments, where applicable:
from the annual period beginning on 1 July 2019 for those accounting standards, interpretations and amendments that are effective for annual periods beginning on
or after 1 January 2019; and,
from the annual period beginning on 1 July 2020 for those accounting standards, interpretations and amendments that are effective for annual periods beginning on
or after 1 January 2020.
The Fund does not plan to apply MFRS 17, Insurance Contracts that is effective for
annual periods beginning on or after 1 January 2021 as it is not applicable to the Fund.
The initial application of the accounting standards, interpretations and amendments
are not expected to have any material financial impacts to the current period and prior period financial statements of the Fund.
33
2. Basis of preparation (continued)
(b) Basis of measurement
The financial statements are prepared on the historical cost basis.
(c) Functional and presentation currency
These financial statements are presented in Ringgit Malaysia (“RM”), which is the
Fund’s functional currency.
(d) Use of estimates and judgements
The preparation of the financial statements in conformity with MFRSs requires
management to make judgements, estimates and assumptions that affect the
application of accounting policies and the reported amounts of assets, liabilities,
income and expenses. Actual results may differ from these estimates.
Estimates and underlying assumptions are reviewed on an ongoing basis.
Revisions to accounting estimates are recognised in the year in which the estimate
is revised and in any future years affected.
There are no significant areas of estimation uncertainty and critical judgements in
applying accounting policies that have a significant effect on the amounts
recognised in the financial statements.
34
3. Significant accounting policies
The accounting policies set out below have been applied consistently to the period
presented in these financial statements, unless otherwise stated.
(a) Financial instruments
Unless specifically disclosed below, the Fund generally applied the following
accounting policies retrospectively. Nevertheless, as permitted by MFRS 9,
Financial Instruments, the Fund has elected not to restate the comparative.
(i) Initial recognition and measurement
A financial asset or liability is recognised in the statement of financial
position when, and only when, the Fund becomes a party to the contractual
provisions of the instrument.
Current financial year
A financial asset (unless it is a trade receivable without significant financing
component) or a financial liability is initially measured at fair value plus or
minus, for an item not at fair value through profit or loss, transaction costs
that are directly attributable to its acquisition or issuance. A trade receivable
without a significant financing component is initially measured at the
transaction price.
Previous financial year
Financial instrument was recognised initially, at its fair value plus plus or
minus in the case of a financial instrument not at fair value through profit or
loss, transaction costs that were directly attributable to the acquisition or
issue of the financial instrument.
(ii) Financial instrument categories and subsequent measurement
The Fund categorises financial instruments as follows:
Financial assets
Current financial year
Categories of financial assets are determined on initial recognition and are
not reclassified subsequent to their initial recognition unless the Fund
changes its business model for managing financial assets in which case all
affected financial assets are reclassified on the first day of the first reporting
period following the change of the business model.
35
3. Significant accounting policies (continued)
(a) Financial instruments (continued)
(ii) Financial instrument categories and subsequent measurement
(continued)
(a) Amortised cost
Amortised cost category comprises financial assets that are held within a
business model whose objective is to hold assets to collect contractual
cash flows and its contractual terms give rise on specified dates to cash
flows that are solely payments of principal and profit on the principal
amount outstanding. The financial assets are not designated as fair
value through profit or loss. Subsequent to initial recognition, these
financial assets are measured at amortised cost using the effective profit
method. The amortised cost is reduced by impairment losses. Profit
income, foreign exchange gains and losses and impairment are
recognised in profit or loss.
Profit income is recognised by applying effective profit rate to the gross
carrying amount except for credit impairment financial assets (see Note 3
(d)) where the effective profit rate is applied to the amortised cost.
All financial assets, except for those measured at fair value through profit or
loss and equity investments measured at fair value through other
comprehensive income, are subject to impairment assessment.
Previous financial year
In the previous financial year, financial assets of the Fund were classified
and measured under MFRS 139, Financial Instruments: Recognition and
Measurements as follows:
Financing and receivables
Financing and receivables category comprised other receivables and cash
and cash equivalents.
Financial assets categorised as financing and receivables were
subsequently measured at amortised cost using the effective profit method.
All financial assets were subject to impairment assessment (see Note 3(d)).
36
3. Significant accounting policies (continued)
(a) Financial instruments (continued)
(ii) Financial instrument categories and subsequent measurement
(continued)
Financial liabilities
Current financial year
The categories of financial liabilities at initial recognition are as follows:
Amortised cost
Other financial liabilities not categorised as fair value through profit or loss
are subsequently measured at amortised cost using the effective profit
method.
Any gains or losses on derecognition are also recognised in the profit or loss.
Previous financial year
All financial liabilities were subsequently measured at amortised cost.
(iii) Derecognition
A financial asset or part of it is derecognised when, and only when, the
contractual rights to the cash flows from the financial asset expire or the
financial asset is transferred to another party without retaining control or
substantially all risks and rewards of the asset. On derecognition of a
financial asset, the difference between the carrying amount and the sum of
the consideration received (including any new asset obtained less any new
liability assumed) and any cumulative gain or loss that had been recognised
in equity is recognised in profit or loss.
A financial liability or a part of it is derecognised when, and only when, the
obligation specified in the contract is discharged or cancelled or expires. On
derecognition of a financial liability, the difference between the carrying
amount of the financial liability extinguished or transferred to another party
and the consideration paid, including any non-cash assets transferred or
liabilities assumed, is recognised in profit or loss.
37
3. Significant accounting policies (continued)
(b) Income recognition
Income from short term investments is recognised as it accrues, using the
effective profit method in profit or loss.
(c) Cash and cash equivalents
Cash and cash equivalents consist of cash at bank and short term placements
with licensed financial institutions which have insignificant risk of changes in fair
value with original maturities of less than 30 days, and are used by the Fund in
the management of its short term commitments.
Cash and cash equivalents are categorised and measured as amortised cost
(2017: financing and receivables).
(d) Impairment
Financial assets
The Fund generally applied the following account policies retrospectively.
Nevertheless, as permitted by MFRS 9, Financial Instruments, the Fund elected
not to restate the comparatives.
Current financial year
The Fund recognised loss allowances for expected credit losses on financial
assets measured at amortised costs. Expected credit losses are a probability-
weighted estimate of credit losses.
The Fund measures loss allowances at an amount equal to lifetime expected
credit loss, except for cash and bank balance for which credit risk has not
increased significantly since initial recognition, which are measured at 12-month
expected credit loss.
When determining whether the credit risk of a financial asset has increased
significantly since initial recognition and when expected credit loss, the Fund
consider reasonable and supportable information that is relevant and available
without undue cost or effort. This includes both quantitative and qualitative
information and analysis, based on the Fund’s historical experience and
informed credit assessment and including forward-looking information, where
available.
38
3. Significant accounting policies (continued)
(d) Impairment (continued)
Financial assets (continued)
Current financial year (continued)
Lifetime expected credit losses are the expected credit losses that result from all
possible default events over the expected life of the asset, while 12-month
expected credit losses are the portion of expected credit losses that result from
default events that are possible within the 12 months after the reporting date.
The maximum period considered when estimating expected credit losses is the
maximum contractual period over which the Fund is exposed to credit risk.
The Fund estimate the expected credit losses on other receivables using a provision
matrix with reference to historical credit loss experience.
An impairment loss in respect of financial assets measured at amortised cost is
recognised in profit or loss and the carrying amount of the asset is reduced through
the use of an allowance account.
At each reporting date, the Fund assess whether financial assets carried at amortised
cost are credit-impaired. A financial asset is credit impaired when one or more events
that have a detrimental impact on the estimated future cash flows of the financial
asset have occurred.
The gross carrying amount of a financial asset is written off (either partially or full) to
the extent that there is no realistic prospects of recovery. This is generally the case
when the Fund determines that the debtor does not have assets or sources of income
that could generate sufficient cash flows to repay the amounts subject to the write-off.
However, financial assets that are written off could still be subject to enforcement
activities in order to comply with the Company’s procedures for recovery amount due.
Previous financial year
All financial assets (except for financial assets categorised as fair value through profit
or loss) were assessed at each reporting date whether there was any objective
evidence of impairment as a result of one or more events having an impact on the
estimated future cash flows of the asset. Losses expected as a result of future
events, no matter how likely, were not recognised.
An impairment loss in respect of financial assets measured at amortised cost (2017:
financing and receivables) was recognised in profit or loss and was measured as the
difference between the asset’s carrying amount and the present value of estimated
future cash flows discounted at the asset’s original effective profit rate. The carrying
amount of the asset was reduced through the use of an allowance account.
39
3. Significant accounting policies (continued)
(e) Income tax
Income tax expense comprises current tax. Current tax is recognised in profit or
loss except to the extent that it relates to items recognised directly in equity or
other comprehensive income.
Current tax is the expected tax payable or receivable on the taxable income for
the period, using tax rates enacted or substantively enacted at the statement of
financial position date, and any adjustment to tax payable in respect of previous
years.
(f) Unitholders’ capital
The Fund issues cancellable units, which are cancelled at the unitholder’s option
and are classified as equity. Cancellable units can be put back to the Fund at
any time for cash equal to a proportionate share of the Fund’s net asset value.
The outstanding units is carried at the redemption amount that is payable at the
financial position date if the unitholder exercises the right to put the unit back to
the Fund.
Units are created and cancelled at the unitholder’s option at prices based on the
Fund’s net asset value per unit at the time of creation or cancellation. The Fund’s
net asset value per unit is calculated by dividing the net asset attributable to
unitholders with the total number of outstanding units. In accordance with the
Securities Commission’s Guidelines on Unit Trust Funds in Malaysia, investment
positions are valued based on the last traded market price for the purpose of
determining the net asset value per unit for creations and cancellations.
The units in the Fund are puttable instruments, classified as equity, which entitle
the unitholders to a pro-rata share of the net asset of the Fund. The units are
subordinated and have identical features. There is no contractual obligation to
deliver cash or another financial asset other than the obligation on the Fund to
repurchase the units. The total expected cash flows from the units are based on
the change in the net asset of the Fund.
(g) Distribution
Distribution is at the discretion of the Fund. A distribution to the Fund’s
unitholders is accounted for as a deduction from realised reserves. A proposed
distribution is recognised as liability or equity in the year in which they are
declared.
(h) Net Asset Value
The Net Assets Value is calculated after deducting the retained profits allocated
for distribution.
40
3. Significant accounting policies (continued)
(i) Fair value measurement
The Fund adopted MFRS 13, Fair Value Measurement which prescribed that fair
value of an asset or a liability, except for share-based payment and lease
transactions, is determined as the price that would be received to sell an asset or
paid to transfer a liability in an orderly transaction between market participants at
the measurement date. The measurement assumes that the transaction to sell
the asset or transfer the liability takes place either in the principal market or in
the absence of a principal market, in the most advantageous market.
For non-financial asset, the fair value measurement takes into account a market
participant’s ability to generate economic benefits by using the asset in its
highest and best use or by selling it to another market participant that would use
the asset in its highest and best use.
When measuring the fair value of an asset or a liability, the Fund uses
observable market data as far as possible. Fair value are categorised into
different levels in a fair value hierarchy based on the input used in the valuation
technique as follows:
Level 1: quoted prices (unadjusted) in active markets for identical assets or
liabilities that the Fund can access at the measurement date.
Level 2: inputs other than quoted prices included within Level 1 that are
observable for the asset or liability, either directly or indirectly.
Level 3: unobservable inputs for the asset or liability.
The Fund recognises transfers between levels of the fair value hierarchy as of
the date of the event or change in circumstances that caused the transfers.
41
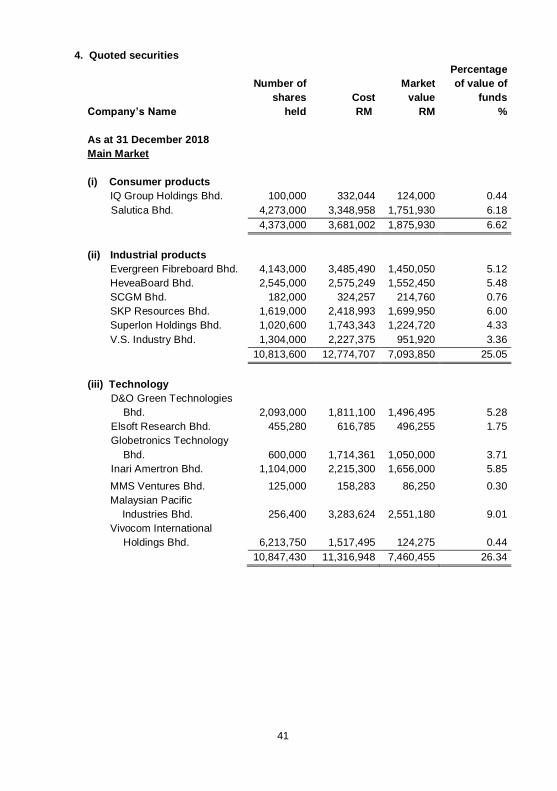
4. Quoted securities
Company’s Name
Number of
shares
held
Cost
RM
Market
value
RM
Percentage
of value of
funds
%
As at 31 December 2018
Main Market
(i) Consumer products
IQ Group Holdings Bhd. 100,000 332,044 124,000 0.44
Salutica Bhd. 4,273,000 3,348,958 1,751,930 6.18
4,373,000 3,681,002 1,875,930 6.62
(ii) Industrial products
Evergreen Fibreboard Bhd. 4,143,000 3,485,490 1,450,050 5.12
HeveaBoard Bhd. 2,545,000 2,575,249 1,552,450 5.48
SCGM Bhd. 182,000 324,257 214,760 0.76
SKP Resources Bhd. 1,619,000 2,418,993 1,699,950 6.00
Superlon Holdings Bhd. 1,020,600 1,743,343 1,224,720 4.33
V.S. Industry Bhd. 1,304,000 2,227,375 951,920 3.36
10,813,600 12,774,707 7,093,850 25.05
(iii) Technology
D&O Green Technologies
Bhd. 2,093,000 1,811,100 1,496,495 5.28
Elsoft Research Bhd. 455,280 616,785 496,255 1.75
Globetronics Technology
Bhd. 600,000 1,714,361 1,050,000 3.71
Inari Amertron Bhd. 1,104,000 2,215,300 1,656,000 5.85
MMS Ventures Bhd. 125,000 158,283 86,250 0.30
Malaysian Pacific
Industries Bhd. 256,400 3,283,624 2,551,180 9.01
Vivocom International
Holdings Bhd. 6,213,750 1,517,495 124,275 0.44
10,847,430 11,316,948 7,460,455 26.34
42
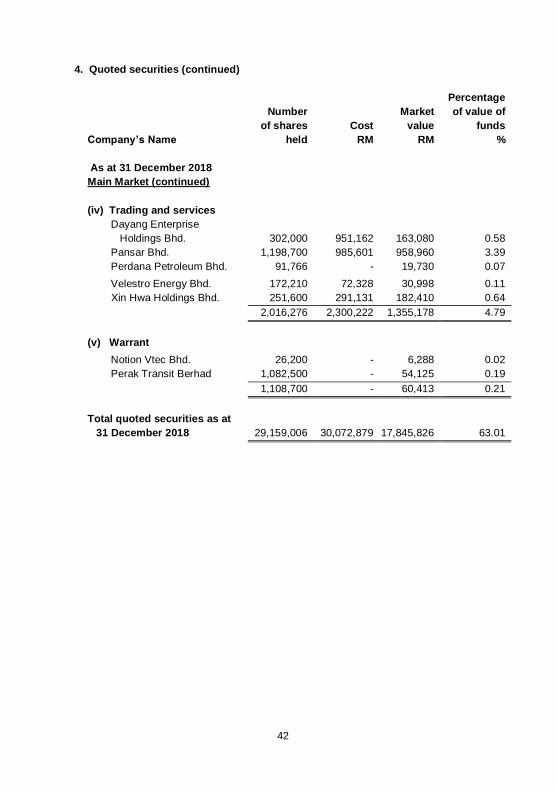
4. Quoted securities (continued)
Company’s Name
Number
of shares
held
Cost
RM
Market
value
RM
Percentage
of value of
funds
%
As at 31 December 2018
Main Market (continued)
(iv) Trading and services
Dayang Enterprise
Holdings Bhd. 302,000 951,162 163,080 0.58
Pansar Bhd. 1,198,700 985,601 958,960 3.39
Perdana Petroleum Bhd. 91,766 - 19,730 0.07
Velestro Energy Bhd. 172,210 72,328 30,998 0.11
Xin Hwa Holdings Bhd. 251,600 291,131 182,410 0.64
2,016,276 2,300,222 1,355,178 4.79
(v) Warrant
Notion Vtec Bhd. 26,200 - 6,288 0.02
Perak Transit Berhad 1,082,500 - 54,125 0.19
1,108,700 - 60,413 0.21
Total quoted securities as at
31 December 2018
29,159,006 30,072,879 17,845,826 63.01
43
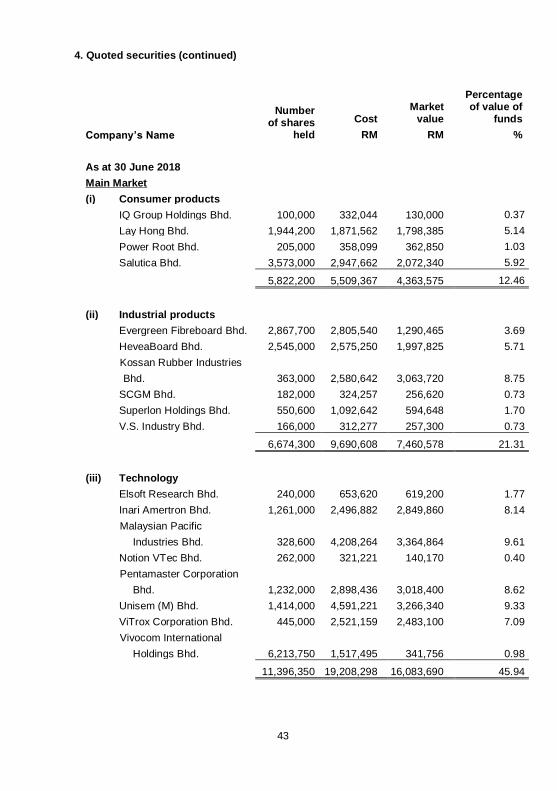
4. Quoted securities (continued)
Number
of shares held
Cost
Market
value
Percentage of value of
funds
Company’s Name RM RM %
As at 30 June 2018
Main Market
(i) Consumer products
IQ Group Holdings Bhd. 100,000 332,044 130,000 0.37
Lay Hong Bhd. 1,944,200 1,871,562 1,798,385 5.14
Power Root Bhd. 205,000 358,099 362,850 1.03
Salutica Bhd. 3,573,000 2,947,662 2,072,340 5.92
5,822,200 5,509,367 4,363,575 12.46
(ii) Industrial products
Evergreen Fibreboard Bhd. 2,867,700 2,805,540 1,290,465 3.69
HeveaBoard Bhd. 2,545,000 2,575,250 1,997,825 5.71
Kossan Rubber Industries
Bhd. 363,000 2,580,642 3,063,720 8.75
SCGM Bhd. 182,000 324,257 256,620 0.73
Superlon Holdings Bhd. 550,600 1,092,642 594,648 1.70
V.S. Industry Bhd. 166,000 312,277 257,300 0.73
6,674,300 9,690,608 7,460,578 21.31
(iii) Technology
Elsoft Research Bhd. 240,000 653,620 619,200 1.77
Inari Amertron Bhd. 1,261,000 2,496,882 2,849,860 8.14
Malaysian Pacific
Industries Bhd. 328,600 4,208,264 3,364,864 9.61
Notion VTec Bhd. 262,000 321,221 140,170 0.40
Pentamaster Corporation
Bhd. 1,232,000 2,898,436 3,018,400 8.62
Unisem (M) Bhd. 1,414,000 4,591,221 3,266,340 9.33
ViTrox Corporation Bhd. 445,000 2,521,159 2,483,100 7.09
Vivocom International
Holdings Bhd. 6,213,750 1,517,495 341,756 0.98
11,396,350 19,208,298 16,083,690 45.94
44
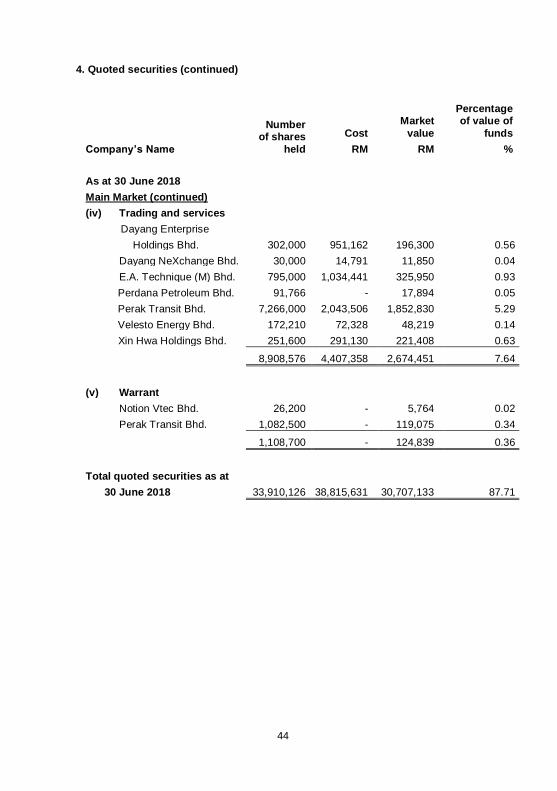
4. Quoted securities (continued)
Number
of shares
held
Cost
Market
value
Percentage of value of
funds
Company’s Name RM RM %
As at 30 June 2018
Main Market (continued)
(iv) Trading and services
Dayang Enterprise
Holdings Bhd. 302,000 951,162 196,300 0.56
Dayang NeXchange Bhd. 30,000 14,791 11,850 0.04
E.A. Technique (M) Bhd. 795,000 1,034,441 325,950 0.93
Perdana Petroleum Bhd. 91,766 - 17,894 0.05
Perak Transit Bhd. 7,266,000 2,043,506 1,852,830 5.29
Velesto Energy Bhd. 172,210 72,328 48,219 0.14
Xin Hwa Holdings Bhd. 251,600 291,130 221,408 0.63
8,908,576 4,407,358 2,674,451 7.64
(v) Warrant
Notion Vtec Bhd. 26,200 - 5,764 0.02
Perak Transit Bhd. 1,082,500 - 119,075 0.34
1,108,700 - 124,839 0.36
Total quoted securities as at
30 June 2018 33,910,126 38,815,631 30,707,133 87.71
45
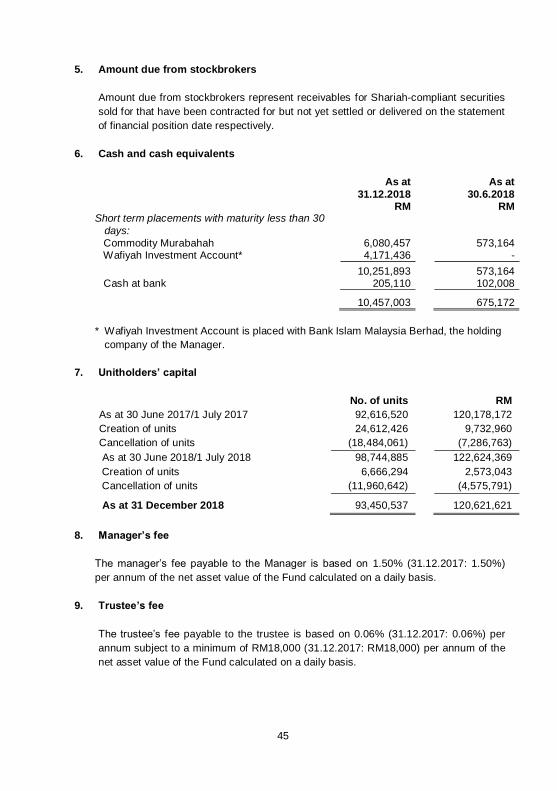
5. Amount due from stockbrokers
Amount due from stockbrokers represent receivables for Shariah-compliant securities
sold for that have been contracted for but not yet settled or delivered on the statement
of financial position date respectively.
6. Cash and cash equivalents
As at
31.12.2018
As at
30.6.2018 RM RM
Short term placements with maturity less than 30
days:
Commodity Murabahah 6,080,457 573,164 Wafiyah Investment Account* 4,171,436 -
10,251,893 573,164 Cash at bank 205,110 102,008
10,457,003 675,172
* Wafiyah Investment Account is placed with Bank Islam Malaysia Berhad, the holding
company of the Manager.
7. Unitholders’ capital
No. of units RM
As at 30 June 2017/1 July 2017 92,616,520 120,178,172
Creation of units 24,612,426 9,732,960
Cancellation of units (18,484,061) (7,286,763)
As at 30 June 2018/1 July 2018 98,744,885 122,624,369
Creation of units 6,666,294 2,573,043
Cancellation of units (11,960,642) (4,575,791)
As at 31 December 2018 93,450,537 120,621,621
8. Manager’s fee
The manager’s fee payable to the Manager is based on 1.50% (31.12.2017: 1.50%)
per annum of the net asset value of the Fund calculated on a daily basis.
9. Trustee’s fee
The trustee’s fee payable to the trustee is based on 0.06% (31.12.2017: 0.06%) per
annum subject to a minimum of RM18,000 (31.12.2017: RM18,000) per annum of the
net asset value of the Fund calculated on a daily basis.
46
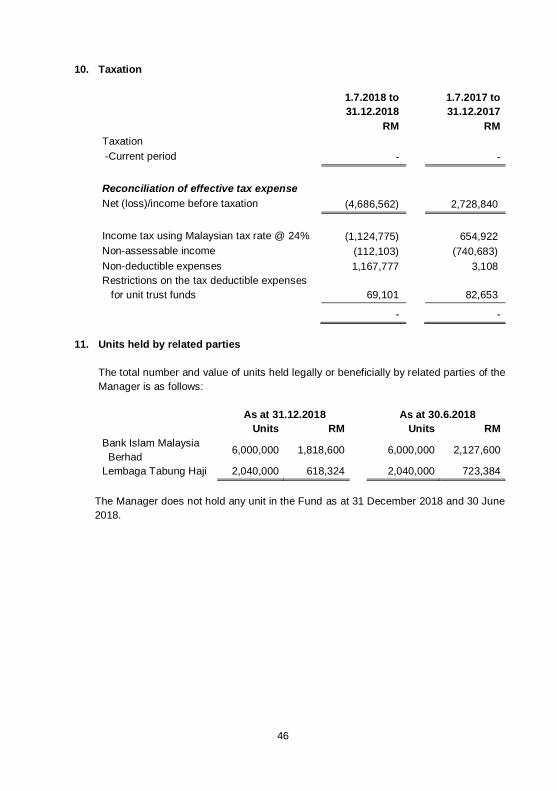
10. Taxation
1.7.2018 to
31.12.2018
1.7.2017 to
31.12.2017
RM RM
Taxation
-Current period - -
Reconciliation of effective tax expense
Net (loss)/income before taxation (4,686,562) 2,728,840
Income tax using Malaysian tax rate @ 24% (1,124,775) 654,922
Non-assessable income (112,103) (740,683)
Non-deductible expenses 1,167,777 3,108
Restrictions on the tax deductible expenses
for unit trust funds 69,101
82,653
- -
11. Units held by related parties
The total number and value of units held legally or beneficially by related parties of the
Manager is as follows:
As at 31.12.2018 As at 30.6.2018
Units RM Units RM
Bank Islam Malaysia
Berhad 6,000,000 1,818,600
6,000,000 2,127,600
Lembaga Tabung Haji 2,040,000 618,324 2,040,000 723,384
The Manager does not hold any unit in the Fund as at 31 December 2018 and 30 June
2018.
47
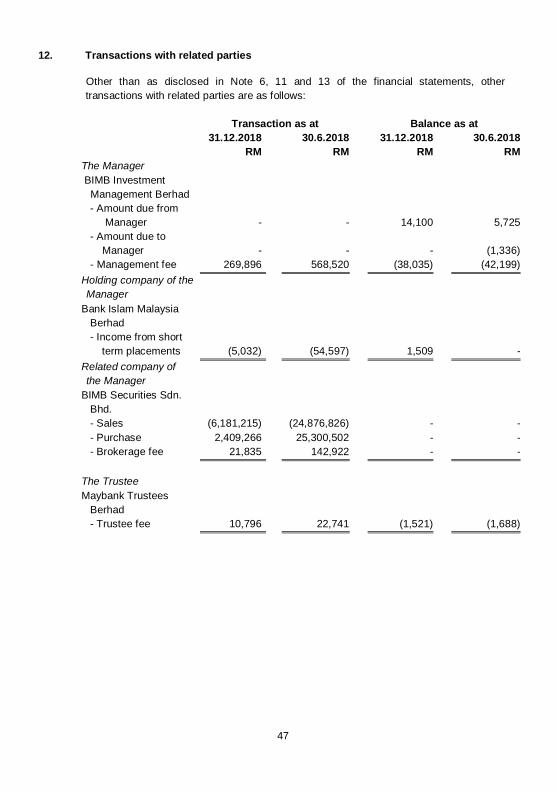
12. Transactions with related parties
Other than as disclosed in Note 6, 11 and 13 of the financial statements, other
transactions with related parties are as follows:
Transaction as at Balance as at
31.12.2018 30.6.2018 31.12.2018 30.6.2018
RM RM RM RM
The Manager
BIMB Investment
Management Berhad
- Amount due from
Manager
-
-
14,100
5,725
- Amount due to
Manager
-
-
-
(1,336)
- Management fee 269,896 568,520 (38,035) (42,199)
Holding company of the
Manager
Bank Islam Malaysia
Berhad
- Income from short
term placements
(5,032)
(54,597)
1,509
-
Related company of
the Manager
BIMB Securities Sdn.
Bhd.
- Sales (6,181,215) (24,876,826) - -
- Purchase 2,409,266 25,300,502 - -
- Brokerage fee 21,835 142,922 - -
The Trustee
Maybank Trustees
Berhad
- Trustee fee 10,796 22,741 (1,521) (1,688)
48
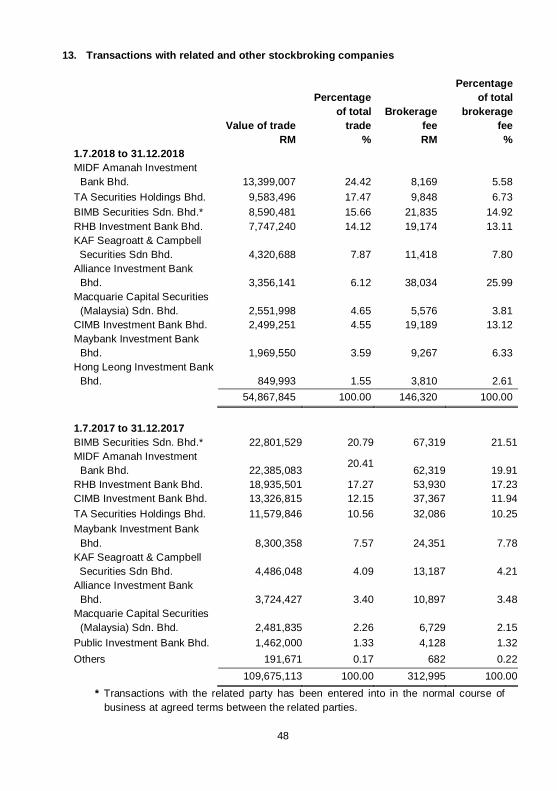
13. Transactions with related and other stockbroking companies
1.7.2018 to 31.12.2018
Value of trade
RM
Percentage
of total
trade
%
Brokerage
fee
RM
Percentage
of total
brokerage
fee
%
MIDF Amanah Investment
Bank Bhd.
13,399,007
24.42
8,169
5.58
TA Securities Holdings Bhd. 9,583,496 17.47 9,848 6.73
BIMB Securities Sdn. Bhd.* 8,590,481 15.66 21,835 14.92
RHB Investment Bank Bhd. 7,747,240 14.12 19,174 13.11
KAF Seagroatt & Campbell
Securities Sdn Bhd.
4,320,688
7.87
11,418
7.80
Alliance Investment Bank
Bhd.
3,356,141
6.12
38,034
25.99
Macquarie Capital Securities
(Malaysia) Sdn. Bhd.
2,551,998
4.65
5,576
3.81
CIMB Investment Bank Bhd. 2,499,251 4.55 19,189 13.12
Maybank Investment Bank
Bhd.
1,969,550
3.59
9,267
6.33
Hong Leong Investment Bank
Bhd.
849,993
1.55
3,810
2.61
54,867,845 100.00 146,320 100.00
1.7.2017 to 31.12.2017
BIMB Securities Sdn. Bhd.* 22,801,529 20.79 67,319 21.51
MIDF Amanah Investment
Bank Bhd.
22,385,083 20.41
62,319
19.91
RHB Investment Bank Bhd. 18,935,501 17.27 53,930 17.23
CIMB Investment Bank Bhd. 13,326,815 12.15 37,367 11.94
TA Securities Holdings Bhd. 11,579,846 10.56 32,086 10.25
Maybank Investment Bank
Bhd.
8,300,358
7.57
24,351
7.78
KAF Seagroatt & Campbell
Securities Sdn Bhd.
4,486,048
4.09
13,187
4.21
Alliance Investment Bank
Bhd.
3,724,427
3.40
10,897
3.48
Macquarie Capital Securities
(Malaysia) Sdn. Bhd.
2,481,835
2.26
6,729
2.15
Public Investment Bank Bhd. 1,462,000 1.33 4,128 1.32
Others 191,671 0.17 682 0.22
109,675,113 100.00 312,995 100.00
* Transactions with the related party has been entered into in the normal course of
business at agreed terms between the related parties.
49
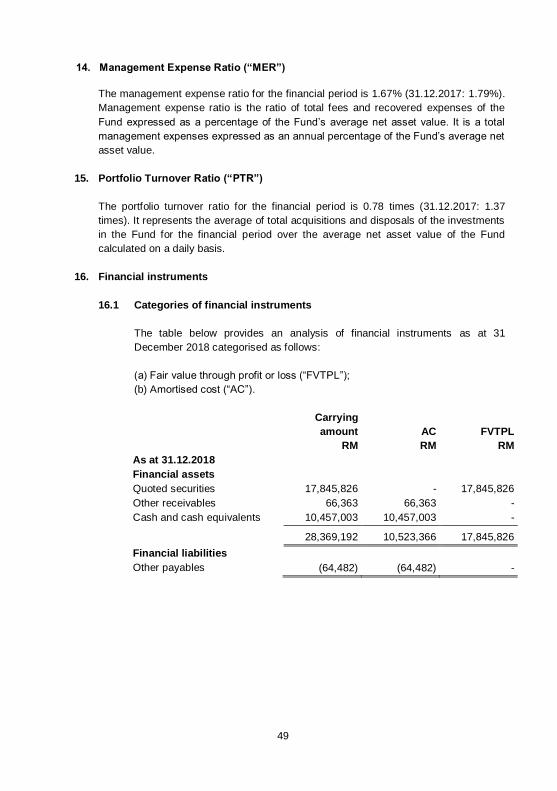
14. Management Expense Ratio (“MER”)
The management expense ratio for the financial period is 1.67% (31.12.2017: 1.79%).
Management expense ratio is the ratio of total fees and recovered expenses of the
Fund expressed as a percentage of the Fund’s average net asset value. It is a total
management expenses expressed as an annual percentage of the Fund’s average net
asset value.
15. Portfolio Turnover Ratio (“PTR”)
The portfolio turnover ratio for the financial period is 0.78 times (31.12.2017: 1.37
times). It represents the average of total acquisitions and disposals of the investments
in the Fund for the financial period over the average net asset value of the Fund
calculated on a daily basis.
16. Financial instruments
16.1 Categories of financial instruments
The table below provides an analysis of financial instruments as at 31
December 2018 categorised as follows:
(a) Fair value through profit or loss (“FVTPL”);
(b) Amortised cost (“AC”).
Carrying
amount
RM
AC
RM
FVTPL
RM
As at 31.12.2018
Financial assets
Quoted securities 17,845,826 - 17,845,826
Other receivables 66,363 66,363 -
Cash and cash equivalents 10,457,003 10,457,003 -
28,369,192 10,523,366 17,845,826
Financial liabilities
Other payables (64,482) (64,482) -
50
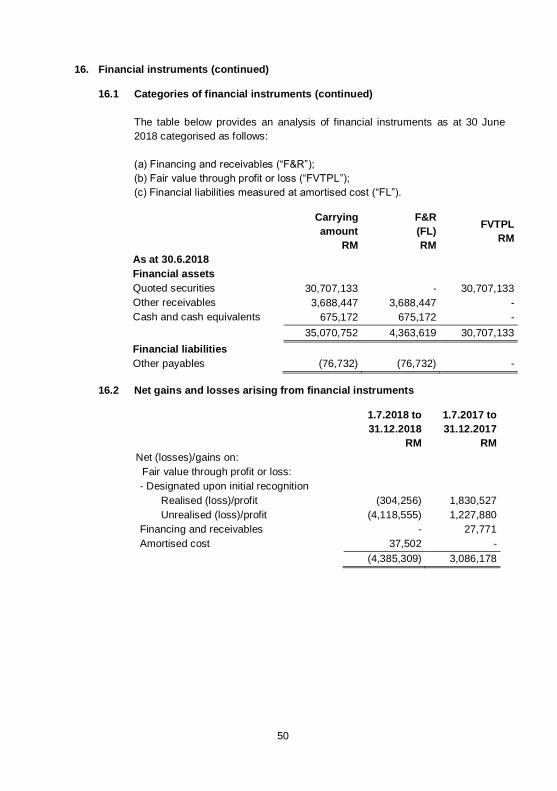
16. Financial instruments (continued)
16.1 Categories of financial instruments (continued)
The table below provides an analysis of financial instruments as at 30 June
2018 categorised as follows:
(a) Financing and receivables (“F&R”);
(b) Fair value through profit or loss (“FVTPL”);
(c) Financial liabilities measured at amortised cost (“FL”).
Carrying
amount
RM
F&R
(FL)
RM
FVTPL
RM
As at 30.6.2018
Financial assets
Quoted securities 30,707,133 - 30,707,133
Other receivables 3,688,447 3,688,447 -
Cash and cash equivalents 675,172 675,172 -
35,070,752 4,363,619 30,707,133
Financial liabilities
Other payables (76,732) (76,732) -
16.2 Net gains and losses arising from financial instruments
1.7.2018 to
31.12.2018
RM
1.7.2017 to
31.12.2017
RM
Net (losses)/gains on:
Fair value through profit or loss:
- Designated upon initial recognition
Realised (loss)/profit (304,256) 1,830,527
Unrealised (loss)/profit (4,118,555) 1,227,880
Financing and receivables - 27,771
Amortised cost 37,502 -
(4,385,309) 3,086,178
51
16. Financial instruments (continued)
16.3 Financial risk management
The Fund has exposure to the following risks from its use of financial
instruments:
Credit risk
Liquidity risk
Market risk
16.4 Credit risk
Credit risk is the risk of a financial loss to the Fund if a counterparty to a
financial instrument fails to meet its contractual obligations. The Fund’s
exposure to credit risk arises principally from its investment securities ,
receivables and cash and cash equivalents.
Risk management objectives, policies and processes for managing the risk
The Manager manages the credit risk by setting counterparty limits and
undertaking credit evaluation to minimise the risk. The exposure to credit risk
is monitored on an ongoing basis.
Exposure to credit risk
The Fund’s maximum credit risk exposure at the reporting date is represented
by the respective carrying amounts of the relevant financial assets in the
statement of financial position.
16.5 Liquidity risk
Liquidity risk is the risk that the Fund will not be able to meet its financial obligations
as they fall due. The Fund’s exposure to liquidity risk arises principally from its
various payables which are due within one year.
The Fund maintains sufficient level of liquid assets, after consultation with the
Trustee, to meet anticipated payments and cancellation of units by unitholders.
Liquid assets comprise cash and other instruments, which are capable of
being converted into cash within 7 days.
16.6 Market risk
Market risk is the risk that changes in market prices, such as profit rates and
market prices will affect the Fund’s financial position or cash flows.
52
16. Financial instruments (continued)
16.6 Market risk (continued)
Profit rate risk (continued)
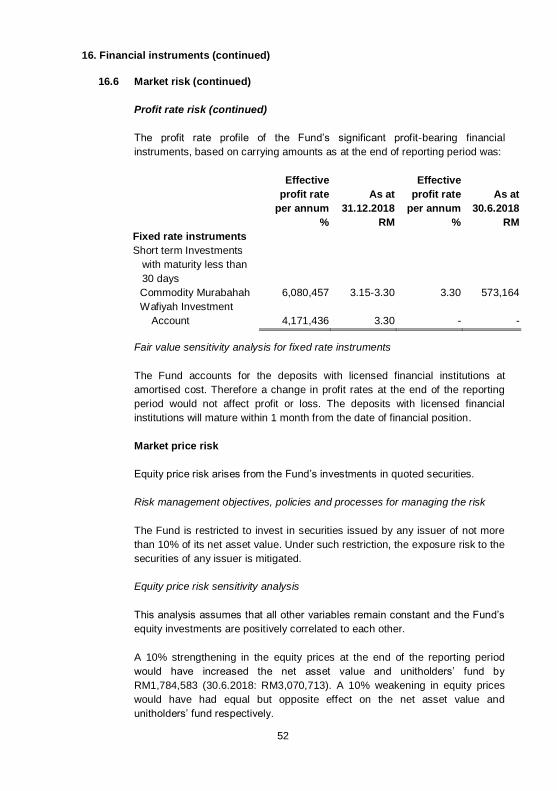
The profit rate profile of the Fund’s significant profit-bearing financial
instruments, based on carrying amounts as at the end of reporting period was:
Effective
profit rate
per annum
As at
31.12.2018
Effective
profit rate
per annum
As at
30.6.2018
% RM % RM
Fixed rate instruments
Short term Investments
with maturity less than
30 days
Commodity Murabahah 6,080,457 3.15-3.30 3.30 573,164
Wafiyah Investment
Account 4,171,436 3.30 - -
Fair value sensitivity analysis for fixed rate instruments
The Fund accounts for the deposits with licensed financial institutions at
amortised cost. Therefore a change in profit rates at the end of the reporting
period would not affect profit or loss. The deposits with licensed financial
institutions will mature within 1 month from the date of financial position.
Market price risk
Equity price risk arises from the Fund’s investments in quoted securities.
Risk management objectives, policies and processes for managing the risk
The Fund is restricted to invest in securities issued by any issuer of not more
than 10% of its net asset value. Under such restriction, the exposure risk to the
securities of any issuer is mitigated.
Equity price risk sensitivity analysis
This analysis assumes that all other variables remain constant and the Fund’s
equity investments are positively correlated to each other.
A 10% strengthening in the equity prices at the end of the reporting period
would have increased the net asset value and unitholders’ fund by
RM1,784,583 (30.6.2018: RM3,070,713). A 10% weakening in equity prices
would have had equal but opposite effect on the net asset value and
unitholders’ fund respectively.
53
16. Financial instruments (continued)
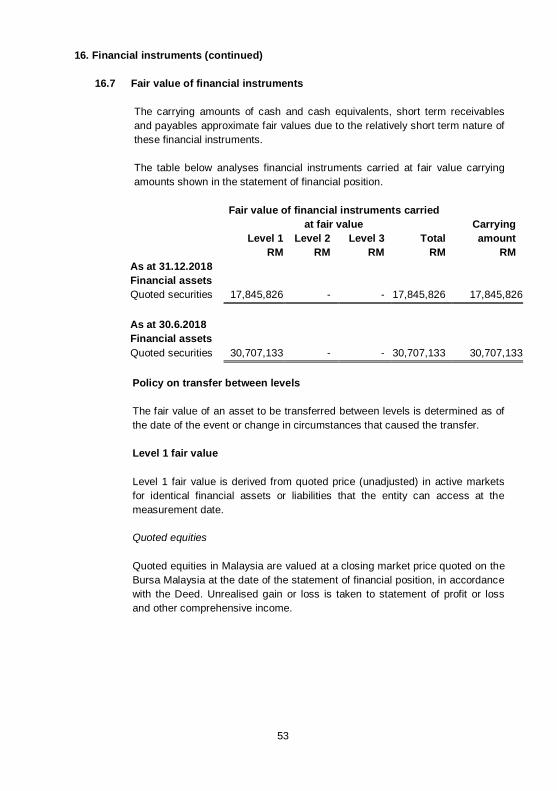
16.7 Fair value of financial instruments
The carrying amounts of cash and cash equivalents, short term receivables
and payables approximate fair values due to the relatively short term nature of
these financial instruments.
The table below analyses financial instruments carried at fair value carrying
amounts shown in the statement of financial position.
Fair value of financial instruments carried
at fair value
Carrying
Level 1 Level 2 Level 3 Total amount
RM RM RM RM RM
As at 31.12.2018
Financial assets
Quoted securities 17,845,826 - - 17,845,826 17,845,826
As at 30.6.2018
Financial assets
Quoted securities 30,707,133 - - 30,707,133 30,707,133
Policy on transfer between levels
The fair value of an asset to be transferred between levels is determined as of
the date of the event or change in circumstances that caused the transfer.
Level 1 fair value
Level 1 fair value is derived from quoted price (unadjusted) in active markets
for identical financial assets or liabilities that the entity can access at the
measurement date.
Quoted equities
Quoted equities in Malaysia are valued at a closing market price quoted on the
Bursa Malaysia at the date of the statement of financial position, in accordance
with the Deed. Unrealised gain or loss is taken to statement of profit or loss
and other comprehensive income.
54
16. Financial instruments (continued)
16.7 Fair value of financial instruments (continued)
Policy on transfer between levels (continued)
Level 2 fair value
Level 2 fair value is estimated using inputs other than quoted prices included
within Level 1 that are observable for the financial assets or liabilities, either
directly or indirectly.
Transfers between Level 1 and Level 2 fair values
There has been no transfer between Level 1 and 2 fair values during the
financial period (30.6.2018: no transfer in either direction).
Level 3 fair value
Level 3 fair value is estimated using unobservable inputs for the financial
assets and liabilities.
17. Capital management
The Fund’s capital is represented by the unitholders’ fund in the statement of financial
position. The Manager of the Fund monitors the adequacy of capital on an ongoing
basis. There is no external capital requirement imposed on the Fund.
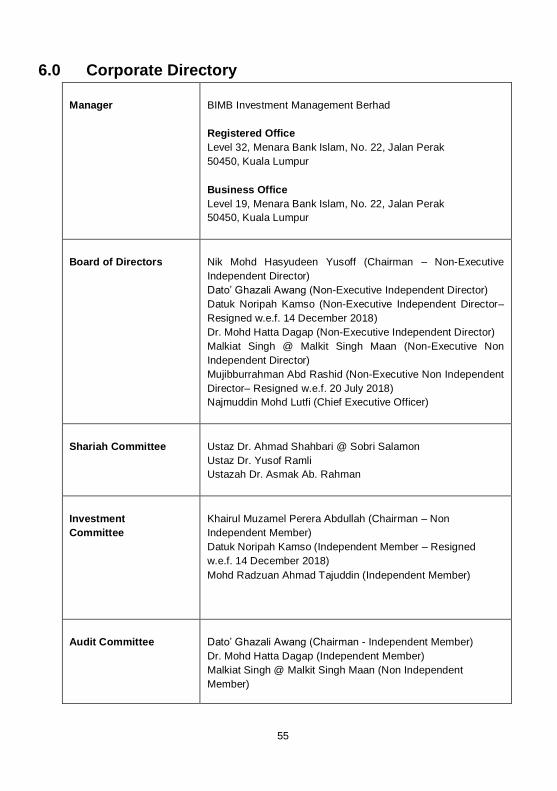
55
6.0 Corporate Directory
Manager BIMB Investment Management Berhad
Registered Office
Level 32, Menara Bank Islam, No. 22, Jalan Perak
50450, Kuala Lumpur
Business Office
Level 19, Menara Bank Islam, No. 22, Jalan Perak
50450, Kuala Lumpur
Board of Directors Nik Mohd Hasyudeen Yusoff (Chairman – Non-Executive
Independent Director)
Dato’ Ghazali Awang (Non-Executive Independent Director)
Datuk Noripah Kamso (Non-Executive Independent Director–
Resigned w.e.f. 14 December 2018)
Dr. Mohd Hatta Dagap (Non-Executive Independent Director)
Malkiat Singh @ Malkit Singh Maan (Non-Executive Non
Independent Director)
Mujibburrahman Abd Rashid (Non-Executive Non Independent
Director– Resigned w.e.f. 20 July 2018)
Najmuddin Mohd Lutfi (Chief Executive Officer)
Shariah Committee Ustaz Dr. Ahmad Shahbari @ Sobri Salamon
Ustaz Dr. Yusof Ramli
Ustazah Dr. Asmak Ab. Rahman
Investment
Committee
Khairul Muzamel Perera Abdullah (Chairman – Non
Independent Member)
Datuk Noripah Kamso (Independent Member – Resigned
w.e.f. 14 December 2018)
Mohd Radzuan Ahmad Tajuddin (Independent Member)
Audit Committee Dato’ Ghazali Awang (Chairman - Independent Member)
Dr. Mohd Hatta Dagap (Independent Member)
Malkiat Singh @ Malkit Singh Maan (Non Independent
Member)
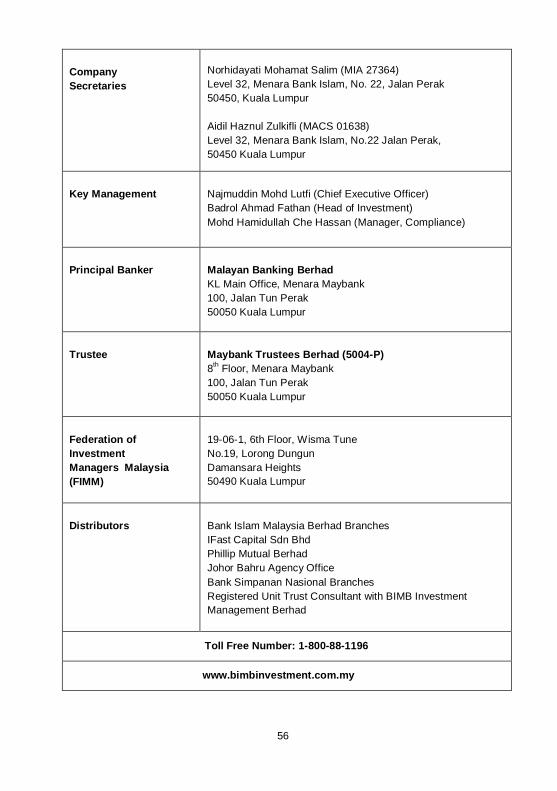
56
Company
Secretaries
Norhidayati Mohamat Salim (MIA 27364)
Level 32, Menara Bank Islam, No. 22, Jalan Perak
50450, Kuala Lumpur
Aidil Haznul Zulkifli (MACS 01638)
Level 32, Menara Bank Islam, No.22 Jalan Perak,
50450 Kuala Lumpur
Key Management Najmuddin Mohd Lutfi (Chief Executive Officer)
Badrol Ahmad Fathan (Head of Investment)
Mohd Hamidullah Che Hassan (Manager, Compliance)
Principal Banker Malayan Banking Berhad
KL Main Office, Menara Maybank
100, Jalan Tun Perak
50050 Kuala Lumpur
Trustee Maybank Trustees Berhad (5004-P)
8th Floor, Menara Maybank
100, Jalan Tun Perak
50050 Kuala Lumpur
Federation of
Investment
Managers Malaysia
(FIMM)
19-06-1, 6th Floor, Wisma Tune
No.19, Lorong Dungun
Damansara Heights
50490 Kuala Lumpur
Distributors Bank Islam Malaysia Berhad Branches
IFast Capital Sdn Bhd
Phillip Mutual Berhad
Johor Bahru Agency Office
Bank Simpanan Nasional Branches
Registered Unit Trust Consultant with BIMB Investment
Management Berhad
Toll Free Number: 1-800-88-1196
www.bimbinvestment.com.my

THIS PAGE INTENTIONALLY LEFT BLANK