Embed Size (px)
Citation preview

1321313131313131333132222222222
ANNEXES

133
E-GOVERNMENT IN SUPPORT OF SUSTAINABLE DEVELOPMENT
An
nexes
AnnexesSurvey Methodology
A.1. E-Government Development Index (EGDI):An Overview
Mathematically, the E-Government Development Index (EGDI) is a weighted average of normalised scores on the three most important dimensions of e-government, namely: scope and quality of online services (Online Service Index, OSI), status of the development of telecommunication infrastructure (Telecommunication Infrastructure Index, TII) and inherent human capital (Human Capital Index, HCI). Each of these sets of indices is in itself a composite measure that can be extracted and analysed independently (See Figure A.1).
Prior to the normalization of the three component indicators, the Z-score standardization procedure is implemented for each componentindicator to ensure that the overall EGDI is equally decided by the threecomponent indexes, (i.e., each component index presents comparablevariance subsequent to the Z-score standardization.) In the absence ofthe Z-score standardization treatment, the EGDI would mainly dependon the component index with the greatest dispersion. After the Z-scorestandardization, the arithmetic average sum becomes a good statisticalindicator, where “equal weights” truly means “equal importance.”
For standard Z-score calculation of each component indicator:
Where:
x is a raw score to be standardized;
μ is the mean of the population;
is the standard deviation of the population.
The composite value of each component index is then normalised to fall between the range of 0 to 1 and the overall EGDI is derived by taking the arithmetic average of the three component indexes.
As indicated, the EGDI is used as a benchmark to provide a numerical ranking of e-government development across United Nations Member States. While the methodological framework for EGDI has remained consistent across the Survey editions, each edition of the Survey has been adjusted to reflect emerging trends of e-government strategies, evolving knowledge of best practices in e-government, changes in technology and other factors. In addition, data collection practices have been periodically refined.
EGDI =1 (OSI normalized +TII normalized + HCI normalized)3
xnew= (x- μ)
In this chapter:
Annexes 131
A.1. E-Government DevelopmentIndex (EGDI): An Overview 131
A.2. Telecommunication InfrastructureIndex (TII) 132
A.3. Human Capital Index (HCI) 134
A.4. Online Service Index (OSI) 136
A.5. Challenges in reviewing acountry’s online presence 137
A.6. E-Participation Index (EPI) 139
A.7. Country Classifications andNomenclature in the Survey 140
A.8. United Nations e-governmentknowledge base 140
A.9. Evolving definitions and understandingsof e-Government and its related development 141
A.10. Matrix of assessment parameters used inthe UN E-Government Surveys in relation to relevant Sustainable Development Goals (SDGs) and Targets 141
Data tables 144
Ref rences 193
Chapter 1 193
Chapter 2 199
Chapter 3 203
Chapter 4 206
Chapter 5 210
Photo credit: nmedia/Shutterstock.com
Annexes

134
ANNEXES
An
nexes
A.2. Telecommunication Infrastructure Index (TII)
The Telecommunication Infrastructure Index (TII) is an arithmetic average composite of five indicators: (i) estimated internet users per 100 inhabitants; (ii) number of main fixed telephone lines per 100 inhabitants; (iii) number of mobile subscribers per 100 inhabitants; (iv) number of wireless broadband subscriptions per 100 inhabitants; and (v) number of fixed broadband subscriptions per 100 inhabitants. The International Telecommunication Union is the primary source of data in each case. (See Figure A.2)
The definitions of the five components of TII1 are:
1. Internet users (per 100 inhabitants) refer to individuals who used the Internet from any location in the last three months.2
2. Main fixed telephone lines (per 100 inhabitants) refers to telephone lines connecting a customer’s terminal equipment (e.g., telephone set, facsimile machine) to the public switched telephone network (PSTN), which has a dedicated port on a telephone exchange. This term is synonymous with the terms main station or Direct Exchange Line (DEL), which are commonly used in telecommunication documents. It may not be the same as an access line or a subscription.
3. Mobile subscribers (per 100 inhabitants) are the number of subscriptions to mobile service in the last three months. A mobile (cellular) telephone refers to a portable telephone subscribed to a public mobile telephone service using cellular technology, which provides access to the PSTN. This includes analogue and digital cellular systems and technologies such as IMT-2000 (3G) and IMT-Advanced. Users of both post-paid subscriptions and prepaid accounts are included.
1 ITU - http://www.itu.int/dms_pub/itu-d/opb/ind/D-IND-ITCMEAS-2014-PDF-E.pdf 2 Note: The Internet is a worldwide public computer network. It provides access to a number of communication services including
the World Wide Web and carries e-mail, news, entertainment and data files, irrespective of the device used (not assumed to be only via a computer − it may also be by mobile telephone, tablet, PDA, games machine, digital TV etc.). Access can be via a fixed or mobile network. (Ibid)
3 https://www.itu.int/en/ITU-D/Statistics/Documents/publications/mis2014/MIS2014_without_Annex_4.pdf p.223 Note: Satellite broadband subscriptions refers to the number of satellite Internet subscriptions with an advertised download speed
of at least 256 kbit/s. It refers to the retail subscription technology and not the backbone technology. Terrestrial fixed wireless broadband subscriptions refers to the number of terrestrial fixed wireless Internet subscriptions with an advertised download speed of at least 256 kbit/s. This includes fixed WiMAX and fixed wireless subscriptions, but excludes occasional users at hotspots and Wi-Fi hotspot subscribers. It also excludes mobilebroadband subscriptions where users can access a service throughout the country wherever coverage is available. Active mobile-broadband subscriptions refers to the sum of standard mobilebroadband subscriptions and dedicated mobile-broadband data subscriptions to the public Internet. It covers actual subscribers, not potential subscribers, even though the latter may have broadband-enabled handsets.
Figure A.1. The three components of the E-Government Development Index
(EGDI)
OSI1/3
TII1/3
HCI1/3
EGDI
OSI—Online Service Index
TII—TelecommunicationInfrastructure Index
HCI—Human Capital Index

135
E-GOVERNMENT IN SUPPORT OF SUSTAINABLE DEVELOPMENT
An
nexes
4. Wireless-broadband subscriptions refers to the sum of satellite broadband, terrestrial fixed wireless broadband and active mobile-broadband subscriptions to the public Internet.3
5. Fixed broadband subscriptions (per 100 inhabitants) refers to fixed subscriptions to high-speed access to the public Internet (a TCP/IP connection), at downstream speeds equal to, or greater than, 256 kbit/s. This includes cable modem, DSL, fibre-to-the-home/building, other fixed (wired)-broadband subscriptions, satellite broadband and terrestrial fixed wireless broadband. This total is measured irrespective of the method of payment.
It excludes subscriptions that have access to data communications (including the Internet) via mobile-cellular networks. It should include fixed WiMAX and any other fixed wireless technologies. It includes both residential subscriptions and subscriptions for organizations.
The TII has remained largely unchanged since 2002, except for the replacement of online population with fixed-broadband subscription and the removal of number of television sets in 2008; the replacement of personal computer (PC) users with fixed Internet subscriptions in 2012; and the replacement of fixed Internet subscriptions with wireless broadband subscriptions in 2014 (See Table A.1).
Each of these indicators was standardised via the Z-score procedure to derive the Z-score for each component indicator. The telecommunication infrastructure composite value for country “x” is the simple arithmetic mean of the five standardised indicators derived this way:
Telecommunication infrastructure composite value=
Average (Internet user Z-score
+ Telephone line Z-score
+ Mobile subscription Z-score
Figure A.2. Telecommunication Infrastructure Index (TII) and its components
TII
1/5 1/5
1/51/5
1/5
Mobile-cellularsubscriptions (per 100)
Fixed-telephonesubscriptions (per 100)
Individuals using the Internet(% population)
Fixed (wired)-broadbandsubscriptions (per 100)
Wireless broadbandsubscriptions (per 100)

136
ANNEXES
An
nexes
+ Wireless broadband subscription Z-score
+ Fixed broadband Z-score)
Finally, the TII composite value is normalized by taking its value for a given country, subtracting
the lowest composite value in the Survey and dividing by the range of composite values for all countries. For example, if country “x” has the composite value of 1.3813, and the lowest composite value for all countries is -1.1358 and the highest is 2.3640, then the normalized value of TII for country “x” would be:
A.3. Human Capital Index (HCI)
The Human Capital Index (HCI) consists of four components, namely: (i) adult literacy rate; (ii) the combined primary, secondary and tertiary gross enrolment ratio; (iii) expected years of schooling; and (iv) average years of schooling. (See Figure A.3)
Figure A.3. Human Capital Index (HCI) and its components
HCI
1/3
2/9
2/92/9
Adult literacy (%)
Gross enrolment ratio (%) Expected years of schooling
Mean years of schooling
TII (Country “x”)= [1.3813–(–1.1358)]
[2.3640–(–1.1358)] = 0.7192
Table A.1. Telecommunication infrastructure index (TII) and changes of its components (2003-2016)
TII (2001) TII (2003) TII (2004) TII (2005) TII (2008) TII (2010) TII (2012) TII (2014) TII (2016)
Internet users
Internet users
Internet users
Internet users
Internet users
Internet users
Internet users
Internet users
Internet users
Online population
Online population
Online population
Online population
Fixed-broad-band subscriptions
Fixed-broad-band subscriptions
Fixed-broad-band subscriptions
Fixed-broad-band subscriptions
Fixed-broad-band subscriptions
Personal computer (PC) users
Personal computer (PC) users
Personal computer (PC) users
Personal computer (PC) users
Personal computer (PC) users
Personal computer (PC) users
Fixed Inter-net subscrip-tions
Wireless broadband subscriptions
Wireless broadband subscriptions
Fixed-tele-phone sub-scriptions
Fixed-tele-phone subscrip-tions
Fixed-tele-phone subscrip-tions
Fixed-tele-phone subscrip-tions
Fixed-tele-phone subscriptions
Fixed-tele-phone subscriptions
Fixed-tele-phone subscriptions
Fixed-tele-phone subscriptions
Fixed-tele-phone subscriptions
Mobile-cel-lular sub-scriptions
Mobile-cel-lular sub-scriptions
Mobile-cel-lular sub-scriptions
Mobile-cel-lular sub-scriptions
Mobile- cellular subscriptions
Mobile- cellular subscriptions
Mobile- cellular subscriptions
Mobile- cellular subscriptions
Mobile- cellular subscriptions
Television sets
Television sets
Television sets
Television sets
- - - - -
137
E-GOVERNMENT IN SUPPORT OF SUSTAINABLE DEVELOPMENT
An
nexes
The definitions of the four indicators of HCI are:
1. Adult literacy is measured as the percentage of people aged 15 years and above who can, with understanding, both read and write a short simple statement on their everyday life.
2. Gross enrolment ratio is measured as the combined primary, secondary and tertiary gross enrolment ratio, of the total number of students enrolled at the primary, secondary and tertiary level, regardless of age, as a percentage of the population of school age for that level.
3. Expected years of schooling is the total number of years of schooling that a child of a certain age can expect to receive in the future, assuming that the probability of his or her being in school at any particular age is equal to the current enrolment ratio age .
4. Mean years of schooling (MYS) provides the average number of years of education completed by a country’s adult population (25 years and older), excluding the years spent repeating grades (add reference 6).
The first two components, i.e. adult literacy rate and the combined primary, secondary and tertiary gross enrolment ratio have been used for the past Surveys since 2002. Recognizing that education is the fundamental pillar in supporting human capital, the 2014 Survey introduced two new components to the human capital index (HCI), namely (i) expected years of schooling; and (ii) mean years of schooling. The preliminary statistical study commissioned by DESA/DPADM validated the use of the new HCI, accentuating that the two new components has strengthened the HCI and it does not introduce any error (UNDESA, 2014) (See Table A.2).
The HCI is a weighted average composite of the four indicators. Similar to calculating the TII, each of the four component indicators is first standardized via the Z-score procedure to derive the Z-score value for each component indicator. The human capital composite value for country “x” is the weighted arithmetic mean with one-third weight assigned to adult literacy rate and two-ninth weight assigned to the gross enrolment ratio, estimated years of schooling and mean years of schooling derived this way:
Human capital composite value =
1⁄3× Adult literacy rate Z-score +
2⁄9× Gross enrolment ratio Z-score +
2⁄9 × Estimated years of schooling Z-score +
2⁄9 × Mean years of schooling Z-score
Table A.2. Human Capital Index and changes of its components (2003–2014)
Components of HCI in past Surveys (2002, 2003, 2004, 2005, 2008, 2010, 2012) Components of HCI in 2014 Survey
Adult literacy Adult literacy
Gross enrolment ratio Gross enrolment ratio
- Expected years of schooling
- Mean years of schooling

138
ANNEXES
An
nexes
Then, the human capital composite value is normalized by taking its composite value for a given country, subtracting the lowest composite value in the Survey and dividing by the range of composite values for all countries. For example, if country “x” has the composite value at 0.8438, and the lowest composite value for all countries is –3.2354 and the highest equal to 1.2752, then the normalized value of the Human Capital Index for country “x” would be:
A.4. Online Service Index (OSI)
To arrive at a set of Online Service Index (OSI) values for 2016, a total of 111 researchers, including UN experts and online United Nations Volunteers (UNVs) from over 60 countries with coverage of 66 languages assessed each country’s national website in the native language, including the national portal, e-services portal and e-participation portal, as well as the websites of the related ministries of education, labour, social services, health, finance and environment as applicable. The UNVs included qualified graduate students and volunteers from universities in the field of public administration.
To ensure consistency of assessments, all the researchers were provided with a rigorous training by e-government and online service delivery experts with years of experience in conducting the assessments, and were guided by Data Team Coordinators who provided support and guidance throughout the assessment period. Researchers were instructed and trained to assume the mind-set of an average citizen user in assessing sites. Thus, responses were generally based on whether the relevant features could be found and accessed easily, not whether they in fact exist although hidden somewhere on the sites. The key point is that the average user needs to find information and features quickly and intuitively for a site to be “usable” with content readily discoverable by the intended beneficiaries.
The data collection and Survey research ran from May 2015 until the end of July 2015. Each country was assessed by at least two researchers who conducted the Survey in the country’s national language. After the initial assessment, the evaluations by the two researchers on each country were compared and questions with discrepancies were reviewed again by the researchers. The third phase, from July to August, was the final review by the Data Team Coordinators who analyzed all the answers and, where needed, carried out further review and verification processes using multiple methods and sources. The scores were then sent for approval by a senior researcher. Through this multilevel approach, all surveyed sites were thoroughly assessed by at least three people, one of whom has years of experience in assessing public sector online services, and reviewed by one of the Data Team Coordinators.
Once the evaluation phase was completed, the statistics team produced the first draft of the OSI ranking. The data was extracted from the platform and the raw OSI scores were created. Rankings were compared with previous OSI scores, and any discrepancies were reviewed thoroughly.
Each question calls for a binary response. Every positive answer generates a new “more in depth question” inside and across the patterns. The outcome is an enhanced quantitative Survey with a wider range of point distributions reflecting differences in levels of e-government development among countries.
The total number of points scored by each country is normalised to the range of 0 to 1. The online index value for a given country is equal to the actual total score less the lowest total score divided by the range of total score values for all countries. For example, if country “x” has a score of 114, and the lowest score of any country is 0 and the highest equal to 153, then the online services value for country “x” would be:
Human Capital Index (Country “x”) = [0.8438–(–3.2354)]
[1.2752–(–3.2354)] = 0.9044

139
E-GOVERNMENT IN SUPPORT OF SUSTAINABLE DEVELOPMENT
An
nexes
A.5. Challenges in reviewing a country’s online presence
Selecting the appropriate site/URL at the national level
As done for each edition of the Survey, the United Nations Member States were requested to provide information regarding their website addresses (URL) for different government ministries and the national portal(s). Information was also requested with regards to open government data, e-participation and the designated authority in charge of e-government policies. Sixty-two (62) Member States returned this information and all appropriate sites were then utilised during the verification process.
One of the essential decisions for researchers when undertaking this Survey is to identify the specific site(s) to review as the national government site for each country. Regardless of the sophistication of e-government in a specific country, the priority for users is to find a clear indication as to which of the many potentially available government sites could be deemed as the “official” national government site – in a sense, the gateway or starting point for national users. Not only is this fairly easy to do – a simple, clear statement at the chosen website is sufficient to start—but it is also an important step towards providing government information and services to the public in an integrated, usable and easy-to-find manner. Many countries have in fact engaged in the procedure of actually noting on their national site that it is their “official” Government site, or “Gateway to Government,” or other such statement.
Yet not all countries provided the appropriate URLs. Thus, some discretion is exerted when deciding whether to use only the country-provided websites. What is noteworthy in this Survey is that the researchers not only reviewed the national portals but also undertook exhaustive research on e-participation and open government data where applicable.
One dilemma facing researchers is that a number of countries provide more than one apparently legitimate national access point. While some have simply not yet consolidated their government entry points into a single site or portal that could be clearly distinguished, others have actually taken this approach on purpose – offering different access points to different audiences. Considering that the use of integrated portals or multi-portals is emerging as a trend in e-government strategies worldwide, researchers would select the integrated website as a National Portal or other portal if it was deemed to be the official homepage of the government. However, more than one site could be scored if the sites were clearly part of a tightly integrated “network” of national sites. It should be noted that for those countries for which more than one site was assessed, having more than one national entry is neither a disadvantage nor a benefit.
Some countries do not offer certain public services at the federal level, but rather at the sub-national or local level. No country is penalised for offering a service at the sub-national level as opposed to the federal level per se. In fact, when the issue arises researchers tend to be inclusive in assessing the matter as long as the information and/or service can be found from the national level.
A more difficult problem arises when not only a specific service is located at the local level but when the entire ministerial functions are altogether missing at the national level. If researchers are unable to locate a ministry as per the above described method, then the next step is to find out whether the country in question actually has such a ministry at the national level or whether the functions might be locally administered.
Online Service Index (Country “x”) = (114–0)
(153–0) = 0.7451

140
ANNEXES
An
nexes Integrated Portal and Multi-Portal Approaches
Some countries have adopted a different approach to their online e-government portal, through utilizing multiple websites for different topics. Hence, instead of centralizing all the e-information, e-services, e-participation, open data and other online features in one portal, they have been made available on separate websites for a more audience-targeted approach. Researchers made sure to examine all possible websites when making the assessment, through links or search engines, to cover all government websites where relative information can be found.
Even though the norm has been to follow a one-stop-shop type of service delivery and an integrated portal approach, countries who have used a decentralised approach have not been penalised in their score, and the assessment was conducted as though for an integrated approach.
For example, Finland has a website www.valtioneuvosto.fi, which is the information portal of the Finnish Government, whereas the website www.suomi.fi is the e-service and public service information portal and also has open government data. Information on e-participation is centralised on the websites www.kansalaisaloite.fi and www.otakantaa.fi. This approach of having several websites for different purposes (information, services, participation and open government data) is typical of several European countries.
Accessing in national official languages
The research team was fully equipped to handle the six official languages of the United Nations, namely Arabic, Chinese, English, French, Russian and Spanish. However, as in previous Survey cycles, the team went beyond this mandate and made an effort to review each website in the official language of the country, or where that was not possible, in another of the languages available on the site. Translators provided assistance as necessary so that possible errors based on language have been reduced to a minimum.
Data quality checks
In order to ensure data quality, UNDESA has put Survey procedures under close monitoring including by developing a web-based application platform for data collection and storage, preparing the methodological and training guidelines for researchers, and instituting a training programme for either group training or individual hands-on support for researchers to resolve thorny issues.
Among other tasks, team members were asked to justify the selection of URLs and indicate whether the URLs had been reviewed in past Surveys. Regular discussions were held to discuss concerns and ensure consistency of evaluation methods.
UNDESA applied the Survey scores to generate an ordering of online service presence of all United Nations Member States and compared them with the historical results in previous Surveys so as to detect possible shortcomings in the process. The new scores are then compared to scores from the previous Surveys by removing the new questions and only considering the ones that remain unchanged. The team was assisted in the research by United Nations interns and volunteers with language skills not otherwise covered by the core group.
Towards a more citizen-centric approach
In line with the global trend towards a more citizen-centric approach and the demand for greater efficiency and cost-effectiveness of the public sector, the Survey questionnaire has been designed to reflect this paradigm of e-government. As mentioned above, user take-up has been included as one special subject in the Survey, which encourages governments to take account not only

141
E-GOVERNMENT IN SUPPORT OF SUSTAINABLE DEVELOPMENT
An
nexes
of the supply side but also the demand side of e-services. Accordingly, the research team was instructed to enforce this approach consistently throughout the whole Survey. If features could not be found easily, quickly and intuitively, then a site would score poorly.
A.6. E-Participation Index (EPI)
The e-participation index (EPI) is derived as a supplementary index to the UN E-Government Survey. It extends the dimension of the Survey by focusing on the use of online services to facilitate provision of information by governments to citizens (“e-information sharing”), interaction with stakeholders (“e-consultation”) and engagement in decision-making processes (“e-decision-making;” See Box A.1)
A country’s EPI reflects its e-participation mechanisms that are deployed by the government as compared to all other countries. The purpose of this measure is not to prescribe any particular practice, but rather to offer insight into how different countries are using online tools to promote interaction between citizen and government, as well as among citizens, for the benefit of all. As the EPI is a qualitative assessment based on the availability and relevance of participatory services available on government websites, the comparative ranking of countries is for illustrative purposes and should serve only as an indicator of the broad trends in promoting citizen engagement. As with the EGDI, the EPI is not intended as an absolute measurement of e-participation, but rather, it attempts to capture the e-participation performance of counties relative to one another at a particular point in time.
In the 2016 Survey, the e-participation questions were carefully reviewed and expanded to reflect current trends and modalities in how governments engage their citizens in public policy-making, implementation and evaluation. New questions were added to address data publishing and sharing by government agencies. Other updates included: the availability of information on the citizens’ rights to access government information; feedback from citizens concerning the improvement of online public services; and tools about public opinion regarding policy deliberation through social media, online polls and online discussion forums. While the EPI provides a useful qualitative analytical tool when comparing the data and ranking of countries for one particular year, caution must be taken in comparing e-participation rankings with past editions of the Survey.
Mathematically, the EPI is normalised by taking the total score value for a given country subtracting the lowest total score for any country in the Survey and dividing by the range of total score values for all countries. For example, if country “x” has an e-participation score of 29, and the lowest value of any country is 0 and the highest equal to 38, then the normalised index value for country “x” would be:
A.1. E-Participation Framework
• E-information: Enabling participation by providing citizens with public information and access to information without or upon demand
• E-consultation: Engaging citizens in contributions to and deliberation on public policies and services
• E-decision-making: Empowering citizens through co-design of policy options and co-production of service components and delivery modalities.
E-Participation Index (Country “x”) = (29–0)
(38–0) = 0.7632
142
ANNEXES
An
nexes
The e-participation ranking of countries is determined by the value of EPI through the “standard competition ranking”. In standard competition ranking, countries with the same EPI receive the same ranking number and a gap is left in the ranking numbers. This ranking strategy is adopted in view that if two or more countries tie for a position in the ranking, the positions of all those ranked below them are unaffected. For example, if country A ranks ahead of B and C, both of which share the same EPI value and scores ahead of D, then A is ranked first (1st), B and C are ranked second (2nd) and D is ranked fourth (4th). In 2012, the “modified competition ranking” was used and for comparison reasons, all ranks were adjusted in 2014 and 2016 using the standard competition ranking.
A.7. Country Classifications and Nomenclature in the Survey
Regional groupings are taken from the classification of the United Nations Statistics Division. For details, see http://unstats.un.org/unsd/methods/m49/m49regin.htm.
Economies are divided according to 2015 GNI per capita, calculated using the World Bank Atlas method. The groups are: low income, USD $1,045 or less; lower middle income, USD $1,046 - $4,125; upper middle income, USD $4,126 - $12,735; and high income, US $12,736 or more. (Accessed on 14 December 2015). Wherever data and statistics are reported by income groups, the report classifies countries according to the World Bank income classification of high, middle and low income groups.
For details, see http://data.worldbank.org/about/country-classifications.
The lists of least developing countries, landlocked developing countries and small island developing countries were obtained from the United Nations Office of the High Representative for the Least Developed Countries, Landlocked Developing Countries and Small Island Developing States (UN-OHRLLS).
For details, see http://www.unohrlls.org/en/ldc/25/
A.8. United Nations e-government knowledge base
The Division for Public Administration and Development Management of the United Nations Department of Economic and Social Affairs is maintaining the United Nations e-government knowledge base (egovkb) to provide governments and all stakeholders with easy access to data and information on e-government development.
The egovkb is an interactive online tool to view, sort and download information and datasets in open data formats from the 2016 UN E-Government Survey and previous editions (2003, 2004, 2005, 2008, 2010, 2012 and 2014). The egovkb also includes advanced research features such as customisable regional and country comparisons, rankings and country profiles.
For more information and details, see the United Nations e-Government Knowledge Base at https://publicadministration.un.org/egovkb/

143
E-GOVERNMENT IN SUPPORT OF SUSTAINABLE DEVELOPMENT
An
nexes
Sources Definition
2001 Benchmarking E-government: A Global Perspective (UNDESA, 2001)
E-government is ‘a tool for information and service provision to citizens’
2003 World Public Sector Report: E-Government at the Crossroads (UNDESA, 2003)
E-government is what enhances the capacity of public administration through the use of ICTs to increase the supply of public value (i.e., to deliver the things that people want).
United Nations Global E-Government Readiness Report 2004: Towards Access for Opportunity (UNDESA, 2004)
E-government is what enhances the capacity of public administration through the use of ICTs to increase the supply of public value (i.e., to deliver the things that people want).
United Nations Global E-Government Readiness Report 2005: From E-Government to E-Inclusion (UNDESA, 2005)
The definition of e-government needs to be enhanced from simply ‘government-to-government networking’ or ‘use of ICTs by governments to provide information and services to the public’ to one which encompasses the role of the govern-ment in promoting equality and social inclusion.
United Nations E-Government Survey 2008: From E-Government to Connected Governance (UNDESA, 2008)
E-government is the continuous innovation in the delivery of services, public participation and governance through the transformation of external and internal relationships by the use of information technology, especially the Internet.
UN E-Government Survey 2014: E-Government for the Future We Want (UNDESA, 2014)
E-government can be referred to as the use and application of information technologies in public administration to stream-line and integrate workflows and processes, to effectively manage data and information, enhance public service delivery, as well as expand communication channels for engagement and empowerment of people.
Organisation for Economic Co-operation and Development (OECD)
E-government is defined as ‘the use of information and com-munications technologies (ICTs), and particularly the Internet, to achieve better government’.
World Bank (WB, 2015) E-government refers to government agencies’ use of informa-tion technologies (such as Wide Area Networks, the Internet, and mobile computing) that have the ability to transform relations with citizens, businesses, and other arms of govern-ment. These technologies can serve a variety of different ends: better delivery of government services to citizens, improved interactions with business and industry, citizen empowerment through access to information, or more efficient government management. The resulting benefits can be less corruption, increased transparency, greater convenience, revenue growth and/or cost reductions.
A.9. Evolving definitions and understandings of e-Government and its related development

144
ANNEXES
An
nexes A.10. Matrix of assessment parameters used in the UN E-Government
Surveys in relation to relevant Sustainable Development Goals (SDGs) and Targets
Sustainable Development Goals (SDGs)
Targets Relevant assessment parameters used in the UN E-Government Surveys (2003-2016)
Goal 1:No Poverty
1.3 Implement nationally appropriate social protection systems and measures for all, including floors, and by 2030 achieve substantial coverage of the poor and the vulnerable.
The Survey evaluates online information and service provision in national, ministry and/or sectoral portal(s) in the six sectors, namely health, education, social, labour, finance and environment.1.4 By 2030, ensure that all men and women, in particular
the poor and the vulnerable, have equal rights to economic resources, as well as access to basic services, ownership and control over land and other forms of property, inheritance, natural resources, appropriate new technology and financial services, including microfinance.
Goal 3: Good Health and Well-Being
3.8 Achieve universal health coverage, including financial risk protection, access to quality essential health-care services and access to safe, effective, quality and affordable essential medicines and vaccines for all.
The Survey evaluates e-health or online services related to health in national, min-istry and/or sectoral portal(s).
Goal 4: Quality Education
4.3 By 2030, ensure equal access for all women and men to affordable and quality technical, vocational and tertiary education, including university.
Human capital is a requisite and one of the three main components of the E-Government Development Index (EGDI); the four sub-components (indicators) of the Human Capital Index in EGDI are (i) adult literacy; (ii) gross enrolment ratio; (iii) expected years of schooling and (iv) mean years of schooling. The source of human capital data is derived from UNESCO.
4.6 By 2030, ensure that all youth and a substantial pro-portion of adults, both men and women, achieve literacy and numeracy.
Goal 5: Gender Equality
5.b Enhance the use of enabling technology, in particular information and communications technology, to promote the empowerment of women
The Survey evaluates online services for women and girls in national, ministry and/or sectoral portal(s).
5.4 Recognize and value unpaid care and domestic work through the provision of public services, infrastructure and social protection policies and the promotion of shared responsibility within the household and the family as nationally appropriate.
The Survey evaluates if national, ministry and/or sectoral portal(s) offer specific online services to people living in poverty, older persons, the illiterate, persons with disabilities, immigrants, women and youth.
Goal 8:Decent Work and Economic Growth
8.5 By 2030, achieve full and productive employment and decent work for all women and men, including for young people and persons with disabilities, and equal pay for work of equal value.
The Survey evaluates online information and services offered by ministries or gov-ernment agencies responsible for labour and employment, or the labour sector in general.
8.8 Protect labour rights and promote safe and secure working environments for all workers, including migrant workers, in particular women migrants, and those in precarious employment.
The Survey evaluates if national, ministry and/or sectoral portal(s) offer specific online services to immigrants.
Goal 9: Industry. Innovation and Infrastructure
9.1 Develop quality, reliable, sustainable and resilient infrastructure, including regional and transborder infra-structure, to support economic development and human well-being, with a focus on affordable and equitable access for all
Telecommunication infrastructure is a req-uisite and one of the three main compo-nents of the E-Government Development Index (EGDI); the five sub-components (indicators) of the Telecommunication Infrastructure Index in EGDI are: (i) Internet users; (ii) fixed-telephone subscriptions; (iii) mobile-cellular subscriptions; (iv) fixed-broadband subscriptions; (v) wireless broadband subscriptions. The source of human capital data is derived from ITU.
9.c Significantly increase access to information and com-munications technology and strive to provide universal and affordable access to the Internet in least developed countries by 2020.

145
E-GOVERNMENT IN SUPPORT OF SUSTAINABLE DEVELOPMENT
An
nexes
Sustainable Development Goals (SDGs)
Targets Relevant assessment parameters used in the UN E-Government Surveys (2003-2016)
Goal 10: Reduced inequalities
10.2 By 2030, empower and promote the social, economic and political inclusion of all, irrespective of age, sex, disability, race, ethnicity, origin, religion or economic or other status.
The Survey evaluates if national, ministry and/or sectoral portal(s) offer specific online services to people living in pover-ty, older persons, the illiterate, persons with disabilities, immigrants, women and youth.
Goal 11: Sustainable cities and communities
11.1 By 2030, ensure access for all to adequate, safe and affordable housing and basic services and upgrade slums.
The Survey evaluates online information and service provision in the six sectors, namely health, education, social, labour, finance and environment.
11.3 By 2030, enhance inclusive and sustainable urbanization and capacity for participatory, integrated and sustainable human settlement planning and management in all countries.
The Survey evaluates e-participation, i.e., use of online services to engage citizens and non-citizens including through provision of online information (e-information), interaction with stakeholders (e-consultation) and engagement in decision-making processes (e-decision making)4
Goal 12:Responsible consumption and production
12.8 By 2030, ensure that people everywhere have the relevant information and awareness for sustainable devel-opment and lifestyles in harmony with nature.
The Survey evaluates the provision of online information, including open government data, in the six sectors in national portals or open data portals, namely in health, education, social, labour, finance and environment.5
Goal 13: Climate Action
13.3 Improve education, awareness-raising and human and institutional capacity on climate change mitigation, adaptation, impact reduction and early warning.
The Survey evaluates the provision of online information, including open government data, related to environmental protection or climate change.
Goal 16:Peace, Justice and Strong Institutions
16.5 Substantially reduce corruption and bribery in all their forms.
The Survey measures online public services available to people in various sectors and the availability of public e-procurement services.
16.6 Develop effective, accountable and transparent institutions at all levels.
The Survey measures online public services available to people provision in the six sectors, namely health, education, social, labour, finance and environment.
16.7 Ensure responsive, inclusive, participatory and representative decision-making at all levels.
The Survey evaluates e-participation, i.e., use of online services to engage citizens and non-citizens including through provision of online information (e-information), interaction with stakeholders (e-consultation) and engagement in decision-making processes (e-decision making).6
4 See Chapter 3 on e-participation5 See Chapter 2 on open government data6 See Chapter 3 on e-participation
146
ANNEXES
An
nexes
Sustainable Development Goals (SDGs)
Targets Relevant assessment parameters used in the UN E-Government Surveys (2003-2016)
16.9 By 2030, provide legal identity for all, including birth registration.
The Survey evaluates if government portals provide digital identity and if birth certificates are available on request through national, ministry and/or sectoral portal(s).7
16.10 Ensure public access to information and protect fun-damental freedoms, in accordance with national legislation and international agreements.
The Survey evaluates the provision of online information including open government data, in the six sectors in government portals or open data portals.
16.B Promote and enforce non-discriminatory laws and policies for sustainable development.
The Survey evaluates the provision of online information on laws and policies in the six sectors, namely in health, educa-tion, social, labour, finance and environ-ment.
Goal 17:Partnerships for the Goals
17.17 Encourage and promote effective public, public-pri-vate and civil society partnerships, building on the experi-ence and resourcing strategies of partnerships.
The Survey evaluates the existence of public-private partnership in offering e-government services in national, ministry and/or sectoral portals.
7 See Chapter 2 on open government data
147
E-GOVERNMENT IN SUPPORT OF SUSTAINABLE DEVELOPMENT
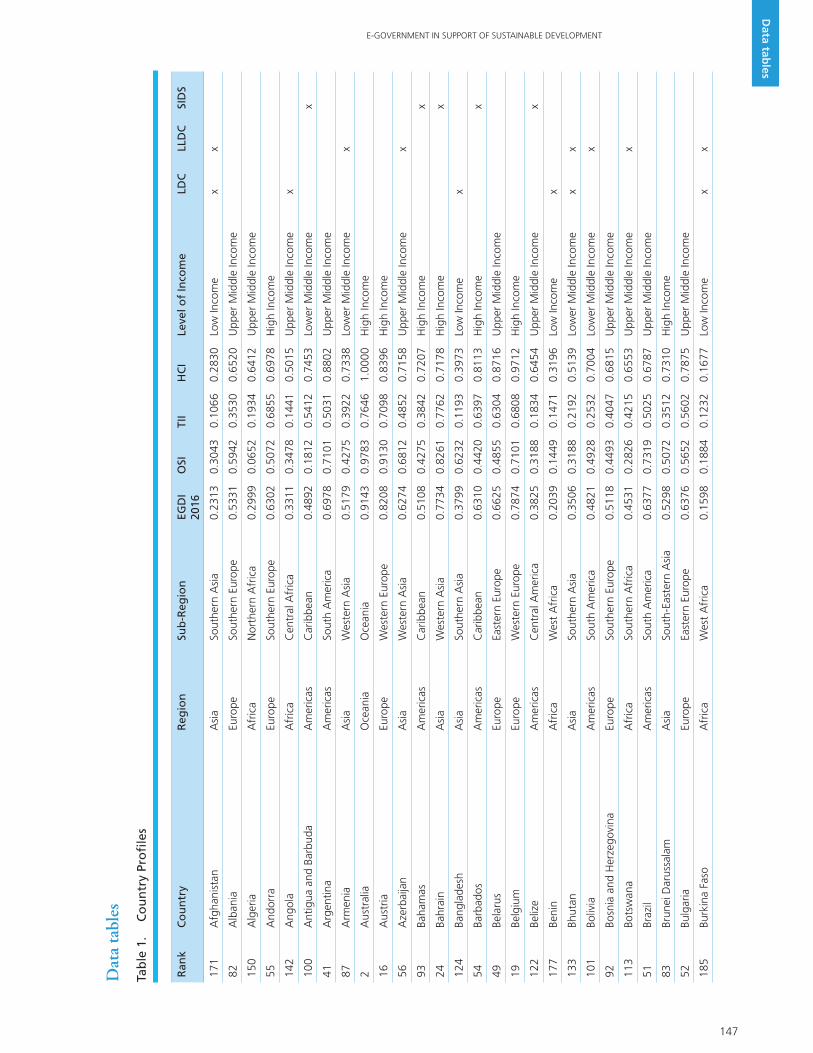
Data tab
les
Ran
kC
ou
ntr
yR
egio
nSu
b-R
egio
nEG
DI
2016
O
SITI
IH
CI
Leve
l of
Inco
me
LDC
LLD
CSI
DS
171
Afg
hani
stan
Asi
aSo
uthe
rn A
sia
0.23
130.
3043
0.10
660.
2830
Low
Inco
me
xx
82A
lban
iaEu
rope
Sout
hern
Eur
ope
0.53
310.
5942
0.35
300.
6520
Upp
er M
iddl
e In
com
e
150
Alg
eria
Afr
ica
Nor
ther
n A
fric
a0.
2999
0.06
520.
1934
0.64
12U
pper
Mid
dle
Inco
me
55A
ndor
raEu
rope
Sout
hern
Eur
ope
0.63
020.
5072
0.68
550.
6978
Hig
h In
com
e
142
Ang
ola
Afr
ica
Cen
tral
Afr
ica
0.33
110.
3478
0.14
410.
5015
Upp
er M
iddl
e In
com
ex
100
Ant
igua
and
Bar
buda
Am
eric
asC
arib
bean
0.48
920.
1812
0.54
120.
7453
Low
er M
iddl
e In
com
ex
41A
rgen
tina
Am
eric
asSo
uth
Am
eric
a0.
6978
0.71
010.
5031
0.88
02U
pper
Mid
dle
Inco
me
87A
rmen
iaA
sia
Wes
tern
Asi
a0.
5179
0.42
750.
3922
0.73
38Lo
wer
Mid
dle
Inco
me
x
2A
ustr
alia
Oce
ania
Oce
ania
0.91
430.
9783
0.76
461.
0000
Hig
h In
com
e
16A
ustr
iaEu
rope
Wes
tern
Eur
ope
0.82
080.
9130
0.70
980.
8396
Hig
h In
com
e
56A
zerb
aija
nA
sia
Wes
tern
Asi
a0.
6274
0.68
120.
4852
0.71
58U
pper
Mid
dle
Inco
me
x
93Ba
ham
asA
mer
icas
Car
ibbe
an0.
5108
0.42
750.
3842
0.72
07H
igh
Inco
me
x
24Ba
hrai
nA
sia
Wes
tern
Asi
a0.
7734
0.82
610.
7762
0.71
78H
igh
Inco
me
x
124
Bang
lade
shA
sia
Sout
hern
Asi
a0.
3799
0.62
320.
1193
0.39
73Lo
w In
com
ex
54Ba
rbad
osA
mer
icas
Car
ibbe
an0.
6310
0.44
200.
6397
0.81
13H
igh
Inco
me
x
49Be
laru
sEu
rope
East
ern
Euro
pe0.
6625
0.48
550.
6304
0.87
16U
pper
Mid
dle
Inco
me
19Be
lgiu
mEu
rope
Wes
tern
Eur
ope
0.78
740.
7101
0.68
080.
9712
Hig
h In
com
e
122
Beliz
eA
mer
icas
Cen
tral
Am
eric
a0.
3825
0.31
880.
1834
0.64
54U
pper
Mid
dle
Inco
me
x
177
Beni
nA
fric
aW
est
Afr
ica
0.20
390.
1449
0.14
710.
3196
Low
Inco
me
x
133
Bhut
anA
sia
Sout
hern
Asi
a0.
3506
0.31
880.
2192
0.51
39Lo
wer
Mid
dle
Inco
me
xx
101
Boliv
iaA
mer
icas
Sout
h A
mer
ica
0.48
210.
4928
0.25
320.
7004
Low
er M
iddl
e In
com
ex
92Bo
snia
and
Her
zego
vina
Euro
peSo
uthe
rn E
urop
e0.
5118
0.44
930.
4047
0.68
15U
pper
Mid
dle
Inco
me
113
Bots
wan
aA
fric
aSo
uthe
rn A
fric
a0.
4531
0.28
260.
4215
0.65
53U
pper
Mid
dle
Inco
me
x
51Br
azil
Am
eric
asSo
uth
Am
eric
a0.
6377
0.73
190.
5025
0.67
87U
pper
Mid
dle
Inco
me
83Br
unei
Dar
ussa
lam
Asi
aSo
uth-
East
ern
Asi
a0.
5298
0.50
720.
3512
0.73
10H
igh
Inco
me
52Bu
lgar
iaEu
rope
East
ern
Euro
pe0.
6376
0.56
520.
5602
0.78
75U
pper
Mid
dle
Inco
me
185
Burk
ina
Faso
Afr
ica
Wes
t A
fric
a0.
1598
0.18
840.
1232
0.16
77Lo
w In
com
ex
x
Tab
le 1
. C
ou
ntr
y Pr
ofi
les
Dat
a ta
bles

148
DATA TABLES
Data tab
les
Ran
kC
ou
ntr
yR
egio
nSu
b-R
egio
nEG
DI
2016
O
SITI
IH
CI
Leve
l of
Inco
me
LDC
LLD
CSI
DS
173
Buru
ndi
Afr
ica
East
ern
Afr
ica
0.22
770.
1522
0.03
310.
4979
Low
Inco
me
xx
158
Cam
bodi
aA
sia
Sout
h-Ea
ster
n A
sia
0.25
930.
0507
0.24
860.
4785
Low
Inco
me
x
155
Cam
eroo
nA
fric
aC
entr
al A
fric
a0.
2759
0.21
740.
1310
0.47
94Lo
wer
Mid
dle
Inco
me
14C
anad
aA
mer
icas
Nor
th A
mer
ica
0.82
850.
9565
0.67
170.
8572
Hig
h In
com
e
103
Cap
e Ve
rde
Afr
ica
Wes
t A
fric
a0.
4742
0.45
650.
3629
0.60
31Lo
wer
Mid
dle
Inco
me
x
191
Cen
tral
Afr
ican
Rep
ublic
Afr
ica
Cen
tral
Afr
ica
0.07
890.
0000
0.03
810.
1985
Low
Inco
me
xx
188
Cha
dA
fric
aC
entr
al A
fric
a0.
1256
0.13
770.
0476
0.19
17Lo
w In
com
ex
x
42C
hile
Am
eric
asSo
uth
Am
eric
a0.
6949
0.77
540.
4970
0.81
24H
igh
Inco
me
63C
hina
Asi
aEa
ster
n A
sia
0.60
710.
7681
0.36
730.
6860
Upp
er M
iddl
e In
com
e
57C
olom
bia
Am
eric
asSo
uth
Am
eric
a0.
6237
0.78
990.
3813
0.70
00U
pper
Mid
dle
Inco
me
176
Com
oros
Afr
ica
East
ern
Afr
ica
0.21
550.
0507
0.10
730.
4885
Low
Inco
me
xx
162
Con
goA
fric
aC
entr
al A
fric
a0.
2497
0.04
350.
1713
0.53
44Lo
w In
com
e
53C
osta
Ric
aA
mer
icas
Cen
tral
Am
eric
a0.
6314
0.63
770.
5129
0.74
36U
pper
Mid
dle
Inco
me
175
Côt
e d'
Ivoi
reA
fric
aW
est
Afr
ica
0.21
850.
1884
0.17
110.
2959
Low
er M
iddl
e In
com
e
37C
roat
iaEu
rope
Sout
hern
Eur
ope
0.71
620.
7464
0.59
740.
8050
Hig
h In
com
e
131
Cub
aA
mer
icas
Car
ibbe
an0.
3522
0.19
570.
1103
0.75
07U
pper
Mid
dle
Inco
me
x
64C
ypru
sA
sia
Wes
tern
Asi
a0.
6023
0.53
620.
4923
0.77
82H
igh
Inco
me
50C
zech
Rep
ublic
Euro
peEa
ster
n Eu
rope
0.64
540.
4783
0.59
520.
8627
Hig
h In
com
e
153
Dem
ocra
tic P
eopl
e's
Repu
blic
of
Kor
eaA
sia
East
ern
Asi
a0.
2801
0.02
170.
0363
0.78
22Lo
w In
com
e
180
Dem
ocra
tic R
epub
lic o
f th
e C
ongo
Afr
ica
Cen
tral
Afr
ica
0.18
760.
0870
0.07
880.
3970
Low
Inco
me
x
9D
enm
ark
Euro
peN
orth
ern
Euro
pe0.
8510
0.77
540.
8247
0.95
30H
igh
Inco
me
187
Djib
outi
Afr
ica
East
ern
Afr
ica
0.13
370.
0217
0.06
980.
3095
Low
er M
iddl
e In
com
ex
109
Dom
inic
aA
mer
icas
Car
ibbe
an0.
4577
0.30
430.
4305
0.63
84U
pper
Mid
dle
Inco
me
x
98D
omin
ican
Rep
ublic
Am
eric
asC
arib
bean
0.49
140.
5072
0.29
920.
6676
Upp
er M
iddl
e In
com
ex
74Ec
uado
rA
mer
icas
Sout
h A
mer
ica
0.56
250.
6304
0.34
380.
7134
Upp
er M
iddl
e In
com
e
108
Egyp
tA
fric
aN
orth
ern
Afr
ica
0.45
940.
4710
0.30
250.
6048
Low
er M
iddl
e In
com
e
104
El S
alva
dor
Am
eric
asC
entr
al A
mer
ica
0.47
180.
4855
0.32
650.
6035
Low
er M
iddl
e In
com
e
165
Equa
toria
l Gui
nea
Afr
ica
Cen
tral
Afr
ica
0.24
030.
0797
0.12
370.
5174
Hig
h In
com
ex
190
Eritr
eaA
fric
aEa
ster
n A
fric
a0.
0902
0.02
170.
0000
0.24
87Lo
w In
com
ex
13Es
toni
aEu
rope
Nor
ther
n Eu
rope
0.83
340.
8913
0.73
290.
8761
Hig
h In
com
e
Tab
le 1
. C
ou
ntr
y Pr
ofi
les
(co
nti
nu
ed)

149
E-GOVERNMENT IN SUPPORT OF SUSTAINABLE DEVELOPMENT
Data tab
les
Ran
kC
ou
ntr
yR
egio
nSu
b-R
egio
nEG
DI
2016
O
SITI
IH
CI
Leve
l of
Inco
me
LDC
LLD
CSI
DS
157
Ethi
opia
Afr
ica
East
ern
Afr
ica
0.26
660.
5290
0.04
950.
2212
Low
Inco
me
xx
96Fi
jiO
cean
iaO
cean
ia0.
4989
0.41
300.
3326
0.75
09U
pper
Mid
dle
Inco
me
x
5Fi
nlan
dEu
rope
Nor
ther
n Eu
rope
0.88
170.
9420
0.75
900.
9440
Hig
h In
com
e
10Fr
ance
Euro
peW
este
rn E
urop
e0.
8456
0.94
200.
7502
0.84
45H
igh
Inco
me
129
Gab
onA
fric
aC
entr
al A
fric
a0.
3584
0.15
220.
3068
0.61
62U
pper
Mid
dle
Inco
me
167
Gam
bia
Afr
ica
Wes
t A
fric
a0.
2396
0.19
570.
1959
0.32
74Lo
w In
com
ex
61G
eorg
iaA
sia
Wes
tern
Asi
a0.
6108
0.63
770.
4184
0.77
63Lo
wer
Mid
dle
Inco
me
15G
erm
any
Euro
peW
este
rn E
urop
e0.
8210
0.84
060.
7342
0.88
82H
igh
Inco
me
120
Gha
naA
fric
aW
est
Afr
ica
0.41
810.
4493
0.25
940.
5458
Low
er M
iddl
e In
com
e
43G
reec
eEu
rope
Sout
hern
Eur
ope
0.69
100.
5797
0.60
320.
8901
Hig
h In
com
e
88G
rena
daA
mer
icas
Car
ibbe
an0.
5168
0.36
960.
3988
0.78
20U
pper
Mid
dle
Inco
me
x
102
Gua
tem
ala
Am
eric
asC
entr
al A
mer
ica
0.47
900.
6667
0.23
580.
5345
Low
er M
iddl
e In
com
e
189
Gui
nea
Afr
ica
Wes
t A
fric
a0.
1226
0.08
700.
0906
0.19
03Lo
w In
com
ex
181
Gui
nea-
Biss
auA
fric
aW
est
Afr
ica
0.18
180.
1087
0.08
280.
3538
Low
Inco
me
xx
126
Guy
ana
Am
eric
asSo
uth
Am
eric
a0.
3651
0.28
260.
2432
0.56
94Lo
wer
Mid
dle
Inco
me
x
178
Hai
tiA
mer
icas
Car
ibbe
an0.
1931
0.16
670.
1004
0.31
24Lo
w In
com
ex
x
127
Hon
dura
sA
mer
icas
Cen
tral
Am
eric
a0.
3611
0.31
160.
2008
0.57
09Lo
wer
Mid
dle
Inco
me
46H
unga
ryEu
rope
East
ern
Euro
pe0.
6745
0.63
040.
5615
0.83
17U
pper
Mid
dle
Inco
me
27Ic
elan
dEu
rope
Nor
ther
n Eu
rope
0.76
620.
6232
0.78
140.
8940
Hig
h In
com
e
107
Indi
aA
sia
Sout
hern
Asi
a0.
4637
0.74
640.
1430
0.50
19Lo
wer
Mid
dle
Inco
me
116
Indo
nesi
aA
sia
Sout
h-Ea
ster
n A
sia
0.44
780.
3623
0.30
160.
6796
Low
er M
iddl
e In
com
e
106
Iran
(Isla
mic
Rep
ublic
of)
Asi
aSo
uthe
rn A
sia
0.46
490.
3333
0.35
140.
7101
Upp
er M
iddl
e In
com
e
141
Iraq
Asi
aW
este
rn A
sia
0.33
340.
3551
0.16
470.
4803
Upp
er M
iddl
e In
com
e
26Ire
land
Euro
peN
orth
ern
Euro
pe0.
7689
0.72
460.
6602
0.92
18H
igh
Inco
me
20Is
rael
Asi
aW
este
rn A
sia
0.78
060.
8623
0.61
750.
8619
Hig
h In
com
e
22Ita
lyEu
rope
Sout
hern
Eur
ope
0.77
640.
8696
0.64
690.
8126
Hig
h In
com
e
112
Jam
aica
Am
eric
asC
arib
bean
0.45
340.
3551
0.31
930.
6859
Upp
er M
iddl
e In
com
ex
11Ja
pan
Asi
aEa
ster
n A
sia
0.84
400.
8768
0.82
770.
8274
Hig
h In
com
e
91Jo
rdan
Asi
aW
este
rn A
sia
0.51
230.
4565
0.34
580.
7344
Upp
er M
iddl
e In
com
e
Tab
le 1
. C
ou
ntr
y Pr
ofi
les
(co
nti
nu
ed)

150
DATA TABLES
Data tab
les
Ran
kC
ou
ntr
yR
egio
nSu
b-R
egio
nEG
DI
2016
O
SITI
IH
CI
Leve
l of
Inco
me
LDC
LLD
CSI
DS
33K
azak
hsta
nA
sia
Cen
tral
Asi
a0.
7250
0.76
810.
5668
0.84
01U
pper
Mid
dle
Inco
me
x
119
Ken
yaA
fric
aEa
ster
n A
fric
a0.
4186
0.55
800.
1808
0.51
69Lo
w In
com
e
145
Kiri
bati
Oce
ania
Oce
ania
0.31
220.
2101
0.06
650.
6599
Low
er M
iddl
e In
com
ex
x
40K
uwai
tA
sia
Wes
tern
Asi
a0.
7080
0.65
220.
7430
0.72
87H
igh
Inco
me
97K
yrgy
zsta
nA
sia
Cen
tral
Asi
a0.
4969
0.42
750.
3123
0.75
08U
pper
Mid
dle
Inco
me
x
148
Lao
Peop
le's
Dem
ocra
tic R
epub
licA
sia
Sout
h-Ea
ster
n A
sia
0.30
900.
2826
0.15
370.
4907
Low
er M
iddl
e In
com
ex
x
45La
tvia
Euro
peN
orth
ern
Euro
pe0.
6810
0.60
870.
5831
0.85
12H
igh
Inco
me
73Le
bano
nA
sia
Wes
tern
Asi
a0.
5646
0.51
450.
4911
0.68
82U
pper
Mid
dle
Inco
me
154
Leso
tho
Afr
ica
Sout
hern
Afr
ica
0.27
700.
1377
0.17
870.
5147
Low
er M
iddl
e In
com
ex
x
170
Libe
riaA
fric
aW
est
Afr
ica
0.23
380.
2391
0.10
410.
3581
Low
Inco
me
x
118
Liby
aA
fric
aN
orth
ern
Afr
ica
0.43
220.
1087
0.42
910.
7588
Upp
er M
iddl
e In
com
e
32Li
echt
enst
ein
Euro
peW
este
rn E
urop
e0.
7313
0.66
670.
7293
0.79
78H
igh
Inco
me
23Li
thua
nia
Euro
peN
orth
ern
Euro
pe0.
7747
0.82
610.
6262
0.87
17H
igh
Inco
me
25Lu
xem
bour
gEu
rope
Wes
tern
Eur
ope
0.77
050.
7174
0.81
900.
7750
Hig
h In
com
e
163
Mad
agas
car
Afr
ica
East
ern
Afr
ica
0.24
160.
2246
0.05
140.
4488
Low
Inco
me
x
166
Mal
awi
Afr
ica
East
ern
Afr
ica
0.23
980.
2174
0.04
850.
4535
Low
Inco
me
xx
60M
alay
sia
Asi
aSo
uth-
East
ern
Asi
a0.
6175
0.71
740.
4397
0.69
53U
pper
Mid
dle
Inco
me
117
Mal
dive
sA
sia
Sout
hern
Asi
a0.
4330
0.23
190.
4370
0.63
01U
pper
Mid
dle
Inco
me
x
182
Mal
iA
fric
aW
est
Afr
ica
0.18
170.
0942
0.21
490.
2358
Low
Inco
me
xx
30M
alta
Euro
peSo
uthe
rn E
urop
e0.
7424
0.79
710.
6992
0.73
10H
igh
Inco
me
156
Mar
shal
l Isl
ands
Oce
ania
Oce
ania
0.26
950.
0290
0.08
490.
6947
Upp
er M
iddl
e In
com
ex
184
Mau
ritan
iaA
fric
aW
est
Afr
ica
0.17
340.
0652
0.15
360.
3015
Low
er M
iddl
e In
com
ex
58M
aurit
ius
Afr
ica
East
ern
Afr
ica
0.62
310.
7029
0.45
960.
7067
Upp
er M
iddl
e In
com
ex
59M
exic
oA
mer
icas
Cen
tral
Am
eric
a0.
6195
0.84
780.
3114
0.69
93U
pper
Mid
dle
Inco
me
146
Mic
rone
sia
(Fed
erat
ed S
tate
s of
)O
cean
iaO
cean
ia0.
3103
0.14
490.
1197
0.66
63Lo
wer
Mid
dle
Inco
me
x
31M
onac
oEu
rope
Wes
tern
Eur
ope
0.73
150.
3188
1.00
000.
8757
Hig
h In
com
e
84M
ongo
liaA
sia
East
ern
Asi
a0.
5194
0.51
450.
2841
0.75
97Lo
wer
Mid
dle
Inco
me
x
47M
onte
negr
oEu
rope
Sout
hern
Eur
ope
0.67
330.
6812
0.52
210.
8165
Upp
er M
iddl
e In
com
e
85M
oroc
coA
fric
aN
orth
ern
Afr
ica
0.51
860.
7391
0.34
290.
4737
Low
er M
iddl
e In
com
e
Tab
le 1
. C
ou
ntr
y Pr
ofi
les
(co
nti
nu
ed)

151
E-GOVERNMENT IN SUPPORT OF SUSTAINABLE DEVELOPMENT
Data tab
les
Ran
kC
ou
ntr
yR
egio
nSu
b-R
egio
nEG
DI
2016
O
SITI
IH
CI
Leve
l of
Inco
me
LDC
LLD
CSI
DS
172
Moz
ambi
que
Afr
ica
East
ern
Afr
ica
0.23
050.
2029
0.09
930.
3893
Low
Inco
me
x
169
Mya
nmar
Asi
aSo
uth-
East
ern
Asi
a0.
2362
0.15
940.
0655
0.48
37Lo
w In
com
ex
125
Nam
ibia
Afr
ica
Sout
hern
Afr
ica
0.36
820.
2826
0.26
690.
5551
Upp
er M
iddl
e In
com
e
152
Nau
ruO
cean
iaO
cean
ia0.
2868
0.09
420.
2448
0.52
14U
pper
Mid
dle
Inco
me
x
135
Nep
alA
sia
Sout
hern
Asi
a0.
3458
0.39
860.
1675
0.47
14Lo
w In
com
ex
x
7N
ethe
rland
sEu
rope
Wes
tern
Eur
ope
0.86
590.
9275
0.75
170.
9183
Hig
h In
com
e
8N
ew Z
eala
ndO
cean
iaO
cean
ia0.
8653
0.94
200.
7136
0.94
02H
igh
Inco
me
123
Nic
arag
uaA
mer
icas
Cen
tral
Am
eric
a0.
3801
0.38
410.
2109
0.54
54Lo
wer
Mid
dle
Inco
me
192
Nig
erA
fric
aW
est
Afr
ica
0.05
930.
0725
0.05
570.
0498
Low
Inco
me
xx
143
Nig
eria
Afr
ica
Wes
t A
fric
a0.
3291
0.41
300.
1958
0.37
84Lo
wer
Mid
dle
Inco
me
18N
orw
ayEu
rope
Nor
ther
n Eu
rope
0.81
170.
8043
0.72
760.
9031
Hig
h In
com
e
66O
man
Asi
aW
este
rn A
sia
0.59
620.
5942
0.51
470.
6796
Hig
h In
com
e
159
Paki
stan
Asi
aSo
uthe
rn A
sia
0.25
830.
3261
0.12
990.
3190
Low
er M
iddl
e In
com
e
111
Pala
uO
cean
iaO
cean
ia0.
4546
0.10
870.
3684
0.88
67U
pper
Mid
dle
Inco
me
x
99Pa
nam
aA
mer
icas
Cen
tral
Am
eric
a0.
4903
0.33
330.
4202
0.71
75U
pper
Mid
dle
Inco
me
179
Papu
a N
ew G
uine
aO
cean
iaO
cean
ia0.
1882
0.16
670.
0739
0.32
40Lo
wer
Mid
dle
Inco
me
x
95Pa
ragu
ayA
mer
icas
Sout
h A
mer
ica
0.49
890.
6014
0.25
440.
6409
Low
er M
iddl
e In
com
ex
81Pe
ruA
mer
icas
Sout
h A
mer
ica
0.53
810.
6304
0.26
890.
7151
Upp
er M
iddl
e In
com
e
71Ph
ilipp
ines
Asi
aSo
uth-
East
ern
Asi
a0.
5765
0.66
670.
3791
0.68
39Lo
wer
Mid
dle
Inco
me
36Po
land
Euro
peEa
ster
n Eu
rope
0.72
110.
7029
0.58
570.
8747
Hig
h In
com
e
38Po
rtug
alEu
rope
Sout
hern
Eur
ope
0.71
440.
7464
0.58
380.
8129
Hig
h In
com
e
48Q
atar
Asi
aW
este
rn A
sia
0.66
990.
6739
0.60
410.
7317
Hig
h In
com
e
3Re
publ
ic o
f K
orea
Asi
aEa
ster
n A
sia
0.89
150.
9420
0.85
300.
8795
Hig
h In
com
e
65Re
publ
ic o
f M
oldo
vaEu
rope
East
ern
Euro
pe0.
5994
0.59
420.
4850
0.71
91Lo
wer
Mid
dle
Inco
me
x
75Ro
man
iaEu
rope
East
ern
Euro
pe0.
5611
0.45
650.
4533
0.77
36U
pper
Mid
dle
Inco
me
35Ru
ssia
n Fe
dera
tion
Euro
peEa
ster
n Eu
rope
0.72
150.
7319
0.60
910.
8234
Hig
h In
com
e
138
Rwan
daA
fric
aEa
ster
n A
fric
a0.
3390
0.45
650.
1084
0.45
22Lo
w In
com
ex
x
94Sa
int
Kitt
s an
d N
evis
Am
eric
asC
arib
bean
0.50
340.
2826
0.53
010.
6976
Hig
h In
com
ex
114
Sain
t Lu
cia
Am
eric
asC
arib
bean
0.45
310.
2754
0.40
940.
6744
Upp
er M
iddl
e In
com
ex
Tab
le 1
. C
ou
ntr
y Pr
ofi
les
(co
nti
nu
ed)
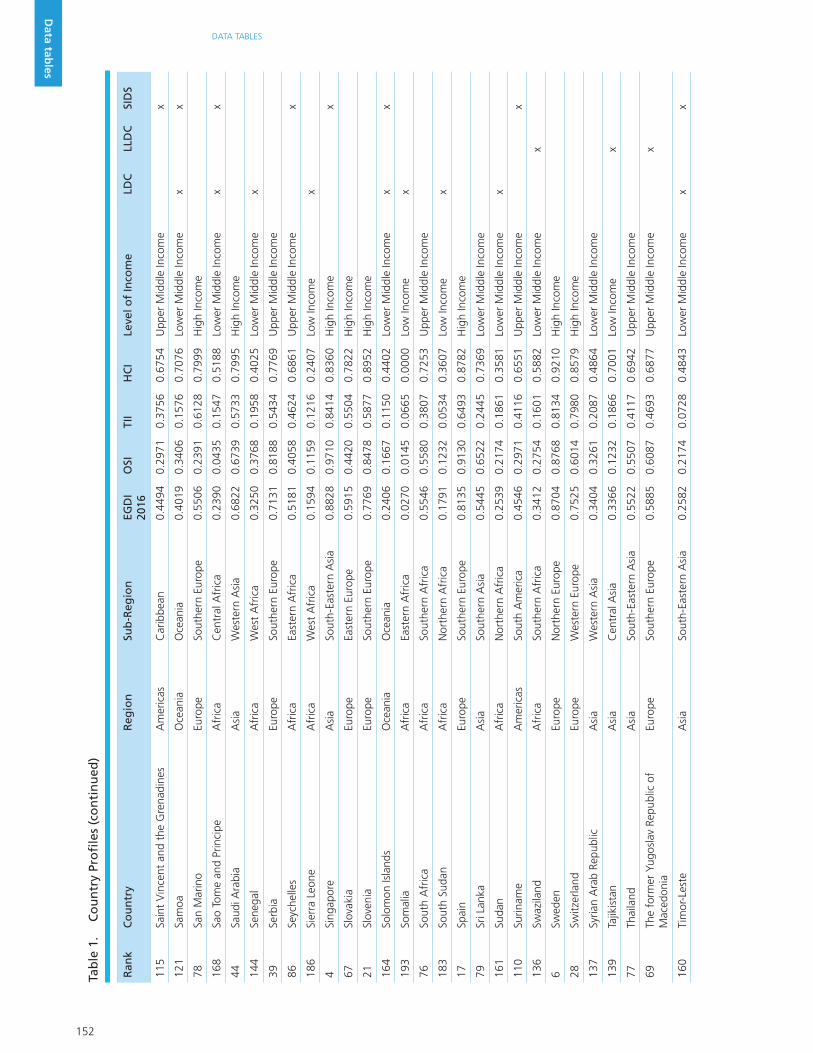
152
DATA TABLES
Data tab
les
Ran
kC
ou
ntr
yR
egio
nSu
b-R
egio
nEG
DI
2016
O
SITI
IH
CI
Leve
l of
Inco
me
LDC
LLD
CSI
DS
115
Sain
t V
ince
nt a
nd t
he G
rena
dine
sA
mer
icas
Car
ibbe
an0.
4494
0.29
710.
3756
0.67
54U
pper
Mid
dle
Inco
me
x
121
Sam
oaO
cean
iaO
cean
ia0.
4019
0.34
060.
1576
0.70
76Lo
wer
Mid
dle
Inco
me
xx
78Sa
n M
arin
oEu
rope
Sout
hern
Eur
ope
0.55
060.
2391
0.61
280.
7999
Hig
h In
com
e
168
Sao
Tom
e an
d Pr
inci
peA
fric
aC
entr
al A
fric
a0.
2390
0.04
350.
1547
0.51
88Lo
wer
Mid
dle
Inco
me
xx
44Sa
udi A
rabi
aA
sia
Wes
tern
Asi
a0.
6822
0.67
390.
5733
0.79
95H
igh
Inco
me
144
Sene
gal
Afr
ica
Wes
t A
fric
a0.
3250
0.37
680.
1958
0.40
25Lo
wer
Mid
dle
Inco
me
x
39Se
rbia
Euro
peSo
uthe
rn E
urop
e0.
7131
0.81
880.
5434
0.77
69U
pper
Mid
dle
Inco
me
86Se
yche
lles
Afr
ica
East
ern
Afr
ica
0.51
810.
4058
0.46
240.
6861
Upp
er M
iddl
e In
com
ex
186
Sier
ra L
eone
Afr
ica
Wes
t A
fric
a0.
1594
0.11
590.
1216
0.24
07Lo
w In
com
ex
4Si
ngap
ore
Asi
aSo
uth-
East
ern
Asi
a0.
8828
0.97
100.
8414
0.83
60H
igh
Inco
me
x
67Sl
ovak
iaEu
rope
East
ern
Euro
pe0.
5915
0.44
200.
5504
0.78
22H
igh
Inco
me
21Sl
oven
iaEu
rope
Sout
hern
Eur
ope
0.77
690.
8478
0.58
770.
8952
Hig
h In
com
e
164
Solo
mon
Isla
nds
Oce
ania
Oce
ania
0.24
060.
1667
0.11
500.
4402
Low
er M
iddl
e In
com
ex
x
193
Som
alia
Afr
ica
East
ern
Afr
ica
0.02
700.
0145
0.06
650.
0000
Low
Inco
me
x
76So
uth
Afr
ica
Afr
ica
Sout
hern
Afr
ica
0.55
460.
5580
0.38
070.
7253
Upp
er M
iddl
e In
com
e
183
Sout
h Su
dan
Afr
ica
Nor
ther
n A
fric
a0.
1791
0.12
320.
0534
0.36
07Lo
w In
com
ex
17Sp
ain
Euro
peSo
uthe
rn E
urop
e0.
8135
0.91
300.
6493
0.87
82H
igh
Inco
me
79Sr
i Lan
kaA
sia
Sout
hern
Asi
a0.
5445
0.65
220.
2445
0.73
69Lo
wer
Mid
dle
Inco
me
161
Suda
nA
fric
aN
orth
ern
Afr
ica
0.25
390.
2174
0.18
610.
3581
Low
er M
iddl
e In
com
ex
110
Surin
ame
Am
eric
asSo
uth
Am
eric
a0.
4546
0.29
710.
4116
0.65
51U
pper
Mid
dle
Inco
me
x
136
Swaz
iland
Afr
ica
Sout
hern
Afr
ica
0.34
120.
2754
0.16
010.
5882
Low
er M
iddl
e In
com
ex
6Sw
eden
Euro
peN
orth
ern
Euro
pe0.
8704
0.87
680.
8134
0.92
10H
igh
Inco
me
28Sw
itzer
land
Euro
peW
este
rn E
urop
e0.
7525
0.60
140.
7980
0.85
79H
igh
Inco
me
137
Syria
n A
rab
Repu
blic
Asi
aW
este
rn A
sia
0.34
040.
3261
0.20
870.
4864
Low
er M
iddl
e In
com
e
139
Tajik
ista
nA
sia
Cen
tral
Asi
a0.
3366
0.12
320.
1866
0.70
01Lo
w In
com
ex
77Th
aila
ndA
sia
Sout
h-Ea
ster
n A
sia
0.55
220.
5507
0.41
170.
6942
Upp
er M
iddl
e In
com
e
69Th
e fo
rmer
Yug
osla
v Re
publ
ic o
f M
aced
onia
Euro
peSo
uthe
rn E
urop
e0.
5885
0.60
870.
4693
0.68
77U
pper
Mid
dle
Inco
me
x
160
Tim
or-L
este
Asi
aSo
uth-
East
ern
Asi
a0.
2582
0.21
740.
0728
0.48
43Lo
wer
Mid
dle
Inco
me
xx
Tab
le 1
. C
ou
ntr
y Pr
ofi
les
(co
nti
nu
ed)
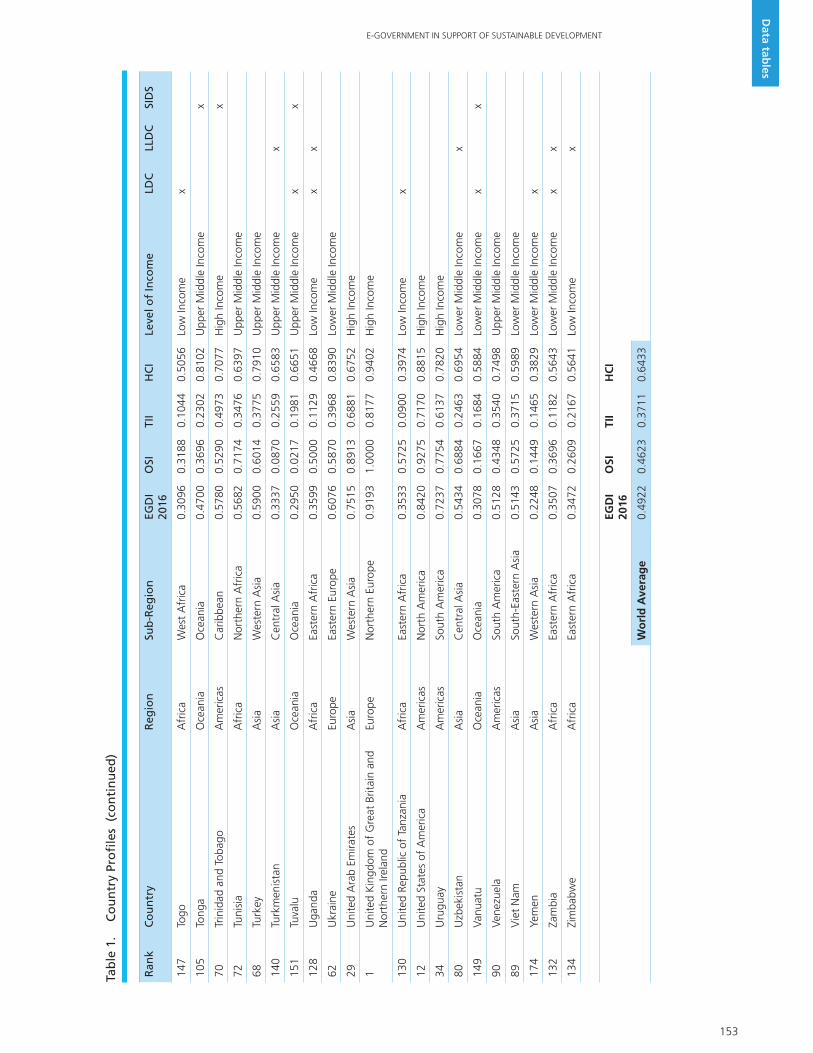
153
E-GOVERNMENT IN SUPPORT OF SUSTAINABLE DEVELOPMENT
Data tab
les
Ran
kC
ou
ntr
yR
egio
nSu
b-R
egio
nEG
DI
2016
O
SITI
IH
CI
Leve
l of
Inco
me
LDC
LLD
CSI
DS
147
Togo
Afr
ica
Wes
t A
fric
a0.
3096
0.31
880.
1044
0.50
56Lo
w In
com
ex
105
Tong
aO
cean
iaO
cean
ia0.
4700
0.36
960.
2302
0.81
02U
pper
Mid
dle
Inco
me
x
70Tr
inid
ad a
nd T
obag
oA
mer
icas
Car
ibbe
an0.
5780
0.52
900.
4973
0.70
77H
igh
Inco
me
x
72Tu
nisi
aA
fric
aN
orth
ern
Afr
ica
0.56
820.
7174
0.34
760.
6397
Upp
er M
iddl
e In
com
e
68Tu
rkey
Asi
aW
este
rn A
sia
0.59
000.
6014
0.37
750.
7910
Upp
er M
iddl
e In
com
e
140
Turk
men
ista
nA
sia
Cen
tral
Asi
a0.
3337
0.08
700.
2559
0.65
83U
pper
Mid
dle
Inco
me
x
151
Tuva
luO
cean
iaO
cean
ia0.
2950
0.02
170.
1981
0.66
51U
pper
Mid
dle
Inco
me
xx
128
Uga
nda
Afr
ica
East
ern
Afr
ica
0.35
990.
5000
0.11
290.
4668
Low
Inco
me
xx
62U
krai
neEu
rope
East
ern
Euro
pe0.
6076
0.58
700.
3968
0.83
90Lo
wer
Mid
dle
Inco
me
29U
nite
d A
rab
Emira
tes
Asi
aW
este
rn A
sia
0.75
150.
8913
0.68
810.
6752
Hig
h In
com
e
1U
nite
d K
ingd
om o
f G
reat
Brit
ain
and
Nor
ther
n Ire
land
Euro
peN
orth
ern
Euro
pe0.
9193
1.00
000.
8177
0.94
02H
igh
Inco
me
130
Uni
ted
Repu
blic
of
Tanz
ania
Afr
ica
East
ern
Afr
ica
0.35
330.
5725
0.09
000.
3974
Low
Inco
me
x
12U
nite
d St
ates
of
Am
eric
aA
mer
icas
Nor
th A
mer
ica
0.84
200.
9275
0.71
700.
8815
Hig
h In
com
e
34U
rugu
ayA
mer
icas
Sout
h A
mer
ica
0.72
370.
7754
0.61
370.
7820
Hig
h In
com
e
80U
zbek
ista
nA
sia
Cen
tral
Asi
a0.
5434
0.68
840.
2463
0.69
54Lo
wer
Mid
dle
Inco
me
x
149
Vanu
atu
Oce
ania
Oce
ania
0.30
780.
1667
0.16
840.
5884
Low
er M
iddl
e In
com
ex
x
90Ve
nezu
ela
Am
eric
asSo
uth
Am
eric
a0.
5128
0.43
480.
3540
0.74
98U
pper
Mid
dle
Inco
me
89V
iet
Nam
Asi
aSo
uth-
East
ern
Asi
a0.
5143
0.57
250.
3715
0.59
89Lo
wer
Mid
dle
Inco
me
174
Yem
enA
sia
Wes
tern
Asi
a0.
2248
0.14
490.
1465
0.38
29Lo
wer
Mid
dle
Inco
me
x
132
Zam
bia
Afr
ica
East
ern
Afr
ica
0.35
070.
3696
0.11
820.
5643
Low
er M
iddl
e In
com
ex
x
134
Zim
babw
eA
fric
aEa
ster
n A
fric
a0.
3472
0.26
090.
2167
0.56
41Lo
w In
com
ex
EGD
I 20
16
OSI
TII
HC
I
Wo
rld
Ave
rag
e0.
4922
0.46
230.
3711
0.64
33
Tab
le 1
. C
ou
ntr
y Pr
ofi
les
(co
nti
nu
ed)

154
DATA TABLES
Data tab
les
Rank Country EGDI Level EGDI Online Service Component
Telecomm. Infrastructure Component
Human Capital Component
171 Afghanistan Low 0.2313 0.3043 0.1066 0.2830
82 Albania High 0.5331 0.5942 0.3530 0.6520
150 Algeria Medium 0.2999 0.0652 0.1934 0.6412
55 Andorra High 0.6302 0.5072 0.6855 0.6978
142 Angola Medium 0.3311 0.3478 0.1441 0.5015
100 Antigua and Barbuda Medium 0.4892 0.1812 0.5412 0.7453
41 Argentina High 0.6978 0.7101 0.5031 0.8802
87 Armenia High 0.5179 0.4275 0.3922 0.7338
2 Australia Very high 0.9143 0.9783 0.7646 1.0000
16 Austria Very high 0.8208 0.9130 0.7098 0.8396
56 Azerbaijan High 0.6274 0.6812 0.4852 0.7158
93 Bahamas High 0.5108 0.4275 0.3842 0.7207
24 Bahrain Very high 0.7734 0.8261 0.7762 0.7178
124 Bangladesh Medium 0.3799 0.6232 0.1193 0.3973
54 Barbados High 0.6310 0.4420 0.6397 0.8113
49 Belarus High 0.6625 0.4855 0.6304 0.8716
19 Belgium Very high 0.7874 0.7101 0.6808 0.9712
122 Belize Medium 0.3825 0.3188 0.1834 0.6454
177 Benin Low 0.2039 0.1449 0.1471 0.3196
133 Bhutan Medium 0.3506 0.3188 0.2192 0.5139
101 Bolivia Medium 0.4821 0.4928 0.2532 0.7004
92 Bosnia and Herzegovina High 0.5118 0.4493 0.4047 0.6815
113 Botswana Medium 0.4531 0.2826 0.4215 0.6553
51 Brazil High 0.6377 0.7319 0.5025 0.6787
83 Brunei Darussalam High 0.5298 0.5072 0.3512 0.7310
52 Bulgaria High 0.6376 0.5652 0.5602 0.7875
185 Burkina Faso Low 0.1598 0.1884 0.1232 0.1677
173 Burundi Low 0.2277 0.1522 0.0331 0.4979
158 Cambodia Medium 0.2593 0.0507 0.2486 0.4785
155 Cameroon Medium 0.2759 0.2174 0.1310 0.4794
14 Canada Very high 0.8285 0.9565 0.6717 0.8572
103 Cape Verde Medium 0.4742 0.4565 0.3629 0.6031
191 Central African Republic Low 0.0789 0.0000 0.0381 0.1985
188 Chad Low 0.1256 0.1377 0.0476 0.1917
42 Chile High 0.6949 0.7754 0.4970 0.8124
63 China High 0.6071 0.7681 0.3673 0.6860
57 Colombia High 0.6237 0.7899 0.3813 0.7000
176 Comoros Low 0.2155 0.0507 0.1073 0.4885
162 Congo Low 0.2497 0.0435 0.1713 0.5344
53 Costa Rica High 0.6314 0.6377 0.5129 0.7436
175 Côte d'Ivoire Low 0.2185 0.1884 0.1711 0.2959
37 Croatia High 0.7162 0.7464 0.5974 0.8050
131 Cuba Medium 0.3522 0.1957 0.1103 0.7507
64 Cyprus High 0.6023 0.5362 0.4923 0.7782
Table 2. E-Government Development Index (EGDI)
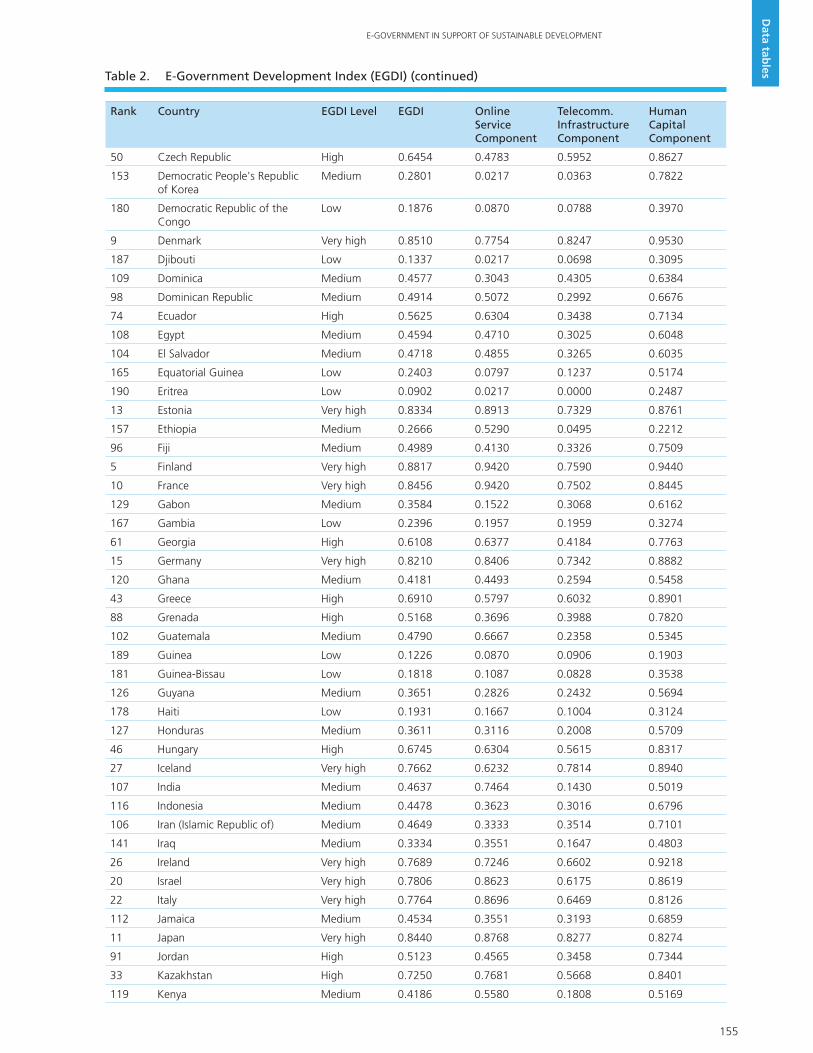
155
E-GOVERNMENT IN SUPPORT OF SUSTAINABLE DEVELOPMENT
Data tab
les
Rank Country EGDI Level EGDI Online Service Component
Telecomm. Infrastructure Component
Human Capital Component
50 Czech Republic High 0.6454 0.4783 0.5952 0.8627
153 Democratic People's Republic of Korea
Medium 0.2801 0.0217 0.0363 0.7822
180 Democratic Republic of the Congo
Low 0.1876 0.0870 0.0788 0.3970
9 Denmark Very high 0.8510 0.7754 0.8247 0.9530
187 Djibouti Low 0.1337 0.0217 0.0698 0.3095
109 Dominica Medium 0.4577 0.3043 0.4305 0.6384
98 Dominican Republic Medium 0.4914 0.5072 0.2992 0.6676
74 Ecuador High 0.5625 0.6304 0.3438 0.7134
108 Egypt Medium 0.4594 0.4710 0.3025 0.6048
104 El Salvador Medium 0.4718 0.4855 0.3265 0.6035
165 Equatorial Guinea Low 0.2403 0.0797 0.1237 0.5174
190 Eritrea Low 0.0902 0.0217 0.0000 0.2487
13 Estonia Very high 0.8334 0.8913 0.7329 0.8761
157 Ethiopia Medium 0.2666 0.5290 0.0495 0.2212
96 Fiji Medium 0.4989 0.4130 0.3326 0.7509
5 Finland Very high 0.8817 0.9420 0.7590 0.9440
10 France Very high 0.8456 0.9420 0.7502 0.8445
129 Gabon Medium 0.3584 0.1522 0.3068 0.6162
167 Gambia Low 0.2396 0.1957 0.1959 0.3274
61 Georgia High 0.6108 0.6377 0.4184 0.7763
15 Germany Very high 0.8210 0.8406 0.7342 0.8882
120 Ghana Medium 0.4181 0.4493 0.2594 0.5458
43 Greece High 0.6910 0.5797 0.6032 0.8901
88 Grenada High 0.5168 0.3696 0.3988 0.7820
102 Guatemala Medium 0.4790 0.6667 0.2358 0.5345
189 Guinea Low 0.1226 0.0870 0.0906 0.1903
181 Guinea-Bissau Low 0.1818 0.1087 0.0828 0.3538
126 Guyana Medium 0.3651 0.2826 0.2432 0.5694
178 Haiti Low 0.1931 0.1667 0.1004 0.3124
127 Honduras Medium 0.3611 0.3116 0.2008 0.5709
46 Hungary High 0.6745 0.6304 0.5615 0.8317
27 Iceland Very high 0.7662 0.6232 0.7814 0.8940
107 India Medium 0.4637 0.7464 0.1430 0.5019
116 Indonesia Medium 0.4478 0.3623 0.3016 0.6796
106 Iran (Islamic Republic of) Medium 0.4649 0.3333 0.3514 0.7101
141 Iraq Medium 0.3334 0.3551 0.1647 0.4803
26 Ireland Very high 0.7689 0.7246 0.6602 0.9218
20 Israel Very high 0.7806 0.8623 0.6175 0.8619
22 Italy Very high 0.7764 0.8696 0.6469 0.8126
112 Jamaica Medium 0.4534 0.3551 0.3193 0.6859
11 Japan Very high 0.8440 0.8768 0.8277 0.8274
91 Jordan High 0.5123 0.4565 0.3458 0.7344
33 Kazakhstan High 0.7250 0.7681 0.5668 0.8401
119 Kenya Medium 0.4186 0.5580 0.1808 0.5169
Table 2. E-Government Development Index (EGDI) (continued)

156
DATA TABLES
Data tab
les
Rank Country EGDI Level EGDI Online Service Component
Telecomm. Infrastructure Component
Human Capital Component
145 Kiribati Medium 0.3122 0.2101 0.0665 0.6599
40 Kuwait High 0.7080 0.6522 0.7430 0.7287
97 Kyrgyzstan Medium 0.4969 0.4275 0.3123 0.7508
148 Lao People's Democratic Republic
Medium 0.3090 0.2826 0.1537 0.4907
45 Latvia High 0.6810 0.6087 0.5831 0.8512
73 Lebanon High 0.5646 0.5145 0.4911 0.6882
154 Lesotho Medium 0.2770 0.1377 0.1787 0.5147
170 Liberia Low 0.2338 0.2391 0.1041 0.3581
118 Libya Medium 0.4322 0.1087 0.4291 0.7588
32 Liechtenstein High 0.7313 0.6667 0.7293 0.7978
23 Lithuania Very high 0.7747 0.8261 0.6262 0.8717
25 Luxembourg Very high 0.7705 0.7174 0.8190 0.7750
163 Madagascar Low 0.2416 0.2246 0.0514 0.4488
166 Malawi Low 0.2398 0.2174 0.0485 0.4535
60 Malaysia High 0.6175 0.7174 0.4397 0.6953
117 Maldives Medium 0.4330 0.2319 0.4370 0.6301
182 Mali Low 0.1817 0.0942 0.2149 0.2358
30 Malta High 0.7424 0.7971 0.6992 0.7310
156 Marshall Islands Medium 0.2695 0.0290 0.0849 0.6947
184 Mauritania Low 0.1734 0.0652 0.1536 0.3015
58 Mauritius High 0.6231 0.7029 0.4596 0.7067
59 Mexico High 0.6195 0.8478 0.3114 0.6993
146 Micronesia (Federated States of) Medium 0.3103 0.1449 0.1197 0.6663
31 Monaco High 0.7315 0.3188 1.0000 0.8757
84 Mongolia High 0.5194 0.5145 0.2841 0.7597
47 Montenegro High 0.6733 0.6812 0.5221 0.8165
85 Morocco High 0.5186 0.7391 0.3429 0.4737
172 Mozambique Low 0.2305 0.2029 0.0993 0.3893
169 Myanmar Low 0.2362 0.1594 0.0655 0.4837
125 Namibia Medium 0.3682 0.2826 0.2669 0.5551
152 Nauru Medium 0.2868 0.0942 0.2448 0.5214
135 Nepal Medium 0.3458 0.3986 0.1675 0.4714
7 Netherlands Very high 0.8659 0.9275 0.7517 0.9183
8 New Zealand Very high 0.8653 0.9420 0.7136 0.9402
123 Nicaragua Medium 0.3801 0.3841 0.2109 0.5454
192 Niger Low 0.0593 0.0725 0.0557 0.0498
143 Nigeria Medium 0.3291 0.4130 0.1958 0.3784
18 Norway Very high 0.8117 0.8043 0.7276 0.9031
66 Oman High 0.5962 0.5942 0.5147 0.6796
159 Pakistan Medium 0.2583 0.3261 0.1299 0.3190
111 Palau Medium 0.4546 0.1087 0.3684 0.8867
99 Panama Medium 0.4903 0.3333 0.4202 0.7175
179 Papua New Guinea Low 0.1882 0.1667 0.0739 0.3240
95 Paraguay Medium 0.4989 0.6014 0.2544 0.6409
Table 2. E-Government Development Index (EGDI) (continued)

157
E-GOVERNMENT IN SUPPORT OF SUSTAINABLE DEVELOPMENT
Data tab
les
Rank Country EGDI Level EGDI Online Service Component
Telecomm. Infrastructure Component
Human Capital Component
81 Peru High 0.5381 0.6304 0.2689 0.7151
71 Philippines High 0.5765 0.6667 0.3791 0.6839
36 Poland High 0.7211 0.7029 0.5857 0.8747
38 Portugal High 0.7144 0.7464 0.5838 0.8129
48 Qatar High 0.6699 0.6739 0.6041 0.7317
3 Republic of Korea Very high 0.8915 0.9420 0.8530 0.8795
65 Republic of Moldova High 0.5994 0.5942 0.4850 0.7191
75 Romania High 0.5611 0.4565 0.4533 0.7736
35 Russian Federation High 0.7215 0.7319 0.6091 0.8234
138 Rwanda Medium 0.3390 0.4565 0.1084 0.4522
94 Saint Kitts and Nevis High 0.5034 0.2826 0.5301 0.6976
114 Saint Lucia Medium 0.4531 0.2754 0.4094 0.6744
115 Saint Vincent and the Grenadines
Medium 0.4494 0.2971 0.3756 0.6754
121 Samoa Medium 0.4019 0.3406 0.1576 0.7076
78 San Marino High 0.5506 0.2391 0.6128 0.7999
168 Sao Tome and Principe Low 0.2390 0.0435 0.1547 0.5188
44 Saudi Arabia High 0.6822 0.6739 0.5733 0.7995
144 Senegal Medium 0.3250 0.3768 0.1958 0.4025
39 Serbia High 0.7131 0.8188 0.5434 0.7769
86 Seychelles High 0.5181 0.4058 0.4624 0.6861
186 Sierra Leone Low 0.1594 0.1159 0.1216 0.2407
4 Singapore Very high 0.8828 0.9710 0.8414 0.8360
67 Slovakia High 0.5915 0.4420 0.5504 0.7822
21 Slovenia Very high 0.7769 0.8478 0.5877 0.8952
164 Solomon Islands Low 0.2406 0.1667 0.1150 0.4402
193 Somalia Low 0.0270 0.0145 0.0665 0.0000
76 South Africa High 0.5546 0.5580 0.3807 0.7253
183 South Sudan Low 0.1791 0.1232 0.0534 0.3607
17 Spain Very high 0.8135 0.9130 0.6493 0.8782
79 Sri Lanka High 0.5445 0.6522 0.2445 0.7369
161 Sudan Medium 0.2539 0.2174 0.1861 0.3581
110 Suriname Medium 0.4546 0.2971 0.4116 0.6551
136 Swaziland Medium 0.3412 0.2754 0.1601 0.5882
6 Sweden Very high 0.8704 0.8768 0.8134 0.9210
28 Switzerland Very high 0.7525 0.6014 0.7980 0.8579
137 Syrian Arab Republic Medium 0.3404 0.3261 0.2087 0.4864
139 Tajikistan Medium 0.3366 0.1232 0.1866 0.7001
77 Thailand High 0.5522 0.5507 0.4117 0.6942
69 The former Yugoslav Republic of Macedonia
High 0.5885 0.6087 0.4693 0.6877
160 Timor-Leste Medium 0.2582 0.2174 0.0728 0.4843
147 Togo Medium 0.3096 0.3188 0.1044 0.5056
105 Tonga Medium 0.4700 0.3696 0.2302 0.8102
70 Trinidad and Tobago High 0.5780 0.5290 0.4973 0.7077
72 Tunisia High 0.5682 0.7174 0.3476 0.6397
Table 2. E-Government Development Index (EGDI) (continued)

158
DATA TABLES
Data tab
les
Rank Country EGDI Level EGDI Online Service Component
Telecomm. Infrastructure Component
Human Capital Component
68 Turkey High 0.5900 0.6014 0.3775 0.7910
140 Turkmenistan Medium 0.3337 0.0870 0.2559 0.6583
151 Tuvalu Medium 0.2950 0.0217 0.1981 0.6651
128 Uganda Medium 0.3599 0.5000 0.1129 0.4668
62 Ukraine High 0.6076 0.5870 0.3968 0.8390
29 United Arab Emirates Very high 0.7515 0.8913 0.6881 0.6752
1 United Kingdom of Great Britain and Northern Ireland
Very high 0.9193 1.0000 0.8177 0.9402
130 United Republic of Tanzania Medium 0.3533 0.5725 0.0900 0.3974
12 United States of America Very high 0.8420 0.9275 0.7170 0.8815
34 Uruguay High 0.7237 0.7754 0.6137 0.7820
80 Uzbekistan High 0.5434 0.6884 0.2463 0.6954
149 Vanuatu Medium 0.3078 0.1667 0.1684 0.5884
90 Venezuela High 0.5128 0.4348 0.3540 0.7498
89 Viet Nam High 0.5143 0.5725 0.3715 0.5989
174 Yemen Low 0.2248 0.1449 0.1465 0.3829
132 Zambia Medium 0.3507 0.3696 0.1182 0.5643
134 Zimbabwe Medium 0.3472 0.2609 0.2167 0.5641
Global Average 0.4922 0.4623 0.3711 0.6433
Table 2. E-Government Development Index (EGDI) (continued)

159
E-GOVERNMENT IN SUPPORT OF SUSTAINABLE DEVELOPMENT
Data tab
les
Region EGDI Online Service Component
Telecomm. Infrastructure Component
Human Capital Component
Africa 0.2882 0.2567 0.1724 0.4355
Americas 0.5245 0.4959 0.3844 0.6933
Asia 0.5132 0.5120 0.3730 0.6545
Europe 0.7241 0.6926 0.6438 0.8360
Oceania 0.4154 0.2966 0.2599 0.6897
World 0.4922 0.4623 0.3711 0.6433
EGDI Online Service Component
Telecomm. Infrastructure Component
Human Capital Component
Small Island Developing States 0.4189 0.3021 0.3103 0.6442
Land Locked Developing Countries 0.3591 0.3474 0.2131 0.5170
Least Developed Countries 0.2350 0.2030 0.1145 0.3875
Level of Income EGDI Online Service Component
Telecomm. Infrastructure Component
Human Capital Component
High Income 0.4980 0.4678 0.3789 0.6471
Upper Middle Income 0.4964 0.4658 0.3759 0.6476
Lower Middle Income 0.3861 0.3719 0.2292 0.5573
Low Income 0.2303 0.2101 0.1062 0.3746
Table 3. Regional and Economic Groupings for E-Government Development Index (EGDI)

160
DATA TABLES
Data tab
les
Rank Country Sub-region EGDI Online Service Component
Telecomm. Infrastructure Component
Human Capital Component
150 Algeria Northern Africa 0.2999 0.0652 0.1934 0.6412
142 Angola Central Africa 0.3311 0.3478 0.1441 0.5015
177 Benin West Africa 0.2039 0.1449 0.1471 0.3196
113 Botswana Southern Africa 0.4531 0.2826 0.4215 0.6553
185 Burkina Faso West Africa 0.1598 0.1884 0.1232 0.1677
173 Burundi Eastern Africa 0.2277 0.1522 0.0331 0.4979
155 Cameroon Central Africa 0.2759 0.2174 0.1310 0.4794
103 Cape Verde West Africa 0.4742 0.4565 0.3629 0.6031
191 Central African Republic Central Africa 0.0789 0.0000 0.0381 0.1985
188 Chad Central Africa 0.1256 0.1377 0.0476 0.1917
176 Comoros Eastern Africa 0.2155 0.0507 0.1073 0.4885
162 Congo Central Africa 0.2497 0.0435 0.1713 0.5344
175 Côte d'Ivoire West Africa 0.2185 0.1884 0.1711 0.2959
180 Democratic Republic of the Congo
Central Africa 0.1876 0.0870 0.0788 0.3970
187 Djibouti Eastern Africa 0.1337 0.0217 0.0698 0.3095
108 Egypt Northern Africa 0.4594 0.4710 0.3025 0.6048
165 Equatorial Guinea Central Africa 0.2403 0.0797 0.1237 0.5174
190 Eritrea Eastern Africa 0.0902 0.0217 0.0000 0.2487
157 Ethiopia Eastern Africa 0.2666 0.5290 0.0495 0.2212
129 Gabon Central Africa 0.3584 0.1522 0.3068 0.6162
167 Gambia West Africa 0.2396 0.1957 0.1959 0.3274
120 Ghana West Africa 0.4181 0.4493 0.2594 0.5458
189 Guinea West Africa 0.1226 0.0870 0.0906 0.1903
181 Guinea-Bissau West Africa 0.1818 0.1087 0.0828 0.3538
119 Kenya Eastern Africa 0.4186 0.5580 0.1808 0.5169
154 Lesotho Southern Africa 0.2770 0.1377 0.1787 0.5147
170 Liberia West Africa 0.2338 0.2391 0.1041 0.3581
118 Libya Northern Africa 0.4322 0.1087 0.4291 0.7588
163 Madagascar Eastern Africa 0.2416 0.2246 0.0514 0.4488
166 Malawi Eastern Africa 0.2398 0.2174 0.0485 0.4535
182 Mali West Africa 0.1817 0.0942 0.2149 0.2358
184 Mauritania West Africa 0.1734 0.0652 0.1536 0.3015
58 Mauritius Eastern Africa 0.6231 0.7029 0.4596 0.7067
85 Morocco Northern Africa 0.5186 0.7391 0.3429 0.4737
172 Mozambique Eastern Africa 0.2305 0.2029 0.0993 0.3893
125 Namibia Southern Africa 0.3682 0.2826 0.2669 0.5551
192 Niger West Africa 0.0593 0.0725 0.0557 0.0498
143 Nigeria West Africa 0.3291 0.4130 0.1958 0.3784
138 Rwanda Eastern Africa 0.3390 0.4565 0.1084 0.4522
168 Sao Tome and Principe Central Africa 0.2390 0.0435 0.1547 0.5188
144 Senegal West Africa 0.3250 0.3768 0.1958 0.4025
86 Seychelles Eastern Africa 0.5181 0.4058 0.4624 0.6861
Table 4. E-Government Development Index (EGDI) by region - AFRICA

161
E-GOVERNMENT IN SUPPORT OF SUSTAINABLE DEVELOPMENT
Data tab
les
Rank Country Sub-region EGDI Online Service Component
Telecomm. Infrastructure Component
Human Capital Component
186 Sierra Leone West Africa 0.1594 0.1159 0.1216 0.2407
193 Somalia Eastern Africa 0.0270 0.0145 0.0665 0.0000
76 South Africa Southern Africa 0.5546 0.5580 0.3807 0.7253
183 South Sudan Northern Africa 0.1791 0.1232 0.0534 0.3607
161 Sudan Northern Africa 0.2539 0.2174 0.1861 0.3581
136 Swaziland Southern Africa 0.3412 0.2754 0.1601 0.5882
147 Togo West Africa 0.3096 0.3188 0.1044 0.5056
72 Tunisia Northern Africa 0.5682 0.7174 0.3476 0.6397
128 Uganda Eastern Africa 0.3599 0.5000 0.1129 0.4668
130 United Republic of Tanzania
Eastern Africa 0.3533 0.5725 0.0900 0.3974
132 Zambia Eastern Africa 0.3507 0.3696 0.1182 0.5643
134 Zimbabwe Eastern Africa 0.3472 0.2609 0.2167 0.5641
Regional Average (AFRICA) 0.2882 0.2567 0.1724 0.4355
Table 4. E-Government Development Index (EGDI) by region - AFRICA (continued)
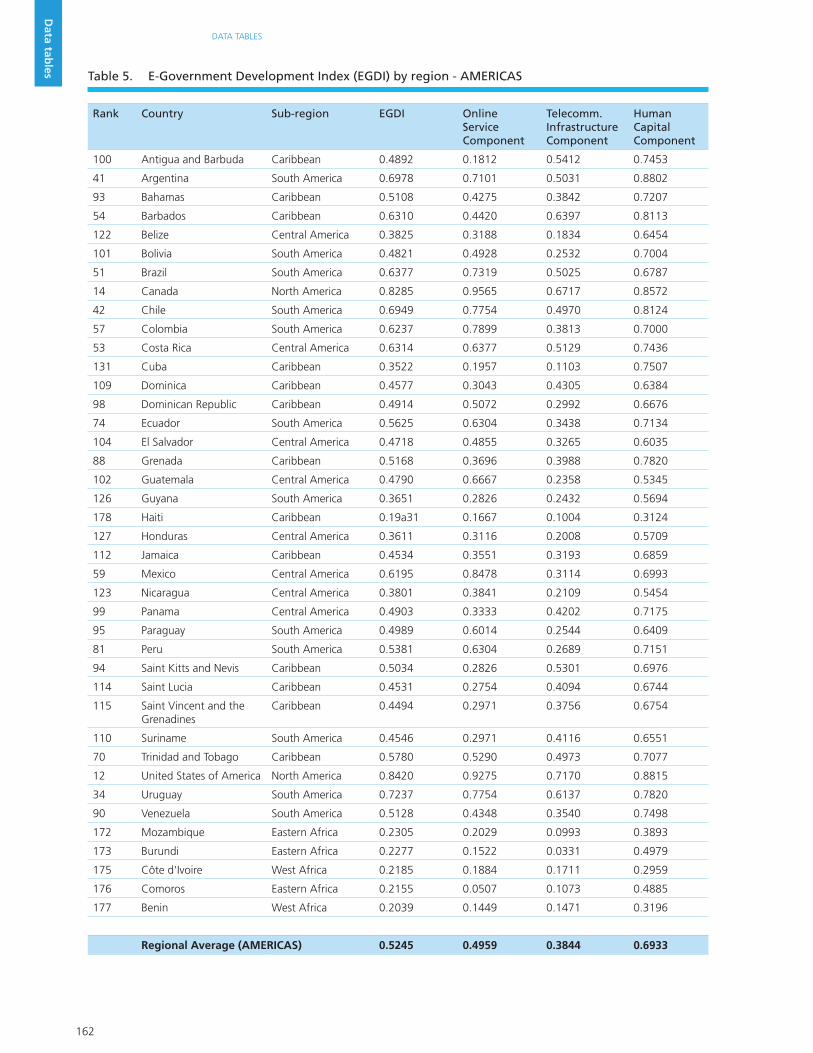
162
DATA TABLES
Data tab
les
Rank Country Sub-region EGDI Online Service Component
Telecomm. Infrastructure Component
Human Capital Component
100 Antigua and Barbuda Caribbean 0.4892 0.1812 0.5412 0.7453
41 Argentina South America 0.6978 0.7101 0.5031 0.8802
93 Bahamas Caribbean 0.5108 0.4275 0.3842 0.7207
54 Barbados Caribbean 0.6310 0.4420 0.6397 0.8113
122 Belize Central America 0.3825 0.3188 0.1834 0.6454
101 Bolivia South America 0.4821 0.4928 0.2532 0.7004
51 Brazil South America 0.6377 0.7319 0.5025 0.6787
14 Canada North America 0.8285 0.9565 0.6717 0.8572
42 Chile South America 0.6949 0.7754 0.4970 0.8124
57 Colombia South America 0.6237 0.7899 0.3813 0.7000
53 Costa Rica Central America 0.6314 0.6377 0.5129 0.7436
131 Cuba Caribbean 0.3522 0.1957 0.1103 0.7507
109 Dominica Caribbean 0.4577 0.3043 0.4305 0.6384
98 Dominican Republic Caribbean 0.4914 0.5072 0.2992 0.6676
74 Ecuador South America 0.5625 0.6304 0.3438 0.7134
104 El Salvador Central America 0.4718 0.4855 0.3265 0.6035
88 Grenada Caribbean 0.5168 0.3696 0.3988 0.7820
102 Guatemala Central America 0.4790 0.6667 0.2358 0.5345
126 Guyana South America 0.3651 0.2826 0.2432 0.5694
178 Haiti Caribbean 0.19a31 0.1667 0.1004 0.3124
127 Honduras Central America 0.3611 0.3116 0.2008 0.5709
112 Jamaica Caribbean 0.4534 0.3551 0.3193 0.6859
59 Mexico Central America 0.6195 0.8478 0.3114 0.6993
123 Nicaragua Central America 0.3801 0.3841 0.2109 0.5454
99 Panama Central America 0.4903 0.3333 0.4202 0.7175
95 Paraguay South America 0.4989 0.6014 0.2544 0.6409
81 Peru South America 0.5381 0.6304 0.2689 0.7151
94 Saint Kitts and Nevis Caribbean 0.5034 0.2826 0.5301 0.6976
114 Saint Lucia Caribbean 0.4531 0.2754 0.4094 0.6744
115 Saint Vincent and the Grenadines
Caribbean 0.4494 0.2971 0.3756 0.6754
110 Suriname South America 0.4546 0.2971 0.4116 0.6551
70 Trinidad and Tobago Caribbean 0.5780 0.5290 0.4973 0.7077
12 United States of America North America 0.8420 0.9275 0.7170 0.8815
34 Uruguay South America 0.7237 0.7754 0.6137 0.7820
90 Venezuela South America 0.5128 0.4348 0.3540 0.7498
172 Mozambique Eastern Africa 0.2305 0.2029 0.0993 0.3893
173 Burundi Eastern Africa 0.2277 0.1522 0.0331 0.4979
175 Côte d'Ivoire West Africa 0.2185 0.1884 0.1711 0.2959
176 Comoros Eastern Africa 0.2155 0.0507 0.1073 0.4885
177 Benin West Africa 0.2039 0.1449 0.1471 0.3196
Regional Average (AMERICAS) 0.5245 0.4959 0.3844 0.6933
Table 5. E-Government Development Index (EGDI) by region - AMERICAS

163
E-GOVERNMENT IN SUPPORT OF SUSTAINABLE DEVELOPMENT
Data tab
les
Rank Country Sub-region EGDI Online Service Component
Telecomm. Infrastructure Component
Human Capital Component
171 Afghanistan Southern Asia 0.2313 0.3043 0.1066 0.2830
87 Armenia Western Asia 0.5179 0.4275 0.3922 0.7338
56 Azerbaijan Western Asia 0.6274 0.6812 0.4852 0.7158
24 Bahrain Western Asia 0.7734 0.8261 0.7762 0.7178
124 Bangladesh Southern Asia 0.3799 0.6232 0.1193 0.3973
133 Bhutan Southern Asia 0.3506 0.3188 0.2192 0.5139
83 Brunei Darussalam South-Eastern Asia 0.5298 0.5072 0.3512 0.7310
158 Cambodia South-Eastern Asia 0.2593 0.0507 0.2486 0.4785
63 China Eastern Asia 0.6071 0.7681 0.3673 0.6860
64 Cyprus Western Asia 0.6023 0.5362 0.4923 0.7782
153 Democratic People's Republic of Korea
Eastern Asia 0.2801 0.0217 0.0363 0.7822
61 Georgia Western Asia 0.6108 0.6377 0.4184 0.7763
107 India Southern Asia 0.4637 0.7464 0.1430 0.5019
116 Indonesia South-Eastern Asia 0.4478 0.3623 0.3016 0.6796
106 Iran (Islamic Republic of) Southern Asia 0.4649 0.3333 0.3514 0.7101
141 Iraq Western Asia 0.3334 0.3551 0.1647 0.4803
20 Israel Western Asia 0.7806 0.8623 0.6175 0.8619
11 Japan Eastern Asia 0.8440 0.8768 0.8277 0.8274
91 Jordan Western Asia 0.5123 0.4565 0.3458 0.7344
33 Kazakhstan Central Asia 0.7250 0.7681 0.5668 0.8401
40 Kuwait Western Asia 0.7080 0.6522 0.7430 0.7287
97 Kyrgyzstan Central Asia 0.4969 0.4275 0.3123 0.7508
148 Lao People's Democratic Republic
South-Eastern Asia 0.3090 0.2826 0.1537 0.4907
73 Lebanon Western Asia 0.5646 0.5145 0.4911 0.6882
60 Malaysia South-Eastern Asia 0.6175 0.7174 0.4397 0.6953
117 Maldives Southern Asia 0.4330 0.2319 0.4370 0.6301
84 Mongolia Eastern Asia 0.5194 0.5145 0.2841 0.7597
169 Myanmar South-Eastern Asia 0.2362 0.1594 0.0655 0.4837
135 Nepal Southern Asia 0.3458 0.3986 0.1675 0.4714
66 Oman Western Asia 0.5962 0.5942 0.5147 0.6796
159 Pakistan Southern Asia 0.2583 0.3261 0.1299 0.3190
71 Philippines South-Eastern Asia 0.5765 0.6667 0.3791 0.6839
48 Qatar Western Asia 0.6699 0.6739 0.6041 0.7317
3 Republic of Korea Eastern Asia 0.8915 0.9420 0.8530 0.8795
44 Saudi Arabia Western Asia 0.6822 0.6739 0.5733 0.7995
4 Singapore South-Eastern Asia 0.8828 0.9710 0.8414 0.8360
79 Sri Lanka Southern Asia 0.5445 0.6522 0.2445 0.7369
137 Syrian Arab Republic Western Asia 0.3404 0.3261 0.2087 0.4864
139 Tajikistan Central Asia 0.3366 0.1232 0.1866 0.7001
77 Thailand South-Eastern Asia 0.5522 0.5507 0.4117 0.6942
160 Timor-Leste South-Eastern Asia 0.2582 0.2174 0.0728 0.4843
68 Turkey Western Asia 0.5900 0.6014 0.3775 0.7910
Table 6. E-Government Development Index (EGDI) by region - ASIA

164
DATA TABLES
Data tab
les
Rank Country Sub-region EGDI Online Service Component
Telecomm. Infrastructure Component
Human Capital Component
140 Turkmenistan Central Asia 0.3337 0.0870 0.2559 0.6583
29 United Arab Emirates Western Asia 0.7515 0.8913 0.6881 0.6752
80 Uzbekistan Central Asia 0.5434 0.6884 0.2463 0.6954
89 Viet Nam South-Eastern Asia 0.5143 0.5725 0.3715 0.5989
174 Yemen Western Asia 0.2248 0.1449 0.1465 0.3829
Regional Average (ASIA)
0.5132 0.5120 0.3730 0.6545
Table 6. E-Government Development Index (EGDI) by region - ASIA (continued)

165
E-GOVERNMENT IN SUPPORT OF SUSTAINABLE DEVELOPMENT
Data tab
les
Rank Country Sub-region EGDI Online Service Component
Telecomm. Infrastructure Component
Human Capital Component
82 Albania Southern Europe 0.5331 0.5942 0.3530 0.6520
55 Andorra Southern Europe 0.6302 0.5072 0.6855 0.6978
16 Austria Western Europe 0.8208 0.9130 0.7098 0.8396
49 Belarus Eastern Europe 0.6625 0.4855 0.6304 0.8716
19 Belgium Western Europe 0.7874 0.7101 0.6808 0.9712
92 Bosnia and Herzegovina Southern Europe 0.5118 0.4493 0.4047 0.6815
52 Bulgaria Eastern Europe 0.6376 0.5652 0.5602 0.7875
37 Croatia Southern Europe 0.7162 0.7464 0.5974 0.8050
50 Czech Republic Eastern Europe 0.6454 0.4783 0.5952 0.8627
9 Denmark Northern Europe 0.8510 0.7754 0.8247 0.9530
13 Estonia Northern Europe 0.8334 0.8913 0.7329 0.8761
5 Finland Northern Europe 0.8817 0.9420 0.7590 0.9440
10 France Western Europe 0.8456 0.9420 0.7502 0.8445
15 Germany Western Europe 0.8210 0.8406 0.7342 0.8882
43 Greece Southern Europe 0.6910 0.5797 0.6032 0.8901
46 Hungary Eastern Europe 0.6745 0.6304 0.5615 0.8317
27 Iceland Northern Europe 0.7662 0.6232 0.7814 0.8940
26 Ireland Northern Europe 0.7689 0.7246 0.6602 0.9218
22 Italy Southern Europe 0.7764 0.8696 0.6469 0.8126
45 Latvia Northern Europe 0.6810 0.6087 0.5831 0.8512
32 Liechtenstein Western Europe 0.7313 0.6667 0.7293 0.7978
23 Lithuania Northern Europe 0.7747 0.8261 0.6262 0.8717
25 Luxembourg Western Europe 0.7705 0.7174 0.8190 0.7750
30 Malta Southern Europe 0.7424 0.7971 0.6992 0.7310
31 Monaco Western Europe 0.7315 0.3188 1.0000 0.8757
47 Montenegro Southern Europe 0.6733 0.6812 0.5221 0.8165
7 Netherlands Western Europe 0.8659 0.9275 0.7517 0.9183
18 Norway Northern Europe 0.8117 0.8043 0.7276 0.9031
36 Poland Eastern Europe 0.7211 0.7029 0.5857 0.8747
38 Portugal Southern Europe 0.7144 0.7464 0.5838 0.8129
65 Republic of Moldova Eastern Europe 0.5994 0.5942 0.4850 0.7191
75 Romania Eastern Europe 0.5611 0.4565 0.4533 0.7736
35 Russian Federation Eastern Europe 0.7215 0.7319 0.6091 0.8234
78 San Marino Southern Europe 0.5506 0.2391 0.6128 0.7999
39 Serbia Southern Europe 0.7131 0.8188 0.5434 0.7769
67 Slovakia Eastern Europe 0.5915 0.4420 0.5504 0.7822
21 Slovenia Southern Europe 0.7769 0.8478 0.5877 0.8952
17 Spain Southern Europe 0.8135 0.9130 0.6493 0.8782
6 Sweden Northern Europe 0.8704 0.8768 0.8134 0.9210
28 Switzerland Western Europe 0.7525 0.6014 0.7980 0.8579
69 The former Yugoslav Republic of Macedonia
Southern Europe 0.5885 0.6087 0.4693 0.6877
Table 7. E-Government Development Index (EGDI) by region - EUROPE

166
DATA TABLES
Data tab
les
Rank Country Sub-region EGDI Online Service Component
Telecomm. Infrastructure Component
Human Capital Component
62 Ukraine Eastern Europe 0.6076 0.5870 0.3968 0.8390
1 United Kingdom of Great Britain and Northern Ireland
Northern Europe 0.9193 1.0000 0.8177 0.9402
Regional Average (EUROPE) 0.7241 0.6926 0.6438 0.6897
Rank Country Sub-region EGDI Online Service Component
Telecomm. Infrastructure Component
Human Capital Component
2 Australia Oceania 0.9143 0.9783 0.7646 1.0000
96 Fiji Oceania 0.4989 0.4130 0.3326 0.7509
145 Kiribati Oceania 0.3122 0.2101 0.0665 0.6599
156 Marshall Islands Oceania 0.2695 0.0290 0.0849 0.6947
146 Micronesia (Federated States of)
Oceania 0.3103 0.1449 0.1197 0.6663
152 Nauru Oceania 0.2868 0.0942 0.2448 0.5214
8 New Zealand Oceania 0.8653 0.9420 0.7136 0.9402
111 Palau Oceania 0.4546 0.1087 0.3684 0.8867
179 Papua New Guinea Oceania 0.1882 0.1667 0.0739 0.3240
121 Samoa Oceania 0.4019 0.3406 0.1576 0.7076
164 Solomon Islands Oceania 0.2406 0.1667 0.1150 0.4402
105 Tonga Oceania 0.4700 0.3696 0.2302 0.8102
151 Tuvalu Oceania 0.2950 0.0217 0.1981 0.6651
149 Vanuatu Oceania 0.3078 0.1667 0.1684 0.5884
Regional Average (OCEANIA)
0.4154 0.2966 0.2599 0.6897
Table 8. E-Government Development Index (EGDI) by region - OCEANIA
Table 7. E-Government Development Index (EGDI) by region - EUROPE (continued)

167
E-GOVERNMENT IN SUPPORT OF SUSTAINABLE DEVELOPMENT
Data tab
les
Rank Country Sub-region EGDI Online Service Component
Telecomm. Infrastructure Component
Human Capital Component
171 Afghanistan Southern Asia 0.2313 0.3043 0.1066 0.2830
142 Angola Central Africa 0.3311 0.3478 0.1441 0.5015
124 Bangladesh Southern Asia 0.3799 0.6232 0.1193 0.3973
177 Benin West Africa 0.2039 0.1449 0.1471 0.3196
133 Bhutan Southern Asia 0.3506 0.3188 0.2192 0.5139
185 Burkina Faso West Africa 0.1598 0.1884 0.1232 0.1677
173 Burundi Eastern Africa 0.2277 0.1522 0.0331 0.4979
158 Cambodia South-Eastern Asia 0.2593 0.0507 0.2486 0.4785
191 Central African Republic Central Africa 0.0789 0.0000 0.0381 0.1985
188 Chad Central Africa 0.1256 0.1377 0.0476 0.1917
176 Comoros Eastern Africa 0.2155 0.0507 0.1073 0.4885
180 Democratic Republic of the Congo
Central Africa 0.1876 0.0870 0.0788 0.3970
187 Djibouti Eastern Africa 0.1337 0.0217 0.0698 0.3095
165 Equatorial Guinea Central Africa 0.2403 0.0797 0.1237 0.5174
190 Eritrea Eastern Africa 0.0902 0.0217 0.0000 0.2487
157 Ethiopia Eastern Africa 0.2666 0.5290 0.0495 0.2212
167 Gambia West Africa 0.2396 0.1957 0.1959 0.3274
189 Guinea West Africa 0.1226 0.0870 0.0906 0.1903
181 Guinea-Bissau West Africa 0.1818 0.1087 0.0828 0.3538
178 Haiti Caribbean 0.1931 0.1667 0.1004 0.3124
145 Kiribati Oceania 0.3122 0.2101 0.0665 0.6599
148 Lao People's Democratic Republic
South-Eastern Asia 0.3090 0.2826 0.1537 0.4907
154 Lesotho Southern Africa 0.2770 0.1377 0.1787 0.5147
170 Liberia West Africa 0.2338 0.2391 0.1041 0.3581
163 Madagascar Eastern Africa 0.2416 0.2246 0.0514 0.4488
166 Malawi Eastern Africa 0.2398 0.2174 0.0485 0.4535
182 Mali West Africa 0.1817 0.0942 0.2149 0.2358
184 Mauritania West Africa 0.1734 0.0652 0.1536 0.3015
172 Mozambique Eastern Africa 0.2305 0.2029 0.0993 0.3893
169 Myanmar South-Eastern Asia 0.2362 0.1594 0.0655 0.4837
135 Nepal Southern Asia 0.3458 0.3986 0.1675 0.4714
192 Niger West Africa 0.0593 0.0725 0.0557 0.0498
138 Rwanda Eastern Africa 0.3390 0.4565 0.1084 0.4522
168 Sao Tome and Principe Central Africa 0.2390 0.0435 0.1547 0.5188
144 Senegal West Africa 0.3250 0.3768 0.1958 0.4025
186 Sierra Leone West Africa 0.1594 0.1159 0.1216 0.2407
164 Solomon Islands Oceania 0.2406 0.1667 0.1150 0.4402
193 Somalia Eastern Africa 0.0270 0.0145 0.0665 0.0000
183 South Sudan Northern Africa 0.1791 0.1232 0.0534 0.3607
161 Sudan Northern Africa 0.2539 0.2174 0.1861 0.3581
160 Timor-Leste South-Eastern Asia 0.2582 0.2174 0.0728 0.4843
147 Togo West Africa 0.3096 0.3188 0.1044 0.5056
Table 9. E-Government Development Index (EGDI) of Least Developed Countries (LDCs)

168
DATA TABLES
Data tab
les
Rank Country Sub-region EGDI Online Service Component
Telecomm. Infrastructure Component
Human Capital Component
151 Tuvalu Oceania 0.2950 0.0217 0.1981 0.6651
128 Uganda Eastern Africa 0.3599 0.5000 0.1129 0.4668
130 United Republic of Tanzania
Eastern Africa 0.3533 0.5725 0.0900 0.3974
149 Vanuatu Oceania 0.3078 0.1667 0.1684 0.5884
174 Yemen Western Asia 0.2248 0.1449 0.1465 0.3829
132 Zambia Eastern Africa 0.3507 0.3696 0.1182 0.5643
LDCs Average 0.2350 0.2030 0.1145 0.3875
Table 9. E-Government Development Index (EGDI) of Least Developed Countries (LDCs) (continued)

169
E-GOVERNMENT IN SUPPORT OF SUSTAINABLE DEVELOPMENT
Data tab
les
Rank Country Sub-Region EGDI Online Service Component
Telecomm. Infrastructure Component
Human Capital Component
100 Antigua and Barbuda Caribbean 0.4892 0.1812 0.5412 0.7453
93 Bahamas Caribbean 0.5108 0.4275 0.3842 0.7207
54 Barbados Caribbean 0.6310 0.4420 0.6397 0.8113
122 Belize Central America 0.3825 0.3188 0.1834 0.6454
103 Cape Verde West Africa 0.4742 0.4565 0.3629 0.6031
176 Comoros Eastern Africa 0.2155 0.0507 0.1073 0.4885
131 Cuba Caribbean 0.3522 0.1957 0.1103 0.7507
109 Dominica Caribbean 0.4577 0.3043 0.4305 0.6384
98 Dominican Republica Caribbean 0.4914 0.5072 0.2992 0.6676
96 Fiji Oceania 0.4989 0.4130 0.3326 0.7509
88 Grenada Caribbean 0.5168 0.3696 0.3988 0.7820
181 Guinea-Bissau West Africa 0.1818 0.1087 0.0828 0.3538
126 Guyana South America 0.3651 0.2826 0.2432 0.5694
178 Haiti Caribbean 0.1931 0.1667 0.1004 0.3124
112 Jamaica Caribbean 0.4534 0.3551 0.3193 0.6859
145 Kiribati Oceania 0.3122 0.2101 0.0665 0.6599
117 Maldives Southern Asia 0.4330 0.2319 0.4370 0.6301
156 Marshall Islands Oceania 0.2695 0.0290 0.0849 0.6947
58 Mauritius Eastern Africa 0.6231 0.7029 0.4596 0.7067
146 Micronesia (Federated States of)
Oceania 0.3103 0.1449 0.1197 0.6663
152 Nauru Oceania 0.2868 0.0942 0.2448 0.5214
111 Palau Oceania 0.4546 0.1087 0.3684 0.8867
179 Papua New Guinea Oceania 0.1882 0.1667 0.0739 0.3240
94 Saint Kitts and Nevis Caribbean 0.5034 0.2826 0.5301 0.6976
114 Saint Lucia Caribbean 0.4531 0.2754 0.4094 0.6744
115 Saint Vincent and the Grenadines
Caribbean 0.4494 0.2971 0.3756 0.6754
121 Samoa Oceania 0.4019 0.3406 0.1576 0.7076
168 Sao Tome and Principe Central Africa 0.2390 0.0435 0.1547 0.5188
86 Seychelles Eastern Africa 0.5181 0.4058 0.4624 0.6861
4 Singapore South-Eastern Asia 0.8828 0.9710 0.8414 0.8360
164 Solomon Islands Oceania 0.2406 0.1667 0.1150 0.4402
110 Suriname South America 0.4546 0.2971 0.4116 0.6551
160 Timor-Leste South-Eastern Asia 0.2582 0.2174 0.0728 0.4843
105 Tonga Oceania 0.4700 0.3696 0.2302 0.8102
70 Trinidad and Tobago Caribbean 0.5780 0.5290 0.4973 0.7077
151 Tuvalu Oceania 0.2950 0.0217 0.1981 0.6651
149 Vanuatu Oceania 0.3078 0.1667 0.1684 0.5884
SIDS Average 0.4093 0.2879 0.2977 0.6422
Table 10. E-Government Development Index (EGDI) of Small Island Developing States (SIDS)
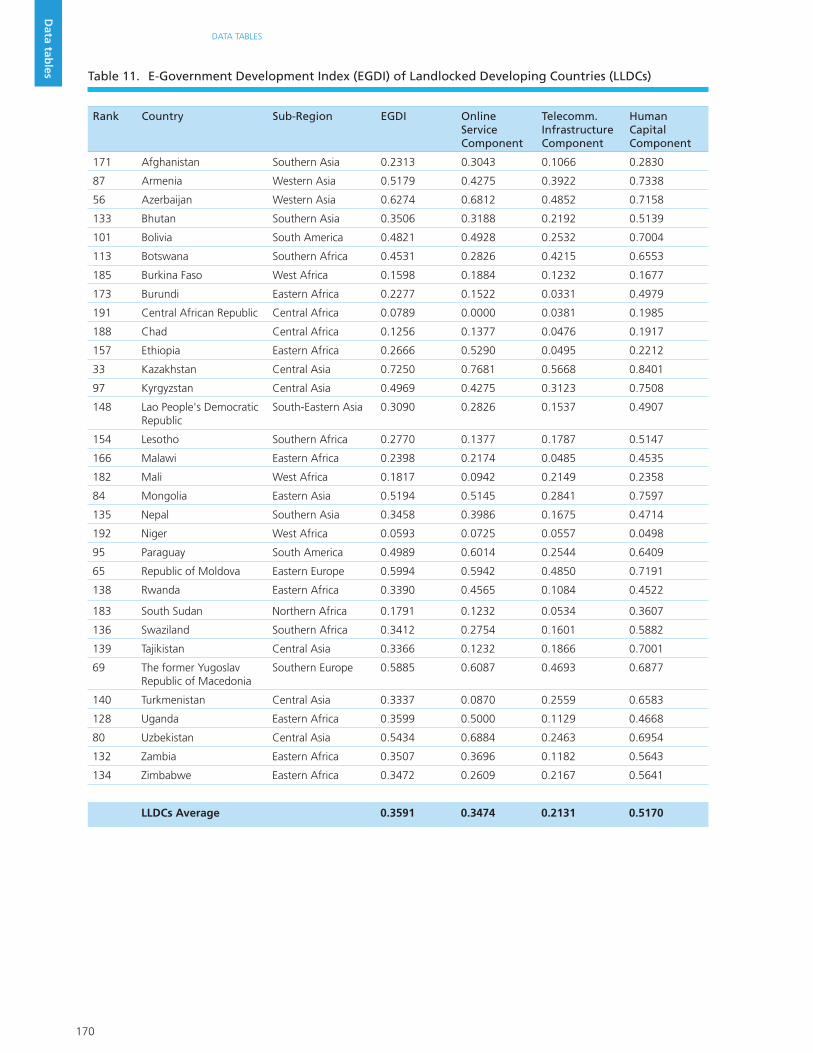
170
DATA TABLES
Data tab
les
Rank Country Sub-Region EGDI Online Service Component
Telecomm. Infrastructure Component
Human Capital Component
171 Afghanistan Southern Asia 0.2313 0.3043 0.1066 0.2830
87 Armenia Western Asia 0.5179 0.4275 0.3922 0.7338
56 Azerbaijan Western Asia 0.6274 0.6812 0.4852 0.7158
133 Bhutan Southern Asia 0.3506 0.3188 0.2192 0.5139
101 Bolivia South America 0.4821 0.4928 0.2532 0.7004
113 Botswana Southern Africa 0.4531 0.2826 0.4215 0.6553
185 Burkina Faso West Africa 0.1598 0.1884 0.1232 0.1677
173 Burundi Eastern Africa 0.2277 0.1522 0.0331 0.4979
191 Central African Republic Central Africa 0.0789 0.0000 0.0381 0.1985
188 Chad Central Africa 0.1256 0.1377 0.0476 0.1917
157 Ethiopia Eastern Africa 0.2666 0.5290 0.0495 0.2212
33 Kazakhstan Central Asia 0.7250 0.7681 0.5668 0.8401
97 Kyrgyzstan Central Asia 0.4969 0.4275 0.3123 0.7508
148 Lao People's Democratic Republic
South-Eastern Asia 0.3090 0.2826 0.1537 0.4907
154 Lesotho Southern Africa 0.2770 0.1377 0.1787 0.5147
166 Malawi Eastern Africa 0.2398 0.2174 0.0485 0.4535
182 Mali West Africa 0.1817 0.0942 0.2149 0.2358
84 Mongolia Eastern Asia 0.5194 0.5145 0.2841 0.7597
135 Nepal Southern Asia 0.3458 0.3986 0.1675 0.4714
192 Niger West Africa 0.0593 0.0725 0.0557 0.0498
95 Paraguay South America 0.4989 0.6014 0.2544 0.6409
65 Republic of Moldova Eastern Europe 0.5994 0.5942 0.4850 0.7191
138 Rwanda Eastern Africa 0.3390 0.4565 0.1084 0.4522
183 South Sudan Northern Africa 0.1791 0.1232 0.0534 0.3607
136 Swaziland Southern Africa 0.3412 0.2754 0.1601 0.5882
139 Tajikistan Central Asia 0.3366 0.1232 0.1866 0.7001
69 The former Yugoslav Republic of Macedonia
Southern Europe 0.5885 0.6087 0.4693 0.6877
140 Turkmenistan Central Asia 0.3337 0.0870 0.2559 0.6583
128 Uganda Eastern Africa 0.3599 0.5000 0.1129 0.4668
80 Uzbekistan Central Asia 0.5434 0.6884 0.2463 0.6954
132 Zambia Eastern Africa 0.3507 0.3696 0.1182 0.5643
134 Zimbabwe Eastern Africa 0.3472 0.2609 0.2167 0.5641
LLDCs Average 0.3591 0.3474 0.2131 0.5170
Table 11. E-Government Development Index (EGDI) of Landlocked Developing Countries (LLDCs)
171
E-GOVERNMENT IN SUPPORT OF SUSTAINABLE DEVELOPMENT
Data tab
les
Rank Country EPI Total % Stage 1 % Stage 2% Stage 3%
104 Afghanistan 0.4237 43.3% 61.8% 26.3% 0.0%
55 Albania 0.6441 65.0% 73.5% 68.4% 14.3%
167 Algeria 0.1186 13.3% 17.6% 10.5% 0.0%
101 Andorra 0.4407 45.0% 64.7% 26.3% 0.0%
101 Angola 0.4407 45.0% 70.6% 15.8% 0.0%
157 Antigua and Barbuda 0.1695 18.3% 26.5% 10.5% 0.0%
60 Argentina 0.6271 63.3% 88.2% 42.1% 0.0%
84 Armenia 0.5254 53.3% 70.6% 42.1% 0.0%
2 Australia 0.9831 98.3% 100.0% 100.0% 85.7%
14 Austria 0.8814 88.3% 94.1% 84.2% 71.4%
47 Azerbaijan 0.6780 68.3% 79.4% 73.7% 0.0%
122 Bahamas 0.3390 35.0% 47.1% 21.1% 14.3%
32 Bahrain 0.7458 75.0% 85.3% 73.7% 28.6%
84 Bangladesh 0.5254 53.3% 73.5% 36.8% 0.0%
104 Barbados 0.4237 43.3% 50.0% 42.1% 14.3%
76 Belarus 0.5593 56.7% 61.8% 68.4% 0.0%
55 Belgium 0.6441 65.0% 85.3% 52.6% 0.0%
138 Belize 0.2542 26.7% 38.2% 15.8% 0.0%
157 Benin 0.1695 18.3% 23.5% 15.8% 0.0%
118 Bhutan 0.3559 36.7% 47.1% 31.6% 0.0%
72 Bolivia 0.5763 58.3% 76.5% 47.4% 0.0%
89 Bosnia and Herzegovina 0.5085 51.7% 70.6% 36.8% 0.0%
127 Botswana 0.2881 30.0% 38.2% 21.1% 14.3%
37 Brazil 0.7288 73.3% 85.3% 78.9% 0.0%
114 Brunei 0.3729 38.3% 50.0% 31.6% 0.0%
43 Bulgaria 0.6949 70.0% 76.5% 78.9% 14.3%
143 Burkina Faso 0.2373 25.0% 38.2% 10.5% 0.0%
161 Burundi 0.1525 16.7% 23.5% 5.3% 14.3%
179 Cambodia 0.0678 8.3% 14.7% 0.0% 0.0%
157 Cameroon 0.1695 18.3% 23.5% 15.8% 0.0%
8 Canada 0.9153 91.7% 97.1% 84.2% 85.7%
97 Cape Verde 0.4746 48.3% 67.6% 31.6% 0.0%
191 Central African Republic 0.0000 1.7% 2.9% 0.0% 0.0%
161 Chad 0.1525 16.7% 26.5% 5.3% 0.0%
32 Chile 0.7458 75.0% 82.4% 78.9% 28.6%
22 China 0.8136 81.7% 94.1% 84.2% 14.3%
27 Colombia 0.7627 76.7% 85.3% 78.9% 28.6%
188 Comoros 0.0169 3.3% 2.9% 5.3% 0.0%
173 Congo, Republic of 0.0847 10.0% 11.8% 10.5% 0.0%
55 Costa Rica 0.6441 65.0% 70.6% 78.9% 0.0%
161 Cote d'Ivoire 0.1525 16.7% 20.6% 15.8% 0.0%
25 Croatia 0.7797 78.3% 73.5% 89.5% 71.4%
124 Cuba 0.3220 33.3% 55.9% 5.3% 0.0%
84 Cyprus 0.5254 53.3% 58.8% 57.9% 14.3%
76 Czech Republic 0.5593 56.7% 73.5% 42.1% 14.3%
Table 12. E-Participation Index (EPI) and its utilisation by stages

172
DATA TABLES
Data tab
les
Rank Country EPI Total % Stage 1 % Stage 2% Stage 3%
188 Democratic People's Republic of Korea 0.0169 3.3% 5.9% 0.0% 0.0%
173 Democratic Republic of the Congo 0.0847 10.0% 14.7% 5.3% 0.0%
22 Denmark 0.8136 81.7% 94.1% 63.2% 71.4%
191 Djibouti 0.0000 1.7% 2.9% 0.0% 0.0%
156 Dominica 0.1864 20.0% 29.4% 10.5% 0.0%
91 Dominican Republic 0.4915 50.0% 70.6% 31.6% 0.0%
72 Ecuador 0.5763 58.3% 70.6% 57.9% 0.0%
107 Egypt 0.4068 41.7% 55.9% 31.6% 0.0%
76 El Salvador 0.5593 56.7% 67.6% 57.9% 0.0%
173 Equatorial Guinea 0.0847 10.0% 17.6% 0.0% 0.0%
188 Eritrea 0.0169 3.3% 5.9% 0.0% 0.0%
22 Estonia 0.8136 81.7% 94.1% 89.5% 0.0%
91 Ethiopia 0.4915 50.0% 61.8% 47.4% 0.0%
127 Fiji 0.2881 30.0% 38.2% 21.1% 14.3%
8 Finland 0.9153 91.7% 97.1% 89.5% 71.4%
12 France 0.8983 90.0% 100.0% 84.2% 57.1%
179 Gabon 0.0678 8.3% 11.8% 5.3% 0.0%
149 Gambia 0.2034 21.7% 32.4% 10.5% 0.0%
76 Georgia 0.5593 56.7% 73.5% 47.4% 0.0%
27 Germany 0.7627 76.7% 91.2% 78.9% 0.0%
98 Ghana 0.4576 46.7% 55.9% 47.4% 0.0%
65 Greece 0.6102 61.7% 58.8% 78.9% 28.6%
124 Grenada 0.3220 33.3% 35.3% 36.8% 14.3%
60 Guatemala 0.6271 63.3% 76.5% 63.2% 0.0%
173 Guinea 0.0847 10.0% 11.8% 10.5% 0.0%
157 Guinea-Bissau 0.1695 18.3% 29.4% 5.3% 0.0%
138 Guyana 0.2542 26.7% 29.4% 26.3% 14.3%
164 Haiti 0.1356 15.0% 17.6% 15.8% 0.0%
111 Honduras 0.3898 40.0% 47.1% 42.1% 0.0%
91 Hungary 0.4915 50.0% 67.6% 36.8% 0.0%
50 Iceland 0.6610 66.7% 79.4% 68.4% 0.0%
27 India 0.7627 76.7% 79.4% 94.7% 14.3%
114 Indonesia 0.3729 38.3% 41.2% 47.4% 0.0%
149 Iran (Islamic Rep. of) 0.2034 21.7% 29.4% 15.8% 0.0%
104 Iraq 0.4237 43.3% 61.8% 26.3% 0.0%
39 Ireland 0.7119 71.7% 88.2% 68.4% 0.0%
17 Israel 0.8305 83.3% 91.2% 89.5% 28.6%
8 Italy 0.9153 91.7% 94.1% 94.7% 71.4%
133 Jamaica 0.2712 28.3% 35.3% 26.3% 0.0%
2 Japan 0.9831 98.3% 100.0% 94.7% 100.0%
98 Jordan 0.4576 46.7% 55.9% 47.4% 0.0%
67 Kazakhstan 0.5932 60.0% 82.4% 42.1% 0.0%
84 Kenya 0.5254 53.3% 70.6% 42.1% 0.0%
138 Kiribati 0.2542 26.7% 35.3% 21.1% 0.0%
55 Kuwait 0.6441 65.0% 82.4% 57.9% 0.0%
Table 12. E-Participation Index (EPI) and its utilisation by stages (continued)

173
E-GOVERNMENT IN SUPPORT OF SUSTAINABLE DEVELOPMENT
Data tab
les
Rank Country EPI Total % Stage 1 % Stage 2% Stage 3%
67 Kyrgyzstan 0.5932 60.0% 58.8% 68.4% 42.9%
133 Lao 0.2712 28.3% 35.3% 26.3% 0.0%
84 Latvia 0.5254 53.3% 58.8% 57.9% 14.3%
91 Lebanon 0.4915 50.0% 70.6% 31.6% 0.0%
167 Lesotho 0.1186 13.3% 17.6% 10.5% 0.0%
127 Liberia 0.2881 30.0% 38.2% 26.3% 0.0%
170 Libya 0.1017 11.7% 17.6% 5.3% 0.0%
60 Liechtenstein 0.6271 63.3% 85.3% 47.4% 0.0%
17 Lithuania 0.8305 83.3% 91.2% 89.5% 28.6%
43 Luxembourg 0.6949 70.0% 82.4% 63.2% 28.6%
149 Madagascar 0.2034 21.7% 26.5% 21.1% 0.0%
127 Malawi 0.2881 30.0% 47.1% 10.5% 0.0%
47 Malaysia 0.6780 68.3% 79.4% 73.7% 0.0%
146 Maldives 0.2203 23.3% 29.4% 21.1% 0.0%
179 Mali 0.0678 8.3% 14.7% 0.0% 0.0%
25 Malta 0.7797 78.3% 61.8% 100.0% 100.0%
184 Marshall Islands 0.0508 6.7% 8.8% 5.3% 0.0%
184 Mauritania 0.0508 6.7% 8.8% 5.3% 0.0%
50 Mauritus 0.6610 66.7% 91.2% 47.4% 0.0%
14 Mexico 0.8814 88.3% 97.1% 94.7% 28.6%
146 Micronesia (Federated States of) 0.2203 23.3% 41.2% 0.0% 0.0%
127 Monaco 0.2881 30.0% 41.2% 21.1% 0.0%
39 Mongolia 0.7119 71.7% 70.6% 89.5% 28.6%
17 Montenegro 0.8305 83.3% 85.3% 84.2% 71.4%
17 Morocco 0.8305 83.3% 85.3% 100.0% 28.6%
149 Mozambique 0.2034 21.7% 23.5% 26.3% 0.0%
170 Myanmar (ex-Birma) 0.1017 11.7% 11.8% 15.8% 0.0%
143 Namibia 0.2373 25.0% 38.2% 10.5% 0.0%
173 Nauru 0.0847 10.0% 14.7% 5.3% 0.0%
89 Nepal 0.5085 51.7% 58.8% 57.9% 0.0%
5 Netherlands 0.9492 95.0% 97.1% 94.7% 85.7%
5 New Zealand 0.9492 95.0% 97.1% 94.7% 85.7%
107 Nicaragua 0.4068 41.7% 52.9% 36.8% 0.0%
173 Niger 0.0847 10.0% 14.7% 5.3% 0.0%
118 Nigeria 0.3559 36.7% 41.2% 42.1% 0.0%
27 Norway 0.7627 76.7% 88.2% 73.7% 28.6%
76 Oman 0.5593 56.7% 73.5% 47.4% 0.0%
114 Pakistan 0.3729 38.3% 52.9% 26.3% 0.0%
186 Palau 0.0339 5.0% 5.9% 5.3% 0.0%
114 Panama 0.3729 38.3% 50.0% 26.3% 14.3%
149 Papau New Guinea 0.2034 21.7% 26.5% 21.1% 0.0%
72 Paraguay 0.5763 58.3% 70.6% 57.9% 0.0%
82 Peru 0.5424 55.0% 73.5% 42.1% 0.0%
67 Philippines 0.5932 60.0% 67.6% 57.9% 28.6%
14 Poland 0.8814 88.3% 91.2% 89.5% 71.4%
Table 12. E-Participation Index (EPI) and its utilisation by stages (continued)

174
DATA TABLES
Data tab
les
Rank Country EPI Total % Stage 1 % Stage 2% Stage 3%
50 Portugal 0.6610 66.7% 85.3% 57.9% 0.0%
55 Qatar 0.6441 65.0% 67.6% 73.7% 28.6%
4 Republic of Korea 0.9661 96.7% 97.1% 100.0% 85.7%
50 Republic of Moldova 0.6610 66.7% 73.5% 73.7% 14.3%
60 Romania 0.6271 63.3% 70.6% 57.9% 42.9%
32 Russia 0.7458 75.0% 91.2% 63.2% 28.6%
91 Rwanda 0.4915 50.0% 67.6% 36.8% 0.0%
133 Saint Kitts and Nevis 0.2712 28.3% 35.3% 26.3% 0.0%
143 Saint Lucia 0.2373 25.0% 29.4% 26.3% 0.0%
133 Saint Vincent and the Grenadines 0.2712 28.3% 26.5% 42.1% 0.0%
126 Samoa 0.3051 31.7% 35.3% 26.3% 28.6%
164 San Marino 0.1356 15.0% 23.5% 5.3% 0.0%
179 São Tomé and Príncipe 0.0678 8.3% 14.7% 0.0% 0.0%
39 Saudi Arabia 0.7119 71.7% 79.4% 73.7% 28.6%
111 Senegal 0.3898 40.0% 52.9% 31.6% 0.0%
17 Serbia 0.8305 83.3% 91.2% 78.9% 57.1%
107 Seychelles 0.4068 41.7% 50.0% 36.8% 14.3%
167 Sierra Leone 0.1186 13.3% 20.6% 5.3% 0.0%
8 Singapore 0.9153 91.7% 94.1% 100.0% 57.1%
82 Slovakia 0.5424 55.0% 76.5% 36.8% 0.0%
37 Slovenia 0.7288 73.3% 94.1% 63.2% 0.0%
146 Solomon Islands 0.2203 23.3% 29.4% 21.1% 0.0%
186 Somalia 0.0339 5.0% 5.9% 5.3% 0.0%
76 South Africa 0.5593 56.7% 61.8% 68.4% 0.0%
170 South Sudan 0.1017 11.7% 17.6% 5.3% 0.0%
7 Spain 0.9322 93.3% 100.0% 94.7% 57.1%
50 Sri Lanka 0.6610 66.7% 79.4% 63.2% 14.3%
138 Sudan 0.2542 26.7% 41.2% 10.5% 0.0%
122 Suriname 0.3390 35.0% 50.0% 21.1% 0.0%
138 Swaziland 0.2542 26.7% 35.3% 21.1% 0.0%
27 Sweden 0.7627 76.7% 97.1% 68.4% 0.0%
72 Switzerland 0.5763 58.3% 70.6% 52.6% 14.3%
98 Syria 0.4576 46.7% 64.7% 31.6% 0.0%
149 Tajikistan 0.2034 21.7% 29.4% 15.8% 0.0%
67 Thailand 0.5932 60.0% 73.5% 57.9% 0.0%
65 The former Yugoslav Republic of Macedonia 0.6102 61.7% 73.5% 63.2% 0.0%
133 Timor-Leste 0.2712 28.3% 41.2% 15.8% 0.0%
111 Togo 0.3898 40.0% 52.9% 31.6% 0.0%
118 Tonga 0.3559 36.7% 50.0% 26.3% 0.0%
101 Trinidad and Tobago 0.4407 45.0% 55.9% 42.1% 0.0%
43 Tunisia 0.6949 70.0% 88.2% 63.2% 0.0%
60 Turkey 0.6271 63.3% 73.5% 68.4% 0.0%
179 Turkmenistan 0.0678 8.3% 14.7% 0.0% 0.0%
191 Tuvalu 0.0000 1.7% 2.9% 0.0% 0.0%
91 Uganda 0.4915 50.0% 73.5% 26.3% 0.0%
Table 12. E-Participation Index (EPI) and its utilisation by stages (continued)

175
E-GOVERNMENT IN SUPPORT OF SUSTAINABLE DEVELOPMENT
Data tab
les
Rank Country EPI Total % Stage 1 % Stage 2% Stage 3%
32 Ukraine 0.7458 75.0% 76.5% 84.2% 42.9%
32 United Arab Emirates 0.7458 75.0% 91.2% 73.7% 0.0%
1 United Kingdom 1.0000 100.0% 100.0% 100.0% 100.0%
67 United Republic of Tanzania 0.5932 60.0% 67.6% 63.2% 14.3%
12 United States 0.8983 90.0% 97.1% 100.0% 28.6%
39 Uruguay 0.7119 71.7% 91.2% 57.9% 14.3%
47 Uzbekistan 0.6780 68.3% 88.2% 57.9% 0.0%
149 Vanuatu 0.2034 21.7% 29.4% 15.8% 0.0%
107 Venezuela 0.4068 41.7% 44.1% 52.6% 0.0%
43 Vietnam 0.6949 70.0% 64.7% 68.4% 100.0%
164 Yemen 0.1356 15.0% 20.6% 10.5% 0.0%
118 Zambia 0.3559 36.7% 52.9% 15.8% 14.3%
127 Zimbabwe 0.2881 30.0% 47.1% 10.5% 0.0%
Global Average 0.4625 47.1% 56.4% 43.1% 12.9%
Table 12. E-Participation Index (EPI) and its utilisation by stages (continued)

176
DATA TABLES
Data tab
les
EPI Total Stage 1 Stage 2 Stage 3
Small island Developing States 0.2868 29.90% 38.30% 23.80% 5.30%
Land Locked Developing Countries 0.3718 38.20% 49.10% 31.40% 4.00%
Least Developed Countries 0.2161 22.90% 31.30% 16.00% 0.90%
High Income 0.6952 70% 79.40% 67.50% 31.70%
Upper Middle Income 0.4440 45.30% 55.60% 41.10% 6.90%
Lower Middle Income 0.3943 40.40% 49.30% 36.80% 7.10%
Low Income 0.2227 23.60% 31.90% 17.10% 0.80%
Africa 0.2599 27.20% 36.20% 20.60% 1.90%
Americas 0.4765 48.50% 58.70% 45.10% 8.20%
Asia 0.5182 52.60% 62.30% 49.90% 13.10%
Europe 0.6985 70.30% 80.10% 67.90% 29.60%
Oceania 0.2966 30.80% 36.80% 25.90% 15.30%
World 0.4625 47.10% 56.40% 43.10% 12.90%
Table 13. Regional and Economic Groupings for E-Participation Index (EPI)

177
E-GOVERNMENT IN SUPPORT OF SUSTAINABLE DEVELOPMENT
Data tab
les
Country TII Percentage of Individuals using the Internet
Fixed-telephone subscriptions per 100 inhabitants
Mobile-cellular telephone subscriptions per 100 inhabitants
Fixed (wired)-broadband subscriptions per 100 inhabitants
Wireless broadband subscriptions per 100 inhabitants
Afghanistan 0.1066 6.39 0.33 74.88 0.00 1.20
Albania 0.3530 60.10 7.76 105.47 6.57 28.20
Algeria 0.1934 18.09 7.75 93.31 4.01 0.00
Andorra 0.6855 95.90 47.71 82.64 35.89 52.30
Angola 0.1441 21.26 1.27 63.48 0.41 12.50
Antigua & Barbuda 0.5412 64.00 35.64 120.02 15.07 48.90
Argentina 0.5031 64.70 22.58 158.74 14.69 19.80
Armenia 0.3922 46.30 18.92 115.92 9.13 31.30
Australia 0.7646 84.56 38.89 131.23 25.76 111.10
Austria 0.7098 81.00 38.31 151.91 27.54 64.50
Azerbaijan 0.4852 61.00 18.87 110.91 19.83 45.10
Bahamas 0.3842 76.92 35.99 71.44 3.61 12.90
Bahrain 0.7762 91.00 21.18 173.27 21.39 119.00
Bangladesh 0.1193 9.60 0.69 75.92 1.19 0.50
Barbados 0.6397 76.67 52.92 106.78 26.97 41.50
Belarus 0.6304 59.02 48.50 122.50 28.84 46.00
Belgium 0.6808 85.00 42.12 114.27 35.99 46.00
Belize 0.1834 38.70 6.68 50.71 2.91 10.20
Benin 0.1471 5.30 1.85 101.71 0.40 0.40
Bhutan 0.2192 34.37 3.11 82.07 3.26 15.60
Bolivia (Plurinational State of)
0.2532 39.02 8.08 96.34 1.59 14.00
Bosnia and Herzegovina
0.4047 60.80 22.20 91.28 14.15 23.90
Botswana 0.4215 18.50 8.30 167.30 1.63 74.30
Brazil 0.5025 57.60 21.84 138.95 11.46 52.00
Brunei Darussalam 0.3512 68.77 11.40 110.06 7.15 6.50
Bulgaria 0.5602 55.49 25.35 137.71 20.74 58.60
Burkina Faso 0.1232 9.40 0.72 71.74 0.03 9.00
Burundi 0.0331 1.38 0.21 30.46 0.02 0.50
Cambodia 0.2486 9.00 2.84 155.11 0.21 10.10
Cameroon 0.1310 11.00 4.61 75.69 0.07 1.70
Canada 0.6717 87.12 46.65 82.98 34.98 57.90
Cape Verde 0.3629 40.26 11.62 121.79 3.79 42.60
Central African Rep. 0.0381 4.03 0.02 31.36 0.01 0.10
Chad 0.0476 2.50 0.18 39.75 0.08 0.00
Chile 0.4970 72.35 19.17 133.26 14.08 35.60
China 0.3673 49.30 17.90 92.27 14.38 21.40
Colombia 0.3813 52.57 14.68 113.08 10.27 25.10
Comoros 0.1073 6.98 3.12 50.90 0.21 14.50
Table 14. Telecommunication Infrastructure Index (TII) and its components

178
DATA TABLES
Data tab
les
Country TII Percentage of Individuals using the Internet
Fixed-telephone subscriptions per 100 inhabitants
Mobile-cellular telephone subscriptions per 100 inhabitants
Fixed (wired)-broadband subscriptions per 100 inhabitants
Wireless broadband subscriptions per 100 inhabitants
Congo 0.1713 7.11 0.36 108.15 0.01 10.50
Costa Rica 0.5129 49.41 17.85 143.83 10.45 72.30
Côte d'Ivoire 0.1711 14.60 1.17 106.25 0.28 1.70
Croatia 0.5974 68.57 36.72 104.43 23.04 66.10
Cuba 0.1103 30.00 11.23 22.48 0.07 0.00
Cyprus 0.4923 69.33 28.44 96.34 21.13 31.80
Czech Republic 0.5952 79.71 17.57 130.03 27.64 54.40
Demo. People's Republic of Korea
0.0363 0.00 4.71 11.19 0.00 11.20
Democratic Republic of Congo
0.0788 3.00 0.00 53.49 0.00 6.70
Denmark 0.8247 95.99 33.32 125.96 41.38 107.50
Djibouti 0.0698 10.71 2.47 32.39 2.27 0.00
Dominica 0.4305 62.86 24.33 127.45 15.76 0.00
Dominican Rep. 0.2992 49.58 11.65 78.86 5.70 25.80
Ecuador 0.3438 43.00 15.28 103.90 7.81 26.70
Egypt 0.3025 31.70 7.57 114.31 3.68 31.10
El Salvador 0.3265 29.70 14.85 144.03 5.00 7.50
Equatorial Guinea 0.1237 18.86 1.94 66.39 0.50 0.00
Eritrea 0.0000 0.99 0.98 6.39 0.00 0.00
Estonia 0.7329 84.24 31.73 160.69 27.37 78.90
Ethiopia 0.0495 2.90 0.85 31.59 0.49 4.90
Fiji 0.3326 41.80 8.43 98.78 1.40 53.50
Finland 0.7590 92.38 11.74 139.66 32.30 123.60
France 0.7502 83.75 60.03 100.36 40.18 55.90
Gabon 0.3068 9.81 1.01 210.37 0.63 0.50
Gambia 0.1959 15.56 2.93 119.63 0.12 1.40
Georgia 0.4184 48.90 25.39 124.94 12.15 17.40
Germany 0.7342 86.19 56.89 120.42 35.78 44.80
Ghana 0.2594 18.90 0.98 114.82 0.27 40.20
Greece 0.6032 63.21 46.90 114.96 28.36 36.10
Grenada 0.3988 37.38 26.90 126.53 17.87 0.80
Guatemala 0.2358 23.40 10.83 106.63 2.41 6.20
Guinea 0.0906 1.72 0.00 72.10 0.01 0.00
Guinea-Bissau 0.0828 3.32 0.29 63.48 0.08 0.00
Guyana 0.2432 37.35 19.87 70.54 5.63 0.10
Haiti 0.1004 11.40 0.39 64.71 0.00 0.20
Honduras 0.2008 19.08 6.45 93.52 1.39 11.70
Hungary 0.5615 76.13 30.32 118.05 27.35 27.50
Iceland 0.7814 98.16 51.49 111.08 35.92 74.70
India 0.1430 18.00 2.13 74.48 1.24 3.20
Indonesia 0.3016 17.14 11.72 126.18 1.19 36.00
Iran (Islamic Republic of)
0.3514 39.35 38.98 87.79 9.46 2.50
Table 14. Telecommunication Infrastructure Index (TII) and its components (continued)

179
E-GOVERNMENT IN SUPPORT OF SUSTAINABLE DEVELOPMENT
Data tab
les
Country TII Percentage of Individuals using the Internet
Fixed-telephone subscriptions per 100 inhabitants
Mobile-cellular telephone subscriptions per 100 inhabitants
Fixed (wired)-broadband subscriptions per 100 inhabitants
Wireless broadband subscriptions per 100 inhabitants
Iraq 0.1647 11.30 5.60 94.91 0.01 3.60
Ireland 0.6602 79.69 43.24 104.26 26.91 68.60
Israel 0.6175 71.45 37.07 121.45 26.18 52.50
Italy 0.6469 61.96 33.68 154.25 23.53 65.90
Jamaica 0.3193 40.50 9.06 102.92 5.41 33.10
Japan 0.8277 90.58 50.09 120.23 29.31 120.50
Jordan 0.3458 44.00 5.00 147.80 4.66 17.80
Kazakhstan 0.5668 54.89 26.12 168.62 12.93 56.60
Kenya 0.1808 43.40 0.40 73.84 0.19 3.10
Kiribati 0.0665 12.25 8.85 17.41 1.15 0.00
Kuwait 0.7430 78.70 14.20 218.43 1.38 139.80
Kyrgyzstan 0.3123 28.30 7.88 134.46 4.16 22.70
Lao People's Dem. Rep.
0.1537 14.26 13.36 66.99 0.16 2.40
Latvia 0.5831 75.83 18.96 124.20 24.74 61.20
Lebanon 0.4911 74.70 19.45 88.35 22.80 43.00
Lesotho 0.1787 11.00 2.44 101.90 0.11 11.50
Liberia 0.1041 5.41 0.23 73.35 0.14 1.90
Libya 0.4291 17.76 11.30 161.12 1.00 80.60
Liechtenstein 0.7293 95.21 48.39 104.32 40.33 48.40
Lithuania 0.6262 72.13 19.50 147.04 31.46 53.80
Luxembourg 0.8190 94.67 49.63 148.37 33.27 80.00
Madagascar 0.0514 3.70 1.06 38.22 0.11 0.50
Malawi 0.0485 5.83 0.38 30.50 0.05 3.90
Malaysia 0.4397 67.50 14.61 148.83 10.14 14.10
Maldives 0.4370 49.28 6.11 189.38 5.64 26.20
Mali 0.2149 7.00 1.00 149.02 0.02 1.80
Malta 0.6992 73.17 53.55 126.98 35.23 41.20
Marshall Islands 0.0849 16.80 4.47 29.37 2.60 0.00
Mauritania 0.1536 10.70 1.29 94.20 0.20 5.60
Mauritius 0.4596 41.44 29.80 132.25 14.57 29.20
Mexico 0.3114 44.39 17.04 82.54 11.56 11.50
Micronesia 0.1197 29.65 6.76 30.32 2.98 0.00
Monaco 1.0000 92.40 132.95 88.46 46.76 53.70
Mongolia 0.2841 27.00 7.92 105.06 6.85 24.70
Montenegro 0.5221 61.00 26.49 163.03 15.20 23.10
Morocco 0.3429 56.80 7.43 131.71 2.96 15.00
Mozambique 0.0993 5.94 0.26 69.67 0.05 1.70
Myanmar 0.0655 2.10 0.98 49.47 0.27 1.00
Namibia 0.2669 14.84 7.78 113.76 1.76 34.20
Nauru 0.2448 54.00 0.00 67.78 9.48 9.97
Nepal 0.1675 15.44 2.98 82.49 0.81 13.00
Netherlands 0.7517 93.17 42.41 116.42 41.02 62.30
New Zealand 0.7136 85.50 40.65 112.05 30.45 81.90
Table 14. Telecommunication Infrastructure Index (TII) and its components (continued)
180
DATA TABLES
Data tab
les
Country TII Percentage of Individuals using the Internet
Fixed-telephone subscriptions per 100 inhabitants
Mobile-cellular telephone subscriptions per 100 inhabitants
Fixed (wired)-broadband subscriptions per 100 inhabitants
Wireless broadband subscriptions per 100 inhabitants
Nicaragua 0.2109 17.60 5.51 114.57 2.48 1.30
Niger 0.0557 1.95 0.57 44.44 0.05 0.90
Nigeria 0.1958 42.68 0.10 77.84 0.01 10.10
Norway 0.7276 96.30 22.72 116.51 38.14 86.50
Oman 0.5147 70.22 9.56 157.75 4.51 68.90
Pakistan 0.1299 13.80 2.65 73.33 1.08 0.80
Palau 0.3684 26.97 33.89 90.60 9.36 32.31
Panama 0.4202 44.92 14.99 158.05 7.90 25.20
Papua New Guinea 0.0739 9.38 1.94 44.93 0.18 0,00
Paraguay 0.2544 43.00 5.38 105.60 2.45 5.60
Peru 0.2689 40.20 9.86 102.92 5.74 3.00
Philippines 0.3791 39.69 3.09 111.22 23.22 27.20
Poland 0.5857 66.60 13.18 156.45 23.83 59.50
Portugal 0.5838 64.59 43.25 111.80 26.68 36.70
Qatar 0.6041 91.49 18.41 145.76 9.90 76.80
Republic of Korea 0.8530 84.33 59.54 115.54 38.78 105.30
Republic of Moldova 0.4850 46.60 35.20 108.00 14.71 47.30
Romania 0.4533 54.08 21.26 105.91 18.52 37.70
Russian Federatian 0.6091 70.52 27.67 155.14 17.45 60.20
Rwanda 0.1084 10.60 0.41 64.02 0.11 5.80
Saint Kitts and Nevis 0.5301 65.40 34.86 139.81 23.73 5.50
Saint Lucia 0.4094 51.00 17.88 102.59 15.36 32.70
Saint Vincent and the Grenadines
0.3756 56.48 21.85 105.16 14.92 0.00
Samoa 0.1576 21.20 6.14 55.53 1.05 16.40
San Marino 0.6128 49.60 58.79 118.85 36.98 11.20
Sao Tomé & Principe 0.1547 24.41 3.44 64.94 0.56 9.80
Saudi Arabia 0.5733 63.70 13.36 179.56 10.36 70.60
Senegal 0.1958 17.70 2.14 98.84 0.71 15.30
Serbia 0.5434 53.50 37.33 122.13 15.57 55.70
Seychelles 0.4624 54.26 22.73 162.19 12.68 10.30
Sierra Leone 0.1216 2.10 0.27 76.66 0.00 13.00
Singapore 0.8414 82.00 35.52 158.13 27.79 136.60
Slovakia 0.5504 79.98 16.84 116.94 21.84 54.90
Slovenia 0.5877 71.59 37.08 112.08 26.55 42.10
Solomon Islands 0.1150 9.00 1.31 65.76 0.23 8.00
Somalia 0.0665 1.63 0.53 50.90 0.56 1.00
South Africa 0.3807 49.00 8.10 149.68 3.21 28.70
South Sudan 0.0534 15.90 0.00 24.50 0.00 1.30
Spain 0.6493 76.19 40.56 107.85 27.27 67.20
Sri Lanka 0.2445 25.80 12.49 103.16 2.65 7.80
Table 14. Telecommunication Infrastructure Index (TII) and its components (continued)

181
E-GOVERNMENT IN SUPPORT OF SUSTAINABLE DEVELOPMENT
Data tab
les
Country TII Percentage of Individuals using the Internet
Fixed-telephone subscriptions per 100 inhabitants
Mobile-cellular telephone subscriptions per 100 inhabitants
Fixed (wired)-broadband subscriptions per 100 inhabitants
Wireless broadband subscriptions per 100 inhabitants
Sudan 0.1861 24.64 1.08 72.20 0.05 26.80
Suriname 0.4116 40.08 15.61 170.57 8.53 13.10
Swaziland 0.1601 27.10 3.50 72.32 0.40 4.40
Sweden 0.8134 92.52 39.67 127.84 34.19 110.30
Switzerland 0.7980 87.00 53.63 140.54 45.97 44.30
Syrian Arab Republic 0.2087 28.09 18.13 70.95 1.68 3.20
Tajikistan 0.1866 17.49 5.24 95.13 0.07 9.50
Thailand 0.4117 34.89 8.46 144.44 8.21 52.50
The Former Yugoslav Republic of Macedonia
0.4693 68.06 18.62 109.10 16.19 39.40
Timor-Leste 0.0728 1.14 0.26 58.74 0.07 0.60
Togo 0.1044 5.70 0.90 68.97 0.11 4.10
Tonga 0.2302 40.00 11.34 64.28 1.70 19.30
Trinidad & Tobago 0.4973 65.10 21.43 147.34 17.47 20.20
Tunisia 0.3476 46.16 8.54 128.49 4.44 26.10
Turkey 0.3775 51.04 16.52 94.79 11.69 32.30
Turkmenistan 0.2559 12.20 11.77 135.78 0.04 10.90
Tuvalu 0.1981 37.00 15.16 38.41 9.10 0.00
Uganda 0.1129 17.71 0.84 52.43 0.29 8.60
Ukraine 0.3968 43.40 24.64 144.08 8.42 6.70
United Arab Emirates 0.6881 90.40 22.26 178.06 11.51 89.10
United Kingdom of Great Britain and Northern Island
0.8177 91.61 52.35 123.58 37.38 87.20
United Republic of Tanzania
0.0900 4.86 0.30 62.77 0.17 2.70
United States of America
0.7170 87.36 40.12 98.41 30.37 93.60
Uruguay 0.6137 61.46 31.68 160.80 24.58 43.50
Uzbekistan 0.2463 43.55 8.55 73.79 1.33 22.80
Vanuatu 0.1684 18.80 2.22 60.41 1.77 26.20
Venezuela (Bolivarian Republic of)
0.3540 57.00 25.31 98.95 7.82 3.80
Viet Nam 0.3715 48.31 6.01 147.11 6.48 21.80
Yemen 0.1465 22.55 4.68 68.49 1.36 0.30
Zambia 0.1182 17.34 0.76 67.34 0.14 0.70
Zimbabwe 0.2167 19.89 2.26 80.82 1.04 37.80
Note: Last accessed in September 2015
Source: International Telecommunications Union (ITU). Year: 2014 or most recent data available." * 2012** 0108*** 2008**** 2007***** 2005"
Table 14. Telecommunication Infrastructure Index (TII) and its components (continued)
182
DATA TABLES
Data tab
les
TII average TII Percentage of Individuals using the Internet
Fixed-telephone subscriptions per 100 inhabitants
Mobile-cellular telephone subscriptions per 100 inhabitants
Fixed(wired)-broadban subscriptions per 100 inhabitants
Wireless broadband subscriptions per 100 inhabitants
Africa 0.1724 16.40 3.33 83.99 1.20 12.02
Americas 0.3844 49.64 19.84 109.86 11.03 21.75
Asia 0.3730 42.95 14.35 114.03 8.68 34.63
Europe 0.6438 75.28 37.68 122.92 28.31 55.68
Oceania 0.2599 34.78 12.86 64.78 6.94 27.59
World 0.3711 43.34 17.35 103.28 11.26 30.16
Small island Developing States
0.3103 39.85 15.29 90.70 8.07 21.61
Land Locked Developing Countries
0.2131 22.84 6.71 85.14 3.06 16.49
Least Developed Countries
0.1145 10.53 1.91 64.60 0.58 5.13
High Income 0.6607 78.77 36.51 126.97 26.78 64.02
Upper Middle Income 0.3734 44.54 16.42 115.59 9.63 25.99
Lower Middle Income 0.2292 27.21 8.32 89.71 3.34 14.03
Low Income 0.1062 7.98 1.08 65.27 0.19 5.08
Table 14. Telecommunication Infrastructure Index (TII) and its components (continued)

183
E-GOVERNMENT IN SUPPORT OF SUSTAINABLE DEVELOPMENT
Data tab
les
Co
un
try
HC
IA
du
lt L
iter
acy
(%
)G
ross
en
rolm
ent
rati
o (
%)
Exp
ecte
d y
ears
of
sch
oo
ling
Mea
n y
ears
of
sch
oo
ling
Ind
ex
valu
eY
ear
Sou
rce
Ind
ex
valu
eY
ear
Sou
rce
Ind
ex
valu
eY
ear
Sou
rce
Ind
ex
valu
eY
ear
Sou
rce
Afg
hani
stan
0.28
3038
.16
2015
UN
ESC
O62
.38
2011
UN
ESC
O9.
2720
11U
NES
CO
3.20
2012
UN
DP
Alb
ania
0.
6520
97.6
220
15U
NES
CO
65.5
820
03U
NES
CO
10.8
320
03U
NES
CO
9.26
2011
UN
ESC
O
Alg
eria
0.
6412
80.2
020
15U
NES
CO
79.1
920
11U
NES
CO
13.9
720
11U
NES
CO
7.60
2012
UN
DP
And
orra
0.
6978
99.0
020
14U
NES
CO
69.0
020
14U
NES
CO
11.6
720
12U
ND
P(H
DI)
10.4
020
12U
ND
P
Ang
ola
0.50
1571
.14
2015
UN
ESC
O73
.02
2011
UN
ESC
O11
.32
2011
UN
ESC
O4.
7020
12U
ND
P
Ant
igua
and
Bar
buda
0.
7453
98.9
520
12U
NES
CO
82.0
320
12U
NES
CO
13.9
520
12U
NES
CO
8.90
2012
UN
DP
Arg
entin
a 0.
8802
98.0
920
15U
NES
CO
104.
9320
12U
NES
CO
17.9
520
12U
NES
CO
9.79
2003
UN
ESC
O
Arm
enia
0.
7338
99.6
520
15U
NES
CO
78.2
220
09U
NES
CO
12.3
220
09U
NES
CO
10.2
720
01U
NES
CO
Aus
tral
ia
1.00
0099
.00
2014
UN
ESC
O11
5.19
2013
UN
ESC
O20
.25
2013
UN
ESC
O13
.18
2012
UN
ESC
O
Aus
tria
0.83
9699
.00
2014
UN
ESC
O94
.61
2013
UN
ESC
O15
.90
2013
UN
ESC
O10
.80
2012
UN
DP
Aze
rbai
jan
0.71
5899
.82
2015
UN
ESC
O71
.11
2012
UN
ESC
O11
.80
2012
UN
DP
(HD
I)10
.85
2009
UN
ESC
O
Baha
mas
0.
7207
95.8
020
14U
NES
CO
74.0
020
14U
NES
CO
12.5
720
12U
ND
P(H
DI)
10.9
420
00U
NES
CO
Bahr
ain
0.71
7895
.70
2015
UN
ESC
O78
.62
2009
UN
ESC
O13
.13
1999
UN
ESC
O9.
4020
12U
ND
P
Bang
lade
sh
0.39
7361
.55
2015
UN
ESC
O59
.39
2011
UN
ESC
O9.
9819
99U
NES
CO
4.25
2001
UN
ESC
O
Barb
ados
0.
8113
99.7
020
14U
NES
CO
96.1
320
11U
NES
CO
15.4
219
99U
NES
CO
8.99
2000
UN
ESC
O
Bela
rus
0.87
1699
.73
2015
UN
ESC
O10
0.09
2013
UN
ESC
O15
.66
2013
UN
ESC
O11
.94
2009
UN
ESC
O
Belg
ium
0.
9712
99.0
020
14U
NES
CO
117.
9420
13U
NES
CO
19.8
020
13U
NES
CO
11.2
720
12U
NES
CO
Beliz
e 0.
6454
70.3
019
91U
NES
CO
81.4
620
13U
NES
CO
13.5
520
13U
NES
CO
10.4
920
10U
NES
CO
Beni
n 0.
3196
38.4
520
15U
NES
CO
67.8
420
11U
NES
CO
11.0
720
11U
NES
CO
2.73
2002
UN
ESC
O
Bhut
an
0.51
3964
.89
2015
UN
ESC
O68
.78
2013
UN
ESC
O12
.62
2013
UN
ESC
O6.
6020
05U
NES
CO
Boliv
ia (P
lurin
atio
nal
Stat
e of
)0.
7004
95.6
520
15U
NES
CO
79.2
520
07U
NES
CO
13.1
520
07U
NES
CO
8.15
2012
UN
ESC
O
Bosn
ia a
nd
Her
zego
vina
0.
6815
98.4
820
15U
NES
CO
71.0
020
14U
NES
CO
13.6
020
12U
ND
P(H
DI)
7.21
2011
UN
ESC
O
Bots
wan
a 0.
6553
88.4
620
15U
NES
CO
73.5
820
08U
NES
CO
12.4
920
08U
NES
CO
8.80
2012
UN
DP
Tab
le 1
5.
Hu
man
Cap
ital
Ind
ex (
HC
I) a
nd
its
com
po
nen
ts

184
DATA TABLES
Data tab
les
Co
un
try
HC
IA
du
lt L
iter
acy
(%
)G
ross
en
rolm
ent
rati
o (
%)
Exp
ecte
d y
ears
of
sch
oo
ling
Mea
n y
ears
of
sch
oo
ling
Ind
ex
valu
eY
ear
Sou
rce
Ind
ex
valu
eY
ear
Sou
rce
Ind
ex
valu
eY
ear
Sou
rce
Ind
ex
valu
eY
ear
Sou
rce
Braz
il 0.
6787
92.5
820
15U
NES
CO
71.0
020
14U
NES
CO
15.1
920
12U
ND
P (H
DI)
6.99
2011
UN
ESC
O
Brun
ei D
arus
sala
m
0.73
1095
.98
2015
UN
ESC
O80
.10
2013
UN
ESC
O14
.35
2013
UN
ESC
O8.
7020
12U
ND
P
Bulg
aria
0.
7875
98.3
920
15U
NES
CO
87.6
520
13U
NES
CO
14.8
020
13U
NES
CO
9.92
2001
UN
ESC
O
Burk
ina
Faso
0.
1677
36.0
220
15U
NES
CO
46.9
020
13U
NES
CO
7.77
2013
UN
ESC
O0.
5620
07U
NES
CO
Buru
ndi
0.49
7985
.62
2015
UN
ESC
O63
.84
2013
UN
ESC
O10
.90
2013
UN
ESC
O2.
7020
12U
ND
P
Cam
bodi
a 0.
4785
77.1
920
15U
NES
CO
63.8
120
08U
NES
CO
10.9
020
08U
NES
CO
3.67
2009
UN
ESC
O
Cam
eroo
n 0.
4794
74.9
920
15U
NES
CO
61.5
620
11U
NES
CO
10.4
020
11U
NES
CO
5.21
2010
UN
ESC
O
Can
ada
0.85
7299
.00
2014
UN
ESC
O93
.04
2000
UN
ESC
O15
.81
2000
UN
ESC
O12
.30
2012
UN
DP
Cap
e Ve
rde
0.60
3187
.58
2015
UN
ESC
O78
.73
2013
UN
ESC
O13
.74
2013
UN
ESC
O3.
5020
12U
ND
P
Cen
tral
Afr
ican
Re
publ
ic
0.19
8536
.75
2015
UN
ESC
O43
.42
2012
UN
ESC
O7.
2420
12U
NES
CO
3.50
2012
UN
DP
Cha
d 0.
1917
40.1
720
15U
NES
CO
46.8
020
11U
NES
CO
7.40
2011
UN
ESC
O1.
4020
04U
NES
CO
Chi
le
0.81
2497
.51
2015
UN
ESC
O92
.57
2013
UN
ESC
O15
.91
2013
UN
ESC
O9.
7920
10U
NES
CO
Chi
na
0.68
6096
.38
2015
UN
ESC
O77
.25
2013
UN
ESC
O13
.24
2013
UN
ESC
O7.
3120
10U
NES
CO
Col
ombi
a 0.
7000
94.6
820
15U
NES
CO
84.4
920
10U
NES
CO
13.5
520
10U
NES
CO
7.07
2010
UN
ESC
O
Com
oros
0.
4885
77.7
620
15U
NES
CO
68.1
320
13U
NES
CO
11.5
020
13U
NES
CO
2.80
2012
UN
DP
Con
go
0.53
4479
.31
2015
UN
ESC
O66
.15
2012
UN
ESC
O11
.11
2012
UN
ESC
O6.
1020
12U
ND
P
Cos
ta R
ica
0.74
3697
.76
2015
UN
ESC
O86
.69
2013
UN
ESC
O13
.86
2013
UN
ESC
O8.
3720
12U
NES
CO
Côt
e d'
Ivoi
re0.
2959
43.1
120
15U
NES
CO
54.2
220
13U
NES
CO
9.15
2013
UN
ESC
O4.
3020
12U
ND
P
Cro
atia
0.
8050
99.2
720
15U
NES
CO
86.4
720
12U
NES
CO
14.8
120
12U
NES
CO
11.0
320
11U
NES
CO
Cub
a 0.
7507
99.8
520
15U
NES
CO
80.2
620
13U
NES
CO
13.8
320
13U
NES
CO
9.45
2002
UN
ESC
O
Cyp
rus
0.77
8299
.07
2015
UN
ESC
O78
.42
2011
UN
ESC
O13
.97
2012
UN
ESC
O11
.62
2012
UN
ESC
O
Cze
ch R
epub
lic
0.86
2799
.00
2014
UN
ESC
O91
.32
2013
UN
ESC
O16
.52
2013
UN
ESC
O12
.26
2012
UN
ESC
O
Dem
ocra
tic P
eopl
e's
Repu
blic
of
Kor
ea
0.78
2210
0.00
2015
UN
ESC
O10
0.00
2014
UN
ESC
O11
.00
2014
UN
ESC
O10
.76
2012
UN
DP
Dem
ocra
tic R
epub
lic
of t
he C
ongo
0.
3970
63.8
220
15U
NES
CO
63.6
920
13U
NES
CO
9.75
2013
UN
ESC
O3.
1020
12U
ND
P
Den
mar
k 0.
9530
99.0
020
14U
NES
CO
106.
2620
13U
NES
CO
19.2
420
13U
NES
CO
12.7
320
08U
NES
CO
Djib
outi
0.30
9570
.30
2014
UN
ESC
O37
.11
2011
UN
ESC
O6.
3920
11U
NES
CO
3.80
2012
UN
DP
Tab
le 1
5.
Hu
man
Cap
ital
Ind
ex (
HC
I) a
nd
its
com
po
nen
ts (
con
tin
ued
)

185
E-GOVERNMENT IN SUPPORT OF SUSTAINABLE DEVELOPMENT
Data tab
les
Co
un
try
HC
IA
du
lt L
iter
acy
(%
)G
ross
en
rolm
ent
rati
o (
%)
Exp
ecte
d y
ears
of
sch
oo
ling
Mea
n y
ears
of
sch
oo
ling
Ind
ex
valu
eY
ear
Sou
rce
Ind
ex
valu
eY
ear
Sou
rce
Ind
ex
valu
eY
ear
Sou
rce
Ind
ex
valu
eY
ear
Sou
rce
Dom
inic
a 0.
6384
88.0
020
14U
NES
CO
73.0
020
14U
NES
CO
12.6
520
12U
ND
P (H
DI)
7.78
2001
UN
ESC
O
Dom
inic
an R
epub
lic
0.66
7691
.79
2015
UN
ESC
O77
.39
2012
UN
ESC
O13
.08
2012
UN
ESC
O7.
4620
12U
NES
CO
Ecua
dor
0.71
3494
.46
2015
UN
ESC
O83
.73
2012
UN
ESC
O14
.17
2012
UN
ESC
O7.
5020
10U
NES
CO
Egyp
t 0.
6048
73.7
520
15U
NES
CO
82.5
820
13U
NES
CO
13.9
120
13U
NES
CO
6.40
UN
DP
El S
alva
dor
0.60
3587
.99
2015
UN
ESC
O70
.03
2013
UN
ESC
O12
.19
2013
UN
ESC
O6.
5120
12U
NES
CO
Equa
toria
l Gui
nea
0.51
7495
.26
2015
UN
ESC
O55
.00
2014
UN
ESC
O8.
4820
00U
NES
CO
5.40
2012
UN
DP
Eritr
ea
0.24
8773
.77
2015
UN
ESC
O25
.0U
ND
P4.
1020
12U
ND
P (H
DI)
3.40
2012
UN
DP
Esto
nia
0.87
6199
.83
2015
UN
ESC
O97
.72
2013
UN
ESC
O16
.32
2013
UN
ESC
O11
.97
2000
UN
ESC
O
Ethi
opia
0.
2212
49.0
920
15U
NES
CO
43.0
720
05U
NES
CO
6.60
2005
UN
ESC
O2.
4120
11U
NES
CO
Fiji
0.75
0994
.40
2014
UN
ESC
O88
.0U
ND
P13
.88
2004
UN
ESC
O9.
4720
07U
NES
CO
Finl
and
0.94
4099
.00
2014
UN
ESC
O11
5.32
2013
UN
ESC
O19
.48
2013
UN
ESC
O10
.30
2012
UN
DP
Fran
ce0.
8445
99.0
020
14U
NES
CO
94.1
220
13U
NES
CO
15.9
720
13U
NES
CO
11.1
320
12U
NES
CO
Gab
on
0.61
6283
.18
2015
UN
ESC
O76
.15
2001
UN
ESC
O12
.30
2012
UN
DP
(HD
I)7.
4020
12U
ND
P
Gam
bia
0.32
7455
.55
2015
UN
ESC
O55
.94
2010
UN
ESC
O9.
1020
12U
ND
P (H
DI)
2.80
2012
UN
DP
Geo
rgia
0.
7763
99.7
620
15U
NES
CO
76.1
120
13U
NES
CO
13.8
020
13U
NES
CO
11.8
920
02U
NES
CO
Ger
man
y 0.
8882
99.0
020
14U
NES
CO
93.6
220
13U
NES
CO
16.6
720
13U
NES
CO
13.3
520
12U
NES
CO
Gha
na
0.54
5876
.57
2015
UN
ESC
O67
.47
2013
UN
ESC
O11
.72
2013
UN
ESC
O6.
7220
10U
NES
CO
Gre
ece
0.89
0197
.69
2015
UN
ESC
O10
8.84
2012
UN
ESC
O17
.63
2012
UN
ESC
O10
.16
2010
UN
ESC
O
Gre
nada
0.
7820
96.0
020
05U
ND
P91
.05
2009
UN
ESC
O15
.80
2009
UN
ESC
O8.
6020
12U
ND
P
Gua
tem
ala
0.53
4581
.55
2015
UN
ESC
O68
.61
2013
UN
ESC
O10
.59
2013
UN
ESC
O5.
6020
12U
NES
CO
Gui
nea
0.19
0330
.41
2015
UN
ESC
O52
.36
2012
UN
ESC
O8.
7020
12U
NES
CO
1.60
2012
UN
DP
Gui
nea-
Biss
au
0.35
3859
.91
2015
UN
ESC
O62
.46
2006
UN
ESC
O9.
0020
122.
3020
12U
ND
P
Guy
ana
0.56
9488
.50
2015
UN
ESC
O68
.11
2012
UN
ESC
O10
.29
2012
UN
ESC
O6.
4120
02U
NES
CO
Hai
ti 0.
3124
60.7
320
15U
NES
CO
39.4
020
14U
NES
CO
7.60
2012
UN
DP
(HD
I)4.
9020
12U
ND
P
Tab
le 1
5.
Hu
man
Cap
ital
Ind
ex (
HC
I) a
nd
its
com
po
nen
ts (
con
tin
ued
)

186
DATA TABLES
Data tab
les
Co
un
try
HC
IA
du
lt L
iter
acy
(%
)G
ross
en
rolm
ent
rati
o (
%)
Exp
ecte
d y
ears
of
sch
oo
ling
Mea
n y
ears
of
sch
oo
ling
Ind
ex
valu
eY
ear
Sou
rce
Ind
ex
valu
eY
ear
Sou
rce
Ind
ex
valu
eY
ear
Sou
rce
Ind
ex
valu
eY
ear
Sou
rce
Hon
dura
s 0.
5709
88.4
820
15U
NES
CO
69.3
320
13U
NES
CO
11.1
020
13U
NES
CO
5.48
2012
UN
ESC
O
Hun
gary
0.
8317
99.0
520
15U
NES
CO
92.6
420
13U
NES
CO
15.7
620
13U
NES
CO
10.7
620
05U
NES
CO
Icel
and
0.89
4099
.00
2014
UN
ESC
O99
.38
2012
UN
ESC
O18
.98
2012
UN
ESC
O10
.40
2012
UN
DP
Indi
a 0.
5019
71.2
420
15U
NES
CO
71.2
020
12U
NES
CO
11.9
420
12U
NES
CO
4.40
2012
UN
DP
Indo
nesi
a 0.
6796
93.8
820
15U
NES
CO
78.8
720
12U
NES
CO
12.9
920
12U
NES
CO
7.51
2011
UN
ESC
O
Iran
(Isla
mic
Rep
ublic
of
) 0.
7101
86.8
520
15U
NES
CO
86.9
620
12U
NES
CO
15.0
920
12U
NES
CO
7.80
2012
UN
DP
Iraq
0.48
0379
.69
2015
UN
ESC
O54
.48
2000
UN
ESC
O10
.08
2004
UN
ESC
O5.
6020
12U
ND
P
Irela
nd
0.92
1899
.00
2014
UN
ESC
O10
5.04
2012
UN
ESC
O18
.57
2012
UN
ESC
O11
.60
2012
UN
DP
Isra
el
0.86
1997
.76
2011
UN
ESC
O94
.21
2013
UN
ESC
O15
.99
2013
UN
ESC
O12
.54
2012
UN
ESC
O
Italy
0.
8126
99.1
520
15U
NES
CO
88.5
920
12U
NES
CO
16.0
420
12U
NES
CO
9.94
2012
UN
ESC
O
Jam
aica
0.
6859
88.6
920
15U
NES
CO
79.8
620
04U
NES
CO
12.4
920
04U
NES
CO
9.60
2012
UN
DP
Japa
n 0.
8274
99.0
020
14U
NES
CO
89.4
520
12U
NES
CO
15.3
320
12U
NES
CO
11.5
020
12U
ND
P
Jord
an
0.73
4495
.37
2015
UN
ESC
O80
.17
2012
UN
ESC
O13
.51
2012
UN
ESC
O9.
9120
10U
NES
CO
Kaz
akhs
tan
0.84
0199
.79
2015
UN
ESC
O92
.17
2013
UN
ESC
O14
.94
2013
UN
ESC
O12
.02
2007
UN
ESC
O
Ken
ya
0.51
6977
.97
2015
UN
ESC
O66
.78
2009
UN
ESC
O10
.98
2009
UN
ESC
O5.
3320
10U
NES
CO
Kiri
bati
0.65
9993
.00
2014
UN
E-G
ov
Surv
ey75
.14
2008
UN
ESC
O12
.32
2008
UN
ESC
O7.
8020
12U
ND
P
Kuw
ait
0.72
8796
.27
2015
UN
ESC
O85
.65
2004
UN
ESC
O14
.64
2004
UN
ESC
O7.
2120
12U
NES
CO
Kyr
gyzs
tan
0.75
0899
.52
2015
UN
ESC
O79
.14
2013
UN
ESC
O13
.05
2013
UN
ESC
O10
.51
2009
UN
ESC
O
Lao
Peop
le's
D
emoc
ratic
Rep
ublic
0.
4907
79.8
620
15U
NES
CO
60.8
720
13U
NES
CO
10.5
820
13U
NES
CO
4.60
2012
UN
DP
Latv
ia
0.85
1299
.89
2015
UN
ESC
O90
.56
2013
UN
ESC
O15
.58
2013
UN
ESC
O12
.35
2006
UN
ESC
O
Leba
non
0.68
8293
.94
2015
UN
ESC
O77
.12
2013
UN
ESC
O13
.75
2013
UN
ESC
O7.
5920
07U
NES
CO
Leso
tho
0.51
4779
.36
2015
UN
ESC
O65
.12
2012
UN
ESC
O10
.69
2006
UN
ESC
O5.
4120
08U
NES
CO
Libe
ria
0.35
8147
.60
2015
UN
ESC
O63
.92
2000
UN
ESC
O10
.67
2000
UN
ESC
O3.
9020
12U
ND
P
Liby
a0.
7588
91.0
220
15U
NES
CO
94.3
820
03U
NES
CO
16.1
220
03U
NES
CO
7.50
2012
UN
DP
Liec
hten
stei
n0.
7978
99.0
020
14U
N E
-Gov
Su
rvey
87.1
320
12U
NES
CO
15.0
320
12U
NES
CO
10.3
020
12U
ND
P
Lith
uani
a 0.
8717
99.8
220
15U
NES
CO
94.4
120
13U
NES
CO
16.2
120
13U
NES
CO
12.3
820
12U
NES
CO
Tab
le 1
5.
Hu
man
Cap
ital
Ind
ex (
HC
I) a
nd
its
com
po
nen
ts (
con
tin
ued
)

187
E-GOVERNMENT IN SUPPORT OF SUSTAINABLE DEVELOPMENT
Data tab
les
Co
un
try
HC
IA
du
lt L
iter
acy
(%
)G
ross
en
rolm
ent
rati
o (
%)
Exp
ecte
d y
ears
of
sch
oo
ling
Mea
n y
ears
of
sch
oo
ling
Ind
ex
valu
eY
ear
Sou
rce
Ind
ex
valu
eY
ear
Sou
rce
Ind
ex
valu
eY
ear
Sou
rce
Ind
ex
valu
eY
ear
Sou
rce
Luxe
mbo
urg
0.77
5099
.00
2014
UN
ESC
O77
.48
2012
UN
ESC
O13
.85
2012
UN
ESC
O11
.71
2007
UN
ESC
O
Mad
agas
car
0.44
8864
.66
2015
UN
ESC
O65
.86
2013
UN
ESC
O10
.39
2013
UN
ESC
O5.
2020
12U
ND
P
Mal
awi
0.45
3565
.79
2015
UN
ESC
O69
.45
2011
UN
ESC
O10
.75
2011
UN
ESC
O4.
2020
12U
ND
P
Mal
aysi
a0.
6953
94.6
420
15U
NES
CO
71.0
820
05U
NES
CO
12.7
320
05U
NES
CO
9.96
2010
UN
ESC
O
Mal
dive
s0.
6301
99.3
120
15U
NES
CO
76.7
620
03U
NES
CO
12.6
620
03U
NES
CO
3.58
2006
UN
ESC
O
Mal
i 0.
2358
38.7
020
15U
NES
CO
55.6
620
11U
NES
CO
8.43
2011
UN
ESC
O2.
0420
11U
NES
CO
Mal
ta
0.73
1094
.44
2015
UN
ESC
O76
.75
2012
UN
ESC
O14
.16
2012
UN
ESC
O9.
8920
12U
NES
CO
Mar
shal
l Isl
ands
0.
6947
94.0
020
14U
N E
-Gov
Su
rvey
74.6
220
02U
NES
CO
12.3
520
02U
NES
CO
9,85
2011
HD
I W
B=IID
Mau
ritan
ia
0.30
1552
.10
2015
UN
ESC
O49
.91
2013
UN
ESC
O8.
5020
13U
NES
CO
3.70
2012
UN
DP
Mau
ritiu
s 0.
7067
90.6
220
15U
NES
CO
85.8
220
12U
NES
CO
15.5
820
12U
NES
CO
6.30
2000
UN
ESC
O
Mex
ico
0.69
9395
.14
2015
UN
ESC
O77
.62
2013
UN
ESC
O13
.19
2013
UN
ESC
O8.
4720
12U
NES
CO
Mic
rone
sia
(Fed
erat
ed S
tate
s of
) 0.
6663
94.0
020
14U
NES
CO
75.4
320
04U
NES
CO
11.4
120
12U
ND
P(H
DI)
8.80
2012
UN
DP
Mon
aco
0.87
5799
.00
2014
UN
E-G
ov
Surv
ey99
.00
2014
UN
DP
HD
I17
.50
2011
UN
DP
(HD
I)10
.76
2012
UN
DP
Mon
golia
0.
7597
98.3
820
15U
NES
CO
79.4
020
06U
NES
CO
14.5
920
10U
NES
CO
9.80
2010
UN
ESC
O
Mon
tene
gro
0.81
6598
.73
2015
UN
ESC
O88
.62
2010
UN
ESC
O15
.18
2010
UN
ESC
O11
.16
2011
UN
ESC
O
Mor
occo
0.
4737
68.4
920
15U
NES
CO
67.1
520
11U
NES
CO
11.5
620
11U
NES
CO
4.40
2012
UN
DP
Moz
ambi
que
0.38
9358
.77
2015
UN
ESC
O60
.33
2013
UN
ESC
O9.
2820
13U
NES
CO
4.99
2009
UN
ESC
O
Mya
nmar
0.
4837
93.0
920
15U
NES
CO
53.0
020
07U
NES
CO
8.63
2007
UN
ESC
O4.
0020
12U
ND
P
Nam
ibia
0.
5551
81.9
420
15U
NES
CO
70.2
820
06U
NES
CO
11.3
420
06U
NES
CO
5.77
2001
UN
ESC
O
Nau
ru
0.52
1492
.00
2014
UN
E-G
ov
Surv
ey56
.13
2008
UN
ESC
O9.
3520
10U
NES
CO
5.45
2012
UN
DP
Nep
al
0.47
1463
.95
2015
UN
ESC
O75
.45
2013
UN
ESC
O12
.34
2013
UN
ESC
O3.
2020
12U
ND
P
Net
herla
nds
0.91
8399
.00
2014
UN
ESC
O10
5.75
2012
UN
ESC
O17
.92
2012
UN
ESC
O11
.89
2012
UN
ESC
O
New
Zea
land
0.
9402
99.0
020
14U
NES
CO
104.
5520
13U
NES
CO
18.9
520
13U
NES
CO
12.5
020
12U
ND
P
Nic
arag
ua
0.54
5482
.82
2015
UN
ESC
O70
.00
2014
UN
ESC
O10
.51
2002
UN
ESC
O5.
8020
12U
ND
P
Nig
er
0.04
9819
.13
2015
UN
ESC
O37
.51
2012
UN
ESC
O5.
4220
12U
NES
CO
1.40
2012
UN
DP
Nig
eria
0.
3784
59.5
720
15U
NES
CO
55.6
620
05U
NES
CO
8.99
2005
UN
ESC
O5.
2020
12U
ND
P
Tab
le 1
5.
Hu
man
Cap
ital
Ind
ex (
HC
I) a
nd
its
com
po
nen
ts (
con
tin
ued
)

188
DATA TABLES
Data tab
les
Co
un
try
HC
IA
du
lt L
iter
acy
(%
)G
ross
en
rolm
ent
rati
o (
%)
Exp
ecte
d y
ears
of
sch
oo
ling
Mea
n y
ears
of
sch
oo
ling
Ind
ex
valu
eY
ear
Sou
rce
Ind
ex
valu
eY
ear
Sou
rce
Ind
ex
valu
eY
ear
Sou
rce
Ind
ex
valu
eY
ear
Sou
rce
Nor
way
0.
9031
99.0
020
14U
NES
CO
98.5
320
13U
NES
CO
17.7
120
13U
NES
CO
12.4
020
07U
NES
CO
Om
an
0.67
9691
.14
2015
UN
ESC
O76
.54
2011
UN
ESC
O13
.64
2011
UN
ESC
O8.
0020
08U
NES
CO
Paki
stan
0.
3190
57.9
420
15U
NES
CO
45.8
220
13U
NES
CO
7.79
2013
UN
ESC
O4.
7320
11U
NES
CO
Pala
u 0.
8867
99.5
220
15U
NES
CO
97.6
720
13U
NES
CO
16.8
620
13U
NES
CO
12.2
020
12U
ND
P
Pana
ma
0.71
7595
.05
2015
UN
ESC
O78
.93
2012
UN
ESC
O13
.28
2012
UN
ESC
O9.
3520
10U
NES
CO
Papu
a N
ew G
uine
a 0.
3240
64.2
320
15U
NES
CO
"36.
9818
6
"19
98U
NES
CO
8.86
2012
UN
DP
(HD
I)3.
9020
12U
ND
P
Para
guay
0.
6409
95.5
620
15U
NES
CO
69.4
220
10U
NES
CO
11.9
120
10U
NES
CO
7.31
2008
UN
ESC
O
Peru
0.
7151
94.4
820
15U
NES
CO
81.9
920
10U
NES
CO
13.0
720
10U
NES
CO
9.01
2012
UN
ESC
O
Phili
ppin
es
0.68
3996
.29
2015
UN
ESC
O81
.48
2010
UN
ESC
O12
.11
2013
UN
ESC
O7.
5620
00U
NES
CO
Pola
nd
0.87
4799
.79
2015
UN
ESC
O97
.50
2013
UN
ESC
O16
.42
2013
UN
ESC
O11
.82
2012
UN
ESC
O
Port
ugal
0.
8129
95.6
820
15U
NES
CO
99.9
620
13U
NES
CO
16.6
620
13U
NES
CO
8.25
2012
UN
ESC
O
Qat
ar
0.73
1797
.30
2015
UN
ESC
O79
.47
2005
UN
ESC
O13
.79
2005
UN
ESC
O9.
0720
12U
NES
CO
Repu
blic
of
Kor
ea
0.87
9599
.00
2014
UN
ESC
O98
.58
2014
UN
ESC
O16
.81
2014
UN
ESC
O11
.77
2010
UN
ESC
O
Repu
blic
of
Mol
dova
0.
7191
99.3
620
15U
NES
CO
70.7
120
13U
NES
CO
11.8
720
13U
NES
CO
11.1
920
11U
NES
CO
Rom
ania
0.
7736
98.7
720
15U
NES
CO
80.5
620
11U
NES
CO
14.2
120
11U
NES
CO
10.7
820
12U
NES
CO
Russ
ian
Fede
ratio
n 0.
8234
99.7
220
15U
NES
CO
88.9
520
12U
NES
CO
14.5
120
12U
NES
CO
11.9
520
10U
NES
CO
Rwan
da
0.45
2270
.52
2015
UN
ESC
O67
.28
2013
UN
ESC
O10
.27
2013
UN
ESC
O3.
7420
12U
NES
CO
Sain
t K
itts
and
Nev
is
0.69
7697
.80
2014
UN
ESC
O75
.22
2008
UN
ESC
O12
.88
2008
UN
ESC
O8.
4020
12U
ND
P
Sain
t Lu
cia
0.67
4494
.80
2014
UN
ESC
O73
.53
2007
UN
ESC
O12
.57
2007
UN
ESC
O8.
3020
12U
ND
P
Sain
t V
ince
nt a
nd t
he
Gre
nadi
nes
0.67
5488
.10
2014
UN
ESC
O78
.28
2004
UN
ESC
O13
.26
2004
UN
ESC
O8.
6020
12U
ND
P
Sam
oa
0.70
7698
.97
2015
UN
ESC
O71
.32
2000
UN
ESC
O12
.00
2000
UN
ESC
O10
.30
2012
UN
DP
San
Mar
ino
0.79
9999
.00
2014
UN
E-G
ov
Surv
ey85
.33
2012
UN
ESC
O15
.02
2012
UN
ESC
O10
.76
2012
UN
DP
Sao
Tom
e an
d Pr
inci
pe
0.51
8874
.92
2015
UN
ESC
O73
.86
2012
UN
ESC
O11
.29
2011
UN
ESC
O4.
7020
12U
ND
P
Saud
i Ara
bia
0.79
9594
.65
2015
UN
ESC
O10
0.32
2013
UN
ESC
O16
.95
2013
UN
ESC
O7.
3020
04U
NES
CO
Sene
gal
0.40
2557
.67
2015
UN
ESC
O48
.25
2010
UN
ESC
O7.
9520
00U
NES
CO
9.61
2013
UN
ESC
O
Tab
le 1
5.
Hu
man
Cap
ital
Ind
ex (
HC
I) a
nd
its
com
po
nen
ts (
con
tin
ued
)

189
E-GOVERNMENT IN SUPPORT OF SUSTAINABLE DEVELOPMENT
Data tab
les
Co
un
try
HC
IA
du
lt L
iter
acy
(%
)G
ross
en
rolm
ent
rati
o (
%)
Exp
ecte
d y
ears
of
sch
oo
ling
Mea
n y
ears
of
sch
oo
ling
Ind
ex
valu
eY
ear
Sou
rce
Ind
ex
valu
eY
ear
Sou
rce
Ind
ex
valu
eY
ear
Sou
rce
Ind
ex
valu
eY
ear
Sou
rce
Serb
ia0.
7769
98.1
120
15U
NES
CO
83.5
520
13U
NES
CO
14.3
920
13U
NES
CO
10.4
620
11U
NES
CO
Seyc
helle
s 0.
6861
91.8
420
12U
NES
CO
72.1
120
13U
NES
CO
13.2
620
13U
NES
CO
9.40
2012
UN
DP
Sier
ra L
eone
0.
2407
48.0
920
15U
NES
CO
45.4
320
01U
NES
CO
7.22
2001
UN
ESC
O2.
9020
12U
ND
P
Sing
apor
e 0.
8360
96.7
620
15U
NES
CO
102.
8020
14U
NES
CO
15.4
020
12U
ND
P(H
DI)
10.2
020
12U
ND
P
Slov
akia
0.
7822
99.0
020
14U
NES
CO
82.2
020
13U
NES
CO
15.0
720
13U
NES
CO
10.1
220
01U
NES
CO
Slov
enia
0.
8952
99.7
220
15U
NES
CO
98.4
120
13U
NES
CO
17.5
420
13U
NES
CO
11.8
920
12U
NES
CO
Solo
mon
Isla
nds
0.44
0276
.60
1999
UN
ESC
O55
.42
2007
UN
ESC
O9.
2420
07U
NES
CO
4.50
2012
UN
DP
Som
alia
0.
0000
24.0
020
14U
N E
-Gov
Su
rvey
17.0
020
14U
ND
P H
DI
2.40
2013
UN
DP
(HD
I)3.
5620
12U
ND
P
Sout
h A
fric
a 0.
7253
94.2
720
15U
NES
CO
78.0
020
12U
NES
CO
13.5
620
12U
NES
CO
9.94
2012
UN
ESC
O
Sout
h Su
dan
0.36
0770
.21
2014
UN
ESC
O38
.00
2014
UN
ESC
O8.
0020
14U
NES
CO
5.37
2008
UN
ESC
O
Spai
n 0.
8782
98.1
020
15U
NES
CO
107.
5420
13U
NES
CO
17.5
620
13U
NES
CO
9.58
2012
UN
ESC
O
Sri L
anka
0.
7369
92.6
320
15U
NES
CO
77.9
120
13U
NES
CO
13.7
920
13U
NES
CO
10.9
120
01U
NES
CO
Suda
n 0.
3581
75.9
020
15U
NES
CO
46.5
520
12U
NES
CO
7.09
2012
UN
ESC
O3.
1020
12U
ND
P
Surin
ame
0.65
5195
.57
2015
UN
ESC
O72
.21
2002
UN
ESC
O12
.00
2012
UN
DP
(HD
I)7.
6520
04U
NES
CO
Swaz
iland
0.
5882
87.4
720
15U
NES
CO
66.7
320
11U
NES
CO
11.3
320
11U
NES
CO
7.10
2012
UN
DP
Swed
en
0.92
1099
.00
2014
UN
ESC
O10
4.89
2013
UN
ESC
O18
.04
2013
UN
ESC
O12
.10
2012
UN
ESC
O
Switz
erla
nd
0.85
7999
.00
2014
UN
ESC
O86
.95
2012
UN
ESC
O15
.79
2012
UN
ESC
O13
.46
2009
UN
ESC
O
Syria
n A
rab
Repu
blic
0.
4864
86.4
320
15U
NES
CO
50.6
020
13U
NES
CO
8.39
2013
UN
ESC
O6.
6020
09U
NES
CO
Tajik
ista
n 0.
7001
99.7
720
15U
NES
CO
69.7
320
12U
NES
CO
11.2
420
12U
NES
CO
10.6
520
00U
NES
CO
Thai
land
0.
6942
96.6
720
15U
NES
CO
78.6
820
13U
NES
CO
13.4
220
13U
NES
CO
7.32
2010
UN
ESC
O
The
form
er Y
ugos
lav
Repu
blic
of
Mac
edon
ia
0.68
7797
.83
2015
UN
ESC
O70
.01
2012
UN
ESC
O13
.35
2012
UN
ESC
O8.
2020
12U
ND
P
Tim
or-L
este
0.48
4367
.52
2015
UN
ESC
O71
.82
2010
UN
ESC
O11
.67
2010
UN
ESC
O4.
4020
12U
ND
P
Togo
0.
5056
66.5
520
15U
NES
CO
72.8
020
11U
NES
CO
12.2
320
11U
NES
CO
5.30
2012
UN
DP
Tong
a 0.
8102
99.4
020
15U
NES
CO
88.5
020
03U
NES
CO
14.7
120
03U
NES
CO
11.0
620
11U
NES
CO
Trin
idad
and
Tob
ago
0.70
7798
.96
2015
UN
ESC
O67
.31
2004
UN
ESC
O12
.27
2004
UN
ESC
O10
.76
2009
UN
ESC
O
Tab
le 1
5.
Hu
man
Cap
ital
Ind
ex (
HC
I) a
nd
its
com
po
nen
ts (
con
tin
ued
)

190
DATA TABLES
Data tab
les
Co
un
try
HC
IA
du
lt L
iter
acy
(%
)G
ross
en
rolm
ent
rati
o (
%)
Exp
ecte
d y
ears
of
sch
oo
ling
Mea
n y
ears
of
sch
oo
ling
Ind
ex
valu
eY
ear
Sou
rce
Ind
ex
valu
eY
ear
Sou
rce
Ind
ex
valu
eY
ear
Sou
rce
Ind
ex
valu
eY
ear
Sou
rce
Tuni
sia
0.63
9781
.78
2015
UN
ESC
O78
.94
2013
UN
ESC
O14
.60
2013
UN
ESC
O6.
5020
12U
ND
P
Turk
ey
0.79
1095
.01
2015
UN
ESC
O97
.23
2013
UN
ESC
O16
.58
2013
UN
ESC
O7.
5620
12U
NES
CO
Turk
men
ista
n 0.
6583
99.6
920
15U
NES
CO
61.2
920
14U
NES
CO
10.8
020
14U
NES
CO
9.90
2012
UN
DP
Tuva
lu
0.66
5198
.00
2014
UN
E-G
ov
Surv
ey72
.33
2001
UN
ESC
O10
.80
2001
UN
ESC
O8.
8320
12U
ND
P
Uga
nda
0.46
6878
.39
2015
UN
ESC
O61
.32
2011
UN
ESC
O9.
7720
11U
NES
CO
4.17
2002
UN
ESC
O
Ukr
aine
0.83
9099
.76
2015
UN
ESC
O94
.68
2013
UN
ESC
O15
.14
2013
UN
ESC
O11
.30
2012
UN
DP
Uni
ted
Ara
b Em
irate
s 0.
6752
93.8
420
15U
NES
CO
67.0
020
14U
NES
CO
13.3
320
12U
ND
P(H
DI)
9.00
2005
UN
ESC
O
Uni
ted
Kin
gdom
of
Gre
at B
ritai
n an
d N
orth
ern
Irela
nd
0.94
0299
.00
2014
UN
ESC
O10
1.78
2013
UN
ESC
O18
.18
2013
UN
ESC
O13
.75
2011
UN
ESC
O
Uni
ted
Repu
blic
of
Tanz
ania
0.
3974
70.6
020
15U
NES
CO
53.4
520
13U
NES
CO
8.59
2013
UN
ESC
O4.
3020
02U
NES
CO
Uni
ted
Stat
es o
f A
mer
ica
0.88
1599
.00
2014
UN
ESC
O95
.44
2013
UN
ESC
O16
.34
2013
UN
ESC
O12
.93
2009
UN
ESC
O
Uru
guay
0.
7820
98.4
920
15U
NES
CO
89.8
820
10U
NES
CO
15.5
020
10U
NES
CO
8.45
2012
UN
ESC
O
Uzb
ekis
tan
0.69
5499
.59
2015
UN
ESC
O70
.39
2011
UN
ESC
O11
.51
2011
UN
ESC
O10
.00
2012
UN
DP
Vanu
atu
0.58
8485
.23
2015
UN
ESC
O63
.51
2004
UN
ESC
O10
.60
2004
UN
ESC
O9.
0020
12U
ND
P
Vene
zuel
a (B
oliv
aria
n Re
publ
ic o
f)0.
7498
96.3
220
15U
NES
CO
88.9
220
09U
NES
CO
14.2
220
09U
NES
CO
8.39
2009
UN
ESC
O
Vie
t N
am
0.59
8994
.51
2015
UN
ESC
O66
.00
2014
UN
ESC
O11
.90
2012
UN
DP
(HD
I)5.
5020
12U
ND
P
Yem
en
0.38
2970
.07
2015
UN
ESC
O55
.97
2011
UN
ESC
O9.
1520
11U
NES
CO
2.50
2012
UN
DP
Zam
bia
0.56
4363
.38
2015
UN
ESC
O85
.0U
ND
P13
.50
2012
UN
DP
(HD
I)6.
5020
12U
ND
P
Zim
babw
e 0.
5641
86.5
020
15U
NES
CO
61.5
520
12U
NES
CO
10.8
5084
2012
UN
ESC
O7.
220
12U
ND
P
No
te: L
ast
acce
ssed
in S
epte
mb
er 2
015
Tab
le 1
5.
Hu
man
Cap
ital
Ind
ex (
HC
I) a
nd
its
com
po
nen
ts (
con
tin
ued
)
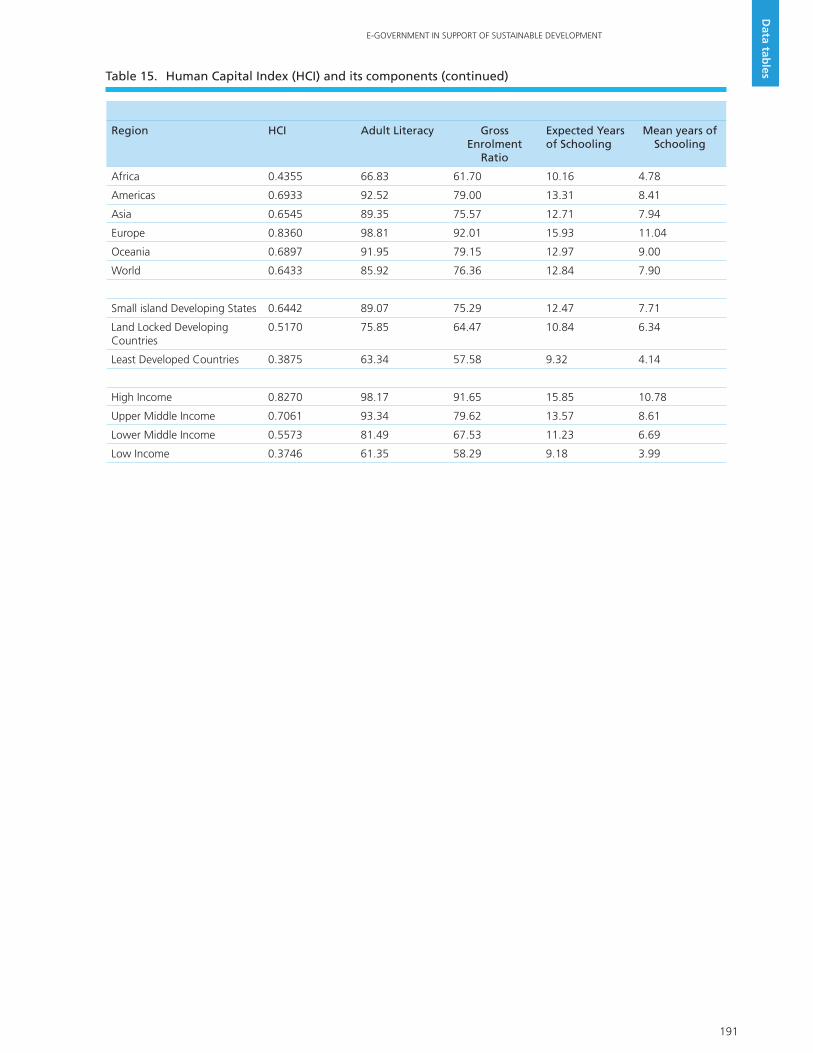
191
E-GOVERNMENT IN SUPPORT OF SUSTAINABLE DEVELOPMENT
Data tab
les
Region HCI Adult Literacy Gross Enrolment
Ratio
Expected Years of Schooling
Mean years of Schooling
Africa 0.4355 66.83 61.70 10.16 4.78
Americas 0.6933 92.52 79.00 13.31 8.41
Asia 0.6545 89.35 75.57 12.71 7.94
Europe 0.8360 98.81 92.01 15.93 11.04
Oceania 0.6897 91.95 79.15 12.97 9.00
World 0.6433 85.92 76.36 12.84 7.90
Small island Developing States 0.6442 89.07 75.29 12.47 7.71
Land Locked Developing Countries
0.5170 75.85 64.47 10.84 6.34
Least Developed Countries 0.3875 63.34 57.58 9.32 4.14
High Income 0.8270 98.17 91.65 15.85 10.78
Upper Middle Income 0.7061 93.34 79.62 13.57 8.61
Lower Middle Income 0.5573 81.49 67.53 11.23 6.69
Low Income 0.3746 61.35 58.29 9.18 3.99
Table 15. Human Capital Index (HCI) and its components (continued)
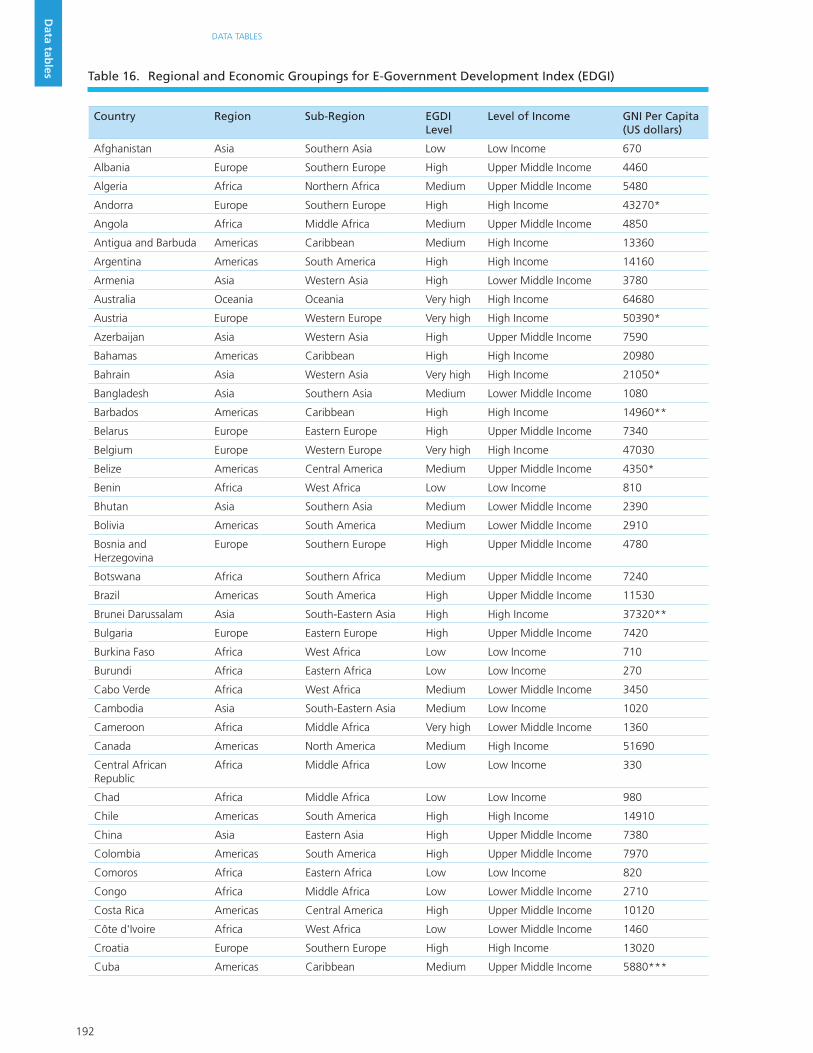
192
DATA TABLES
Data tab
les
Country Region Sub-Region EGDI Level
Level of Income GNI Per Capita (US dollars)
Afghanistan Asia Southern Asia Low Low Income 670
Albania Europe Southern Europe High Upper Middle Income 4460
Algeria Africa Northern Africa Medium Upper Middle Income 5480
Andorra Europe Southern Europe High High Income 43270*
Angola Africa Middle Africa Medium Upper Middle Income 4850
Antigua and Barbuda Americas Caribbean Medium High Income 13360
Argentina Americas South America High High Income 14160
Armenia Asia Western Asia High Lower Middle Income 3780
Australia Oceania Oceania Very high High Income 64680
Austria Europe Western Europe Very high High Income 50390*
Azerbaijan Asia Western Asia High Upper Middle Income 7590
Bahamas Americas Caribbean High High Income 20980
Bahrain Asia Western Asia Very high High Income 21050*
Bangladesh Asia Southern Asia Medium Lower Middle Income 1080
Barbados Americas Caribbean High High Income 14960**
Belarus Europe Eastern Europe High Upper Middle Income 7340
Belgium Europe Western Europe Very high High Income 47030
Belize Americas Central America Medium Upper Middle Income 4350*
Benin Africa West Africa Low Low Income 810
Bhutan Asia Southern Asia Medium Lower Middle Income 2390
Bolivia Americas South America Medium Lower Middle Income 2910
Bosnia and Herzegovina
Europe Southern Europe High Upper Middle Income 4780
Botswana Africa Southern Africa Medium Upper Middle Income 7240
Brazil Americas South America High Upper Middle Income 11530
Brunei Darussalam Asia South-Eastern Asia High High Income 37320**
Bulgaria Europe Eastern Europe High Upper Middle Income 7420
Burkina Faso Africa West Africa Low Low Income 710
Burundi Africa Eastern Africa Low Low Income 270
Cabo Verde Africa West Africa Medium Lower Middle Income 3450
Cambodia Asia South-Eastern Asia Medium Low Income 1020
Cameroon Africa Middle Africa Very high Lower Middle Income 1360
Canada Americas North America Medium High Income 51690
Central African Republic
Africa Middle Africa Low Low Income 330
Chad Africa Middle Africa Low Low Income 980
Chile Americas South America High High Income 14910
China Asia Eastern Asia High Upper Middle Income 7380
Colombia Americas South America High Upper Middle Income 7970
Comoros Africa Eastern Africa Low Low Income 820
Congo Africa Middle Africa Low Lower Middle Income 2710
Costa Rica Americas Central America High Upper Middle Income 10120
Côte d'Ivoire Africa West Africa Low Lower Middle Income 1460
Croatia Europe Southern Europe High High Income 13020
Cuba Americas Caribbean Medium Upper Middle Income 5880***
Table 16. Regional and Economic Groupings for E-Government Development Index (EDGI)

193
E-GOVERNMENT IN SUPPORT OF SUSTAINABLE DEVELOPMENT
Data tab
les
Country Region Sub-Region EGDI Level
Level of Income GNI Per Capita (US dollars)
Cyprus Asia Western Asia High High Income 26370
Czech Republic Europe Eastern Europe High High Income 18970*
Democratic People's Republic of Korea
Asia Eastern Asia Medium Low Income 506~
Democratic Republic of the Congo
Africa Middle Africa Low Low Income 380
Denmark Europe Northern Europe Very high High Income 61310
Djibouti Africa Eastern Africa Low Lower Middle Income 1030&
Dominica Americas Caribbean Medium Upper Middle Income 7070
Dominican Republic Americas Caribbean Medium Upper Middle Income 6030
Ecuador Americas South America High Upper Middle Income 6070
Egypt Africa Northern Africa Medium Lower Middle Income 3050
El Salvador Americas Central America Medium Lower Middle Income 3950
Equatorial Guinea Africa Middle Africa Low High Income 12640
Eritrea Africa Eastern Africa Low Low Income 680
Estonia Europe Northern Europe Very high High Income 18530
Ethiopia Africa Eastern Africa Medium Low Income 550
Fiji Oceania Oceania Medium Upper Middle Income 4540
Finland Europe Northern Europe Very high High Income 48910*
France Europe Western Europe Very high High Income 43070
Gabon Africa Middle Africa Medium Upper Middle Income 9450
Gambia Africa West Africa Low Low Income 440
Georgia Asia Western Asia High Lower Middle Income 3720
Germany Europe Western Europe Very high High Income 47640
Ghana Africa West Africa Medium Lower Middle Income 1600
Greece Europe Southern Europe High High Income 22090
Grenada Americas Caribbean High Upper Middle Income 7850
Guatemala Americas Central America Medium Lower Middle Income 3410
Guinea Africa West Africa Low Low Income 470
Guinea-Bissau Africa West Africa Low Low Income 550
Guyana Americas South America Medium Lower Middle Income 4170
Haiti Americas Caribbean Low Low Income 820
Honduras Americas Central America Medium Lower Middle Income 2280
Hungary Europe Eastern Europe High High Income 13470
Iceland Europe Northern Europe Very high High Income 47640
India Asia Southern Asia Medium Lower Middle Income 1570
Indonesia Asia South-Eastern Asia Medium Lower Middle Income 3630
Iran (Islamic Republic of)
Asia Southern Asia Medium Upper Middle Income 6840*
Iraq Asia Western Asia Medium Upper Middle Income 6320
Ireland Europe Northern Europe Very high High Income 44660
Israel Asia Western Asia Very high High Income 34990
Italy Europe Southern Europe Very high High Income 34280
Jamaica Americas Caribbean Medium Upper Middle Income 5220*
Japan Asia Eastern Asia Very high High Income 42000
Table 16. Regional and Economic Grouping for E-Government Development Index (EDGI) (Continued)
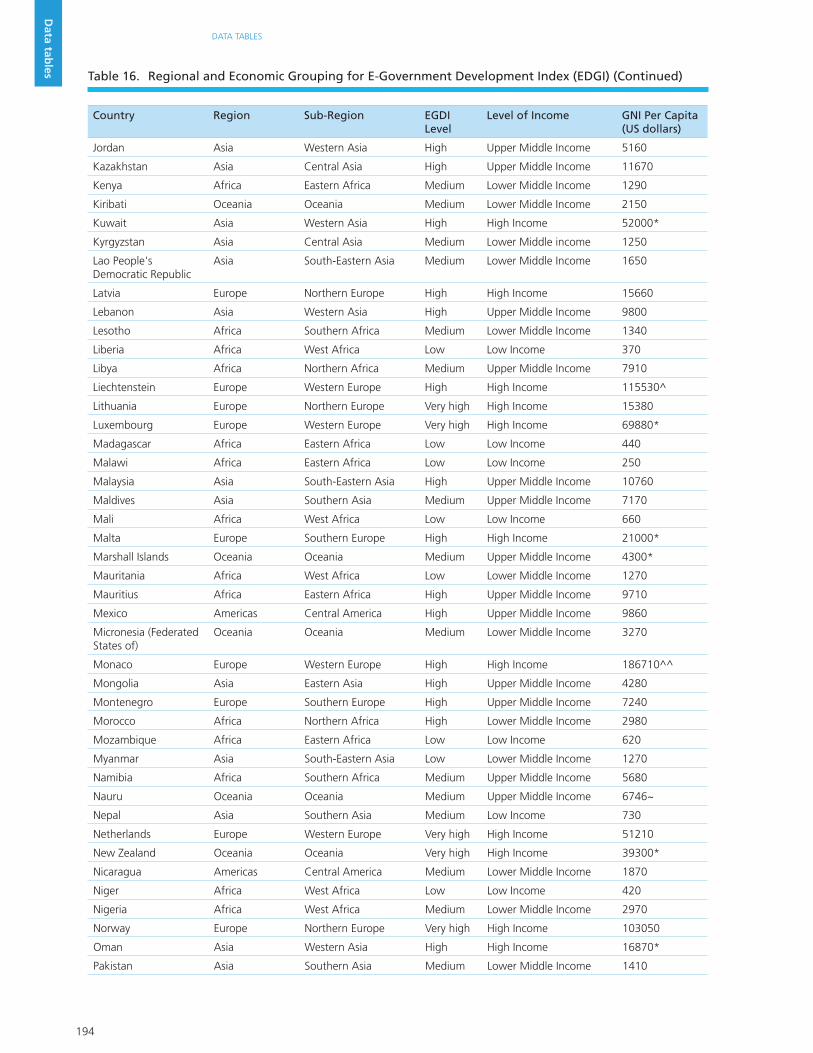
194
DATA TABLES
Data tab
les
Country Region Sub-Region EGDI Level
Level of Income GNI Per Capita (US dollars)
Jordan Asia Western Asia High Upper Middle Income 5160
Kazakhstan Asia Central Asia High Upper Middle Income 11670
Kenya Africa Eastern Africa Medium Lower Middle Income 1290
Kiribati Oceania Oceania Medium Lower Middle Income 2150
Kuwait Asia Western Asia High High Income 52000*
Kyrgyzstan Asia Central Asia Medium Lower Middle income 1250
Lao People's Democratic Republic
Asia South-Eastern Asia Medium Lower Middle Income 1650
Latvia Europe Northern Europe High High Income 15660
Lebanon Asia Western Asia High Upper Middle Income 9800
Lesotho Africa Southern Africa Medium Lower Middle Income 1340
Liberia Africa West Africa Low Low Income 370
Libya Africa Northern Africa Medium Upper Middle Income 7910
Liechtenstein Europe Western Europe High High Income 115530^
Lithuania Europe Northern Europe Very high High Income 15380
Luxembourg Europe Western Europe Very high High Income 69880*
Madagascar Africa Eastern Africa Low Low Income 440
Malawi Africa Eastern Africa Low Low Income 250
Malaysia Asia South-Eastern Asia High Upper Middle Income 10760
Maldives Asia Southern Asia Medium Upper Middle Income 7170
Mali Africa West Africa Low Low Income 660
Malta Europe Southern Europe High High Income 21000*
Marshall Islands Oceania Oceania Medium Upper Middle Income 4300*
Mauritania Africa West Africa Low Lower Middle Income 1270
Mauritius Africa Eastern Africa High Upper Middle Income 9710
Mexico Americas Central America High Upper Middle Income 9860
Micronesia (Federated States of)
Oceania Oceania Medium Lower Middle Income 3270
Monaco Europe Western Europe High High Income 186710^^
Mongolia Asia Eastern Asia High Upper Middle Income 4280
Montenegro Europe Southern Europe High Upper Middle Income 7240
Morocco Africa Northern Africa High Lower Middle Income 2980
Mozambique Africa Eastern Africa Low Low Income 620
Myanmar Asia South-Eastern Asia Low Lower Middle Income 1270
Namibia Africa Southern Africa Medium Upper Middle Income 5680
Nauru Oceania Oceania Medium Upper Middle Income 6746~
Nepal Asia Southern Asia Medium Low Income 730
Netherlands Europe Western Europe Very high High Income 51210
New Zealand Oceania Oceania Very high High Income 39300*
Nicaragua Americas Central America Medium Lower Middle Income 1870
Niger Africa West Africa Low Low Income 420
Nigeria Africa West Africa Medium Lower Middle Income 2970
Norway Europe Northern Europe Very high High Income 103050
Oman Asia Western Asia High High Income 16870*
Pakistan Asia Southern Asia Medium Lower Middle Income 1410
Table 16. Regional and Economic Grouping for E-Government Development Index (EDGI) (Continued)

195
E-GOVERNMENT IN SUPPORT OF SUSTAINABLE DEVELOPMENT
Data tab
les
Country Region Sub-Region EGDI Level
Level of Income GNI Per Capita (US dollars)
Palau Oceania Oceania Medium Upper Middle Income 11110
Panama Americas Central America Medium Upper Middle Income 11130
Papua New Guinea Oceania Oceania Low Lower Middle Income 2030*
Paraguay Americas South America Medium Upper Middle Income 4380
Peru Americas South America High Upper Middle Income 6370
Philippines Asia South-Eastern Asia High Lower Middle Income 3470
Poland Europe Eastern Europe High High Income 13730
Portugal Europe Southern Europe High High Income 21320
Qatar Asia Western Asia High High Income 94410
Republic of Korea Asia Eastern Asia Very high High Income 27090
Republic of Moldova Europe Eastern Europe High Lower Middle Income 2550
Romania Europe Eastern Europe High Upper Middle Income 9370
Russian Federation Europe Eastern Europe High High Income 13210
Rwanda Africa Eastern Africa Medium Low Income 700
Saint Kitts and Nevis Americas Caribbean High High Income 14490
Saint Lucia Americas Caribbean Medium Upper Middle Income 7080
Saint Vincent and the Grenadines
Americas Caribbean Medium Upper Middle Income 6560
Samoa Oceania Oceania Medium Lower Middle Income 4050
San Marino Europe Southern Europe High High Income 52140^^
Sao Tome and Principe
Africa Middle Africa Low Lower Middle Income 1670
Saudi Arabia Asia Western Asia High High Income 25140*
Senegal Africa West Africa Medium Lower Middle Income 1040
Serbia Europe Southern Europe High Upper Middle Income 5820
Seychelles Africa Eastern Africa High High Income 13990
Sierra Leone Africa West Africa Low Low Income 710
Singapore Asia South-Eastern Asia Very high High Income 55150
Slovakia Europe Eastern Europe High High Income 17810*
Slovenia Europe Southern Europe Very high High Income 23220*
Solomon Islands Oceania Oceania Low Lower Middle Income 1830
Somalia Africa Eastern Africa Low Low Income 107~
South Africa Africa Southern Africa High Upper Middle Income 6800
South Sudan Africa Eastern Africa Low Low Income 940
Spain Europe Southern Europe Very high High Income 29940*
Sri Lanka Asia Southern Asia High Lower Middle Income 3400
Sudan Africa Northern Africa Medium Lower Middle Income 1710
Suriname Americas South America Medium Upper Middle Income 9470*
Swaziland Africa Southern Africa Medium Lower Middle Income 2700
Sweden Europe Northern Europe Very high High Income 61600
Switzerland Europe Western Europe Very high High Income 90670*
Syrian Arab Republic Asia Western Asia Medium Lower Middle Income 1860^^^
Tajikistan Asia Central Asia Medium Lower Middle Income 1080
Thailand Asia South-Eastern Asia High Upper Middle Income 5370
Table 16. Regional and Economic Grouping for E-Government Development Index (EDGI) (Continued)

196
DATA TABLES
Data tab
les
Country Region Sub-Region EGDI Level
Level of Income GNI Per Capita (US dollars)
The former Yugoslav Republic of Macedonia
Europe Southern Europe High Upper Middle Income 5150
Timor-Leste Asia South-Eastern Asia Medium Lower Middle Income 3120
Togo Africa West Africa Medium Low Income 570
Tonga Oceania Oceania Medium Upper Middle Income 4290
Trinidad and Tobago Americas Caribbean High High Income 15550*
Tunisia Africa Northern Africa High Upper Middle Income 4210*
Turkey Asia Western Asia High Upper Middle Income 10840
Turkmenistan Asia Central Asia Medium Upper Middle Income 8020
Tuvalu Oceania Oceania Medium Upper Middle Income 5840*
Uganda Africa Eastern Africa Medium Low Income 680
Ukraine Europe Eastern Europe High Lower Middle Income 3560
United Arab Emirates Asia Western Asia Very high High Income 45200
United Kingdom of Great Britain and Northern Ireland
Europe Northern Europe Very high High Income 42690
United Republic of Tanzania
Africa Eastern Africa Medium Low Income 930
United States of America
Americas North America Very high High Income 55200
Uruguay Americas South America High High Income 16350
Uzbekistan Asia Central Asia High Lower Middle Income 2090
Vanuatu Oceania Oceania Medium Lower Middle Income 3090*
Venezuela Americas South America High High Income 12890
Viet Nam Asia South-Eastern Asia High Lower Middle Income 1890
Yemen Asia Western Asia Low Lower Middle Income 1300*
Zambia Africa Eastern Africa Medium Lower Middle Income 1680
Zimbabwe Africa Eastern Africa Medium Low Income 830
Source: World Bank 2015 World Development Indicators (Accessed 18 September 2015) http://data.worldbank.org/data-catalog/world-development-indicators Year: 2014 or most recent data available (as indicated * 2013 ** 2012 *** 2011 ^ 2009 ^^ 2008 ^^^ 2007 & 2005 ~ 2014 (UN Data)
Table 16. Regional and Economic Grouping for E-Government Development Index (EDGI) (Continued)

197
E-GOVERNMENT IN SUPPORT OF SUSTAINABLE DEVELOPMENT
Referen
ces
References Chapter 1
Adebesin, Funmi (2013). ‘A review of interoperability standards in e-Health and imperatives for their adoption in Africa’, SACJ , No. 50 (July 2013).
Berger G. and Steurer R. (2009). ‘Horizontal policy integration and sustainable development: Conceptual remarks and governance examples’, ESDN Quarterly Report, [online], June 2009,available: http://www.sd-network.eu/?k=quarterly%20reports&report_id=13. [accessed: 1 November 2015].
Bilbao-Osorio, B. et al. (2014). ‘The Global Information Technology Report 2014 Rewards and Risks of Big Data’, Geneva: World Economic Forum.
Clark, Helen (2012). ‘The Importance of Governance for Sustainable Development’, Remarks on the Occasion of the Singapore Lecture Series, United Nations Development Programme, 13 March 2012, Singapore, [online], available: http://www.undp.org/content/undp/en/home/presscenter/speeches/2012/03/13/the-importance-of-governance-for-sustainable-development.html. [accessed: 1 November 2015].
Dinevski, D. et al. (2010). ‘E-health Integration and Interoperability based on Open-Source Information Technology’, Wiener klinische Wochenschrift, May 2010.
Dominic S. and Meijers E. (2004). ‘Policy Integration: What Does It Mean and How Can It Be Achieved? A Multi-disciplinary Review’, Paper for 2004 Berlin Conference on the Human Dimensions of Global Environmental Change: Greening of Policies – Interlinkages and Policy Integration, [online], available: http://userpage.fu-berlin.de/ffu/akumwelt/bc2004/download/meijers_stead_f.pdf. [accessed: 1 November 2015].
Dzhusupova, Zamira (2013). ‘Enabling Democratic Local Governance through Rural E-Municipalities in Kyrgyzstan’, in: Mahmood Zaigham (ed.). E-Government Implementation and Practice in Developing Countries, pp. 34–58, Hershey, PA: IGI Global.
ECOSOC, United Nations Economic and Social Council (2015). Report of the Secretary-General. Strengthening and Building Institutions for Policy Integration in the Post-2015 Era. E/2015/69.
Estevez, E. et al. (2013). ‘Electronic Governance for Sustainable Development: How EGOV Solutions contribute to SD Goals?’, Proceedings of the 14th Annual International Conference on Digital Government Research, pp. 92-101.
European Commission (2015). ‘Future-proofing eGovernment for a Digital Single Market – Final insight Report’, June 2015, ISBN 978-92-79-48427-8.
Eynon R. and Dutton W. (2007). ‘Barriers to Networked Governments: Evidence from Europe’, Prometheus, vol. 25, Issue 3.
Fountain, Jane (2007). ‘Bureaucratic Reform and E-Government in the United States: An Institutional Perspective’, National Center for Digital Government of the University of Massachusetts Amherst. Paper 07-006.
——— (2010). ‘The Office for Harmonization in the Internal Market: Creating a 21st Century Public Agency’, National Center for Digital Government of the University of Massachusetts Amherst. Paper 38.

198
REFERENCES
Referen
ces
——— (2011). ‘Disjointed Innovation: The Political Economy of Digitally Mediated Institutional Reform, Paper prepared for presentation at the 2011 Annual Meeting of the American Political Science’.
——— (2013). ‘Interview by Michael J. Keegan - Implementing Cross-Agency Collaboration: A Guide for Federal Managers with Dr. Jane Fountain’, IBM Center for the Business of Government.
——— (2014). On the Effects of e-Government on Political Institutions. New York: Routledge.
Gaffney, Andrea (2007). ‘Hammarby Sjostad’, Stockholm, Sweden: A Case Study, [online], available: http://www.aeg7.com/assets/publications/hammarby%20sjostad.pdf. [accessed: 1 November 2015].
Gil-Garcia, J. Ramon (2012). ‘Towards a smart state? Inter-agency collaboration, Information Integration, and Beyond’, Information Polity.
Government of Australia, Management Advisory Committee (2004). ‘Connecting Government: Whole of Government Responses to Australia’s Priority Challenges’, ISBN 0 97510151X.
Government of Karnataka (2014). ‘Electronic Integration of BHOOMI with Stakeholders, Karnataka’, [online], available: http://darpg.gov.in/darpgwebsite_cms/document/file/Case%20Study%20-%20Bhoomi.pdf.[accessed: 1 November 2015].
Government of the Republic of Korea (2012). ‘Whole-of-Government Approach to Welfare Reform – Social Security Information System’, [online], available: http://workspace.unpan.org/sites/Internet/Documents/Session%208_GeunChan_Lim.pdf. [accessed: 1 November 2015].
Government of Singapore (2006). From Integrating Services and to Integrating Government. Report by the iGov 2010 Project Steering Committee, [online], available: https://www.ida.gov.sg/~/media/Files/Infocomm%20Landscape/iN2015/Reports/07_iGov2010.pdf. [accessed: 1 November 2015].
——— (2015). ‘About AGD: Our Role within Whole-of-Government’, [online], available: http://www.agd.gov.sg/about_role.html. [Accessed: 1 November 2015].
Government of Slovenia, Ministry of the Interior and Public Administration (2013). ‘Initiative – Reusable IT Building Blocks for Electronic Data Exchange – Implementation for e-Social Security’, [online], available: http://www.unpan.org/DPADM/UNPSDayAwards/KnowledgeBaseofUNPublicServiceAwards/tabid/1260/language/en-US/Default.aspx. [accessed: 1 November 2015].
Government of Thailand, Department of Disease Control (2015). ‘Webcam Connected Microscope for Trusted Malaria Telediagnosis on Cloud in Remote Border A’, Submission to the United Nations Public Service Award 2015. Knowledge Base of UN Public Service Awards Initiatives, [online], available: http://www.unpan.org/DPADM/UNPSDayAwards/KnowledgeBaseofUNPublicServiceAwards/tabid/1260/language/en-US/Default.aspx. [accessed: 1 November 2015].
Government of Turkey, Ministry of Family and Social Policy (2015). ‘Turkey’s Integrated Social Assistance Services System: Recent Effort, Impressive Virtual Integration’, Workshop on Integrated Data and Information Management for Social Protection: Bridging the Gaps between Theory and Practice Jakarta, 11-12 March, [online], available: http://www.opml.co.uk/sites/default/files/Poster%20Turkey_FINAL.pdf. [accessed: 1November 2015].

199
E-GOVERNMENT IN SUPPORT OF SUSTAINABLE DEVELOPMENT
Referen
ces
Government of the United Kingdom, Department of Business Innovation and Skills (2013). ‘Global Innovators: International Case Studies on Smart Cities - Case Studies Report’, BIS Research Paper, No. 135. (October 2013).
Government of the United States, Federal Emergency Management Agency (2015). ‘Welcome to FEMA’s Flood Map Service Center’, [online], available: https://msc.fema.gov/portal. [accessed: 1 November 2015].
Government of the United States, Office of Management and Budget (2014). ‘FY 2014 Annual Report to Congress: E-government Act Implementation’, 8 January 2014, [online], available: https://www.whitehouse.gov/omb/e-gov/docs. [accessed: 1 November 2015].
Greben, Gregory (2012). ‘How agencies can use data more effectively’, Federal Times, 22 January 2012, [online],available: http://archive.federaltimes.com/article/20120122/ADOP06/201220301/How-agencies-can-use-data-more-effectively. [accessed: 1November 2015].
Greengard, Samuel (2014). ‘Analytics Tools Help China Deal With Air Pollution’, Baseline, 15 August 2014, [online], available: http://www.baselinemag.com/analytics-big-data/analytics-tools-help-china-deal-with-air-pollution.html#sthash.FwS7PYTm.dpuf. [accessed: 1November 2015].
Hanna, Nagy K. (2011). Transforming Government and Building the Information Society: Challenges and Opportunities for the Developing World. New York: Springer.
Hawley, Kate (2014). ‘Transforming Cities for Sustainability: Facts and Figures’, SciDevNet, 19 November 2014, [online], available: http://www.scidev.net/global/cities/feature/transforming-cities-sustainability-facts-figures.html. [accessed: 1November 2015].
Henman, Paul (2005). ‘E-government, Public Policy and the Growth of Conditionality’, Proceedings of European Conference on E-Government’05, Antwerp, Belgium, 16-17 June 2005, [online], available: http://www.uq.edu.au/swahs/ECEGPaper.pdf. [accessed: 1November 2015].
Hodgkinson, Steve (2011). ‘Is Your City Smart Enough?’, Ovum, [online], available: http://www.cisco.com/web/strategy/docs/Is_your_city_smart_enough-Ovum_Analyst_Insights.pdf. [accessed: 1 November 2015].
Jones, Andrew (2013). ‘Smart Cities’, LGiU Policy Briefing. Local Government information Unit, [online], available: http://www.lgiu.org.uk/wp-content/uploads/2013/10/Smart-Cities.pdf. [accessed: 1November 2015].
Kierkegaard, Patrick (2013). ‘E-Health in Denmark: A Case Study’, Journal of Medical Systems. vol. 37.
Kim, Ran (2014). ‘Role and Positioning of E-government Leadership: Trends and Issues’, Paper for the United Nations Expert Group Meeting on Policy Integration in Government in Pursuit of the SDGs (28-29 January 2015), [online], available: http://workspace.unpan.org/sites/Internet/Documents/UNPAN94253.pdf. [accessed: 1 November 2015].
KOÇ, Serkan (2011). ‘Use of ICT in Macro Projects in Poverty Alleviation - Integrated Social Assistance Services Project’, available: http://www.sesrtcic.org/imgs/news/image/620-statement-session3-1.pdf. [accessed: 1 November 2015].

200
REFERENCES
Referen
ces
Langer M., and SchÖn A. (2002). ‘Evaluation of Sustainable Development: An Integrated Referential Framework for Sustainable Development’, Prepared for the WU-Jahrestagung 2002, [online], available: http://epub.wu.ac.at/904/1/document.pdf. [accessed: 1 November 2015].
David Le Blanc (2015). ‘Towards integration at last? The sustainable development goals as a network of targets’ DESA Working Paper No. 141 ST/ESA/2015/DWP/141, [online], available: http://www.un.org/esa/desa/papers/2015/wp141_2015.pdf. [accessed: 1 March 2016],
Lee, Jung Hoon. et al. (2014). ‘Towards an effective framework for building smart cities: Lessons from Seoul and San Francisco’, Technological Forecasting and Social Change, vol. 89 (November).
Millard J. and Carpenter J. (2014). ‘Case study analysis report of online collaboration and networking tools for social innovation – a deliverable of the project’, The theoretical, empirical and policy foundations for building social innovation in Europe (TEPSIE), European Commission – 7th Framework Programme, Brussels: European Commission.
Mochty, Franz (2009). ‘Electronic Data Management: An integrated EGovernment-Application in the Environmental Field in Austria’, [online], available: http://www.e-envi2009.org/presentations/S2/Mochty.pdf. [accessed: 1 November 2015].
Montenegro, Hernán (2011). ‘Combating Health Care Fragmentation through Integrated Health Service Delivery Networks in the Americas: Lessons Learned’, Journal of Integrated Care, vol.19, Issue 5.
Nam, Taewoo (2013). ‘Government 3.0 in Korea: fad or fashion?’, ICEGOV’ 13 Proceedings of the 7th International Conference on Theory and Practice of Electronic Governance.
Navara D. and Bianchi C. (2013). ‘Territorial Governance, E-government and Sustainable Development Policy: A system dynamics approach’, pp. 14-25, in: Wimmer, Maria et al. (eds.). Electronic Government. 12th IFIP WG 8.5 International Conference, EGOV 2013 Proceedings.
OECD, Organisation for Economic Co-operation and Development (1996). Building Policy Coherence, Tools and Tensions, Public Management Occasional Papers, No.12. Paris: OECD.
——— (2008). Ireland: Towards an integrated Public Service. OECD Public Management Reviews, Paris: OECD. [online], available: http://www.oecd.org/ireland/oecdpublicmanagementreviews-irelandtowardsanintegratedpublicservice.htm. [accessed: 1November 2015].
——— (2009). The Financial and Economic Crisis Impact on E-government in OECD countries. 5th Ministerial eGovernment Conference 19-20 November – Malmö, Sweden, Paris: OECD.
——— (2012). OECD E-government Studies – Egypt (2012). Paris: OECD.
Paredes, Divina (2013). ‘Fleshing out big data: A huge undertaking (2013)’, CIO, 9 August 2013, [online], available: http://www.cio.co.nz/article/523305/fleshing_big_data_huge_undertaking/. [accessed: 1 November 2015].
Partnership for Public Service (2011). ‘From data to decisions: The power of analytics’, [online], available: http://www.businessofgovernment.org/sites/default/files/From%20Data%20to%20Decisions.pdf. [accessed: 1 November 2015].

201
E-GOVERNMENT IN SUPPORT OF SUSTAINABLE DEVELOPMENT
Referen
ces
Payton, Jean (2012). ‘Is Rio de Janeiro the world’s first ‘smart’ city?’, The Christian Science Monitor, 15 March 2012, [online], available: http://www.csmonitor.com/World/Making-a-difference/Change-Agent/2012/0315/Is-Rio-de-Janeiro-the-world-s-first-smart-city. [accessed: 1 November 2015].
Pearce, Rohan (2015). ‘DTO works on Whole-of-Government Service Analytics’, Computer World, 2 June 2015, [online], available: http://www.computerworld.com.au/article/576394/dto-works-whole-of-government-service-analytics/. [accessed: 1 November 2015].
Špa ek, David (2014). ‘Enhancing coordination through e-government in the Czech Republic’, Organizing for Coordination in the Public Sector: Practices and Lessons from 12 European countries. New York: The Palgrave McMillian.
Thukral, Sanjeev (2014). ‘Can BI & Analytics Eradicate Poverty From India?’, iGovernment. 19 November 2014, [online], available: http://www.igovernment.in/opinion/1000786/can-bi-analytics-eradicate-poverty-from-india. [accessed: 1 November 2015].
UNDESA, UN Department of Economic and Social Affairs (2012). United Nations E-Government Survey 2012: E-government for the People. ST/ESA/PAS/SER.E/150.
——— (2014). United Nations E-Government Survey 2014: E-Government for the Future We Want. ST/ESA/PAD/SER.E/188.
——— (2015a). ‘Policy integration in government in pursuit of the sustainable development goals – Report of the expert group meeting’, 28 - 29 January 2015, available: http://www.un.org/esa/socdev/csocd/2016/egmreport-policyintegrationjan2015.pdf. [accessed: 1 November 2015]. E/CN.16/2015/CRP.2.
——— (2015b). Global Sustainable Development Report. available: https://sustainabledevelopment.un.org/content/documents/1758GSDR%202015%20Advance%20Unedited%20Version.pdf. [accessed: 1 November 2015].
United Nations (1992). Outcome Document of the Conference on Environment and Development, Rio de Janeiro, Brazil, 3 to 14 June 1992. Agenda 21.
——— (2012). Big Data for Development: Challenges & Opportunities. available: http://www.unglobalpulse.org/sites/default/files/BigDataforDevelopment-GlobalPulseMay2012.pdf. [accessed: 1 November 2015].
——— (2013). A New Global Partnership: Eradicate Poverty and Transform Economies through Sustainable Development. Report of the High-Level Panel of Eminent Persons on the Post-2015 Development Agenda.
——— (2014a). The Road to Dignity by 2030: Ending Poverty, Transforming all Lives and Protecting the Planet. Synthesis Report of the Secretary-General on the Post-2015 Sustainable Development Agenda.. A/69/700.
——— (2014b). ‘High-level Political Forum on Sustainable Development Issues Briefs 5: From Silos to Integrated Policymaking’, [online], available: https://sustainabledevelopment.un.org/content/documents/1322HLPF_Brief_5.pdf. [accessed: 1 November 2015].
——— (2014c). A World that Counts: Mobilising the Data Revolution for Sustainable Development.

202
REFERENCES
Referen
ces
——— (2015a). Transforming our world: the 2030 Agenda for Sustainable Development. A/RES/70/1.
——— (2015b). Addis Ababa Action Agenda of the Third International Conference on Financing for Development (Addis Ababa Action Agenda). A/RES/69/313.
Report prepared by Independent Expert Advisory Group on the Data Revolution for Sustainable Development. [online], available: http://www.undatarevolution.org/wp-content/uploads/2014/12/A-World-That-Counts2.pdf. [accessed: 1 November 2015].
——— (2015c). ‘Report of the Secretary-General - Outcome of the Third International Conference on Financing for Development’, A/70/150.
UNDP, United Nations Development Programme (2013). From Connectivity to Service Delivery: Case Studies in E-governance. [online], available: http://www.undp.org/content/undp/en/home/librarypage/democratic-governance/access_to_informationande-governance/from-connectivity-to-service-delivery---case-studies-in-e-govern.html. [accessed: 1 November 2015].
UNEP, United Nations Environment Programme (2009). Integrated policymaking for Sustainable Development: A Reference Manual. ISBN 978-92-807-2923-8.
UNESCAP, United Nations Economic and Social Commission for Asia and the Pacific (2015). Balancing the Three Dimensions of Sustainable Development: From Integration to Implementation. Economic and Social Survey of Asia and the Pacific 2015. Part II. ST/ESCAP/2718.
UNESCWA, United Nations Economic and Social Commission for West Asia (2015). Arab Sustainable Development Report Prototype Edition. available: http://www.preventionweb.net/files/45335_arabsustainabledevelopmentreport.pdf. [accessed: 1 November 2015].
Wicks, P.et al. (2014). ‘Innovations in E-health’, Qual Life Res. vol. 23, Issue 1.
World Bank (2012). ‘Who Needs Smart Cities for Sustainable Development?’, World Bank, 20 March 2012, [online], available: http://www.worldbank.org/en/news/feature/2012/03/20/who-needs-smart-cities-for-sustainable-development. [accessed: 1 November 2015].

203
E-GOVERNMENT IN SUPPORT OF SUSTAINABLE DEVELOPMENT
Referen
cesChapter 2
Bennett D. and Harvey A. (2009). ‘Publishing Open Government Data’, W3C, [online], 8 September 2009, available: http://www.w3.org/TR/gov-data/. [accessed: 1 November 2015].
Chêne, Marie (2014). ‘Providing on-demand Research to help fight Corruption: The impact of corruption on growth and inequality’, Transparency International, [online], available: http://www.transparency.org/files/content/corruptionqas/Impact_of_corruption_on_growth_and_inequality_2014.pdf. [accessed: 1 November 2015].
Chui M., Farrell D. and Jackson K. (2014). ‘How government can promote open data’, McKinsey Global Institute, [online], available: http://www.mckinsey.com/insights/public_sector/how_government_can_promote_open_data. [accessed: 1 November 2015].
ECOSOC, United Nations Economic and Social Council (2015). Committee of Experts on Public Administration Report on the fourteenth session. 20-24 April 2015. E/2015/44-E/C.16/2015/7.
Elena S., Aquilino N. and Pichón Rivière A. (2014). Case Study: Emerging Impacts in Open Data in the Judiciary Branches in Argentina, Chile and Uruguay. Buenos Aires: CIPPEC.
European Commission (2012). Green Public Procurement, A collection of good practices. ISBN 978-92-79-26276-0.
——— (2015). Future-proofing eGovernment for a Digital Single Market. ISBN 978-92-79-48428-5.
Gass, Thomas (2015). Providing Access to Legal Information to Accelerate Sustainable Development. 24 June 2015, New York, Department of Economic and Social Affairs, available: http://workspace.unpan.org/sites/Internet/Documents/UNPAN94915.pdf. [accessed: 1 November 2015].
Global Partnership For Sustainable Development Data (2015). ‘About’, Global Partnership For Sustainable Development Data, available: http://www.data4sdgs.org/who-we-are/. [accessed: 1 November 2015].
Government of Australia, Department of Finance and Deregulation (2013). The Australian Public Service Big Data Strategy: Improved understanding through enhanced data-analytics capability. ISBN 978-1-922096-27-2.
Government of United Kingdom, Cabinet Office (2012). ‘Open Data White Paper: Unleashing the Potential’, [online], available: https://www.gov.uk/government/publications/open-data-white-paper-unleashing-the-potential. [accessed: 1 November 2015].
Government of United States (2015). ‘Open Government’, Data.Gov, available: https://www.data.gov/open-gov/. [accessed: 1 November 2015].
Hattgen K. and Klasen S. (2010). Fragility and MDG Progress: How Useful is the Fragility Concept? - EUI-RSCAS Working Papers, pp.12. [online], available: h t t p : / / c a d m u s . e u i . e u / b i t s t r e a m / h a n d l e / 1 8 1 4 / 1 3 5 8 5 / R S C A S _ 2 0 1 0 _ 2 0 .pdf;jsessionid=06333966197F994625567467AA794F4A?sequence=1. [accessed: 1 November 2015].
International Budget Partnership (2015). ‘Open Budget Survey 2015’, [online], available: http://internationalbudget.org/opening-budgets/open-budget-initiative/open-budget-survey/publications-2/rankings-key-findings/key-findings/. [accessed: 1 November 2015].

204
REFERENCES
Referen
ces
IPCC, Intergovernmental Panel on Climate Change (2014). Synthesis Report, Summary for Policymakers: Climate Change. pp.37. [online], available: https://www.ipcc.ch/pdf/assessment-report/ar5/syr/AR5_SYR_FINAL_SPM.pdf. [accessed: 1 November 2015].
IPU, Inter-Parliamentary Union (2015). Resolution on Democracy in the digital era and the threat to privacy and individual freedoms. Geneva. 21 October 2015. available: http://www.ipu.org/conf-e/133/res-1.htm. [accessed: 1 November 2015].
Jesuit Hakimani Centre (2014). Open Government Data or effective public participation. April 2014. Nairobi Kenya. available: http://www.opendataresearch.org/sites/default/files/publications/JHC%20Publication%20April%202014%20-%20ODDC%20research.pdf. [accessed: 1 November 2015].
Longo, Justin (2013). ‘Open Government – What’s in a Name?’, GovLab Blog, 5 August 2013, [online], available: http://thegovlab.org/open-government-whats-in-a-name/. [accessed: 1 November 2015].
Manyika J. et al. (2013). ‘Open data: Unlocking innovation and performance with liquid Information’, McKinsey Global Institute, [online], available: http://www.mckinsey.com/insights/business_technology/open_data_unlocking_innovation_and_performance_with_liquid_information. [accessed: 1 November 2015].
Mckenzie D. and Exler R. (2014). ‘The Success of Open Data Depends on Open Standards’, Government Technology, 16 September 2014, [online], available: http://www.govtech.com/data/The-Success-of-Open-Data-Depends-on-Open-Standards.html. [accessed: 1 November 2015].
McLaughlin, Brian (2015) ‘U.S. Judicial Branch Embraces Open Government’, PATimes, 25 January 2015, [online], available: http://patimes.org/u-s-judicial-branch-embraces-open-government/. [accessed: 1 November 2015].
Mendel, Toby (2015). ‘Freedom of Information as an Internationally Protected Human Right’, [online], available: https://www.article19.org/data/files/pdfs/publications/foi-as-an-international-right.pdf. [accessed: 1 November 2015].
Montiel, Lenni, ‘The 2030 agenda for sustainable development: from vision to implementation, statement delivered at the Symposium on “Promotion of an Inclusive and Effective Public Administration, Cochabamba, Bolivia, February 2016.
Open Data Institute (2015). ‘Supporting Sustainable Development with Open Data’, [online], available from: http://theodi.org/supporting-sustainable-development-with-open-data. [accessed: 1 November 2015].
OSJI, Open Society Justice Initiative (2009). ‘Report on Access to Judicial Information’. pp. I. [online], available: http://www.right2info.org/resources/publications. [accessed: 1 November 2015].
Ubaldi, Barbara (2013). ‘Open Government Data: Towards Empirical Analysis of Open Government Data Initiatives’, Organisation for Economic Co-operation and Development, [online], available: http://www.oecd-ilibrary.org/governance/open-government-data_5k46bj4f03s7-en. [accessed: 1 November 2015].
UNDESA, UN Department of Economic and Social Affairs (2005). Challenges and Perspectives in Reforming Governance Institutions - DPADM Technical Papers. [online], available: http://unpan1.un.org/intradoc/groups/public/documents/un/unpan021508.pdf. [accessed: 1 November 2015].
205
E-GOVERNMENT IN SUPPORT OF SUSTAINABLE DEVELOPMENT
Referen
ces
——— (2010). World Public Sector Report: Reconstructing Public Administration after Conflict - Challenges, Practices and Lessons Learned.ST/ESA/PAD/SER.E/135.
——— (2014). United Nations E-Government Survey 2014: E-Government for the Future We Want. ST/ESA/PAD/SER.E/188.
——— (2015a) Report of the Expert Group Meeting: E-Government for Sustainable Development. Division for Public Administration and Development Management, UNDESA, 16-17 March 2015. ST/ESA/PAD/SER.E/205.
——— (2015b). National adoption, governance and institutions of MDGs: Lessons and implications for post-2015. [online], available: https://wess.un.org/wp-content/uploads/2015/02/WESS-2015-BP-Adoption-Governance-Institutions-24-02-15-unedited.pdf. [accessed: 1 November 2015].
——— (2015c). World Public Sector Report: Responsive and Accountable Public Governance. ST/ESA/PAD/SER.E/187.
——— (2015d). ‘United Nations Sustainable Development Knowledge Platform’, [online], available: http://www.un.org/esa/sustdev/sdissues/consumption/procurement/clemencec.pdf. [accessed: 1 November 2015].
UNDESA, UN Department of Economic and Social Affairs, and INTOSAI, International Organization Supreme Audit Institutions (2013). Audit and Advisory Activities by SAIs: Opportunities and Risks, as well as Possibilities for Engaging Citizens Report of the Expert Group Meeting. ST/ESA/PAD/SER.E/192.
UNDESA, UN Department of Economic and Social Affairs, and IPU, Inter-Parliamentary Union (2012). World e-Parliament Report 2012. ST/ESA/PAD/SER.E/176.
UN General Assembly (1946). Calling of an International Conference on Freedom of Information. A/RES/59(1).
——— (2000). United Nations Millennium Declaration. A/RES/55/2.
——— (2001). Combating the criminal misuse of information technologies in the great year of the world. para. e. A/RES/55/63.
——— (2014a). The Road to Dignity by 2030: Ending Poverty, Transforming all Lives and Protecting the Planet. Synthesis Report of the Secretary-General on the Post-2015 Sustainable Development Agenda. A/69/700.
——— (2014b). The right to privacy in the digital age. A/RES/69/166.
——— (2014c). Addis Ababa Action Agenda of the Third International Conference on Financing for Development (Addis Ababa Action Agenda). A/RES/69/313.
——— (2015a). Transforming our world: the 2030 Agenda for Sustainable Development. A/RES/70/1.
——— (2015b). Outcome document of the high-level meeting of the General Assembly on the overall review of the implementation of the outcomes of the World Summit on the Information Society. A/RES/70/125.
United Nations (2013). A new global partnership: Eradicate Poverty and Transform Economies

206
REFERENCES
Referen
ces
through Sustainable Development. Report of the High-Level Panel of Eminent Persons on the Post-2015 Development Agenda. pp. 9. [online], available: http://www.un.org/sg/management/pdf/HLP_P2015_Report.pdf. [accessed: 1 November 2015].
——— (2014). A World that Counts: Mobilising the Data Revolution for Sustainable Development. Report prepared by Independent Expert Advisory Group on the Data Revolution for Sustainable Development. available: http://www.undatarevolution.org/wp-content/uploads/2014/11/A-World-That-Counts.pdf. [accessed: 1 November 2015].
——— (2015a). The 2015 Millennium Development Goals Report 2015. pp.61. ISBN 978-92-1-101320-7.
——— (2015b). Interactive dialogue 5: Building effective, accountable and inclusive institutions to achieve sustainable development. 70th Session High Level Week, available: https://papersmart.unmeetings.org/ga/70th-session/70th-session-high-level-week-interactive-dialogue/interactivedialogue5/statements/. [accessed: 1 November 2015].
Van Heeke T., Baxandall P. and Surka M. (2015). ‘Following the Money 2015, How the 50 States Rate in Providing Online Access to Government Spending Data’, U.S. PIRG Education Fund and Frontier Group, [online], available: http://www.uspirg.org/sites/pirg/files/reports/Following%20the%20Money%202015%20vUS.pdf. [accessed: 1 November 2015].
World Bank (2013a). ‘Open Development and Aid Management in Malawi’, [online], available: http://www.worldbank.org/en/news/feature/2013/11/14/open-development-and-aid-management-in-malawi. [accessed: 1 November 2015].
——— (2013b). ‘Open Data in 60 Seconds’, [online], available: http://opendatatoolkit.worldbank.org/en/open-data-in-60-seconds.html. [accessed: 1 November 2015].
——— (2014). ‘Open Data for Economic Growth’, [online], available: http://www.worldbank.org/content/dam/Worldbank/document/Open-Data-for-Economic-Growth.pdf. [accessed: 1 November 2015].
——— (2015). ‘Transport ICT: Open Data for Sustainable Development’, available: http://pubdocs.worldbank.org/pubdocs/publicdoc/2015/8/999161440616941994/Open-Data-for-Sustainable-Development.pdf. [accessed: 1 November 2015].
Wu, Hongbo (2015). “Development cooperation for a new era: Making the renewed global partnership for sustainable development a reality”. Closing statement to the DCF Uganda High-Level symposium, 6 November 2015, Kampala, Department of Economic and Social Affairs, available: https://www.un.org/development/desa/statements/mr-wu/2015/11/dcf-uganda-hl-symposium.html. [accessed: 1 November 2015].

207
E-GOVERNMENT IN SUPPORT OF SUSTAINABLE DEVELOPMENT
Referen
cesChapter 3
Austria Parliament (2014). ‘Petition regarding financial issues of the nation’, [online], available: http://www.parlament.gv.at/PAKT/VHG/XXV/SPET/SPET_00007/imfname_352653.pdf. [accessed 12 November].
Bach, J., Stark, D. and United Nations Research Institute for Social Development (2003). Technology and Transformation: facilitating knowledge networks in Eastern Europe. United Nations Research Institute for Social Development, [online], available: http://www.unrisd.org/80256B3C005BCCF9/(httpPublications)/35352D4B078518C0C1256BDF0049556C?OpenDocument. [accessed: 1 November 2015].
Collins, L., Swart, R. and Zhang, B. (2013). The Rise of Future Finance: The UK Alternative Finance Benchmarking Report. London: Cambridge University and Berkeley University.
De Cindio, F. and Stortone, S. (2013). ‘Experimenting liquidfeedback for online deliberation in civic contexts’. In Electronic Participation (pp. 147-158). Berlin Heidelberg: Springer. ISBN 978-3-642-40346-0.
European Commision (2009). European eParticipation Summary Report , [online], available: https://joinup.ec.europa.eu/community/epractice/document/eu-european-eparticipation-summary report. [accessed: 1 November 2015].
(2010). ‘The European eGovernment Action Plan 2011-2015: Harnessing ICT to promote smart, sustainable & innovative Government’, [online], available: http://eur-lex.europa.eu/LexUriServ/LexUriServ.do?uri=COM:2010:0743:FIN:EN:PDF. [accessed: 30 November 2015].
———(2015a).‘eGovernment Action Plan 2016-2020’, [online], available: http://ec.europa.eu/smartregulation/roadmaps/docs/2016_cnect_006_e_government_action_plan_en.pdf .[accessed 10 December, 2015].
——— (2015b). ‘Digital Agenda in the Europe 2020 Strategy’, [online], available: https://ec.europa.eu/digital-agenda/en/digital-agenda-europe-2020-strategy. [accessed: 30 November 2015].
Fischer, Frank., Gottweis, Herbert (eds) (2012). The Argumentative Turn Revisited: Public Policy as Communicative Practice. Durham and London : Duke University Press. ISBN:978-0-8223-5263-1.
German Parliament (2015) . ‘E-petition System’, [online], available : https://epetitionen.bundestag.de/epet/petuebersicht/mz.nc.html. [accessed 12 November, 2015]
GroundTruth Initiative, LLC (2016). [online], available: http://groundtruth.in/2014/03/25/open-community-collaborative-data-for-land-rights-and-tenure [accessed 30 November, 2015].
Jarmo Eskelinen, Ana García Robles, Ilari Lindy, Jesse Marsh, Arturo Muente-Kunigami (2015). Citizen-Driven Innovation: A guidebook for city mayors and public administrators. Written in a collaboration between the World Bank and the European Network of Living Labs, [online] , available : http://openlivinglabs.eu/sites/enoll.org/files/Citizen_Driven_Innovation_Full%284%29.pdf. [accessed 20 November, 2015].
Lee, D., Loutas, N., Sanchez-Nielsen, E., Mogulkoc, E. and O. Lacigova (2011). ‘Inform-Consult-Empower: A Three-Tired Approach to eParticipation’ . Electric Participation, pp. 121-132. IFIP International Federation for Information Processing, [online], availeble: http://link.springer.com/chapter/10.1007%2F978-3-642-23333-3_11. [accessed 29 November 2015].

208
REFERENCES
Referen
ces
Macintosh, Ann (2004). ‘Characterizing ‘E-Participation in Policy Making’. In: 37th Annual Hawaii International Conference on System Sciences (HICSS), [online], available : http://www.computer.org/csdl/proceedings/hicss/2004/2056/05/205650117a.pdf. [accessed 1 November 2015]
Macintosh, Ann (2006). eParticipation in policy-making. The research and the challenges, exploiting the knowledge economy: issues, applications, case studies. Amsterdam: IOS Press.
Obi, T. (2010). The Innovative CIO and E-participation in E-government Initiatives (Vol. 3), IOS Press. ISBN: 9781607505044.
OECD, Organisation for Economic Co-operation and Development (2001). Citizens as Partners: Information, Consultation and Public Participation in Policy-making. ISBN 92-64-19540-8 – No. 52151.
——— (2004). Promise and Problems of e-Democracy: Challenges of Online Citizen Engagement. Paris: OECD. ISBN: 9789264019485.
——— (2014). ‘Recommendation of the Council on Digital Government Strategies Recommendation of the Council on Digital Government Strategies’, [online], available:http://www.oecd.org/gov/public-innovation/Recommendation-digital-government-strategies.pdf. [accessed: 30 November 2015].
OSMF, OpenStreetMap Foundation (2015). [online], available: http://www.openstreetmap.org . [accessed 30 November, 2015].
Panopoulou, Eleni, Tambouris, Efthimios, Tarabanis, Konstantinos (2009). ‘eParticipation initiatives: How is Europe progressing? ’, European Journal of ePractice, No. 7, March 2009, [online], available: http://www.epractice.eu/files/7.2.pdf. [accessed : 30 November 2015].
Sen, Amartaya, (2004). Rationality and freedom. Cambridge, MA: The Belknap Press of Harvard University Press, p 289.
UK Parliament, House of commons Procedure Committee (2014). ‘E–petitions: a collaborative system’. Third Report of Session 2014–15, December 2014: pp 4. London: The Stationery Office.
UNDESA, UN Department of Economic and Social Affairs (2012a). UNTT Report to the Secretary- General: Realizing the Future We Want For All, [online] ,available : http://www.un.org/en/development/desa/policy/untaskteam_undf/.[accessed: 1 November 2015].
——— (2012b). ‘Promoting people’s empowerment in achieving poverty eradication, social integration and productive and decent work for all’, Report of the Expert Group Meeting. [online], available : http://www.un.org/esa/socdev/csocd/2013/egm-empowerment-final.pdf. [accessed 25 January 2016].
——— (2013). DPADM Concept paper ‘Developing capacity for participatory governance through e-participation’, [online], available: http://workspace.unpan.org/sites/internet/Documents/CONCEPT%20PAPER%20e-Participation%2001.30.13.pdf. [accessed: 1 November 2015].
——— (2014). United Nations E-government Survey 2014: E-Government For the Future We Want. ISBN 978-92-1-123198-4.

209
E-GOVERNMENT IN SUPPORT OF SUSTAINABLE DEVELOPMENT
Referen
ces
——— (2015). MDG Gap Task Force Report 2015: Taking Stock of the Global Partnership for Development. ISBN: 978-92-1-101317-7.
——— (2016).‘Overview of the Report on the World Social Situation 2016’, [Online], available:http://www.un.org/esa/socdev/documents/2016/RWSS2016ExecutiveSummary.pdf. [accessed 1 November 2015] .
UNECE, The United Nations Economic Commission for Europe (1998). ‘Convention on Access to Information, Public Participation in Decision-Making and Access to Justice in Environmental Matters’.[online ], available http://live.unece.org/env/pp/treatytext.html. [accessed 30 November 2015].
UN ECOSOC, United Nations Economic and Social Council (2013). ‘Promoting people’s empowerment in achieving poverty eradication, social integration and productive and decent work for all’, [online], available: http://www.un-ngls.org/IMG/pdf/CsocD_report.pdf. [accessed: 1 November 2015].
UN General Assembly (1995). Report of the World Summit for Social Development. A/CONF.166/9.
——— (2015a). Addis Ababa Action Agenda. The Third International Conference on Financing for Development. A/RES/69/313.
——— (2015b). The 2030 Agenda for Sustainable Development. A/RES/70/1.
——— (2015c). Promoting inclusive and accountable public services for sustainable development. A/RES/69/327.
Witters, L., Marom, R. and Steinert, K. (2012). ‘The role of public-private partnerships in driving innovation’. The Global Innovation Index.
World Bank, Information for Development Program (2013). ‘Crowdfunding’s Potential for the Developing World’, [online], available: http://infodev.org/infodev-files/wb_crowdfundingreport-v12.pdf. [accessed: 1 November 2015].
World Bank, World Development Report 2016, “Digital Dividends”.

210
REFERENCES
Referen
ces Chapter 4
Abi Research Inc (2016). [Online], available: https://www.abiresearch.com/press/more-than-30-billion-devices-will-wirelessly-conne/ [last accessed on 22 January, 2016].
Anderson. J, and Lee, R (2014). ‘Main Report: An In-depth Look at Expert Responses’, Washington: Pew Research Center on internet, science and technology, [Online], available: http://www.pewinternet.org/files/2014/05/PIP_Internet-of-things_0514142.pdf. [accessed 21 January 2016].
Andrew G., Rohit R. and Thongchie S. (2014). ‘Coordinates for change: how GIS technology and geospatial analytics can improve city services’, [online], available: http://www.mckinsey.com/client_service/public_sector/latest_thinking/government_designed_for_new_times. [accessed: 22 January, 2016].
Alan B., Mark T., Jerry F. (2014). Digitizing Government: Understanding and implementing new digital business models, [online], available: http://www.palgrave.com/us/book/9781137443625 [last accessed on 22 January, 2016].
Anthony Wilhelm, A. G. (2004). Digital nation: toward an inclusive information society. Cambridge: MIT Press, [Online], available: https://mitpress.mit.edu/books/digital-nation [accessed: 22 January, 2016].
Aker, J and Fafchamps, M. (2010). ‘How does Mobile Phone Coverage affect Farm-Gate prices? Evidence from West Africa’, [online], available: http://web.stanford.edu/~fafchamp/mobiles.pdf . [accessed: 22 January, 2016].
Byrnjolfsson E and Andrew. M. (2014). The Second machine age (hard copy) ISBN-13: 978-0393239355.
Comin, D. and Bart H. (2011). ‘Technology Diffusion and Postwar Growth’, NBER Macroeconomics Annual 2010 ,Volume 25: 209-246, [online], available: http://www.nber.org/chapters/c12030 [accessed: 22 January, 2016].
Comin, D. and Marti M. (2014). ‘If Technology Has Arrived Everywhere, Why Has Income Diverged?’, NBER Macroeconomics Annual 2014, [online], available: http://www.wipo.int/edocs/mdocs/mdocs/en/wipo_ip_econ_ge_2_14/wipo_ip_econ_ge_2_14_ref_comin.pdf. [ accessed: 22 January, 2016].
Perez, C. (2004). Technological revolutions, paradigm shifts and socio-institutional change, [online], available: http://econpapers.repec.org/bookchap/elgeechap/1570_5f7.htm [accessed: 22 January 2016].
E.Reinert ed.(2004). Globalization, Economic Development and Inequality: An alternative Perspective. Cheltenham: Edward Elgar, pp. 217-242. ISBN: 1 85898 891 8, [online], available: http://www.elgaronline.com/view/9781858988917.xml [accessed: 22 January, 2016].
European Commission, Information Society and Media (2014). ‘EU-China Joint White Paper on Internet-of-Things Identification, European Research Cluster on the Internet of Things’, [online], available: http://www.internet-of-things-research.eu/documents.htm. [accessed: 22 January, 2016].
European Commission Internet-of-things-research (2016). IERC-European Research Cluster on the Internet of Things. [online], available : http://www.iot-a.eu/public/news/resources/EC_WS%20IOTA-IERC_Friess_291110.pdf. [accessed: 22 January, 2016].

211
E-GOVERNMENT IN SUPPORT OF SUSTAINABLE DEVELOPMENT
Referen
ces
European Commission (2015). ‘Strategy Paper on a Digital Single Market’, [online], available: http://ec.europa.eu /priorities/digital-single-market/. [accessed: 22 January, 2016].
Gartner Research, Inc (2013). [Online], available: http://www.gartner.com/newsroom/id/2636073. [accessed: 22 January, 2016].
GCC, Gulf Cooperation Council, e-Government Committee (2016). http://gccegov.org/en/web/guest/news_details?id=158305. [accessed: 27 January 2016].
Goya, Aparatija (2009). ‘Policy Research working paper 5315’, [online], available: http://web.worldbank.org/archive/website01291/WEB/IMAGES/WPS5315.TXT. [accessed: 1 November 2015].
Govdelivery (2013). ‘The Transformative Power of Communications: Digital Communication Management for the Public Sector’. [online], available: http://www.govdelivery.com/pdfs/WP_DCM_power_of_communications.pdf. [accessed: 1 November 2015].
Guerrieri and Padoan (2007). ‘Evaluation Models And Tools For Assessment Of Innovation And Sustainable Development At The EU Level’, [online], available: https://ec.europa.eu/research/evaluations/pdf/archive/fp6-evidence-base/evaluation_studies_and_reports/evaluation_studies_and_reports_2006/evaluation_models_and_tools_for_assessment_of_innovation_and_sustainable_development_at_eu_level__2006.pdf. [accessed: 22 January, 2016].
OECD, The Organisation for Economic Co-operation and Development (2012). Report on Policies to Support Women’s Entrepreneurship Development in the MENA Region, [online], available: http://www.oecd-ilibrary.org/industry-and-services/women-in-business/public-policy-and-women-s-entrepreneurship-in-the-mena-region_9789264179073-6-en. [accessed: 22 January 2016].
OFCOM (2015). ‘Independent Regulator and Competition Authority of the United Kingdom and Northern Ireland Report’, [online], available: http://stakeholders.ofcom.org.uk/market-data-research/market-data/infrastructure/connected-nations-2015/. [accessed: 1 November 2015].
Hafkin, N.J. and Huyer, S. (2006). Cinderella or cyberella? Empowering women in the knowledge society. Kumarian Press, ISBN: 1565492196, 220 pp. (abstract online – hard copy) http://www.jstor.org/stable/25548239?seq=1#page_scan_tab_contents [accessed: 22 January 2016].
Helbig, Gil-Garcia and Ferro (2005). ‘Understanding the complexity of electronic government: implications from the digital divide literature’, [online], available: http://www.enricoferro.com/amcis2005_final.pdf [accessed: 22 January, 2016].
Hilbert, M. (2011). ‘The end justifies the definition: The manifold outlooks on the digital divide and their practical usefulness for policy-making’, Telecommunications Policy, 35(8), pp.715-736. http://www.sciencedirect.com/science/journal/03085961/35/8.
Hilbert, M. (2011). ‘Digital gender divide or technologically empowered women in developing countries? A typical case of lies, damned lies, and statistics’, Women’s Studies International Forum 34 (6). pp. 479-489 http://www.sciencedirect.com/science/journal/02775395/34/6. [accessed: 22 January 2016].
Hana, Nagy (2010). Transforming government and building the information society, challenges and opportunities for developing countries. (Hard copy) http://www.springer.com/fr/book/9781441911841
212
REFERENCES
Referen
ces
Hana, Nagy (2010). Enabling Enterprise Transformation: Businesses and Grassroots Innovation for Knowledge Economy, [online], available: http://www.springer.com/us/book/9781441915078 [accessed: 22 January 2016].
Japan, Government Portal (2016). http://www.data.go.jp/?lang=english. [accessed: 27 January 2016].
Takashi, Y &Megumi, M (2006). ‘The impacts of mobile phone coverage expansion on market participants –panel data evidence from Uganda’, [online], available: https://www.researchgate.net/publication/46507255_The_Impact_of_Mobile_Phone_Coverage_Expansion_on_Market_Participation_Panel_Data_Evidence_from_Uganda . [accessed: 22 January, 2016].
Kaliannan M., Murali R., and Magiswary D. (2010). ‘Assessing E-Government Services: The Case Of E-Filing Of Personal Income Tax In Malaysia’, In Citizens and E-Government: Evaluating Policy And Management. [Online], available: http://www.irma-international.org/viewtitle/42564/. [accessed: 22 January 2016].
Klapper, Degado and Lewin (2009). ‘The impacts of business environment on the business creation processes’, [online], available: http://papers.ssrn.com/sol3/papers.cfm?abstract_id=1407955. [accessed: 22 January 2016].
Norris, Pipa (2002). ‘Digital Divide Civic Engagement, Information Poverty and the Internet Worldwide [online], available: http://www.cambridge.org/US/academic/subjects/politics-international-relations/comparative-politics/digital-divide-civic-engagement-information-poverty-and-internet-worldwide. [accessed: 22 January 2016].
International Privacy Conference, Data protection Office (2014). ‘Mauritius Declaration on the Internet of Things and data protection’, [online], available: http://www.privacyconference2014.org/media/16596/Mauritius-Declaration.pdf. [accessed: 1 November 2015].
Mehra al. (2004). ‘The internet for empowerment of minority and marginalized users’, Sage Publications London, Thousand Oaks, CA and New Delhi Vol 6(6):781–802. [Online], available: http://citeseerx.ist.psu.edu/viewdoc/download?doi=10.1.1.115.4911&rep=rep1&type=pdf . [accessed: 1 November 2015].
McKinsey & Company (2014). Government designed for new time .Volume 2. [Online], available: http://www.mckinsey.com/client_service/public_sector/latest_thinking/government_designed_for_new_times. [accessed: 1 November 2015].
McKinsey&Company (2011). System Analysis and Design: People, processes and projects. ISBN-13: 978-0765623539.
Radikati Group (2015). Email Statistics Report, 2015-2019. [Online], available: http://www.radicati.com/wp/wp-content/uploads/2015/02/Email-Statistics-Report-2015-2019-Executive-Summary.pdf. [accessed: 22 January 2016].
Reddick, Christopher (2010). Citizens and E-Government: Evaluating Policy and Management , [online], available : http://www.irma-international.org/book/citizens-government-evaluating-policy-management/37314/. [accessed: 22 January, 2016].
Korea (2016). Government portal ‘Government 3.0’, [online], available: http://www.gov30.go.kr/gov30/index.do. [accessed: 27 January 2016].

213
E-GOVERNMENT IN SUPPORT OF SUSTAINABLE DEVELOPMENT
Referen
ces
Servon, Lisa (2002). ‘Bridging Digital Divide: Technology, Community and Public Policy’, New School University, [online], available: http://www.newschool.edu/uploadedFiles/Milano/Academics/Faculty/bridgingthegap.pdf?n=7981.[accessed: 22 January 2016]
Vermessan & Friess, (2015). ‘Building the Hyper-connected Society: Internet of Things Research and Innovation Value Chains, ecosystems and markets’, [online], available: http://www.internet-of-things-research.eu/pdf/Building_the_Hyperconnected_Society_IERC_2015_Cluster_eBook_978-87-93237-98-8_P_Web.pdf. [accessed: 22 January 2016].
Wilhelm, A. G. (2004). Digital nation: toward an inclusive information society. Cambridge: MIT Press. [online], available: https://mitpress.mit.edu/books/digital-nation [accessed: 22 January 2016].
UN General Assembly (2015). ‘Outcome document of the high-level meeting of the General Assembly on the overall review of the implementation of the outcomes of the World Summit on the Information Society’, 15-21917 (E) 151215. [online], available: http://workspace.unpan.org/sites/Internet/Documents/UNPAN95735.pdf. [accessed: 1 November 2015].
UN-GGIM, United Nations Committee of Experts on Global Geospatial Information management (2014).Beijing Declaration,[online], available:http://ggim.un.org/docs/meetings/3rd%20H OFCOM LF/Beijing% OFCOM 20Declaration%2024Oct2014%20FINAL.pdf. [accessed: 22 January 2016].
World Bank (2008). ‘New Data on New Business Creation in 100 Countries’, [online], available: http://econ.worldbank.org/external/default/
World Bank (2016). World Development Report 2016: Digital Dividends, [online], available: http://www.worldbank.org/en/publication/wdr2016. [accessed 12 January 2016].
ITU, International Telecommunication Union (2012a). Recommendation ITU-T Y. 2060- Overview of the Internet of Things, http://www.itu.int/ITU-T/recommendations/rec.aspx?rec=Y.2060.
———(2012b) Measuring the Information Society. [Online], available: https://www.itu.int/en/ITU-D/Statistics/Documents/BroadbandCommissionpublications/mis2012/MIS2012_without_Annex_4.pdf [accessed: 22 January, 2016].
———(2014) The State of Broadband 2014: broadband for all. ISBN 978-92-61-150716. [online], Available: http://www.broadbandcommission.org/documents/reports/bb-annualreport2014.pdf. [accessed: 1 November 2015].
———(2015) Figures and facts: The World in 2015, [online], available: https://www.itu.int/en/ITU-D/Statistics/Documents/facts/ICTFactsFigures2015.pdf. [accessed: 22 January 2016].
ITU, International Telecommunication Union and UNESCO, United Nations Educational, Scientific and Cultural Organization (2015). The State of Broadband 2015, [online], available: http://www.broadbandcommission.org/documents/reports/bb-annualreport2015.pdf. [accessed: 1 November 2015].

214
REFERENCES
Referen
ces Chapter 5
Agcopra, Therese (2015). ‘South Korea to Move 750 E-Government Services to loud Computing by 2017 for Improved and Cost-Efficient Public Service’, Korea Portal, available: http://en.koreaportal.com/articles/4349/20151113/south-korea-move-750-e-government-services-cloud-computing-2017.htm. [accessed: 1 December 2015].
Berriman, Frances (2012). ‘Using HTML5 for Gov.UK’, Blog, Government Digital Service, United Kingdom, [online], available: https://gds.blog.gov.uk/2012/02/10/using-html5-for-gov-uk/. [accessed 1 November 2015].
Christensen, Clayton M. (1995). The Innovator’s Dilemma: When New Technologies Cause Great Firms to Fail. Boston, Massachusetts: Harvard Business Review Press.
Dunlevy, Fiona (2015). ‘Crowdsourcing France’s New Digital Law’, Euro Scientist, [online], available: http://www.euroscientist.com/crowdsourcing-frances-new-digital-law/. [accessed: 30 November 2015].
Estonian ICT Demo Center (2012). ‘E-Estonia - the Digital Society’, e-estonia.com, [online], available: https://ccdcoe.org/cycon/2012/workshops/e-Estonia_03.2012.pdf. [accessed: 1 November 2015].
European Commission (2015). ‘Digital Agenda in the Europe 2020 Strategy’, [online], available: https://ec.europa.eu/digital-agenda/en/digital-agenda-europe-2020-strategy. [accessed: 30 November 2015].
Foreshew-Cain, Stephen (2015). ‘How Digital and Technology Transformation Saved £1.7bn Last Year’, Blog, Government Digital Service, United Kingdom, [online], available: https://gds.blog.gov.uk/2015/10/23/how-digital-and-technology-transformation-saved-1-7bn-last-year/. [accessed: 1 November 2015].
GCC, Gulf Cooperation Council (2015). ‘About the GCC Egovernment Award’, The Portal of the Cooperation Council for the Arab States of the Gulf, [online], available: http://gccegov.org/en/web/guest/award. [accessed: 1 November 2015].
Government of Bangladesh (2015). Statement delivered by H.E. Mrs. Sheikh Hasina, Prime Minister, Bangladesh, at the 68th Session of the United Nations General Assembly, September 2013.
Government of Barbados, Data Processing Department (2015). ‘Big - Barbados Integrated Government’, [online], available: https://www.gov.bb/home/?p=home. [accessed: 1 November 2015].
Government of China, Zhejiang Government Affairs Service (2015). ‘Zhejiang One-Stop Portal’. Zhejiang Government, [online], available: http://www.zjzwfw.gov.cn/. [accessed: 1 November 2015].
Government of Ethiopia, Ministry of Communication and Information Technology (2015). ‘The Ethiopian E-Government Strategy’, [online], available: http://www.mcit.gov.et/web/english/egovernment-strategy. [accessed: 1 November 2015].
Government of Dominica, Information and Communication Technology Unit, Establishment Personnel and Training Department (2015a). ‘Government of Dominica Internal Directory Mobile App’, [online], available: https://play.google.com/store/apps/details?id=ict.unit.dominicagid&hl=en. [accessed: 1 November 2015].

215
E-GOVERNMENT IN SUPPORT OF SUSTAINABLE DEVELOPMENT
Referen
ces
Government of Dominica (2015b). ‘Online Sevices, Government of the Commonwealth of Dominica’, Web Portal, [online], available: http://www.dominica.gov.dm/services. [accessed: 1 November 2015].
GovInsider (2015). ‘Malaysia closing half of all government websites: government looking to provide citizens with easier access to digital services’, [online], available: https://govinsider.asia/digital-gov/malaysia-to-shut-down-750-government-websites/. [accessed: 1 November 2015].
Iglauer, Philip (2015). ‘South Korea to Move 60% of E-Government Services to Cloud by 2017’, ZDNet, 10 November 2015, [online], available: http://www.zdnet.com/article/south-korea-to-move-60-of-e-government-services-to-cloud-by-2017/. [accessed: 30 November 2015].
ITU, International Telecommunication Union (2015). Measuring the Information Society Report 2015. ISBN 978-92-61-15791-3.
Lee, Young Bum (2014). E-Government for Promoting Sustainable Development in Small Island Developing States (SIDS) - Background Paper for the Special Event of the 69th Session of the United Nations General Assembly Second Committee, [online], available: http://workspace.unpan.org/sites/Internet/Documents/UNPAN93784.pdf [accessed: 1 November 2015].
Ming A., Awan O. and Somani N. (2013). E-Governance in Small States. London: Commonwealth Secretariat.
Ndilula, Ndeshipanda C.(2015). ‘Namibia: The E-Government Project - a Reform Initiative’, AllAfrica, 6 November 2015, [online], available: http://allafrica.com/stories/201511061580.html. [accessed: 15 November 2015].
Partnership on Measuring ICT for Development (2014). Final WSIS Targets Review: Achievements, Challenges and the Way Forward. [online], available: http://www.itu.int/en/ITU-D/Statistics/Documents/publications/wsisreview2014/WSIS2014_review.pdf. ISBN 978-92-61-14871-3 [accessed: 1 November 2015].
Pop, Valenitna (2015). ‘Interview of Andrus Ansip: You can’t use 18th century law for a digital world’, EUobserver,26 February 2015, [online], available: https://euobserver.com/economic/127800. [accessed: 1 November 2015].
Schwab K. and Sala-i-Martín X. (2015). The Global Competitiveness Report 2015-2016. Geneva: World Economic Forum. ISBN-13: 978-92-95044-99-9. [online], available: http://www3.weforum.org/docs/gcr/2015-2016/Global_Competitiveness_Report_2015-2016.pdf. [accessed: 1 November 2015].
The White House, United States (2009). ‘Remarks by the President on Securing Our Nation’s Cyber Infrastructure’, [online], available: http://www.whitehouse.gov/the-press-office/remarks-president-securing-our-nations-cyber-infrastructure. [accessed: 15 November 2015].
Transparency International (2014). ‘2014 Corruption Perception Index’, Transparency International, [online], available: https://www.transparency.org/cpi2014. [accessed: 1 November 2015].
UN General Assembly (2011). Programme of Action for the Least Developed Countries for the Decade 2011-2020, Istanbul, May 2011. A /CONF.219/3/Rev.1.
——— (2014a). Promoting Inclusive and Accountable Public Services for Sustainable Development. A/RES/69/327.

216
REFERENCES
Referen
ces
——— (2014b). Follow-up to the Fourth United Nations Conference on the Least Developed Countries. A/RES/69/231.
——— (2014c). SIDS Accelerated Modalities of Action (Samoa) Pathway. A/RES/69/15.
——— (2014c). Addis Ababa Action Agenda of the Third International Conference on Financing for Development (Addis Ababa Action Agenda). A/RES/69/313.
——— (2015a). The 2030 Agenda for Sustainable Development. A/RES/70/1.
——— (2015b). Outcome Document of the High-Level Meeting of the General Assembly on the Overall Review of the Implementation of the Outcomes of the World Summit on the Information Society. A/RES/70/125.
UNDESA, UN Department of Economic and Social Affairs, and ASPA, American Society for Public Administration (2002). Benchmarking E-Government: A Global Perspective - Assessing the progress of the UN Member States.
UNDESA, UN Department of Economic and Social Affairs (2001). ‘3rd Global Forum on Reinventing E-Government’, [online], available: https://publicadministration.un.org/en/3rdglobalforum. [accessed: 30 November 2015].
——— (2003). World Public Sector Report: E-Government at the Crossroads. ST/ESA/PAD/SER.E/49.
——— (2004). United Nations Global E-Government Readiness Report 2004 : Towards Access for Opportunity.
——— (2005). United Nations Global E-Government Readiness Report 2005: From E-Government to E-Inclusion. ST/ESA/PAD/SER.E/90.
——— (2008). United Nations E-Government Survey 2008: From E-Government to Connected Governance. ST/ESA/PAD/SER.E/112.
——— (2010). United Nations E-Government Survey 2008: Leveraging E-Government at a Time of Financial and Economic Crisis. ST/ESA/PAD/SER.E/131.
——— (2012). United Nations E-Government Survey 2012: E-Government for the People. ST/ESA/PAS/SER.E/150.
——— (2014). United Nations E-Government Survey 2014: E-Government for the Future We Want. ST/ESA/PAD/SER.E/188
——— (2015a). Report of the Expert Group Meeting: E-Government for Sustainable Development. Division for Public Administration and Development Management, UNDESA, 16-17 March 2015. ST/ESA/PAD/SER.E/205.
——— (2015b). World Population 2015 Wallchart. [online], available: http://esa.un.org/unpd/wpp/Publications/Files/World_Population_2015_Wallchart.pdf. ST/ESA/SER.A/378.
UNDP, United Nations Development Programme (2015). 2015 Human Development Report. ISBN 978-92-1-126398-5.

217
E-GOVERNMENT IN SUPPORT OF SUSTAINABLE DEVELOPMENT
Referen
ces
UNECA, United Nations Economic Commission for Africa (2014). Manual for Measuring E-Government, [online], available: https://www.itu.int/en/ITU-D/Statistics/Documents/partnership/eGovernment_Manual_Final_2014.pdf. [accessed: 1 November 2015].
UN General Assembly (2011). Programme of Action for the Least Developed Countries for the Decade 2011-2020 . A/CONF.219/3/Rev.1.
——— (2014a). Promoting Inclusive and Accountable Public Services for Sustainable Development. A/RES/69/327.
——— (2014b). Follow-up to the Fourth United Nations Conference on the Least Developed Countries. A/RES/69/231.
——— (2014c). SIDS Accelerated Modalities of Action (Samoa) Pathway. A/RES/69/15.
——— (2014c). Addis Ababa Action Agenda of the Third International Conference on Financing for Development (Addis Ababa Action Agenda). A/RES/69/313.
——— (2015a). The 2030 Agenda for Sustainable Development. A/RES/70/1.
——— (2015b). Outcome Document of the High-Level Meeting of the General Assembly on the Overall Review of the Implementation of the Outcomes of the World Summit on the Information Society. A/RES/70/125.
United Nations (2003). Geneva Plan of Action. World Summit on the Information Society, [online], available: http://www.itu.int/net/wsis/docs/geneva/official/poa.html,WSIS-03/Geneva/Doc/5-E. [accessed: 1 November 2015].
——— (2015). WSIS-SDG Matrix: Linking WSIS Action Lines with Sustainable Development Goals. Geneva: WSIS Forum, 25-29 May 2015.
Verhulst S. (2012). ‘UK Government: Digital by Default’, Govlab, [online], available: http://thegovlab.org/uk-government-digital-by-default/. [accessed: 1 November 2015].
Vietnamnet Bridge (2015). ‘E-Government Status and Future Actions’, [online], available: http://english.vietnamnet.vn/fms/government/144912/e-government-status-and-future-actions.html. [accessed: 1 November 2015].
World Bank (2015). ‘Definition of E-Government’, [online], available: http://web.worldbank.org/WBSITE/EXTERNAL/TOPICS/EXTINFORMATIONANDCOMMUNICATIONANDTECHNOLO-GIES/EXTEGOVERNMENT/0,,contentMDK:20507153~menuPK:702592~pagePK:148956~piP-K:216618~theSitePK:702586,00.html. [accessed: 1 November 2015].
World Bank (2015). ‘Estonia ICT Day, Smart Digital Solutions for Sustainable Development’, [online], available: http://www.worldbank.org/en/events/2015/09/28/Estonia-ict-day-2#1. [accessed: 1 November 2015].
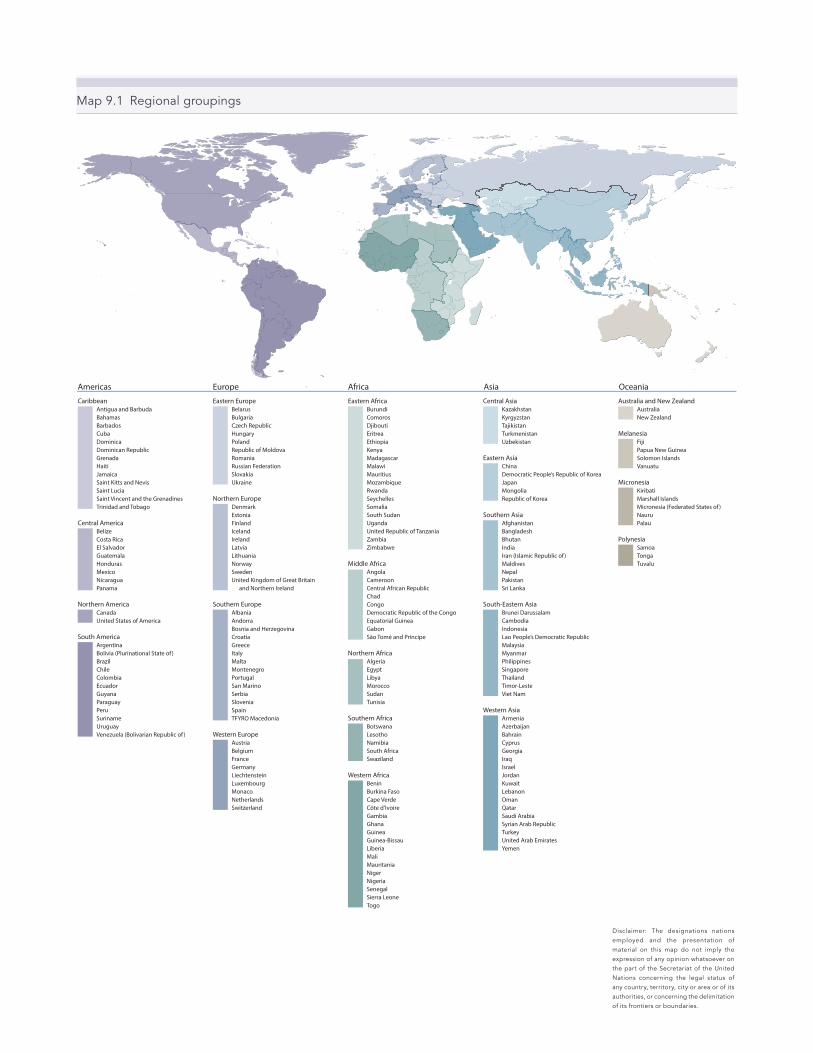
Map 9.1 Regional groupings
CaribbeanAntigua and BarbudaBahamasBarbadosCubaDominicaDominican RepublicGrenadaHaitiJamaicaSaint Kitts and NevisSaint LuciaSaint Vincent and the GrenadinesTrinidad and Tobago
Central AmericaBelizeCosta RicaEl SalvadorGuatemalaHondurasMexicoNicaraguaPanama
Northern AmericaCanadaUnited States of America
South AmericaArgentinaBolivia (Plurinational State of )BrazilChileColombiaEcuadorGuyanaParaguayPeruSurinameUruguayVenezuela (Bolivarian Republic of )
Eastern AfricaBurundiComorosDjiboutiEritreaEthiopiaKenyaMadagascarMalawiMauritiusMozambiqueRwandaSeychellesSomaliaSouth SudanUgandaUnited Republic of TanzaniaZambiaZimbabwe
Middle AfricaAngolaCameroonCentral African RepublicChadCongoDemocratic Republic of the CongoEquatorial GuineaGabonSão Tomé and Príncipe
Northern AfricaAlgeriaEgyptLibyaMoroccoSudanTunisia
Southern AfricaBotswanaLesothoNamibiaSouth AfricaSwaziland
Western AfricaBeninBurkina FasoCape VerdeCôte d’IvoireGambiaGhanaGuineaGuinea-BissauLiberiaMaliMauritaniaNigerNigeriaSenegalSierra LeoneTogo
Central AsiaKazakhstanKyrgyzstanTajikistanTurkmenistanUzbekistan
Eastern AsiaChinaDemocratic People’s Republic of KoreaJapanMongoliaRepublic of Korea
Southern AsiaAfghanistanBangladeshBhutanIndiaIran (Islamic Republic of )MaldivesNepalPakistanSri Lanka
South-Eastern AsiaBrunei DarussalamCambodiaIndonesiaLao People’s Democratic RepublicMalaysiaMyanmarPhilippinesSingaporeThailandTimor-LesteViet Nam
Western AsiaArmeniaAzerbaijanBahrainCyprusGeorgiaIraqIsraelJordanKuwaitLebanonOmanQatarSaudi ArabiaSyrian Arab RepublicTurkeyUnited Arab EmiratesYemen
Australia and New ZealandAustraliaNew Zealand
MelanesiaFijiPapua New GuineaSolomon IslandsVanuatu
MicronesiaKiribatiMarshall IslandsMicronesia (Federated States of )NauruPalau
PolynesiaSamoaTongaTuvalu
Eastern EuropeBelarusBulgariaCzech RepublicHungaryPolandRepublic of MoldovaRomaniaRussian FederationSlovakiaUkraine
Northern EuropeDenmarkEstoniaFinlandIcelandIrelandLatviaLithuaniaNorwaySwedenUnited Kingdom of Great Britain and Northern Ireland
Southern EuropeAlbaniaAndorraBosnia and HerzegovinaCroatiaGreeceItalyMaltaMontenegroPortugalSan MarinoSerbiaSloveniaSpainTFYRO Macedonia
Western EuropeAustriaBelgiumFranceGermanyLiechtensteinLuxembourgMonacoNetherlandsSwitzerland
AfricaAmericas Asia OceaniaEurope
Disclaimer: The designations nations employed and the presentation of material on this map do not imply the expression of any opinion whatsoever on the part of the Secretariat of the United Nations concerning the legal status of any country, territory, city or area or of its authorities, or concerning the delimitation of its frontiers or boundaries.
The United Nations E-Government Survey pres-ents a systematic assessment of the use of In-formation and Communication Technologies
(ICTs) to transform the public sector by enhancing its efficiency, effectiveness, transparency, inclusiveness and supporting access to public services and citizen participation. The Survey examines emerging e-gov-ernment issues and trends, and innovative practices that are relevant to the international community. By studying broad patterns of e-government around the world, the Survey assesses the e-government develop-ment status of the 193 United Nations Member States. It serves as a tool for decision-makers to identify their areas of strength and challenges in e-government to inform policies and strategies. It supports countries’ ef-forts to provide inclusive and equitable electronic and mobile services to all and bridge the digital divide.
The 2016 E-Government Survey entitled “E-Govern-ment in Support of Sustainable Development” is is-sued at the time when countries are moving towards localizing and implementing the Sustainable Develop-ment Goals (SDGs). Governments, together with the private sector and civil society, will play a central role in the implementation of the 2030 Agenda for Sustain-able Development. The 2016 Survey provides new evi-dence and new analysis to reflect on the potential of e-government to support the implementation of the Agenda and the 17 SDGs that are at its core. It looks at how e-government can facilitate integrated poli-cies and services across the three dimensions of sus-tainable development; it highlights how opening up government data can promote effective, accountable
and transparent institutions; it examines how e-partic-ipation can strengthen participatory decision-making and service delivery; it reports on progress made in the provision of electronic and mobile services and focuses on the importance of bridging divides. Overall, the Sur-vey highlights a positive global trend towards higher levels of e-government development as countries in all regions are increasingly embracing innovation and utilizing ICTs to deliver services and engage people in decision-making processes. It underscores that one of the most important new trends is the advancement of people-driven services, i.e. services that reflect peo-ple’s needs and are driven by them. At the same time, disparities remain within and among countries. Lack of access to technology, poverty and inequality prevent people from fully taking advantage of the potential of ICTs and e-government for sustainable development. For e-government to effectively support the implemen-tation of the SDGs, it will need to be guided by the principles and goals of the 2030 Agenda. It is essen-tial to ensure that the overarching objective of poverty eradication and “Leaving No One Behind”, a key prin-ciple of the 2030 Agenda, are at the core of all efforts to mobilize ICT to realize the transformation the 2030 Agenda demands.
The United Nations E-Government Survey is a product of the United Nations Department of Economic and Social Affairs. The Department, through its Division for Public Administration and Development Management, has published this world report on e-government since 2003 and is regularly called upon to provide its exper-tise on how to expand the use of information and com-munication technologies in government to advance the internationally-agreed development goals.
ISBN 978-92-1-123205-9
15-1
3183
EE-GOVEVEVEVEVEVEVEERNMRNMRNMR ENTNTENTNTNNTNNE IN SUSUSUPPOPPPPPPP RT OF OFOFOOFO SUSTAIAIAIAA NABNABN LELE DDEVDED ELOOPMEPP NT