Embed Size (px)
Citation preview
Ultrasonic tomography of grouted duct post-tensioned reinforced concretebridge beams
J. Martina, K.J. Broughtonb, A. Giannopolousb, M.S.A. Hardyb, M.C. Fordeb,*aOve Arup & Partners, Coventry, England, UK
bSchool of Civil Engineering, University of Edinburgh, The Kings Buildings, Edinburgh EH9 3JN, UK
Abstract
Some concern exists over the safety and durability of the 600 post-tensioned bridges in the UK, and the much larger number worldwide.The objective of the work reported herein was to identify voiding in the metallic tendon ducts in these bridges. Voiding can give rise to twosets of problems: (a) possible ingress of chlorides, which would cause corrosion; and (b) a lack of redistribution of stress within the beam. Itwas against this background that it was important to first of all identify the extent of voiding in post-tensioned bridges.
The new technique of ultrasonic tomography was used for the trials reported in this paper. Two test beams were examined: a 10 m longbeam at the Transport Research Laboratory (TRL), Crowthorne, UK and a short test beam constructed at Stanger Science and Environment,Elstree, UK. The ducts in the TRL beam were 40 mm in diameter. This is smaller than would normally be encountered in a post-tensionedbridge beam. A more usual duct diameter would be 100–110 mm with a cover of around 125 mm. The second test beam at Stanger Scienceand Environment, Elstree contained 100-mm diameter ducts.
The time-of-flight tomography data obtained demonstrated that it is a potentially highly successful method of investigating post-tensionedconcrete beams. The method is somewhat time consuming and so should be used in conjunction with a simpler testing method, e.g. sonicimpact-echo, which identifies areas of interest. The smaller the ducts to be investigated, the smaller the required distances between testingstations. This therefore significantly increases the testing time.q 2001 Published by Elsevier Science Ltd.
Keywords: Post-tensioned concrete; Bridges; Ducts; Voids; Ultrasonic; Tomography
1. Introduction
Some concern has emerged over the safety and durabilityof the 600 post-tensioned bridges in the UK, leading to atemporary moratorium on the construction of new post-tensioned concrete bridges [1]. Concern followed thecollapse of a rail bridge [2]; a foot bridge in the UK and amajor highway bridge in Belgium; the Belgian road bridgeresulted in some loss of life. There are basically two types ofpost-tensioned road bridge in the UK: cast in situ concretepost-tensioned road bridges and precast segmental bridgeswith cast-in-situ joints [3]. Considerable difficulties havearisen in terms of inspection techniques for these structures.Visual inspection has proved inadequate as the strain priorto collapse is low [4].
Post-tensioned concrete bridges were constructed fromthe 1960s onwards in the UK with a 120-year design life.In the 1960s, concrete bridges were perceived to be main-tenance free. However faults in design and supervision,
particularly in relation to tendon duct grouting togetherwith increased traffic loads and a lack of understanding ofdurability issues related to chloride ingress, have led toconcern about the safety of these structures.
2. Problems with post-tensioned bridges
The principal problem with post-tensioned bridges iscorrosion of the tendons, which can give rise to lack ofcross-sectional area, increased stress in the remainingtendons and failure. This problem can be brought on bylack of grout in the tendon ducts. This risk was seen asless worrying in the UK bridge stock as it was consideredthat failure of an individual strand would result in the redis-tribution of the stress to the other strands; failure in anindividual cable would result in a redistribution of stressesto other cables. In addition, failure of a cable at one locationwas perceived as a partial problem due to the fact that thestress would be transferred via the grouting to the rest of thebeam.
Where the voided duct contains a tendon, which issmeared in grout, thus preventing corrosion at that particular
NDT&E International 34 (2001) 107–113
0963-8695/01/$ - see front matterq 2001 Published by Elsevier Science Ltd.PII: S0963-8695(00)00035-9
www.elsevier.com/locate/ndteint
* Corresponding author. Tel:144-131-650-5721; fax:144-131-452-8596.
E-mail address:[email protected] (M.C. Forde).
point, it still leaves the problem that if the tendon fails at adifferent location, the stresses cannot be redistributed fully.
However, more recent work [5] involving examination ofthe post-tensioned bridge beams removed from the A34,Botley Viaduct, Oxford has shown that voiding reducesthe opportunity for redistribution of stresses within thebeams. Voiding can give rise to two sets of problems:
1. Possible ingress of chlorides, which would cause corro-sion.
2. A lack of redistribution of stress within the beam. It isagainst this background that it is important to first of allidentify the extent of voiding in post tensioned bridges.
3. Bridge testing procedures
There are three aspects to any assessment and testingprogramme:
(a) Protecting the value of the bridge asset commensuratewith its residual life [6].(b) Ensuring public safety [7].(c) Choosing the best value for money assessment andinvestigation procedure commensurate with a whole lifecosting programme [8].
The testing procedures, which might be considered for thesebridges, are listed in Table 1.
The current routine procedure in the UK for assessinggrout integrity is to drill and inspect visually [9]. As thismethod is subjective and ad hoc in its accuracy, a moresystematic NDT method might be preferable. Radar willnot penetrate through metallic ducts, which exist in most
post-tensioned bridges constructed before the mid-1990s.However, radar will penetrate through plastic ducts andalso through unlined cast-in-situ joints in segmental precastpost tensioned bridges [10]. Where metallic ducts exist, themost developed NDT technique is impact-echo, which hasbeen promoted heavily in the USA. The newest technique isthat of ultrasonic tomography.
4. Ultrasonic tomography theory
Tomography, from the Greek root, “tomos“ meaningslice, involves the reconstruction of a two-dimensionalsection of the test specimen. This slice is constructedusing measurements of pulse velocity through the specimenmade outside its perimeter. The mathematical theory wasestablished by Radon in 1917 [11] in which it is shown thatthe internal characteristics of an object can be exactly recon-structed by a complete set of projections through the object.This theory has been used extensively in modern medicine.
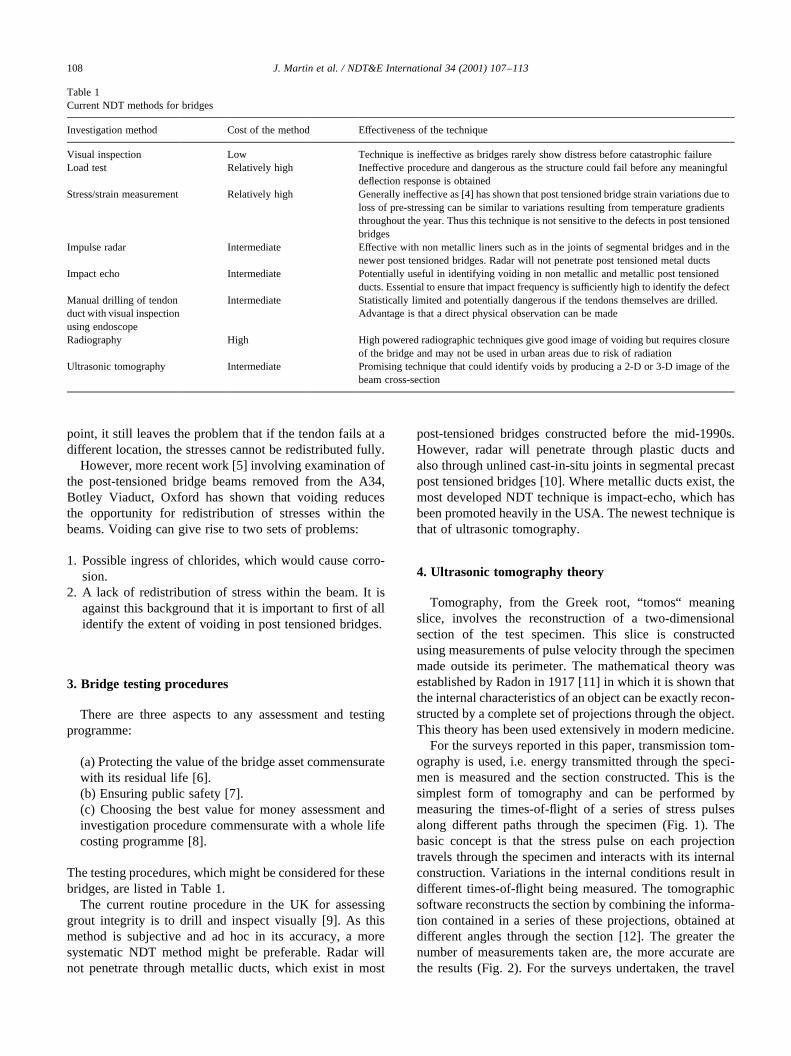
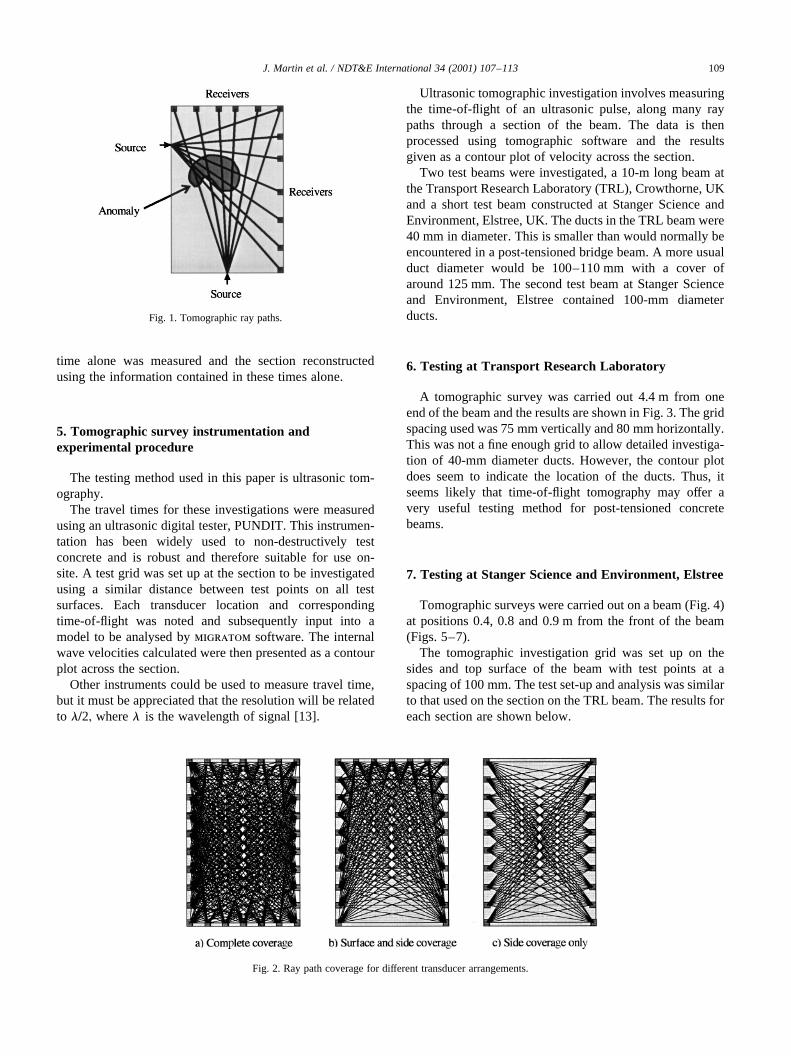
For the surveys reported in this paper, transmission tom-ography is used, i.e. energy transmitted through the speci-men is measured and the section constructed. This is thesimplest form of tomography and can be performed bymeasuring the times-of-flight of a series of stress pulsesalong different paths through the specimen (Fig. 1). Thebasic concept is that the stress pulse on each projectiontravels through the specimen and interacts with its internalconstruction. Variations in the internal conditions result indifferent times-of-flight being measured. The tomographicsoftware reconstructs the section by combining the informa-tion contained in a series of these projections, obtained atdifferent angles through the section [12]. The greater thenumber of measurements taken are, the more accurate arethe results (Fig. 2). For the surveys undertaken, the travel
J. Martin et al. / NDT&E International 34 (2001) 107–113108
Table 1Current NDT methods for bridges
Investigation method Cost of the method Effectiveness of the technique
Visual inspection Low Technique is ineffective as bridges rarely show distress before catastrophic failureLoad test Relatively high Ineffective procedure and dangerous as the structure could fail before any meaningful
deflection response is obtainedStress/strain measurement Relatively high Generally ineffective as [4] has shown that post tensioned bridge strain variations due to
loss of pre-stressing can be similar to variations resulting from temperature gradientsthroughout the year. Thus this technique is not sensitive to the defects in post tensionedbridges
Impulse radar Intermediate Effective with non metallic liners such as in the joints of segmental bridges and in thenewer post tensioned bridges. Radar will not penetrate post tensioned metal ducts
Impact echo Intermediate Potentially useful in identifying voiding in non metallic and metallic post tensionedducts. Essential to ensure that impact frequency is sufficiently high to identify the defect
Manual drilling of tendonduct with visual inspectionusing endoscope
Intermediate Statistically limited and potentially dangerous if the tendons themselves are drilled.Advantage is that a direct physical observation can be made
Radiography High High powered radiographic techniques give good image of voiding but requires closureof the bridge and may not be used in urban areas due to risk of radiation
Ultrasonic tomography Intermediate Promising technique that could identify voids by producing a 2-D or 3-D image of thebeam cross-section
time alone was measured and the section reconstructedusing the information contained in these times alone.
5. Tomographic survey instrumentation andexperimental procedure
The testing method used in this paper is ultrasonic tom-ography.
The travel times for these investigations were measuredusing an ultrasonic digital tester, PUNDIT. This instrumen-tation has been widely used to non-destructively testconcrete and is robust and therefore suitable for use on-site. A test grid was set up at the section to be investigatedusing a similar distance between test points on all testsurfaces. Each transducer location and correspondingtime-of-flight was noted and subsequently input into amodel to be analysed bymigratom software. The internalwave velocities calculated were then presented as a contourplot across the section.
Other instruments could be used to measure travel time,but it must be appreciated that the resolution will be relatedto l=2; wherel is the wavelength of signal [13].
Ultrasonic tomographic investigation involves measuringthe time-of-flight of an ultrasonic pulse, along many raypaths through a section of the beam. The data is thenprocessed using tomographic software and the resultsgiven as a contour plot of velocity across the section.
Two test beams were investigated, a 10-m long beam atthe Transport Research Laboratory (TRL), Crowthorne, UKand a short test beam constructed at Stanger Science andEnvironment, Elstree, UK. The ducts in the TRL beam were40 mm in diameter. This is smaller than would normally beencountered in a post-tensioned bridge beam. A more usualduct diameter would be 100–110 mm with a cover ofaround 125 mm. The second test beam at Stanger Scienceand Environment, Elstree contained 100-mm diameterducts.
6. Testing at Transport Research Laboratory
A tomographic survey was carried out 4.4 m from oneend of the beam and the results are shown in Fig. 3. The gridspacing used was 75 mm vertically and 80 mm horizontally.This was not a fine enough grid to allow detailed investiga-tion of 40-mm diameter ducts. However, the contour plotdoes seem to indicate the location of the ducts. Thus, itseems likely that time-of-flight tomography may offer avery useful testing method for post-tensioned concretebeams.
7. Testing at Stanger Science and Environment, Elstree
Tomographic surveys were carried out on a beam (Fig. 4)at positions 0.4, 0.8 and 0.9 m from the front of the beam(Figs. 5–7).
The tomographic investigation grid was set up on thesides and top surface of the beam with test points at aspacing of 100 mm. The test set-up and analysis was similarto that used on the section on the TRL beam. The results foreach section are shown below.
J. Martin et al. / NDT&E International 34 (2001) 107–113 109
Fig. 1. Tomographic ray paths.
Fig. 2. Ray path coverage for different transducer arrangements.
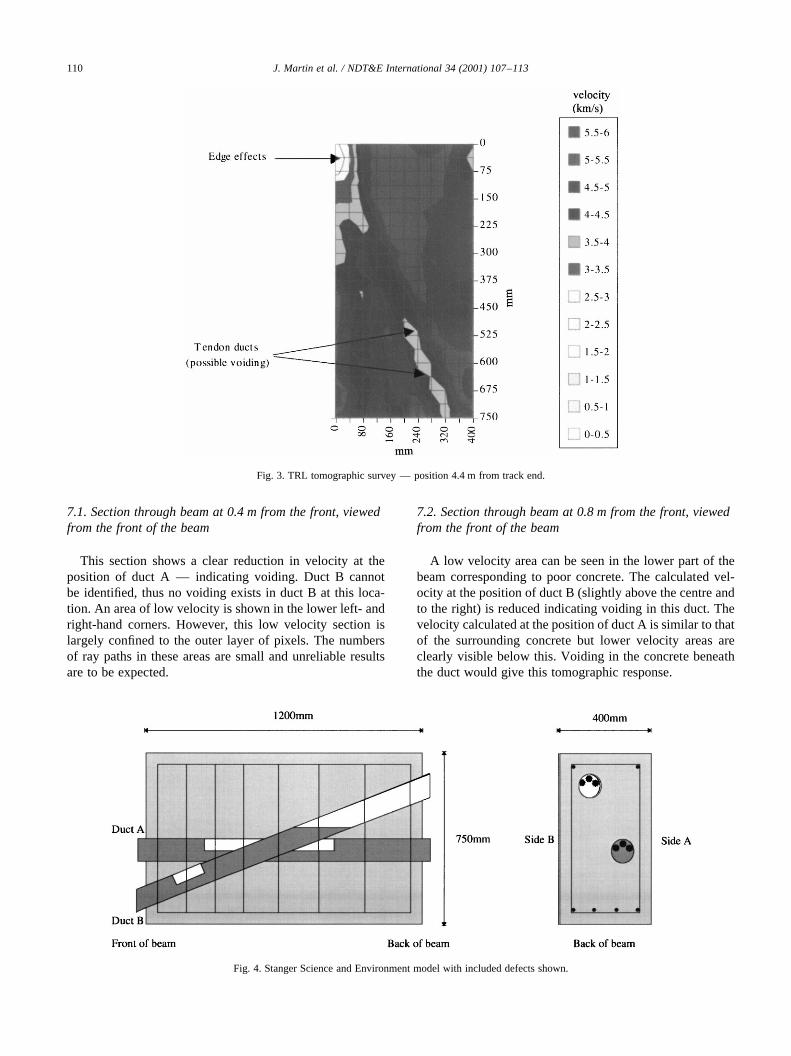
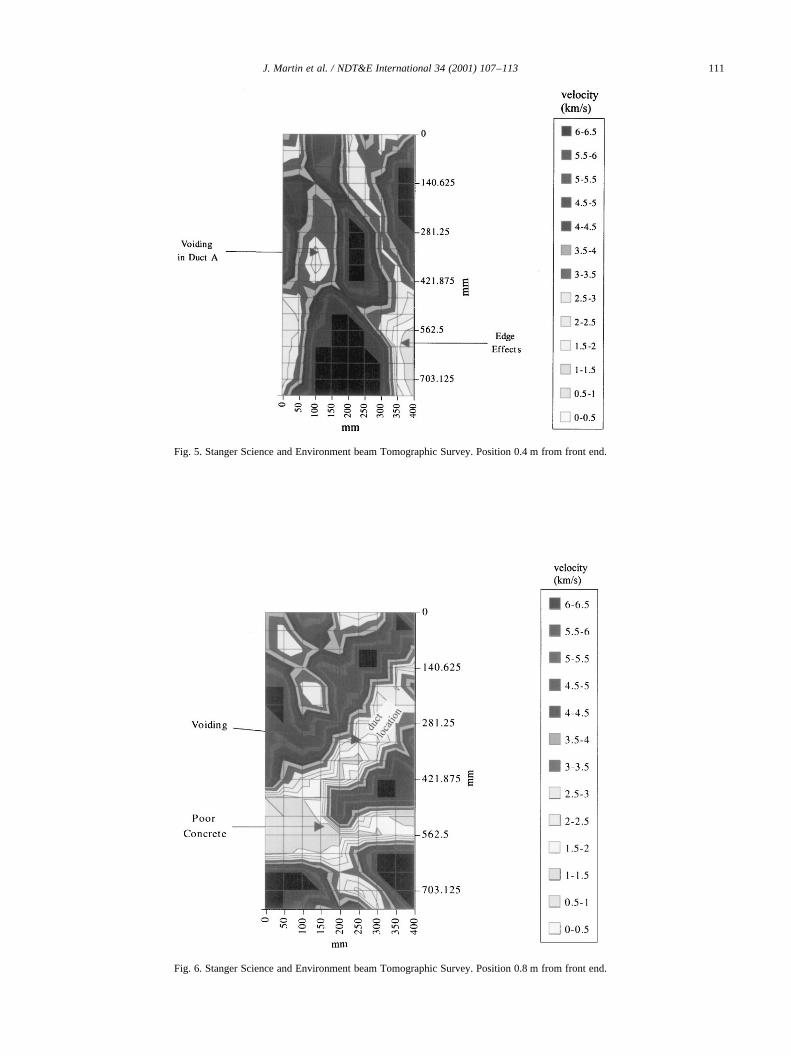
7.1. Section through beam at 0.4 m from the front, viewedfrom the front of the beam
This section shows a clear reduction in velocity at theposition of duct A — indicating voiding. Duct B cannotbe identified, thus no voiding exists in duct B at this loca-tion. An area of low velocity is shown in the lower left- andright-hand corners. However, this low velocity section islargely confined to the outer layer of pixels. The numbersof ray paths in these areas are small and unreliable resultsare to be expected.
7.2. Section through beam at 0.8 m from the front, viewedfrom the front of the beam
A low velocity area can be seen in the lower part of thebeam corresponding to poor concrete. The calculated vel-ocity at the position of duct B (slightly above the centre andto the right) is reduced indicating voiding in this duct. Thevelocity calculated at the position of duct A is similar to thatof the surrounding concrete but lower velocity areas areclearly visible below this. Voiding in the concrete beneaththe duct would give this tomographic response.
J. Martin et al. / NDT&E International 34 (2001) 107–113110
Fig. 3. TRL tomographic survey — position 4.4 m from track end.
Fig. 4. Stanger Science and Environment model with included defects shown.
J. Martin et al. / NDT&E International 34 (2001) 107–113 111
Fig. 5. Stanger Science and Environment beam Tomographic Survey. Position 0.4 m from front end.
Fig. 6. Stanger Science and Environment beam Tomographic Survey. Position 0.8 m from front end.
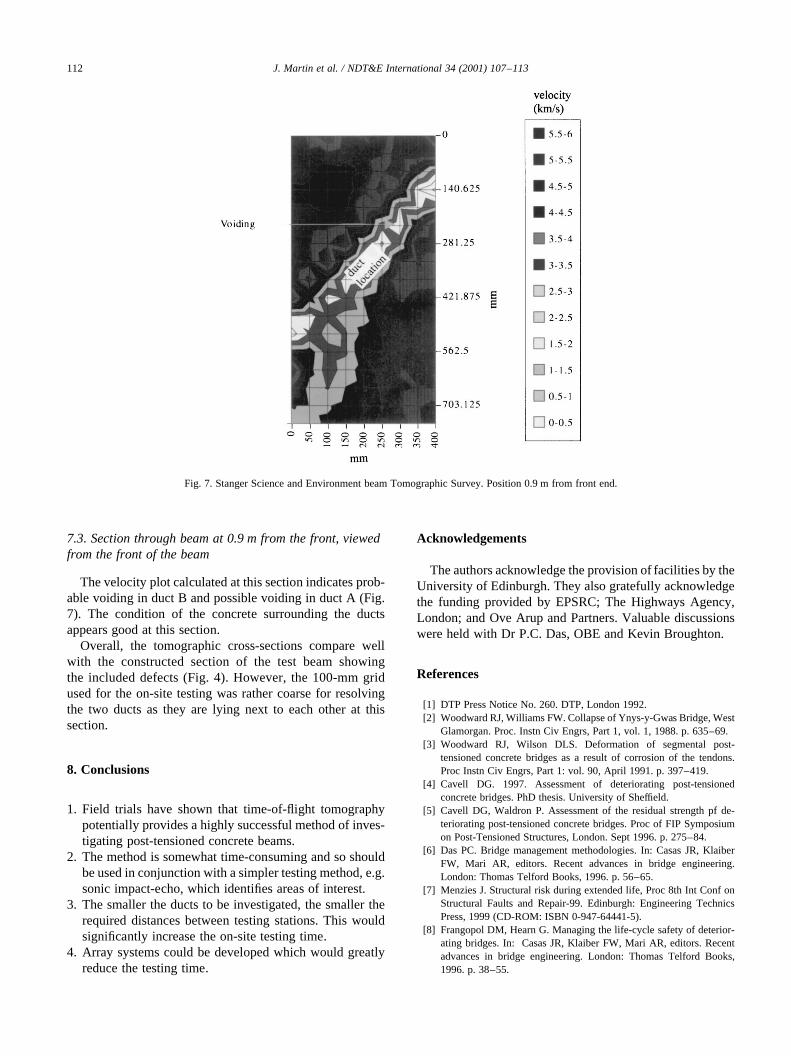
7.3. Section through beam at 0.9 m from the front, viewedfrom the front of the beam
The velocity plot calculated at this section indicates prob-able voiding in duct B and possible voiding in duct A (Fig.7). The condition of the concrete surrounding the ductsappears good at this section.
Overall, the tomographic cross-sections compare wellwith the constructed section of the test beam showingthe included defects (Fig. 4). However, the 100-mm gridused for the on-site testing was rather coarse for resolvingthe two ducts as they are lying next to each other at thissection.
8. Conclusions
1. Field trials have shown that time-of-flight tomographypotentially provides a highly successful method of inves-tigating post-tensioned concrete beams.
2. The method is somewhat time-consuming and so shouldbe used in conjunction with a simpler testing method, e.g.sonic impact-echo, which identifies areas of interest.
3. The smaller the ducts to be investigated, the smaller therequired distances between testing stations. This wouldsignificantly increase the on-site testing time.
4. Array systems could be developed which would greatlyreduce the testing time.
Acknowledgements
The authors acknowledge the provision of facilities by theUniversity of Edinburgh. They also gratefully acknowledgethe funding provided by EPSRC; The Highways Agency,London; and Ove Arup and Partners. Valuable discussionswere held with Dr P.C. Das, OBE and Kevin Broughton.
References
[1] DTP Press Notice No. 260. DTP, London 1992.[2] Woodward RJ, Williams FW. Collapse of Ynys-y-Gwas Bridge, West
Glamorgan. Proc. Instn Civ Engrs, Part 1, vol. 1, 1988. p. 635–69.[3] Woodward RJ, Wilson DLS. Deformation of segmental post-
tensioned concrete bridges as a result of corrosion of the tendons.Proc Instn Civ Engrs, Part 1: vol. 90, April 1991. p. 397–419.
[4] Cavell DG. 1997. Assessment of deteriorating post-tensionedconcrete bridges. PhD thesis. University of Sheffield.
[5] Cavell DG, Waldron P. Assessment of the residual strength pf de-teriorating post-tensioned concrete bridges. Proc of FIP Symposiumon Post-Tensioned Structures, London. Sept 1996. p. 275–84.
[6] Das PC. Bridge management methodologies. In: Casas JR, KlaiberFW, Mari AR, editors. Recent advances in bridge engineering.London: Thomas Telford Books, 1996. p. 56–65.
[7] Menzies J. Structural risk during extended life, Proc 8th Int Conf onStructural Faults and Repair-99. Edinburgh: Engineering TechnicsPress, 1999 (CD-ROM: ISBN 0-947-64441-5).
[8] Frangopol DM, Hearn G. Managing the life-cycle safety of deterior-ating bridges. In: Casas JR, Klaiber FW, Mari AR, editors. Recentadvances in bridge engineering. London: Thomas Telford Books,1996. p. 38–55.
J. Martin et al. / NDT&E International 34 (2001) 107–113112
Fig. 7. Stanger Science and Environment beam Tomographic Survey. Position 0.9 m from front end.

[9] Stain RT, Dixon S. Inspection of cables in post-tensioning bridge —what techniques are available, Proc. 5th International Conference onStructural Faults and Repair — 93, vol. 1. Edinburgh: EngineeringTechnics Press, 1993. p. 297–306.
[10] Cooke RS, Ashurst DM, McCavitt N. Digital radar assessment ofBesses o‘th’ Barn Post-tensioned precast concrete segmental railbridge, Proc. 5th Int. Conf.: Structural Faults and Repair-93, vol. 1.Edinburgh: Engineering Technics Press, 1993. p. 305–11.
[11] Papoulis A. Signal analysis. Singapore: McGraw-Hill, 1977. 431 p.[12] Jackson MJ, Tweeton DR.migratom. Geophysical tomography using
wavefront migration and fuzzy constraints, R.I. 9497. Bureau ofMines, United States Department of Interior, 1994. 35 p.
[13] Martin J, Hardy MSA, Usmani AS, Forde MC. Accuracy of NDE inbridge assessment. Engineering structures 1998;20(11):979–84.
J. Martin et al. / NDT&E International 34 (2001) 107–113 113