Embed Size (px)
Citation preview

Copyright ©2008 by NACE International. Requests for permission to publish this manuscript in any form, in part or in whole must be in writing to NACE International, Copyright Division, 1440 South creek Drive, Houston, Texas 777084. The material presented and the views expressed in this paper are solely those of the author(s) and are not necessarily endorsed by the Association. Printed in the U.S.A.
DETECTION OF CORROSION OF POST-TENSIONED STRANDS IN GROUTED ASSEMBLIES
L. V. Taveira, A. A. Sagüés, and J. Lopez-Sabando
Department of Civil and Environmental Engineering, University of South Florida 4202 E. Fowler Ave. Tampa, FL 33620
B. Joseph
Department of Chemical Engineering, University of South Florida 4202 E. Fowler Ave. Tampa, FL 33620
ABSTRACT
The feasibility and sensitivity of electrochemical noise (EN), electrochemical impedance spectroscopy (EIS), and linear polarization resistance (LPR) for detection of corrosion in post-tensioning (PT) components was investigated. The use of the electrical resistance (ER) technique, as well EIS and LPR, to detect air space corrosion at the grout voids was also explored. The results showed that high sensitivity noise measurements (in the μV range) are feasible for the strand-anchorage systems. The potential and galvanic current trends for the assemblies suggest the presence of activation-passivation cycles linked to each water ingress event. The EN method was adequate to identify only one modality of corrosion, and failed to detect other potentially important forms of corrosion despite the presence of significant macrocell current. In contrast, the EIS and LPR methods more reliably detected ongoing corrosion. The ER method could sensitively detect the deterioration of grouted and bare steel strands exposed to a high humidity environment as in the air space of a grout void. The air space corrosion experiments showed that an aggressive environment may evolve in the grout void, resulting in appreciable corrosion rates. Keywords: Post-tensioning strands, anchorage assemblies, grout, recharge water, corrosion detection methods
INTRODUCTION
Severe corrosion damage and even complete failure of external tendons have been observed in
three Florida pre-cast segmental bridges over sea water1, 2. The failures of the post-tensioning (PT) tendons occurred relatively early in their expected service life. The first incident was reported at the 18-year old Niles Channel Bridge (NCB) in Florida Keys3, 4 followed by the 7-year old Mid Bay Bridge (MBB) in the Western panhandle5 and finally the 15-year old Sunshine Skyway Bridge (SSB) over
1
Paper No.
08398
Tampa Bay6. The affected tendons consist of bundles with 19 or more seven-wire high strength (ultimate tensile strength 1.86 GPa (270 ksi)) steel strands encapsulated in a high-density polyethylene (HDPE) duct. The tendon is connected to an anchorage assembly, which includes wedges to hold the tendons that pass through an anchor head with tapered holes, transferring force to the concrete. Portions of the tendon pass through pipes in intermediate deviation blocks or U-bends to provide lateral force transfer where needed. After the strands have been tensioned, the space between the tendon and the anchorage (or ducts) is normally completely filled with cementitious grout to protect the steel against corrosion by providing a highly alkaline environment, which induces metal passivation. The grout also allows for some force transfer between strand and anchorage in case of strand breakage or loosening7, 8.
Previous work2, 8, 9 showed that bleed water formation when the mix water and the cement particles
segregate (bleeding) during the grouting process10 is a key factor in the development of corrosion. The bleed water tends to accumulate at the tendon high points where anchorages are commonly placed, forming voids there upon absorption of the water by the grout or evaporation through incomplete anchorage sealing. As indicated by some authors11, the bleed water itself can be very aggressive causing corrosion while the bleed water is still present. Corrosion can also occur at the region where the steel emerges from the grout into the void, either when the system is still wet from its original condition, or during later recharge events from external water intrusion into the voids at or near the anchorage2. At the same time the high humidity environment inside the grout voids may induce an atmospheric-like air space corrosion on the bare steel. Other detrimental factors such as decrease of grout pH in the voids due to concrete carbonation12, and galvanic coupling between strand steel and the ductile cast iron anchorage body9 can considerably aggravate the corrosion. Additionally, because of evaporative chloride concentration the chloride content of pore water can increase to a level sufficient to cause the breakdown of passivity at the local pH and potential conditions12, 13.
In PT structures, the corrosion of steel tendons is a particularly serious problem, as the structural
integrity of the bridges is dependent on the large tensile load concentrated by the tendon. Failure of a tendon, due to strand corrosion could have grave consequences. Therefore, development of highly reliable and non-intrusive detection methods for PT anchorage corrosion is desirable to prevent future occurrences. Electrochemical techniques are appealing methods to detect the corrosion in PT anchorages since those techniques can be highly sensitive and can be applied to hidden components, such as bonded tendons. Among these methods, electrochemical noise (EN) may be particularly desirable for early damage detection in PT tendons due to its high sensitivity to corrosion and instrumental simplicity if implemented as potential-EN, which is based on the measurement of open-circuit potential (OCP) fluctuations that develop in systems corroding actively. In such case, measurements can be conducted using a simple reference electrode even if it experiences long-term potential drift. EN may also identify the type of corrosion occurring in the system, particularly pitting corrosion14, 15, which is a common early deterioration mode of PT steels in anchorages or ducts. Based on those expectations, the reliability of EN to detect corrosion in PT components was previously studied16. In this work, the feasibility and sensitivity of EN for detection of corrosion in PT components was evaluated in further detail and compared to other conventional electrochemical techniques such as electrochemical impedance spectroscopy (EIS) and linear polarization resistance (LPR). The use of electrical resistance (ER) technique, as well EIS and LPR, to detect atmospheric corrosion at the air space of grout voids was also explored.
EXPERIMENTAL PROCEDURE
Two series of mock-up anchorage assemblies were constructed using actual ductile iron anchorage
bodies and unstressed high strength eutectoid carbon steel strands (ASTM A416/A416M-98) as described elsewhere8. The series P assemblies (P1 to P3) used a plain cement grout with addition of a commercial aluminum based expansion agent. This type of grout was used in earlier construction practice, which did not effectively prevent the formation of bleed water voids. The series S assemblies
2
ENP ENP
ENC Vernier Interface
100X +
-
100
1
VF +
-
1 nF 10 MΩ
Mock-up Assembly
25 μF
10 Ω
RE
hi f cutoff
Temporary zero component
ENC
CE
(S1 to S4) used a new-generation commercial low-bleed grout representative of materials currently used.
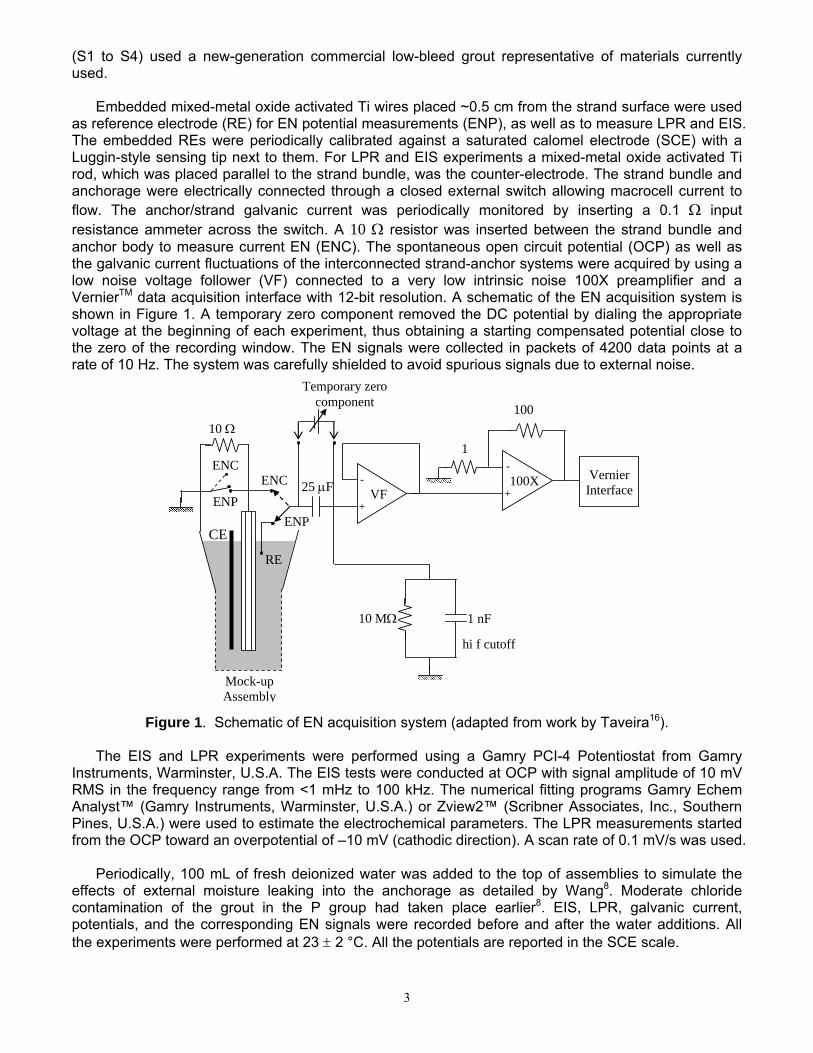
Embedded mixed-metal oxide activated Ti wires placed ~0.5 cm from the strand surface were used
as reference electrode (RE) for EN potential measurements (ENP), as well as to measure LPR and EIS. The embedded REs were periodically calibrated against a saturated calomel electrode (SCE) with a Luggin-style sensing tip next to them. For LPR and EIS experiments a mixed-metal oxide activated Ti rod, which was placed parallel to the strand bundle, was the counter-electrode. The strand bundle and anchorage were electrically connected through a closed external switch allowing macrocell current to flow. The anchor/strand galvanic current was periodically monitored by inserting a 0.1 Ω input resistance ammeter across the switch. A 10 Ω resistor was inserted between the strand bundle and anchor body to measure current EN (ENC). The spontaneous open circuit potential (OCP) as well as the galvanic current fluctuations of the interconnected strand-anchor systems were acquired by using a low noise voltage follower (VF) connected to a very low intrinsic noise 100X preamplifier and a VernierTM data acquisition interface with 12-bit resolution. A schematic of the EN acquisition system is shown in Figure 1. A temporary zero component removed the DC potential by dialing the appropriate voltage at the beginning of each experiment, thus obtaining a starting compensated potential close to the zero of the recording window. The EN signals were collected in packets of 4200 data points at a rate of 10 Hz. The system was carefully shielded to avoid spurious signals due to external noise.
Figure 1. Schematic of EN acquisition system (adapted from work by Taveira16). The EIS and LPR experiments were performed using a Gamry PCI-4 Potentiostat from Gamry
Instruments, Warminster, U.S.A. The EIS tests were conducted at OCP with signal amplitude of 10 mV RMS in the frequency range from <1 mHz to 100 kHz. The numerical fitting programs Gamry Echem Analyst™ (Gamry Instruments, Warminster, U.S.A.) or Zview2™ (Scribner Associates, Inc., Southern Pines, U.S.A.) were used to estimate the electrochemical parameters. The LPR measurements started from the OCP toward an overpotential of –10 mV (cathodic direction). A scan rate of 0.1 mV/s was used.
Periodically, 100 mL of fresh deionized water was added to the top of assemblies to simulate the
effects of external moisture leaking into the anchorage as detailed by Wang8. Moderate chloride contamination of the grout in the P group had taken place earlier8. EIS, LPR, galvanic current, potentials, and the corresponding EN signals were recorded before and after the water additions. All the experiments were performed at 23 ± 2 °C. All the potentials are reported in the SCE scale.
3

Grout film
Grout bridge
Wire 1 Wire 2
In order to investigate the air space corrosion, which may occur at the grout voids, atmospheric corrosion test chambers were designed and constructed. Relative humidity (RH) was controlled by introducing in the cell 1 L of saturated- or 89 g/L- sodium chloride solutions for 75% RH or 95% RH respectively17, 18. EIS, LPR and ER experiments were performed with duplicate specimens at 23 ± 2 °C. Weight loss measurements were also conducted for comparison. The gravimetric tests had greater multiplicity. The 75% RH humidity chamber was only used for weight loss experiments and preliminary ER tests.
For the EIS and LPR measurements two 5 mm diameter steel wires (10.5 cm long) extracted from
an actual high strength strand were used to build wire-grout-wire (WGW) probes (Figure 2). After removing the mill scale, both wires were attached parallel to each other with a 0.6 mm or 1 mm gap between them. Plastic spacers at the end of the probes kept the two wires electronically isolated from each other. Thin stainless steel wire contacts were spot welded at the end of each wire for external connection. The probes were immersed in a fluid 0.42 water/cement ratio grout (type 1 Portland cement) and then lifted forming upon curing a thin grout layer on the surface and across the gap. The grout layer in the 1 mm probes was thicker than in the 0.6 mm probes, which were made in a different batch. The grouted probes were cured in a 100% RH chamber for a day and then placed in the 95% RH chamber. EIS and LPR experiments for the WGW probes were performed using the same potentiostat and the same conditions as explained above except for the frequency range in the EIS tests, which was from 100 kHz to 10 mHz. The reference and counter-electrode were connected to one wire of the probe and the working electrode to the other one, so the impedance measured corresponded to the wire-grout-wire series combination. The same numerical fitting programs indicated above were used to estimate the electrochemical parameters for WGW probes.
Figure 2. (a) WGW probes and (b) schematic of probe cross-section. ER probes were built based on the principle of increase in electrical resistance produced by a
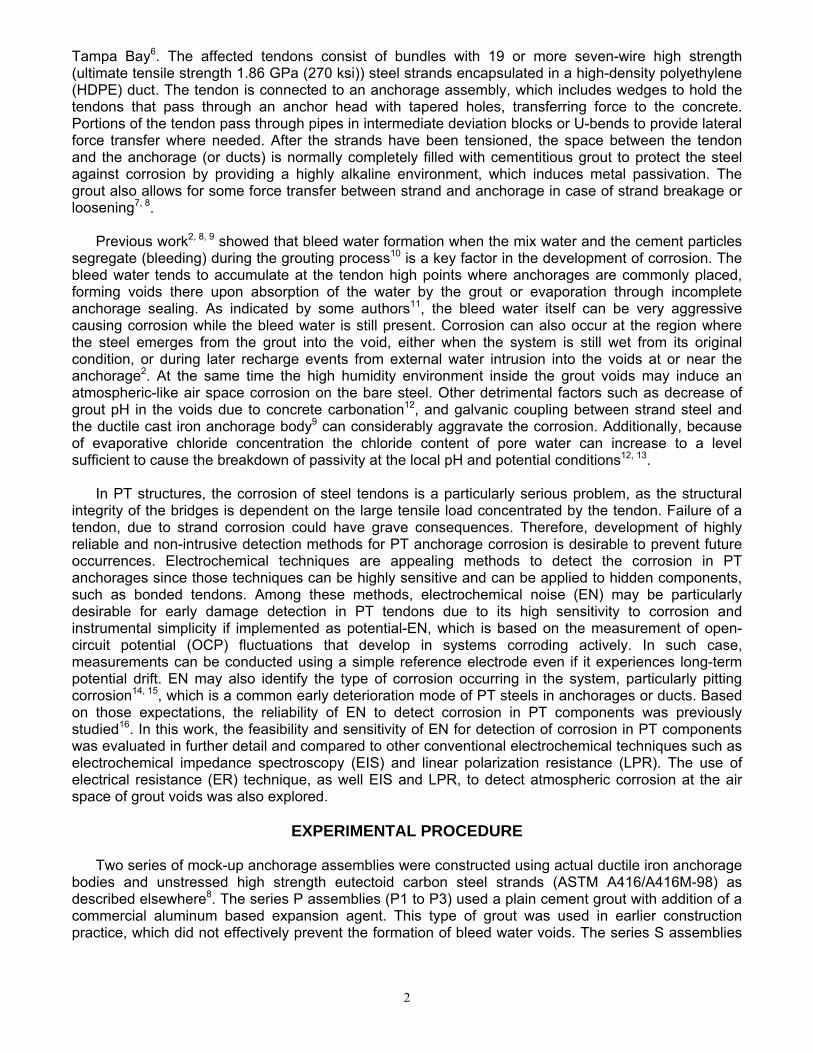
decrease in the section thickness of the metal when it corrodes. These probes were designed as a Wheatstone bridge with one branch isolated from the corrosive environment. The ER probes consisted of two identical, 120 cm long plain low carbon steel rebar tie wires, 1.60 mm diameter, in the “as-received” condition (dark mill scale on the metal surface). One of the wires, the working element, was exposed to the atmosphere inside the chamber. The other wire, the reference element, was protected by sealing it inside the probe body (PVC pipe) from the external medium (Figure 3). The covered wire provides a reference for evaluating changes in the uncovered wire and also serves to compensate for the effects of temperature changes on resistance. In the final design, both internal and external wires were double-coiled to minimize inductance effects. External wires of some ER probes were also covered by a grout film to simulate the conditions at the tendon anchorage. The grout was the same
(b)
(a)
4
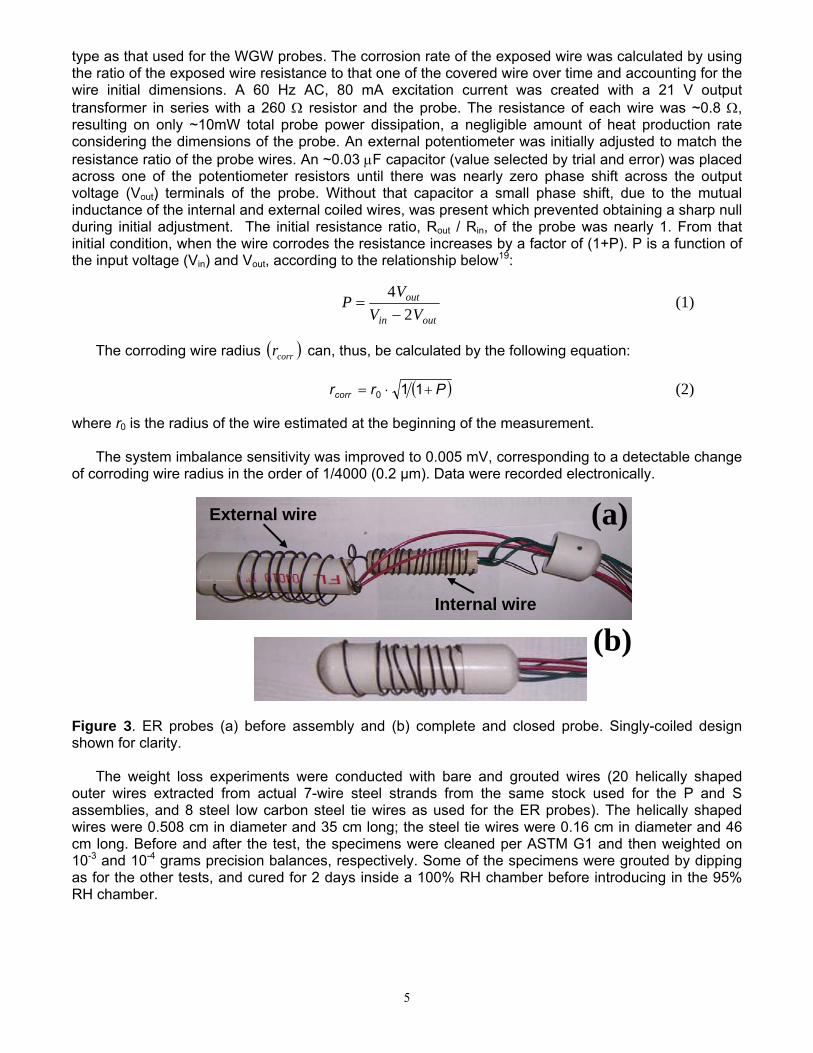
type as that used for the WGW probes. The corrosion rate of the exposed wire was calculated by using the ratio of the exposed wire resistance to that one of the covered wire over time and accounting for the wire initial dimensions. A 60 Hz AC, 80 mA excitation current was created with a 21 V output transformer in series with a 260 Ω resistor and the probe. The resistance of each wire was ~0.8 Ω, resulting on only ~10mW total probe power dissipation, a negligible amount of heat production rate considering the dimensions of the probe. An external potentiometer was initially adjusted to match the resistance ratio of the probe wires. An ~0.03 μF capacitor (value selected by trial and error) was placed across one of the potentiometer resistors until there was nearly zero phase shift across the output voltage (Vout) terminals of the probe. Without that capacitor a small phase shift, due to the mutual inductance of the internal and external coiled wires, was present which prevented obtaining a sharp null during initial adjustment. The initial resistance ratio, Rout / Rin, of the probe was nearly 1. From that initial condition, when the wire corrodes the resistance increases by a factor of (1+P). P is a function of the input voltage (Vin) and Vout, according to the relationship below19:
outin
out
VVV
P2
4−
= (1)
The corroding wire radius ( )corrr can, thus, be calculated by the following equation:
( )Prrcorr +⋅= 110 (2) where r0 is the radius of the wire estimated at the beginning of the measurement.
The system imbalance sensitivity was improved to 0.005 mV, corresponding to a detectable change of corroding wire radius in the order of 1/4000 (0.2 μm). Data were recorded electronically.
Figure 3. ER probes (a) before assembly and (b) complete and closed probe. Singly-coiled design shown for clarity.
The weight loss experiments were conducted with bare and grouted wires (20 helically shaped
outer wires extracted from actual 7-wire steel strands from the same stock used for the P and S assemblies, and 8 steel low carbon steel tie wires as used for the ER probes). The helically shaped wires were 0.508 cm in diameter and 35 cm long; the steel tie wires were 0.16 cm in diameter and 46 cm long. Before and after the test, the specimens were cleaned per ASTM G1 and then weighted on 10-3 and 10-4 grams precision balances, respectively. Some of the specimens were grouted by dipping as for the other tests, and cured for 2 days inside a 100% RH chamber before introducing in the 95% RH chamber.
External wire
Internal wire
(a)
(b)
5
RESULTS AND DISCUSSION EN Characteristics of Corroding Strand-Anchorage Systems
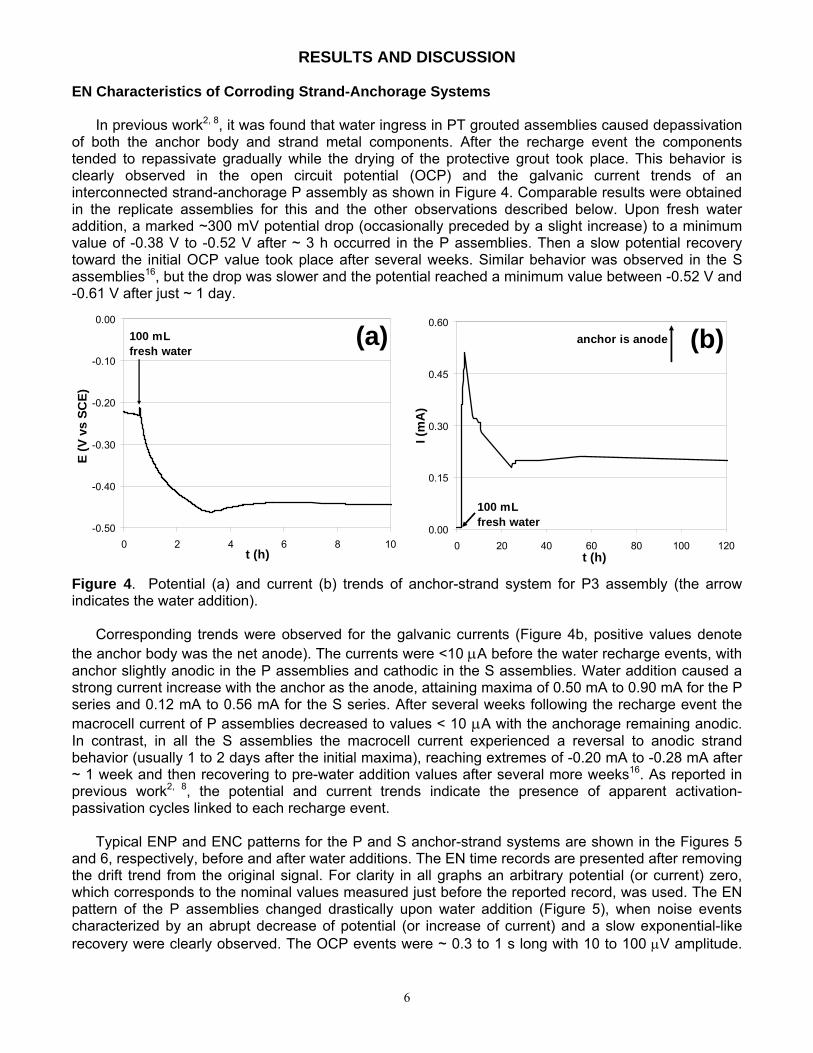
In previous work2, 8, it was found that water ingress in PT grouted assemblies caused depassivation of both the anchor body and strand metal components. After the recharge event the components tended to repassivate gradually while the drying of the protective grout took place. This behavior is clearly observed in the open circuit potential (OCP) and the galvanic current trends of an interconnected strand-anchorage P assembly as shown in Figure 4. Comparable results were obtained in the replicate assemblies for this and the other observations described below. Upon fresh water addition, a marked ~300 mV potential drop (occasionally preceded by a slight increase) to a minimum value of -0.38 V to -0.52 V after ~ 3 h occurred in the P assemblies. Then a slow potential recovery toward the initial OCP value took place after several weeks. Similar behavior was observed in the S assemblies16, but the drop was slower and the potential reached a minimum value between -0.52 V and -0.61 V after just ~ 1 day.
Figure 4. Potential (a) and current (b) trends of anchor-strand system for P3 assembly (the arrow indicates the water addition).
Corresponding trends were observed for the galvanic currents (Figure 4b, positive values denote the anchor body was the net anode). The currents were <10 μA before the water recharge events, with anchor slightly anodic in the P assemblies and cathodic in the S assemblies. Water addition caused a strong current increase with the anchor as the anode, attaining maxima of 0.50 mA to 0.90 mA for the P series and 0.12 mA to 0.56 mA for the S series. After several weeks following the recharge event the macrocell current of P assemblies decreased to values < 10 μA with the anchorage remaining anodic. In contrast, in all the S assemblies the macrocell current experienced a reversal to anodic strand behavior (usually 1 to 2 days after the initial maxima), reaching extremes of -0.20 mA to -0.28 mA after ~ 1 week and then recovering to pre-water addition values after several more weeks16. As reported in previous work2, 8, the potential and current trends indicate the presence of apparent activation-passivation cycles linked to each recharge event.
Typical ENP and ENC patterns for the P and S anchor-strand systems are shown in the Figures 5 and 6, respectively, before and after water additions. The EN time records are presented after removing the drift trend from the original signal. For clarity in all graphs an arbitrary potential (or current) zero, which corresponds to the nominal values measured just before the reported record, was used. The EN pattern of the P assemblies changed drastically upon water addition (Figure 5), when noise events characterized by an abrupt decrease of potential (or increase of current) and a slow exponential-like recovery were clearly observed. The OCP events were ~ 0.3 to 1 s long with 10 to 100 μV amplitude.
-0.50
-0.40
-0.30
-0.20
-0.10
0.00
0 2 4 6 8 10t (h)
E (V
vs
SCE)
100 mLfresh water
(a)
0.00
0.15
0.30
0.45
0.60
0 20 40 60 80 100 120t (h)
I (m
A)
100 mLfresh water
anchor is anode (b)
6
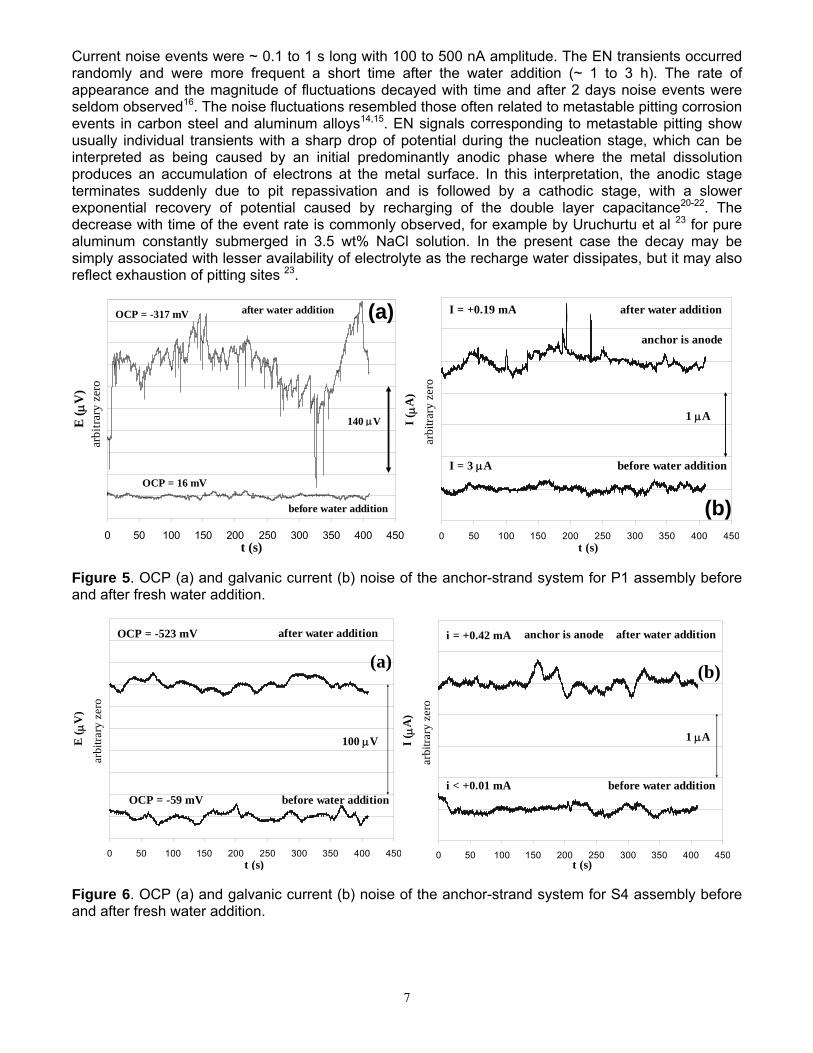
Current noise events were ~ 0.1 to 1 s long with 100 to 500 nA amplitude. The EN transients occurred randomly and were more frequent a short time after the water addition (~ 1 to 3 h). The rate of appearance and the magnitude of fluctuations decayed with time and after 2 days noise events were seldom observed16. The noise fluctuations resembled those often related to metastable pitting corrosion events in carbon steel and aluminum alloys14,15. EN signals corresponding to metastable pitting show usually individual transients with a sharp drop of potential during the nucleation stage, which can be interpreted as being caused by an initial predominantly anodic phase where the metal dissolution produces an accumulation of electrons at the metal surface. In this interpretation, the anodic stage terminates suddenly due to pit repassivation and is followed by a cathodic stage, with a slower exponential recovery of potential caused by recharging of the double layer capacitance20-22. The decrease with time of the event rate is commonly observed, for example by Uruchurtu et al 23 for pure aluminum constantly submerged in 3.5 wt% NaCl solution. In the present case the decay may be simply associated with lesser availability of electrolyte as the recharge water dissipates, but it may also reflect exhaustion of pitting sites 23.
Figure 5. OCP (a) and galvanic current (b) noise of the anchor-strand system for P1 assembly before and after fresh water addition.
Figure 6. OCP (a) and galvanic current (b) noise of the anchor-strand system for S4 assembly before and after fresh water addition.
0 50 100 150 200 250 300 350 400 450t (s)
E ( μ
V)
before water addition
after water addition
OCP = -59 mV
OCP = -523 mV
100 μV
arbi
trary
zer
o
0 50 100 150 200 250 300 350 400 450t (s)
I ( μ
A)
before water addition
after water addition
i < +0.01 mA
i = +0.42 mA
1 μA
arbi
trary
zer
o
anchor is anode
(a) (b)
0 50 100 150 200 250 300 350 400 450t (s)
I (μ
A)
before water addition
after water addition
I = 3 μA
I = +0.19 mA
1 μAar
bitra
ry z
ero
anchor is anode
(b)0 50 100 150 200 250 300 350 400 450
t (s)
E ( μ
V)
before water addition
after water addition
OCP = 16 mV
OCP = -317 mV
140 μV
arbi
trary
zer
o
(a)
7
By assuming that the EN fluctuations were associated to pitting corrosion, the pit sizes ascribed to a typical noise event can be estimated as described elsewhere16, 21. In P assemblies plausible values of pit size in the order of 6 μm for the ENP and 2 μm for the ENC were calculated16.
Importantly, in contrast with the P assemblies, the water recharge events did not alter significantly
the EN patterns for S assemblies (Figure 6). Noise transients like those of the P systems were rarely observed in the S assemblies, even when they were experiencing an appreciable level of galvanic current.
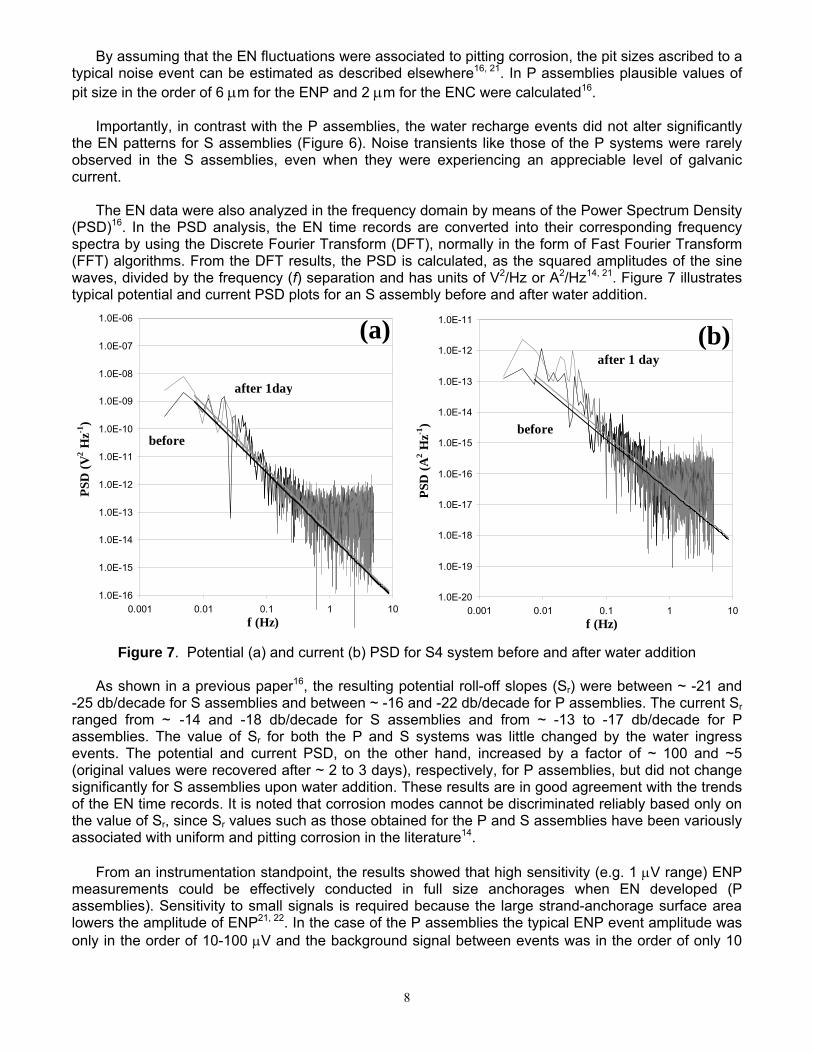
The EN data were also analyzed in the frequency domain by means of the Power Spectrum Density
(PSD)16. In the PSD analysis, the EN time records are converted into their corresponding frequency spectra by using the Discrete Fourier Transform (DFT), normally in the form of Fast Fourier Transform (FFT) algorithms. From the DFT results, the PSD is calculated, as the squared amplitudes of the sine waves, divided by the frequency (f) separation and has units of V2/Hz or A2/Hz14, 21. Figure 7 illustrates typical potential and current PSD plots for an S assembly before and after water addition.
Figure 7. Potential (a) and current (b) PSD for S4 system before and after water addition
As shown in a previous paper16, the resulting potential roll-off slopes (Sr) were between ~ -21 and -25 db/decade for S assemblies and between ~ -16 and -22 db/decade for P assemblies. The current Sr ranged from ~ -14 and -18 db/decade for S assemblies and from ~ -13 to -17 db/decade for P assemblies. The value of Sr for both the P and S systems was little changed by the water ingress events. The potential and current PSD, on the other hand, increased by a factor of ~ 100 and ~5 (original values were recovered after ~ 2 to 3 days), respectively, for P assemblies, but did not change significantly for S assemblies upon water addition. These results are in good agreement with the trends of the EN time records. It is noted that corrosion modes cannot be discriminated reliably based only on the value of Sr, since Sr values such as those obtained for the P and S assemblies have been variously associated with uniform and pitting corrosion in the literature14.
From an instrumentation standpoint, the results showed that high sensitivity (e.g. 1 μV range) ENP
measurements could be effectively conducted in full size anchorages when EN developed (P assemblies). Sensitivity to small signals is required because the large strand-anchorage surface area lowers the amplitude of ENP21, 22. In the case of the P assemblies the typical ENP event amplitude was only in the order of 10-100 μV and the background signal between events was in the order of only 10
1.0E-16
1.0E-15
1.0E-14
1.0E-13
1.0E-12
1.0E-11
1.0E-10
1.0E-09
1.0E-08
1.0E-07
1.0E-06
0.001 0.01 0.1 1 10f (Hz)
PSD
(V2 H
z-1)
before
after 1day
(a)
1.0E-20
1.0E-19
1.0E-18
1.0E-17
1.0E-16
1.0E-15
1.0E-14
1.0E-13
1.0E-12
1.0E-11
0.001 0.01 0.1 1 10f (Hz)
PSD
(A2 H
z-1) before
after 1 day(b)
8
μV, but practical observations were conducted routinely. The S assemblies had no EN activity detectable with the available sensitivity, suggesting that equipment not normally available for practical applications would be required in such case. The equipment demands for detecting ENC are less stringent because ENC is expected to increase with system area. In the present case a sensitivity in the order of 20 nA was enough to characterize the behavior of the P assemblies.
The cause for the virtual lack of observable noise in the S assemblies has not yet been identified. It
could be thought that the higher baseline resistivity of the grout used there (~ 10 times greater than those of P series after completely cured)1 may have reduced corrosion severity and consequently EN levels, but the S assemblies had actually higher macrocell currents than in the P systems. Moreover, after the successive water recharge events the strand to anchor grout resistance for both P and S assemblies were found to be comparable. The results suggest that the corrosion in the P assemblies was more localized, pitting-like, than in the S assemblies. In that context it is worth noting that the moderate, 500 ppm native chloride content of the S grout1 may not have been enough to promote strong corrosion localization, compared to the case of the P assemblies to which salt water had been added in earlier experiments2. That chloride may have further concentrated at the anchor body-grout interface and/or at the grout-void interface of the strand bundles in the P assemblies with greater EN manifestations.
Regardless of the cause, the lack of appreciable noise response in one class of assemblies despite
strong corrosion macrocell activity indicates an important drawback in the use of EN as a sole method for early corrosion detection method in these systems. Consequently, other electrochemical procedures less corrosion-mode specific such as EIS and LPR have been also explored for this purpose, as shown in the following section.
Evaluation of EIS and LPR for Corrosion Detection in Strand-Anchorage Systems
Figure 8 shows the EIS behavior of a P grouted assembly before and after a water recharge event. Comparable results were obtained in the replicate P and in the other S assemblies for this and the other observations described below. To determine the electrochemical parameters, the system was idealized as a constant phase element (CPE), where Y0ID and nID are the CPE parameters, in parallel with an idealized polarization resistance (RPID). The solution resistance (RS), which corresponds to the grout resistance, is in series with the parallel combination. The value of RS was obtained by fitting the impedance predicted by such analog circuit to the actual impedance results, considering all data in the 1 mHz to 100 Hz frequency interval. The fitting algorithm under those conditions is biased to the preponderance of data relevant to RS at the highest frequencies and yields a well defined estimate of the grout resistance. The overall impedance behavior usually deviated somewhat at the highest frequencies from that of the idealized system assumed. That situation, combined with the data weighing procedures used in the fitting algorithm tended sometimes to cause misleading results in the value of RP yielded by the fit procedure, as much of the spectral information for that parameter is contained at the lower frequencies and in a relatively small data population. Consequently, a compromise procedure was developed that consisted in first obtaining provisional estimate values R'P and R'S by performing the fit only for the 10 lowest frequency data (using frequencies <1mHz when available) in the impedance spectrum obtained. Thus, the calculated low-frequency real axis intercept, not affected by high frequency spectral features was R'P + R'S. Subtracting from that sum the previously (and reliable) value of RS yielded an improved estimate of the polarization resistance RP = R'P + R'S - RS. That RP value is the one reported below and used in subsequent calculations. The values of Y0 and n obtained with the 10-point low frequency data fit are also those reported subsequently. Figure 8b exemplifies the results (solid line) of the provisional fit and estimate of R'P (as well as Y0 and n) for a P1 assembly after water recharge. The figure also illustrates how the high-frequency real intercept of the provisional estimate is slightly higher than the value for the smallest absolute phase angle (which corresponds to a frequency ~ 100 Hz), hence the independent determination of RS to refine the overall estimate of RP. In the periods before the first water recharge, or after the effects of water recharge had dissipated, the low frequency impedance data for either grout type in most cases (with exceptions noted later) did not
9

converge toward a recognizable finite value of RP, as exemplified in Figure 8a. The correspondingly large value of RP returned by the curve-fitting procedure was consequently subject to great relative uncertainty. Thus, calculated values of R'P >~ 104 Ω were treated as being infinity, as illustrated in Figure 8a.
Figure 8. EIS behavior of P1 assembly (a) before and (b) after a water recharge event. The solid line indicates the low frequency model fitting as explained in text. The estimated electrochemical parameters are shown in the graph.
The results of the model fitting are shown in the Figures 9 and 10 for all assemblies. For clarity an arbitrary time is indicated in the diagrams, in which the first recharge water event would correspond to the starting point. The corrosion currents Icorr estimated by the Stern-Geary relationship24 below, with an assumed Stearn-Geary constant value of 26 mV (treating the reactions in the system as if they were under simple activation polarization) are shown in the same Figures. The 1 μA lower limit in the graph is a placeholder for negligible Icorr values (infinity RP as indicated above).
P
corr RI 026.0
= (3)
A nominal corrosion rate can be calculated (assuming a nominal area of 1000 cm2, which is in the
order of the total amount of metal surface in contact with grout for the dimensions of the strand-anchor assembly) according to the following equation:
A
mIymrateCorrosion eqcorr
965001015.3
)/(11
ρμ
×= (4)
In equations (3) and (4) the corrosion current in A, the assembly ferrous components are treated as pure Fe, meq is the equivalent weight of Fe (27.92 g/equivalent), A is the nominal area in cm2 and ρ is the density of Fe (7.87 g/cm3).
As shown in Figures 9 and 10 a dramatic increase in Icorr by a factor in the order of ~102 to >103 for both assemblies was observed upon water recharge events. Reflecting the wetting, the grout solution resistance RS decreased somewhat for the P systems and markedly (~4 to 10 times) for the S systems. Upon water addition the Y0 parameter increased abruptly too (~10 times) in all S assemblies suggesting
-300
-250
-200
-150
-100
-50
00 50 100 150 200 250 300
Z' (Ω)
Z" ( Ω
)
RP = ∞Y0 = 0.09 F sn-1
n = 0.66
P assembly beforewater addition
1 mHz
10 mHz
-75
-60
-45
-30
-15
00 15 30 45 60 75
Z' (Ω)Z"
( Ω)
R'P = 57 ΩY0 = 0.32 F sn-1
n = 0.73
P assembly ~ 4 daysafter water addition
0.8 mHz 10 mHz
(a) (b)
10
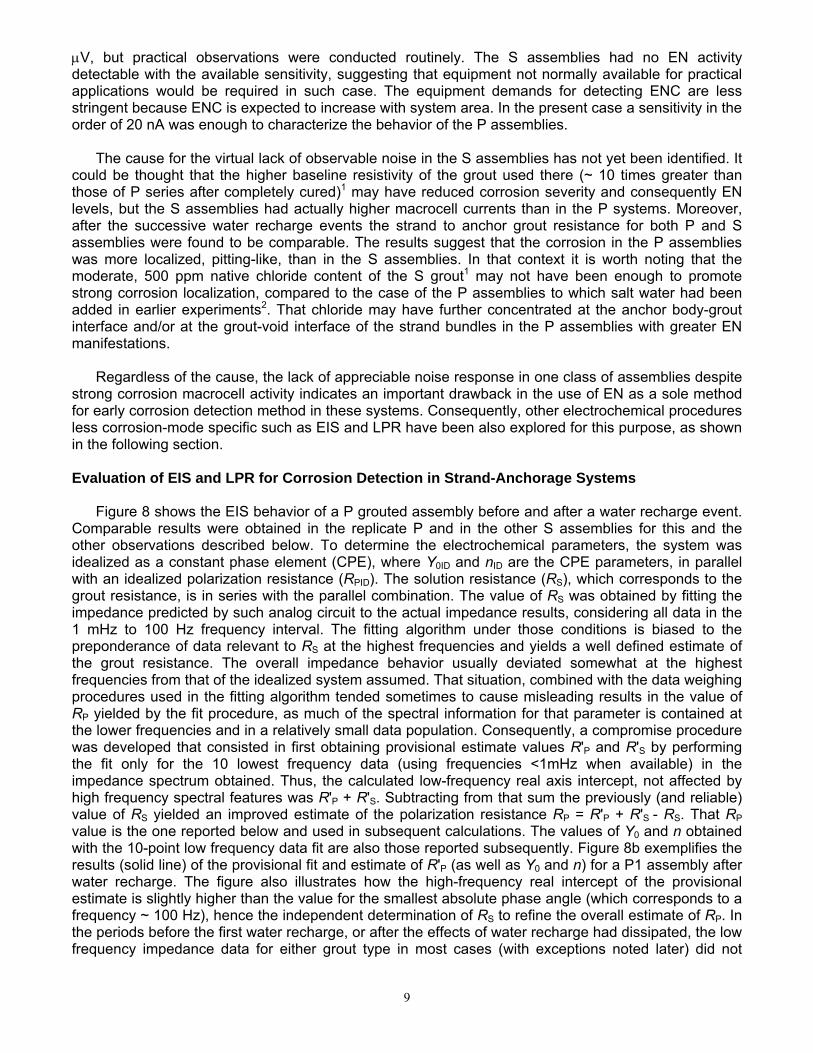
the development of a larger area of effective contact between the metal surface and the electrolyte. This behavior however was seldom observed in the P assemblies. Those results suggest that, in the absence of excess water, electrolytic contact between the grout and the metallic surfaces in the S assemblies was poorer than in the P assemblies. Wang2, 8 noted in previous tests that in some of the test assemblies thin gaps had developed between the grout and the anchor body, so the observed effects may reflect the recharge water temporarily filling some of the gaps. For either grout type there was no clear correlation between the water recharge events and the n parameter, except for the suggestion of a slight increase of the latter upon recharge.
Figure 9. Electrochemical parameters, (a) Y0, (b) RS, and (c) n estimated by EIS and the corresponding (d) Icorr for P assemblies before and after water addition. The arrows in the diagrams indicate the water recharge events.
As shown by comparing Figures 9 and 10, the S assemblies had upon water recharge higher Icorr
values (typically ~2 mA, maximum ~7 mA) than the P assemblies (~0.5 mA, maximum ~2 mA). For the assumed nominal total corroding area of 1,000 cm2 those values correspond to nominal corrosion rates in the order of ~25 μm/y (maximum of ~80 μm/y) for the S assemblies and ~6 μm/y (maximum of ~25 μm/y) for the P assemblies. Moreover, for the S assemblies Icorr remained appreciable for longer times; 30 weeks after the recharge event values Icorr ~20 μA (corresponding to a nominal 0.2 μm/y) were still observed. In contrast, the Icorr values for the P systems were again undetectable 5 to 15 weeks following the recharge event. The generally higher corrosion rates found in the S group are not apparently associated with the relative RS values, since the S assemblies had larger pre-wetting RS values than those of P assemblies (in the order of ~ 10 Ω and ~ 3 Ω respectively). Upon water recharge the RS values for both P and S systems became comparable, but Icorr was larger in the S systems as noted above.
1.E-01
1.E+00
1.E+01
1.E+02
0.E+00 2.E+03 4.E+03 6.E+03 8.E+03 1.E+04t (h)
RS
( Ω)
P1P2P3
(b)
1.E-02
1.E-01
1.E+00
1.E+01
0.E+00 2.E+03 4.E+03 6.E+03 8.E+03 1.E+04t (h)
Y 0 (F
sn-
1 )
P1P2P3
(a)
1.0E-06
1.0E-05
1.0E-04
1.0E-03
1.0E-02
0.E+00 2.E+03 4.E+03 6.E+03 8.E+03 1.E+04t (h)
I corr
(A)
P1P2P3
(d)0.4
0.5
0.6
0.7
0.8
0.9
0.E+00 2.E+03 4.E+03 6.E+03 8.E+03 1.E+04t (h)
n
P1P2P3
(c)
11

Figure 10. Electrochemical parameters, (a) Y0, (b) RS, and (c) n estimated by EIS and the corresponding (d) Icorr for S assemblies before and after water addition. The arrows in the diagrams indicate the water recharge events.
The Icorr trends were consistent with the relative galvanic current and potential trends noted earlier,
both on the overall values and in the way in which the recharge event effects persisted with time. In Figure 11 the Icorr value estimated by EIS each time a test was performed, and the simultaneous measured value of the macrocell current (Imacrocell, reported in Figure 4b) are compared for both assemblies. The diagonal line corresponds to a hypothetical 1:1 agreement between both values. A clear correlation of increasing Imacrocell with increasing estimated Icorr was observed over about 2 orders of magnitude for both types of assemblies and with comparable values within replicate specimens. The trends were distinctly below the 1:1 lines so that in general, Icorr was ~2 to 4 times and ~4 to 10 times greater than Imacrocell for P and S assemblies, respectively. The overall pattern and value of the ratios are reasonable as the Imacrocell can never be greater than the total local cell action current, since the former results only from imbalance of the latter. The value of the ratios is in keeping with common observations of corrosion of steel in concrete and modeling predictions25. It is noted however that while Imacrocell was evaluated by direct measurement, the value of Icorr stems from modeling assumptions of the impedance response and assumptions on the value of kinetic parameters. Thus, the value of the ratio between those magnitudes is subject to modeling/assumption uncertainty and interpretation of that value is limited to the above observation that, on average, it is in a plausible range.
1.E-01
1.E+00
1.E+01
1.E+02
0.E+00 2.E+03 4.E+03 6.E+03 8.E+03 1.E+04t (h)
RS
( Ω)
S1S2S3S4
(b)
1.E-02
1.E-01
1.E+00
1.E+01
0.E+00 2.E+03 4.E+03 6.E+03 8.E+03 1.E+04t (h)
Y 0 (F
sn-
1 )S1S2S3S4
(a)
0.3
0.4
0.5
0.6
0.7
0.8
0.E+00 2.E+03 4.E+03 6.E+03 8.E+03 1.E+04t (h)
n
S1S2S3S4
(c)
1.E-06
1.E-05
1.E-04
1.E-03
1.E-02
0.E+00 2.E+03 4.E+03 6.E+03 8.E+03 1.E+04t (h)
I corr
(A)
S1S2S3S4
(d)
12

Figure 11. Comparison between Imacrocell and the total Icorr estimated by EIS for (a) P and (b) S assemblies.
LPR measurements were conducted over the same general time frame as the EIS tests, and the Icorr values estimated by LPR (LPR-Icorr) and by EIS (EIS-Icorr) are compared in Figure 12 for both types of assemblies. As in Figure 11, the diagonal line corresponds to a hypothetical 1:1 agreement between both values. To determine the LPR-Icorr values a refined RP (LPR-RP) was used. The LPR-RP values were compensated for RS and for the presence of interfacial CPE behavior using the corresponding parameters obtained from the EIS measurements. The compensation was made by first subtracting an amount equal to I•Rs from the potential V at each point of the measured current (I) - V curve obtained in the LPR test, thus obtaining an ohmic resistance-compensated curve I-Vcomp. The correction for the current demanded by the CPE was done by the following relationship26:
( )
1
max0
11
−−
⎥⎥⎦
⎤
⎢⎢⎣
⎡
−Γ+=
nVSY
RR
nn
aP (5)
where Vmax is the maximum compensated potential applied, S is the scan rate (0.1 mV/s), Γ is the Euler´s Gamma function, and Ra is the apparent RP determined by the slope at V=Vmax of the I-Vcomp curve, and Y0 and n are the CPE parameters obtained from the impedance experiment performed usually 6 to 10 h before. It is noted that the correction represents only a first approximation, as it does not take into consideration the convolution resulting from the simultaneous presence of the RS and the CPE26.
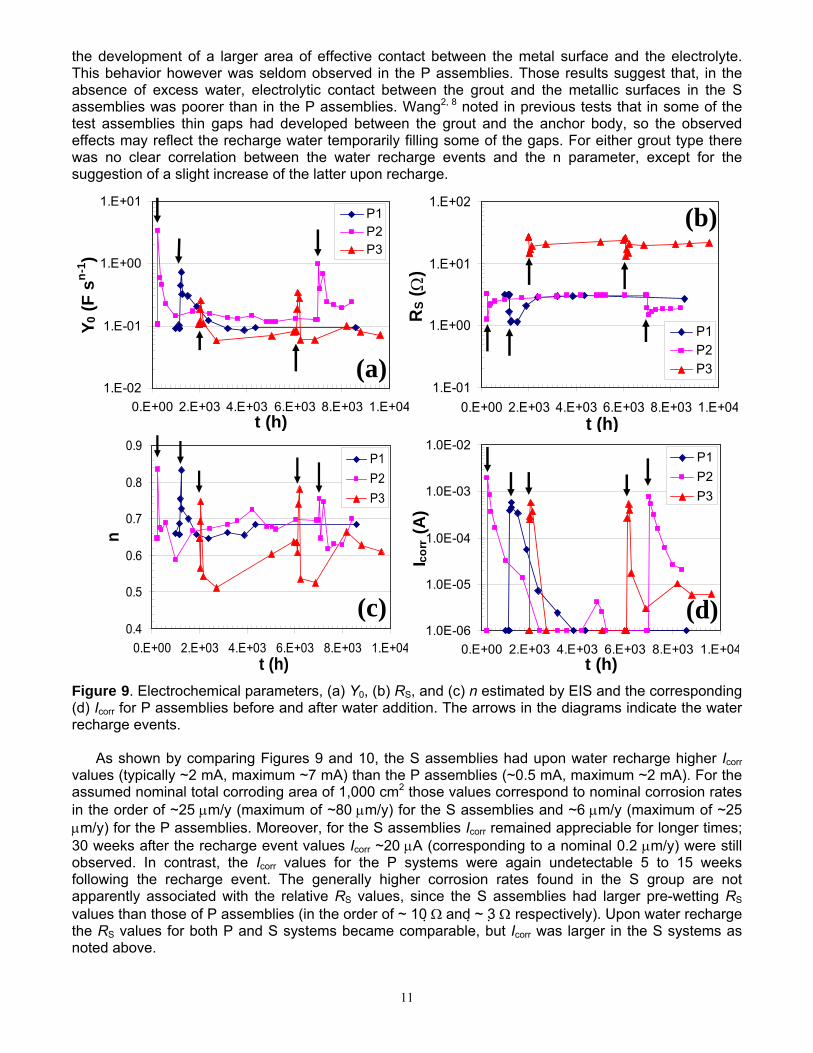
Figure 12 shows general agreement between the EIS-Icorr and LPR-Icorr trends when EIS-Icorr was higher than 10 μA. The ratios between LPR-Icorr and EIS-Icorr in those cases were ~ 1 to 2 and ~ 1 to 1.5 for P and S assemblies, respectively. When EIS-Icorr decreased several weeks after the recharge event, the ratios became larger (ratios > 30 occurred for both assemblies if EIS-Icorr was small enough), likely reflecting uncertainty as noted earlier in determining RP (and consequently Icorr) when it is very large. Nevertheless, the results show that the simpler LPR technique can detect ongoing corrosion in these assemblies, and reveal the sudden increase of the corrosion rates upon water intrusion.
Both polarization techniques as well as the macrocell current measurements used indicated usually higher corrosion rates in the S group, even though salt water was never added there. Those results support the concern that the native chemical composition of this proprietary low-bleed grout may create
1.E-07
1.E-06
1.E-05
1.E-04
1.E-03
1.E-02
1.E-07 1.E-06 1.E-05 1.E-04 1.E-03 1.E-02Icorr (A)
I mac
roce
ll (A
)P1P2P3
(a)1.E-07
1.E-06
1.E-05
1.E-04
1.E-03
1.E-02
1.E-07 1.E-06 1.E-05 1.E-04 1.E-03 1.E-02Icorr (A)
I mac
roce
ll (A
)
S1S3
(b)
13
a more corrosive environment upon external leakage than otherwise. Such concerns have been noted by Bricker11 and Wang2, 8, the latter in connection with the presence of relatively high, but still meeting specifications, native chloride content of the grout. This issue should be examined in detail in future work.
Figure 12. Comparison of total Icorr estimated by EIS and LPR for (a) P and (b) S assemblies.
It is recognized that application of the conventional techniques examined here involves numerous
assumptions and simplifications, so accurate determination of corrosion rates is not obtained. However, the techniques provide clear indication of the onset of active corrosion and approximate numerical indicators of its severity suitable for an early warning system. Regardless of the factors responsible for the observed corrosion, the above results demonstrated the ability of both LPR and EIS methods to detect corrosion in post-tensioning tendons, in one case when EN had been unable to do so. From the point of view of practical deployment the LPR technique would be preferable since this method is simpler to implement than EIS because of less demanding data acquisition and processing needs. The approach illustrated here to process the LPR data assumed that some EIS testing had already taken place, since RS, n and Y0 values were used in the calculations. The need for such prior determination can be obviated with a compromise approach. Such approach would involve, in the case of RS, conducting a simple single-frequency test (for example at ~100 Hz, with instrumentation function similar to that of a soil resistivity meter) and building such test into the instrumentation and testing protocols, thus keeping instrumental complexity to a minimum. The correction for Y0 and n may be conducted, as an approximation, using generic values of those parameters obtained separately from similar systems such as those used in the present investigation.
Atmospheric Corrosion at the Bleed Water Voids
The EIS behavior of WGW probes exposed to 95% RH environment had general features similar to
those of the mock-up assemblies, but with a better defined additional high frequency semicircle in the impedance diagram. That high frequency semicircle corresponds to the solution resistance RS and dielectric capacitance (CS) of the grout bridge. Because that system has a very short time constant, the analysis to determine the circuit parameters relevant to the polarization of the corrosion reactions was limited to the frequency interval from 10 mHz to 1 Hz, where the effect of Cs is small(1). The second (1) A few of the tests revealed a more complex spectrum, with two time constants in the low frequency regime. In those cases, only a restricted range of frequencies at the low end of the spectrum (from ~100 mHz to 10 mHz) was used for analysis. The cases involved were for days 39,42,64,94 and 208 in 0.6 mm gap WGW0 and for days 229-264 in 1 mm gap WGW4.
1.E-07
1.E-06
1.E-05
1.E-04
1.E-03
1.E-02
1.E-07 1.E-06 1.E-05 1.E-04 1.E-03 1.E-02LPR-Icorr (A)
EIS-
I corr (A
)
P2P3
(a)1.E-07
1.E-06
1.E-05
1.E-04
1.E-03
1.E-02
1.E-07 1.E-06 1.E-05 1.E-04 1.E-03 1.E-02LPR-Icorr (A)
EIS-
I corr (A
)
S1S3
(b)
14
semicircle is related to the series combination of the impedance of the metal-grout interface of both wires. Each interfacial impedance was idealized as the parallel combination of a polarization resistance RP and a CPE with parameters Y0 and n. For simplicity the two metal-grout interfaces were assumed to behave similarly. Thus, the measured impedance could be represented by a resistor of value RP*=2RP and a CPE with parameters Y0*=Y0/2 and n, in series with RS. The EIS data were analyzed accordingly and the results in the following are discussed in terms of the parameter values for one of the interfaces.
Upon initial exposure to the 95% RH environment the RS and the RP values for 1 mm gap WGW
probes were small, but then increased drastically tending to stabilize after ~50 days. The increase in RS likely reflects the establishment of a less interconnected pore network in the grout as curing matures. The values for RP in the 0.6 mm probes were in the same order as those for the 1mm probes, but not as stable. The values of RS were about one order of magnitude greater than those for the 1 mm gap probes and less stable as well. As for the mockup PT assemblies, LPR measurements processed as described earlier yielded RP values comparable to those obtained from EIS measurements.
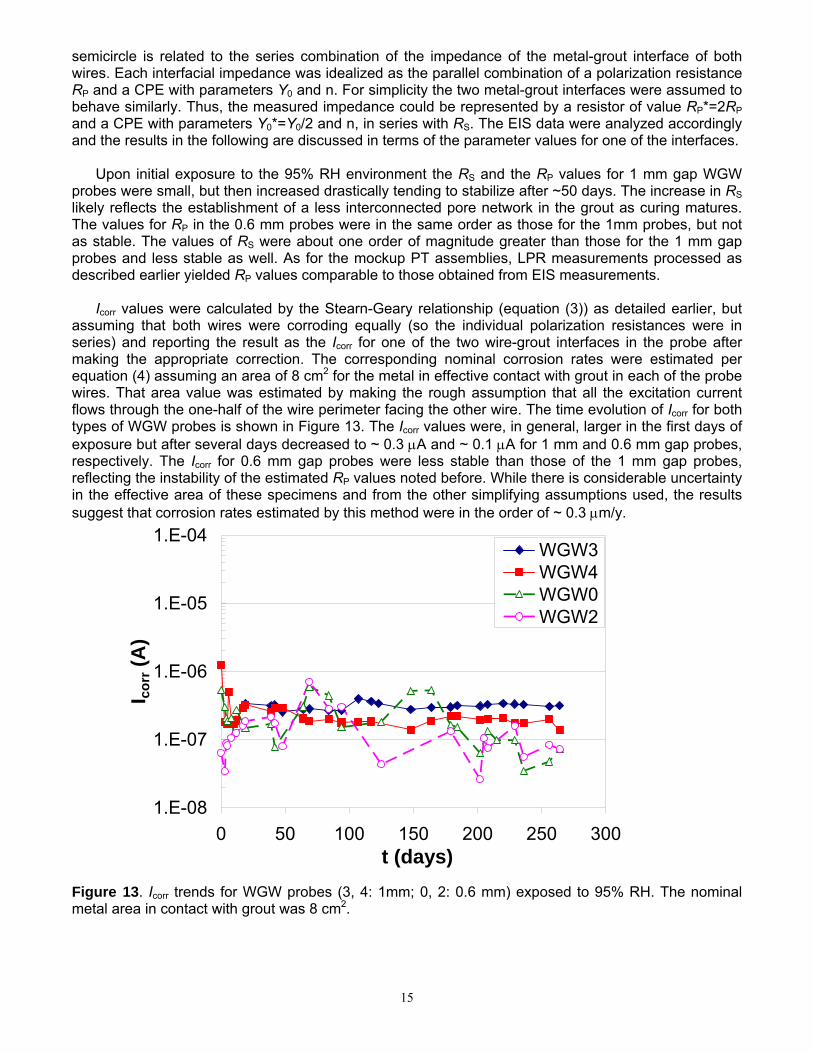
Icorr values were calculated by the Stearn-Geary relationship (equation (3)) as detailed earlier, but
assuming that both wires were corroding equally (so the individual polarization resistances were in series) and reporting the result as the Icorr for one of the two wire-grout interfaces in the probe after making the appropriate correction. The corresponding nominal corrosion rates were estimated per equation (4) assuming an area of 8 cm2 for the metal in effective contact with grout in each of the probe wires. That area value was estimated by making the rough assumption that all the excitation current flows through the one-half of the wire perimeter facing the other wire. The time evolution of Icorr for both types of WGW probes is shown in Figure 13. The Icorr values were, in general, larger in the first days of exposure but after several days decreased to ~ 0.3 μA and ~ 0.1 μA for 1 mm and 0.6 mm gap probes, respectively. The Icorr for 0.6 mm gap probes were less stable than those of the 1 mm gap probes, reflecting the instability of the estimated RP values noted before. While there is considerable uncertainty in the effective area of these specimens and from the other simplifying assumptions used, the results suggest that corrosion rates estimated by this method were in the order of ~ 0.3 μm/y.
Figure 13. Icorr trends for WGW probes (3, 4: 1mm; 0, 2: 0.6 mm) exposed to 95% RH. The nominal metal area in contact with grout was 8 cm2.
1.E-08
1.E-07
1.E-06
1.E-05
1.E-04
0 50 100 150 200 250 300t (days)
I corr (A
)
WGW3WGW4WGW0WGW2
15
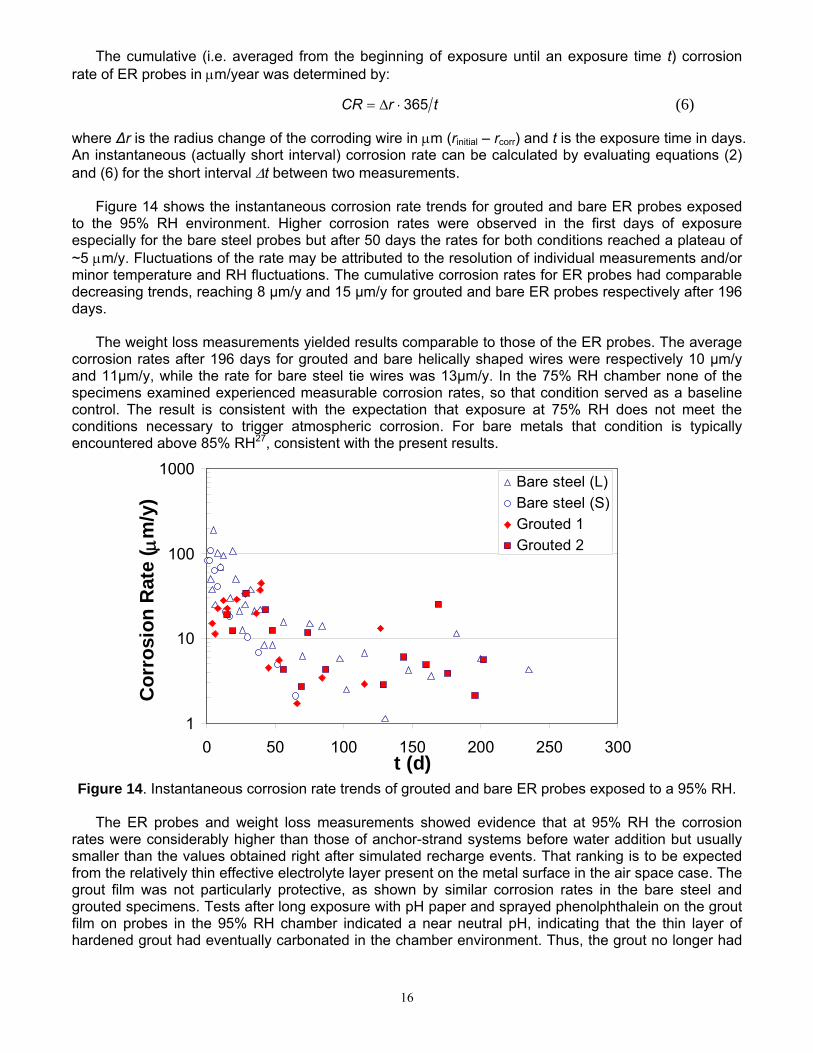
The cumulative (i.e. averaged from the beginning of exposure until an exposure time t) corrosion rate of ER probes in μm/year was determined by:
trCR 365⋅Δ= (6) where Δr is the radius change of the corroding wire in μm (rinitial – rcorr) and t is the exposure time in days. An instantaneous (actually short interval) corrosion rate can be calculated by evaluating equations (2) and (6) for the short interval Δt between two measurements.
Figure 14 shows the instantaneous corrosion rate trends for grouted and bare ER probes exposed
to the 95% RH environment. Higher corrosion rates were observed in the first days of exposure especially for the bare steel probes but after 50 days the rates for both conditions reached a plateau of ~5 μm/y. Fluctuations of the rate may be attributed to the resolution of individual measurements and/or minor temperature and RH fluctuations. The cumulative corrosion rates for ER probes had comparable decreasing trends, reaching 8 μm/y and 15 μm/y for grouted and bare ER probes respectively after 196 days.
The weight loss measurements yielded results comparable to those of the ER probes. The average
corrosion rates after 196 days for grouted and bare helically shaped wires were respectively 10 μm/y and 11μm/y, while the rate for bare steel tie wires was 13μm/y. In the 75% RH chamber none of the specimens examined experienced measurable corrosion rates, so that condition served as a baseline control. The result is consistent with the expectation that exposure at 75% RH does not meet the conditions necessary to trigger atmospheric corrosion. For bare metals that condition is typically encountered above 85% RH27, consistent with the present results.
Figure 14. Instantaneous corrosion rate trends of grouted and bare ER probes exposed to a 95% RH.
The ER probes and weight loss measurements showed evidence that at 95% RH the corrosion
rates were considerably higher than those of anchor-strand systems before water addition but usually smaller than the values obtained right after simulated recharge events. That ranking is to be expected from the relatively thin effective electrolyte layer present on the metal surface in the air space case. The grout film was not particularly protective, as shown by similar corrosion rates in the bare steel and grouted specimens. Tests after long exposure with pH paper and sprayed phenolphthalein on the grout film on probes in the 95% RH chamber indicated a near neutral pH, indicating that the thin layer of hardened grout had eventually carbonated in the chamber environment. Thus, the grout no longer had
1
10
100
1000
0 50 100 150 200 250 300t (d)
Cor
rosi
on R
ate
( μm
/y)
Bare steel (L)Bare steel (S)Grouted 1Grouted 2
16
passivating properties to the steel and it is not surprising that measurable corrosion was taking place. This was further confirmed by direct observation of rusting on ER, weight loss and even some of the WGW probe wires.
The observation of rust on some WGW probe wires clearly indicated that significant corrosion was taking place. However, even though still greater than those in the mock-up anchorages before water recharge, the WGW apparent corrosion rates were one order of magnitude lower than those obtained by ER or weight loss. This discrepancy may be attributed in part to uncertainty in estimating the effective probe area in contact with grout. That area may be much less than the nominal assumed value because of cracks in the grout or disbondment at the grout-metal interface, thus greatly underestimating the actual rates over the remaining area of contact. Another likely cause of insensitivity would be that the assumption of equal electrochemical behavior at the two metal-grout interfaces in a probe is wrong. If corrosion were to start at only one of the interfaces with the other largely in the passive condition, then the total series impedance would still be very large and the corresponding apparent current density would stay low until both wires are simultaneously in the active condition.
The worst-case surface-averaged corrosion rate values observed in the high humidity chamber
(about 10 μm/y), if sustained over 10 years would correspond to an average loss of diameter of 100 μm, or about 8% reduction in cross-sectional area in a 5 mm diameter wire. Such a loss may already be considered of concern even if it were uniform, considering that one decade is a relatively short time compared to typical design life goals. As corrosion is likely to show some degree of localization, critical loss of strength could occur even earlier. Thus, these findings highlight air space corrosion as a potential cause of strand failure.
The same caveats noted in the previous section as to accuracy of the methods investigated apply
here as well. The tests nevertheless showed that ER probes can detect instantaneous and cumulative corrosion loss with good sensitivity for both grouted and bare steel strands exposed to the simulated air void environment, if high relative humidity conditions exist. The interpretation of the WGW probe results needs to be refined to better assess their usefulness.
CONCLUSIONS
1) The feasibility of electrochemical noise (EN) measurements in strand-anchor assemblies with simulated bleed water voids was demonstrated for both potential (ENP) and current (ENC) modalities. Simple embedded electrodes sufficed. High sensitivity (μV range) ENP measurements, necessary due to the large working electrode area, could be achieved without need for highly sophisticated signal processing instruments. 2) Anchor assemblies were built with plain cement grout (P) and a proprietary grout (S). The potential and galvanic current trends for both assemblies confirmed the presence of apparent activation-passivation cycles linked to water recharge events. Sizable (e.g. 100 μA range) corrosion macrocell currents developed upon those events between the strand and the anchor components. 3) In P assemblies water recharge events were concurrent with high amplitude EN signals, resembling those related to metastable pitting events. However, the water recharge events did not produce recognizable EN signatures for the S assemblies, despite the presence of a strong macrocell current. 4) The lack of noise response in the S assemblies showed that EN technique may be limited to detecting adequately only some forms of corrosion in PT anchorages (e.g those were pitting is predominant), leaving other potentially important corrosion modalities undetected. 5) The feasibility of practical implementation of traditional electrochemical corrosion measurements such as Electrochemical Impedance Spectroscopy (EIS) and Linear Polarization Resistance (LPR) in
17

strand-anchor assemblies was demonstrated. In contrast to EN, the EIS and LPR methods reliably and sensitively detected ongoing corrosion in the circumstances examined. 6) The EIS and LPR measurements successfully documented the onset of corrosion, the strength of the corrosion reactions, and the time evolution of corrosion before and after simulated recharge events. The results also were consistent with the expected relative magnitude of macrocell and total corrosion currents in the system. 7) There was good correlation between EIS and LPR measurements showing that the latter, simpler method has good potential for practical implementation. 8) Simulated air-space corrosion experiments showed that an aggressive environment may evolve in the grout void even on strand wires covered with a residual hardened grout layer, resulting in corrosion rates that may have damaging effects in a relatively short service time. 9) Electrical Resistance (ER) probes customized for PT anchor air space conditions showed adequate sensitivity to detect the corrosion rates of interest. The results were validated against direct gravimetric measurements. 10) Wire-Grout-Wire (WGW) probes for EIS and LPR measurements in PT anchor air space conditions were operational. However, the interpretation of the WGW probe results needs to be refined to better assess their usefulness.
ACKNOWLEDGMENTS
This investigation was supported by the State of Florida Department of Transportation and the U.S. Department of Transportation. The opinions, findings and conclusions expressed in this publication are those of the authors and not necessarily those of the supporting agencies.
REFERENCES 1. A. A. Sagüés, R. G. Powers, H. Wang, “Mechanism of Corrosion of Steel Strands in Post
Tensioned Grouted Assemblies” Corrosion/2003, Paper No. 03312 (Houston, TX, NACE, 2003). 2. H. Wang, A. A. Sagüés, and R. G. Powers, “Corrosion of the Strand-Anchorage System in Post-
Tensioned Grouted Assemblies” Corrosion/2005, Paper No. 05266 (Houston, TX, NACE, 2005). 3. R. G. Powers, “Corrosion Evaluation of Post-Tensioned Tendons on the Niles Channel Bridge”
Florida Department of Transportation, Florida, June 29, 1999. 4. A. A. Sagüés, S. C. Kranc, R. H. Hoehne, “Initial Development of Methods for Assessing Condition
of Post-Tensioned Tendons of Segmental Bridges” May, 2000. 5. J. Corven, “Mid Bay Bridge Post-Tensioning Evaluation” Final Report, Florida Department of
Transportation, Florida, October, 2001. 6. FDOT (Florida Department of Transportation), “Sunshine Skyway Bridge Post-Tensioned Tendons
Investigation” February, 2002. 7. R. M. Salas, A. J. Schokker, J. S. West, J. E. Breen, M. E. Kreger, “Conclusions,
Recommendations and Design Guidelines for Corrosion Protection of Post-Tensioned Bridges” Report FHWA/TX-04/0-1405-9, Texas Department of Transportation, Texas, February, 2004.
8. H. Wang, A. A. Sagüés, “Corrosion of Post-Tensioning Strands” Final Report BC353-33, Florida Department of Transportation, Florida, November 1, 2005.
9. R. G. Powers, Sagüés, A. A., Virmani, Y. P., “Corrosion of Strand-Anchorage System in Post-Tensioned Grouted Assemblies,” in Proc. 17th U.S.-Japan Bridge Engineering Workshop, held Nov. 12-14, 2001, p. 579, Japan: Public Works Research Institute, 2002.
10. A. Ghorbanpoor, S. C. Madathanapalli, “Performance of Grouts for Post-Tensioned Bridge Structures” Report FHWA-RD-92-095, Federal Highway Administration, Washington, DC, 1992.
18
11. M. D. Bricker, A. J. Schokker, “Corrosion from Bleed Water in Grouted Post-Tensioned Tendons”, R&D Serial No. 2547, Portland Cement Association, Skokie, Illinois, USA, 2005.
12. E. I. Moreno, A. A. Sagüés, “Carbonation-Induced Corrosion of Blended-Cement Concrete Mix Designs for Highway Structures,” paper no. 636, CORROSION/98, NACE International, Houston, 1998.
13. L. Li, A. A. Sagüés, Corrosion 57, 19 (2001). 14. R. A. Cottis, Corrosion 57, 265 (2001). 15. R. A. Cottis, in Corrosion/2006, Paper No. 06432, NACE International, Houston, TX (2006). 16. L. V. Taveira, B. Joseph, A. A. Sagüés, "Electrochemical Noise Corrosion Monitoring of Post
Tensioned Tendons", ECS Transactions Vol. 13, Issue 13, pp. 129-138, 210th ECS Meeting, October 29-November 3, 2006, Cancun, Mexico, "Corrosion of Infrastructure", The Electrochemical Society, Pennington, NJ, 2007.
17. F. Mansfeld, J. V. Kenkel, Corros. Sci. 16, 111 (1976). 18. J.F. Young, “Humidity control in the laboratory using salt solutions - A Review,” J. Appl. Chem. 17,
241 (1967). 19. J. W. Dally, W. F. Riley, K. G. McConnell, “Instrumentation for Engineering Measurements”, 2nd Ed.,
John Wiley & Sons, Inc., Hoboken, NJ, 1993. 20. K. Sasaki, P. W. Levy, and H. S. Isaacs, Electrochem. Solid-State Lett. 5, B25 (2002). 21. I. Arrieta, M. Sc. Thesis, “The Effect of Surface Area on Electrochemical Noise of Aluminum Alloys
1100, 2024 and 5052 in Chloride Media”, University of South Florida, Tampa, FL (2003). 22. I. Arrieta, A. A. Sagüés, and B. Joseph, in Corrosion/2004, Paper No. 04456, NACE International,
Houston, TX (2004). 23. J.C. Uruchurtu, J.L. Dawson, Corrosion 43, 19 (1987). 24. F. Mansfeld, “The Polarization Resistance Technique” in Advances in Corrosion Science and
Technology, Vol. 6, M. G. Fontana and R. W. Staehle, Eds., Plenum Press (1976). 25. S. C. Kranc and A. A. Sagüés, Corrosion 50, 50 (1994). 26. A. Sagüés, S. Kranc, E. Moreno, Corrosion Science 37, 1097 (1995). 27. R. B. Griffin, “Corrosion in Marine Atmospheres,” in Corrosion: Environments and Industries, ASM
Handbook Vol. 13c, pp. 42-60, ASM International, Materials Park, OH, 2006.
19