Embed Size (px)
Citation preview

(This is a sample cover image for this issue. The actual cover is not yet available at this time.)
This article appeared in a journal published by Elsevier. The attachedcopy is furnished to the author for internal non-commercial researchand education use, including for instruction at the authors institution
and sharing with colleagues.
Other uses, including reproduction and distribution, or selling orlicensing copies, or posting to personal, institutional or third party
websites are prohibited.
In most cases authors are permitted to post their version of thearticle (e.g. in Word or Tex form) to their personal website orinstitutional repository. Authors requiring further information
regarding Elsevier’s archiving and manuscript policies areencouraged to visit:
http://www.elsevier.com/copyright

Author's personal copy
Technical Note
New technology for measuring the in situ performance of rock bolts
A.J.S. Spearing a,n, A.J. Hyett b, T. Kostecki a, M. Gadde c
a Southern Illinois University, Carbondale, United Statesb Yieldpoint Inc, Canadac Peabody Energy, United States
a r t i c l e i n f o
Article history:
Received 14 November 2011
Received in revised form
24 July 2012
Accepted 27 July 2012
1. Introduction
The vast majority (490%) of the approximately 68 million roofbolts installed annually in underground coal mines in the USA arefully grouted using resin cartridges. Among the bolts that useresin, the most popular is the fully grouted rebar bolt, which isconsidered a passive (un-tensioned) support as it is un-tensionedon installation. In 2005 it was estimated that about 68% of all thebolts used in US were passive rebar bolts [1]. The other class ofroof bolts is considered active systems, as they apply someamount of load to the roof at the time of installation.
Despite the safety consequences of ground instability, thereremains a deficit of practical engineering understanding indicatinghow roof bolts provide reinforcement to the rock mass surroundingan excavation as mining proceeds. This applies particularly to ‘‘fullygrouted’’ bolts which have gained popularity due to their superiorperformance compared to ‘‘end-anchored’’ bolts. Whereas for an endanchored bolt the tension in the bolt is constant over its length, for afully grouted bolt the load distribution is more complex and variesdepending on factors such as (i) the physical properties of the bolt(ii) the installation procedure, (iii) the polyester resin bond betweenthe bolt and the rock borehole, and finally but importantly (iv) thedistribution of movement in the rock mass surrounding the bolt.
Whereas all previous attempts at rock bolt instrumentationhave used resistive strain gauges, the new instrumentationdescribed in this paper is based on an array of small diameterdisplacement sensors that directly measure the induced displace-ment (i.e. stretch) of the bolt over its entire length. Upon dividingthe measured displacement by the base-length of the sensor, anaverage strain is determined, which based on the materialproperties of the bolt, can be related to the load. The design anddevelopment of the instrumentation has been influenced by the
requirement to provide both (i) a tool that can validate existingexperimental and theoretical research, and (ii) a commercial andcost effective rock bolt monitoring solution. Results are presentedfrom two initial field trials in room-and-pillar coal mines oper-ated by Peabody Energy.
2. Theoretical load distribution along rock bolts
Theoretical understanding provides the foundation for thedesign, implementation and interpretation of any successfulinstrumentation project, especially one relating to a problem ascomplex as the rock bolts/rock mass interaction. As mentionedabove, for a fully grouted bolt the rock displacement profile has amajor effect on the load distribution induced along the bolt.
2.1. Rock bolt behaviour in a continuous rock mass
The majority of recent theoretical and analytical studies havebeen focussed on the axial deformation of fully grouted rock boltsin response to continuous distribution of rock mass convergence[2–7].
Freeman [2] presented a conceptual model for the axialloading of a rock-bolt in a continuum that divided the bolt intotwo sections (Fig. 1). The pick-up length, which is closest toexcavation surface, is that length of the bolt for which the rockdisplaces more than the bolt and for which the shear forcesdeveloped in the grout annulus restrain rock movement. Tomaintain equilibrium along the bolt, there must exist also asection of bolt for which the shear forces are of the oppositesense. This section is referred to as the anchor length because thebolt displaces more than the rock and therefore the rock restrainsthe bolt from moving towards the excavation surface. The point ofmaximum axial load along the bolt is referred to as the neutral
point and is defined as that point at which the rock mass and thebolt displace equally so that the shear stress within the resin
Contents lists available at SciVerse ScienceDirect
journal homepage: www.elsevier.com/locate/ijrmms
International Journal ofRock Mechanics & Mining Sciences
1365-1609/$ - see front matter & 2012 Elsevier Ltd. All rights reserved.
http://dx.doi.org/10.1016/j.ijrmms.2012.07.027
n Corresponding author. Tel.: þ1 618 9251718.
E-mail address: [email protected] (A.J.S. Spearing).
International Journal of Rock Mechanics & Mining Sciences 57 (2013) 153–166

Author's personal copy
annulus is zero. Freeman’s conceptual model was in agreementwith in situ data collected from instrumented bolts installed in softmudstone as part of the Kielder (UK) experiment. If the bolt isinstalled tight to the excavation surface with a rigid plate, the bolthead and the excavation surface will displace equally so that theneutral point occurs at the excavation surface (Fig. 1b). However,in practice the flexural response of the plate and its bearing actionwill be somewhat compliant, so that even with a face plate the boltwill exhibit behaviour intermediate between the two cases shown.
Analytical and theoretical studies [3–7] have established thataxial rock bolt performance depends on such factors as: (i) themechanical properties of the bolt and faceplate, (ii) installationcharacteristics such as whether the rock-bolt is actively pre-tensioned, (iii) the bond properties between the bolt and the grout,(iv) the bond properties between the grout and the rock, and (v) thetiming of bolt installation after excavation is created [5].
2.2. Rock bolt behaviour in a discontinuous rock mass
In a discontinuous rock mass the load distribution alongthe bolt will be dominated by a limited number of localized
discontinuity openings [8]. A closed form solution to this problemwhen a rock bolt transects a rock discontinuity undergoingdilatational behaviour was developed by Hyett et al. [9]. Numer-ical models demonstrated that, especially for longer bolts such afully grouted cable bolts, several peaks in load may occur alongthe bolt length. Such an effect was observed experimentally byBjornfot and Stephansson [10] for bolts in very hard, blocky rockat the Kiruna Mine in Sweden.
A localized ‘‘dowel’’ effect [11] occurs when a rock-bolt transectsa rock discontinuity which is undergoing shear behaviour. If therock bolt is aligned perpendicular to the discontinuity under shearthen the deformation may be almost perfect shear, however in thegeneral case a combination of shear and axial deformation willoccur. Numerous instances have been reported by Li [8] for whichfailed bolts displaying permanent shearing have been exposed aftera fall of ground, and McHugh and Signer [12] state that shearloading can significantly contribute to the failure of bolts used forrock reinforcement in coal mines. However, the literature on theshear loading of rock bolts is less extensive than that for that foraxial loading, because this complex loading mechanism is difficultto monitor without a priori knowledge of the shearing location.
Fig. 1. The two different end conditions for the rock bolt problem: (a) no faceplate, and (b) faceplate attached at the excavation surface.
A.J.S. Spearing et al. / International Journal of Rock Mechanics & Mining Sciences 57 (2013) 153–166154

Author's personal copy
3. Previous experimental work
Over the preceding 30 years an extensive body of experimentalresearch has been conducted by NIOSH [12–15], formerly the USBureau of Mines in the US. The instrumented bolts developedinvolve populating two diametrically opposed slots with pairs ofshort base-length resistive strain gauges to compensate for anybending or shear deformation diametrically opposed grooves orslots are populated with pairs of strain gauges. Hence the axialstrain is determined at discrete locations along the bolt length,each based on the equation:
eaxial ¼ ðeAþeBÞ=2 ð1Þ
where eA and eB are the strain gauge reading on Side A andSide B of the rock bolt at the same point along the bolt. Theinstrumented bolts were calibrated using a uniaxial tensionmachine in order to eliminate factors such as (i) the crosssectional area not being well defined for a slotted bolt, and (ii)inaccuracies due to strain gauge misalignment [13].
The corresponding bending strain is usually calculated from
eshear ¼ ðeA�eBÞ=2 ð2Þ
although strictly this value only yields a minimum value, sincestrain gauges located in at least three orientations would berequired to determine complete bending strain vector. If thedirection of rock mass shear displacement is known a priori, andthe orientation of the bolt can be accurately controlled duringinstallation then, in theory, measurement of shear loading can beperformed based on strain data from two slots.
An example of measurements obtained using this technology(Signer et al. [11]) is shown in Fig. 2. Even though the bolts areplated, they exhibit the characteristic behaviour predicted by theaxial continuum theoretical model without a faceplate (Fig. 1a).
Specifically, a distinct maximum in the load profile representingthe neutral point is observed around 0.75 m into the roof. Theload decreases near the roof-line indicating that the faceplate isrelatively compliant and not perfectly rigid as shown in Fig. 1b.In practice this will usually be the case (even in hard rock) since therigidity of the faceplate at the roof is compromised by its primaryrole which is to secure screen and strapping. Hence, in operationalreality, the situation in Fig. 1b, which continues to be widelyanalyzed in the literature (e.g. Ref. [12]), may be relatively rare.
4. A new experimental approach
Instrumentation design for rock bolts involves a compromisebetween the number of gauges (i.e. cost) and the accuracy withwhich the strain profile along the bolt can be resolved. Instrumentcost is important since a percentage of instrumented bolts will belost to production related attrition, firstly because the installationprocess involves spinning the grouted bolt in the polyester resin,and secondly because, at the production face, the proximity ofmobile heavy machinery presents an on-going hazard. The accu-racy with which the load distribution along the bolt is measuredusing a discrete number of gauges depends on (i) the number ofgauges, (ii) the accuracy and resolution of the gauges, and (iii) thebase-length of the gauges. Concerning the latter, short base-length strain gauges will very accurately measure the load atspecific locations but may be unrepresentative of the interveningbolt length especially if load concentrations occur at discontinu-ities. Long base-length strain gauges will capture localized defor-mation due to any discrete points of loading, but due to anaveraging effect may also be unrepresentative of the extremevalues if the strain profile varies dramatically.
Coal
0.9m 1.4m 1.3m 1.5m 1.0m
Mudstonerock
15
31
83
10668
101
8
26
31
83
107
31
100
7
11
38
98
106
56
129
6
15
75
99
85
67
116
5
AXIAL LOAD, kN
1.8
m
Coal
0.9m 1.4m 1.3m 1.5m 1.0m
Mudstonerock
2
-8
-17
-2153
-2
8
-12
-5
-13
-18
-170
-1
7
4-4
0
0
-57
1
6
1
5
0
-3278
37
5
BENDING LOAD, N-m
1.8
m
Fig. 2. Experimental load profiles determined using strain gauges [15].
A.J.S. Spearing et al. / International Journal of Rock Mechanics & Mining Sciences 57 (2013) 153–166 155

Author's personal copy
A new rock bolt instrumentation strategy has been implemen-ted based on an array of sub-micron resolution displacementsensors that measure the change in displacement or stretch (Dui)of the bolt. The end-points of the displacement sensor define abase-length (L), typically in the range 200–500 mm, which ismore than an order of magnitude longer than for a resistive foilstrain gauge.
The corresponding strain (ei) for the ith gauge is determinedfrom:
ei ¼Dui=L ð3Þ
In order to control the unit cost the number of displacementsensors for each instrumented bolt was limited to six. Thedisplacement sensors were arranged with three in each diame-trically opposed slot (sides A and B of the rock bolt) in an end-to-end arrangement (Fig. 3). Sensors denoted by i¼1, 3 and 5 are onside A and sensors 2, 4 and 6 are on side B. Two differentconfigurations referred to as (i) stacked and (ii) staggered wereinvestigated:
4.1. ‘‘Stacked’’ configuration
For the stacked configuration, the axial and bending strainwere calculated according to Eqs. (4) and (5).
eiaxial ¼ ðe
2i�1þe2iÞ=2 ð4Þ
Fiaxial ¼ EAei
axial ð5Þ
with I ¼1 to 3 corresponding to the three nodal points of loaddetermination (Fig. 4a). Since, this configuration provides onlythree points of load determination located at the centre of eachdisplacement sensor, the resolution of the load profile along thebolt is rather crude. The corresponding bending strain is
eibending ¼ ðe
2i�1�e2iÞ=2 ð6Þ
Since the gauges are arranged end-to-end and monitor thewhole length of the bolt the equivalent displacement profile can
be written as below, and represented in Fig. 5a:
Duiaxial ¼
Xn ¼ i
n ¼ 3
ðeiaxial � LÞ ð7Þ
It should be recognized that a distinction is made between themeasured displacement (Dui) from each displacement sensor andthe calculated axial displacement Dui
axial which accounts for anybending.
4.2. ‘‘staggered’’ configuration
For the staggered configuration, the gauges on Side A or thebolt are offset from those on Side B by one half the base-length ofthe sensor (L/2). In this case a data reduction scheme is imple-mented based on the central difference approximation to thesecond order governing differential equation for displacementvariation along a grouted bolt [2]. The strains at the ith nodalpoint can be approximated as
eiaxial ¼ ðe
i�1þ2eiþeiþ1Þ=4 ð8Þ
eibending ¼ ðe
i�1�2eiþeiþ1Þ=2 ð9Þ
where ei is the strain measured by the displacement gaugecentred at the ith nodal point and ei�1 and eiþ1 are the twooverlapping gauges on the opposite side of the bolt (Fig. 4b).At the ends of the bolt the following two relations are used.For node 1, the following relation is used:
e1axial ¼ ð2e1þe2Þ=3 ð10Þ
and for node 6, knowing that eaxial must be zero at the toe of thebolt:
e6axial ¼ ð2eyþe5Þ=4 ð11Þ
Again, since the gauges are arranged end-to-end and monitorthe whole length of the bolt the corresponding displacementprofile at the ith nodal point can be calculated from the summa-tion:
Duiaxial ¼
Xn ¼ i
n ¼ 6
ðeiaxial � L=2Þ ð12Þ
relative to the toe end of the bolt which is assumed fixedðDutoe
axial ¼ 0Þ, as shown in Fig. 5b. In this manner an approximationof axial displacement, strain and load can be determined at sixnodal points along the bolt (Figs. 4b and 5b). This providesadditional axial resolution compared to the stacked configurationwhile sacrificing some degree of accuracy related to bendingerrors.
Fig. 4. The calculation of axial strain from the strain values measured by the six
displacement sensors. (a) Stacked configuration and (b) Staggered configuration.
Fig. 3. The two strain gauge configurations used for the field trials. (a) Stacked
configuration and (b) Staggered configuration.
Fig. 5. The calculation scheme for axial displacement for stacked and staggered
gauges. (a) Stacked configuration and (b) Staggered configuration.
A.J.S. Spearing et al. / International Journal of Rock Mechanics & Mining Sciences 57 (2013) 153–166156

Author's personal copy
4.3. Laboratory validation and calibration
Instrumented rock-bolts need to be loaded to calibrate therelationship between load and deformation. In the current instru-ment the calibration coefficients are written into memory on theinstrument’s micro-controller. Results from a typical axial cali-bration experiment are shown in Table 1. Calibration data istypically collected on the third loading cycle. For the bolts usedin the field trials presented below the stiffness of the bolt is15.1 me/kN or 153 me/t.
Simple bending tests were conducted to establish the responseof the displacement sensor array to bending. As would beexpected from simple beam theory the gauges on the top of therock-bolt display contraction and those on the bottom demon-strate extension (Fig. 6a). When the gauges are aligned at theneutral plane (Fig. 6b) they show minimal displacement. Thissituation referred to as ‘‘bending’’ should not be confused withthat for localized shear when the zone of ‘‘shearing’’ is shortcompared to the base-length of the displacement sensor is shownin Fig. 7. On each side of the bolt the shear zone comprises aconvex/concave pair which will exhibit corresponding zones ofcontraction and extension which should cancel out. Hence thelong base-length sensors should be far less susceptible to pertur-bation related to localized shear.
Table 1Typical calibration test result.
Applied strain (me) Measured strain 1 (me) Measured strain 2 (me) Measured strain 3 (me) Measured strain 4 (me) Measured strain 5 (me) Measured. strain 6 (me)
0 0 0 0 �1 0 0
152.5 152 160 156 157 157 154
305 301 303 307 310 310 308
610 605 617 614 617 615 612
915 906 918 915 914 915 913
1220 1227 1233 1230 1226 1228 1226
1525 1531 1536 1532 1529 1530 1529
Calculated slope 1.0045 1.0069 1.0044 1.0013 1.0021 1.0021
Calculated offset �3.8464 0.9573 0.8157 2.6536 2.5154 0.628
Fig. 6. Results of a simple 3-point bending test bending tests on the bolts. (a) with
displacement sensors aligned with lateral deflection and (b) 901 to lateral
deflection.
LConcave (-ve)
Convex (+ve)Convex (+ve)
Concave (-ve)
Side BSide A
Fig. 7. Localized shearing on a bolt.
Table 2Results of pull tests on different bolt types considered for the test programme.
Bolt type Yield load Ultimate load
#6 Grade 60 forged head 119.75 kN (minimum) 179.62 kN (minimum)
0.804 Grade 75 threaded 184.16 kN (actual) 257.31 kN (actual)
0.804 Grade 75 bar 183.25 kN (actual) 261.27 kN
A.J.S. Spearing et al. / International Journal of Rock Mechanics & Mining Sciences 57 (2013) 153–166 157

Author's personal copy
End Sept
End Aug
#12,#13,#14Intersection
Bottom to Top
Fig. 8. Case Study 1 instrumented bolt site (a) The room and pillar mining sequence (b) the instrument bolt array across a heading at mid-pillar. The numbers refer to
instrumented rock bolts.
Fig. 9. Temporal strain gauge results a. Bolt 71, b. Bolt 73, c. Bolt 74, d. Bolt 75.
A.J.S. Spearing et al. / International Journal of Rock Mechanics & Mining Sciences 57 (2013) 153–166158

Author's personal copy
5. Field trials in two coal mines
Field trials were conducted in two room and pillar coal mineslocated in the Illinois Coal Basin. The results in this paper were apart of a larger research project funded by the National Instituteof Occupational Safety and Health (NIOSH).
Both mines use #6 (19 mm diameter) Grade 60 fully groutedpassive rebar for their primary support. In order to better capturethe loads experienced by roof bolts, it was decided to install theinstrumented bolts as primary support. Given that slotting formounting displacement sensors would reduce the load carryingcapacity of roof bolts, in order to achieve similar load capacity as
Fig. 10. The change in axial strain over the monitoring period (a) first logged reading 08/28/2010 (b) last reading 11/11/2010.
Fig. 11. The change in axial displacement over the monitoring period (a) first logged reading 08/28/2010 (b) last reading 11/11/2010.
Fig. 12. The bending strain over the monitoring period (a) first logged reading 08/28/2010 (b) last reading 11/11/2010.
A.J.S. Spearing et al. / International Journal of Rock Mechanics & Mining Sciences 57 (2013) 153–166 159

Author's personal copy
un-slotted #6 Grade 60 bar, initially it was proposed to use #6,Grade 75 rebar for the instrumented bolts. However, laboratorytesting of slotted #6, Grade 75 bars produced slightly lower yieldcapacity than desired. Therefore to achieve a higher or at leastcomparable capacity to the pattern bolts, it was finally decided touse 20 mm diameter, Grade 75 bars for all instrumented bolts inthese trials. Table 2 compares the tensile strengths at failure ofthese different steels. To minimize vendor related variability, allthe instrumented roof bolts, plates and resin used were donatedby the same manufacturer.
Each instrumented bolt was zeroed prior to installation in a35 mm diameter drill hole that was drilled about 25 mm longerthan the bolt. In order to ensure best practices were followedduring bolt installations, a representative of a resin and boltmanufacturing firm was present during the instrumented boltinstallations at both mines. The rock-bolts were installed as partof the routine rock-bolt installation cycle.
Unfortunately, the data-loggers could not be used until freshair was established at both sites as they were not intrinsically safeas required by the Mine Safety and Health Administration(MSHA). Consequently, there was a delay between the time theinstrumented bolts were installed as primary supports and whenthe first readings were taken (Figs. 9 and 10). Thereafter datacollection from all the instrumented bolts was by automateddata-logger at hourly intervals.
5.1. Case study 1: stacked displacement sensors
Four instrumented fully grouted passive rebar (FGPR) rockbolts were installed on 26th August 2010 at the mid pillar
location of a coal mine using a room-and-pillar mining geometry.Bolts #73 and #74 were installed at the mid-span of the headingand #71 and #75 were at the wall (Fig. 8b). Temporal plots for thefour instruments are shown in Fig. 9, with the three displacementsensor pairs being arranged as follows: Gauges 1 and 2 are thestacked pair nearest the head, 3 and 4 in the centre of the bolt and5 and 6 towards the toe. The length-wise distributions of axialstrain (eaxial), axial displacement (Duaxial), and bending strain(ebending) are plotted in Figs. 10–12, respectively. The axial stretchof the rock-bolts at the centre of the span (#73 and #74) is abouttwice as great as those nearer the wall (#71 and #75).
Fig. 13. A Contour diagram of the axial strain (uaxial in microns) in the roof of the heading (a) first logged reading 08/28/2011 (b) 11/11/2011.
Fig. 14. A Contour diagram of the axial strain (eaxial in microstrain) in the roof of the heading(a) first logged reading 08/28/2011 (b) 11/11/2011.
Fig. 15. The instrument layout for Case study 2.
A.J.S. Spearing et al. / International Journal of Rock Mechanics & Mining Sciences 57 (2013) 153–166160

Author's personal copy
Fig. 13 represents a contour map of bolt stretch (in microns)based on the 4 instrumented bolts. An almost symmetrical ‘‘arch’’pattern is defined, with a maximum stretch of 2 mm observed
at centre-span as mining progressed. The corresponding strainvalues in the bolt are contoured in Fig. 14, where 2000 microstrainscorrespond to 13.1 t of load. The following conclusions were drawn:
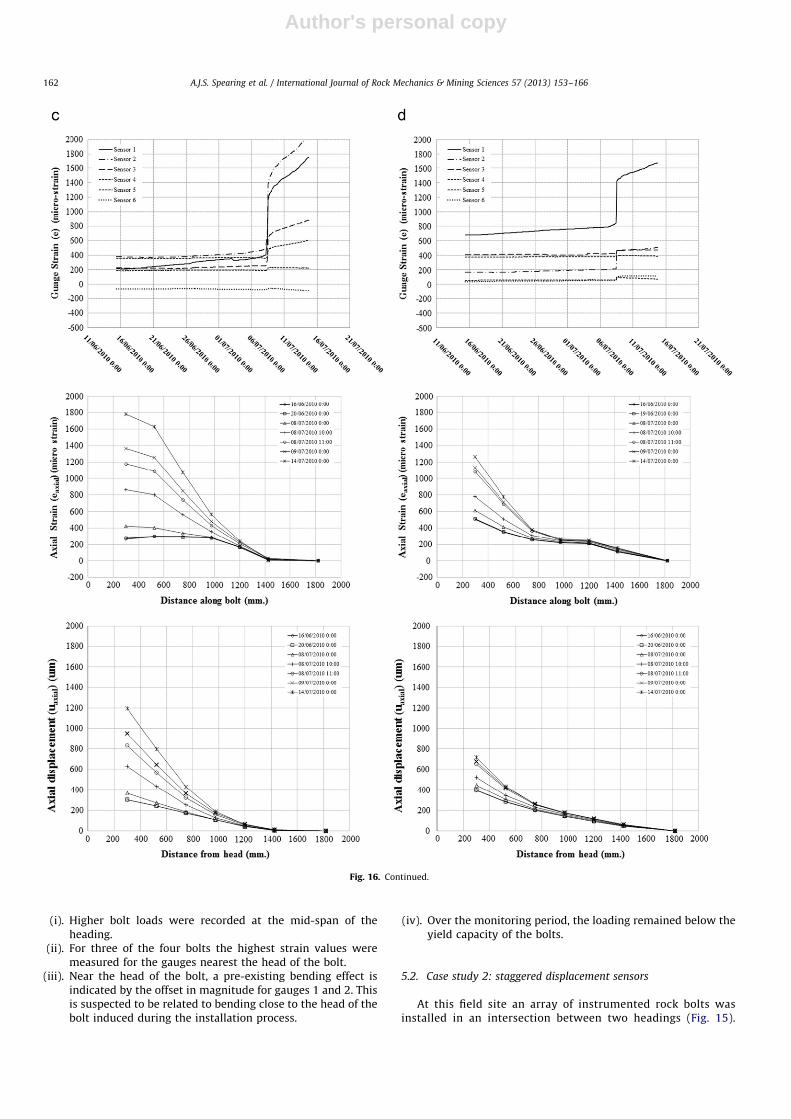
Fig. 16. (a): Gauge response (top), axial strain versus bolt length (middle) and axial displacement (stretch) versus bolt length (bottom) for FG bolt 100575078. (b): Gauge
response (top), axial strain versus bolt length (middle) and axial displacement (stretch) versus bolt length (bottom) for FG bolt 100575071. (c): Gauge response (top), axial strain
versus bolt length (middle) and axial displacement (stretch) versus bolt length (bottom) for FG bolt 100575074. (d): Gauge response (top), axial strain versus bolt length (middle)
and axial displacement (stretch) versus bolt length (bottom) for FG bolt 100575075. (e): Gauge response (top), axial strain versus bolt length (middle) and axial displacement
(stretch) versus bolt length (bottom) for FG bolt 100575077. (f): Gauge response (top), axial strain versus bolt length (middle) and axial displacement (stretch) versus bolt length
(bottom) for FG bolt 100575073. (g): Gauge response (top), axial strain versus bolt length (middle) and axial displacement (stretch) versus bolt length (bottom) for FG bolt
100575072. (h): Gauge response (top), axial strain versus bolt length (middle) and axial displacement (stretch) versus bolt length (bottom) for FG bolt 100575080.
A.J.S. Spearing et al. / International Journal of Rock Mechanics & Mining Sciences 57 (2013) 153–166 161
Author's personal copy
(i). Higher bolt loads were recorded at the mid-span of theheading.
(ii). For three of the four bolts the highest strain values weremeasured for the gauges nearest the head of the bolt.
(iii). Near the head of the bolt, a pre-existing bending effect isindicated by the offset in magnitude for gauges 1 and 2. Thisis suspected to be related to bending close to the head of thebolt induced during the installation process.
(iv). Over the monitoring period, the loading remained below theyield capacity of the bolts.
5.2. Case study 2: staggered displacement sensors
At this field site an array of instrumented rock bolts wasinstalled in an intersection between two headings (Fig. 15).
Fig. 16. Continued.
A.J.S. Spearing et al. / International Journal of Rock Mechanics & Mining Sciences 57 (2013) 153–166162

Author's personal copy
The displacement sensors for the instrumented bolts werearranged in a ‘‘staggered’’ configuration (Fig. 4b). As for casestudy 1, the bolts were fully grouted passive (FGPR). The boltswere installed on 5th June 2010 using standard operationalprocedures.
Initially all of the bolts exhibited low magnitudes of bolt loading.The typical loads are in the 2–3 t range. However it was noted thatthere were several small jumps in the bolt load with some anchors
increasing around 5–10 mm while other decreased. These eventswere synchronously detected by several bolts suggesting that theywere related to definite changes in rock mass condition or alteredmining geometry induced by asymmetrical progressive failure ofthe ribs.
However, on July 8th 2010 the bolts suddenly began to loadup much more rapidly. Fig. 16a,b,c,d and f display a precipitousincrease in bolt strain. Undoubtedly, all of these bolts are
Fig. 16. Continued.
A.J.S. Spearing et al. / International Journal of Rock Mechanics & Mining Sciences 57 (2013) 153–166 163

Author's personal copy
responding to the same rock mass deformation event occurringat this intersection, however very different responses weremeasured from bolt to bolt. If, as predicted by the numericalsolutions for loading of a bolt in a discontinuous rock [9], themaximum load develops where the bolt intersects a disconti-nuity, then it is conceivable that markedly different loadprofiles may be measured within an array of bolts if thatdiscontinuity is inclined. Such numerical models also display
sharp peaks in axial load around the discontinuity. As shown inthe axial load profiles in Fig. 16a to d, even though there was asharp jump in the axial loads of five intersection bolts whenviewed temporally, the axial load distribution along bolt lengthdid not display any sharp peaks that are expected at a discretediscontinuity.
To further understand the axial load trends in the inter-section, the bolt strain distribution was contoured for a row
Fig. 16. Continued.
A.J.S. Spearing et al. / International Journal of Rock Mechanics & Mining Sciences 57 (2013) 153–166164
Author's personal copy
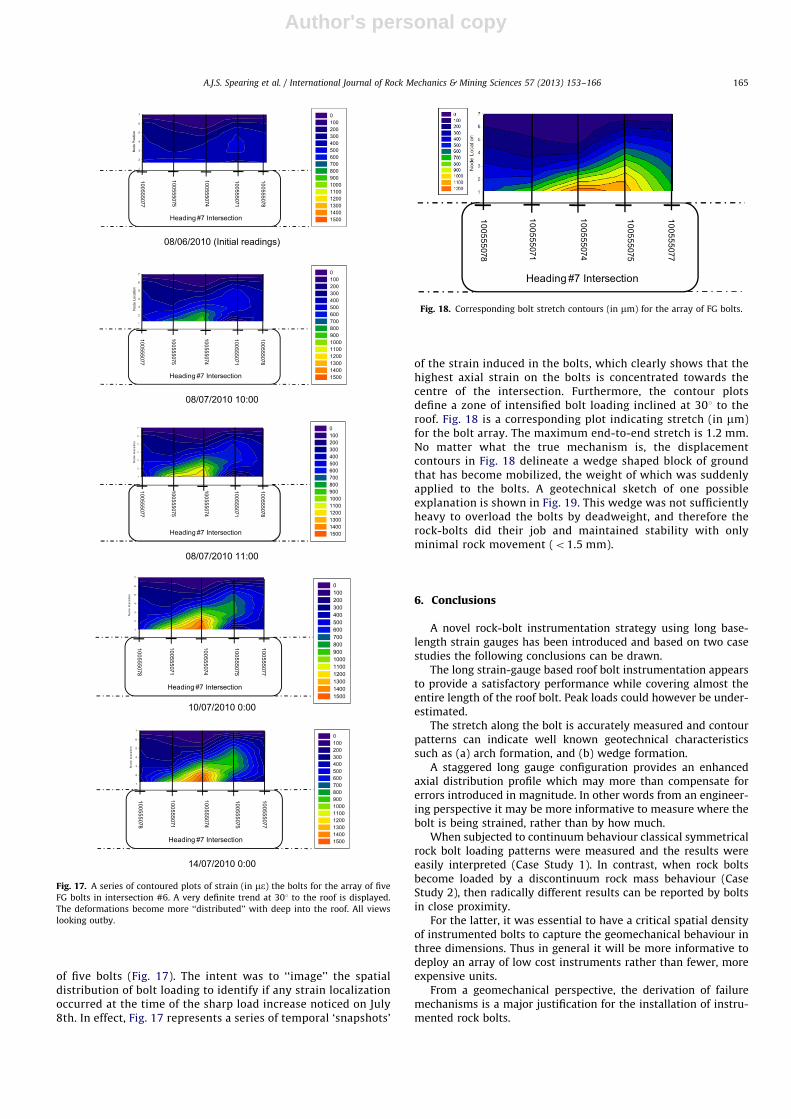
of five bolts (Fig. 17). The intent was to ‘‘image’’ the spatialdistribution of bolt loading to identify if any strain localizationoccurred at the time of the sharp load increase noticed on July8th. In effect, Fig. 17 represents a series of temporal ‘snapshots’
of the strain induced in the bolts, which clearly shows that thehighest axial strain on the bolts is concentrated towards thecentre of the intersection. Furthermore, the contour plotsdefine a zone of intensified bolt loading inclined at 301 to theroof. Fig. 18 is a corresponding plot indicating stretch (in mm)for the bolt array. The maximum end-to-end stretch is 1.2 mm.No matter what the true mechanism is, the displacementcontours in Fig. 18 delineate a wedge shaped block of groundthat has become mobilized, the weight of which was suddenlyapplied to the bolts. A geotechnical sketch of one possibleexplanation is shown in Fig. 19. This wedge was not sufficientlyheavy to overload the bolts by deadweight, and therefore therock-bolts did their job and maintained stability with onlyminimal rock movement (o1.5 mm).
6. Conclusions
A novel rock-bolt instrumentation strategy using long base-length strain gauges has been introduced and based on two casestudies the following conclusions can be drawn.
The long strain-gauge based roof bolt instrumentation appearsto provide a satisfactory performance while covering almost theentire length of the roof bolt. Peak loads could however be under-estimated.
The stretch along the bolt is accurately measured and contourpatterns can indicate well known geotechnical characteristicssuch as (a) arch formation, and (b) wedge formation.
A staggered long gauge configuration provides an enhancedaxial distribution profile which may more than compensate forerrors introduced in magnitude. In other words from an engineer-ing perspective it may be more informative to measure where thebolt is being strained, rather than by how much.
When subjected to continuum behaviour classical symmetricalrock bolt loading patterns were measured and the results wereeasily interpreted (Case Study 1). In contrast, when rock boltsbecome loaded by a discontinuum rock mass behaviour (CaseStudy 2), then radically different results can be reported by boltsin close proximity.
For the latter, it was essential to have a critical spatial densityof instrumented bolts to capture the geomechanical behaviour inthree dimensions. Thus in general it will be more informative todeploy an array of low cost instruments rather than fewer, moreexpensive units.
From a geomechanical perspective, the derivation of failuremechanisms is a major justification for the installation of instru-mented rock bolts.
08/06/2010 (Initial readings)
08/07/2010 10:00
08/07/2010 11:00
10/07/2010 0:00
14/07/2010 0:00
Fig. 17. A series of contoured plots of strain (in me) the bolts for the array of five
FG bolts in intersection #6. A very definite trend at 301 to the roof is displayed.
The deformations become more ‘‘distributed’’ with deep into the roof. All views
looking outby.
Heading #7 Intersection
100555078
100555074
100555075
100555071
100555077
Fig. 18. Corresponding bolt stretch contours (in mm) for the array of FG bolts.
A.J.S. Spearing et al. / International Journal of Rock Mechanics & Mining Sciences 57 (2013) 153–166 165

Author's personal copy
Acknowledgements
The funding and support provided by NIOSH (under BAAnumber 2008-N-10989) is greatly acknowledged as is the con-siderable support given by Peabody Energy. Jennmar Corporationhelp by providing the bolts for instrumentation and the freight toYieldPoint Inc. at no cost is also appreciated. The project team alsoacknowledges the assistance provided by Minova USA during thefield installations at all three mine sites.
References
[1] Tadolini SC, Mazzoni RA. Twenty-four conferences: more than one-hundredand seventy papers; understanding roof bolt selection and design stillremains priceless. In: Proceedings of the 25th international conference onground control in mining. Morgantown (WV); 2006. p. 382–9.
[2] Freeman TJ. The behaviour of fully grouted bolts in the Kielder experimentaltunnel. Tunnels Tunnelling 1978;10:37–40.
[3] Farmer IW. Stress distribution along a resin grouted anchor. Int J Rock MechMin Sci 1975;12 347–35.
[4] Blanco Martin L, Tijani M, Hadj-Hassen F. A new analytical solution to themechanical behaviour of fully grouted rock bolts subjected to pull-out tests.Constr Build Mater 2011;25:749–55.
[5] Deb D, Das CD. Bolt-G¼grout interactions in elastoplastic rock mass usingcoupled FEM-FDM techniques. Adv Civ Eng 2010 Article 149810.
[6] Li C, Stillborg B. Analytical models for rock bolts. Int J Rock Mech Min Sci
1999;36:1013–29.[7] Bobet A, Einstein HH. Tunnel reinforcement with rock-bolts. Tunn Underg Sp
Tech 2011;26:100–23.[8] Li C. Field observations of rock bolts in high stress rock masses. Rock Mech
Rock Eng 2009;43:491–6.[9] Hyett AJ, Moosavi M, Bawden WF. Load distribution along fully grouted bolts
with emphasis on cable bolt reinforcement. Int J Numer Anal Met 1996;20:
490–517.[10] Bjornfot F, Stephansson O. Interaction of grouted rock bolts and hard rock
masses at variable loading in a test drift of the Kiirunavaara Mine, Sweden.In: Proceedings of the international symposium on rock bolting, Abisko;
1983. p. 377–95.[11] Ferrero AM. The shear strength of reinforced rock joints. Int J Rock Mech Min
Sci 1995;32:595–605.[12] McHugh E, Signer SD. Roof bolt response to shear stress: laboratory analysis.
In: Proceedings of the 18th international conference on ground control in
mining, Morgantown (WV); 1999. p. 232–8.[13] Signer S, Jones S. A case study of grouted roof bolt loading in a two-entry gate
road. In: Proceedings of the 9th international conference on ground control inmining. Morgantown (WV); 1990. p. 35–41.
[14] Signer SP, Mark C, Franklin G, Hendon G. Comparisons of active versus passivebolts in a bedded mine roof. In: Proceedings of the 12th internationalconference on ground control in mining. Morgantown (WV); 1993. p. 16–23.
[15] Signer SD, Cox D and Johnson J. A method for the selection of rock supportbased on loading measurements In: Proceedings of the 16th international
conference on ground control in mining. Morgantown (WV); 1997. p. 183–90.
Fig. 19. A proposed mechanism for instability in the roof of intersection based on the data presented above.
A.J.S. Spearing et al. / International Journal of Rock Mechanics & Mining Sciences 57 (2013) 153–166166