Embed Size (px)
Citation preview

UK Film Council Statistical Yearbook Annual Review 2003/04
rsu_cover_3.qxd 19/8/04 11:07 AM Page 1

1 The box office 41.1 Adm issions 51.2 Box office earnings 71.3 Film releases and box office revenues 81.4 Country of origin of film releases 8
The Box office
3Statistical Yearbook 2003

Chapter 1The box office
2003 was an excellent year for cinema adm issions and new releases,if not quite as record-breaking as 2002. This chapter explores totaladm issions and box office earnings, and the UK’s share of releases inthe home market.
4Cold Mountain courtesy of BVI. © Disney

5
• 2003 saw the second highest cinema admissions for 30 years, at 167 million.
• The small decline in admissions (-5%) compared with 2002 was mirrored elsewhere in the world.
• Total box office receipts were £742 million, a slight decrease on 2002.
• 423 films (on release for a week or more) were released in the UK and Republic of Ireland, an increase of 15% on 2002.
• UK films, including co-productions, accounted for 18% of film releases in the UK and Republic of Ireland and 16% of box office earnings.
Chapter 1: The Box Office
Facts in focus
1.1 AdmissionsThe 167.3 million cinema admissions recorded in 2003 were the second highest admissions figure for 30 years, after 2002. Although they were down 5% on 2002, this still marks a 35% increase in ten years.
The UK was not alone in seeing admission numbers fall in 2003. The Motion Picture Association (MPA)reports worldw ide admissions dropping from 9.1 billion in 2002 to 8.6 billion in 2003. In Europe, wherethe UK has the second largest admissions figure after France at 174.2 million, the European AudiovisualObservatory estimates that admissions were down 5% across the 15 countries then making up the EU. The fall was greatest in Germany, which saw admissions drop from 163.9 million in 2002 to 149 million in2003 (-9.1%). The other two large film markets in Europe, Spain (136.5 million) and Italy (109.3 million),saw falls of 3% and 1.9% respectively. The Republic of Ireland bucked the downward trend w ith anincrease of 0.6% to 17.4 million admissions in 2003.
Even the USA was not immune to declining admissions; according to the MPA 2003 saw a 4% decline to 1.57 billion.
Year Total admissions (millions)
1994 123.5
1995 114.6
1996 123.5
1997 138.9
1998 135.2
1999 139.1
2000 142.5
2001 155.9
2002 175.9
2003 167.3
Table 1.1 UK Annual admissions 1994 – 2003
Source: CAA , Nielsen EDI
Statistical Yearbook 2003
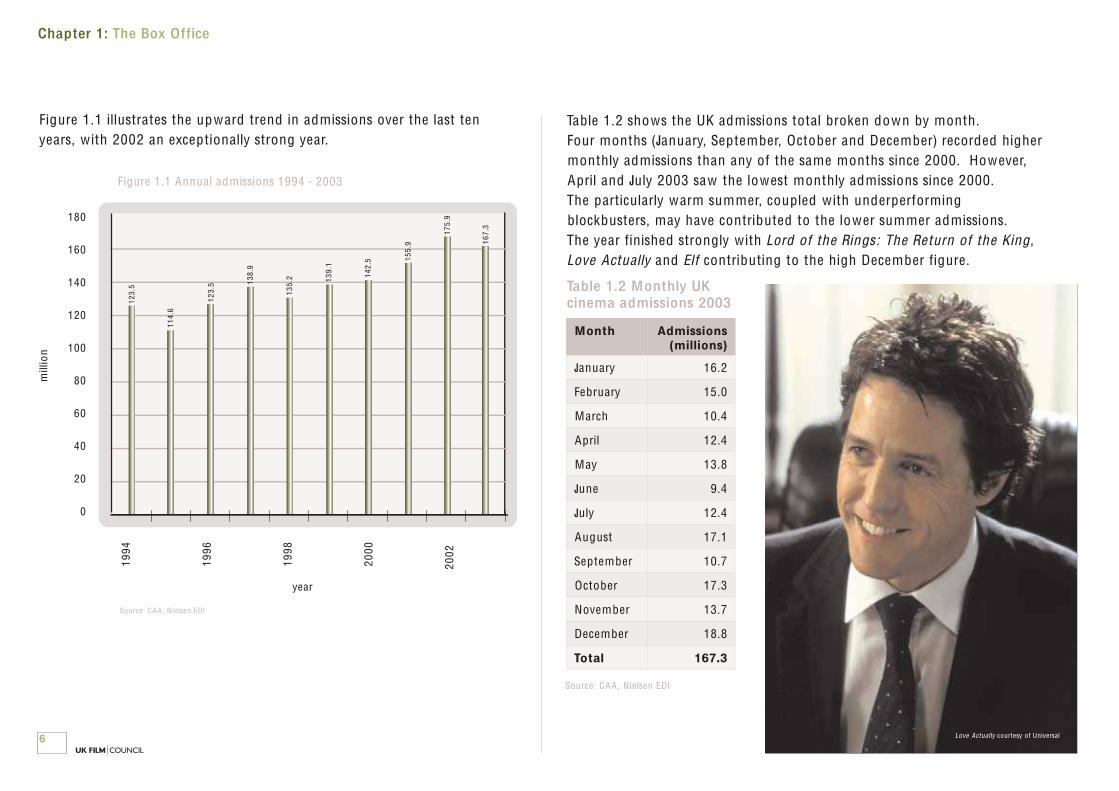
Table 1.2 shows the UK adm issions total broken down by month. Four months (January, September, October and December) recorded highermonthly adm issions than any of the same months since 2000. However,April and July 2003 saw the lowest monthly adm issions since 2000. The particularly warm summer, coupled w ith underperform ing blockbusters, may have contributed to the lower summer adm issions. The year finished strongly w ith Lord of the Rings: The Return of the King,Love Actually and Elf contributing to the high December figure.
Chapter 1: The Box Office
6
Month Admissions (millions)
January 16.2
February 15.0
March 10.4
April 12.4
May 13.8
June 9.4
July 12.4
August 17.1
September 10.7
October 17.3
November 13.7
December 18.8
Total 167.3
Table 1.2 Monthly UK cinema admissions 2003
Source: CAA , Nielsen EDI
Source: CAA , Nielsen EDI
Figure 1.1 Annual adm issions 1994 - 2003
180
160
140
120
100
80
60
40
20
0
1994
1996
1998
2000
2002
123.
5
114.
6
123.
5 138.
9
135.
2 139.
1
142.
5 155.
9
175.
9
167.
3
year
mill
ion
Figure 1.1 illustrates the upward trend in adm issions over the last tenyears, w ith 2002 an exceptionally strong year.
Love Actually courtesy of Universal

Table 1.3 shows how the 2003 adm issions break down by ISBA TV region. The areas w ith the highest concentration of population - London, the M idlands and Lancashire - accounted for half of all UK adm issions in2003. Scotland saw 10% of all UK adm issions, compared w ith 6.4% inWales and West.
Chapter 1: The Box Office
7
Region Admissions (millions)
%
London 43.8 26.2
M idlands 22.9 13.7
Lancashire 18.1 10.8
Southern 15.4 9.2
Yorkshire 13.6 8.1
Central Scotland 11.5 6.9
Wales and West 10.8 6.4
East of England 10.8 6.4
North East 6.2 3.7
Northern Ireland 5.4 3.2
South West 3.6 2.2
Northern Scotland 3.4 2.1
Border 1.6 1.0
Total 167.3 100.0
Table 1.3 Cinema admissions by region 2003
Source: CAA , Nieslen EDI
1.2 Box office earningsThe total UK box office for 2003 was £742 m illion, slightly down on 2002(by almost 2%), but an increase of 136% over the decade. This figure covers all box office earnings during the calendar year 2003 for all filmsexhibited in that year.
Year Box office gross (£m)
% + /- Cumulative % + /-
1993 315 - -
1994 356 13.0 13.0
1995 356 0.0 13.0
1996 411 15.4 30.5
1997 489 19.0 55.2
1998 547 11.8 73.7
1999 563 3.0 78.7
2000 583 3.5 85.1
2001 645 10.6 104.8
2002 755 17.0 139.7
2003 742 -1.7 135.6
Table 1.4: UK box office trends 1994 – 2003
Source: CAA , Nieslen EDI
Statistical Yearbook 2003

1.3 Film releases and box office revenues423 films (on release for a week or more) were released in the UK and Republic of Ireland in 2003, an increase of 15% on 2002. They generated £830 m illion in box office revenues, an increase of 2.5% inthe same period.
As can be seen in Table 1.5, box office polarity has decreased from 2002,and the share of the top 20 films is at its lowest for five years, falling toalmost 54%. 323 films (ie 76% of all releases) accounted for just 7.7% ofthe box office.
Chapter 1: The Box Office
1.4 Country of origin of film releasesWe apply the Department for Culture, Media and Sport (DCMS) definition of a UK film under the Films Act (1985) for our analysis. To qualify underSchedule 1 of the Act, a film must meet certain criteria in relation to the proportion of a film’s budget spent in the UK and the proportion of labourcosts paid to qualifying individuals. A film may also qualify if it satisfies the terms of one of the UK’s co-production treaties. The DCMS website contains a full list of qualifying criteria (www.culture.gov.uk/creative/index.html).
As Table 1.6 indicates, US films dom inated the UK theatrical market in 2003 interms of box office share. Of all films released last year, 44% were of US origin(excluding UK co-productions), and these films accounted for over 81% of thetotal box office earnings.
UK films, including co-productions, accounted for almost 18% of releases and16% of the box office. UK/USA collaborations earned over 13% of the boxoffice despite representing only 3.8% of releases.
Films whose country of origin lies outside the UK and USA accounted for over38% of releases but only 2.7% of earnings. Indian films alone represented 13% of all releases and 1% of revenues.
8
1999 2000 2001 2002 2003
Releases 391 383 352 369 423
Combined gross £m 610.5 635.8 744.1 809.4 829.7
Top 20 (%) 60.0 54.3 59.3 60.3 53.5
Top 50 (%) 82.2 80.8 84.1 82.3 77.8
Top 100 (%) 94.5 93.7 95.6 94.4 92.3
Table 1.5 Summary of results at the UK and Republic of Ireland box office 1999 – 2003
Source: Nielsen EDI
Note: Table 1.5, and all subsequent analysis on the theatrical market, includes all titles released in 2003.We have included Chicago in this year’s analysis because it opened on one screen only on 27 December 2002 and did not feature in last year’s analysis. The combined gross reflects the territorialgross (ie including the Republic of Ireland), and covers those titles released in 2003, but also makingmoney into 2004, up to and including 22 March 2004.
The Lord of the Rings: Return of the King courtesy of Entertainment

9
Chapter 1: The Box Office
Country of origin No. of releases in 2003
% of allreleases
2003 box office (£m)
2003 box office share
(%)
USA solo 133 31.4 512.31 61.7
USA co-productions (other) 53 12.5 164.74 19.9
Sub total 186 44.0 677.04 81.6
UK and UK co-productions 59 13.9 20.55 2.5
USA/UK 16 3.8 109.56 13.2
Sub total 75 17.7 130.11 15.7
Europe 66 15.6 7.85 0.9
India 56 13.2 8.13 1.0
Rest of the world 40 9.5 6.58 0.8
Total 423 100 829.71 100
Table 1.6 Country of origin of films released in the UK and Republic of Ireland, 2003
Source: Nielsen EDI, RSU analysis Box office gross = cumulative total up to 22 March 2004
See also• For more information about top films in 2003 see chapter 2• For further details about film distribution in 2003 see chapter 5• For a review of the exhibition sector in 2003 see chapter 6
Statistical Yearbook 2003
ELF courtesy of Entertainment

2 Top films, 2003 112.1 The top 20 films 122.2 The top 20 UK films 132.3 Best weekend performances of UK films 14
Top films, 2003
10Statistical Yearbook 2003

Chapter 2Top films, 2003
The chart toppers always generate much excitement, even when thetop films are sometimes predictable. No one was surprised when thefinal Lord of the Rings episode, The Return of the King, achieved thenumber one rating. Three UK comedies also made it to the top 10.
11The Lord of the Rings: Return of the King courtesy of Entertainment

12
• Lord of the Rings: The Return of the King was the biggest film of the year, earning over £60 million.
• Three UK comedies – Love Actually, Calendar Girls and Johnny English – made it to the top ten.
• The USA was involved in every production in the top 20 films at the UK box office, partnering the UK on three films.
• The top 20 UK films grossed £122.7 million at the UK box office, almost 15% of the total, a decrease on last year’s figure.
Chapter 2: Top films, 2003
Facts in focus
2.1 The top 20 filmsThe final instalment of the Lord of the Rings trilogy, The Return of the King, was the highest grossing film of the year. Major UK successes included three comedies in the top 10 – Love Actually, Calendar Girls and Johnny English. Sequels and franchises accounted for seven of the top 20 films, down from eight in 2002.
Title Countryof origin
Box officegross (£m)
Number of opening cinemas
Opening weekend
gross (£m)
Distributor
1 The Lord of the Rings: Return of the King USA/NZ 60.67 494 15.02 Entertainment
2 Finding Nemo USA 37.36 2 0.15 Buena Vista
3 Love Actually UK/USA 36.45 477 6.66 UIP
4 The Matrix Reloaded USA 33.42 481 12.17 Warner Bros
5 The Pirates of the Caribbean USA 28.17 452 3.77 Buena Vista
6 Bruce A lm ighty USA 23.64 446 7.26 Buena Vista
7 X-Men 2 USA 20.66 449 7.04 20th Century Fox
8 Calendar Girls UK/USA 20.43 1 0.07 Buena Vista
9 Johnny English UK/USA 19.65 445 3.44 UIP
10 Term inator 3: Rise of the Machines USA/Ger 18.91 478 6.08 Columbia TriStar
11 The Matrix Revolutions USA 17.99 467 8.71 Warner Bros
12 American Pie: The Wedding USA 17.09 426 4.15 UIP
13 Chicago USA/Can 16.42 1 0.11 Buena Vista
14 Elf USA 16.34 392 4.54 Entertainment
15 Catch Me If You Can USA 15.04 459 3.72 UIP
16 Two Weeks Notice USA 13.65 414 2.64 Warner Bros
17 8 M ile USA/Ger 13.25 423 4.44 UIP
18 Charlie’s Angels: Full Throttle USA 12.36 473 3.27 Columbia TriStar
19 Kill Bill - Volume 1 USA 11.62 1 0.16 Buena Vista
20 Gangs of New York USA 10.56 385 2.62 Entertainment
Table 2.1 Box office results for the top 20 films released in the UK and Republic of Ireland, 2003
Source: Nielsen EDI, RSU analysis. Box office gross = cumulative total up to 22 March 2004 Films w ith an asterisk (*) were still being exhibited on 22 March 2004
Statistical Yearbook 2003
Chicago courtesy of BVI

2.2 The top 20 UK filmsThe top three UK films were comedies, followed by two big budget co-productions, Cold Mountain and Tomb Raider 2. Co-productions wereonce again prominent, particularly collaborations w ith the USA . Eight of thetop UK films were distributed by Buena Vista International and UIP. Pathélaunched four of the top 20 UK films. The top 20 UK films had a combinedgross of £122.7 million, which was 14.8% of the total UK box office, downfrom £184.6 million in 2002 (22.8% of gross box office).
Chapter 2: Top films, 2003
13
Title Country of origin Box office gross (£m)
Distributor
1 Love Actually UK/USA 36.45 UIP
2 Calendar Girls UK/USA 20.43 Buena Vista
3 Johnny English UK/USA 19.65 UIP
4 Cold Mountain* UK/USA/Rom/Ita 9.12 Buena Vista
5 Tomb Raider 2 UK/USA/Jap/Ger 5.30 UIP
6 The Hours UK/USA 4.70 Buena Vista
7 Underworld UK/USA/Ger/Hun 4.39 Entertainment
8 Veronica Guerin UK/USA/Ire 3.30 Buena Vista
9 The Pianist UK/Fra/Ger/Neth/Pol 2.97 Pathé
10 S Club Seeing Double UK 2.32 Columbia TriStar
11 Touching the Void* UK 2.22 Pathé
12 Interm ission UK/Ire 2.14 Buena Vista
13 In America UK/Ire 1.90 20th Century Fox
14 Evelyn UK/Ire 1.45 Pathé
15 Nicholas Nickleby UK/USA 1.24 20th Century Fox
16 Buffalo Soldiers UK/Ger 1.10 Pathé
17 Bright Young Things UK 1.09 Icon
18 I Capture the Castle UK 1.04 Momentum
19 Ripley’s Game UK/Ita 1.01 Entertainment
20 Blackball UK 0.89 Icon
Total 122.71
Table 2.2 Box office results for the top 20 UK films released in the UK and Republic of Ireland, 2003
Source: Nielsen EDI, RSU analysis. Box office gross = cumulative total up to 22 March 2004 Films w ith an asterisk (*) were still being exhibited on 22 March 2004
Two Weeks Notice courtesy of Warner Bros

2.3 Best weekend performances of UK filmsFilms usually open at the weekend, when people are more likely to go tothe cinema, in order to maxim ise their impact at the box office. The performance of a film during its opening weekend is a factor in decidinghow long the film w ill remain on release. Opening weekend data aretherefore important in negotiations between distributors and exhibitors.Table 2.3 shows the UK films that topped the weekend box office charts (of all films) during 2003. Three films achieved this distinction, w ith acombined total of nine weeks at number one.
Chapter 2: Top films, 2003
14
Weekat top
Title Weekendgross(£m)
Box officegross (£m)
Distributor No. ofweeks at
no.1
11/4/03 Johnny English 3.44 19.65 UIP 3
12/9/03 Calendar Girls 1.76 20.43 Buena Vista 1
26/9/03 Calendar Girls 1.76 20.43 Buena Vista 1
21/11/03 Love Actually 6.66 36.45 UIP 4
Table 2.3 UK films at number one in the weekend box office charts, 2003
Source: Nielsen EDINote: Calendar Girls topped the charts on two separate occasions, hence its inclusion tw ice in the table
See also• For more about top films since 1994 see chapter 3• For further information about film distribution in 2003 see
chapter 5• For an overview of the exhibition sector in 2003 see chapter 6• For information about how the UK Film Council supports UK film
production see http://www.ukfilmcouncil.org.uk/funding/
Statistical Yearbook 2003
Veronica Guerin courtesy of BVI

3 Top films, 1994 - 2003 163.1 Top films in the UK, 1994 - 2003 17
Top films, 1994 - 2003
15Statistical Yearbook 2003

Chapter 3Top films, 1994 -2003
Longer-term box office comparisons of the most popular films help to give a perspective on what the UK really enjoys watching. The last in the Lord of the Rings trilogy, The Return of the King,became the third most successful film of the last decade, thoughTitanic has yet to be toppled from its pedestal as the favourite film of the period.
16Finding Nemo courtesy of BVI. © Disney Pixar

17
• Four films from 2003 entered the list of top 20 films at the UK box office between 1994 and 2003.
• Seven of the top 20 films were UK/USA collaborations.
Chapter 3: Top films, 1994 - 2003
Facts in focus
3.1 Top films in the UK, 1994 – 2003Four films released in 2003 appear in the list of the top films over the last ten years. The final instalment in the Lord of the Rings trilogy, The Return of the King, is the third biggest earner at the UK box office over the last decade. Animated comedy Finding Nemo, British romantic comedyLove Actually, and the second instalment in The Matrix trilogy are the other new entrants in the top 20. There are seven UK/USA collaborations in the top20, including two Harry Potter films, a Bond film and three romantic comedies from Working Title (Bridget Jones' s Diary, Love Actually and Notting Hill).
Film Countryof origin
UK box officetotal (£m)
UK distributor Year ofrelease
1 Titanic USA 69.03 20th Century Fox 1998
2 Harry Potter and the Philosopher’s Stone UK/USA 66.10 Warner Bros 2001
3 Lord of the Rings: The Fellowship of the Ring USA/NZ 63.00 Entertainment 2001
4 Lord of the Rings: The Return of the King* USA/NZ 60.67 Entertainment 2003
5 Lord of the Rings: The Two Towers USA/NZ 57.60 Entertainment 2002
6 Harry Potter and the Chamber of Secrets UK/USA 54.78 Warner Bros 2002
7 The Full Monty UK/USA 52.23 20th Century Fox 1997
8 Star Wars Episode I: The Phantom Menace USA 51.06 20th Century Fox 1999
9 Toy Story 2 USA 44.31 Buena Vista 2000
10 Bridget Jones’s Diary UK/USA 42.01 UIP 2001
11 Monsters, Inc. USA 37.91 Buena Vista 2002
12 Star Wars Episode II: Attack of the Clones USA 37.55 20th Century Fox 2002
13 Finding Nemo USA 37.36 Buena Vista 2003
14 Independence Day USA 37.13 20th Century Fox 1996
15 Love Actually UK/USA 36.45 UIP 2003
16 Die Another Day UK/USA 36.06 20th Century Fox 2002
17 Men In Black USA 35.82 Columbia TriStar 1997
18 The Matrix Reloaded USA 33.42 Warner Bros 2003
19 Gladiator USA 31.20 UIP 2000
20 Notting Hill UK/USA 31.00 UIP 1999
Table 3.1 Top 20 films at the UK box office, 1994 – 2003
Source: Nielsen EDI, RSU analysis Note: Figures have not been inflation adjusted. Films w ith an asterisk (*) were still on release at 22 March 2004 so box office gross may grow. Statistical Yearbook 2003

4 Language, genre and UK story material 194.1 Foreign Language films 204.2 Genre 234.3 UK story material 24
Language, genre and UK story material
18Statistical Yearbook 2003

Chapter 4Language, genre andUK story material
Foreign language films occupy a significant niche in the UK market,in part reflecting the UK's varied cultural make-up, and an enthusiasm for international cinema in all its diversity. As far as genreis concerned, comedy is king for UK audiences. What is also strikingis the predom inance of UK writers or UK settings as an inspiration tosuccessful filmmakers from around the world.
19Mein Prem Ki Diwani Hoon courtesy of Yash Raj Films

20
• 147 foreign language films were released, 35% of total releases (down from 36% in 2002).
• Although foreign language films accounted for over one third of all releases in 2003, they shared only 2.5% of the total UK box office gross.
• Hindi was the dominant foreign language in terms of both releases and market share.
• Comedy was the most popular genre, with 30% of the gross box office from 25% of releases.
• UK story material featured in 13 of the top 50 films at the UK box office in 2003.
Chapter 4: Language, genre and UK story material
Facts in focus
4.1 Foreign language filmsIn 2003, 147 foreign language films were released in the UK and Republic of Ireland (34.7% of releases), earning £20.4 m illion at the box office. This represents 2.5% of the total UK gross box office for 2003.
Year Number % of all releases
Gross box office (£m)
% of total gross box office
2002 131 36.0 17.1 2.2
2003 147 34.7 20.4 2.5
Table 4.1 Foreign language films at the UK box office 2002 and 2003
Source: Nielsen EDI, BBFC, RSU analysis Figures as at 22 March 2004
Main language No. films released
% releases Gross box office (£m)
% of total gross box office
English 276 65.2 809.2 97.5
Hindi 52 12.3 8.1 1.0
European 61 14.4 9.6 1.2
Other International 34 8.0 2.7 0.3
Total 423 100.0 829.7 100.0
Table 4.2 Language 2003
Source: Nielsen EDI, BBFC, RSU analysisFigures as at 22 March 2004. Figures may not sum to totals due to rounding.
Statistical Yearbook 2003
City of God courtesy of BVI

Hindi was the dom inant foreign language in terms of the number of releases and box office share (see Table 4.3), a position it also held in 2002.
Chapter 4: Language, genre and UK story material
21
Main language No. ofreleases
Gross box officetotal (£m)
Top performingtitle
Hindi 52 8.1 Kal Ho Naa Ho
French 25 2.8 Belleville Rendezvous
German 7 2.4 Goodbye, Lenin!
Portuguese 2 2.4 City of God (Brazil)
Japanese 10 1.3 Spirited Away
Table 4.3 Top five foreign languages at the UK box office 2003
Source: Nielsen EDI, BBFC, RSU analysisFigures as at 22 March 2004
Main language No. of releases
Gross box office total (£m)
Top performing title
French 25 2.8 Belleville Rendezvous
German 7 2.4 Goodbye, Lenin!
Portuguese 2 2.4 City of God (Brazil)
Spanish 12 0.8 Intacto
Italian 5 0.7 Respiro
Finnish 2 0.2 A Man W ithout a Past
Danish 4 0.1 Open Hearts
Icelandic 1 0.1 Noi A lbinoi
Norwegian 2 0.06 Elling
Swedish 1 0.04 Persona (re-release)
Table 4.4 European foreign languages at the UK box office 2003
Source: Nielsen EDI, BBFC, RSU analysisFigures as at 22 March 2004
Koi...M il Gaya courtesy of Yash Raj Films

Chapter 4: Language, genre and UK story material
22
Title Country oforigin
Gross boxoffice (£m)
Distributor Language
1 City of God Bra 2.4 Buena Vista Portuguese
2 Kal Ho Naa Ho Ind 1.7 Yash Raj Films Hindi
3 Good Bye, Lenin! Ger 1.2 UGC Films German
4 Spirited Away Jap/USA 0.9 Optimum Rel. Japanese
5 The Little Polar Bear Ger 0.8 Warner Bros. German
6 Chalte Chalte Ind 0.8 Eros Hindi
7 Baghban Ind/UK 0.7 Eros Hindi
8 Belleville Rendezvous Fra/Bel/Can 0.7 Metro Tartan French
9 Etre Et Avoir Fra 0.7 Metro Tartan French
10 Koi...M il Gaya Ind 0.6 Yash Raj Films Hindi
11 Main Prem Ki Diwani Hoon Ind 0.5 Yash Raj Films Hindi
12 Russian Ark Rus/Ger 0.5 Aritificial Eye Russian
13 Dil Ka Rishtaa Ind 0.4 Venus Films Hindi
14 L’Homme du Train Fra/UK/Ger 0.4 Pathé French
15 Respiro Ita/Fra 0.4 Metro Tartan Italian/English
16 The Leopard Ita/Fra 0.3 bfi Italian/English
17 Andaaz Ind 0.3 Tip Top Hindi
18 Armaan Ind 0.3 Eros Hindi
19 Intacto Spa 0.3 Momentum Spanish/English
20 Kuch Naa Kaho Ind 0.3 Eros Hindi
Total 14.2
Table 4.5 Top 20 foreign language films released in the UK and Republic of Ireland in 2003
Source: Nielsen EDI, BBFC, RSU analysisFigures as at 22 March 2004
Statistical Yearbook 2003
Chalte Chalte courtesy of Eros International

Five films in the top 20 were supported by the UK Film Council.Goodbye, Lenin!, Sp irited Away, Belleville Rendezvous and Resp iroreceived funding to pay for additional prints and advertising, affordinggreater opportunity for people to see the films, while L'Homme duTrain was part financed by the UK Film Council Prem iere Fund.
4.2 Genre The UK Film Council has allocated up to five genres to every filmreleased in the UK in 2003. The list of genres is based on conventionscommonly used by published sources including the Internet MovieDatabase and the British Board of Film Classification (BBFC) website.The final list was decided follow ing consultation w ith the UK FilmCouncil Production Funds and other industry representatives.
Table 4.6 provides an indication of the relative popularity of differenttypes of film based on the primary genre allocated to each titlereleased in 2003. Each film is counted only once so that any additionalgenres allocated to a title have been disregarded for the purposes ofsimplified reporting. The list of genres and classification of each titlereleased in 2003 is available on our website(www.ukfilmcouncil.org.uk/statistics/genre/titles).
Table 4.6 shows that once again comedy was the top grossing genreat the UK box office. At just over a quarter of all releases, comedytitles shared 30.5% of the gross box office in 2003.
Chapter 4: Language, genre and UK story material
23
Genre Number ofreleases
%Releases
Gross boxoffice (£m)
% Boxoffice
Comedy (including romantic comedy) 107 25.3 252.7 30.5
Action 46 10.9 139.0 16.8
Drama 134 31.7 82.6 10.0
Animated 14 3.3 74.6 9.0
Adventure 9 2.1 69.2 8.3
Fantasy 5 1.2 60.8 7.3
Sci fi 7 1.7 59.3 7.1
Horror 22 5.2 39.8 4.8
Musical 2 0.5 16.9 2.0
Crime 23 5.4 13.8 1.7
Thriller 14 3.3 13.0 1.6
Documentary 21 5.0 5.6 0.7
Romance 16 3.8 1.7 0.2
Biopic 1 0.2 0.6 0.1
War 2 0.5 0.03 0.0
Table 4.6 Films on release in the UK and Republic of Ireland by genre, 2003
Source: Nielsen EDI, RSU analysis
Russian Ark courtesy of Artifcial Eye

24
Chapter 4: Language, genre and UK story material
See also• For cinema admissions and box office in 2003 see chapter 1• For a look at cinema audiences see chapter 7• For more details about genre classification see
http://www.ukfilmcouncil.org.uk/statistics/genre
A lthough drama accounted for the largest number of releases (134, or 31.7% of all releases) the genre achieved only 10% of thetotal gross box office. Drama is not a helpful category as titles w ithinit do not necessarily share common themes and genre conventions,unlike, for example, action or horror. The lack of a cohesive genreidentity for dramas may make it harder to market these titles, therebyreducing their likelihood of success at the box office.
4.3 UK story materialThe UK has a long and rich literary heritage, and filmmakers have frequently drawn upon British writing talent as the basis for filmscripts. Even films written and produced outside the UK may featurepredom inantly British characters and/or settings, particularly in historical contexts (for example, Rob in Hood Prince of Thieves). These stories not only help to shape a sense of national identity, they also define British cultural heritage for international audiences.
UK story material (defined here as scripts based on the work of a UKwriter or involving predom inantly British characters and/or settings)featured in 13 of the top 50 films in 2003 as Table 4.7 indicates. Fivefilms, The Lord of the Rings: The Return of the King, Love Actually, The Pirates of the Caribbean, Calendar G irls and Johnny English, allappeared in the top ten and grossed £165.4 m illion at the box office.
Title Gross box
office (£m)
Country of origin
Story material
Lord of the Rings: The Return of the King 60.6 USA/NZ Adapted UK author
Love Actually 36.4 UK/USA UK based script
The Pirates of the Caribbean 28.2 USA UK characters
Calendar Girls 20.4 UK/USA UK based script
Johnny English 19.6 UK/USA UK based script
Peter Pan 9.3 USA Adapted UK author
The Jungle Book 2 8.3 USA Adapted UK author
The Italian Job 7.7 USA Based on UK source
Master and Commander 7.5 USA UK characters
The League of Extraordinary Gentlemen 7.3 USA UK characters
Tomb Raider 2 5.3 UK/USA/Ger/Jap/Neth Based on UK source
The Hours 4.7 UK/USA UK characters
Piglet’s Big Movie 4.4 USA Adapted UK author
Table 4.7 UK story material in the top 50 films at the UK box office 2003
Source: Nielsen EDI, RSU analysis
Statistical Yearbook 2003
5 Distribution 265.1 Distributors in 2003 275.2 Distributors, 1999 - 2003 275.3 Opening weekends 285.4 Release costs 29
Distribution
25Statistical Yearbook 2003

Chapter 5Distribution
Film distributors, responsible for getting new releases onto our cinema screens, decide release dates and which films we learn aboutthrough advertising. This chapter looks at distributors’ market share,the range of weekend results (when most films are released) andspending on advertising.
26The Pirates of the Caribbean courtesy of BVI. © Disney

27
• The top eight distributors had a 96% share of the market in 2003.
• Weekends (Friday to Sunday) accounted for 61% of the box office.
• Opening weekends represented 25% of the total box office.
• Estimated total advertising spend was £147.8 million, an increase of 13% on 2002.
Chapter 5: Distribution
Facts in focus
5.1 Distributors in 2003As shown in Table 5.1, the top eight distributors had a 96% share of themarket (up 6% on 2002). The remaining 56 distributors handled a total of252 titles (52% of the total), but gained only a 4% share of the box office(down 6% on the previous year).
Distributor Market Share %
Films on release 2003
Gross box office (£m)
Buena Vista 26.3 46 218.2
UIP 22.5 31 187.0
Entertainment 14.6 18 121.1
Warner Bros 10.4 20 86.3
Columbia TriStar 9.7 36 80.1
20th Century Fox 8.8 29 73.3
Pathé 2.0 24 16.5
Momentum 1.3 23 11.1
Sub total 95.7 227 793.7
Others (56 distributors) 4.3 252 35.8
Total 100.0 479 829.5
Table 5.1 Distributor share of box office, UK and Republic of Ireland, 2003
Source: Nielsen EDIBox office gross = cumulative box office total for all films handled by the distributor in the period 3 January 2003 to 4 January 2004 (ie all films released in 2002 and still show ing in 2003)
5.2 Distributors, 1999 – 2003Table 5.2 shows that the top six distributors form a stable leading group,although their individual market shares vary considerably from year toyear, depending on the particular m ix of films distributed each year.Distributors are ranked by their 2003 box office share.
Distributor 1999 2000 2001 2002 2003
Buena Vista 21.5 22.6 14.1 15.2 26.3
UIP 23.2 26.9 31.7 12.5 22.5
Entertainment 6.0 4.6 9.7 16.6 14.6
Warner Bros 11.8 7.8 16.5 15.4 10.4
Columbia TriStar 5.5 12.8 6.6 12.3 9.7
20th Century Fox 14.5 9.9 8.7 17.9 8.8
Pathé 3.5 7.1 2.1 2.1 2.0
Momentum 0.05 1.1 2.5 1.9 1.3
Redbus 0.03 0.6 1.6 1.8 0.8
Icon 0.3 2.8 3.6 0.9 0.7
Top 10 total 86.4 96.2 97.1 96.6 97.1
Others 13.6 3.8 2.9 3.4 2.9
Total 100.0 100.0 100.0 100.0 100.0Source: Nielsen EDI
Statistical Yearbook 2003
Table 5.2 Distributor market share as percentage of box office gross, 1999 - 2003

Chapter 5: Distribution
28
5.3 Opening weekendsIn 2003, 61% of the box office was taken at weekends, down from 68% in 2002, as Table 5.3 shows.
Opening weekends accounted for 24.5% of the total box office in 2003, a slight increase on 2002 (Table 5.4). Films in the £20-£30 m illion bandtook proportionately less in their opening weekend compared w ith 2002.Films in this band included The Pirates of the Caribbean and Calendar G irls, which both stayed in the box office top 10 for 11 weeks. Films in the £10-£20 m illion band took more, which was a reflection of the relatively poor performance of some of the summer blockbusters.
2002 2003
Friday 16.9 16.0
Saturday 29.4 26.6
Sunday 21.3 18.7
Weekend 67.6 61.3
Monday 7.2 8.9
Tuesday 8.5 10.0
Wednesday 8.6 9.8
Thursday 8.1 10.0
Weekday 32.4 38.7
Total 100.0 100.0
Table 5.3 Box office percentage share by weekday/weekend, 2002 – 2003
Source: Nielsen EDI
Range of box office results
% of total in opening
weekend 2002
% of total in opening
weekend 2003
All films 24.1 24.5
More than £30 m illion 27.7 24.5
£20 m illion - £30 m illion 24.9 21.3
£10 m illion - £20 m illion 18.5 26.4
£5 m illion - £10 m illion 21.9 24.1
£1 m illion - £5 m illion 22.9 23.6
£200,000 - £999,000 29.5 26.8
Less than £200,000 29.8 29.4
Table 5.4 UK opening weekend as percentage of total box office, 2002 – 2003
Source: Nielsen EDINote: Opening weekends include preview figures. For films w ith a lim ited initial opening, the w iderrelease figure is included in the analysis.

29
Chapter 5: Distribution
5.4 Release costsThe opening weekend of a film is recognised as being crucial to the lifetime of a film , both in cinemas and on subsequent release platforms.Distributors invest heavily in advertising in order to raise a film’s profileacross all media (outdoor posters, print media, TV and radio). From dataprovided by Nielsen Media Research (Table 5.5) the estimated total distributor advertising spend in 2003 was £147.8 m illion, up nearly 13%from £131 m illion in 2002.
TV £61.2 m illion
Outdoor £46.6 m illion
Press £30.1 m illion
Radio £9.7 m illion
Direct mail £0.1 m illion
Cinema £0.04 m illion
Total £147.8 million
Table 5.5 Estimated advertising spend 2003
Source: Nielsen Media Research
See also• For further details about the UK box office in 2003 see chapter 1• For more information about the top films at the UK box office in
2003 see chapter 2• For an overview of employment in film distribution see chapter 15• To learn more about what the UK Film Council is doing to support UK
distribution see http://www.ukfilmcouncil.org.uk/funding/distributionandexhibition/
Statistical Yearbook 2003
Goodbye Lenin! courtesy of UGC Films

6 Exhibition 316.1 How many cinema screens were there in 2003? 326.2 Which exhibitors have the most screens? 336.3 Exhibitor revenues 336.4 Where are the screens located? 336.5 The growth of multiplexes 366.6 Programm ing 376.7 Digital projection 37
Exhibition
30Statistical Yearbook 2003

Chapter 6Exhibition
31
Our opportunity to see a film on the big screen depends to a large extent on access to a conveniently located cinema. Worldw ide there does appear to be a correlation between the number of screens per capita and the number of cinema adm issions.So it is encouraging that the number of both cinemas and screens is increasing – though the UK still has fewer screens per capita thanmany countries. This chapter exam ines not just numbers of cinemasand screens but also where they are and the type of films they show.
The Matrix Relvolutions courtesy of Warner Bros
32
• The UK had 3,318 screens, 60 more than last year, in 678 cinemas.
• The average ticket price was £4.43.
• The six largest exhibitors operated almost 71% of screens. Odeon Cinemas topped the list.
• There were 5.6 screens per 100,000 of the population, lower than many countries.
• There was an increase in the number of screens in and around city centres, out of town and in rural areas, and a decrease in suburban locations.
• Under 5% of screens were in rural or suburban locations.
• 71% of screens were in multiplexes – that is purpose-built cinemas with five or more screens.
• The London region, with the highest number of screens, also had the highest admissions per person.
• Northern Ireland had the highest number of screens per 100,000 population in the UK.
• Only 6% of screens were dedicated to ‘specialised’ (that is non-mainstream) programming, with less than 0.5% showing Asian films.
• Nine UK cinemas had digital projection.
Chapter 6: Exhibition
Facts in focus
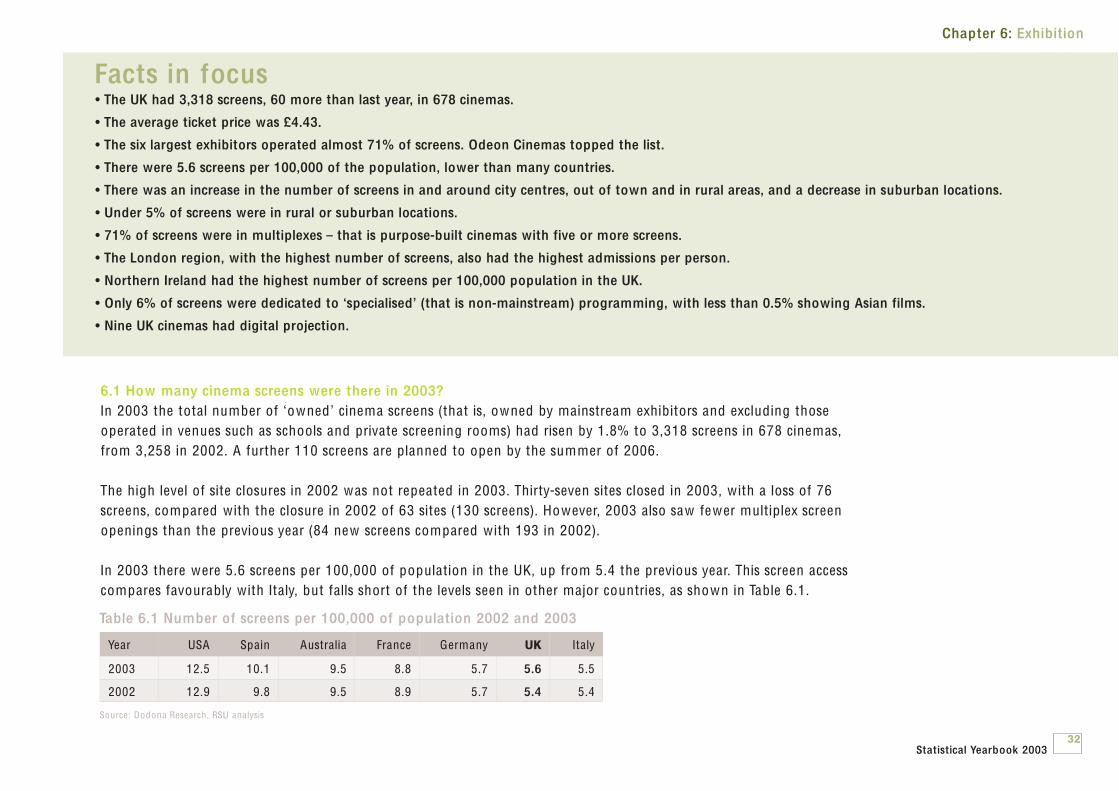
6.1 How many cinema screens were there in 2003?In 2003 the total number of ‘owned’ cinema screens (that is, owned by mainstream exhibitors and excluding thoseoperated in venues such as schools and private screening rooms) had risen by 1.8% to 3,318 screens in 678 cinemas,from 3,258 in 2002. A further 110 screens are planned to open by the summer of 2006.
The high level of site closures in 2002 was not repeated in 2003. Thirty-seven sites closed in 2003, w ith a loss of 76screens, compared w ith the closure in 2002 of 63 sites (130 screens). However, 2003 also saw fewer multiplex screenopenings than the previous year (84 new screens compared w ith 193 in 2002).
In 2003 there were 5.6 screens per 100,000 of population in the UK, up from 5.4 the previous year. This screen accesscompares favourably w ith Italy, but falls short of the levels seen in other major countries, as shown in Table 6.1.
Year USA Spain Australia France Germany UK Italy
2003 12.5 10.1 9.5 8.8 5.7 5.6 5.5
2002 12.9 9.8 9.5 8.9 5.7 5.4 5.4
Table 6.1 Number of screens per 100,000 of population 2002 and 2003
Source: Dodona Research, RSU analysis
Statistical Yearbook 2003
6.3 Exhibitor revenuesAccording to Dodona Research, total exhibitor revenue in 2003 remainedat the same level as in 2002, at £901 m illion. This represents an increase of53% since 1998 when total exhibitor revenue stood at £590 m illion. The fall in adm issions and gross box office in 2003 was offset by higheradvertising and concession revenues and an increase in average ticket prices.
Gross advertising revenue increased from £185 m illion in 2002 to £200m illion in 2003. This compares w ith £97 m illion in 1998. Meanwhile, average ticket prices (including discounted adm issions) rose from £4.29 in2002 to £4.43 in 2003 (an increase of 3.3%).
6.4 Where are the screens located?Screen concentration is, not surprisingly, highest in urban areas. 95.5% of all screens in the UK are either in city centres, edge of centre or out oftown locations (Table 6.4).
This situation has remained unchanged over the last three years, althoughthere have been m inor fluctuations in each type of location. Table 6.4shows the pattern of change in 2003, w ith an increase in the number ofscreens in and around city centre, out of town and rural locations, and adecrease in suburban locations.
Chapter 6: Exhibition
33
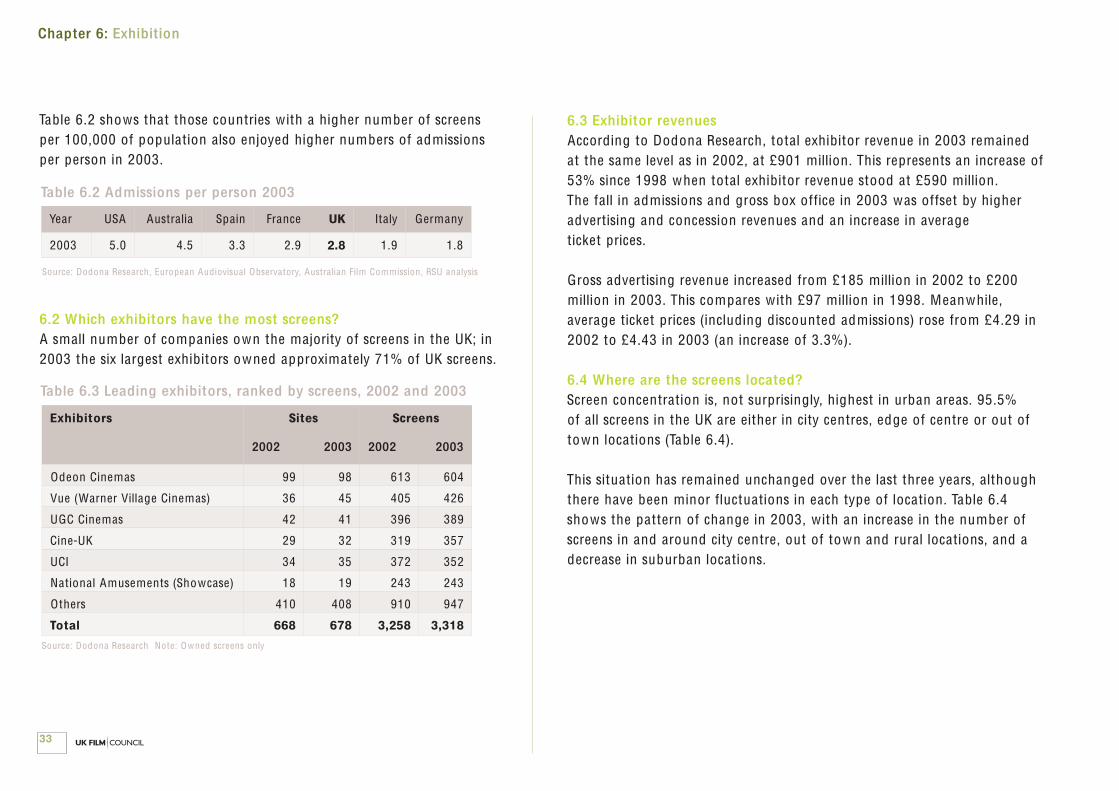
Table 6.2 shows that those countries w ith a higher number of screens per 100,000 of population also enjoyed higher numbers of adm issions per person in 2003.
6.2 Which exhibitors have the most screens?A small number of companies own the majority of screens in the UK; in2003 the six largest exhibitors owned approximately 71% of UK screens.
Year USA Australia Spain France UK Italy Germany
2003 5.0 4.5 3.3 2.9 2.8 1.9 1.8
Table 6.2 Admissions per person 2003
Source: Dodona Research, European Audiovisual Observatory, Australian Film Comm ission, RSU analysis
Exhibitors Sites
2002 2003
Screens
2002 2003
Odeon Cinemas 99 98 613 604
Vue (Warner Village Cinemas) 36 45 405 426
UGC Cinemas 42 41 396 389
Cine-UK 29 32 319 357
UCI 34 35 372 352
National Amusements (Showcase) 18 19 243 243
Others 410 408 910 947
Total 668 678 3,258 3,318
Table 6.3 Leading exhibitors, ranked by screens, 2002 and 2003
Source: Dodona Research Note: Owned screens only

Chapter 6: Exhibition
34
Location 2001 2002 2003 % 2003 % Change + / - 2003
City centre 1,404 1,466 1,470 44.3 0.2
Out of town 1,207 1,199 1,234 37.2 2.9
Edge of centre 410 456 464 14.0 1.7
Rural 107 103 117 3.5 13.6
Suburban 46 34 33 1.0 -2.9
Total 3,174 3,258 3,318 100.0
Table 6.4 Screens by location, 2001 to 2003
Source: Dodona Research, RSU analysis
In addition to London, 28 cities had 20 or more screens operating in 2003,led by Manchester, Edinburgh and Birm ingham .
City Screens in 2002 Screens in 2003 % Change + / - 2003
Greater London 498 503 1.0
Manchester 80 80 0.0
Edinburgh 72 71 -1.4
West End of London 53 57 7.5
Birm ingham 54 55 1.8
Glasgow 49 51 4.1
Bristol 49 50 2.0
Liverpool 45 48 6.6
Belfast 47 47 0.0
Sheffield 55 45 -18.2
Leeds 41 41 0.0
Cardiff 31 43 38.7
Bradford 29 31 6.9
Nottingham 32 31 -3.1
Kingston-upon-Hull 28 28 0.0
Bolton 27 27 0.0
Leicester 27 27 0.0
M ilton Keynes 26 26 0.0
Norw ich 26 26 0.0
Dudley 24 24 0.0
Coventry 24 24 0.0
Newcastle 23 23 0.0
Derby 22 22 0.0
Dundee 21 21 0.0
Portsmouth 24 21 0.0
Basingstoke 20 20 0.0
Northampton 20 20 0.0
Oxford 11 20 81.8
Southampton 20 20 0.0
Sw indon 20 20 0.0
Table 6.5 Cities with 20 or more screens, 2002 and 2003
Source: Dodona Research. RSU analysis
Statistical Yearbook 2003
The Little Polar Bear courtesy of Warner Bros

Table 6.6 presents an interesting picture of regional variations in the average number of adm issions per screen and per person. London hadmore screens than any other region, as m ight be expected, and it also hadmore adm issions per screen (61,492). In contrast, Northern Ireland had37,276 adm issions per screen (nearly 12,000 below the national average),which may be due to the fact that it had the highest number of screensper 100,000 of population (see Table 6.6 and Figure 6.1).
Chapter 6: Exhibition
There is evidence of a positive correlation between the number of screensper 100,000 of population in a region and the number of adm issions perperson. Put crudely, the more screens available the higher the number ofadm issions per person. However, the relationship is not clear cut, and itmay be affected by other factors like the proxim ity of screens to denselypopulated areas w ithin regions and the demographic make up of regions(particularly by age and socio-econom ic groups).Thus a high number ofscreens concentrated in urban areas w ith a largely elderly population maynot necessarily yield high numbers of adm issions per person given what weknow about the demographic characteristics of frequent cinema-goers.
35
TV Region Admissions Admissionsper screen
Screens Admissionsper person
Screensper 100k
London 43,843,771 61,492 713 4.0 6.5
North East 6,214,170 59,183 105 2.0 3.5
Northern Scotland 3,439,508 57,325 60 3.9 6.8
East of England 10,764,474 53,822 200 2.5 4.7
Southern 15,394,723 52,542 293 3.3 6.3
Central Scotland 11,543,538 48,098 240 3.5 7.3
Yorkshire 13,573,769 47,461 286 2.8 5.8
M idlands 22,946,243 47,021 488 2.5 5.3
Border 1,615,854 43,672 37 2.5 5.6
Lancashire 18,125,332 43,571 416 2.5 5.8
Wales and West 10,778,556 42,942 251 2.9 6.8
South West 3,648,193 42,920 85 1.6 3.8
Northen Ireland 5,367,730 37,276 144 3.4 9.0
Table 6.6 Admissions per screen and per person by region
Source: Dodona Research, CAA , RSU analysis
Baghban courtesy of Eros International

36
Chapter 6: Exhibition
Source: CAA , Dodona Research, RSU analysis
Figure 6.1 Regional variations, screens and adm issions 2003
10.0
9.0
8.0
7.0
6.0
5.0
4.0
3.0
2.0
1.0
0.0
Lond
on
Nor
ther
n Sc
otla
nd
Cen
tral
Sco
tland
Nor
ther
n Ir
elan
d
Sout
hern
Wal
es a
nd W
est
York
shir
e
Lanc
ashi
re
Bord
er
Mid
land
s
East
of E
ngla
nd
Nor
th E
ast
Sout
h W
est
Screens per 100k
Adm issions per person6.
54.
0
6.8
3.9
7.3
3.5
9.0
3.4
6.3
3.3
6.8
2.9
5.8
2.8
5.8
2.5
5.6
2.5
5.3
2.5
4.7
2.5
3.5
2.0
3.8
1.6
6.5 The growth of multiplexesIn 1998 the number of multiplex screens rose above the number of screens in traditional sites for the first time(Dodona Research defines multiplex sites as purpose-built w ithfive or more screens). By 2003 71% of screens in the UK werefound in multiplexes (an increase of 1% on 2002). Table 6.7presents figures for the last five years.
Overall, there was an increase of 63 multiplex screens ( + 2.7%) in 2003 compared w ith three fewer traditionalscreens (-0.3%).
Year Multiplex Traditional Total
1999 1,624 1,134 2,758
2000 1,874 1,080 2,954
2001 2,115 1,049 3,164
2002 2,299 959 3,258
2003 2,362 956 3,318
Table 6.7 Cinema screens by type 1999 to 2003
Source: Dodona ResearchNote: 2002 and 2003 multiplex figures include four and three'megaplexes' w ith 20 + screens respectively
Statistical Yearbook 2003
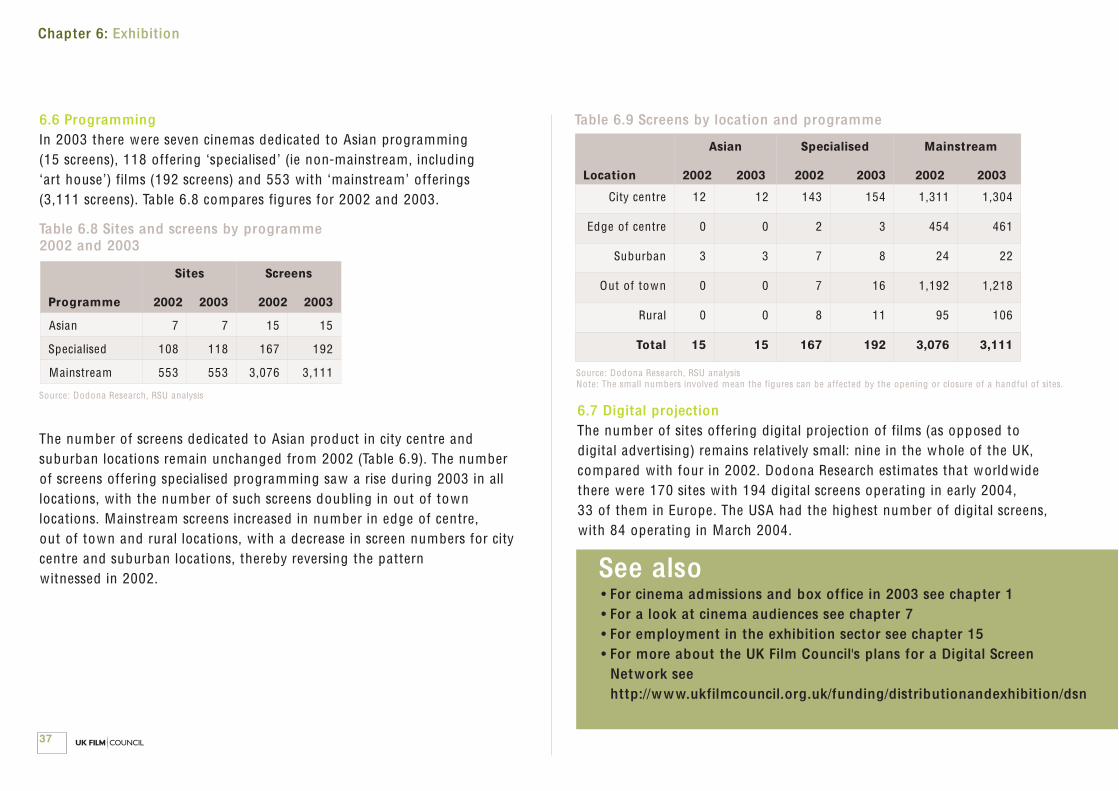
6.6 ProgrammingIn 2003 there were seven cinemas dedicated to Asian programm ing (15 screens), 118 offering ‘specialised’ (ie non-mainstream , including ‘art house’) films (192 screens) and 553 w ith ‘mainstream’ offerings (3,111 screens). Table 6.8 compares figures for 2002 and 2003.
The number of screens dedicated to Asian product in city centre and suburban locations remain unchanged from 2002 (Table 6.9). The numberof screens offering specialised programm ing saw a rise during 2003 in alllocations, w ith the number of such screens doubling in out of town locations. Mainstream screens increased in number in edge of centre, out of town and rural locations, w ith a decrease in screen numbers for citycentre and suburban locations, thereby reversing the pattern w itnessed in 2002.
Chapter 6: Exhibition
37
Programme
Sites
2002 2003
Screens
2002 2003
Asian 7 7 15 15
Specialised 108 118 167 192
Mainstream 553 553 3,076 3,111
Table 6.8 Sites and screens by programme 2002 and 2003
Source: Dodona Research, RSU analysis
Location
Asian
2002 2003
Specialised
2002 2003
Mainstream
2002 2003
City centre 12 12 143 154 1,311 1,304
Edge of centre 0 0 2 3 454 461
Suburban 3 3 7 8 24 22
Out of town 0 0 7 16 1,192 1,218
Rural 0 0 8 11 95 106
Total 15 15 167 192 3,076 3,111
Table 6.9 Screens by location and programme
Source: Dodona Research, RSU analysisNote: The small numbers involved mean the figures can be affected by the opening or closure of a handful of sites.
6.7 Digital projectionThe number of sites offering digital projection of films (as opposed to digital advertising) remains relatively small: nine in the whole of the UK,compared w ith four in 2002. Dodona Research estimates that worldw idethere were 170 sites w ith 194 digital screens operating in early 2004, 33 of them in Europe. The USA had the highest number of digital screens,w ith 84 operating in March 2004.
See also• For cinema admissions and box office in 2003 see chapter 1• For a look at cinema audiences see chapter 7• For employment in the exhibition sector see chapter 15• For more about the UK Film Council's plans for a Digital Screen
Network see http://www.ukfilmcouncil.org.uk/funding/distributionandexhibition/dsn

7 Audiences 397.1 Cinema audience by gender 407.2 Film preferences by gender 417.3 Cinema audience by age 427.4 Comparative age distribution of DVD, 42
cinema and TV audiences7.5 Film preferences by age 437.6 Cinema audience by social group 457.7 Film preferences by social group 467.8 Film audiences by ethnicity 477.9 Film audiences by disability 487.10 Cinema audiences by region 487.11 Film preferences by region 48
Audiences
38Statistical Yearbook 2003

Chapter 7Audiences
39
Cinema-going is a popular pastime in the UK – over 70 per cent of us went to the cinema at least once in 2003 and as many as onequarter went once a month or more. Delving deeper into the overalltotals reveals considerable variation in who goes to the cinema andthe types of film they enjoy; there are even regional variations in cinema attendance, w ith Londoners more likely to visit the cinema. The majority of cinema-goers are under 35 and there is significantunder-representation of disabled people among audiences.
Touching the Void courtesy of Pathé
40
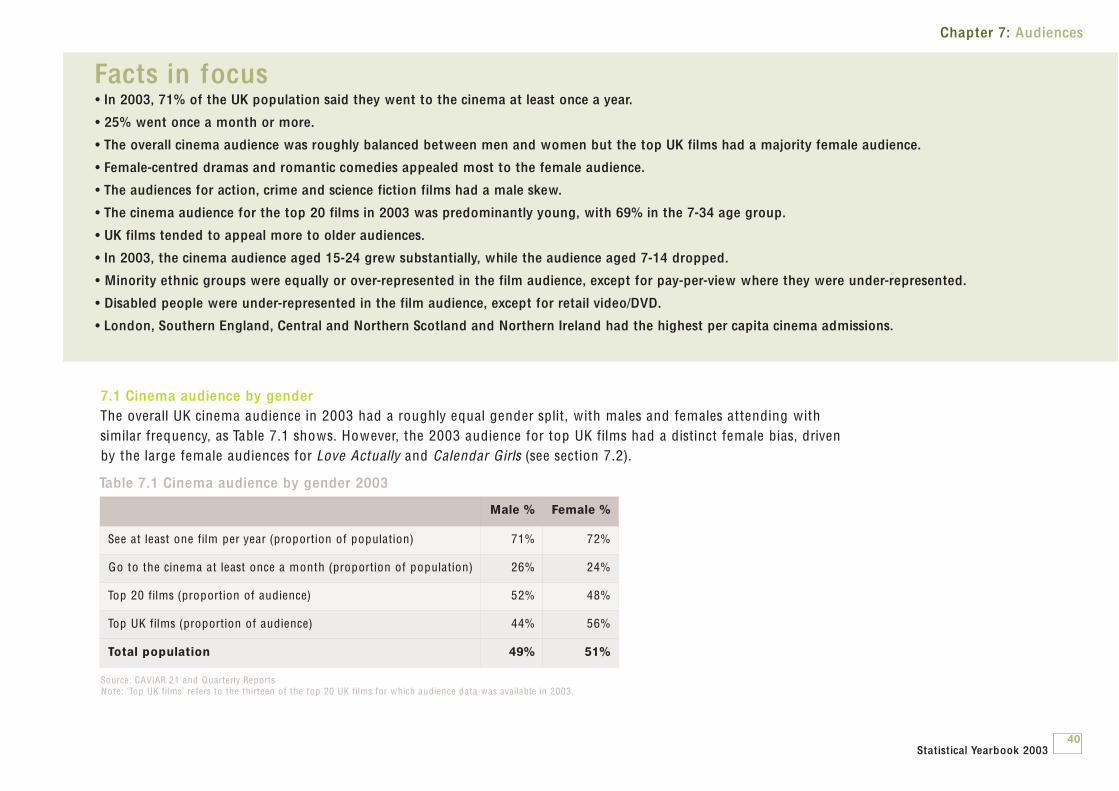
• In 2003, 71% of the UK population said they went to the cinema at least once a year.
• 25% went once a month or more.
• The overall cinema audience was roughly balanced between men and women but the top UK films had a majority female audience.
• Female-centred dramas and romantic comedies appealed most to the female audience.
• The audiences for action, crime and science fiction films had a male skew.
• The cinema audience for the top 20 films in 2003 was predominantly young, with 69% in the 7-34 age group.
• UK films tended to appeal more to older audiences.
• In 2003, the cinema audience aged 15-24 grew substantially, while the audience aged 7-14 dropped.
• Minority ethnic groups were equally or over-represented in the film audience, except for pay-per-view where they were under-represented.
• Disabled people were under-represented in the film audience, except for retail video/DVD.
• London, Southern England, Central and Northern Scotland and Northern Ireland had the highest per capita cinema admissions.
Chapter 7: Audiences
Facts in focus
7.1 Cinema audience by genderThe overall UK cinema audience in 2003 had a roughly equal gender split, w ith males and females attending w ith sim ilar frequency, as Table 7.1 shows. However, the 2003 audience for top UK films had a distinct female bias, driven by the large female audiences for Love Actually and Calendar G irls (see section 7.2).
Male % Female %
See at least one film per year (proportion of population) 71% 72%
Go to the cinema at least once a month (proportion of population) 26% 24%
Top 20 films (proportion of audience) 52% 48%
Top UK films (proportion of audience) 44% 56%
Total population 49% 51%
Table 7.1 Cinema audience by gender 2003
Source: CAVIAR 21 and Quarterly ReportsNote: ‘Top UK films’ refers to the thirteen of the top 20 UK films for which audience data was available in 2003.
Statistical Yearbook 2003

Chapter 7: Audiences
41
7.2 Film preferences by genderAlthough the overall cinema audience in 2003 was divided roughly equallybetween men and women, some films attracted substantially more of onegender than the other. Men preferred action (Terminator 3, Tomb Raider 2, X-Men 2), science fiction (the two Matrix films) and crime (Gangs of New York,Veronica Guerin, Kill Bill). The male audience skew in these genres prevailedeven where the central character was female (Kill Bill, Tomb Raider 2). Womenpreferred female-centred dramas (The Hours, Evelyn), romantic comedies(Love Actually, Two Weeks Notice) and comedies (Calendar Girls, Elf).
As in 2002, there was a tendency for the top UK films to appeal more to onegender than the other than for the overall top 20 films. All five of the films inTable 7.2 w ith the biggest female audience skews were UK films and three outof the six films w ith the biggest male audience skews were UK films.
Table 7.2 Top films by audience gender split, UK box office, 2003 Top 20 films and top UK films
Title Male % ofaudience
Female % of audience
Evelyn (UK) 26.4 73.6
Greaterfemale
audienceshare
Calendar Girls (UK) 26.7 73.3
S Club Seeing Double (UK) 27.6 72.4
Love Actually (UK) 34.2 65.8
The Hours (UK) 37.2 62.8
Two Weeks Notice 39.7 60.3
Elf 41.0 59.0
Finding Nemo 43.6 56.4
Charlie's Angels: Full Throttle 44.4 55.6
Touching the Void (UK) 45.9 54.1
The Pirates of the Caribbean 47.4 52.6
Even gender
split
Cold Mountain (UK) 48.4 51.6
Bruce A lm ighty 50.4 49.6
The Pianist (UK) 51.0 49.0
Catch Me If You Can 52.0 48.0
Nicholas Nickleby (UK) 52.7 47.3
Johnny English (UK) 54.1 45.9
Greatermale
audienceshare
The Ring 54.6 45.4
Lord of the Rings: The Return of the King 54.7 45.3
American Pie: The Wedding 56.0 44.0
8 M ile 60.2 39.8
The Matrix Reloaded 60.8 39.2
Kill Bill - Volume 1 61.2 38.8
The Matrix Revolutions 61.6 38.4
Veronica Guerin (UK) 62.3 37.7
Tomb Raider 2 (UK) 63.1 36.9
Gangs of New York 64.0 36.0
Term inator 3: Rise of Machines 64.8 35.2
X-Men 2 65.1 34.9
Underworld (UK) 69.0 31.0Source: CAVIAR / BMRB / CAA , Quarterly Reports
Bruce A lmighty courtesy BVI

Chapter 7: Audiences
42
7.3 Cinema audience by ageThe cinema audience has a youthful profile, as Table 7.3 shows. In 2003,the 41% of the population in the 7-34 age group provided 69% of the top20 film audience and 52% of the top UK film audience. The audience fortop UK films had a distinctly older age distribution than the overall top 20,w ith seven of the top UK films (including Calendar G irls, Touching the Voidand Cold Mountain) taking more than 60% of their audiences from the 35 plus age group.
Age 7 - 14
Age 15 - 24
Age 25 - 34
Age35+
See at least one film per year (proportion of population)
91% 90% 84% 60%
Go to the cinema at least once a month (proportion of population)
37% 52% 33% 14%
Top 20 films (proportion of audience) 14% 32% 23% 31%
Top UK films (proportion of audience) 12% 21% 19% 48%
Total population 11% 13% 17% 59%
Table 7.3 Cinema audience by age group 2003
Source: CAVIAR 21 and Quarterly Reports
The audience share of the 7-14 age group dropped in 2003, apparentlyreflecting the lower number of animated films released in 2003 as Table7.4 shows. The audience share of the 15-24 age group increased, influenced particularly by the success of 8 M ile, the two Matrix films andAmerican Pie : the Wedding w ith this age group. In 2003, the 15-24 audience was substantially larger in absolute terms than it was in 2002.
7.4 Comparative age distribution of DVD, cinema and TV audiencesTable 7.5 compares the frequency of cinema visits w ith the frequencies ofDVD and television watching. The frequency of DVD watching overall washigher than cinema visiting, but w ith a sim ilarly youthful age skew. Among the over-35s, the frequency of watching bought DVDs was significantly higher than for both rented DVDs and cinema. TV watchinghad an older age profile w ith the over-35s having the highest proportion(25%) watching TV for five hours or more per day.
Age 2002 (millions)
2002 % 2003 (millions)
2003 %
7 - 14 20.7 20.9 % 11.7 13.5 %
15 - 24 23.3 23.6 % 27.7 32.0 %
25 - 34 22.1 22.3 % 20.1 23.2 %
35 + 33.0 33.3 % 27.1 31.3 %
Total 99.1 100.0 % 86.6 100.0 %
Table 7.4 Audiences for the top 20 films, 2002 and 2003
Source: Cinema Advertising Association (CAA)
Statistical Yearbook 2003

Chapter 7: Audiences
43
Viewing habits Age 7 - 14
Age 15 - 24
Age 25 - 34
Age 35+
Watch rented DVD once amonth or more
34% 46% 41% 16%
Watch bought DVD once amonth or more
54% 64% 55% 31%
Go to cinema once a monthor more
37% 52% 33% 14%
Watch TV every day 90% 81% 83% 83%
Watch TV five hours ormore per day
12% 21% 22% 25%
Table 7.5 Audience frequency, DVD, cinema and TV by age group
Source: CAVIAR 21 and Quarterly Reports
7.5 Film preferences by ageComedies, animated and action films appealed to the 7-14 audience; films from a w ide range of genres (drama excepted) interested the 15-24group; crime and science fiction appealed to the 25-34 group and dramato the over 35 age group.
The age profile for the top UK films was substantially older than for theoverall top 20 films, w ith 48% of the audience for the top UK films com ingfrom the 35 plus age group. Calendar G irls, Cold Mountain, Touching theVoid, Veronica Guerin and N icholas N ickleby took more than two-thirds oftheir audience from the over-35 group. Nine of the ten films that had substantially higher than average 35 plus audience shares were UK films(Tables 7.6 – 7.9).
Title Age group % of the film’s total audience
S Club Seeing Double (UK) 59.1
Elf 39.5
Finding Nemo 32.6
Johnny English (UK) 30.7
Bruce A lm ighty 22.3
The Pirates of the Caribbean 21.4
Charlie's Angels: Full Throttle 20.2
Tomb Raider 2 (UK) 19.7
Two Weeks Notice 17.9
X-Men 2 17.2
Percentage of 7-14 age group in top 20 audience
13.5
Percentage of 7-14 age group in top UK audience
11.8
Percentage of 7-14 age group in total survey population
11.3
Table 7.6 Films with an above-average audience in 7-14 age group, 2003. Top 20 films and top UK films
Source: CAVIAR/BMRB/CAA , Quarterly Reports

44
Chapter 7: Audiences
Title Age group % of the film’s total audience
American Pie: The Wedding 61.1
8 M ile 61.0
Underworld (UK) 58.3
The Ring 48.9
Kill Bill - Volume 1 48.3
The Matrix Revolutions 42.9
The Matrix Reloaded 42.8
Love Actually (UK) 29.4
Tomb Raider 2 (UK) 26.9
Percentage of 15-24 age group in top 20 audience
32.0
Percentage of 15-24 age group in top UK audience
21.3
Percentage of 15-24 age group in total survey population
13.3
Table 7.7 Films with an above-averageaudience in 15-24 age group 2003. Top 20 films and top UK films
Source: CAVIAR/BMRB/CAA , Quarterly Reports
Title Age group % of the film’s total audience
Gangs of New York 37.5
Kill Bill - Volume 1 33.5
The Matrix Reloaded 33.4
The Matrix Revolutions 32.4
Underworld (UK) 31.9
The Hours (UK) 28.5
The Pianist (UK) 27.9
Love Actually (UK) 25.9
Tomb Raider 2 (UK) 24.9
Percentage of 25-34 age group in top 20 audience 23.2
Percentage of 25-34 age group in top UK audience 18.9
Percentage of 25-34 age group in total survey population 17.1
Table 7.8 Films with an above-average audience in 25-34 age group 2003. Top 20 films and top UK films
Source: CAVIAR/BMRB/CAA , Quarterly Reports
Statistical Yearbook 2003

Chapter 7: Audiences
45
7.6 Cinema audience by social groupThe cinema audience had a moderate skew away from the DE social grouptowards the C1 group for top 20 films and towards AB and C1 groups fortop UK films (Table 7.10).
Title Age group % of the film’stotal audience
Calender Girls (UK) 74.5
Touching the Void (UK) 71.2
Cold Mountain (UK) 67.2
Veronica Guerin (UK) 67.1
Nicholas Nickleby (UK) 67.0
The Pianist (UK) 61.6
Evelyn (UK) 60.2
The Hours (UK) 56.2
Love Actually (UK) 44.7
Lord of the Rings: The Return of the King 44.6
Percentage of 35 + age group in top 20 audience 31.3
Percentage of 35 + age group in top UK audience 48.1
Percentage of 35 + age group in total survey population 58.3
Table 7.9 Films with an above-average audience in 35 + age group 2003. Top 20 films and top UK films
Source: CAVIAR/BMRB/CAA , Quarterly Reports
AB C1 C2 DE
See at least one film per year (proportion of population)
82% 78% 68% 56%
Go to the cinema at least once a month (proportion of population)
26% 30% 24% 18%
Top 20 films (proportion of population) 27% 34% 21% 19%
Top UK films (proportion of population) 32% 34% 18% 16%
Total Population 25% 29% 21% 26%
Table 7.10 Cinema audience by social group
Source: CAVIAR 21 and Quarterly ReportsNote: AB: Professional, business and white collar, C1: Higher skilled manual, C2: Lower skilled manual, DE: ‘Sem i -’ and ‘Un–skilled’ manual
46
Chapter 7: Audiences
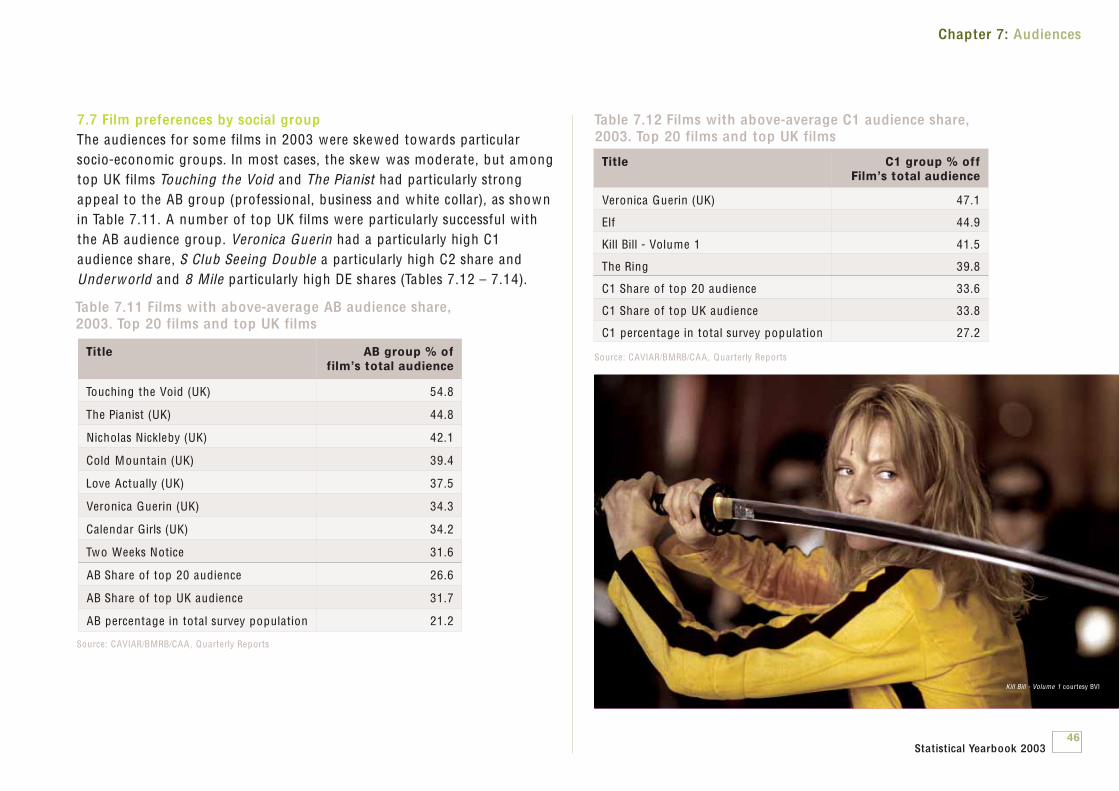
7.7 Film preferences by social groupThe audiences for some films in 2003 were skewed towards particularsocio-econom ic groups. In most cases, the skew was moderate, but amongtop UK films Touching the Void and The Pianist had particularly strongappeal to the AB group (professional, business and white collar), as shownin Table 7.11. A number of top UK films were particularly successful w iththe AB audience group. Veronica Guerin had a particularly high C1audience share, S Club Seeing Doub le a particularly high C2 share andUnderworld and 8 M ile particularly high DE shares (Tables 7.12 – 7.14).
Title AB group % of film’s total audience
Touching the Void (UK) 54.8
The Pianist (UK) 44.8
Nicholas Nickleby (UK) 42.1
Cold Mountain (UK) 39.4
Love Actually (UK) 37.5
Veronica Guerin (UK) 34.3
Calendar Girls (UK) 34.2
Two Weeks Notice 31.6
AB Share of top 20 audience 26.6
AB Share of top UK audience 31.7
AB percentage in total survey population 21.2
Table 7.11 Films with above-average AB audience share, 2003. Top 20 films and top UK films
Source: CAVIAR/BMRB/CAA , Quarterly Reports
Title C1 group % offFilm’s total audience
Veronica Guerin (UK) 47.1
Elf 44.9
Kill Bill - Volume 1 41.5
The Ring 39.8
C1 Share of top 20 audience 33.6
C1 Share of top UK audience 33.8
C1 percentage in total survey population 27.2
Table 7.12 Films with above-average C1 audience share, 2003. Top 20 films and top UK films
Source: CAVIAR/BMRB/CAA , Quarterly Reports
Statistical Yearbook 2003
Kill Bill - Volume 1 courtesy BVI

Chapter 7: Audiences
47
7.8 Film audiences by ethnicityM inority ethnic groups were over-represented among buyers of cinematickets and rental films and under-represented among buyers of pay-per-view (PPV) (the smallest market) (Table 7.15).
Title C2 group % of film’s
total audience
S Club Seeing Double (UK) 36.9
8 M ile 27.5
C2 Share of top 20 audience 20.6
C2 Share of top UK audience 18.3
C2 percentage in total survey population 22.2
Table 7.13 Films with above-average C2 audience share, 2003 Top 20 films and top UK films
Source: CAVIAR/BMRB/CAA , Quarterly Reports
Title DE group % of film’s
total audience
Underworld (UK) 33.1
8 M ile 30.3
Tomb Raider 2 (UK) 23.3
DE Share of top 20 audience 19.2
DE Share of top UK audience 16.2
DE percentage in total survey population 29.2
Table 7.14 Films with above-average DE audience share, 2003 Top 20 films and top UK films
Source: CAVIAR/BMRB/CAA , Quarterly Reports
Black, Asian, Chinese, mixed
and other
White
Population aged 12-74 8.1% 91.9%
Buyers of cinema, rental, retail and PPV film 12.1% 87.9%
Rental film buyers 11.0% 89.0%
Retail video/DVD buyers 7.5% 92.5%
Cinema-goers 12.1% 87.9%
PPV buyers 5.4% 94.6%
Table 7.15 Ethnicity of audiences aged 12-74 for cinema, rental and retail video/DVD, PPV, 2003
Source: TNSNote: For reference, the size of each of these markets as measured in the TNS Survey is shown in Table 7.16
Number of persons/buyers
(millions)
Market volume (millions
of occasions)
Population aged 12-74 45.6 n/a
Total buyers: cinema, rental,retail and PPV film
35.3 474.6
Rental film buyers 14.9 134.5
Retail video/DVD buyers 27.0 191.9
Cinema-goers 26.1 139.0
PPV 3.9 9.1
Table 7.16 Size of cinema, rental, retail and PPV markets for 12 -74 age groups, 2003
Source: TNS

7.9 Film audiences by disabilityDisabled people were significantly under-represented overall among purchasers of film view ing opportunities. Retail video/DVD was the onlymarket segment in which disabled purchasers matched their overall population percentage.
48
Chapter 7: Audiences
Disabled Not Disabled
Population aged 12-74 14.3% 85.7%
Buyers of cinema, rental, retail and PPV film 7.2% 92.8%
Rental film buyers 5.7% 94.3%
Retail video/DVD buyers 14.1% 85.9%
Cinema goers 5.6% 94.4%
PPV buyers 4.1% 95.9%
Table 7.17 Disabled audiences aged 12-74 for cinema, rental and retail video/DVD, PPV, 2003
Source: TNS
ISBA TV Region Admissions % Population %
London 43,843,771 26.2 10,964,000 19.4
M idlands 22,946,243 13.7 9,189,000 16.3
Lancashire 18,125,332 10.8 7,233,000 12.8
Southern 15,394,723 9.2 4,615,000 8.2
Yorkshire 13,573,769 8.1 4,905,000 8.7
Central Scotland 11,543,538 6.9 3,277,000 5.8
Wales and West 10,778,556 6.4 3,680,000 6.5
East of England 10,764,474 6.4 4,240,000 7.5
North East 6,214,170 3.7 3,042,000 5.4
Northern Ireland 5,367,730 3.2 1,594,000 2.8
South West 3,648,193 2.2 2,220,000 3.9
Northern Scotland 3,439,508 2.1 882,000 1.6
Border 1,615,854 1.0 655,000 1.2
Total 167,255,861 100.0 56,496,000 100.0
Table 7.18 UK cinema audience by region 2003
Source: CAA
There is more about regional patterns of cinema-going in chapter 6 (section 6.4).
7.10 Cinema audiences by regionThere was a marked regional skew in cinema adm issions, particularlytowards the London region which had 26% of adm issions from 19% of the UK population base, as Table 7.18 shows. Other regions that had ahigher share of adm issions than their population share were SouthernEngland, Central and Northern Scotland and Northern Ireland.
7.11 Film preferences by regionFor top 20 films and top UK films the regional distribution of the audiencefor individual titles was usually quite close to that of the top 20 audienceas a whole. There are no statistically significant differences to report fortop films released in 2003.
See also• For more information about top films at the box office in 2003
see chapter 2• For further details about films on video, DVD and TV see chapters 10 and 11• For a summary of what the UK Film Council is doing to broaden
audience diversity and make films more accessible at the cinema see http://www.ukfilmcouncil.org.uk/funding/distributionandexhibition
Statistical Yearbook 2003
8 UK films internationally 508.1 UK films in the USA 518.2 UK films in the European Union 528.3 UK films worldw ide 53
UK films internationally
49Statistical Yearbook 2003

Chapter 8UK Films internationallyUK films and co-productions have a significant market internationally,not least in the USA . A lthough UK films were less successful this yearthan in 2002, the top ten perform ing films worldw ide still grossedover $1,100 m illion w ith Love Actually attracting the biggest audience for a UK film .
50Love Actually courtesy of Universal

51
• Worldwide the gross box office for all films grew by 3% in 2003 to over $20 billion.
• UK films represented almost 8% of releases at the USA box office, down from just over 9% in 2002.
• The market share of UK films at the USA box office was almost 6%, at a value of $517 million.
• All top ten UK films at the USA box office were co-productions in 2003, similar to 2002.
• Love Actually was the best performing UK film at the worldwide box office.
• The top ten performing UK films worldwide grossed $1,167 million in 2003.
Chapter 8: UK Films Internationally
Facts in focus
8.1 UK films in the USAThe Motion Picture Association estimates that despite a fall in worldw idecinema adm issions, 2003 saw the worldw ide gross box office rise by 3% to $20.3 billion. Around half of this total comes from the North Americantheatrical market, which indicates its importance in the film value chain.Table 8.1 shows the country of origin of films released in the USA andCanada in 2003. There were eight fewer UK releases than in 2002, andtheir share of the gross box office fell from 7.2% in 2002 to 5.7% in 2003.The total revenue from these films stood at $516.8 m illion.
The other notable characteristic of the USA market was the greater success of USA solo films compared w ith 2002. In the former year USA solo films accounted for 55.2% of all releases and generated gross boxoffice revenues of $6,523 m illion (a market share of 73%). In 2003 therewere fewer USA solo releases (down to 53.8%), but their market share rose to 81% of the gross box office ($7,295.8 m illion).
Country of origin Number ofreleases
% ofreleases
Box officeshare %
Box office($ million)
UK and UK co-productions(non-USA)
26 5.5 1.5 139.5
USA/UK 11 2.3 4.2 377.3
Sub total 37 7.8 5.7 516.8
USA solo 253 53.8 81.0 7,295.8
USA co-productions (other) 36 7.7 11.8 1,066.5
Sub total 289 61.5 92.8 8,362.3
Rest of world 144 30.6 1.3 114.0
Total 470 100.0 100.0 9,003.4
Table 8.1 Country of origin of films in the USA and Canada, 2003
Source: Nielsen EDI, RSU analysis. Figures may not sum due to rounding
Statistical Yearbook 2003

Chapter 8: UK Films Internationally
The top 20 UK films at the European box office in the period 1999 to 2003 generated a total of 383 m illion cinema adm issions according to the EuropeanAudiovisual Observatory's Lum iere database (Table 8.4). Five films entered thetop 20 in 2003: Johnny English, Love Actually, The Pianist, The Hours, and Tomb Raider 2.
52
Cold Mountain was the top perform ing UK film at the USA box office in2003. The top ten grossed a total of $460 m illion, down 33% on 2002.Only Bend it Like Beckham and In America were made w ithout USAinvolvement (Table 8.2).
Title Country of origin Box office gross ($m)
1 Cold Mountain UK/USA/Rom/Ita 95.3
2 Tomb Raider 2 UK/USA/Jap/Ger 65.7
3 Love Actually UK/USA 59.4
4 Underworld UK/USA/Ger/Hun 51.5
5 28 Days Later UK/Neth/USA 45.1
6 What a Girl Wants UK/USA 36.0
7 Bend it Like Beckham UK/Ger 32.5
8 Calender Girls UK/USA 31.0
9 Johnny English UK/USA 28.1
10 In America UK/Ire 15.4
Table 8.2 Top ten UK films at the USA and Canada box office (including co-productions), 2003
Source: Nielsen EDI, RSU analysisNote: box office gross correct up to 22 March 2004
Country Population*(million)
Box office for UK films (£m)
UK share (%)
Germany 82.4 37.9 7.0
France 60.2 8.9m (adm issions) 5.1
UK 59.2 130.1 15.7
Spain 40.2 33.6 8.0
Austria 8.2 5.5 7.5
Table 8.3 UK market share in selected EU territories, 2003
Source: Nielsen EDI *forecast data
8.2 UK films in the European UnionThe UK market share of major European countries where data exist fellbelow 10% in 2003 (Table 8.3). UK films had a 5% share of the French market in 2003, rising to an 8% share in Spain.
The Hours courtesy of BVI

Chapter 8: UK Films Internationally
53
Title Country oforigin
Year ofrelease
Europeanadmissions
1 Harry Potter and the Philosopher’s Stone UK/USA 2001 59,032,893
2 Harry Potter and the Chamber of Secrets UK/USA 2002 49,176,277
3 Bridget Jones’s Diary UK/USA 2001 29,870,546
4 Notting Hill UK/USA 1999 29,730,259
5 The World is not Enough UK/USA 1999 26,915,828
6 Die Another Day UK/USA 2002 25,130,839
7 The Mummy Returns UK/USA 2001 20,266,804
8 Shakespeare in Love UK/USA 1999 19,306,232
9 Chicken Run UK/USA 2000 16,257,695
10 Lara Croft Tomb Raider UK/USA/Jap/Ger 2001 14,624,771
11 Johnny English UK/USA 2003 13,510,856
12 Billy Elliot UK/Fra 2000 12,777,494
13 Love Actually UK/USA 2003 12,366,368
14 Chocolat UK/USA 2001 10,893,803
15 About a Boy UK/USA 2002 10,838,040
16 The Pianist Fra/UK/Ger/Neth/Pol 2003 8,115,425
17 Gosford Park UK/USA/Ger/Ita 2002 6,726,794
18 The Hours UK/USA 2003 6,067,545
19 Snatch UK/USA 2000 5,781,421
20 Tomb Raider 2 UK/USA/Jap/Ger 2003 5,575,283
Table 8.4 Top 20 UK films in 35 European countries 1999 to 2003
Source: European Audiovisual Observatory Lum iere Database, RSU analysis
8.3 UK films worldwideAccording to Variety, the top ten perform ing UK films worldw idegrossed a total of $1,167 m illion in 2003 (Table 8.5).
Title Country of origin
Worldwide gross
($ million)
1 Love Actually UK/USA 185
2 Johnny English UK/USA 158
3 Tomb Raider 2 UK/USA/Jap/Ger 156
4 Harry Potter and theChamber of Secrets
UK/USA 148
5 Die Another Day UK/USA 108
6 The Hours UK/USA 107
7 The Pianist Fra/UK/Ger/Neth/Pol 99
8 Underworld UK/USA/Ger/Hun 80
9 28 Days Later UK/Neth/USA 72
10 Calender Girls UK/USA 54
Table 8.5 Top 10 UK films worldwide, 2003
Source: VarietyNote: Variety lists the gross made in 2003 and includes films released in the previous year. Cold Mountain is absent from the top ten as it was released late in 2003 and its worldw idegross was still grow ing in 2004.
See also• For more information about overseas trade see chapter 9
Statistical Yearbook 2003

9 Overseas trade and the UK film industry 559.1 Film exports, 1995 - 2002 56
Overseas trade and the UK film industry
54Statistical Yearbook 2003

Chapter 9Overseas trade andthe UK film industryOverseas trade in UK films and film services is of interest not only to the industry but also to all who study the UK economy. The mostup to date trade figures available are those for 2002 and they showthat the UK film industry exported £656 m illion worth of services inthat year, a slight decline on 2001’s exports. Film , however, still made a positive contribution to the UK balance of payments.
55Johnny English courtesy of Universal
56
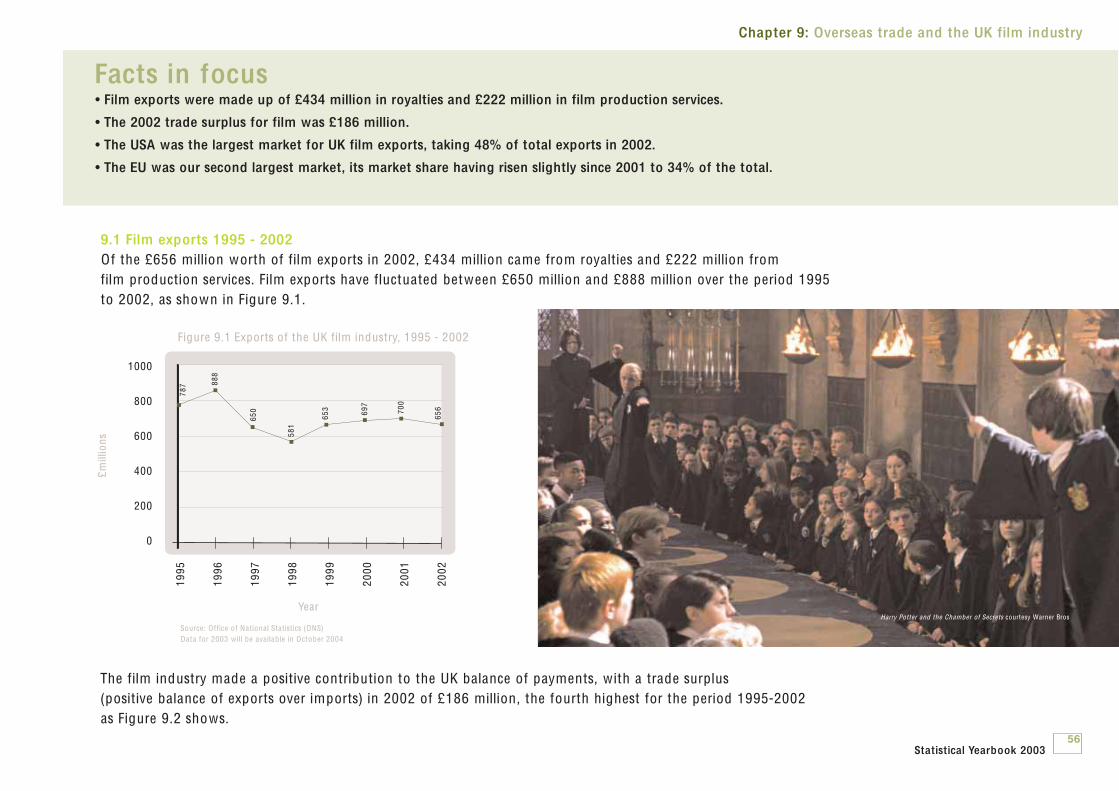
• Film exports were made up of £434 million in royalties and £222 million in film production services.
• The 2002 trade surplus for film was £186 million.
• The USA was the largest market for UK film exports, taking 48% of total exports in 2002.
• The EU was our second largest market, its market share having risen slightly since 2001 to 34% of the total.
Chapter 9: Overseas trade and the UK film industry
Facts in focus
9.1 Film exports 1995 - 2002Of the £656 m illion worth of film exports in 2002, £434 m illion came from royalties and £222 m illion from film production services. Film exports have fluctuated between £650 m illion and £888 m illion over the period 1995 to 2002, as shown in Figure 9.1.
The film industry made a positive contribution to the UK balance of payments, w ith a trade surplus (positive balance of exports over imports) in 2002 of £186 m illion, the fourth highest for the period 1995-2002 as Figure 9.2 shows.
1000
800
600
400
200
0
1995
1996
1997
1998
1999
2000
2001
2002
Year
Source: Office of National Statistics (ONS)Data for 2003 w ill be available in October 2004
£mill
ions
Figure 9.1 Exports of the UK film industry, 1995 - 2002
787 88
8
650
581
653 69
7
700
656
Statistical Yearbook 2003
Harry Potter and the Chamber of Secrets courtesy Warner Bros

Chapter 9: Overseas trade and the UK film industry
57
300
250
200
150
100
50
0
1995
1996
1997
1998
1999
2000
2001
2002
Year
Source: ONSNote: ‘Trade surplus’ equals exports m inus imports. Where a company (e g the UK subsidiary of a USA major) receives income from overseas that it subsequently pays to its parent company, this is recorded both as a receipt and as a payment, leaving the measure of the trade surplus unaffected.
£mill
ions
Figure 9.2 Trade surplus of UK film industry,
1995 - 2002
106
236
125 14
4
278
87
245
186
The share of UK film exports accounted for by the UK subsidiaries of majorUSA film companies declined from 70% in 1996 to 53% in 2002, as shownin Figure 9.3.
75.0
70.0
65.0
60.0
55.0
50.0
45.0
40.0
1995
1996
1997
1998
1999
2000
2001
2002
Year
Perc
ent
of t
otal
exp
orts
Figure 9.3 Exports by UK subsidiaries of major USA film companies as a percentage of total UK film exports
66.5
70.2
67.5
54.9 55
.4
59.7
53.0
52.5
The USA was the largest market for UK film exports, taking 49% of totalexports in 2002. The EU was the second largest market (taking 34% intotal) w ith Germany, France and Italy being the largest EU country markets,as shown in Figure 9.4.

Chapter 9: Overseas trade and the UK film industry
58
Figure 9.4 Destination of UK film exports as percentage of the total, 2002
Source: ONS
Aus & Oceania (1.5%)
France (10.6%)
Germany (9.6%)
Italy (3.8%)
Other EU (10.0%)
Other Europe (5.5%)
Asia (7.0%)Africa (1.8%)
Other America (0.8%)
USA (49.4%)
The geographical distribution of the UK’s film trade surplus was differentfrom the export pattern, as shown in Table 9.1. The USA’s share was muchlower, at 6.9%, while the EU accounted for 48% (net) and Asia for 23%.This reflects the higher proportion of film imports from the USA in the UK’stotal film imports.
Territory £ MillionExports Imports Balance
Percent of totalExports Imports Balance
France 70 20 50 10.6 4.3 26.6
Germany 63 6 57 9.6 1.3 30.3
Italy 25 0 25 3.8 0.0 13.3
Other EU 66 107 -41 10.0 22.8 -21.8
Other Europe 36 13 23 5.5 2.8 12.2
USA 325 312 13 49.4 66.4 6.9
Other America 5 6 -1 0.8 1.3 -0.5
Africa 12 1 11 1.8 0.2 5.9
Asia 46 3 43 7.0 0.6 22.9
Aus & Oceania 10 2 8 1.5 0.4 4.3
World Total 658 470 188 100.0 100.0 100.0
Table 9.1 International transactions of the UK film industry by geographical area, 2002
Source: ONS
Statistical Yearbook 2003

10 Film on VHS and DVD 6010.1 Film on VHS and DVD 6110.2 Film in the rental video market 6110.3 Film in the retail video market 6310.4 Hardware 65
Film on VHS and DVD
59Statistical Yearbook 2003

Chapter 10Film on VHS and DVD
60
The ready availability of film in video formats (VHS and DVD) hasw idened our access to films and generated an important new revenue stream . The market continued to thrive, up by 13% in thelast year, though home viewers did not always favour the same filmsas cinema-goers.
Harry Potter and the Philospher’s Stone courtesy of Warner Bros

61
• In 2003 more VHS and DVD units were sold than rented, the first time this has occurred.
• 156 million VHS videos and DVDs were rented , while 208 million VHS videos and DVDs were sold.
• DVD sales increased 61% on 2002.
• The total value of the rental and sales market in 2003 was £2.87 billion.
• The top rental title on VHS was My Big Fat Greek Wedding, while on DVD it was Signs. The most popular purchase on VHS was Harry Potter and the
Chamber of Secrets, and on DVD it was The Lord of the Rings: The Two Towers.
• 6.37 million DVD players and 4.7 million video cassette recorders were sold in 2003.
Chapter 10: Film on VHS and DVD
Facts in focus
10.1 Film on VHS and DVDAccording to the British Video Association (BVA) the total value of the UK home video market (VHS and DVD) was£2.87 billion in 2003, an increase of 13% on 2002. Film accounted for 81% of this, equivalent to three times thevalue of the UK theatrical market.
A m ilestone was passed in 2003 marking a shift in consumer behaviour away from video rentals towards purchases. For the first time the volume of VHS videos and DVDs sold was higher than the number rented. This may be due to the fact that many titles are now released simultaneously to rent and to buy.
It may also result from the unique features of the DVD format, w ith consumers judging that ownership of a DVDintended for repeated view ings (w ith no deterioration in quality) is more cost effective over time than a one-offrental. Looked at another way, the expansion of the retail market may also reflect the development of new pricingstructures and the proliferation of marketing offers (multi-buy discounts and so on).
It is possible that piracy has played a role in depressing the volume of rental transactions although it is difficult toknow for certain on the strength of the available data.
10.2 Film in the rental video market156 m illion videos and DVDs were rented in 2003 (an average of over six per household) w ith an average value of£2.88. 99% of rental transactions were feature films, and UK films accounted for 14.5% of all transactions on videoand DVD.
Figure 10.1 shows that the number of transactions fell by 20 m illion from 2002, to its lowest level since 1994. The value of the rental market fell to £450 m illion.
Statistical Yearbook 2003
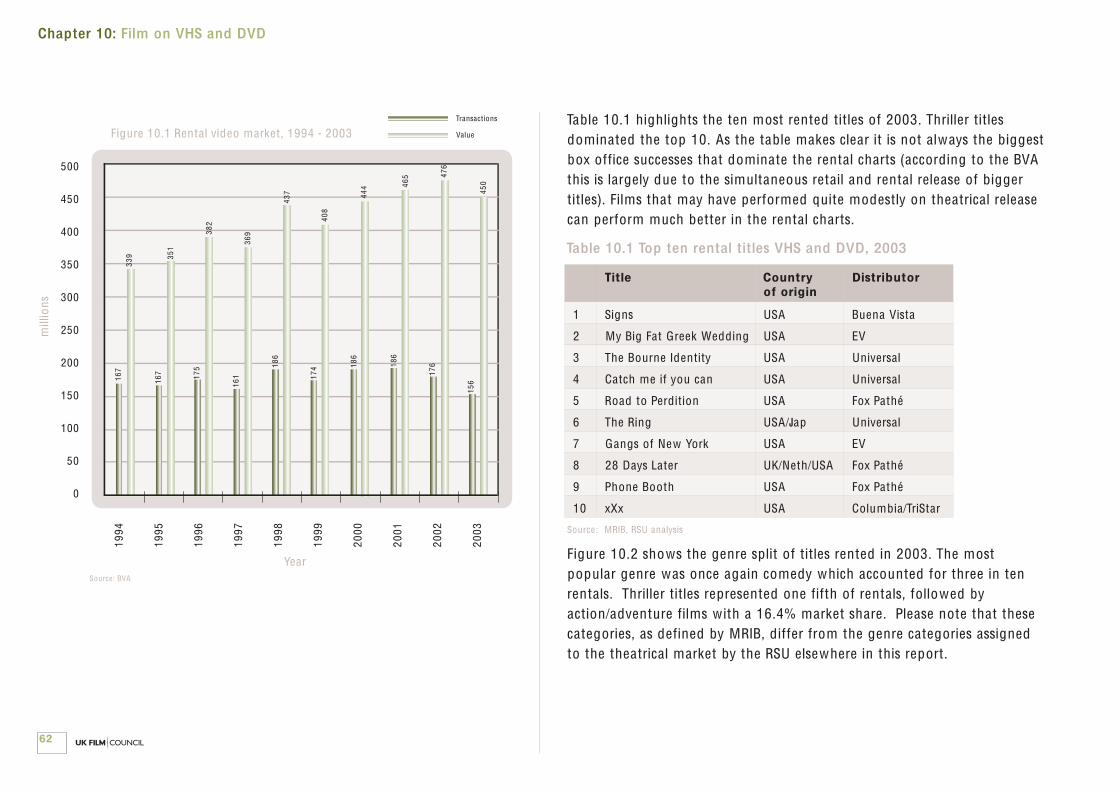
Chapter 10: Film on VHS and DVD
62
Table 10.1 highlights the ten most rented titles of 2003. Thriller titles dom inated the top 10. As the table makes clear it is not always the biggestbox office successes that dom inate the rental charts (according to the BVAthis is largely due to the simultaneous retail and rental release of biggertitles). Films that may have performed quite modestly on theatrical releasecan perform much better in the rental charts.
Figure 10.2 shows the genre split of titles rented in 2003. The most popular genre was once again comedy which accounted for three in tenrentals. Thriller titles represented one fifth of rentals, followed byaction/adventure films w ith a 16.4% market share. Please note that thesecategories, as defined by MRIB, differ from the genre categories assignedto the theatrical market by the RSU elsewhere in this report.
Source: BVA
Figure 10.1 Rental video market, 1994 - 2003
500
450
400
350
300
250
200
150
100
50
0
1994
1995
1996
1997
1998
1999
2000
2001
2002
2003
Transactions
Value
167
339
167
351
175
382
161
369
186
437
174
408
186
444
186
465
176
476
156
450
Year
mill
ions
Title Country of origin
Distributor
1 Signs USA Buena Vista
2 My Big Fat Greek Wedding USA EV
3 The Bourne Identity USA Universal
4 Catch me if you can USA Universal
5 Road to Perdition USA Fox Pathé
6 The Ring USA/Jap Universal
7 Gangs of New York USA EV
8 28 Days Later UK/Neth/USA Fox Pathé
9 Phone Booth USA Fox Pathé
10 xXx USA Columbia/TriStar
Table 10.1 Top ten rental titles VHS and DVD, 2003
Source: MRIB, RSU analysis
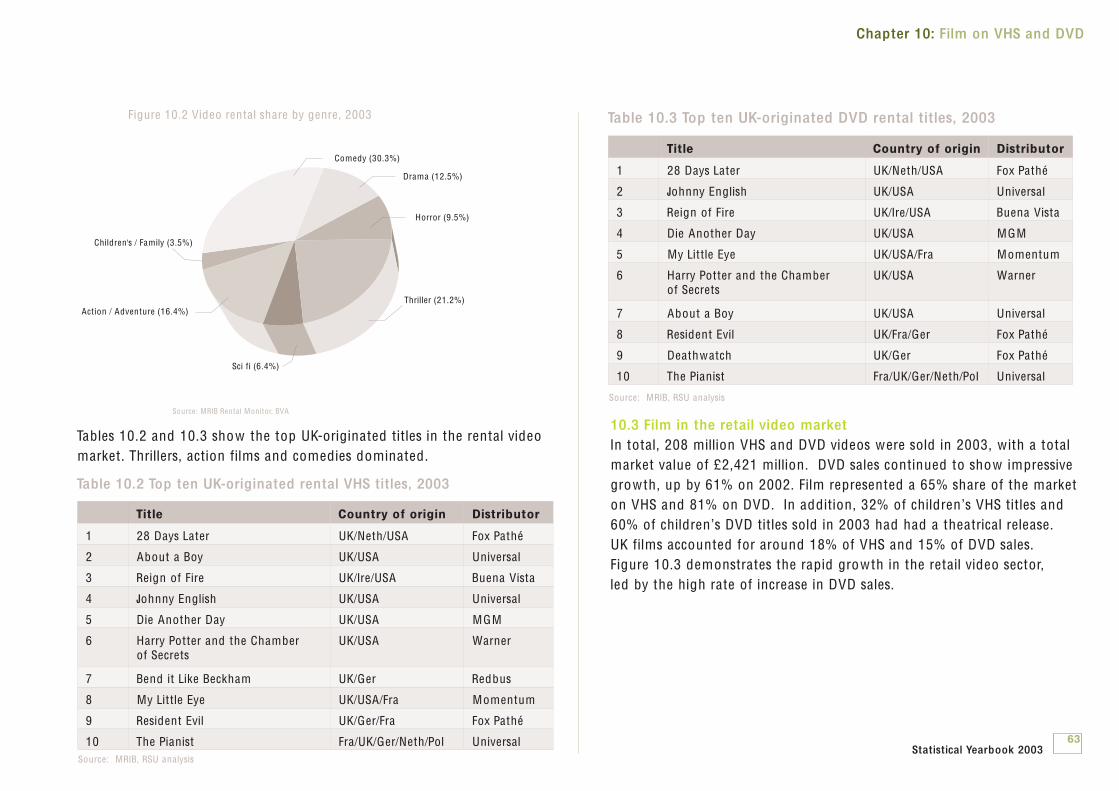
Chapter 10: Film on VHS and DVD
63
Tables 10.2 and 10.3 show the top UK-originated titles in the rental videomarket. Thrillers, action films and comedies dom inated.
Title Country of origin Distributor
1 28 Days Later UK/Neth/USA Fox Pathé
2 About a Boy UK/USA Universal
3 Reign of Fire UK/Ire/USA Buena Vista
4 Johnny English UK/USA Universal
5 Die Another Day UK/USA MGM
6 Harry Potter and the Chamber of Secrets
UK/USA Warner
7 Bend it Like Beckham UK/Ger Redbus
8 My Little Eye UK/USA/Fra Momentum
9 Resident Evil UK/Ger/Fra Fox Pathé
10 The Pianist Fra/UK/Ger/Neth/Pol Universal
Table 10.2 Top ten UK-originated rental VHS titles, 2003
Source: MRIB, RSU analysis
Title Country of origin Distributor
1 28 Days Later UK/Neth/USA Fox Pathé
2 Johnny English UK/USA Universal
3 Reign of Fire UK/Ire/USA Buena Vista
4 Die Another Day UK/USA MGM
5 My Little Eye UK/USA/Fra Momentum
6 Harry Potter and the Chamber of Secrets
UK/USA Warner
7 About a Boy UK/USA Universal
8 Resident Evil UK/Fra/Ger Fox Pathé
9 Deathwatch UK/Ger Fox Pathé
10 The Pianist Fra/UK/Ger/Neth/Pol Universal
Table 10.3 Top ten UK-originated DVD rental titles, 2003
Source: MRIB, RSU analysis
10.3 Film in the retail video marketIn total, 208 m illion VHS and DVD videos were sold in 2003, w ith a totalmarket value of £2,421 m illion. DVD sales continued to show impressivegrowth, up by 61% on 2002. Film represented a 65% share of the marketon VHS and 81% on DVD. In addition, 32% of children’s VHS titles and60% of children’s DVD titles sold in 2003 had had a theatrical release. UK films accounted for around 18% of VHS and 15% of DVD sales. Figure 10.3 demonstrates the rapid growth in the retail video sector, led by the high rate of increase in DVD sales.
Figure 10.2 Video rental share by genre, 2003
Source: MRIB Rental Monitor, BVA
Horror (9.5%)
Thriller (21.2%)
Sci fi (6.4%)
Drama (12.5%)
Comedy (30.3%)
Children's / Fam ily (3.5%)
Action / Adventure (16.4%)
Statistical Yearbook 2003

Chapter 10: Audiences
64
Source: Official UK Charts Company, BVA
Figure 10.3 Retail video sales, 1994 - 2003
3000
2500
2000
1500
1000
500
0
1994
1995
1996
1997
1998
1999
2000
2001
2002
2003
Volume
Value
6669
8
7378
9
7980
3
8785
8
100
981
9696
0
114
1200
135
1539
169
2050
208
2421
Year
mill
ions
Table 10.4 shows the top selling films on DVD and VHS in 2003. As w ithlast year’s chart it reflects the top grossing box office films of the last twoyears. Please note that this table includes theatrically released films listedin the ‘Children’s’ genre category by the Official UK Charts Company.
Title Country of origin Distributor
1 Lord of the Rings: The Two Towers USA/NZ EIV
2 Harry Potter and the Chamber ofSecrets
UK/USA Warner
3 The Pirates of the Caribbean USA Buena Vista
4 The Matrix Reloaded USA Warner
5 Lord of the Rings: The Fellowship ofthe Ring
USA/NZ EIV
6 Lilo & Stitch USA Buena Vista
7 Die Another Day UK/USA MGM
8 Bruce A lm ighty USA Buena Vista
9 Spiderman USA Col/TriStar
10 The Matrix USA Warner
Table 10.4 Top 10 VHS and DVD retail sales, 2003
Source: Official UK Charts Company, RSU analysis
Figure 10.4 Sales breakdown by film genre, 2003
Source: Official UK Charts Company
Horror 5.2%
Comedy 20.7%
Musical 3.3%
Drama 14.4%
Western 0.9%
Fam ily 9.2%
Science Fiction 10.5%
Adult 0.3%
War 3.8%
Thriller 8.8%
Action / Adventure 23.0%
Figure 10.4 shows the genre of films sold on video in 2003. Acion/adventure was the dom inant genre, accounting for 23% of the market.Comedy was the next most popular w ith one in five (20.7%) of all sales.

65
Chapter 10: Audiences
Tables 10.5 and 10.6 highlight the top ten UK performers on sell-throughVHS and DVD in 2003. The popularity of recent theatrical releases is clearw ith Harry Potter and the Chamber of Secrets, Die Another Day, andJohnny English among the popular titles released theatrically in 2002/3.
Title Country of origin
Distributor
1 Harry Potter and the Chamber of Secrets
UK/USA Warner
2 Bridget Jones’s Diary UK/USA Universal
3 Die Another Day UK/USA MGM
4 Bend it Like Beckham UK/Ger Warner
5 About a Boy UK/USA Universal
6 Notting Hill UK/USA Universal
7 Johnny English UK/USA Universal
8 Harry Potter and thePhilosopher’s Stone
UK/USA Warner
9 28 Days Later UK/Neth/USA 20th Century Fox
10 Dog Soldiers UK/Lux 20th Century Fox
Table 10.5 Top ten UK-originated VHS retail titles, 2003
Source: Official UK Charts Company, RSU analysis
Title Country of origin Distributor
1 Harry Potter and the Chamber ofSecrets
UK/USA Warner
2 Die Another Day UK/USA MGM
3 Johnny English UK/USA Universal
4 28 Days Later UK/Neth/USA 20th Century Fox
5 Bend it Like Beckham UK/Ger Warner
6 Bridget Jones’s Diary UK/USA Col/TriStar
7 The 51st State UK/Can Momentum
8 About a Boy UK/USA Universal
9 Dog Soldiers UK/Lux 20th Century Fox
10 Harry Potter and the Philosopher’sStone
UK/USA Warner
Table 10.6 Top ten UK-originated DVD retail titles, 2003
Source: Official UK Charts Company, RSU analysis
10.4 HardwareThere was a large increase in the ownership of DVD players in 2003. In thecourse of the year 6.37 m illion DVD players were sold, and it is estimatedthat 41% of households owned a DVD player (up from around 25% in2002).
In spite of DVD's grow ing popularity, sales of video cassette recorders (VCRs)also rose in 2003. 91.5% of households in the UK owned a VCR, sales ofwhich hit the 4.7 m illion mark in 2003 (up 1% on 2002).
See also• For more information about top films at the UK box office
see chapter 2• For further details about the performance of films on UK
television see chapter 11
Statistical Yearbook 2003

11 Film on UK television 6711.1 Programm ing 6811.2 Peak time 6911.3 Audiences 7011.4 Films on cable and satellite TV 72
Film on UK televison
66Statistical Yearbook 2003

Chapter 11Film on UK televisionFeature films shown on a w idening range of television channels give m illions of viewers an opportunity to enjoy films at home.Typical peak-time television audiences are greater than cinema audiences and an exceptional film can even attract a sizeable proportion of the UK population. Television exposure is also a vitalcomponent in the value chain, giving yielding another source of revenue.
67Lara Croft : Tomb Raider courtesy of Paramount

68
• 2,339 films were shown on terrestrial channels in 2003, up 11% on 2002. This is an average of over six films
per day. Of these 518 (22%) were UK films.
• An average of 2.8 million people watched each film on peak time TV (down from 2.9 million in 2002).
• The top film on terrestrial television was Billy Elliot on BBC1, with over 12 million viewers, one in five of the
UK population.
• Multi-channel television accounted for almost 24% of the UK audience in 2003, up from 22% in 2002.
• By the end of 2003, over 50% of households were estimated to have digital television.
Chapter 11: Film on UK televison
Facts in focus
11.1 ProgrammingTable 11.1 shows the number of feature films broadcast on the five terrestrial network channels in 2003 and the total number of UK titles broadcast in that time, broken down into older titles (more than eight years old) and recent theatrical releases (released in the last eight years). Here, UK film includes all titles listed as UK-originated in the Broadcasters Audience Research Board (BARB) genre field, plus UK co-productions categorised as other countries (mostly USA) in the BARB data.
The number of films on terrestrial television rose by 11% in 2003, although the proportion of recent UK films remained static at 2.8%.
Channel Total no. offilms broadcast
Total no. UKfilms broadcast
No. UK films more than 8 yrs old
No. recent UK filmsless than 8 yrs old
No. recent UK films as % total films
BBC1 432 76 56 20 4.6
BBC2 448 91 76 15 3.3
ITV1 310 73 61 12 3.9
Channel 4 587 222 207 15 2.6
Five 562 56 53 3 0.5
Total 2,339 518 453 65 2.8
Table 11.1 Feature films broadcast on network television 2003
Source: BARB, DGA Metrics, RSU analysis
Statistical Yearbook 2003

Chapter 11: Film on UK televison
69
Source: DGA Metrics
Figure 11.1 Number of feature films on network television, 1998 - 2003
1,200
1,000
800
600
400
200
0
1998
1999
2000
2001
2002
2003
BBC1BBC2ITV1Channel 4Five
449
456
300
975
551
394
495
324
774
531
319
513
291
562
629
516
339
284
616 64
1
342 38
825
554
4 574
432 44
831
058
7
562
Year
11.2 Peak timeThe proportion of peak time hours (18:00 to 23:59 hours) givenover to films varied w idely across the terrestrial channels. Film represented 9.1% of programm ing on BBC1, 4.5% on BBC2,5.4% on ITV1, 9.5% on Channel 4 and 13.4% on Five (Figure 11.2).
Source: DGA Metrics
Figure 11.2 Composition of peak time hours, 2003
% H
ours
50%
45%
40%
35%
30%
25%
20%
15%
10%
5%
0%
Dra
ma
Fact
ual
Ente
rtai
nmen
t
New
s/cu
rren
t af
fairs
Film
(cin
ema)
Spor
t
Oth
er
Film
(m
ade
for
TV)
BBC1BBC2ITV1Channel 4Five
21.0
%8.
9%39
.0%
49.9
%
14.0
18.8
%33
.6%
12.6
%
39.7
%17
.0%
20.0
%
20.5
%15
.5%
16.2
%6.
3%
24.1
%13
.2% 17
.6%
15.9
%6.
1%
9.1%
4.5%
5.4%
9.5% 13
.4%
3.2%
10.4
%7.
7%
1.0% 1.1%
3.9%
8.8%
1.1%2.
0% 3.5%
0.0%
0.2%
0.2%
5.1%
0.2%
The number of slots for feature film on network television declinedfrom 1998 to 2002, but increased slightly in 2003, as Figure 11.1shows.

Chapter 11: Film on UK televison
70
The total number of broadcast hours for film per channel in peak time isshown in Figure 11.3. Channel Five transm itted 540 hours of film at peaktimes over 2003, whereas ITV1 showed 98 hours (the only channel to see adecrease compared w ith 2002).
11.3 AudiencesThe average audience for a film shown on peak-time network television was 3.76 m illion on BBC1, 2 m illion on BBC2, 4.7 m illion on ITV1,1.9 m illion on Channel 4 and 1.7 m illion on Five. This compares w ith themedian cinema adm issions for top 50 films of approximately 1.7 m illion.
Figure 11.3 Hours of film in peak time, 2003
600
500
400
300
200
100
0
BBC1
BBC2
ITV
1
Cha
nnel
4
Five
185
98
127
540
173
Hou
rs
Source: BARB, DGA Metrics
Figure 11.4 Average audience for peak time film , 2003
5,000
4,000
3,000
2,000
1,000
0
BBC1
BBC2
ITV
1
Cha
nnel
4
Five
3,76
0
2,02
8
4,68
4
1,88
6
1,72
2
Aud
ienc
e (0
00s)
This compares favourably w ith average peak time audiences for other types of programm ing, as shown in Figure 11.5.
Statistical Yearbook 2003

Chapter 11: Film on UK televison
71
Source: BARB, DGA Metrics
Figure 11.5 Average peak-time audience, 2003
9,000
8,000
7,000
6,000
5,000
4,000
3,000
2,000
1,000
0
BBC1
BBC2
ITV
1
Cha
nnel
4
Five
Feature filmDramaEntertainmentChannel 4Five
3,76
0
7,93
64,
926
3,91
94,
869
2,02
81,
945
2,17
2
1,92
3 2,38
5
4,68
48,
333
5,25
93,
649
4,29
1
1,88
61,
705
1,79
9
1,84
0
2,60
5
1,72
2
1,53
859
0
1,17
6
1,03
8
Aud
ienc
e (0
00s)
The most popular film on terrestrial television was Billy Elliot, w ith over 12 m illion viewers, one person in five, tuning in to its prem iere show ing onBBC1(Table 11.2). In theatrical terms, this is equivalent to a box officegross of over £56 m illion (by way of comparison the film actually made£18.4 m illion at the UK box office).
Title Channel Countryof origin
Year of theatrical
release
Audience(m)
1 Billy Elliot BBC1 UK/Fra 2000 12.7
2 Cast Away BBC1 USA 2000 9.6
3 The Sixth Sense ITV1 USA 1999 9.0
4 Indiana Jones and the Last Crusade
BBC1 USA 1989 8.8
5 Dr Dolittle ITV1 USA 1998 8.2
6 The World is Not Enough ITV1 UK/USA 1999 7.8
7 The Thomas Crown Affair BBC1 USA 1999 7.7
8 The Full Monty ITV1 UK/USA 1997 7.6
9 Goldeneye ITV1 UK/USA 1995 7.5
10 Meet the Parents BBC1 USA 2000 7.4
Table 11.2 Top 10 films on network television, 2003
Source: BARB, DGA Metrics
The top 10 UK films of 2003, shown in Table 11.3, included five James Bondfilms (two show ings for 1997’s Tomorrow Never Dies) and two broadcasts ofBilly Elliot.

72
Chapter 11: Film on UK televison
Title Channel Country of origin
Year of theatrical
release
Audience(m)
1 Billy Elliot BBC1 UK/Fra 2000 12.7
2 The World is Not Enough ITV1 UK/USA 1999 7.8
3 The Full Monty ITV1 UK/USA 1997 7.6
4 Goldeneye ITV1 UK/USA 1995 7.5
5 Tomorrow Never Dies ITV1 UK/USA 1997 7.2
6 Billy Elliot BBC1 UK/Fra 2000 7.1
7 Chicken Run BBC1 UK/USA 2000 6.8
8 Tomorrow Never Dies ITV1 UK/USA 1997 6.7
9 Little Voice BBC2 UK 1999 5.8
10 You Only Live Tw ice ITV1 UK/USA 1967 5.6
Table 11.3 Top 10 UK-originated films on network television, 2003
Source: BARB, DGA Metrics
11.4 Films on cable and satellite TVTable 11.4 shows the audience share for satellite/cable multi-channel television has continued to grow in last few years. Multi-channel TV accounted for 23.6% of the UK audience in 2003, up from 22.1% in 2002.
Year BBC1 BBC2 ITV1 Channel 4 Five Others
1999 28.4 10.8 31.2 10.3 5.4 14.0
2000 27.2 10.8 29.3 10.5 5.7 16.6
2001 26.9 11.1 26.7 10.0 5.8 19.6
2002 26.2 11.4 24.1 10.0 6.3 22.1
2003 25.6 11.0 23.7 9.4 6.5 23.6
Table 11.4 TV percentage audience shares 1999 - 2003
Source: BARB, DGA Metrics
There are now 12.4 m illion digital TV households in the UK, which represents just over 50% market penetration. In total, 13.4 m illion households have access to multi-channel television (Table 11.5). Pay-per-view film channels such as Sky Box Office and Front Row offer arange of films across 60 separate channels to digital satellite and cablesubscribers.
Statistical Yearbook 2003
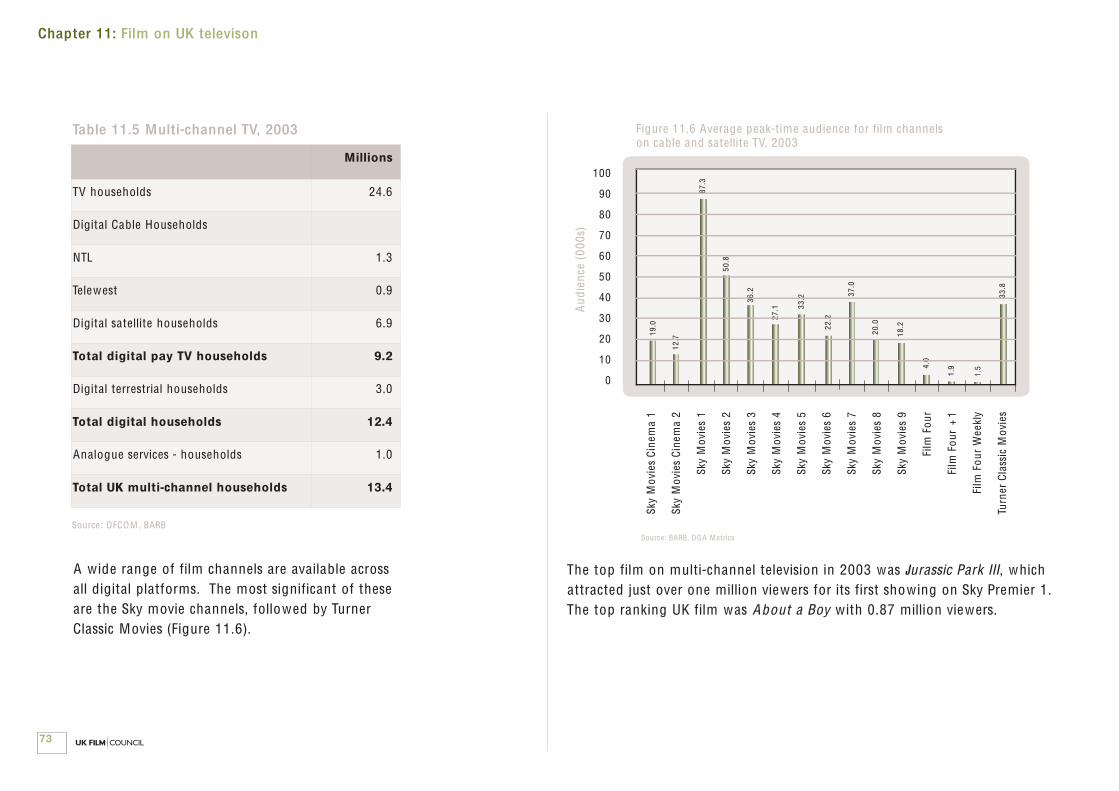
Chapter 11: Film on UK televison
73
A w ide range of film channels are available acrossall digital platforms. The most significant of theseare the Sky movie channels, followed by TurnerClassic Movies (Figure 11.6).
Millions
TV households 24.6
Digital Cable Households
NTL 1.3
Telewest 0.9
Digital satellite households 6.9
Total digital pay TV households 9.2
Digital terrestrial households 3.0
Total digital households 12.4
Analogue services - households 1.0
Total UK multi-channel households 13.4
Table 11.5 Multi-channel TV, 2003
Source: OFCOM , BARBSource: BARB, DGA Metrics
Figure 11.6 Average peak-time audience for film channels on cable and satellite TV, 2003
100
90
80
70
60
50
40
30
20
10
0
Sky
Mov
ies
Cine
ma
1
Sky
Mov
ies
Cine
ma
2
Sky
Mov
ies
1
Sky
Mov
ies
2
Sky
Mov
ies
3
Sky
Mov
ies
4
Sky
Mov
ies
5
Sky
Mov
ies
6
Sky
Mov
ies
7
Sky
Mov
ies
8
Sky
Mov
ies
9
Film
Fou
r
Film
Fou
r +
1
Film
Fou
r W
eekl
y
Turn
er C
lass
ic M
ovie
s
19.0
12.7
50.8
36.2
87.3
27.1 33
.2
22.2
37.0
20.0
18.2
4.0
1.9
1.5
33.8
Aud
ienc
e (0
00s)
The top film on multi-channel television in 2003 was Jurassic Park III, whichattracted just over one m illion viewers for its first show ing on Sky Prem ier 1.The top ranking UK film was About a Boy w ith 0.87 m illion viewers.

74
Chapter 11: Film on UK televison
Title Channel Country of origin
Year of theatrical
release
Audience(m)
1 Jurassic Park III Sky Prem ier 1 USA 2001 1.04
2 Crocodile Dundee in Los Angeles
Sky Prem ier 1 USA 2001 0.88
3 About a Boy Sky Movies 1 UK/USA 2002 0.87
4 Swordfish Sky Prem ier 1 USA 2001 0.85
5 StarWars Episode II: Attack of the Clones
Sky Movies 1 USA 2002 0.81
6 Bend it like Beckham Sky Movies 1 UK/Ger 2002 0.81
7 Lara Croft: Tomb Raider Sky Prem ier 1 UK/USA/Ger/Jap 2001 0.78
8 Planet of the Apes Sky Prem ier 1 USA 2001 0.76
9 Legally Blonde Sky Prem ier 1 USA 2001 0.74
10
Sister Act 2: Back in the Habit
Sky One USA 1994 0.74
Table 11.6 Top 10 feature films on multi-channel television, 2003
Source: BARB, DGA Metrics
See also• For more information about top films on theatrical release see
chapter 2• For an overview of the performance of films on video see
chapter 10
Statistical Yearbook 2003
Bend it Like Beckham courtesy of Helkon SK
12 Film Production 7612.1 The value of UK production in 2003 7712.2 Inward, domestic and UK co-production 78
features 1992 to 200312.3 Upward trends in budgets 8012.4 Size distribution of budgets, 2003 8012.5 Big budget productions in 2002 and 2003 8112.6 UK share of co-production expenditure 8212.7 Partners in UK co-productions 8212.8 UK co-productions by country of shoot 8312.9 Production company activity levels 8412.10 US Studios’ involvement in inward features 84
Film Production
75Statistical Yearbook 2003

Chapter 12Film productionThe UK Film industry is both an independent creator of feature filmsand a provider of services to the international film industry. 2003 sawstrong growth in film production in the UK, and this Chapter looks attrends over the last decade, based on the production statistics collected by UK Film Council International. The figures are presented inaggregate, so as to respect the confidentiality of individual producersand production companies.
76Five Children and IT courtesy of Pathé
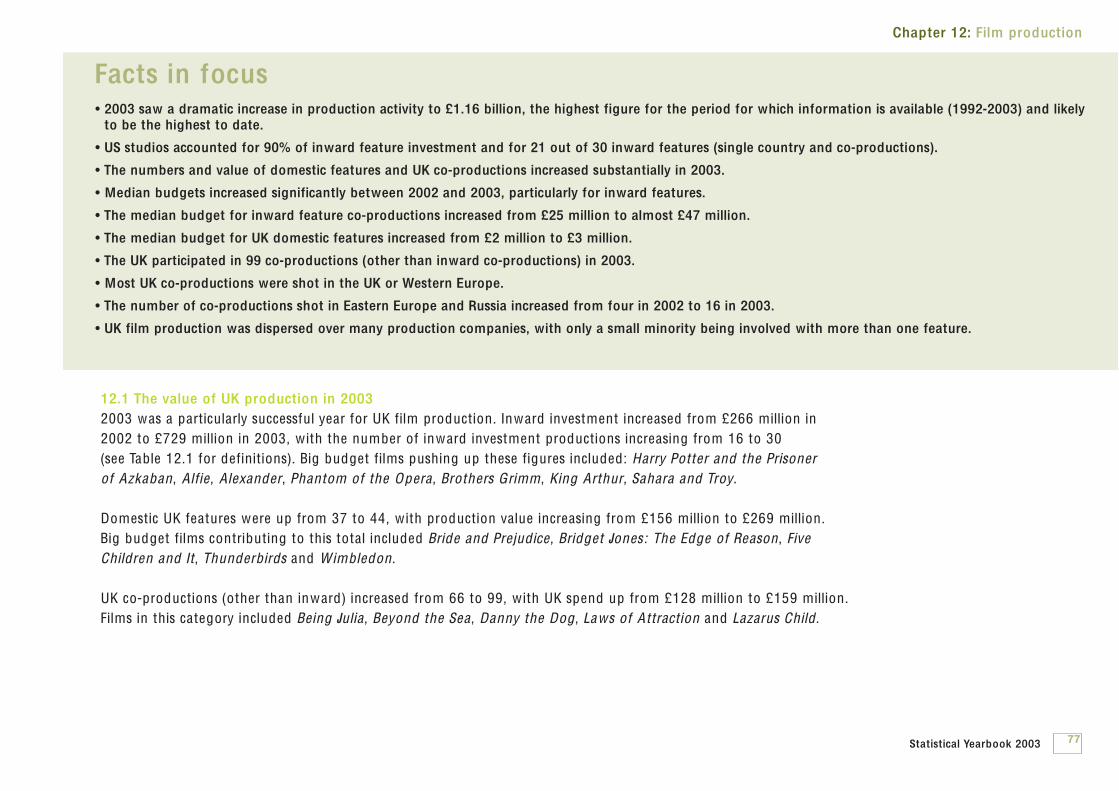
77
• 2003 saw a dramatic increase in production activity to £1.16 billion, the highest figure for the period for which information is available (1992-2003) and likelyto be the highest to date.
• US studios accounted for 90% of inward feature investment and for 21 out of 30 inward features (single country and co-productions).
• The numbers and value of domestic features and UK co-productions increased substantially in 2003.
• Median budgets increased significantly between 2002 and 2003, particularly for inward features.
• The median budget for inward feature co-productions increased from £25 million to almost £47 million.
• The median budget for UK domestic features increased from £2 million to £3 million.
• The UK participated in 99 co-productions (other than inward co-productions) in 2003.
• Most UK co-productions were shot in the UK or Western Europe.
• The number of co-productions shot in Eastern Europe and Russia increased from four in 2002 to 16 in 2003.
• UK film production was dispersed over many production companies, with only a small minority being involved with more than one feature.
Chapter 12: Film production
Facts in focus
12.1 The value of UK production in 20032003 was a particularly successful year for UK film production. Inward investment increased from £266 m illion in 2002 to £729 m illion in 2003, w ith the number of inward investment productions increasing from 16 to 30 (see Table 12.1 for definitions). Big budget films pushing up these figures included: Harry Potter and the Prisoner of Azkaban, A lfie, A lexander, Phantom of the Opera, Brothers Grimm, King Arthur, Sahara and Troy.
Domestic UK features were up from 37 to 44, w ith production value increasing from £156 m illion to £269 m illion. Big budget films contributing to this total included Bride and Prejudice, Bridget Jones: The Edge of Reason, FiveChildren and It, Thunderb irds and W imb ledon.
UK co-productions (other than inward) increased from 66 to 99, w ith UK spend up from £128 m illion to £159 m illion.Films in this category included Being Julia, Beyond the Sea, Danny the Dog, Laws of Attraction and Lazarus Child.
Statistical Yearbook 2003
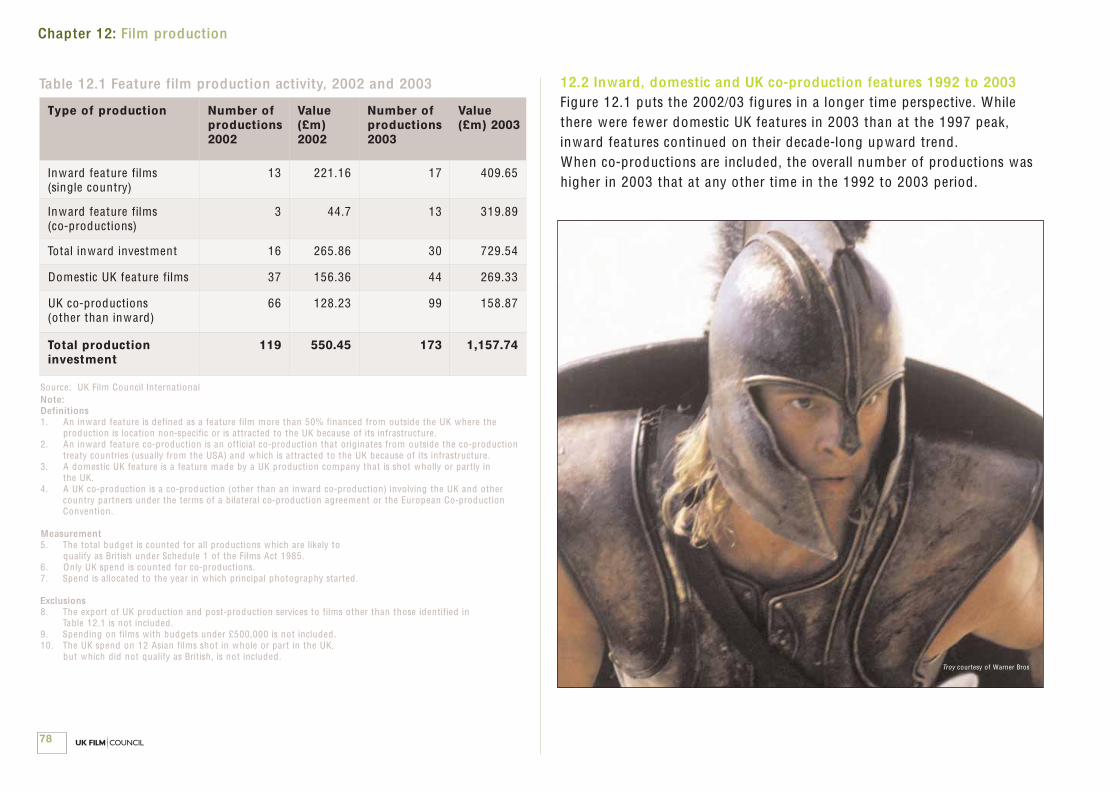
Chapter 12: Film production
78
Note:Definitions1. An inward feature is defined as a feature film more than 50% financed from outside the UK where the
production is location non-specific or is attracted to the UK because of its infrastructure.2. An inward feature co-production is an official co-production that originates from outside the co-production
treaty countries (usually from the USA) and which is attracted to the UK because of its infrastructure.3. A domestic UK feature is a feature made by a UK production company that is shot wholly or partly in
the UK.4. A UK co-production is a co-production (other than an inward co-production) involving the UK and other
country partners under the terms of a bilateral co-production agreement or the European Co-production Convention.
Measurement5. The total budget is counted for all productions which are likely to
qualify as British under Schedule 1 of the Films Act 1985.6. Only UK spend is counted for co-productions.7. Spend is allocated to the year in which principal photography started.
Exclusions8. The export of UK production and post-production services to films other than those identified in
Table 12.1 is not included.9. Spending on films w ith budgets under £500,000 is not included.10. The UK spend on 12 Asian films shot in whole or part in the UK,
but which did not qualify as British, is not included.
Type of production Number of productions2002
Value (£m)2002
Number of productions2003
Value (£m) 2003
Inward feature films (single country)
13 221.16 17 409.65
Inward feature films (co-productions)
3 44.7 13 319.89
Total inward investment 16 265.86 30 729.54
Domestic UK feature films 37 156.36 44 269.33
UK co-productions (other than inward)
66 128.23 99 158.87
Total production investment
119 550.45 173 1,157.74
Table 12.1 Feature film production activity, 2002 and 2003
Source: UK Film Council International
12.2 Inward, domestic and UK co-production features 1992 to 2003Figure 12.1 puts the 2002/03 figures in a longer time perspective. Whilethere were fewer domestic UK features in 2003 than at the 1997 peak,inward features continued on their decade-long upward trend. When co-productions are included, the overall number of productions washigher in 2003 that at any other time in the 1992 to 2003 period.
Troy courtesy of Warner Bros

Chapter 12: Film production
79
120
100
80
60
40
20
0
1994
1993
1992
1995
1996
1997
1998
1999
2000
2001
2002
2003
822
1525
33 34
73
84
67
70
52
51
3766
9944
13 14
25
20
16
22
28
23
16
30
YearSource: UK FIlm Council InternationalNote: 'Inward features' includes inward investment co-productions from 2002
Num
ber
of f
eatu
res
Figure 12.1 Number of inward, domestic and UK co-production features, 1992 - 2003
Domestic UK features
Inward features
UK co-pros
The growth in value of UK production in 2003 was even sharper than thegrowth in numbers, w ith the 2003 total being more than double that of2002 (Figure 12.2). Inward features accounted for the biggest part of theincrease. Production activity in 2003 was roughly 11 times the level of1992 (not allow ing for the effects of inflation).
1400
1200
1000
800
600
400
200
0
1994
1993
1992
1995
1996
1997
1998
1999
2000
2001
2002
2003
YearSource: UK FIlm Council InternationalNote: ‘Inward features’ includes inward investment co-productions from 2002.For co-productions (inward and UK) only the UK spend is included in the above chart (not the total budget).
Valu
e of
Pro
duct
ion
(£m
illio
n)
Figure 12.2 Value of inward, domestic,
UK co-production and total features, 1992 - 2003
Inward features
UK Co-pros
Domestic UK featuresTotal production value
98.4
8 158.
0812
7.74
30.3
4
58.5
39.9
8
182.
6559
.51
216.
4594 17
2.2
202.
89
174.
96
170.
31
211.
7
180.
12
156.
36
158.
87
128.
23
269.
33387.
1
261.
9
214.
2 366.
57
198.
5336.
37
265.
86
729.
54
242.
16 310.
45
559.
3
464.
79
389.
16 506.
68 578.
27
378.
62
550.
45
1157
.74
Statistical Yearbook 2003
Inward Domestic UK co-pros Total
1992 58.5 39.98 98.48
1993 127.74 30.34 158.081994 182.65 59.51 242.161995 216.45 94 310.451996 387.1 172.2 559.31997 261.9 202.89 464.791998 214.2 174.96 389.161999 336.37 170.31 506.682000 366.57 211.7 578.272001 198.5 180.12 378.622002 265.86 156.36 128.23 550.452003 729.54 269.33 158.87 1157.74

Chapter 12: Film production
80
Production category Median budget £m Average budget £m
2002 2003 2002 2003
Inward features (single country) 6.9 12.1 17.0 26.5
Inward features (co-productions) 25.0 46.6 32.3 51.6
Domestic UK productions 2.0 3.0 4.2 6.1
Co-productions (other than inward) 3.2 3.5 6.0 5.5
Table 12.2 Comparison of median and average budgets, 2002 and 2003
Source: UK Film Council International, RSU analysis.
12.3 Upward trends in budgetsTable 12.2 shows that budgets for inward and domestic films increasedsubstantially between 2002 and 2003. A lthough in each case the averagebudget is skewed upwards by the biggest budget productions, the upwardmovement of the median shows that budgets generally increased. Themedian budget for inward features (single country) increased from £6.9m illion to £12.1 m illion. For inward features (co-productions) the increasewas from £25 m illion to £46.6 m illion, while the domestic UK medianincreased from £2 m illion to £3 m illion.
Only co-productions (other than inward) showed a more moderate costincrease, w ith the median increasing from £3.2 m illion to £3.5 m illion,while the average budget actually fell, from £6 m illion to £5.5 m illion.
Budget band Number Total budget in band (£m) % of total budget
£30m + 4 263.2 58.5
£10 - £30m 9 160.0 35.6
Under £10m 4 26.8 5.9
Total 17 449.9 100.0
Table 12.3 Size distribution of budgets, inward features (single country), 2003
Source: UK Film Council International, RSU analysis.
Budget band Number Total budget in band (£m) % of total budget
£30m + 8 586.1 87.4
£10 - £30m 5 84.7 12.6
Under £10m 0 0 0.0
Total 13 670.8 100.0
Table 12.4 Size distribution of budgets, inward features (co-productions), 2003
Source: UK Film Council International, RSU analysis
12.4 Size distribution of budgets, 2003The size distribution of the budgets for the four categories of film is shown in Tables 12.3 to 12.6. Four features w ith budgets of over £30 millionaccounted for 58.5% of the aggregate budget for inward features (single country). Only four out of 17 features had budgets of less than £10million.
Inward features (co-productions) were even more concentrated in the£30m illion plus category, w ith eight out of 13 films falling in this category,accounting for 87.4% of the aggregate category budget.

81
Chapter 12: Film production
Notable in 2003 was the number of large budget UK films. Three out of the44 UK domestic features had budgets of more than £30 million, accountingfor 42.7% of aggregate UK domestic feature budgets.
The budgets of co-productions (other than inward) were more evenly distributed than the other categories and there were no very large budgetfilms in this category in 2003. Nevertheless, the 17 productions (out of 99)w ith budgets in the £10-£30 million range accounted for 46% of the aggregate category budget.
Budget band Number Total budget in band (£m)
% of total budget
£30m + 3 115.0 42.7
£10 - £30m 3 40.2 14.9
£5 - £10m 10 62.6 23.2
£2 - £5m 11 33.7 12.5
£0.5 - £2m 17 17.9 6.6
Total 44 269.3 100.0
Table 12.5 Size distribution of budgets, domestic UK features, 2003
Source: UK Film Council International, RSU analysis
Budget band Number Total budget in band (£m)
% of total budget
£30m + 0 0.0 0.0
£10 - £30m 17 250.3 46.0
£5 - £10m 17 123.6 22.7
£2 - £5m 43 138.5 25.4
£0.5 - £2m 22 32.4 5.9
Total 99 544.8 100.0
Table 12.6 Size distribution of budgets, UK co-productions (other than inward), 2003
Source: UK Film Council International, RSU analysis
12.5 Big budget productions in 2002 and 2003Table 12.7 shows the jump in big budget productions and their associated UKspend between 2002 and 2003. The number of films w ith budgets of morethan £30 million increased from five to 15, and the associated UK spend leaptfrom £197 million to £672 million.
Category Number of films with budgets of £30m +
Value of associated UK spend £m
2002 2003 2002 2003
Inward (single) 2 4 155.5 263.2
Inward (co-pro) 1 8 26.1 293.4
Domestic UK 0 3 0.0 115.0
Co-pro (other than inward) 2 0 15.0 0.0
Total 5 15 196.6 671.6
Table 12.7 Films with budgets of £30m + in 2002 and 2003
Source: UK Film Council International, RSU analysis
Statistical Yearbook 2003

Chapter 12: Film production
82
12.6 UK share of co-production expenditureTables 12.8 and 12.9 show the UK expenditure shares by budget band forinward co-productions and co-productions (other than inward) respectively.For inward co-productions (particularly big budget co-productions) the UKexpenditure share was relatively high, at around 48%.
For the remaining co-productions (the majority), the UK expenditure sharewas substantially lower, at 29.2%, as shown in Table 12.9. The £10-£30m illion budget band had the lowest UK expenditure share, at 25.8%.
Budget band(£m)
Number Total budget in band (£m)
UK spend in band (£m)
UK spend as % of bandtotal
£30m + 8 586.1 293.4 50.1
£10 - £30m 5 84.7 26.5 31.3
Under £10m 0 0 0 n/a
Total 13 670.8 319.9 47.7
Table 12.8 UK expenditure share by budget band, inward co-productions, 2003
Source: UK Film Council International, RSU analysis
Budget band (£m) Number Total budget inband (£m)
UK spend inband (£m)
UK spend as %of band total
£30m + 0 0 0 n/a
£10 - £30m 17 250.3 64.5 25.8
£5 - £10m 17 123.6 46.0 37.2
£2 - £5m 43 138.5 38.9 28.1
£0.5 - £2m 22 32.4 9.5 29.2
Total 99 544.8 158.9 29.2
Table 12.9 UK expenditure share by budget band, co-productions (other than inward), 2003
Source: UK Film Council International, RSU analysis
12.7 Partners in UK co-productions Table 12.10 shows that the UK partner was rarely the major funder in mostof the co-productions in which there was a UK interest in 2003. The mostfrequent principal partner was France (22 productions), followed by the UK(18), Canada (16) and Germany and Italy (7 each).

83
Chapter 12: Film production
Principal country participant Number of UK co-productions
France 22
UK 18
Canada 16
Germany 7
Italy 7
Eire 6
Netherlands 5
Denmark 4
New Zealand 3
Australia 2
Czech Republic 2
South Africa 2
Other 5
Total 99
Table 12.10 UK co-productions, principal country participants, 2003
Source: UK Film Council InternationalNote: “Principal country participant” means the country contributing the largest portion of thefilm budget, often (but not always) the majority.
12.8 UK co-productions by country of shootTable 12.11 shows the shoot locations for UK co-productions (not including inward investment) in 2003. The most frequent locationswere in the UK (20 productions), France (12), Canada (7), Germany andRomania (6 each). Some films were shot in more than one country and aretherefore counted more than once.
Country Number of productions
Information awaited 33
UK 20
France 12
Canada 7
Germany 6
Romania 6
South Africa 5
Bulgaria 3
Denmark 3
Eire 3
Sweden 3
Netherlands 3
Italy 3
New Zealand 3
Others 21
Table 12.11 UK co-productions, country of shoot, 2003
Source: UK Film Council InternationalNote: Some productions shoot in more than one country, hence the total in Table 12.11 isgreater than the number of UK co-productions.
Statistical Yearbook 2003

Chapter 12: Film production
84
Region Shot abroad in 2002 Shot abroad in 2003
Information awaited n/a 33
Western Europe 30 42
North America 15 8
South and Central America, Caribbean 4 0
Eastern Europe and Russia 4 16
Australasia 3 4
Asia 1 3
Southern Africa 0 5
Table 12.12 Location of shoot by region, UK co-productions shot abroad in 2002 and 2003
Source: UK Film Council International, RSU analysisNote: Of the 33 for which information was awaited , some may have been shot in the UK.
12.9 Production company activity levelsUK film production in 2003 was dispersed over a large number of production companies, as shown in Table 12.13. The UK Film CouncilInternational database recorded 181 production companies associated w ith films shot in the UK or co-productions involving the UK in 2003. Ofthese, 166 companies were associated w ith a single feature. A considerablenumber of these are likely to have been single-purpose vehicles. The mostprolific production company was associated w ith ten features, followed byone company w ith seven features, one w ith five and one w ith four.
Number of features Number of companies
10 1
7 1
5 1
4 1
3 each 4
2 each 7
1 each 166
Table 12.13 Film production company activity in 2003
Source: UK Film Council International, RSU analysis.Notes: Includes all types of films involving the UK.Some films have several production companies associated w ith them , so the sum of the features in the above table is greater than the total number of features involving the UK in 2003.
12.10 US Studios’ involvement in inward featuresAs usual, US studios were the dom inant force in inward film investmentinto the UK in 2003. These accounted for 21 out of 30 inward features(single country and co-productions) and for £659m out of £730m in UKspend associated w ith these features (90.3%) (Table 12.14).
Table 12.12 shows the shoot locations by region for UK co-productionsshot abroad in 2002 and 2003. Western Europe (not including the UK) wasonce again the most frequent destination; however there was a surge inshoots in Eastern Europe and Russia. A year ago the attractiveness ofEastern Europe was much discussed but had not yet shown up in the data.This year the trend was evident. The most frequent countries in this groupwere Romania, Bulgaria, the Czech Republic and Russia. The number ofproductions shot in South Africa in 2003 (five) was also notable.

85
Chapter 12: Film production
Studio Number of inward features in 2003
Disney 4
Warner Bros 6
Dreamworks 1
Fox 3
MGM 3
Paramount 3
Sony 1
Total 21
Table 12.14 US studio’s involvement in inward features (single country and co-productions), 2003
Source: UK Film Council International, RSU analysis.Note: Universal Pictures had a significant involvement in UK production through its UK partner Working TitleFilms which produced three features in 2003 defined for the purpose of these statistics as domestic UK films.
See also• Information about film companies is given in chapter 14.• For details about employment in the film production sector see
chapter 15. • For more information about UK post-production see
chapter 13. • For a summary of UK Film Council production funds' activity in
2003 see http://www.ukfilmcouncil.org.uk/funding/
Statistical Yearbook 2003
Cold Mountain courtesy of BVI

13 Post-production 8713.1 What is post-production? 8813.2 Post-production company activity 8913.3 Employment in post-production 8913.4 Location of post-production activity 90
Post-production
86Statistical Yearbook 2003

Chapter 13Post-production
Post-production activities now make up a significant sector w ith an annual turnover of well over £1 billion. One-quarter of the total spend on film production in the UK is now spent w ith post-production companies. About one-third of post-productionactivity burgeoning industry is film-related and some of the work itattracts comes from US and other international film companies.
87Troy courtesy of Warner Bros

88
• 908 companies are estimated to have carried out post-production activities in the UK in 2002/03.
• Just under a third of this activity (29%) was film-related.
• Post-production work accounted for over one-quarter of all production budget spend in the UK, up from 13% in 2001.
• The UK post-production sector had a combined annual turnover of £1.39 billion in 2002.
• Over 15,000 people were employed in post-production in the UK in 2002/03.
• 79 post-production companies had over 100 employees, 500 had fewer than 10.
• 91% of all post-production activity by spend was clustered in and around London.
Chapter 13: Post production
Facts in focus
13.1 What is post-production?For the purposes of this chapter post-production is defined as involving "an activity or action on the visual image or audio that takes place away from the shoot or the studio. The activity is connected to the production of the physicalimage and audio itself rather than the business of distribution, etc. PR and advertising, for example, are excluded whilstrights clearances are included" (Salix Management Consultants).
Most data reported in this chapter are derived from a project undertaken by Salix Management Consultants on behalf of the Department for Trade and Industry and the UK Film Council. Fieldwork was conducted in two phases: a survey offilm post-production companies between October and December 2002 and a study of the TV and commercials sectorbetween January and March 2003. The Salix report, available on the UK Film Council website, provides the first-ever picture of the full range of post-production activity in the UK.
The research covers the UK post-production sector as a whole. As only a small number of major films requiring high-end post-production come to the UK each year, film post-production is closely linked w ith activity in the TV and commercials sectors in the UK.
The team sought to distinguish post-production activity from other elements of the production process, which is not a straightforward task. Technological innovation has eroded previous distinctions between production and post-production work, w ith some of the latter activity taking place either before production or during the shooting period (for example, digital visual and audio effects that allow film sets and characters to be generated ‘virtually’ on screen).
Statistical Yearbook 2003

The importance of post-production to the film sector is underlined by thefact that around one-quarter of the total spend on film production in theUK was spent w ith post-production companies. This marks an increasefrom around 13% in 2001. It is estimated the UK post-production sectorhad a combined annual turnover of £1.39 billion in 2002, compared w ith£1.31 billion in 2000, which shows modest growth when, in 2001, film production levels experienced a decline. Salix reports that 70.2% ofpost-production turnover comes from UK-based contracts, w ith 23.1%deriving from contracts w ith companies based in the USA (Table 13.2).
13.3 Employment in post-productionThe sector the sector employed 15,043 people in 2002/03, of whom31% were identified as freelance, as Table 13.1 shows. 79 companies hadover 100 employees, while over 500 companies had fewer than 10 peopleworking for them .
UK (70.2%)
US (excl. West Coast) (7.3%)
Continental Europe (5.6%)
Asia & Australasia (0.9%)
Rest of the world (0.3%)
US, West Coast (15.8%)
Chapter 13: Post production
89
13.2 Post-production company activity908 post-production companies were active in 2002 and 2003. This includes all medium and large companies, but not necessarily the very smallest operations. 90% of the companies identified were privatelyowned, and 79% were run independently of other companies.
Just under one-third of post-production activity by turnover in 2001 was film-related (see Figure 13.1), although the demand for for film post-production is highly variable from year to year.
Figure 13.1 Post-production activity by sectors, 2001
Source: DCMS Creative Industries mapping document 2001
Figure 13.2 Sources of work
Source: Salix Management Consultants
Commercials (36.4 %)
Feature film (29.3%)
Broadcast TV (18.9%)
Titles and channel identities (4.1%)
Music video (2.5%)
Corporate (2.5%)
Radio (0.2%)
Video games (0.2%)
Other (5.9%)
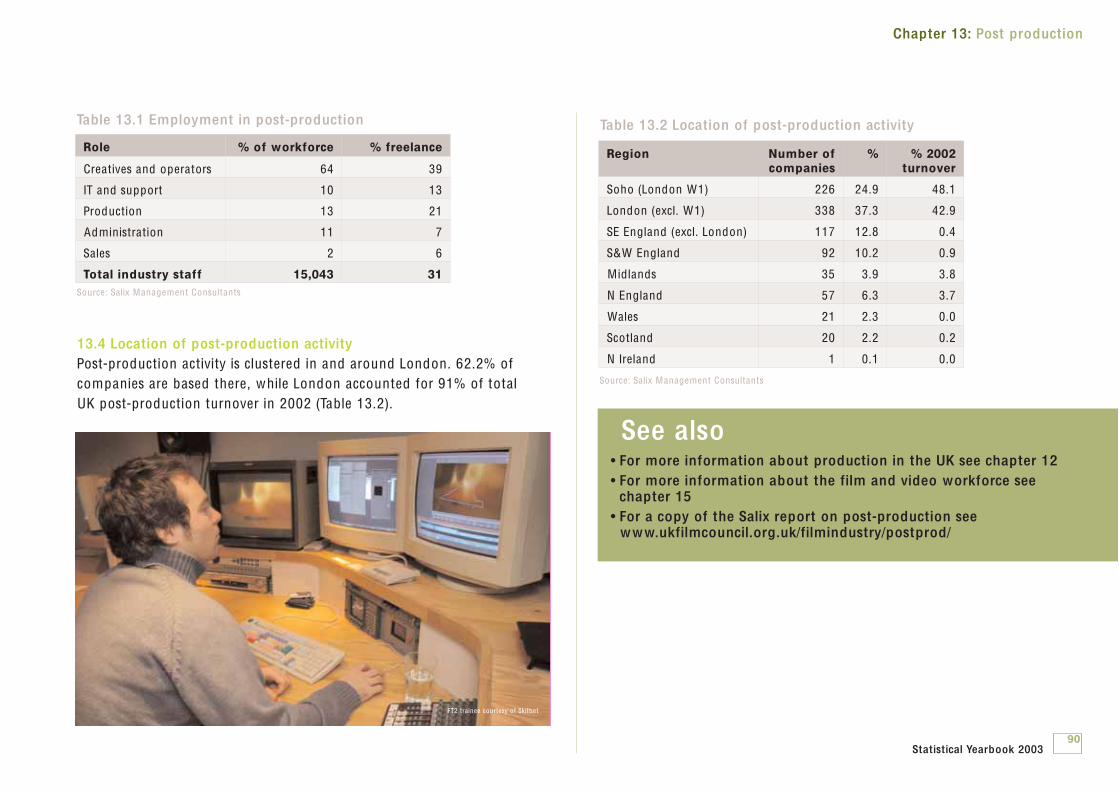
13.4 Location of post-production activityPost-production activity is clustered in and around London. 62.2% of companies are based there, while London accounted for 91% of total UK post-production turnover in 2002 (Table 13.2).
Chapter 13: Post production
90
Role % of workforce % freelance
Creatives and operators 64 39
IT and support 10 13
Production 13 21
Adm inistration 11 7
Sales 2 6
Total industry staff 15,043 31
Table 13.1 Employment in post-production
Source: Salix Management Consultants
Region Number ofcompanies
% % 2002 turnover
Soho (London W1) 226 24.9 48.1
London (excl. W1) 338 37.3 42.9
SE England (excl. London) 117 12.8 0.4
S&W England 92 10.2 0.9
M idlands 35 3.9 3.8
N England 57 6.3 3.7
Wales 21 2.3 0.0
Scotland 20 2.2 0.2
N Ireland 1 0.1 0.0
Table 13.2 Location of post-production activity
Source: Salix Management Consultants
See also• For more information about production in the UK see chapter 12• For more information about the film and video workforce see
chapter 15• For a copy of the Salix report on post-production see
www.ukfilmcouncil.org.uk/filmindustry/postprod/
Statistical Yearbook 2003
FT2 trainee courtesy of Skillset
14 Film industry companies 9214.1 Number of companies in the film and video industries 93 14.2 Changing size distribution of film production companies 94 14.3 Leading film companies in the UK and Europe 9414.4 Leading film production companies in the UK and Europe 96
Film industry companies
91Statistical Yearbook 2003

Chapter 14Film industry companiesFilm production companies and other film sectors are thriving in theUK. Many of these companies are recent start-ups and small in sizebut there has also been expansion in the bigger companies. Most ofthe leading film companies in Europe are of US, French or UK origin.
Calendar G irls courtesy of BVI
92
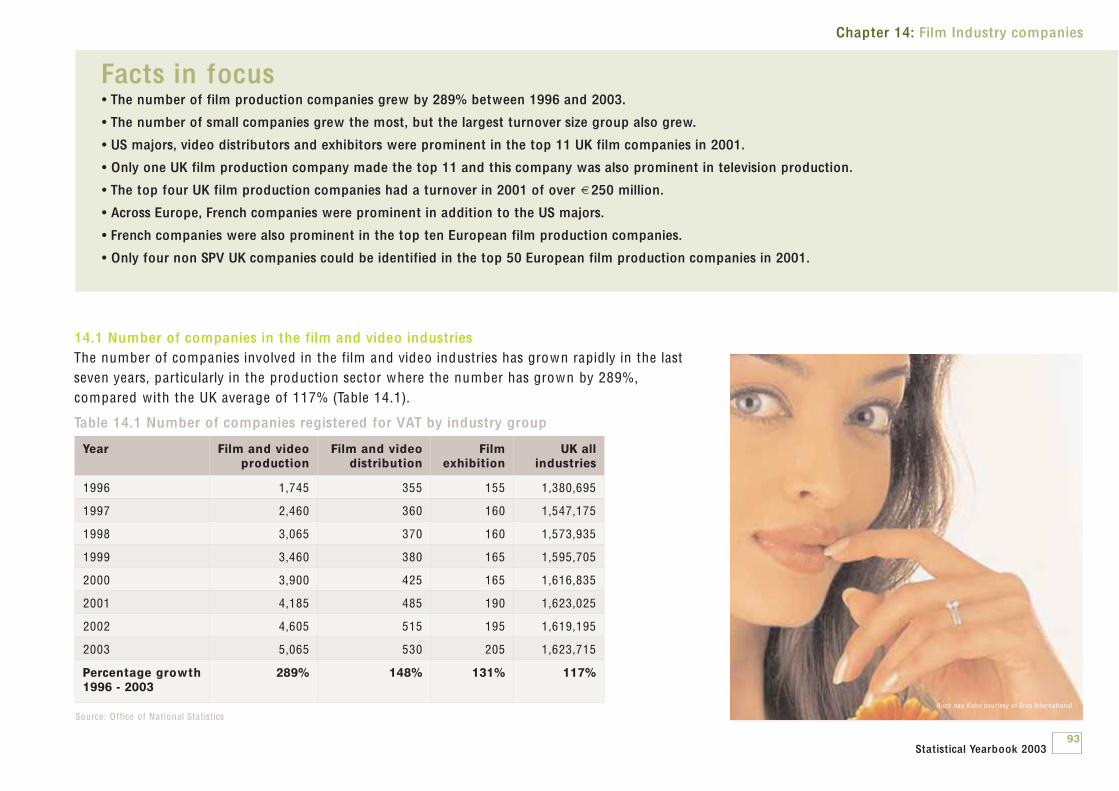
• The number of film production companies grew by 289% between 1996 and 2003.
• The number of small companies grew the most, but the largest turnover size group also grew.
• US majors, video distributors and exhibitors were prominent in the top 11 UK film companies in 2001.
• Only one UK film production company made the top 11 and this company was also prominent in television production.
• The top four UK film production companies had a turnover in 2001 of over 250 million.
• Across Europe, French companies were prominent in addition to the US majors.
• French companies were also prominent in the top ten European film production companies.
• Only four non SPV UK companies could be identified in the top 50 European film production companies in 2001.
Chapter 14: Film Industry companies
Facts in focus
14.1 Number of companies in the film and video industriesThe number of companies involved in the film and video industries has grown rapidly in the last seven years, particularly in the production sector where the number has grown by 289%, compared w ith the UK average of 117% (Table 14.1).
Year Film and videoproduction
Film and videodistribution
Film exhibition
UK all industries
1996 1,745 355 155 1,380,695
1997 2,460 360 160 1,547,175
1998 3,065 370 160 1,573,935
1999 3,460 380 165 1,595,705
2000 3,900 425 165 1,616,835
2001 4,185 485 190 1,623,025
2002 4,605 515 195 1,619,195
2003 5,065 530 205 1,623,715
Percentage growth1996 - 2003
289% 148% 131% 117%
Table 14.1 Number of companies registered for VAT by industry group
Source: Office of National Statistics
93Statistical Yearbook 2003
Kuch naa Kaho courtesy of Eros International

Chapter 14: Film Industry companies
94
14.2 Changing size distribution of film production companiesThe growth in the number of film and video production companies hasbeen particularly concentrated in the smaller turnover size bands, theopposite of the UK all-industries trend. The proportion of film and videoproduction companies in the £1,000-£99,000 turnover band increasedfrom 41% to 56% of the total (Figure 14.1), compared w ith a reductionfrom 53% to 46% for the same turnover band for UK all industries (Figure 14.2). Interestingly, there was also a significant increase in thenumber and proportion of large film and video production companies(turnover £5 m illion plus).
Source: Office of National Statistics, RSU analysis
Figure 14.1 The changing size distribution of VAT-registered film and video production companies, 1996 to 2003
Turnover band (£000)
Perc
enta
ge o
f to
tal c
ompa
nies
60.0
50.0
40.0
30.0
20.0
10.0
0.0
1 -
99
100
- 99
9
1000
- 4
999
5000
+
1996
2003
40.7
55.7
45.3
31.5
11.5
8.7
2.6 4.
0
Source: Office of National Statistics, RSU analysis
Figure 14.2 The changing size distribution of UK VAT-registered companies (all industries), 1996 to 2003
Turnover band (£000)
Perc
enta
ge o
f to
tal c
ompa
nies
60.0
50.0
40.0
30.0
20.0
10.0
0.0
1 -
99
100
- 99
9
1000
- 4
999
5000
+
1996
2003
52.8
45.5
40.3
45.0
2.45.
3
1.7
7.2
14.3 Leading film companies in the UK and EuropeTable 14.2 shows the top 11 film companies in the UK in 2001 as identifiedby the European Audiovisual Observatory. Several interesting features stand out: the prom inence of the US majors, the importance of undertaking multiple activities (production, distribution, television, rights,video), the relatively high position of two companies specialising in video,the presence of two exhibitors in the list (Odeon and Cine-UK) and the significance of production activities spanning television and film (Tiger Aspect Holdings).

Chapter 14: Film Industry companies
95
Rank Company Activities Operating revenues
(000)
1 Walt Disney International DISFILM , DISTV, RIGHTS, VID 1,236,098
2 Time Warner Entertainment DISFILM , DISTV, VID 690,539
3 Odeon EXH 317,071
4 Columbia Pictures Video VID 257,691
5 Universal Pictures Productions RIGHTS, DISFILM , PRODFILM 214,090
6 20th Century Fox Home Entertainment
VID 191,371
7 The Entertainment Group of Companies
DISFILM , VID 148,123
8 Cine-UK EXH 121,570
9 Columbia Pictures Corporation PRODFILM , DISFILM , VID 111,490
10 20th Century Fox Film Company DISFILM 96,641
11 Tiger Aspect Holdings PRODFILM , PRODTV 62,771
Table 14.2 Top 11 film companies in the UK, 2001
Source: European Audiovisual Observatory, 2003 YearbookDefinitions: DISFILM = film distribution; DISTV = television distribution, RIGHTS = trade in television rights; VID = video; EXH = exhibition; PRODFILM = film production; PRODTV = television production
Across Europe, the US majors were prom inent, but were joined by threeFrench companies, Pathé, UGC and Europalaces, indicating the continuedcorporate strength of the French film industry. Three exhibitors appeared.Odeon was the only non-US British company in the top ten.
Statistical Yearbook 2003
Rank Company Activities Country Operating revenues
(000)
1 Walt Disney International DISFILM , DISTV, RIGHTS, VID
UK 1,236,098
2 United International Pictures BV
DISFILM NL 871,364
3 Group Pathé EXH, DISFILM , VID, RIGHTS, TV, PRODFILM
FR 570,000
4 Time Warner Entertainment
DISFILM , DISTV, VID UK 690,539
5 UGC EXH, DISFILM , VID, RIGHTS, PRODFILM
FR 537,253
6 Paramount Home Entertainment Intl BV
VID NL 457,908
7 United Cinemas Intl Multiplex BV
EXH NL 488,067
8 Europalaces EXH FR 351,000
9 Embassy Eagle Holdings PRODFILM , DISFILM NL 320,507
10 Odeon EXH UK 317,071
Table 14.3 Top ten film companies in Europe, 2001
Source: European Audiovisual Observatory, 2003 YearbookDefinitions: DISFILM = film distribution; DISTV = television distribution, RIGHTS = trade in television rights;VID = video; EXH = exhibition; PRODFILM = film production; PRODTV = television production, TV = television

Chapter 14: Film Industry companies
96
While partly an artefact of the use of single-purpose vehicles, the shortnessof the above list underlines the corporately-dispersed nature of the UK filmproduction industry.
14.4 Leading film production companies in the UK and EuropeLooking at film production only, we see that six out of the top tenEuropean production companies in 2001 were French. Only two UK companies made the top ten: Intermedia Film Equities and Tiger Aspect Productions.
For the UK, the picture is blurred by the frequent use of single-purposevehicles (SPV). Only four non single purpose vehicle UK film companiesappear in the European Audiovisual Observatory’s list of the top 50European film production companies in 2001.
Rank Company Nationality Operating revenues (000)
1 Studiocanal France FR 272,000
2 Intermedia Film Equities UK 144,232
3 Europa Corp FR 140,415
4 Les Films A lain Sarde FR 82,923
5 AB Svensk Film industri SWED 63,584
6 Pathé Renn Production FR 70,210
7 Gaumont FR 85,600
8 Filmauro IT 60,199
9 UGC Images FR 58,574
10 Tiger Aspect Productions UK 55,032
Table 14.4 Top ten film production companies in Europe, 2001
Source: European Audiovisual Observatory, 2003 Yearbook
Rank Company Operating revenues (000)
1 Intermedia Film Equities 144,232
2 Tiger Aspect Productions 75,935
3 Aardman Holdings 20,892
4 Working Title Films 17,777
Table 14.5 Top four UK film production companies, 2001 not including SPVs
Source: European Audiovisual Observatory, 2003 Yearbook.Notes: (1) Due to its recent growth, Working Title Films is likely to have moved further up the list since 2001.(2) EON Productions Ltd (makers of the Bond movies) is a candidate for this list, but EAO did not have sufficient information to rank it.
See also• For film production company activity levels in 2003 see
chapter 12• For US studio involvement in UK film production in 2003 see
chapter 12• For leading film distributors in the UK in 2003 see chapter 5• For leading film exhibitors in the UK in 2003 see chapter 6• For numbers and size distribution of film workplaces in 2002 see
chapter 15
15 Employment in the film and video industries 9815.1 The workforce 9915.2 Results of the Skillset film workforce survey 10115.3 The workplace location 10315.4 The scale of the workplace 104
Employment in the filmand video industries
97Statistical Yearbook 2003

Chapter 15Employment in the filmand video industriesLater in 2004 Skillset w ill publish the results of a new survey, givingus the first full picture of how many people work in the UK film production industry, who they are and what they do. Up until nowpublished data have looked at film and video industries together.Some provisional data from the new survey are included in this chapter which throws a spotlight on the growth of employment and the w ide range of skills deployed in these creative industries.
98
Intermission courtesy of BVI.© Disney
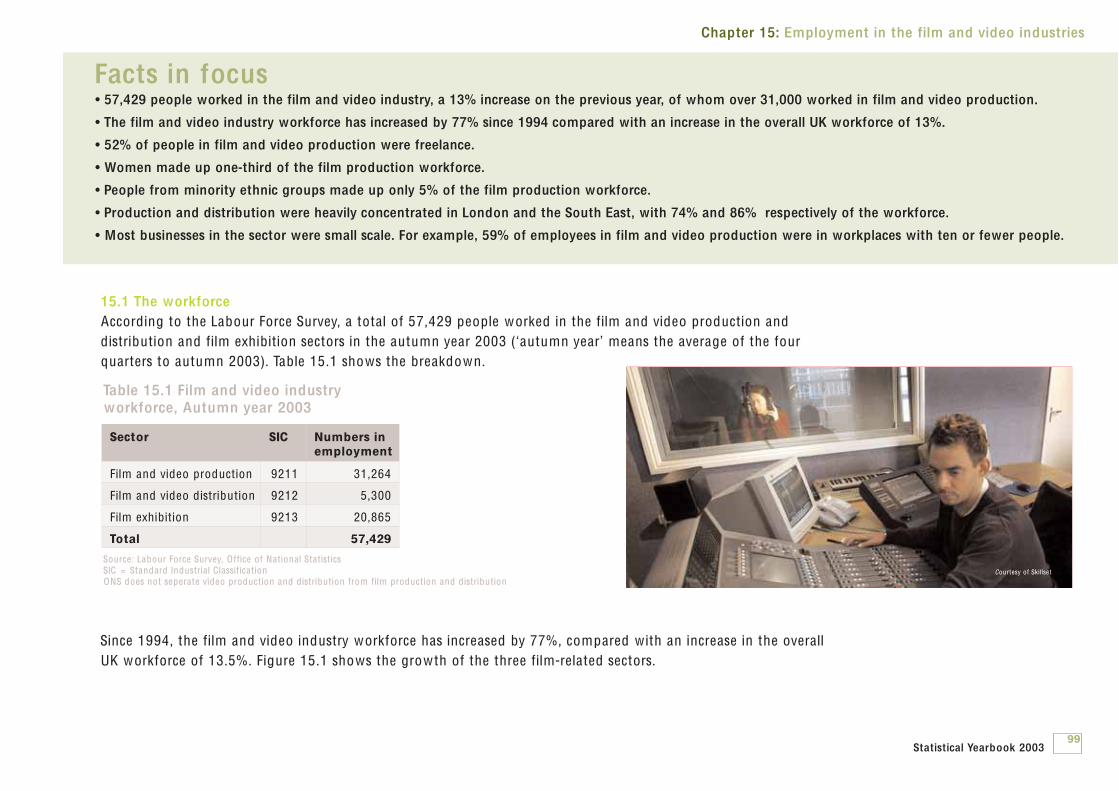
99
• 57,429 people worked in the film and video industry, a 13% increase on the previous year, of whom over 31,000 worked in film and video production.
• The film and video industry workforce has increased by 77% since 1994 compared with an increase in the overall UK workforce of 13%.
• 52% of people in film and video production were freelance.
• Women made up one-third of the film production workforce.
• People from minority ethnic groups made up only 5% of the film production workforce.
• Production and distribution were heavily concentrated in London and the South East, with 74% and 86% respectively of the workforce.
• Most businesses in the sector were small scale. For example, 59% of employees in film and video production were in workplaces with ten or fewer people.
Chapter 15: Employment in the film and video industries
Facts in focus
15.1 The workforceAccording to the Labour Force Survey, a total of 57,429 people worked in the film and video production and distribution and film exhibition sectors in the autumn year 2003 (‘autumn year’ means the average of the four quarters to autumn 2003). Table 15.1 shows the breakdown.
Since 1994, the film and video industry workforce has increased by 77%, compared w ith an increase in the overall UK workforce of 13.5%. Figure 15.1 shows the growth of the three film-related sectors.
Sector SIC Numbers in employment
Film and video production 9211 31,264
Film and video distribution 9212 5,300
Film exhibition 9213 20,865
Total 57,429
Table 15.1 Film and video industry workforce, Autumn year 2003
Source: Labour Force Survey, Office of National StatisticsSIC = Standard Industrial ClassificationONS does not seperate video production and distribution from film production and distribution
Statistical Yearbook 2003
Courtesy of Skillset
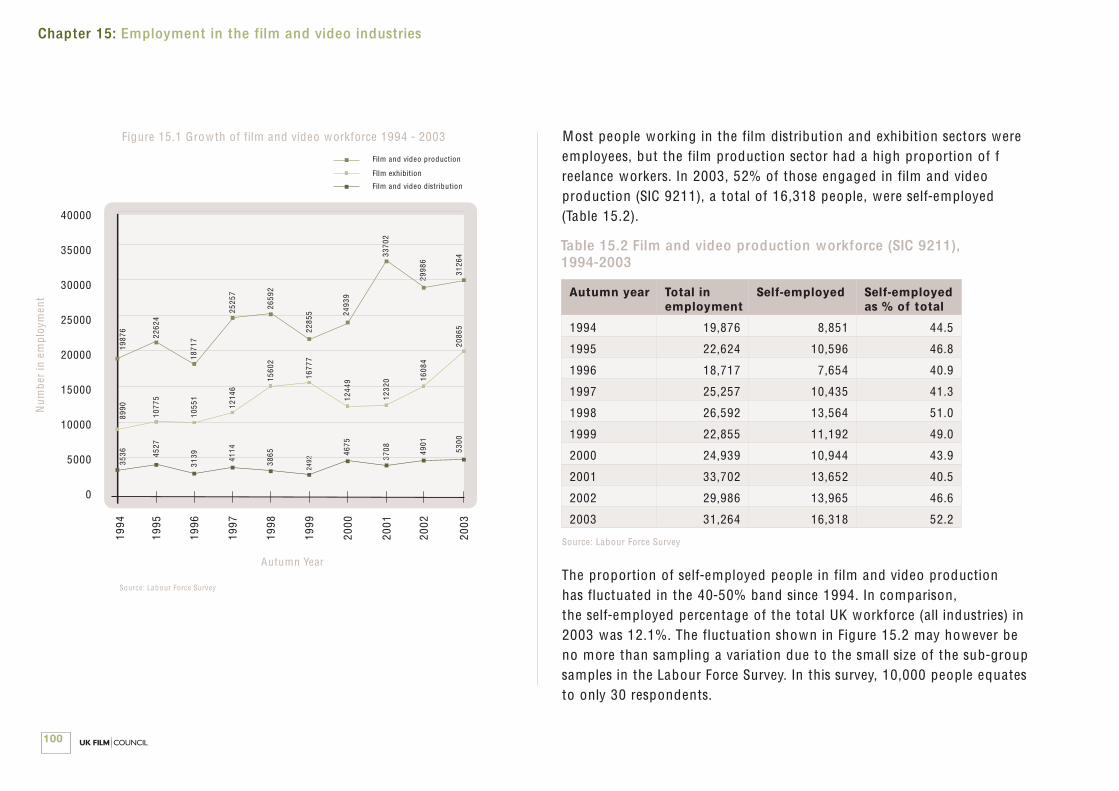
Chapter 15: Employment in the film and video industries
100
40000
35000
30000
25000
20000
15000
10000
5000
0
1994
1995
1996
1997
1998
1999
2000
2001
2002
2003
1987
689
9035
36 4527
1077
5
3139
1055
1
4114
1214
6
3865
1560
2
2492
1677
7
4675
1244
9
3708
1232
0
4901
1608
4
5300
2086
5
2262
4
1871
7
2525
7
2659
2
2285
5 2493
9
3370
2
2998
6
3126
4
Film and video production
Film and video distribution
FIlm exhibition
Autumn Year
Source: Labour Force Survey
Num
ber
in e
mpl
oym
ent
Figure 15.1 Growth of film and video workforce 1994 - 2003 Most people working in the film distribution and exhibition sectors wereemployees, but the film production sector had a high proportion of freelance workers. In 2003, 52% of those engaged in film and video production (SIC 9211), a total of 16,318 people, were self-employed (Table 15.2).
The proportion of self-employed people in film and video production has fluctuated in the 40-50% band since 1994. In comparison, the self-employed percentage of the total UK workforce (all industries) in2003 was 12.1%. The fluctuation shown in Figure 15.2 may however be no more than sampling a variation due to the small size of the sub-groupsamples in the Labour Force Survey. In this survey, 10,000 people equatesto only 30 respondents.
Autumn year Total in employment
Self-employed Self-employedas % of total
1994 19,876 8,851 44.5
1995 22,624 10,596 46.8
1996 18,717 7,654 40.9
1997 25,257 10,435 41.3
1998 26,592 13,564 51.0
1999 22,855 11,192 49.0
2000 24,939 10,944 43.9
2001 33,702 13,652 40.5
2002 29,986 13,965 46.6
2003 31,264 16,318 52.2
Table 15.2 Film and video production workforce (SIC 9211), 1994-2003
Source: Labour Force Survey
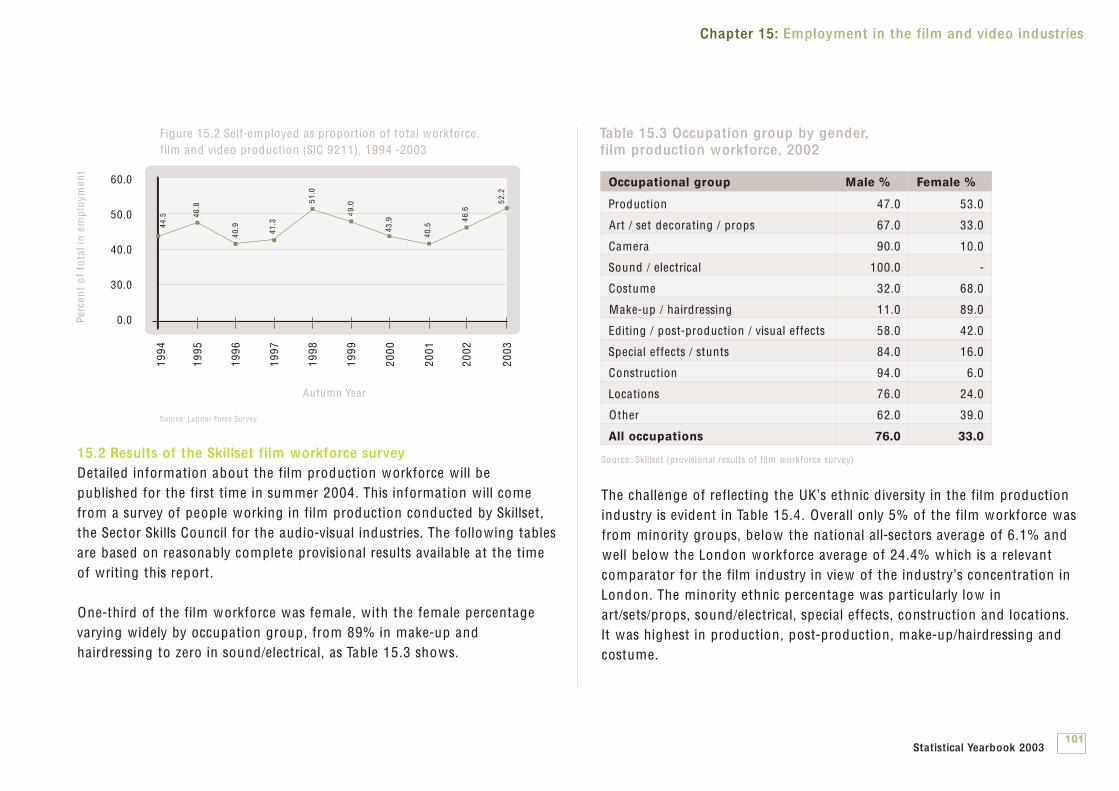
Chapter 15: Employment in the film and video industries
101
60.0
50.0
40.0
30.0
0.0
1994
1995
1996
1997
1998
1999
2000
2001
2002
2003
44.5 46
.8
40.9
41.3
51.0
49.0
43.9
40.5
46.6
52.2
Autumn Year
Source: Labour Force Survey
Perc
ent
of t
otal
in e
mpl
oym
ent
Figure 15.2 Self-employed as proportion of total workforce, film and video production (SIC 9211), 1994 -2003
15.2 Results of the Skillset film workforce surveyDetailed information about the film production workforce w ill be published for the first time in summer 2004. This information w ill comefrom a survey of people working in film production conducted by Skillset,the Sector Skills Council for the audio-visual industries. The follow ing tablesare based on reasonably complete provisional results available at the timeof writing this report.
One-third of the film workforce was female, w ith the female percentagevarying w idely by occupation group, from 89% in make-up and hairdressing to zero in sound/electrical, as Table 15.3 shows.
Occupational group Male % Female %
Production 47.0 53.0
Art / set decorating / props 67.0 33.0
Camera 90.0 10.0
Sound / electrical 100.0 -
Costume 32.0 68.0
Make-up / hairdressing 11.0 89.0
Editing / post-production / visual effects 58.0 42.0
Special effects / stunts 84.0 16.0
Construction 94.0 6.0
Locations 76.0 24.0
Other 62.0 39.0
All occupations 76.0 33.0
Table 15.3 Occupation group by gender, film production workforce, 2002
Source: Skillset (provisional results of film workforce survey)
The challenge of reflecting the UK’s ethnic diversity in the film productionindustry is evident in Table 15.4. Overall only 5% of the film workforce wasfrom m inority groups, below the national all-sectors average of 6.1% andwell below the London workforce average of 24.4% which is a relevantcomparator for the film industry in view of the industry’s concentration inLondon. The m inority ethnic percentage was particularly low inart/sets/props, sound/electrical, special effects, construction and locations.It was highest in production, post-production, make-up/hairdressing andcostume.
Statistical Yearbook 2003

The film production workforce was predom inantly young, w ith 67%aged 44 or under as Table 15.6 shows.
In parallel w ith the youth of the workforce, 53% had begun working in the industry since 1990 while only 21% had entered the industrybefore 1980 (Table 15.7).
35-44 (34.0%)25-34 (30.0%)
65 and over (1.0%)
16-24 (3.0%)
55-64 (11.0% ) 45-54 (22.0%)
Chapter 15: Employment in the film and video industries
102
Occupational group White Mixed Asian orAsian British
Black orBlack British
Chinese Other
Production 92.4 4.2 0.7 0.7 - 2.1
Art / set decorating / props 97.3 0.9 - - 0.9 0.9
Camera 93.3 3.4 1.1 1.1 - -
Sound / electrical 96.2 1.9 - 1.9 - -
Costume 91.9 5.4 - 2.7 - -
Make-up / hairdressing 91.7 5.6 - 2.8 - -
Editing / post-production /visual effects
93.8 6.3 - - - -
Special effects / stunts 97.7 2.3 - - - -
Construction 100.0 - - - - -
Locations 97.1 - 2.9 - - -
Other 94.3 - 2.9 1.0 - 1.9
All occupations 95.0 2.4 0.8 0.8 0.1 0.9
Table 15.4 Occupation by ethnicity, film production workforce, 2002
Source: Skillset (provisional results of film workforce survey)
The disabled proportion of the film production workforce was low at 2%,as shown in Table 15.5.
Figure 15.5 Disability, film production workforce, 2002
Source: Skillset (provisional results of film workforce survey)
Figure 15.6 Age distribution of film production workforce, 2002
Source: Skillset (provisional results of film workforce survey)
Figure 15.7 Year started working in film production industry, 2002
Source: Skillset (provisional results of film workforce survey)
NO (98.0%)
YES (2.0%)
1960 - 1969 (6.0%)
1970-1979 (13.0% )
1980-1989 (26.0% )
1990-1999 (39.0% )
2000 - 2003 (14.0%)
Before 1960 (2.0%)

Married or living as a couple (62%)
Single and never married (31.1%)
Divorced or seperated (6.3%)
W idowed (0.5%)
£30,000-£39,999 (18% )
£40,000-£49,999 (14% )
£50,000-£74,999 (13% )
£75,000 or more (11%)
No income fromaudio-visual in past year (5% )
£0-£9,999 (8% )
£10,000-£19,999 (14%)
£20,000-£29,999 ( 17% )
103
Chapter 15: Employment in the film and video industries
38% of the workforce were unattached, perhaps reflecting the itinerantnature of much film production work.
Sixty-five percent of the workforce had no dependent children up to 15 years of age:
Figure 15.8 Marital status of film production workforce, 2002
Source: Skillset (provisional results of film workforce survey)
Figure 15.9 Number of dependent children, film production workforce 2002
Source: Skillset (provisional results of film workforce survey) Includes children living apart from respondent
Despite its relative youth, the film production workforce was relatively wellpaid, w ith 56% earning £30,000 a year and over, in 2002; 24% earned£50,000 or more (Table 15.10). This is likely to reflect both the skills of theworkforce and the ability of many companies and individuals to obtainadditional work in other audio-visual industries (for example, television),smoothing out the ups and downs of film work.
Figure 15.10 Income distribution of film production workforce, 2002
Source: Skillset (provisional results of film workforce survey)Includes all income earned in the audio-visual industries
15.3 The workplace locationThe film production and distribution sectors are concentrated in Londonand the South East, as shown in Table 15.11. In contrast, the London andSouth East share of the exhibition sector workforce is closer to the UK average.
Sector SIC Total UKemployment
London & SEemployment
London & SE as% of UK total
UK all industries A ll 28,783,294 7,773,944 27.0
Film and video production 9211 31,264 22,979 73.5
Film and video distribution 9212 5,300 4,537 85.6
Film exhibition 9213 20,865 8,044 38.6
Table 15.11 London and South East employment as percentage of total, autumn year 2003
Source: Labour Force Survey. The South East region wraps around London to include the major studios to the west of London.
Statistical Yearbook 2003
None (65.3%)
More than two (6.5%)
One (12.6%)
Two (15.6%)

Chapter 15: Employment in the film and video industries
104
The peak in the London and South East share of the film and video production workforce coincided w ith the peak in production of inward features and domestic UK films between 1996 and 2000. This suggeststhat much of the additional work at that time was drawn to London andthe South East (and also that the 2001 fall-off particularly affected Londonand the South East). This pattern appears to have continued in 2003, w iththe exceptionally high level of production in 2003 coinciding w ith anincrease in the London and South East share of the workforce.
15.4 The scale of the workplaceEach year, ONS conducts a survey of businesses, called the Annual BusinessInquiry (ABI), which provides information on the number of employees ineach workplace, by industrial sector. The latest available year is 2002. Thedata relating to the film industry are shown in Tables 15.12, 15.13 and15.14. The different characteristics of the three sectors stand out clearly inthese tables.
The film and video production sector had an exceptionally high number ofsmall workplaces (95.8% in the 1-10 band), accounting for a majority ofthe sector’s total workforce (59.4%). At the other end of the scale, therewas a small number of large workplaces. The 27 workplaces w ith 50 ormore employees accounted for 3,086 employees, an average of 114 each.
The London and South East share of the film and video production work-force (SIC 9211) rose to 74.3% in the year to autumn 2003, after droppingin 2001 and 2002.
90.0
80.0
70.0
60.0
50.0
40.0
30.0
20.0
10.0
0.0
1994
1995
1996
1997
1998
1999
2000
2001
2002
2003
57.4
62.5
68.5
79.9
78.2
70.3
77.9
71.0
64.7
74.3
26.5
26.2
26.4
26.6
26.8
27.1
27.1
27.1
27.1
27.0
Film and video production
UK all industries
Year
Source: Labour Force Survey. The sample sizes for film and video distribution (9212) and film exhibition (9213) in London are too small to chart w ith confidence.
Perc
enta
ge o
f to
tal w
orkf
orce
Figure 15.3 London and SE percentage share of total workforce, 1994 - 2003

105
Chapter 15: Employment in the film and video industries
Workplace size band
Number of workplacesin band
% totalworkplaces
Number ofemployees in band
% of totalemployees
1-10 5,588 95.8 10,522 59.4
11-49 215 3.7 4,091 23.1
50 + 27 0.5 3,086 17.4
Total 5,830 100.0 17,699 100.0
Table 15.12 Film and video production (SIC 9211) workplace size distribution (employees), 2002
Source: ABI
The distribution sector was not as concentrated in small workplaces as the production sector, w ith over two-thirds of employees working in workplacesw ith 11 or more employees.
Workplacesize band
Number of workplacesin band
% totalworkplaces
Number of employees in band
% of total employees
1-10 505 87.4 1,345 29.8
11 + 73 12.6 3,162 70.2
Total 578 100.0 4,507 100.0
15.13 Film and video distribution (SIC 9212) workplace size distribution (employees), 2002
Source: ABI
Workplace numbers for bands above 11 employees cannot be published for confidentiality reasons (too few workplaces in the bands). 44% of distributionemployees worked in workplaces of 50 employees or greater. There was a smallnumber of workplaces in the 200-plus employee size range.
The exhibition sector had a concentration that was the reverse of the productionsector. Over 60% of exhibition employees worked in workplaces of 50 or moreemployees, and only 3.9% in workplaces in the 1-10 employee band.
Workplacesize band
Number of workplacesin band
% totalworkplaces
Number ofemployees in band
% of totalemployees
1-10 184 33.2 716 3.9
11-49 230 41.4 6,320 34.3
50 + 141 25.4 11,370 61.8
Total 555 100.0 18,406 100.0
Table 15.14 Film exhibition (SIC 9213) workplace size distribution (employees), 2002
Source: ABI
Over the period 1995 to 2002, two trends can be identified in the workplace sizedistribution data. First, in the production sector (SIC 9211) the concentration ofemployment in 1-10 employee size band increased at the expense of employmentin the 50-plus band, as shown in Figure 15.4.
Statistical Yearbook 2003
Courtesy of Skillset

Chapter 15: Employment in the film and video industries
106
See also• For more details on the film distribution sector in 2003 see chapter 5.• For more information about the exhibition sector in 2003 see chapter 6.• For more background about film production in 2003 see chapter 12.• For an insight into what the UK Film Council is doing to support film
industry training see http://www.ukfilmcouncil.org.uk/funding/trainingfund/
80
70
60
50
40
30
20
10
0
1995
1996
1997
1998
1999
2000
2001
2002
29.8
35.4
52.1
68.0
56.1
51.8
42.2
58.8 61
.863.1
56.8
40.5
25.1
36.6
36.5
34.3
11 - 49 employees
50 + employees
YearS
Perc
enta
ge o
f sec
tor
wor
kfor
ce
Figure 15.5 Film exhibition sector (SIC 9213): employees by workplace size band, percentage of total, 1995-2002
70
60
50
40
30
20
10
0
1995
1996
1997
1998
1999
2000
2001
2002
30 28.3
25.7
25.6
21.3 22
.9
17.2
17.4
44.9 46
.9 50.3
55.6 57
.2 57.9
57.1 59
.4
1 - 10 employees
50 + employees
YearSource: ABI
Perc
enta
ge o
f sec
tor
wor
kfor
ce
Figure 15.4 Film and video production sector (SIC 9211) employees by workplace size band, percentage of total, 1995-2002
Second, in the exhibition sector the numbers of workplaces and employees in the50-plus category grew, while the numbers in the 11-49 category fell, that is, therewas a tendency for exhibition workplaces to grow in size, as shown in Figure 15.5.

Acknowledgements/Sources
109
SourcesChapters 1 to 7: Films and their UK cinema audiences• Cinema Advertising Association, Cinema and
Video Industry Audience Research (CAVIAR) survey, 2003 Quarterly Reports and CAVIAR 21, December 2003.
• TNS, disability and ethnicity groups w ithin visual entertainments, 52 weeks ending January 4 2004.
• Department for Culture, Media and Sport, public list of UK qualifying films.
• Dodona Research, Cinemagoing 12, March 2004.• Motion Picture Association of America,
US adm issions report• Nielsen EDI, weekly UK box office reports.• Nielsen Media Research, monthly media spend
reports.
Chapters 8 & 9: UK films abroad and the international picture• AFMA , international box office reports.• Cinetel (Italy), box office reports.• European Audiovisual Observatory Lum iere
Database• Kogyo Tsushinsha (Japan), box office reports.• Nielsen EDI, weekly US box office reports.• Office for National Statistics, Annual Film and
Television Survey, 2002.
Chapters 10 & 11: Films on video/DVD and television• BARB audience data supplied by DGA Metrics.• British Video Association, BVA Yearbook 2004,
May 2004.• MRIB, Rental Monitor weekly report.• Official UK Charts Company, video charts.
Chapters 12-15: The UK film industry• Office for National Statistics, Annual Business
Inquiry, 2002.• Office for National Statistics, Labour Force Survey,
Quarterly to Autumn 2003.• Office for National Statistics, Size Analysis of UK
Businesses 2003 (VAT data)• Skillset, Prelim inary results of film production
workforce survey, March 2004.• UK Film Council International, Survey of Film
Productions w ith UK Participation, 2003.• UK Film Council & dti, Post-production in the UK,
November 2003.
AcknowledgementsWe would like to thank the follow ing organisations for kindly allow ing us to reproduce their data:
British Board of Film Classification (BBFC)British Market Research Bureau (BMRB)British Video Association (BVA)Cinema Advertising Association (CAA)DGA MetricsDodona ResearchMotion Picture Association of America (MPAA)MRIBNielsen EDINielsen Media ResearchOffice for National Statistics (ONS)Official UK Charts CompanyTNS
Please note that nothing in this Yearbook may bereproduced in any form w ithout prior perm issionfrom the authors or copyright owners.Television Survey, 2002.
Glossary
107
CAACinema Advertising Association. The trade association of cinema advertising contractors operating in the UK and Eire
Concession revenueRevenue from sales of food, drink and merchandiseat cinemas
Co-productionA film made by companies from more than one country, often under the terms of a bilateral co-production treaty or the European Co-Production Convention
Country of originThe nationality of a film . In the case of co-productions, this may include more than one country
DCMSDepartment for Culture, Media and Sport. The UK Film Council's sponsoring department
Digital projectionThe projection of a film onto a cinema screen usinga digital master and a digital projector, i.e. usingelectronic signals to direct light onto the screenrather than passing light through a celluloid strip
DistributorA person or company that acquires the right toexploit the commercial and creative values of a film in the theatrical, video and TV market. A lso conducts the promotional and marketingactivities necessary to w in audiences for the film
DVDDigital Versatile Disc
ExhibitorA cinema operator that rents a film from a distributor to show to a cinema audience
Feature film A film made for cinema release, as opposed to afilm made for television
Film certificateClassification given to a film by the British Board of Film Classification. Indicates the film’s suitabilityfor audiences according to their age
Film RentalThe sum of money paid to the distributor by theexhibitor in return for the right to show a particularfilm . Usually calculated as a percentage of net boxoffice
GlossaryAsian programm ing Films originating from South Asia, e.g. Bollywood,and generally, though not exclusively, aimed at a South Asian audience and in a South Asian language
BARBBroadcasters' Audience Research Board Ltd. The company that compiles audience figures for UK television (www.barb.co.uk)
BBFCBritish Board of Film Classification. Independentbody responsible for classifying films and video(see Film certificate) (www.bbfc.org.uk)
Box officeTotal value of ticket sales for a film screened commercially at cinemas
Box office grossBox office takings before deduction of ValueAdded Tax (VAT)
BVABritish Video Association. The trade body repre-senting the interests of publishers and rights own-ers of pre-recorded home entertainment on video(www.bva.org.uk)

Net box officeBox office takings after deduction of VAT
Non-terrestrial televisionTelevision programm ing carried by cable or satellitedelivery systems
Peak-time hoursThe time of day that secures the largest televisionsaudiences. For the purposes of this report, peak-time hours are 18:00 to 23:59
Standard Industrial Classification (SIC)A numbering system used by the Office for National Statistics to identify different industries in the UK’s official statistics
SitesIndividual cinema prem ises
Socio-econom ic groupSection of the population defined by employmentstatus
Specialised programm ingGenerally, non-mainstream films. This categoryincludes foreign-language and sub-titled films, art-house productions and films aimed at nicheaudiences
Terrestrial televisionChannels available through an aerial
Traditional cinemaA cinema generally w ith fewer than five screensand that shows more mainstream product. Oftenan older building located in city centres or suburbs
FranchiseA film series, e.g. Harry Potter and thePhilosopher's Stone and its sequels
GenreA style or category of film defined on the basis ofcommon story and cinematic conventions (e.g.action, crime, romantic comedy, drama etc)
Inward featuresA term used by the UK Film Council to denote a film where more than 50% of the total financing is from outside the UK and/or where theproduction is attracted to the UK by the UK’s film-making infrastructure
ISBA TV RegionsSystem for classifying regions developed by the Incorporated Society of British Advertisers for use by the advertising industry
Mainstream programm ingCategory of films aimed at the general audience
Megaplex siteDefined by Dodona Research as a purpose builtcinema w ith twenty or more screens
Multiplex siteDodona Research defines a multiplex as a purposebuilt cinema w ith five or more screens
108Statistical Yearbook 2003
Terminator 3 courtesy of Warner Bros