Embed Size (px)
Citation preview
STATISTICALYearbook /2003
CAMARA ARGENTINA DE LA INDUSTRIA DEL ALUMINIO Y METALES AFINES
: : :
yearbook : : : 2mil3 : : : 02
CONTENTS
Statisticalyearbook2003
Index
Editorial year 2003
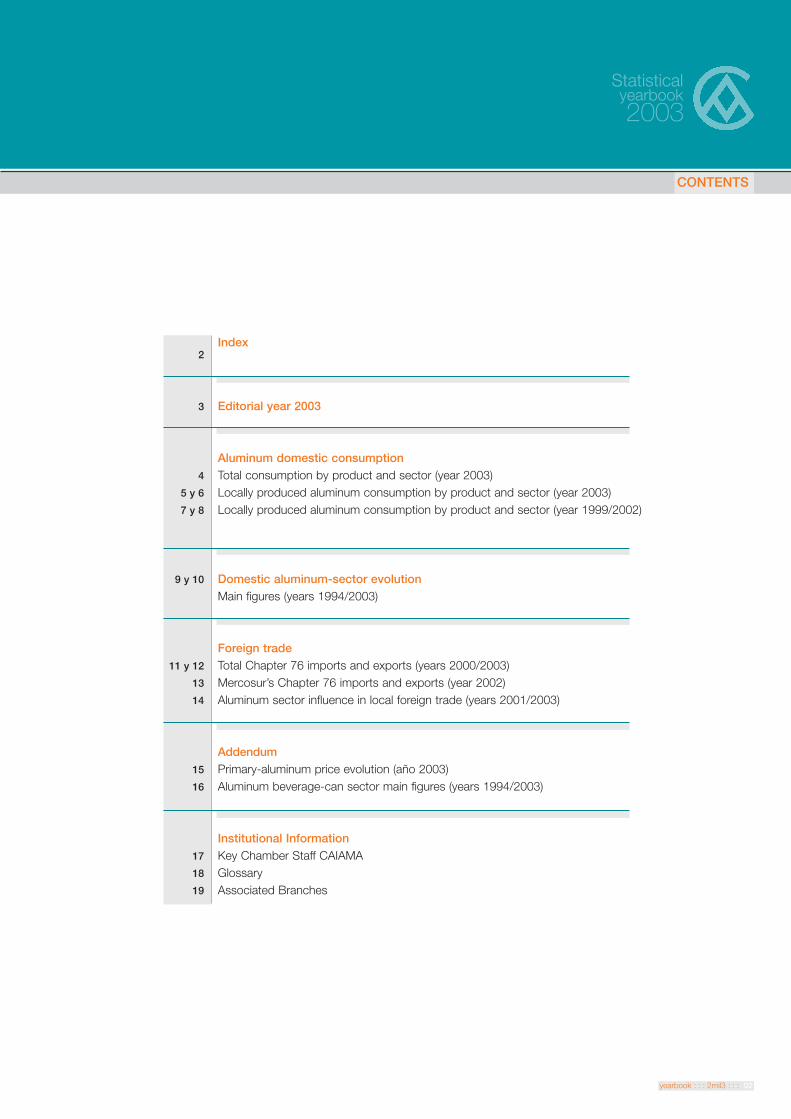
Aluminum domestic consumptionTotal consumption by product and sector (year 2003)Locally produced aluminum consumption by product and sector (year 2003)Locally produced aluminum consumption by product and sector (year 1999/2002)
Domestic aluminum-sector evolutionMain figures (years 1994/2003)
Foreign tradeTotal Chapter 76 imports and exports (years 2000/2003)Mercosur’s Chapter 76 imports and exports (year 2002)Aluminum sector influence in local foreign trade (years 2001/2003)
AddendumPrimary-aluminum price evolution (año 2003)Aluminum beverage-can sector main figures (years 1994/2003)
Institutional InformationKey Chamber Staff CAIAMAGlossaryAssociated Branches
2
3
4
5 y 6
7 y 8
9 y 10
11 y 12
13
14
15
16
17
18
19
EDITORIAL : : :
yearbook : : : 2003 : : : 03
EDITORIAL : : :
Statisticalyearbook2003
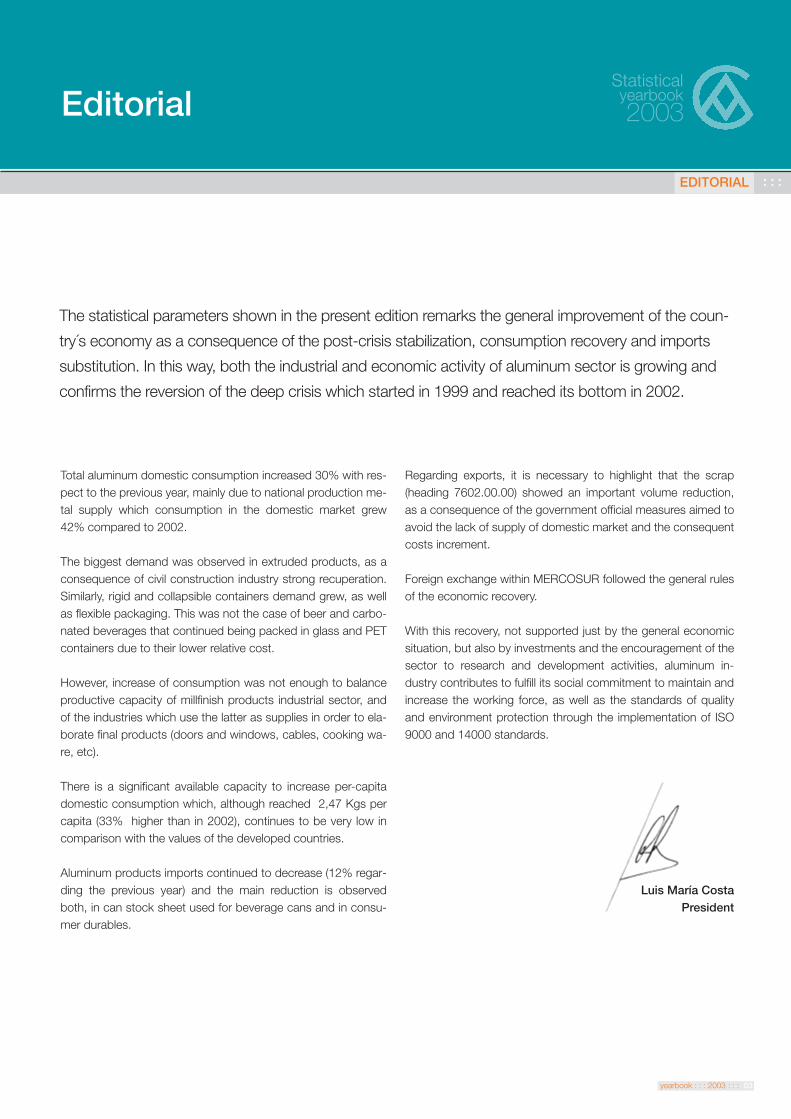
Total aluminum domestic consumption increased 30% with res-pect to the previous year, mainly due to national production me-tal supply which consumption in the domestic market grew42% compared to 2002.
The biggest demand was observed in extruded products, as aconsequence of civil construction industry strong recuperation.Similarly, rigid and collapsible containers demand grew, as wellas flexible packaging. This was not the case of beer and carbo-nated beverages that continued being packed in glass and PETcontainers due to their lower relative cost.
However, increase of consumption was not enough to balanceproductive capacity of millfinish products industrial sector, andof the industries which use the latter as supplies in order to ela-borate final products (doors and windows, cables, cooking wa-re, etc).
There is a significant available capacity to increase per-capitadomestic consumption which, although reached 2,47 Kgs percapita (33% higher than in 2002), continues to be very low incomparison with the values of the developed countries.
Aluminum products imports continued to decrease (12% regar-ding the previous year) and the main reduction is observedboth, in can stock sheet used for beverage cans and in consu-mer durables.
Editorial
The statistical parameters shown in the present edition remarks the general improvement of the coun-
try´s economy as a consequence of the post-crisis stabilization, consumption recovery and imports
substitution. In this way, both the industrial and economic activity of aluminum sector is growing and
confirms the reversion of the deep crisis which started in 1999 and reached its bottom in 2002.
Regarding exports, it is necessary to highlight that the scrap(heading 7602.00.00) showed an important volume reduction,as a consequence of the government official measures aimed toavoid the lack of supply of domestic market and the consequentcosts increment.
Foreign exchange within MERCOSUR followed the general rulesof the economic recovery.
With this recovery, not supported just by the general economicsituation, but also by investments and the encouragement of thesector to research and development activities, aluminum in-dustry contributes to fulfill its social commitment to maintain andincrease the working force, as well as the standards of qualityand environment protection through the implementation of ISO9000 and 14000 standards.
Luis María Costa President

Aluminum domestic consumptionTotal consumption by product and origin (tons)Year 2003
CONSUMPTION : : :
Statisticalyearbook2003
yearbook : : : 2003 : : : 04
DOMESTIC CONSUMPTION BY PRODUCT DOMESTIC CONSUMPTION BY ORIGIN
(*) Excludes 4060 tons of rolled products for soft drink and beer can production
Castings
Wire, rodand cables
Extrusions
Thin sheetand foil
Sheets and coilsthickness > 0,2 mm
Other
36%
12%
19%
15%
14%
4%Imports
LocalProduced
84.4%
15.6%
(*)
Unit: Tons
PRODUCT/SECTOR LOCAL PRODUCED IMPORTS TOTAL
Sheets and coils thickness 11.956 1.652 13.608> 0,2 mm
Thin sheet and foil 8.255 6.312 14.567
Extrusions 17.578 1.352 18.930
Wire, rod and cables 10.742 1.132 11.874
Castings 33.841 1.697 35.538
Others 1.121 3.257 4.378
TOTALS 83.493 15.402 98.895
Share (%) 84,4% 15,6% 100%

CONSUMO : : :
yearbook : : : 2003 : : : 05
Aluminum domestic consumptionLocally produced aluminum consumption by product and sectorYear 2003
CONSUMPTION : : :
Statisticalyearbook2003
(*) Excludes soft drinks and beer cans • Information supplied by aluminum products manufacturers Unit: Tons
PRODUCT/SECTOR Building Packaging (*) Transport. Electrical Consumer Machinery & Steel Other TOTAL Share(%)Ind. Durables Equipment
Sheets and coils thickness 343 6.260 464 10 2.310 2.243 - 326 11.956 14,3%> 0,2 mm
Thin sheet and foil 1.386 5.458 588 - 631 145 - 47 8.255 9,9%
Extrusions 12.063 - 992 318 1.392 2.014 - 799 17.578 21,1%
Wire, rod and cables - - - 10.240 - - 502 - 10.742 12,9%
Castings 7.403 - 17.495 385 3.311 274 4.558 415 33.841 40,5%
Other - - - - - - - 1.121 1.121 1,3%
TOTALS 21.195 11.718 19.539 10.953 7.644 4.676 5.060 2.708 83.493 100,0%
Share (%)) 25,4% 14,0% 23,4% 13,1% 9,2% 5,6% 6,1% 3,2% 100,0%
Castings
Wire, rod andcables
Extrusions
Thin sheetand foil
Sheets and coilsthickness > 0,2 mm
Other
41%
13%
21%
10%
14%
1%
26%
23%
Other
Steel
Machinery &equipment
Consumedurables
ElectricalInd.
Packaging
Building
Transportation
3%
6%
6%
9%
13% 14%
LOCALLY PRODUCED ALUMINUM CONSUMPTION BYPRODUCT
LOCALLY PRODUCED ALUMINUM CONSUMPTION BYSECTOR

yearbook : : : 2003 : : : 06
Transportation
Building
Others 1%
Steel
Machinery &equipment
1%
Consumedurables
ElectricalInd.1%
Aluminum domestic consumptionLocally produced aluminum consumption by product and sectorYear 2003
CONSUMPTION : : :
Statisticalyearbook2003
Steel0%
Machinery &Equipment
ConsumeDurables
EléctricalInd. 2%
Packaging0%
Building
Transportation
5%
11%
8%
6%68%
Other3%
Machinery &equipment
Consumedurables
ElectricalInd. 1%
Packagings
Transportation
19%
52%
13%
22%
10%
52%
Packaging0%
Other
Packaging
Building
Transportation
7% 65%
8%
ElectricalInd.0%
17%
Machinery &equipment
2%
Steel 0%
Consumedurables
Other1%
DOMESTIC CONSUMPTION OF CASTING PRODUCTS DOMESTIC CONSUMPTION OF EXTRUDED PRODUCTS
CONSUMO DOMÉSTICO DE PRODUCTOS LAMINADOS FINOS
CONSUMO DOMÉSTICO DE PRODUCTOS LAMINADOS GRUESOS
19%
4%
Building2%
Steel 0%
yearbook : : : 2003 : : : 07
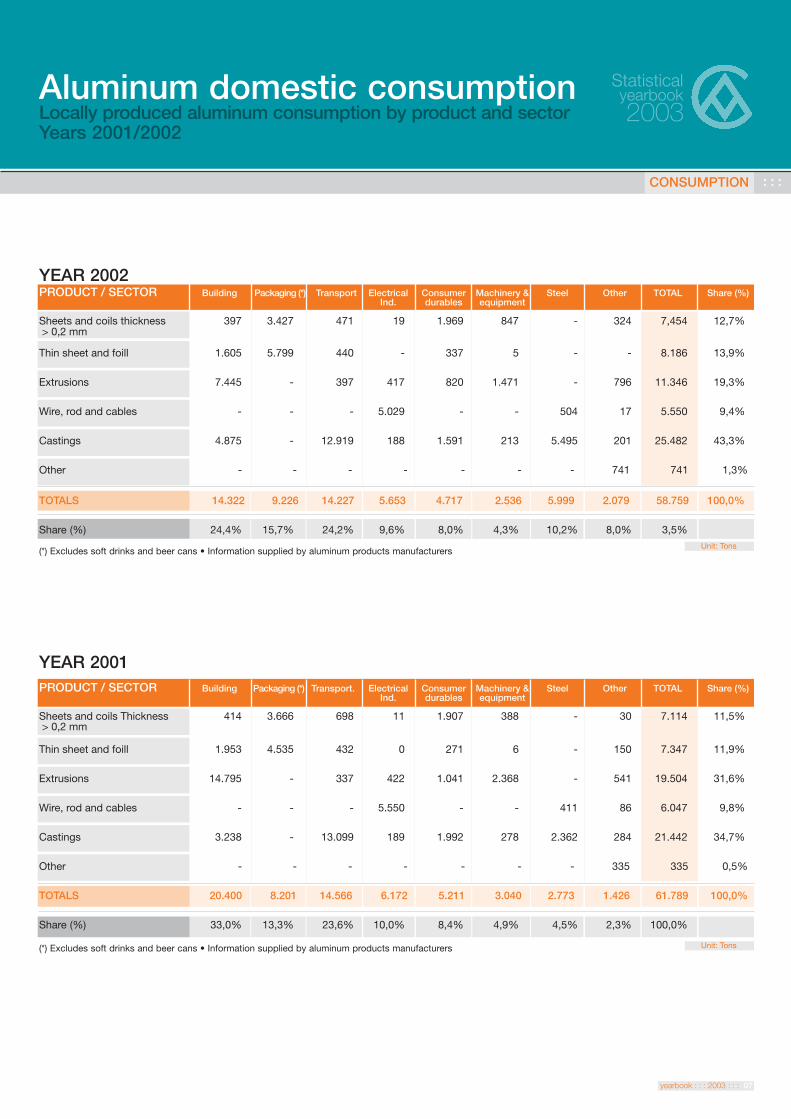
Aluminum domestic consumptionLocally produced aluminum consumption by product and sectorYears 2001/2002
CONSUMPTION : : :
Statisticalyearbook2003
YEAR 2002
YEAR 2001
(*) Excludes soft drinks and beer cans • Information supplied by aluminum products manufacturersUnit: Tons
PRODUCT / SECTOR Building Packaging (*) Transport Electrical Consumer Machinery & Steel Other TOTAL Share (%)Ind. durables equipment
Sheets and coils thickness 397 3.427 471 19 1.969 847 - 324 7,454 12,7%> 0,2 mm
Thin sheet and foill 1.605 5.799 440 - 337 5 - - 8.186 13,9%
Extrusions 7.445 - 397 417 820 1.471 - 796 11.346 19,3%
Wire, rod and cables - - - 5.029 - - 504 17 5.550 9,4%
Castings 4.875 - 12.919 188 1.591 213 5.495 201 25.482 43,3%
Other - - - - - - - 741 741 1,3%
TOTALS 14.322 9.226 14.227 5.653 4.717 2.536 5.999 2.079 58.759 100,0%
Share (%) 24,4% 15,7% 24,2% 9,6% 8,0% 4,3% 10,2% 8,0% 3,5%
(*) Excludes soft drinks and beer cans • Information supplied by aluminum products manufacturers Unit: Tons
PRODUCT / SECTOR Building Packaging (*) Transport. Electrical Consumer Machinery & Steel Other TOTAL Share (%)Ind. durables equipment
Sheets and coils Thickness 414 3.666 698 11 1.907 388 - 30 7.114 11,5%> 0,2 mm
Thin sheet and foill 1.953 4.535 432 0 271 6 - 150 7.347 11,9%
Extrusions 14.795 - 337 422 1.041 2.368 - 541 19.504 31,6%
Wire, rod and cables - - - 5.550 - - 411 86 6.047 9,8%
Castings 3.238 - 13.099 189 1.992 278 2.362 284 21.442 34,7%
Other - - - - - - - 335 335 0,5%
TOTALS 20.400 8.201 14.566 6.172 5.211 3.040 2.773 1.426 61.789 100,0%
Share (%) 33,0% 13,3% 23,6% 10,0% 8,4% 4,9% 4,5% 2,3% 100,0%
yearbook : : : 2003 : : : 08
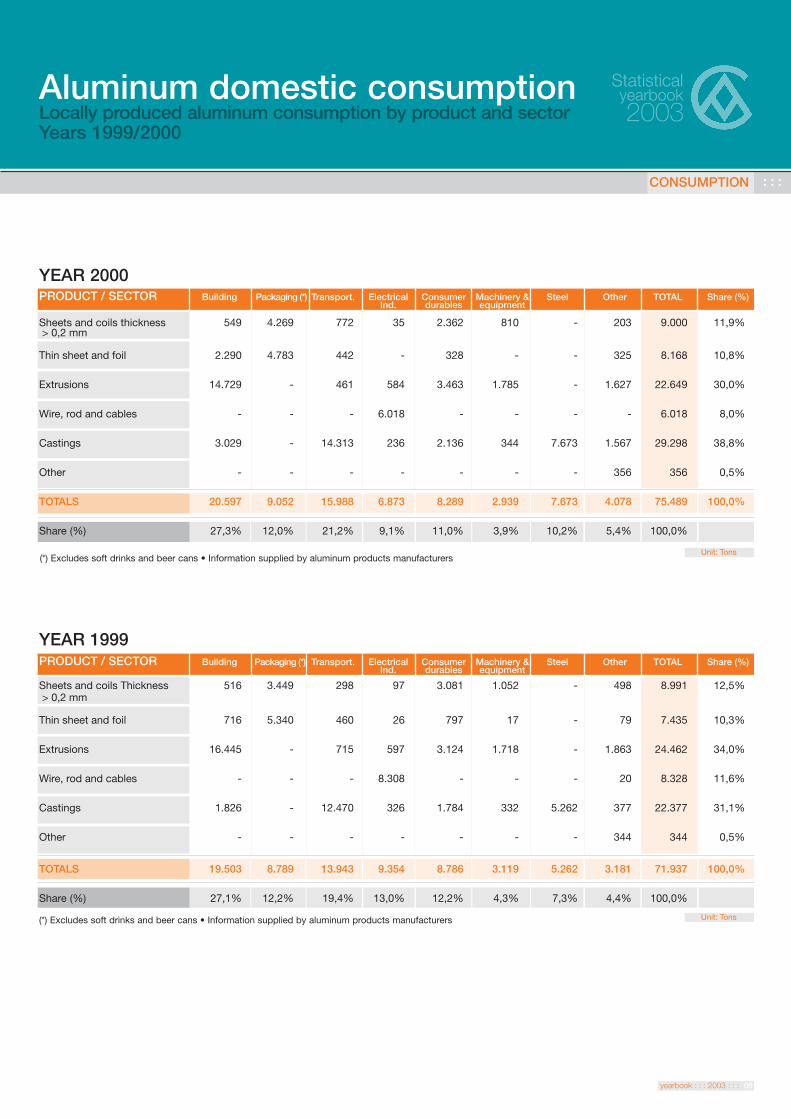
Aluminum domestic consumptionLocally produced aluminum consumption by product and sectorYears 1999/2000
CONSUMPTION : : :
Statisticalyearbook2003
YEAR 2000
YEAR 1999
(*) Excludes soft drinks and beer cans • Information supplied by aluminum products manufacturersUnit: Tons
PRODUCT / SECTOR Building Packaging (*) Transport. Electrical Consumer Machinery & Steel Other TOTAL Share (%)Ind. durables equipment
Sheets and coils thickness 549 4.269 772 35 2.362 810 - 203 9.000 11,9%> 0,2 mm
Thin sheet and foil 2.290 4.783 442 - 328 - - 325 8.168 10,8%
Extrusions 14.729 - 461 584 3.463 1.785 - 1.627 22.649 30,0%
Wire, rod and cables - - - 6.018 - - - - 6.018 8,0%
Castings 3.029 - 14.313 236 2.136 344 7.673 1.567 29.298 38,8%
Other - - - - - - - 356 356 0,5%
TOTALS 20.597 9.052 15.988 6.873 8.289 2.939 7.673 4.078 75.489 100,0%
Share (%) 27,3% 12,0% 21,2% 9,1% 11,0% 3,9% 10,2% 5,4% 100,0%
(*) Excludes soft drinks and beer cans • Information supplied by aluminum products manufacturers Unit: Tons
PRODUCT / SECTOR Building Packaging (*) Transport. Electrical Consumer Machinery & Steel Other TOTAL Share (%)Ind. durables equipment
Sheets and coils Thickness 516 3.449 298 97 3.081 1.052 - 498 8.991 12,5%> 0,2 mm
Thin sheet and foil 716 5.340 460 26 797 17 - 79 7.435 10,3%
Extrusions 16.445 - 715 597 3.124 1.718 - 1.863 24.462 34,0%
Wire, rod and cables - - - 8.308 - - - 20 8.328 11,6%
Castings 1.826 - 12.470 326 1.784 332 5.262 377 22.377 31,1%
Other - - - - - - - 344 344 0,5%
TOTALS 19.503 8.789 13.943 9.354 8.786 3.119 5.262 3.181 71.937 100,0%
Share (%) 27,1% 12,2% 19,4% 13,0% 12,2% 4,3% 7,3% 4,4% 100,0%
350.000
300.000
250.000
200.000
150.000
100.000
50.000
0
yearbook : : : 2003 : : : 09
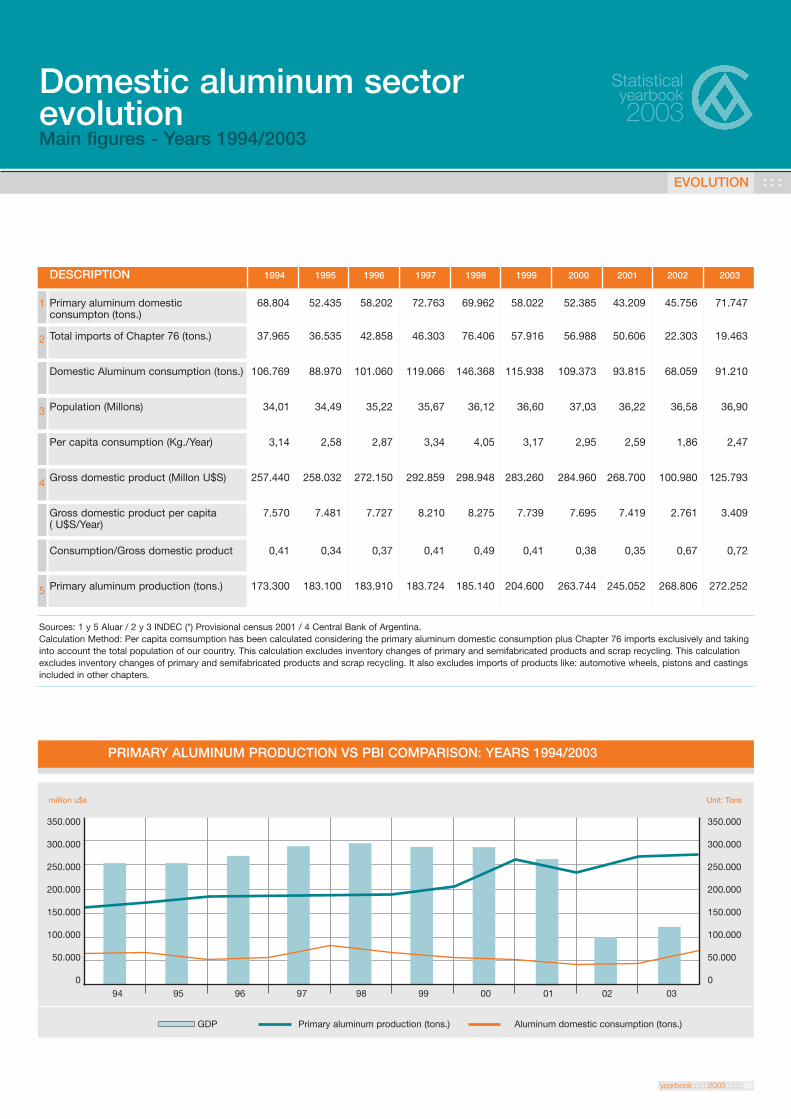
Domestic aluminum sector evolutionMain figures - Years 1994/2003
EVOLUTION : : :
Statisticalyearbook2003
Sources: 1 y 5 Aluar / 2 y 3 INDEC (*) Provisional census 2001 / 4 Central Bank of Argentina.Calculation Method: Per capita comsumption has been calculated considering the primary aluminum domestic consumption plus Chapter 76 imports exclusively and takinginto account the total population of our country. This calculation excludes inventory changes of primary and semifabricated products and scrap recycling. This calculationexcludes inventory changes of primary and semifabricated products and scrap recycling. It also excludes imports of products like: automotive wheels, pistons and castingsincluded in other chapters.
DESCRIPTION 1994 1995 1996 1997 1998 1999 2000 2001 2002 2003
Primary aluminum domestic 68.804 52.435 58.202 72.763 69.962 58.022 52.385 43.209 45.756 71.747consumpton (tons.)
Total imports of Chapter 76 (tons.) 37.965 36.535 42.858 46.303 76.406 57.916 56.988 50.606 22.303 19.463
Domestic Aluminum consumption (tons.) 106.769 88.970 101.060 119.066 146.368 115.938 109.373 93.815 68.059 91.210
Population (Millons) 34,01 34,49 35,22 35,67 36,12 36,60 37,03 36,22 36,58 36,90
Per capita consumption (Kg./Year) 3,14 2,58 2,87 3,34 4,05 3,17 2,95 2,59 1,86 2,47
Gross domestic product (Millon U$S) 257.440 258.032 272.150 292.859 298.948 283.260 284.960 268.700 100.980 125.793
Gross domestic product per capita 7.570 7.481 7.727 8.210 8.275 7.739 7.695 7.419 2.761 3.409( U$S/Year)
Consumption/Gross domestic product 0,41 0,34 0,37 0,41 0,49 0,41 0,38 0,35 0,67 0,72
Primary aluminum production (tons.) 173.300 183.100 183.910 183.724 185.140 204.600 263.744 245.052 268.806 272.252
1
2
3
4
5
350.000
300.000
250.000
200.000
150.000
100.000
50.000
094 95 96 97 98 99 00 01 02 03
GDP Primary aluminum production (tons.) Aluminum domestic consumption (tons.)
Unit: Tonsmillion u$s
PRIMARY ALUMINUM PRODUCTION VS PBI COMPARISON: YEARS 1994/2003
yearbook : : : 2003 : : : 10
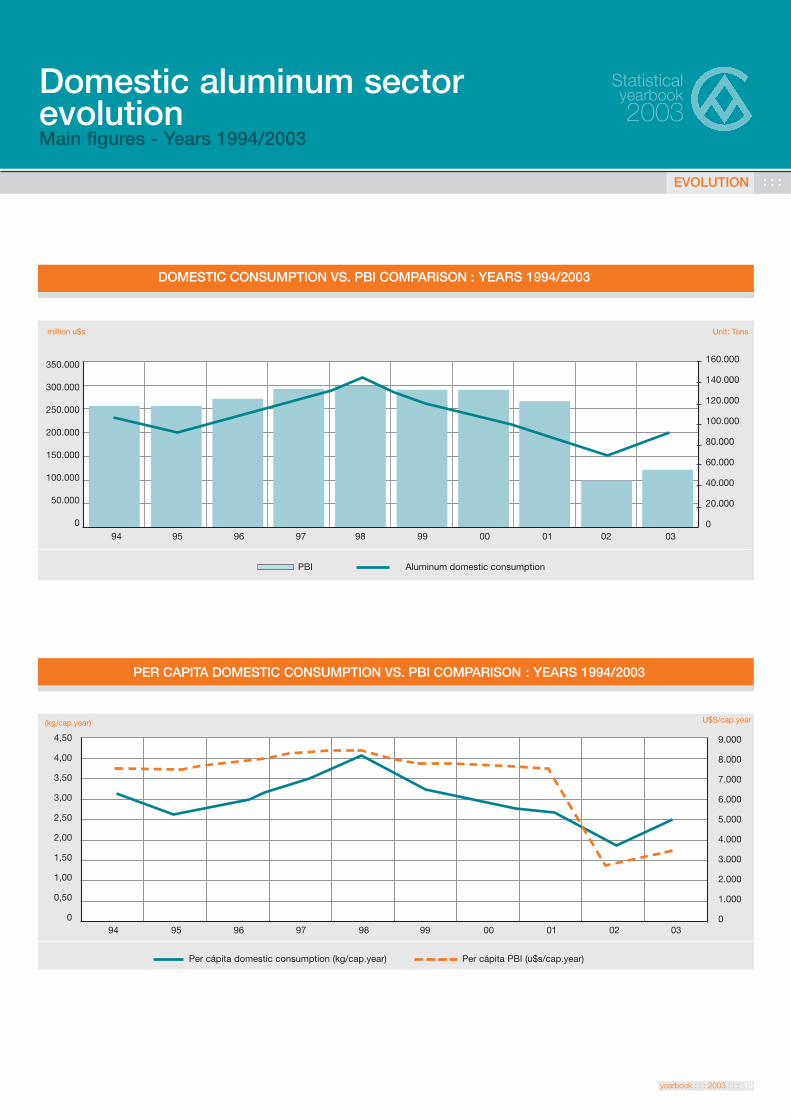
Domestic aluminum sector evolutionMain figures - Years 1994/2003
EVOLUTION : : :
Statisticalyearbook2003
350.000
300.000
250.000
200.000
150.000
100.000
50.000
0
160.000
140.000
120.000
100.000
80.000
60.000
40.000
20.000
094 95 96 97 98 99 00 01 02 03
PBI Aluminum domestic consumption
4,50
4,00
3,50
3,00
2,50
2,00
1,50
1,00
0,50
0
9.000
8.000
7.000
6.000
5.000
4.000
3.000
2.000
1.000
094 95 96 97 98 99 00 01 02 03
Per cápita domestic consumption (kg/cap.year) Per cápita PBI (u$s/cap.year)
Unit: Tonsmillion u$s
(kg/cap.year)
PER CAPITA DOMESTIC CONSUMPTION VS. PBI COMPARISON : YEARS 1994/2003
DOMESTIC CONSUMPTION VS. PBI COMPARISON : YEARS 1994/2003
U$S/cap.year

HEADING DESCRIPTION IMPORTS EXPORTS
00 01 02 03 00 01 02 03
UNWROUGHT ALUMINUM- not alloyed- aluminum alloysWASTE AND SCRAPPOWDERS AND FLAKES BARS, RODS AND PROFILES - of aluminum, not alloyed- of aluminum alloys - hollow profiles- otherALUMINUM WIRE - of aluminum not alloyed- of aluminum alloys - otherPLATES, SHEETS AND STRIP OF THICKNESSEXCEEDING 0,2 MM- Including square- of aluminum not alloyed- of aluminum alloys- other - of aluminum not alloyed- of aluminum alloys ALUMINUM FOIL - not laminated- other - laminated TUBES- of aluminum not alloyed- of aluminum alloysTUBE OR PIPE FITTINGS STRUCTURES AND PARTS OF STRUCTURES - doors, windows and their frames and
thresholds for doors- other
RESERVOIRS, TANKS, VATS AND SIMILAR CONTAINERS OF A CAPACITY EXCEEDING 300 LITERSTANKS, DRUMS, CANS, BOXES AND SIMILAR CONTAIN-ERS OF A CAPACITY NOT EXCEEDING 300 LITERS- collapsible tubular containers- other CONTAINERS FOR COMPRESSED OR LIQUIFIED GASSTRANDED WIRE, CABLES, ETC. NOT ELECTICALLYINSULATED- with steel core- other
TABLE, KITCHEN OR OTHER HOUSEHOLD ARTICLES
OTHER ARTICLES OF ALUMINUM
TOTAL
76017601.17601.27602760376047604.17604.27604.217604.2976057605.17605.217605.297606
7606.17606.117606.127606.97606.917606.9276077607.117607.197607.2076087608.17608.2760976107610.1
7610.97611
7612
7612.17612.976137614
7614.17614.97615
7616
922,11.710,4
242,0385,4
70,9
2.533,5
6.602,3387,4849,1
1.024,117.652,3
303,1222,0
8.269,3308,1
3.855,1
148,5499,2179,6
114,61.607,6
1,6
166,41.420,9
35,1
612,126,0
2.520,5
4.318,6
56.987,8
217,82.302,4
89,4296,2
122,7
862,3952,3
2.942,9240,7803,5
809,516.529,0
151,688,1
7.148,3336,3
3.483,3
85,3619,0161,6
104,41.152,4
16,6
167,91.915,4
49,0
2.027,423,4
2.449,8
4.457,6
50.606
623,9
422,5
29,0
147,9140,5
158,4209,140,6
187,85.420,4
27,854,9
4.582,7205,6
1.716,2
91,5362,4156,1
7,4822,3
1,3
49,6581,7
6,1
420,02.449,8
424,42.962,8
22.303
1.598,9
151,7
37,1
304,0145,0
132,0457,249,6
326,14.059,8
38,982,9
4.197,7308,3
1.806,4
140,5543,098,4
2,8180,0
0,1
44,5160,618,8
301,4191,7980,7
3.104,8
19.463
44.570,2143.288,8
3.757,313,3
5,7
126,4375,6
25.010,4102,491,5
626,7330,4
4,0
4.091,7155,5319,5
1,225,86,9
17,570,2
0,3
7,62.358,2
3,1
0,83,0
216,9
459,0
226.039,9
69.119,5113.412,6
6.447,03,8
21,3
84,0208,9
12.167,5303,510,6
674,4295,4
15,74,0
3.868,8114,0368,1
3,0725,6189,1
21,570,7
45,12.610,6
0,6
0,1158,5179,6
387,7
211.511,2
64.004,7136.514,510.680,0
34,4
137,2
348,0875,2
23.927,4214,2
1,0
962,8938,5
3,838,9
2.752,328,4
363,8
0,1107,0317,9
35,9145,6
6,0
47,61.728,8
2,1
318,5271,5159,6
559,9
245.525,6
yearbook : : : 2003 : : : 11
International TradeTotal Chapter 76 imports and exportsYears 2000/2003
Statisticalyearbook2003
41.052,0158.813,8
718,72,6
48,1
295,51.594,9
20.696,0134,8
1,8
864,91.256,5
5,957,5
3.239,917,7
266,7
1,7249,2388,1
614,090,5
2,0
48,01.854,8
0,8
601,3343,2938,4
734,6
234.933,9
Source: INDEC
Unit: Tons
INTERNATIONAL TRADE : : :
yearbook : : : 2003 : : : 12
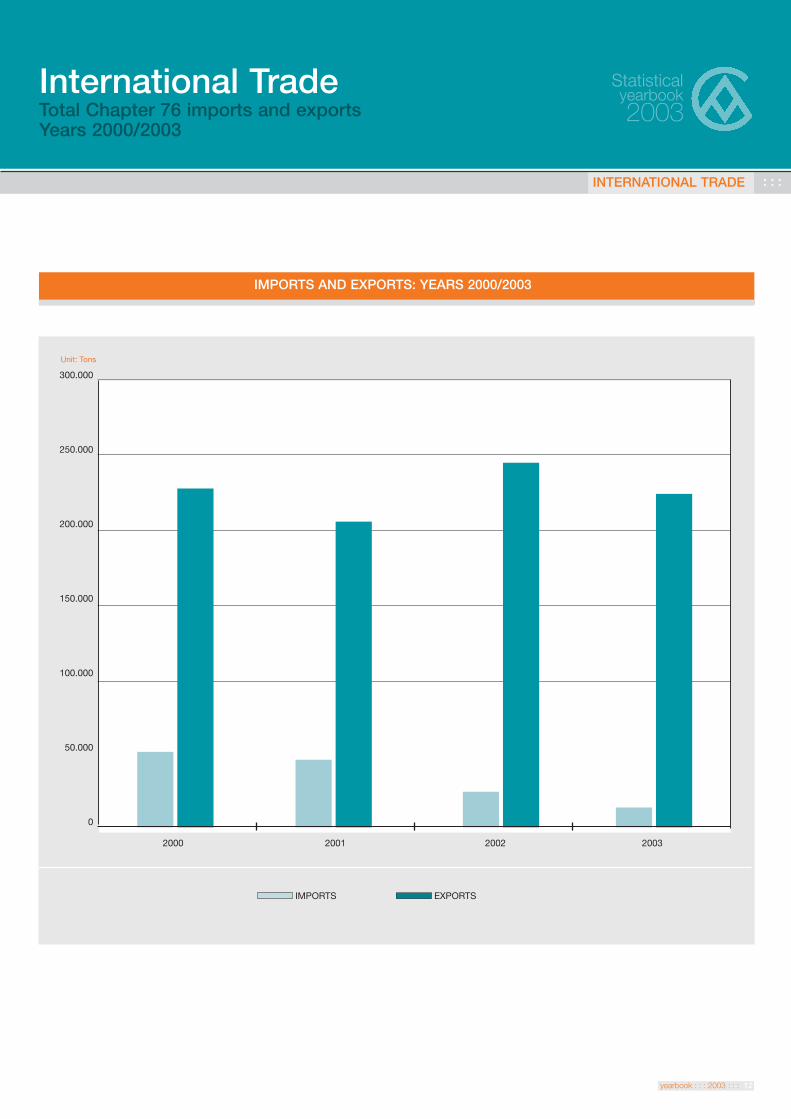
International TradeTotal Chapter 76 imports and exportsYears 2000/2003
INTERNATIONAL TRADE : : :
Statisticalyearbook2003
IMPORTS AND EXPORTS: YEARS 2000/2003
300.000
250.000
200.000
150.000
100.000
50.000
0
2000 2001 2002 2003
IMPORTS EXPORTS
Unit: Tons
Source: INDEC
yearbook : : : 2003 : : : 13
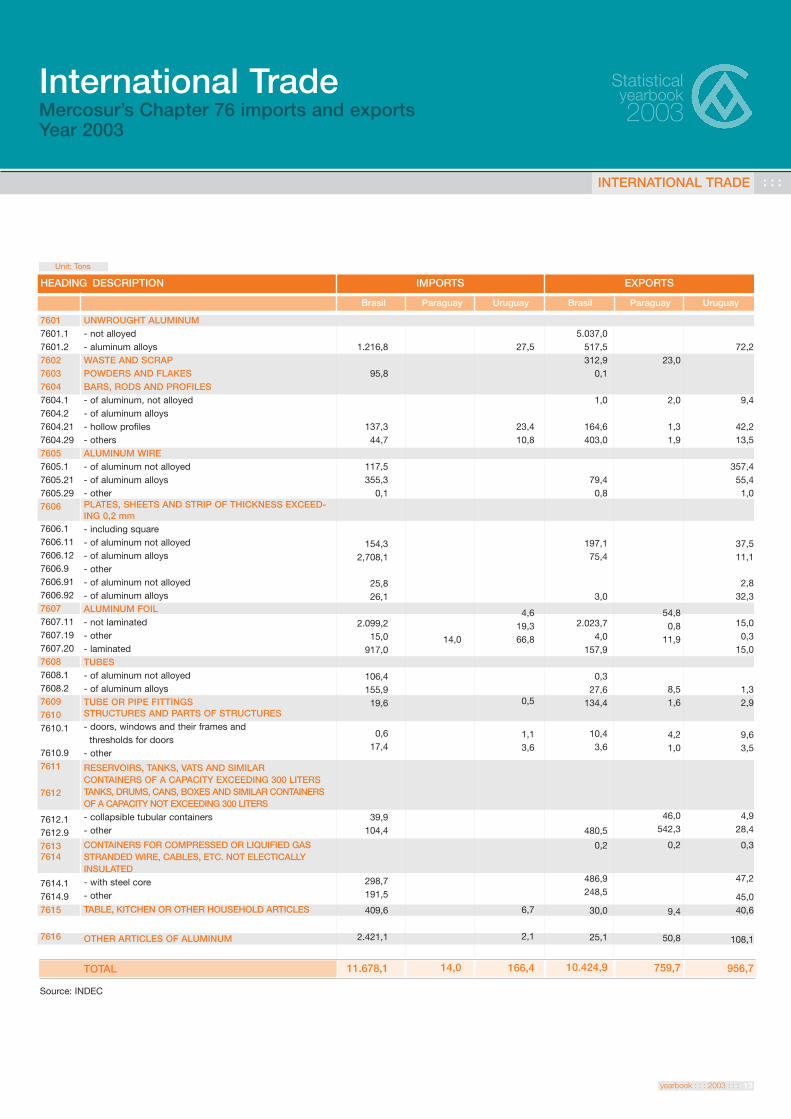
International TradeMercosur’s Chapter 76 imports and exportsYear 2003
Statisticalyearbook2003
HEADING DESCRIPTION IMPORTS EXPORTS
Brasil Paraguay Uruguay Brasil Paraguay Uruguay
UNWROUGHT ALUMINUM - not alloyed- aluminum alloysWASTE AND SCRAP POWDERS AND FLAKES BARS, RODS AND PROFILES - of aluminum, not alloyed - of aluminum alloys - hollow profiles - othersALUMINUM WIRE - of aluminum not alloyed- of aluminum alloys - otherPLATES, SHEETS AND STRIP OF THICKNESS EXCEED-ING 0,2 mm- including square- of aluminum not alloyed - of aluminum alloys - other - of aluminum not alloyed - of aluminum alloys ALUMINUM FOIL - not laminated - other - laminated TUBES- of aluminum not alloyed - of aluminum alloysTUBE OR PIPE FITTINGS STRUCTURES AND PARTS OF STRUCTURES - doors, windows and their frames and
thresholds for doors- other
RESERVOIRS, TANKS, VATS AND SIMILAR CONTAINERS OF A CAPACITY EXCEEDING 300 LITERSTANKS, DRUMS, CANS, BOXES AND SIMILAR CONTAINERSOF A CAPACITY NOT EXCEEDING 300 LITERS- collapsible tubular containers- other
CONTAINERS FOR COMPRESSED OR LIQUIFIED GASSTRANDED WIRE, CABLES, ETC. NOT ELECTICALLYINSULATED- with steel core - other
TABLE, KITCHEN OR OTHER HOUSEHOLD ARTICLES
OTHER ARTICLES OF ALUMINUM
TOTAL
76017601.17601.27602760376047604.17604.27604.217604.2976057605.17605.217605.297606
7606.17606.117606.127606.97606.917606.9276077607.117607.197607.2076087608.17608.2760976107610.1
7610.97611
7612
7612.17612.976137614
7614.17614.97615
7616
1.216,8
95,8
137,344,7
117,5355,3
0,1
154,32,708,1
25,826,1
2.099,215,0
917,0
106,4155,919,6
0,617,4
39,9104,4
298,7191,5
409,6
2.421,1
11.678,1
14,0
14,0
27,5
23,410,8
4,619,366,8
0,5
1,13,6
6,7
2,1
166,4
5.037,0517,5312,9
0,1
1,0
164,6403,0
79,40,8
197,175,4
3,0
2.023,74,0
157,9
0,327,6
134,4
10,43,6
480,5
0,2
486,9248,5
30,0
25,1
10.424,9
23,0
2,0
1,31,9
54,80,8
11,9
8,51,6
4,21,0
46,0542,3
0,2
9,4
50,8
759,7
72,2
9,4
42,213,5
357,455,41,0
37,511,1
2,832,3
15,00,3
15,0
1,32,9
9,63,5
4,928,4
0,3
47,2
45,040,6
108,1
956,7
Unit: Tons
INTERNATIONAL TRADE : : :
yearbook : : : 2003 : : : 14
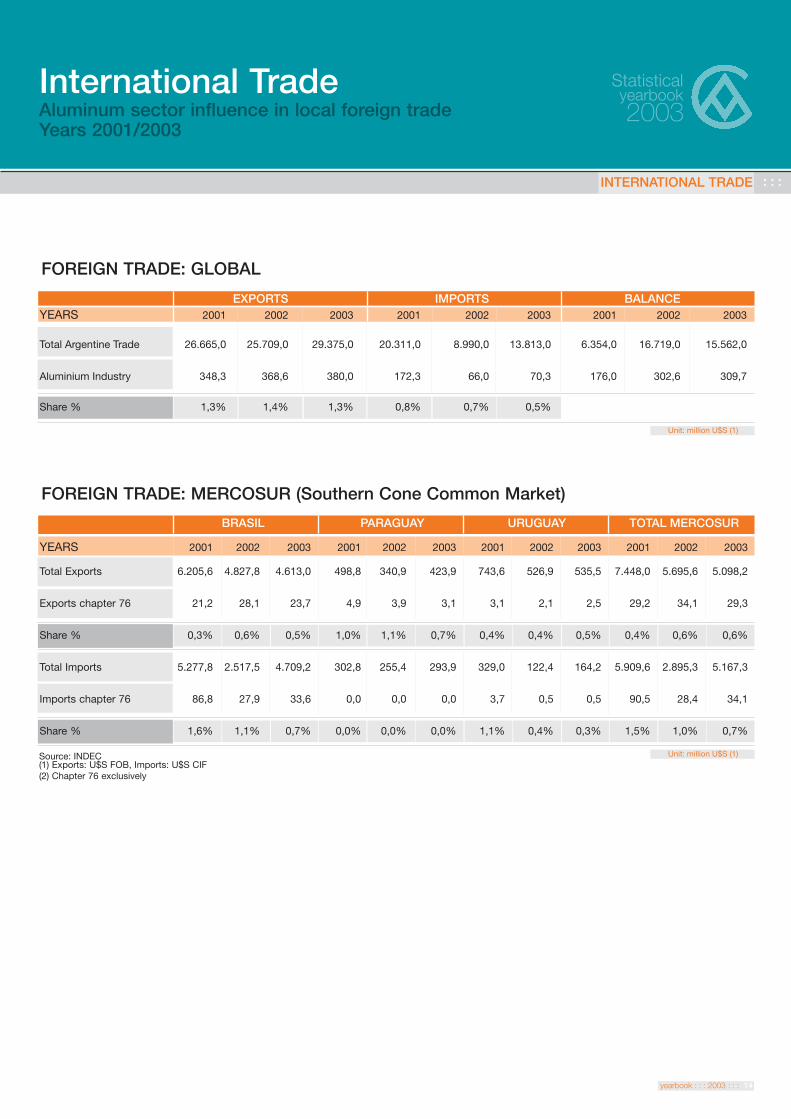
International TradeAluminum sector influence in local foreign tradeYears 2001/2003
INTERNATIONAL TRADE : : :
Statisticalyearbook2003
Source: INDEC(1) Exports: U$S FOB, Imports: U$S CIF (2) Chapter 76 exclusively
Unit: million U$S (1)
EXPORTS IMPORTS BALANCEYEARS 2001 2002 2003 2001 2002 2003 2001 2002 2003
Total Argentine Trade 26.665,0 25.709,0 29.375,0 20.311,0 8.990,0 13.813,0 6.354,0 16.719,0 15.562,0
Aluminium Industry 348,3 368,6 380,0 172,3 66,0 70,3 176,0 302,6 309,7
Share % 1,3% 1,4% 1,3% 0,8% 0,7% 0,5%
Unit: million U$S (1)
BRASIL PARAGUAY URUGUAY TOTAL MERCOSUR
YEARS 2001 2002 2003 2001 2002 2003 2001 2002 2003 2001 2002 2003
Total Exports 6.205,6 4.827,8 4.613,0 498,8 340,9 423,9 743,6 526,9 535,5 7.448,0 5.695,6 5.098,2
Exports chapter 76 21,2 28,1 23,7 4,9 3,9 3,1 3,1 2,1 2,5 29,2 34,1 29,3
Share % 0,3% 0,6% 0,5% 1,0% 1,1% 0,7% 0,4% 0,4% 0,5% 0,4% 0,6% 0,6%
Total Imports 5.277,8 2.517,5 4.709,2 302,8 255,4 293,9 329,0 122,4 164,2 5.909,6 2.895,3 5.167,3
Imports chapter 76 86,8 27,9 33,6 0,0 0,0 0,0 3,7 0,5 0,5 90,5 28,4 34,1
Share % 1,6% 1,1% 0,7% 0,0% 0,0% 0,0% 1,1% 0,4% 0,3% 1,5% 1,0% 0,7%
FOREIGN TRADE: GLOBAL
FOREIGN TRADE: MERCOSUR (Southern Cone Common Market)
Average 3 months LME Price primary aluminum
yearbook : : : 2003 : : : 15
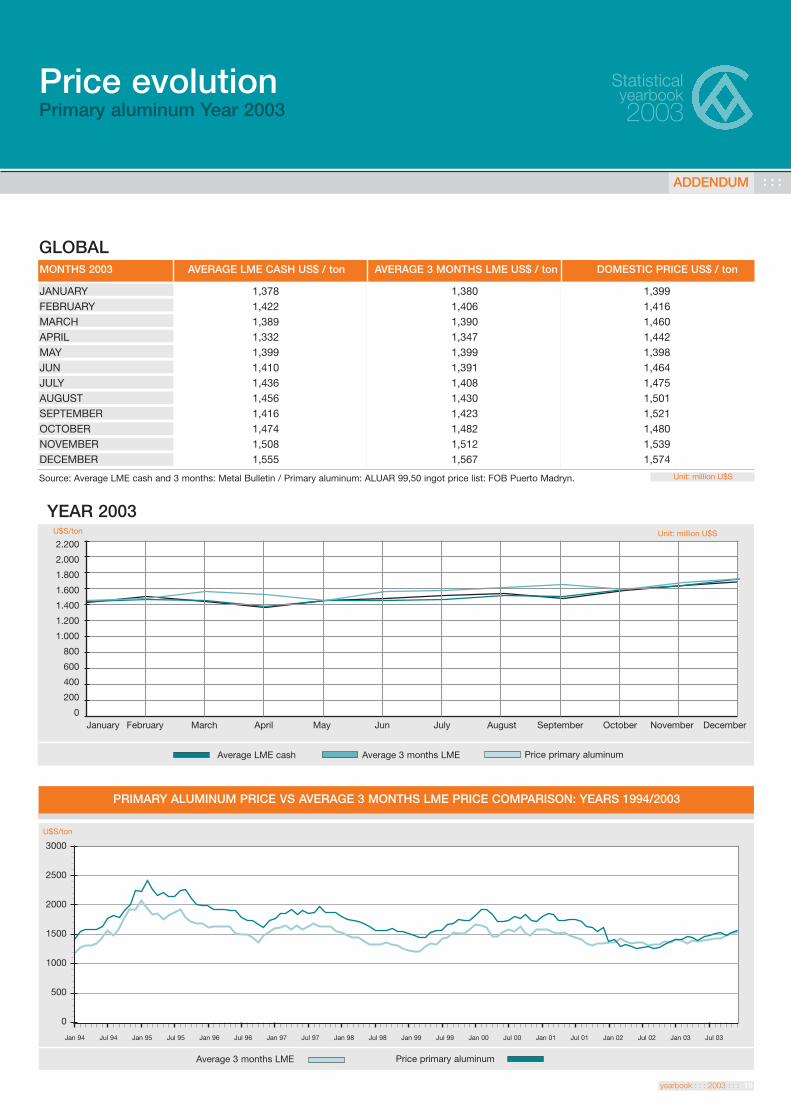
Price evolutionPrimary aluminum Year 2003
ADDENDUM : : :
Statisticalyearbook2003
Average LME cash Average 3 months LME Price primary aluminum
YEAR 2003
Unit: million U$S
MONTHS 2003 AVERAGE LME CASH US$ / ton AVERAGE 3 MONTHS LME US$ / ton DOMESTIC PRICE US$ / ton
JANUARY 1,378 1,380 1,399FEBRUARY 1,422 1,406 1,416MARCH 1,389 1,390 1,460 APRIL 1,332 1,347 1,442MAY 1,399 1,399 1,398JUN 1,410 1,391 1,464JULY 1,436 1,408 1,475AUGUST 1,456 1,430 1,501SEPTEMBER 1,416 1,423 1,521OCTOBER 1,474 1,482 1,480NOVEMBER 1,508 1,512 1,539DECEMBER 1,555 1,567 1,574
GLOBAL
Source: Average LME cash and 3 months: Metal Bulletin / Primary aluminum: ALUAR 99,50 ingot price list: FOB Puerto Madryn.
Unit: million U$S2.200
2.000
1.800
1.600
1.400
1.200
1.000
800
600
400
200
0
Jan 94 Jul 94 Jan 95 Jul 95 Jan 96 Jul 96 Jan 97 Jul 97 Jan 98 Jul 98 Jan 99 Jul 99 Jan 00 Jul 00 Jan 01 Jul 01 Jan 02 Jul 02 Jan 03 Jul 03
PRIMARY ALUMINUM PRICE VS AVERAGE 3 MONTHS LME PRICE COMPARISON: YEARS 1994/2003
January February March April May Jun July August September October November December
3000
2500
2000
1500
1000
500
0
U$S/ton
U$S/ton

yearbook : : : 2003 : : : 16
94 95 96 97 98 99 00 01 02 03
Recycling Recycling PercentageDomestic Consumption
Local TradeAluminum beverage-can sector main figuresYears 1994 2003
ADDENDUM : : :
Statisticalyearbook2003
Unit: millions
Unit: millions
Reciclyng IndexYEARS 94 95 96 97 98 99 00 01 02 03
Recycled Cans - 242 407 437 463 440 400 390 190 178
Recycling Percentage - 25% 41% 48% 50% 51% 50% 52% 78% 80%
(*) Includes imports. Source Aluplata-Rexam Argentina- Cadibsa. Figures in millon units. Unit: millions
Consumption and ProductionYEARS 94 95 96 97 98 99 00 01 02 03
Domestic Consumption (*) 950 978 994 916 924 864 797 750 245 223
Production Capacity 450 600 1.450 1.450 1.450 1.450 1.450 1.200 650 650
RECYCLING INDEX
1000
900
800
700
600
500
400
300
200
100
0
90%
80%
70%
60%
50%
40%
30%
20%
10%
0%
(*) Includes imports. Source Aluplata-Rexam Argentina- Cadibsa. Figures in millon units.
yearbook : : : 2003 : : : 17
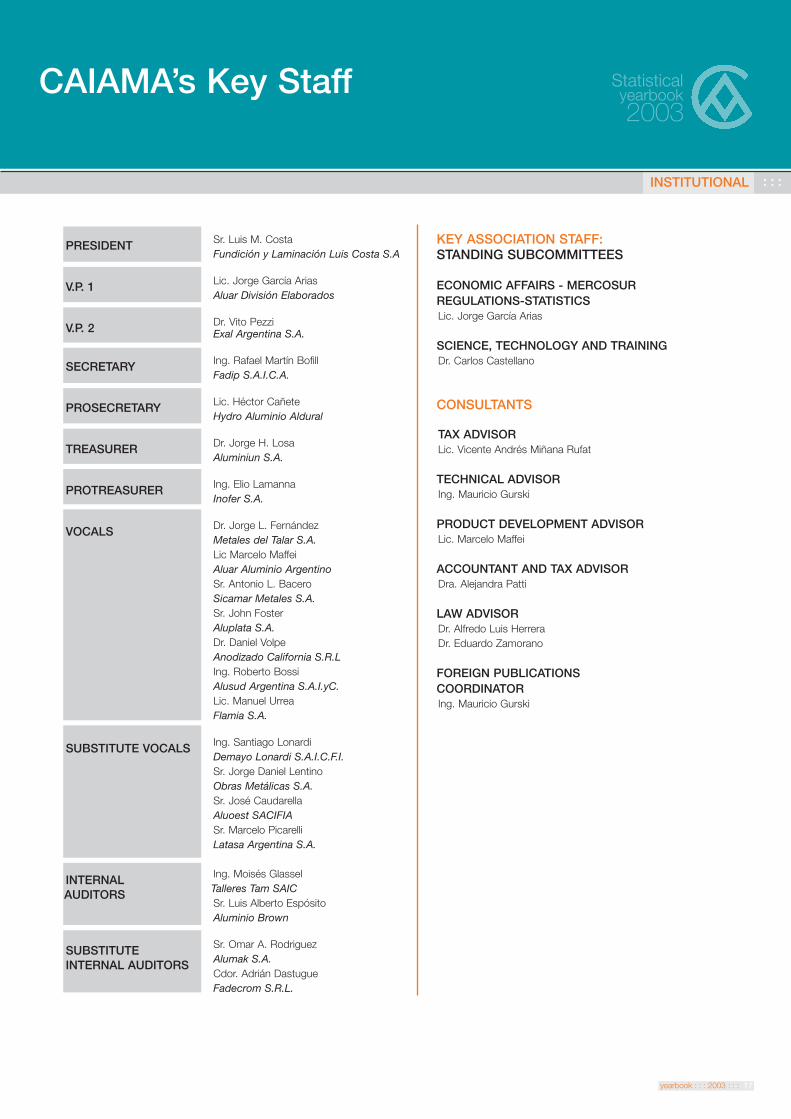
PRESIDENT Sr. Luis M. CostaFundición y Laminación Luis Costa S.A
V.P. 1 Lic. Jorge García AriasAluar División Elaborados
V.P. 2 Dr. Vito PezziExal Argentina S.A.
SECRETARY Ing. Rafael Martín BofillFadip S.A.I.C.A.
PROSECRETARY Lic. Héctor CañeteHydro Aluminio Aldural
TREASURER Dr. Jorge H. LosaAluminiun S.A.
PROTREASURER Ing. Elio LamannaInofer S.A.
VOCALS Dr. Jorge L. FernándezMetales del Talar S.A.Lic Marcelo MaffeiAluar Aluminio ArgentinoSr. Antonio L. BaceroSicamar Metales S.A.Sr. John FosterAluplata S.A.Dr. Daniel VolpeAnodizado California S.R.LIng. Roberto BossiAlusud Argentina S.A.I.yC.Lic. Manuel UrreaFlamia S.A.
SUBSTITUTE VOCALS Ing. Santiago LonardiDemayo Lonardi S.A.I.C.F.I.Sr. Jorge Daniel LentinoObras Metálicas S.A.Sr. José CaudarellaAluoest SACIFIASr. Marcelo PicarelliLatasa Argentina S.A.
INTERNAL Ing. Moisés Glassel
AUDITORS Talleres Tam SAICSr. Luis Alberto EspósitoAluminio Brown
SUBSTITUTE Sr. Omar A. Rodriguez
INTERNAL AUDITORS Alumak S.A.Cdor. Adrián DastugueFadecrom S.R.L.
KEY ASSOCIATION STAFF:STANDING SUBCOMMITTEES
ECONOMIC AFFAIRS - MERCOSURREGULATIONS-STATISTICSLic. Jorge García Arias
SCIENCE, TECHNOLOGY AND TRAININGDr. Carlos Castellano
CONSULTANTS
TAX ADVISORLic. Vicente Andrés Miñana Rufat
TECHNICAL ADVISORIng. Mauricio Gurski
PRODUCT DEVELOPMENT ADVISORLic. Marcelo Maffei
ACCOUNTANT AND TAX ADVISORDra. Alejandra Patti
LAW ADVISORDr. Alfredo Luis HerreraDr. Eduardo Zamorano
FOREIGN PUBLICATIONS COORDINATORIng. Mauricio Gurski
CAIAMA’s Key Staff
INSTITUTIONAL : : :
Statisticalyearbook2003
yearbook : : : 2003 : : : 18
INSTITUTIONAL : : :
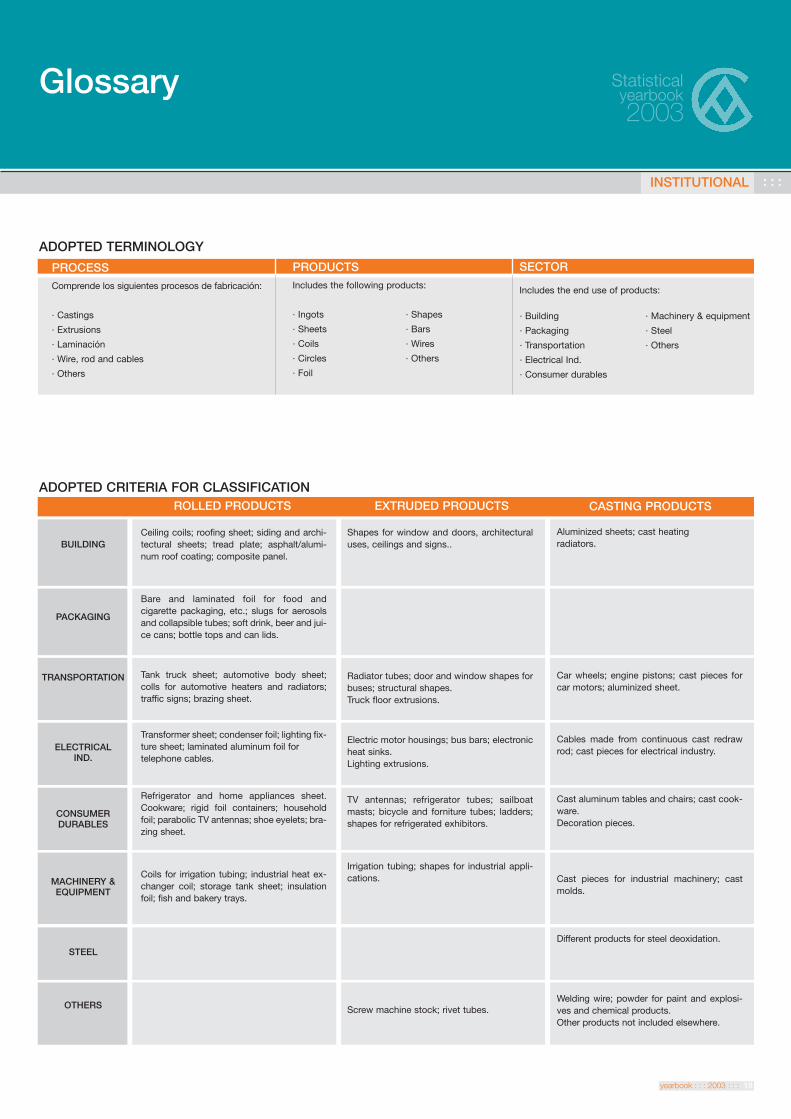
ADOPTED CRITERIA FOR CLASSIFICATION
BUILDING
PACKAGING
TRANSPORTATION
ELECTRICALIND.
CONSUMER DURABLES
MACHINERY & EQUIPMENT
STEEL
OTHERS
Ceiling coils; roofing sheet; siding and archi-tectural sheets; tread plate; asphalt/alumi-num roof coating; composite panel.
Bare and laminated foil for food andcigarette packaging, etc.; slugs for aerosolsand collapsible tubes; soft drink, beer and jui-ce cans; bottle tops and can lids.
Tank truck sheet; automotive body sheet;colls for automotive heaters and radiators;traffic signs; brazing sheet.
Transformer sheet; condenser foil; lighting fix-ture sheet; laminated aluminum foil for telephone cables.
Refrigerator and home appliances sheet.Cookware; rigid foil containers; householdfoil; parabolic TV antennas; shoe eyelets; bra-zing sheet.
Coils for irrigation tubing; industrial heat ex-changer coil; storage tank sheet; insulationfoil; fish and bakery trays.
Shapes for window and doors, architecturaluses, ceilings and signs..
Radiator tubes; door and window shapes forbuses; structural shapes.Truck floor extrusions.
Electric motor housings; bus bars; electronicheat sinks.Lighting extrusions.
TV antennas; refrigerator tubes; sailboatmasts; bicycle and forniture tubes; ladders;shapes for refrigerated exhibitors.
Irrigation tubing; shapes for industrial appli-cations.
Screw machine stock; rivet tubes.
ROLLED PRODUCTS EXTRUDED PRODUCTS CASTING PRODUCTS
Aluminized sheets; cast heatingradiators.
Car wheels; engine pistons; cast pieces forcar motors; aluminized sheet.
Cables made from continuous cast redrawrod; cast pieces for electrical industry.
Cast aluminum tables and chairs; cast cook-ware.Decoration pieces.
Cast pieces for industrial machinery; castmolds.
Different products for steel deoxidation.
Welding wire; powder for paint and explosi-ves and chemical products.Other products not included elsewhere.
PROCESSComprende los siguientes procesos de fabricación:
· Castings
· Extrusions
· Laminación
· Wire, rod and cables
· Others
PRODUCTSIncludes the following products:
· Ingots · Shapes
· Sheets · Bars
· Coils · Wires
· Circles · Others
· Foil
SECTOR
Includes the end use of products:
ADOPTED TERMINOLOGY
· Building
· Packaging
· Transportation
· Electrical Ind.
· Consumer durables
· Machinery & equipment
· Steel
· Others
Glossary Statisticalyearbook2003
yearbook : : : 2003 : : : 19
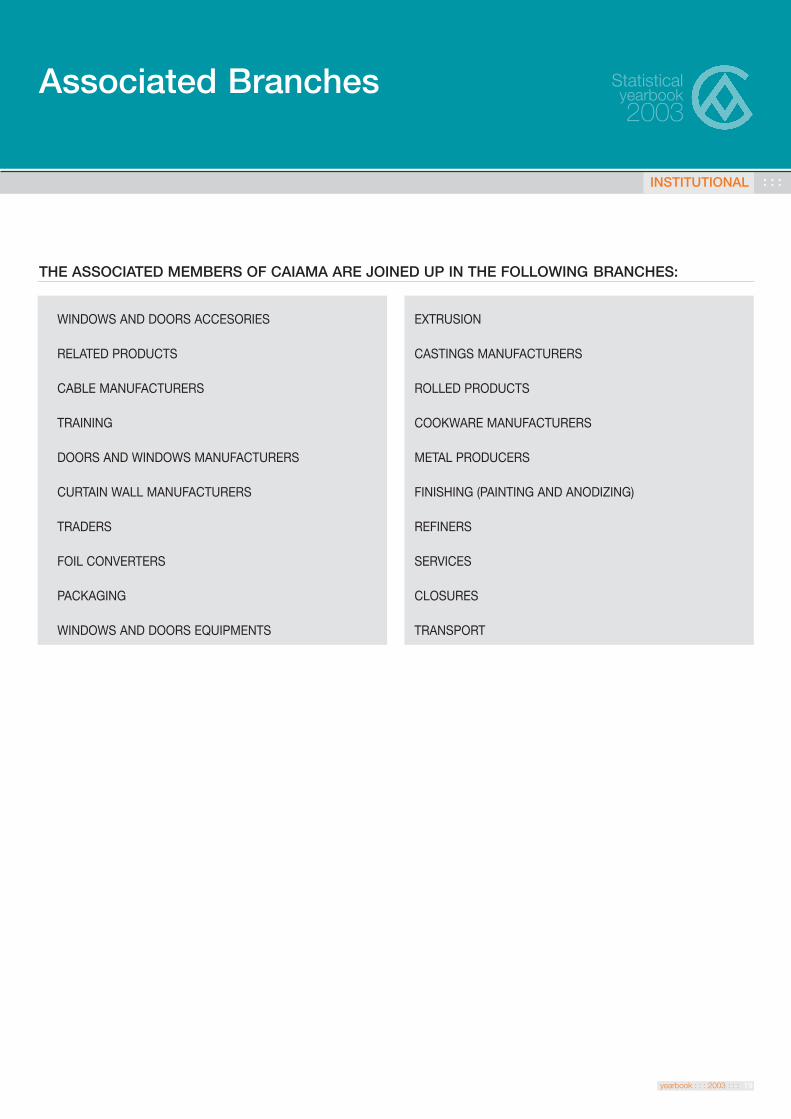
Associated Branches
INSTITUTIONAL : : :
Statisticalyearbook2003
WINDOWS AND DOORS ACCESORIES
RELATED PRODUCTS
CABLE MANUFACTURERS
TRAINING
DOORS AND WINDOWS MANUFACTURERS
CURTAIN WALL MANUFACTURERS
TRADERS
FOIL CONVERTERS
PACKAGING
WINDOWS AND DOORS EQUIPMENTS
EXTRUSION
CASTINGS MANUFACTURERS
ROLLED PRODUCTS
COOKWARE MANUFACTURERS
METAL PRODUCERS
FINISHING (PAINTING AND ANODIZING)
REFINERS
SERVICES
CLOSURES
TRANSPORT
THE ASSOCIATED MEMBERS OF CAIAMA ARE JOINED UP IN THE FOLLOWING BRANCHES: