Embed Size (px)
Citation preview

UK Film Council10 Little Portland StreetLondon W1W 7JGT +44 (0)20 7861 7861F +44 (0)20 7861 7862
This Statistical Yearbook is available online atwww.ukfilmcouncil.org.uk
“IT’S AWRAP”
STATISTICAL YEARBOOK2006/07
“ANDACTION”
UK
FILMCO
UN
CILSTATISTIC
AL
YEARBO
OK
2006/07
Introduction 02Executive summary 05
1 The box office 101.1 Admissions 121.2 Box office earnings 161.3 Film releases and box office revenues 161.4 Country of origin of film releases 18
2 Top films in 2006 222.1 The top 20 films 242.2 The top 20 UK films 252.3 Best weekend performances of UK films 26
3 Top films 1997–2006 283.1 Top films in the UK, 1997–2006 303.2 Top UK films of the last decade 31
4 UK films internationally 324.1 UK films worldwide 344.2 UK films in North America 354.3 UK films in Europe 36
5 UK talent and the global box office 385.1 UK story material 405.2 UK actors 435.3 UK directors 44
6 Release history of UK films 466.1 UK films released in the UK
and the Republic of Ireland 486.1.1 Types of certification:
Schedule 1 and co-production 496.1.2 UK majority and minority co-productions 506.1.3 Independent and studio films 506.2 UK films released internationally 516.2.1 Types of certification:
Schedule 1 and co-production 526.2.2 UK majority and minority co-productions 536.2.3 Independent and studio films 546.3 Release opportunities analysis 546.3.1 Types of certification:
Schedule 1 and co-production 556.3.2 UK majority and minority co-productions 566.3.3 Independent and studio films 566.4 Financial success analysis 57
7 Language, genre and classification 587.1 Foreign language films 607.2 Genre 647.3 Classification 68
8 Distribution 728.1 Distributors in 2006 748.2 Distributors, 2002–2006 758.3 Weekend box office 768.4 Release costs 77
9 Exhibition 789.1 UK screens 809.2 Screen location 819.3 Multiplexes 849.4 Programming 869.5 Exhibitors 889.6 Exhibitor revenues 899.7 Digital projection 899.8 Community cinema provision
in the UK, 2006 909.8.1 BFFS membership survey 919.8.2 Community cinema provision 92
10 Audiences 9610.1 Cinema audience by gender 9810.2 Film preferences by gender 9810.3 Cinema audience by age 10010.4 Film preferences by age 10010.5 Cinema audience by social group 10410.6 Film preferences by social group 10410.7 Film audiences by ethnicity 10510.8 Film audiences by disability 10710.9 Film preferences by region 10710.10 Film download and digital piracy by age 10910.11 Comparative profiles of cinema audiences
and audiences for film on television 11010.12 Frequency by age of cinema-goers
watching and buying DVDs, going to thecinema and watching television 110
11 Film on DVD 11211.1 Film in the video rental market 11411.2 Film in the retail video market 11611.3 Hardware 116
12 Film on UK television 11812.1 Programming 12012.2 Peak time 12112.3 Audiences for film on network television 12212.4 Films on multi-channel television 12412.5 The audience for film on
television, 1997–2006 12712.6 The value of feature film to broadcasters 128
13 The UK film market as a whole 13013.1 The UK filmed entertainment market
as a whole 13213.2 The UK market in the global context 13213.3 The evolution of UK film revenues,
1998–2006 13313.4 The impact of other digital
leisure activities 13513.5 Has the fall in the length of the theatrical
window reduced cinema admissions? 13513.6 The impact of film piracy 136
14 Film production 13814.1 The value of UK production in 2006 14014.2 Inward, domestic and UK co-production
features, 1992–2006 14114.3 Budget trends 14414.4 Size distribution of budgets 14414.5 Big-budget productions, 2002–2006 14614.6 UK share of expenditure 14614.7 UK co-productions by country of shoot 14614.8 Production company activity levels 14814.9 US studios’ involvement in
inward features 14914.10 The new UK film tax incentive 149
15 Film industry companies 15015.1 Number of companies in the film
and video industries 15215.2 Changing size distribution of
film companies 15215.3 Leading film companies in the
UK and Europe 15515.4 Leading film production companies
in the UK and Europe 157
16 UK film exports 16016.1 UK film exports, 1995–2005 16216.2 UK film imports, 1995–2005 16216.3 The UK film trade balance, 1995–2005 16316.4 UK film export markets 16316.5 UK film exports compared with the
global market for filmed entertainment 16416.6 The geographical distribution of the
UK’s film trade surplus 165
17 Employment in the film and video industries 166
17.1 The workforce 16817.2 The film production workforce survey 17017.3 The workplace location 17417.4 The scale of the workplace 175
Glossary 178Acknowledgements 180Sources 180
2 | UK Film Council Statistical Yearbook
Introduction
2006: The year in review
2006 was a year in which online and mobileconsumption of audio-visual entertainment began tomake an impact on film, but not yet in a way that film could compete on an equal footing with music,user-generated content and social networking. The UKis a huge consumer of film, but the initial effect of thelatest digital revolution has been to compress ratherthan expand film audiences. The evidence and reasonsfor this are examined in this Yearbook – in particular, in Chapters 1 (Box office), 11 (Film on DVD), 12 (Filmon television) and 13 (The film market as a whole). In short, audiences are racing into the new digitalentertainment arena while the film industry strugglesto overcome barriers such as slow download speeds,unresolved rights and security issues, and undevelopedplatforms. In a few years, these will be overcome, but in the meantime a proportion of consumer timeand money has migrated away from film and into the expanding world of opportunity offered by theinternet and its associated devices.
How big is the audience for film in the UK?
While most media attention is paid to the cinemarelease of films, it is via television (Chapter 12) thatpeople watch most of the films they see. In the UK in2006, the total audience for film on television was astaggering 3.3 billion, 21 times larger than the cinemaaudience and three or four times larger than theaudience for DVD/video.
The top film on TV in 2006 was Pirates of theCaribbean: The Curse of the Black Pearl which drew a BBC1 audience of 9.5 million, approximately one-sixth of the entire UK population. Its success wasdue in part to the wealth of British actors appearing inthe film including Keira Knightley, Orlando Bloom, Jack Davenport, Jonathan Pryce and Mackenzie Crookand the American actor Johnny Depp playing a British character and modelling his performance on a member of the Rolling Stones.
British films attract around one-fifth of the televisionfilm audience – about 660 million viewing occasions,that is about 10 per person per year. Of those viewingoccasions, roughly one-quarter are for recent UK films(UK films theatrically released within the last eightyears), suggesting that the Government’s investmentin UK film reaps a substantial dividend in terms ofaudience enjoyment.
Who watches films in the UK?
The majority of the theatrical audience is young (nearly half under the age of 25), but the olderaudience (people aged 45 and over) has grownsubstantially over the last decade – from 19 million to38 million and from 14% to 24% of the total theatricalaudience. Growth in the older audience seems to havebeen driven both by the ageing of the population andby the wider choice of films on offer. The number oftheatrical releases increased from 327 in 1998 to 505 in 2006. And Chapter 1 notes a significant trend:that the plateau in cinema admissions is confined tothe top 50 titles, while box office takings for filmsranked 51–150 and 151 onwards have continued to grow strongly.
The television audience for film has a much older profile:only 16% under the age of 25 and 56% over the ageof 45, reflecting the preference of the older agegroups for home-based audio-visual entertainment.
The film audience is diverse. It is roughly 50/50 male and female and minority ethnic groups are well represented (Chapter 10). As one would expect,the audience for individual films varies widely,depending on the genre and type of film and thelocation of the cinema. Disabled people haveproportionate access to retail DVD/video but are under-represented in cinema access and DVD/video rental.
A small, but growing, part of the audience enjoysforeign language films, of which there were 171releases in 2006 in 29 languages, taking 3.5% of thebox office. Hindi was the most common foreignlanguage in terms of number of releases, followed by French, Tamil and Spanish. The top four foreignlanguage films in 2006 were Volver (Spain), Pan’sLabyrinth (Mexico/Spain/USA), Kabhi Alvida Naa Kehna(India) and Hidden (France). Foreign language filmswere popular with film societies, of which there werenearly 300 in the UK in 2006. While the totalattendance at film society screenings was only 116,000(Chapter 9), film societies plug a gap in cinemaprovision for film enthusiasts and are often located inrural or remote rural locations.
At this stage, the audience most attracted to new digital entertainment is young people and, as reported in Chapter 13, there is evidence of a shiftfrom DVD/video towards internet use among 15–24 year olds.
2006: The year in review | 3
This also emerges from research into film theft(Chapter 13) which indicates a surge in downloading/burning, predominantly in the 15–34 age group. The only factors holding many people back fromdownloading are not knowing how to do it or findingit ‘too much effort’, responses that do not augur wellfor containing online film theft when technology and skills improve.
One potential culprit for the plateau in cinemaadmissions is the shorter gap between a film’s debut in the cinema and its release on DVD/video but research reported in Chapter 13 suggests that this has not, as yet, been the cause of reduced boxoffice takings.
Audiences continue to enjoy UK films
As reported last year, 2005 was a record year for UKfilms, which took one-third of the box office. The 2006performance was not quite as strong – UK films took19% of the box office – but the year finished on a highnote with the latest Bond film, Casino Royale, toppingthe charts with takings of £55.5 million (Chapter 2).The end of the year also saw the critical and awardsuccesses for The Queen (director Stephen Frears,starring Helen Mirren) and The Last King of Scotland(director Kevin Macdonald, starring Forest Whitakerand supported by the UK Film Council).
Earlier in 2006, two other UK films, Ken Loach’s TheWind that Shakes the Barley and Andrea Arnold’s RedRoad (both supported by the UK Film Council) tookthe two top prizes at the Cannes Film Festival.
On network television, the top three UK films in 2006 were Calendar Girls (8 million viewers), Mrs Henderson Presents (7 million viewers) and Love Actually (5.5 million viewers).
Taking UK film to the world
UK films were once again seen by huge audiencesaround the world. The UK film share of global cinema takings was 8.5%, or US$2.2 billion, equal toapproximately 500 million admissions (Chapter 4). The new Bond film with Daniel Craig, Casino Royale,thrilled audiences across the world, sparking televisioncoverage and feature articles on ’Britishness’ fromSouth Africa to South America to South Korea.International audiences also enjoyed relationshipdramas such as Notes on a Scandal and Venus, thedynastic political films The Queen and The Last King of Scotland, Paul Greengrass’s evocation of 9/11,United 93 and Aardman Animation’s children’s film,Flushed Away.
The international reach of UK film was confirmed bythe latest (2005) trade figures released by the Office forNational Statistics, showing a jump in UK film exportsto £967 million, contributing a trade surplus of £163 million to the UK’s balance of payments (Chapter 16).
Two-thirds of the export income came from royaltiesand one-third from the export of production services,a figure likely to increase in 2006 due to the recoveryof inward investment into UK film production (Chapter14). Inward investment – into films such as CasinoRoyale, Harry Potter and the Order of the Phoenix,His Dark Materials: The Golden Compass, The BourneUltimatum – jumped in 2006 to £570 million asuncertainty over the UK’s film tax regime abated. The Government put in place a new tax relief forculturally British film which came into force on 1 January 2007, while transitional provisions coveredfilms already in production in 2006.
2006 also saw the production of 50 domestic features (including Mr Bean’s Holiday and Hot Fuzz,the 2007 box office leaders at the time of writing) and 57 co-productions with a combined UK spend of £273 million.
The reach of UK talent goes further than British films,as UK actors, directors and writers work on filmsproduced in the USA and other countries (Chapter 5).Thirty-one of the top 200 films at the world box officein 2001–2006 were based on stories and characterscreated by British writers including JK Rowling (theHarry Potter films), JRR Tolkien (The Lord of the Rings),CS Lewis (The Chronicles of Narnia), Brian Aldiss (A.I. Artificial Intelligence), Patrick O’Brian (Master andCommander: The Far Side of the World) and SachaBaron Cohen (Borat). British directors directed 19 ofthese top 200 films and British actors appeared inmore than half of them. Ridley Scott was the most-frequent director and Orlando Bloom and Sir Ian McKellan the most frequent actors.
Better quality, better marketing
There were signs of an improvement in the quality andmarketing of British films. As Chapter 6 shows, 60% ofUK films certified in the years 2000 to 2005 had beenreleased internationally by March 2007 and thereleased films accounted for 82% of the total budgetof all UK films certified in that period. For Schedule 1films (films that pass the standard test of ’Britishness’in the Films Act 1985) the international release rateimproved from 60% to 70% over the period. Therewas also a 25% improvement in the proportion ofinternational release opportunities achieved by Britishfilms between 2000 and 2005.
Low cost inflation
These improved results have been achieved without,apparently, any significant increase in production costs. The median production budget for domestic UKproductions actually fell from £3 million in 2003 to£1.5 million in 2006 and the median co-productionbudget has been constant for the last three years(Chapter 14). Similarly, the 2006 Skillset filmproduction workforce survey did not show any signsof inflation in wages and salaries. The size distributionof incomes was about the same as it was when thelast survey was completed in 2003/04 (Chapter 17)with half the respondents reporting incomes of under£20,000 per year. This is despite the concentration ofthe industry around London – 76% of the productionworkforce was based in London and the South East –where one might expect higher rates to prevail.
The workforce diversity challenge
Compared to the UK workforce as a whole, the filmproduction workforce is more concentrated in the25–50 age brackets. There are fewer workers under 25or over 50 compared with the UK average (Chapter17). There is also a marked gender difference: themajority of women in the industry are under 35,whereas two-thirds of the men are over 35. Thisstatistic supports anecdotal evidence that manywomen drop out of the industry in their mid-thirtiesdue to the long, unsocial hours of the productionsector. The sector has a task on its hands to find waysof making its working practices more family-friendly.
Disabled workers are under-represented in the industry(only 3% in 2006) and, most challenging of all, the 2006 Skillset production workforce survey showed thatthe minority ethnic group profile in the industry didnot improve over the last three to four years. Only 5%of the film production workforce was from a minorityethnic background, compared to 7% in the UKworkforce as a whole and 24% in the Londonworkforce, the most appropriate comparator due to the concentration of film production in London.
Research in 2006 into ethnicity and gender in the film and wider audio-visual sectors (publicationforthcoming) showed that informal recruitmentpersists, affecting women trying to break into under-represented roles (such as writing and directing) and people from minority ethnic backgrounds who are not already connected to these informal networks.For this reason, the UK Film Council has challenged the sector to make faster progress on diversity in 2006 and successive years by setting up a Leadershipin Diversity Forum to plan practical measures toimplement 2005’s Equality Charter for Film.See http://www.ukfilmcouncil.org.uk/information/aboutus/diversity/
What’s new in this Yearbook?
Regular readers of the UK Film Council StatisticalYearbook will notice a number of changes this year, in particular:
• A new analysis of the success of UK film talentaround the world (Chapter 5).
• A new analysis of the release history of UK filmssince 2000 (Chapter 6).
• Extension of information on exhibition to cover film societies and community cinema (Chapter 9).
• The reintroduction of an analysis of film on television(Chapter 12).
• An analysis of the size and trends in the UK filmmarket as a whole covering theatrical, DVD/video and television (Chapter 13).
• Expanded coverage of the UK’s overseas trade in film(Chapter 16).
Within the limits of data availability, the RSU isdeveloping the Yearbook to meet the business,economic, cultural and policy needs of UK film.Feedback is welcome and, if you would like to discuss any of the content with us, or makesuggestions, please contact us at the number or email address below. The information in this Yearbook is also published on our website –www.ukfilmcouncil.org.uk
Finally, a special thank you to all our data suppliers,who have allowed us to publish the statistical resultsarising from their surveying and tracking activities withsuitable protections for the confidentiality of individualrespondents and the commercial interests of thesuppliers. This is a valuable service to the public andeveryone connected with UK film.
Sean Perkins, Research Executive. Edmond Ng, Senior Research Executive.David Steele, Head of Research and Statistics.
About the Research and Statistics Unit
The Research and Statistics Unit (RSU) providesresearch data and market intelligence to anyone with an interest in UK film and film in the UK. Research enquiries should be directed to the RSU (+44 (0)20 7861 7940, [email protected]).
All other enquiries should be made to the UK Film Council Communications Department (+44 (0)20 7861 7861,[email protected]).
4 | UK Film Council Statistical Yearbook
2006: The year in review | 5
Executive summary
The box office
More than 500 films were released in 2006 with onein five of these a UK production. Despite the widerchoice of film on offer, audiences dipped for thesecond successive year. At the same time, market sharefor the top 100 films since 1997 shows audiences forfilms are diversifying.
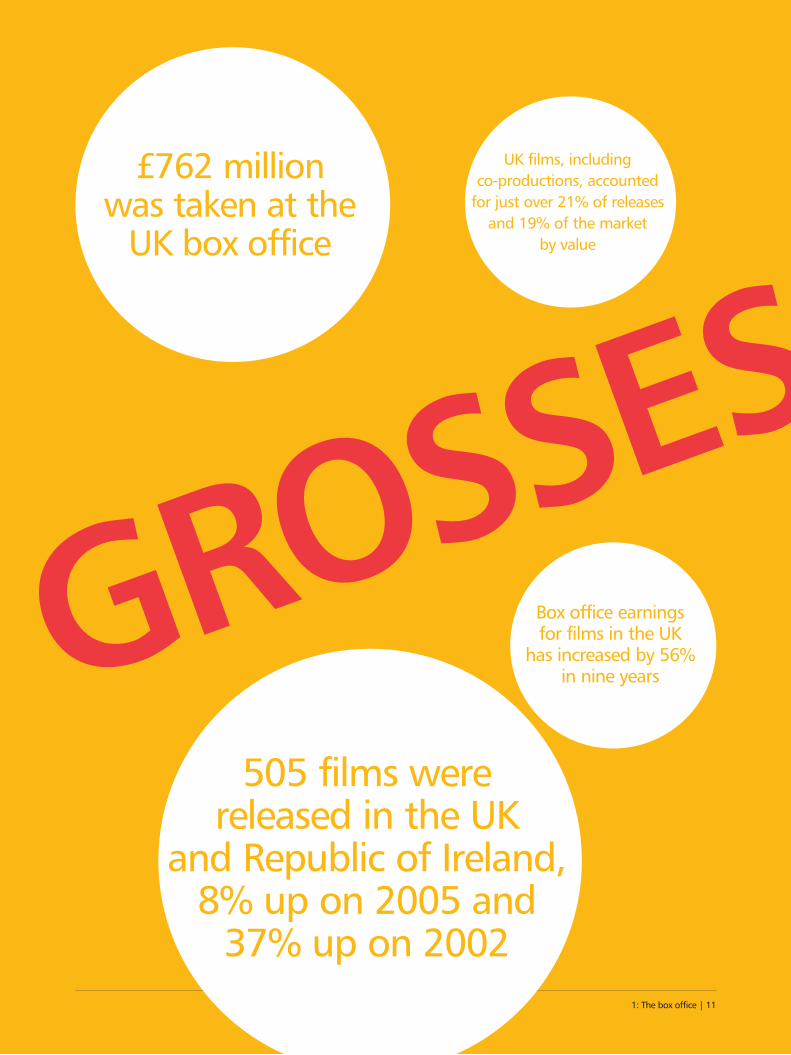
• UK cinema admissions were 157 million in 2006,down 5% on 2005.
• Box office earnings were £762 million, down 1% on 2005.
• The top 100 films earned almost 89% of the grossbox office.
• 505 films were released in the UK and Republic ofIreland, 8% up on 2005 and 37% up on 2002.
• UK films, including co-productions, accounted forjust over 21% of releases and 19% of the market by value.
Top films in 2006
Casino Royale and Pirates of the Caribbean: DeadMan’s Chest dominated the charts in 2006. Three UKfilms appeared in the top 20 but many achieveddistinction through film awards.
• The top 20 UK films grossed £151 million at the UK box office.
• Three UK films featured in the top 20 – CasinoRoyale, The Da Vinci Code and Flushed Away.
• Casino Royale was the biggest film of the year,earning over £55 million.
• The USA was involved in every production in the top 20 films at the UK box office, partnering the UK on three.
• UK films topped the weekly box office charts for fiveweeks in 2006.
Top films 1997–2006
Two 2006 releases – Casino Royale and Pirates of theCaribbean: Dead Man’s Chest – entered the top 20films of the decade. Harry Potter and Lord of the Ringsfilms dominated the decade, while UK writers providedthe inspiration for 12 out of the top 20 films.
• The top 20 films of the decade included two 2006release: Casino Royale and Pirates of the Caribbean:Dead Man’s Chest.
• Casino Royale became the second highest grossingUK film of all time.
• The Da Vinci Code was the only other 2006 UKrelease in the last decade’s UK top 20.
• Harry Potter and Lord of the Rings films took sevenplaces in the top 13 films of the decade.
• 8 of the top 20 films were UK/USA collaborations.
• 12 of the top 20 films were based on stories andcharacters created by UK writers.
UK films internationally
After last year’s outstanding success in the globalmarketplace, UK films delivered a more averageperformance in 2006. Even so, the top 10 UK filmsgrossed almost $2000 million worldwide.
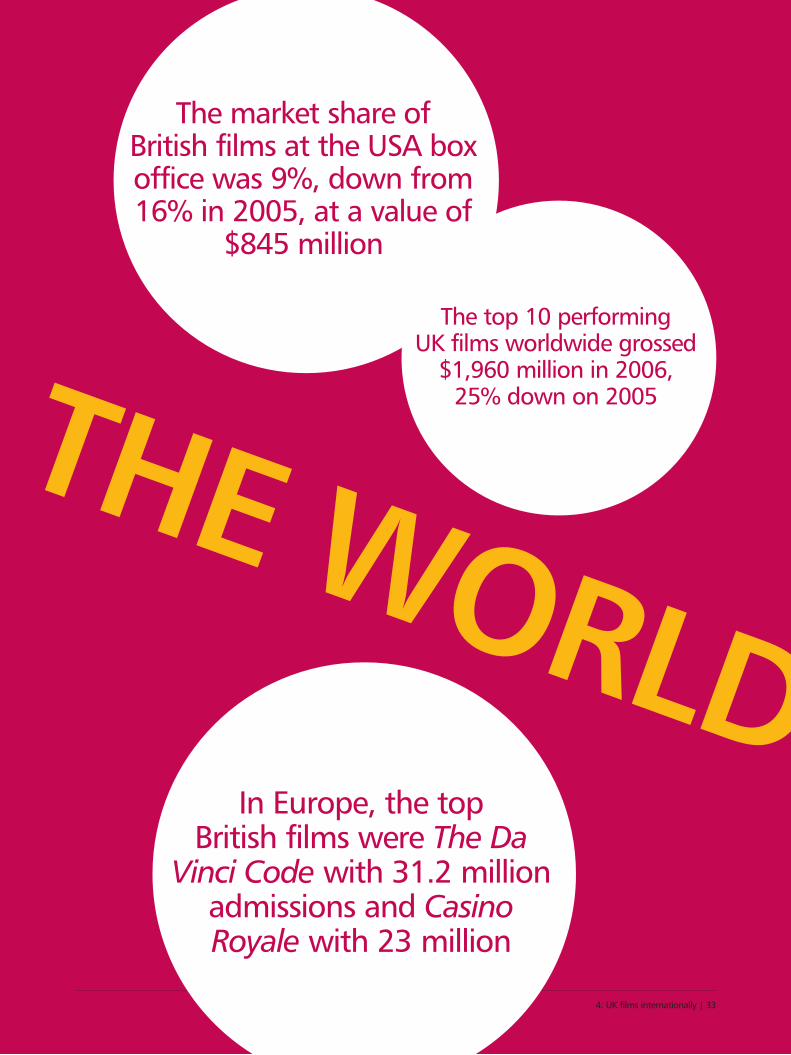
• The top 10 performing UK films worldwide grossed$1,960 million in 2006, 25% down on $2,599million in 2005.
• In Europe the top British films were The Da VinciCode with 31.2 million admissions and CasinoRoyale with 23 million.
• The Da Vinci Code was the strongest UK film at theworldwide box office.
• UK films accounted for 12% of releases in the USA,unchanged from 2005.
• The market share of British films at the US box office was 9%, down from 16% in 2005, at a valueof $845 million.
• Worldwide the gross box office for films of allcountries of origin increased by 11% in 2006 to $26 billion.
UK talent and the global box office
Stories created by UK writers have dominated theglobal box office over the last few years and Britishacting talent has also played a starring role in manyrecent blockbusters helping to project strong images of UK cultural and national identity across the world.
• 31 of the top 200 films worldwide from 2001-2006are based on stories and characters created by UKwriters and have earned more than $13 billion.
• Six of the top 10 global box office successes of thelast six years are based on the novels of British writersJRR Tolkien and JK Rowling.
• UK acting talent feature in more than half of the top200 films released worldwide since 2001.
• British directors have directed 19 of the 200 biggestfilms of the last six years.
Release history of UK films
The cinema release of a feature film has an importantinfluence on its performance in later release windowssuch as retail and rental DVD and video-on-demand.However, not all UK films get a theatrical releaseinternationally or even locally.
• International UK film releases increased as aproportion of international release opportunities.
• 60.2% of UK films were internationally releasedaccounting for 82.3% of total UK film budgets.
• Almost half (47.5%) of UK films certified between2000 and 2005 and accounting for 71.8% of total UKfilm budgets have been released in the UK and theRepublic of Ireland.
• The international release rate of British films certified between 2000 and 2005 improved from60% to 70%.
• Schedule 1 British films were more likely to betheatrically released in the UK, Ireland andinternationally than UK co-productions.
• Almost 100% of UK studio films have achieved aninternational theatrical release compared with just57% of independent UK films.
Language, genre and classification
Film culture in the UK is increasingly diverse. The recordnumber of films on release in 2006 gave audiencesaccess to the best cinema from across the globe, in 30different languages, as well as films varying in subjectmatter, genre and style.
• 171 foreign language films were released, 33.9% oftotal releases, down from 43.5% in 2005.
• Films in 30 different languages (including English)were released in the UK in 2006.
• Foreign language films accounted for over a third of all releases but just 3.5% of the total UK box office gross.
• Foreign language films averaged 17 sites at theirwidest point of release, compared to 162 for Englishlanguage films.
• Hindi was the most common foreign language interms of the number of releases.
• Comedy, traditionally popular with audiences,accounted for 24% of releases and 27% of the boxoffice gross.
• Drama films made up the highest proportion ofreleases (30.5%) but only shared 10.1% of the totalbox office.
• More documentaries were released in 2006 than2005 (32) but their box office share fell to 0.4%.
• More ‘15’ certificate films were released than anyother category but ‘12A’ films accounted for thelargest box office share.
Distribution
A small number of large companies dominate thedistribution of films in the UK investing millions ofpounds in attracting audiences to the cinema.
• The top ten distributors had a 96% share of themarket in 2006, 1% down on 2005.
• Weekends (Friday to Sunday) accounted for 60% of the box office.
• Opening weekends represented 27% of the total box office.
• Total advertising spend increased by 3.3% to £171.3 million.
6 | UK Film Council Statistical Yearbook
Exhibition
For most film-lovers, the best way to enjoy film is onthe big screen, with a large audience. The fortunes ofthe exhibition sector are therefore an importantindicator of the vitality of film culture. On this basis,film is thriving, with the number of screens increasingyear on year since 2002. Screenings run by providersserving their local communities, including film societiesand mixed-use venues are also an important part of theUK’s diverse exhibition landscape.
• The UK had 3,440 screens in 697 cinemas, 83 morethan 2005 (5.8 screens per 100,000 people).
• London had the highest number (15%) of screensoverall followed by the South East and North West.
• Only 7% of screens were dedicated to ‘specialised’films, with 0.5% showing South Asian films.
• The proportion of screens in multiplexes remainedunchanged at 73%.
• Northern Ireland had the highest number of screensper 100,000 people, and England had the lowest.
• The five largest exhibitors operated 75% of screens.
• The average ticket price was £4.87.
• The UK had 148 digital screens, over two and halftimes more than in 2005.
• Film societies attracted over 225,000 admissions.
• Rural areas had 42% of the UK’s film societies.
Audiences
Despite the ready availability of home-basedentertainment, going to the cinema is still a highlypopular activity, particularly for younger age groups.
• The cinema audience for the top 20 films in 2006 waspredominantly young, with the 7-34 age group (40%of the population) making up 64% of the audience.
• 60% of the UK population said they went to thecinema at least once a year and 18% went once amonth or more.
• There was an even split between men and women in the cinema audience of the top 20 films.
• Dramas and comedies with women in leading roles plus family films appealed most to the female audience.
• Action-led films held stronger male appeal.
• Younger age groups preferred action, animation andcomedy films while drama appealed more to theover-35s.
• Minority ethnic groups were equally or over-represented in the film audience, except for retailDVD/video where they were under-represented.
• Disabled people were under-represented in the filmaudience, except for retail DVD/video.
• 12% of cinema-goers reported they had downloadeda film for free off the Internet.
• The audience for film on television was older thanthat of the cinema audience and skewed towards theC2 and DE social groups.
Film on DVD
Films reach a wide audience through their release onvideo, though home viewers do not always choose thebox office favourites. Home viewing is now almostentirely in DVD format, with even newer digitaltechnologies edging their way into the market.
• 116 million DVDs were rented in 2006 and 227million DVDs were sold.
• The total value of the rental and sales market in 2006was £2.5 billion, down 7% on 2005 although DVDsales increased by 7%.
• Film accounts for 99% of the DVD rental market and72%% of DVD sales.
• British films accounted for 17% of all DVD rentaltransactions and 19% of sales.
• Flightplan was the top rental title and Pirates of the Caribbean: Dead Man’s Chest was the highestDVD seller.
• Online DVD rental accounted for 24% of rentaltransactions.
• 80% of households now own a DVD player comparedwith only 25% five years ago.
2006: The year in review | 7
Film on UK television
Opportunities to watch film on television have neverbeen wider, with multi-channel television gaining inpopularity. Viewing patterns have correspondinglyfragmented. Even so, one in six people in the UKwatched the year’s favourite TV film, Pirates of theCaribbean: The Curse of the Black Pearl, on BBC1.
• 2,011 films were shown on terrestrial channels in2006, down 14% on 2005 but the proportion of UKfilms increased.
• 438 UK films were shown on terrestrial television(22% of the total).
• 41 foreign language films were shown (2% of the total).
• An average of 1.5 million people watched each filmon peak time television (down from 2 million in2005), compared to median audiences for the top 50 films at the cinema of 1.7 million.
• Multi-channel television accounted for over 33% of the UK television audience in 2006, up from 30%in 2005.
• The top terrestrial film was Pirates of the Caribbean:The Curse of the Black Pearl on BBC1, with 9.5 millionviewers – one in six of the UK population.
• The top film on subscription movie channels was The Chronicles of Narnia: The Lion, the Witch and the Wardrobe on Sky Movies (650,000 viewers).
• The top film on multi-channel overall was DieAnother Day on ITV2 (1.6 million viewers).
• There were 3.3 billion viewings of feature film acrossall television formats (except pay-per-view) in 2006 –over 21 times the number of cinema but down from3.9 billion in 1997.
• There were nearly five times more films on televisionin 2006 than a decade ago, largely as a result ofsubscription film channels.
• The value of film to broadcasters was approximately£1.07 billion.
The UK film market as a whole
While much of the publicity and media attention forfilms occurs around the cinema release, it is the filmmarket as a whole that recovers the costs of productionand marketing and makes profits (or not) for filmproducers and investors. The sale and rental ofDVDs/videos are particularly important for filmmakersand distributors in revenue terms and sales to televisionalso generate significant income.
• The UK had the third-largest filmed entertainmentmarket in the world after the USA and Japan (2005).
• DVD/video sales accounted for the largest share (42%)of UK film revenues.
• Film piracy and competition from new forms ofdigital leisure activities, particularly onlineentertainment are creating a plateau in film revenues.
• Sell-through revenues boomed between 2000 and 2004.
• Film revenues in the UK peaked in 2004 and thendeclined significantly.
• Research suggests that the decreasing theatricalwindow has not has not contributed to the fall in UK cinema admissions.
Film production
The UK film industry is both an independent creator of feature films and a provider of services to theinternational film industry. In 2006, UK productionactivity bounced back from the lower level of 2005,reaching £842 million, the second highest year onrecord. This reflects greater industry confidence afterthe announcement of the UK’s new film tax relief.
• 2006 saw a 46% increase in UK production activity to £842 million from £577 million in 2005.
• Budgets for inward investment films increasedsubstantially, reflecting the higher number of big-budget studio films made in the UK in 2006.
• Five US majors accounted for almost two-thirds of the UK spend associated with inward investmentfeatures.
• The UK spend associated with inward investmentfeatures jumped 84% from £309 million to £570 million.
• The number of UK domestic features increasedsignificantly, from 39 in 2005 to 50 in 2006; howeverthe median budget fell significantly.
• The number of UK co-productions continued to fall,though the UK spend increased compared with 2005.
• Most UK co-productions continued to be shot in theUK or Western Europe, though there was a furtherincrease in Eastern European shoots, led by Hungaryand Romania.
• UK film production was dispersed over manyproduction companies, with only a small minoritybeing involved with more than one feature.
8 | UK Film Council Statistical Yearbook
Film industry companies
The number of film production companies has grownyear on year since 1996. Many of these companies aresmall in size but there has also been expansion in thebigger companies. The French topped the league of the20 leading film production companies in Europe, but anumber of British companies were also prominent.
• The number of small production companies grew themost, but the largest turnover size group also grew.
• The number of film production companies grew by256% between 1996 and 2006.
• US majors, video distributors and exhibitors wereprominent in the top 16 UK film companies in 2004.
• The top six UK film production companies had aturnover in 2004/05 of e195.5 million.
• Across Europe, French companies were prominent inaddition to the US majors.
• French, UK, German and Italian companies wereprominent in the top 20 European film productioncompanies in 2005.
• Only six non-single-purpose vehicle UK companiescould be identified in the top 100 European filmproduction companies in 2005.
• In the distribution and exhibition sectors, numbersgrew in the larger turnover brackets.
UK film exports
The UK film industry is a strong exporter, earning royaltyincome from around the world, providing productionservices to overseas (particularly USA) film producersand contributing a trade surplus to the UK’s balance of payments.
• The UK film industry exported £967 million worth ofservices in 2005, comprising £660 million in royaltiesand £307 million in film production services.
• The UK’s film trade surplus grew in 2005 to £163million, the highest for the 11 year.
• Exports grew by 65% between 2003 and 2005.
• UK film imports consisted largely of royalty paymentsto overseas rights’ owners.
• The USA was the largest market for UK film exports,taking 61% of total film exports in 2005.
• Europe was our second largest market, taking 19% of UK film exports.
• UK exports performed better in Australia andOceania, but were under-represented in Asia.
Employment in the film and video industries
The film and video industries employ substantialnumbers of highly skilled workers. While employmentlevels are somewhat volatile, reflecting the variable levelof demand for the sector’s services, employment hasincreased by a third over the past decade.
• 42,230 people worked in the film and video industryin 2005/06, of whom around 24,213 worked in filmand video production, a decrease on 2005.
• The film and video industry workforce was 33%higher in 2006 than in 1994, compared with a 13%increase in the overall workforce.
• 48% of people in film and video production were freelance.
• Women made up 40% of the film productionworkforce in 2006 (33% in 2002) and they were paidless than men on average.
• People from minority ethnic groups are under-represented in film production, 5%, the same as in 2002.
• Production and distribution were concentrated inLondon and the south-east, with 76% and 68%respectively of the workforce.
• 58% of employees in film and video production werein workplaces with ten or fewer people.
2006: The year in review | 9
10 | UK Film Council Statistical Yearbook
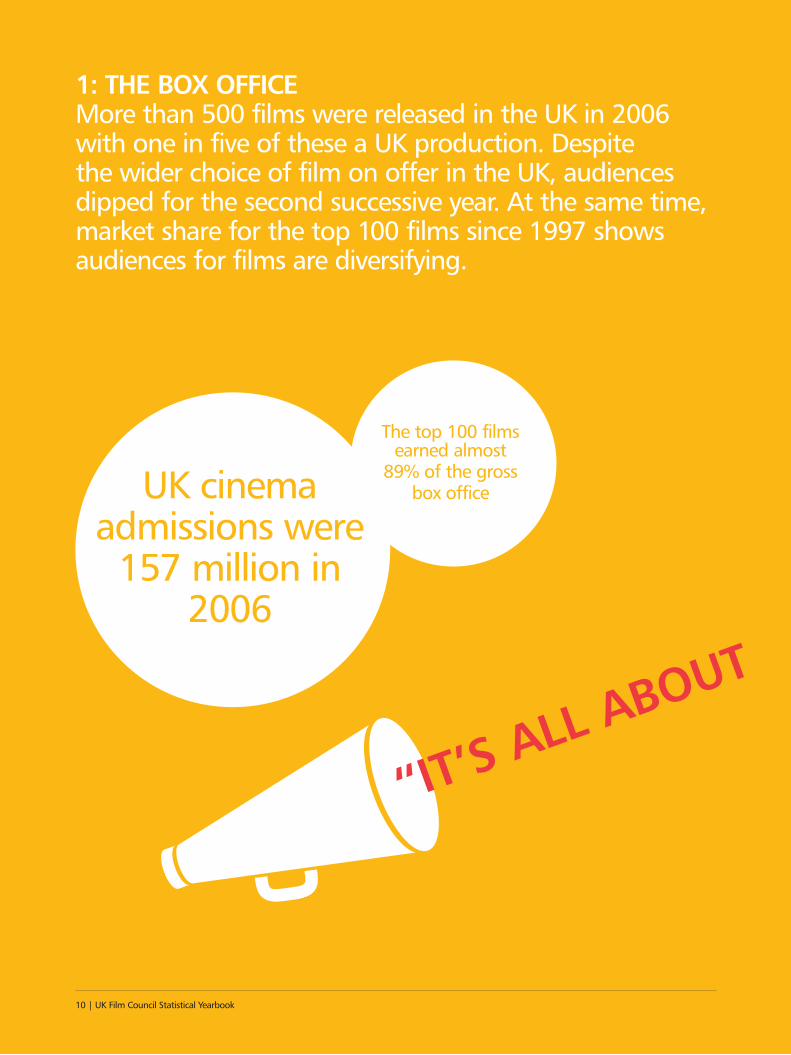
1: THE BOX OFFICEMore than 500 films were released in the UK in 2006with one in five of these a UK production. Despite the wider choice of film on offer in the UK, audiencesdipped for the second successive year. At the same time,market share for the top 100 films since 1997 shows audiences for films are diversifying.
10 | UK Film Council Statistical Yearbook
“IT’S ALL ABOUT GROSSESUK cinema
admissions were 157 million in
2006
The top 100 filmsearned almost
89% of the gross box office
1: The box office | 111: The box office | 11
“IT’S ALL ABOUT GROSSES£762 million
was taken at the UK box office
Box office earnings for films in the UK
has increased by 56% in nine years
UK films, including co-productions, accounted
for just over 21% of releasesand 19% of the market
by value
505 films were released in the UK
and Republic of Ireland,8% up on 2005 and
37% up on 2002
1.1 Admissions
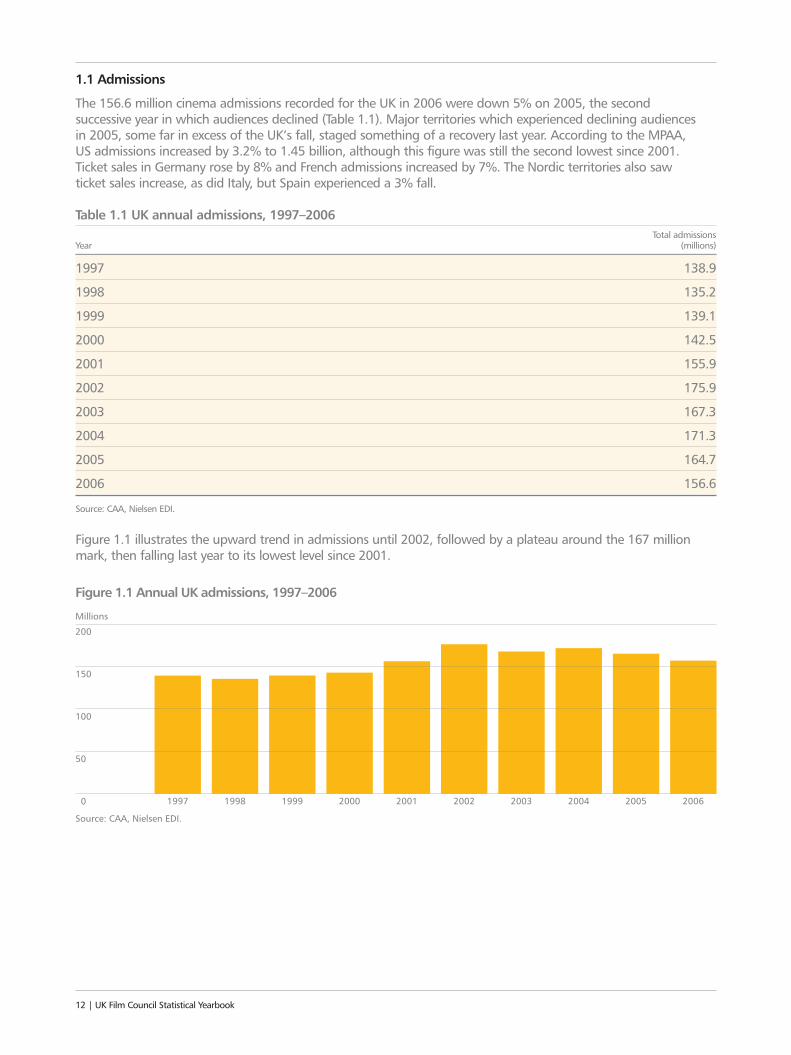
The 156.6 million cinema admissions recorded for the UK in 2006 were down 5% on 2005, the second successive year in which audiences declined (Table 1.1). Major territories which experienced declining audiences in 2005, some far in excess of the UK’s fall, staged something of a recovery last year. According to the MPAA, US admissions increased by 3.2% to 1.45 billion, although this figure was still the second lowest since 2001. Ticket sales in Germany rose by 8% and French admissions increased by 7%. The Nordic territories also saw ticket sales increase, as did Italy, but Spain experienced a 3% fall.
Table 1.1 UK annual admissions, 1997–2006Total admissions
Year (millions)
1997 138.9
1998 135.2
1999 139.1
2000 142.5
2001 155.9
2002 175.9
2003 167.3
2004 171.3
2005 164.7
2006 156.6
Source: CAA, Nielsen EDI.
Figure 1.1 illustrates the upward trend in admissions until 2002, followed by a plateau around the 167 millionmark, then falling last year to its lowest level since 2001.
12 | UK Film Council Statistical Yearbook
0
Source: CAA, Nielsen EDI.
50
100
150
200
1997 1998 1999 2000 2001 2002 2003 2004 2005 2006
Millions
Figure 1.1 Annual UK admissions, 1997–2006
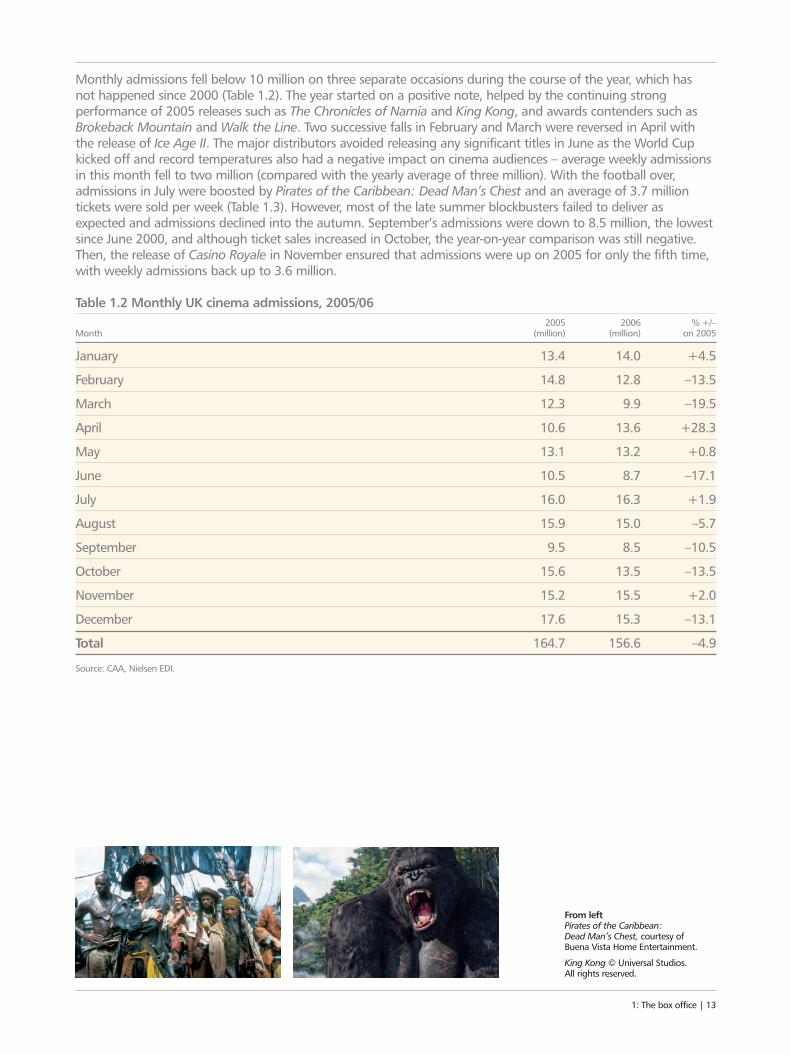
Monthly admissions fell below 10 million on three separate occasions during the course of the year, which has not happened since 2000 (Table 1.2). The year started on a positive note, helped by the continuing strongperformance of 2005 releases such as The Chronicles of Narnia and King Kong, and awards contenders such asBrokeback Mountain and Walk the Line. Two successive falls in February and March were reversed in April withthe release of Ice Age II. The major distributors avoided releasing any significant titles in June as the World Cupkicked off and record temperatures also had a negative impact on cinema audiences – average weekly admissionsin this month fell to two million (compared with the yearly average of three million). With the football over,admissions in July were boosted by Pirates of the Caribbean: Dead Man’s Chest and an average of 3.7 milliontickets were sold per week (Table 1.3). However, most of the late summer blockbusters failed to deliver asexpected and admissions declined into the autumn. September’s admissions were down to 8.5 million, the lowestsince June 2000, and although ticket sales increased in October, the year-on-year comparison was still negative.Then, the release of Casino Royale in November ensured that admissions were up on 2005 for only the fifth time,with weekly admissions back up to 3.6 million.
Table 1.2 Monthly UK cinema admissions, 2005/062005 2006 % +/–
Month (million) (million) on 2005
January 13.4 14.0 +4.5
February 14.8 12.8 –13.5
March 12.3 9.9 –19.5
April 10.6 13.6 +28.3
May 13.1 13.2 +0.8
June 10.5 8.7 –17.1
July 16.0 16.3 +1.9
August 15.9 15.0 –5.7
September 9.5 8.5 –10.5
October 15.6 13.5 –13.5
November 15.2 15.5 +2.0
December 17.6 15.3 –13.1
Total 164.7 156.6 –4.9
Source: CAA, Nielsen EDI.
From left Pirates of the Caribbean: Dead Man’s Chest, courtesy of Buena Vista Home Entertainment.
King Kong © Universal Studios. All rights reserved.
1: The box office | 13
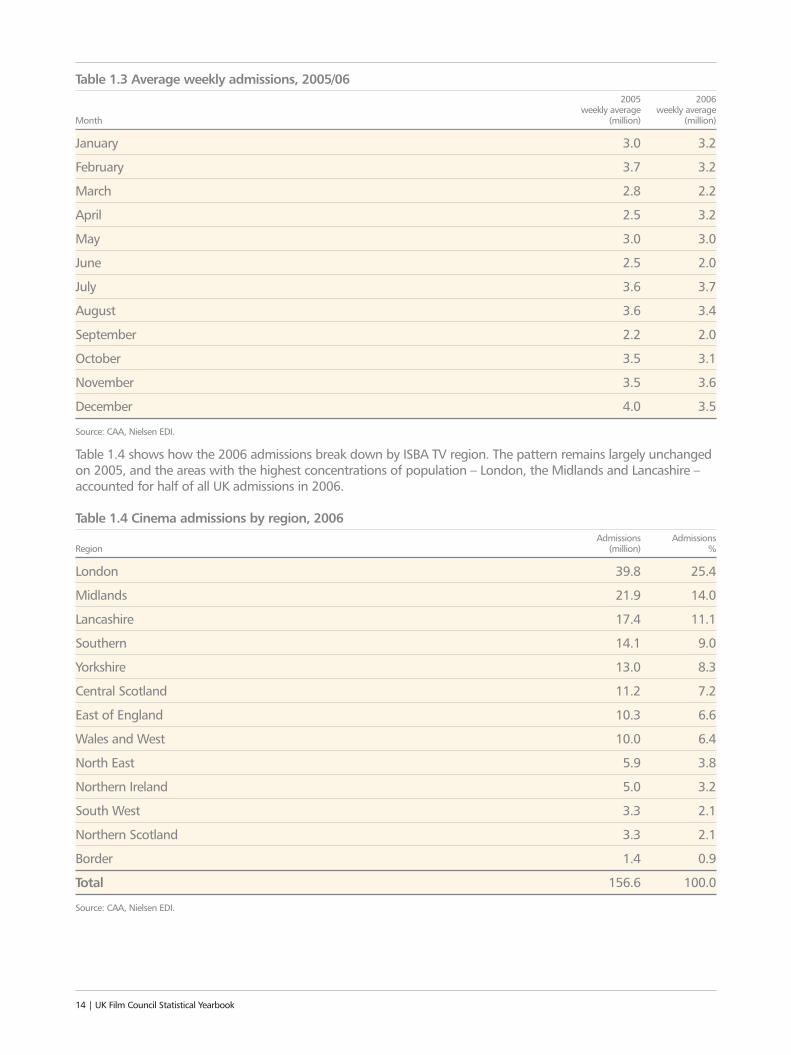
Table 1.3 Average weekly admissions, 2005/062005 2006
weekly average weekly average Month (million) (million)
January 3.0 3.2
February 3.7 3.2
March 2.8 2.2
April 2.5 3.2
May 3.0 3.0
June 2.5 2.0
July 3.6 3.7
August 3.6 3.4
September 2.2 2.0
October 3.5 3.1
November 3.5 3.6
December 4.0 3.5
Source: CAA, Nielsen EDI.
Table 1.4 shows how the 2006 admissions break down by ISBA TV region. The pattern remains largely unchangedon 2005, and the areas with the highest concentrations of population – London, the Midlands and Lancashire –accounted for half of all UK admissions in 2006.
Table 1.4 Cinema admissions by region, 2006Admissions Admissions
Region (million) %
London 39.8 25.4
Midlands 21.9 14.0
Lancashire 17.4 11.1
Southern 14.1 9.0
Yorkshire 13.0 8.3
Central Scotland 11.2 7.2
East of England 10.3 6.6
Wales and West 10.0 6.4
North East 5.9 3.8
Northern Ireland 5.0 3.2
South West 3.3 2.1
Northern Scotland 3.3 2.1
Border 1.4 0.9
Total 156.6 100.0
Source: CAA, Nielsen EDI.
14 | UK Film Council Statistical Yearbook

1: The box office | 15
Above Casino Royale © 2006 Danjaq, LLCand United Artists Corporation andColumbia Pictures Industries, Inc. All rights reserved.
1.2 Box office earnings
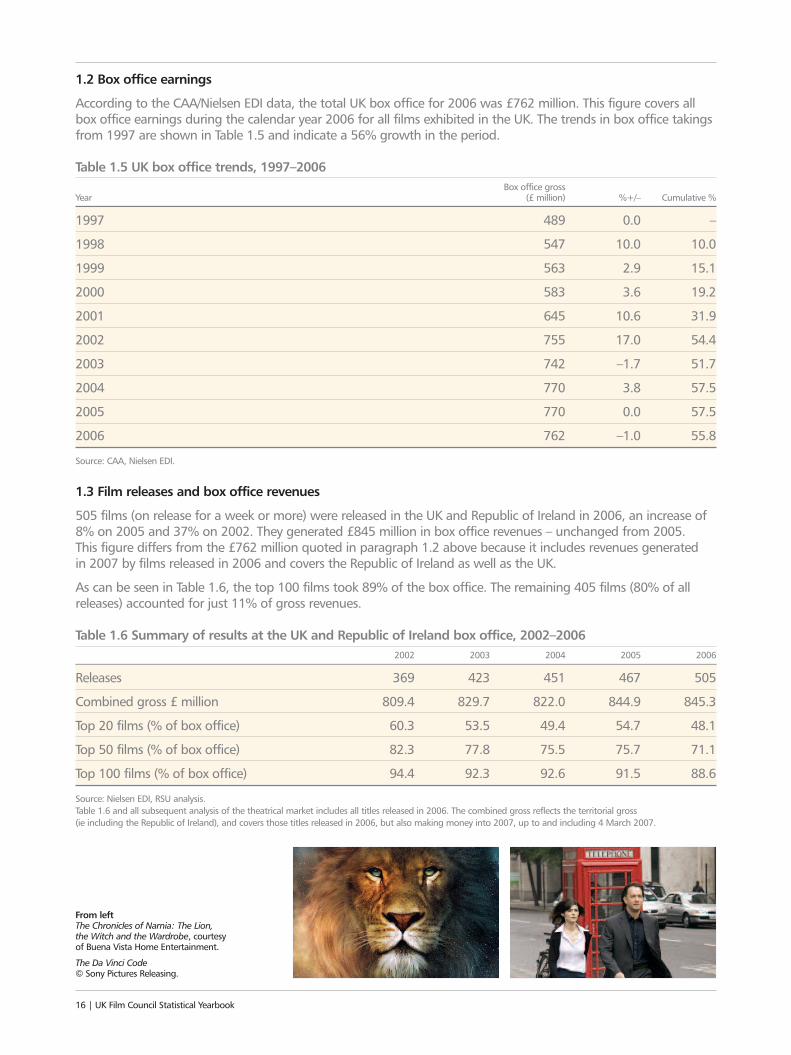
According to the CAA/Nielsen EDI data, the total UK box office for 2006 was £762 million. This figure covers allbox office earnings during the calendar year 2006 for all films exhibited in the UK. The trends in box office takingsfrom 1997 are shown in Table 1.5 and indicate a 56% growth in the period.
Table 1.5 UK box office trends, 1997–2006Box office gross
Year (£ million) %+/– Cumulative %
1997 489 0.0 –
1998 547 10.0 10.0
1999 563 2.9 15.1
2000 583 3.6 19.2
2001 645 10.6 31.9
2002 755 17.0 54.4
2003 742 –1.7 51.7
2004 770 3.8 57.5
2005 770 0.0 57.5
2006 762 –1.0 55.8
Source: CAA, Nielsen EDI.
1.3 Film releases and box office revenues
505 films (on release for a week or more) were released in the UK and Republic of Ireland in 2006, an increase of8% on 2005 and 37% on 2002. They generated £845 million in box office revenues – unchanged from 2005. This figure differs from the £762 million quoted in paragraph 1.2 above because it includes revenues generated in 2007 by films released in 2006 and covers the Republic of Ireland as well as the UK.
As can be seen in Table 1.6, the top 100 films took 89% of the box office. The remaining 405 films (80% of allreleases) accounted for just 11% of gross revenues.
Table 1.6 Summary of results at the UK and Republic of Ireland box office, 2002–20062002 2003 2004 2005 2006
Releases 369 423 451 467 505
Combined gross £ million 809.4 829.7 822.0 844.9 845.3
Top 20 films (% of box office) 60.3 53.5 49.4 54.7 48.1
Top 50 films (% of box office) 82.3 77.8 75.5 75.7 71.1
Top 100 films (% of box office) 94.4 92.3 92.6 91.5 88.6
Source: Nielsen EDI, RSU analysis.Table 1.6 and all subsequent analysis of the theatrical market includes all titles released in 2006. The combined gross reflects the territorial gross (ie including the Republic of Ireland), and covers those titles released in 2006, but also making money into 2007, up to and including 4 March 2007.
From left The Chronicles of Narnia: The Lion, the Witch and the Wardrobe, courtesyof Buena Vista Home Entertainment.
The Da Vinci Code© Sony Pictures Releasing.
16 | UK Film Council Statistical Yearbook
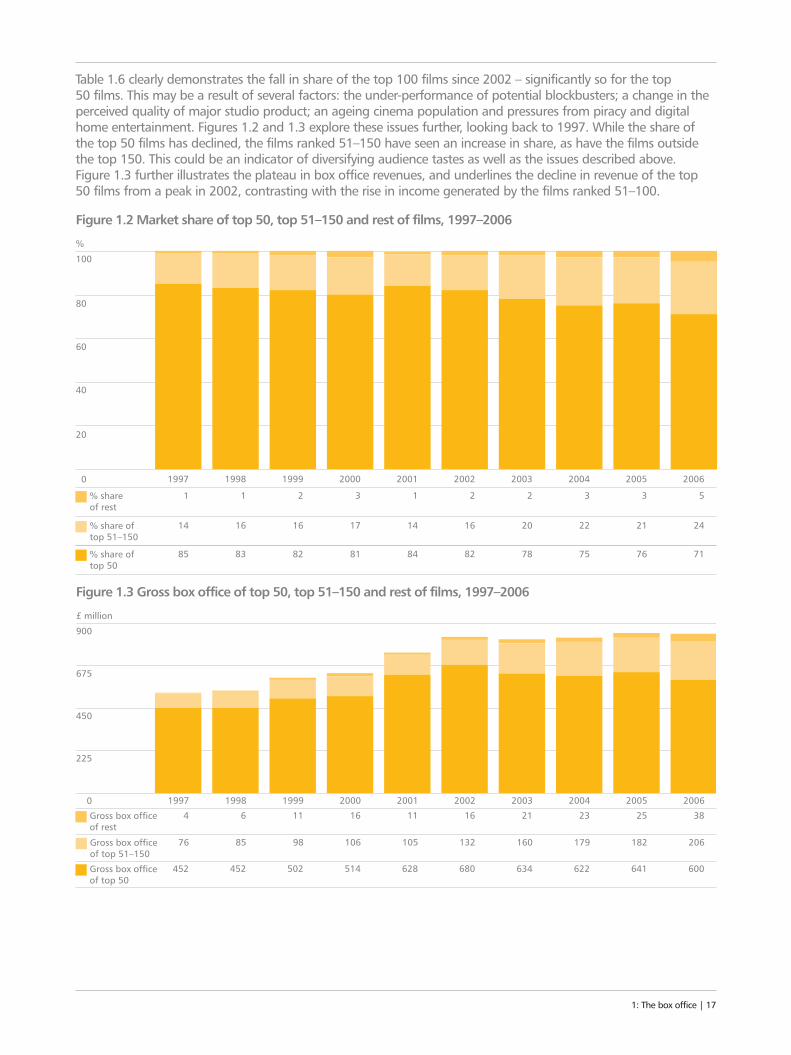
Table 1.6 clearly demonstrates the fall in share of the top 100 films since 2002 – significantly so for the top 50 films. This may be a result of several factors: the under-performance of potential blockbusters; a change in theperceived quality of major studio product; an ageing cinema population and pressures from piracy and digitalhome entertainment. Figures 1.2 and 1.3 explore these issues further, looking back to 1997. While the share ofthe top 50 films has declined, the films ranked 51–150 have seen an increase in share, as have the films outsidethe top 150. This could be an indicator of diversifying audience tastes as well as the issues described above. Figure 1.3 further illustrates the plateau in box office revenues, and underlines the decline in revenue of the top50 films from a peak in 2002, contrasting with the rise in income generated by the films ranked 51–100.
1: The box office | 17
0
20
40
60
80
100
1997 1998 1999 2000 2001 2002 2003 2004 2005 2006
%
Figure 1.2 Market share of top 50, top 51–150 and rest of films, 1997–2006
83 82 84 82 75% share of top 50
788185 76 71
16 16 14 16 22% share of top 51–150
201714 21 24
1 2 1 2 3% share of rest
231 3 5
0
225
450
675
900
1997 1998 1999 2000 2001 2002 2003 2004 2005 2006
£ million
Figure 1.3 Gross box office of top 50, top 51–150 and rest of films, 1997–2006
452 502 628 680 622Gross box office of top 50
634514452 641 600
85 98 105 132 179Gross box office of top 51–150
16010676 182 206
6 11 11 16 23Gross box office of rest
21164 25 38
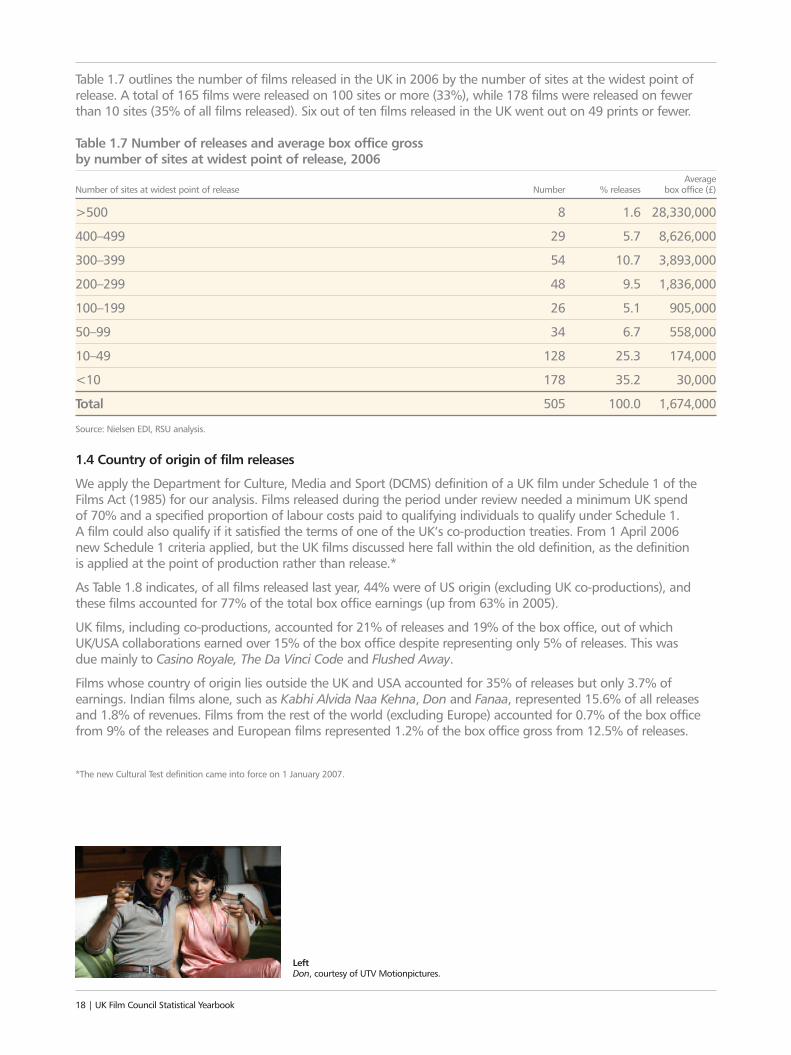
Table 1.7 outlines the number of films released in the UK in 2006 by the number of sites at the widest point ofrelease. A total of 165 films were released on 100 sites or more (33%), while 178 films were released on fewerthan 10 sites (35% of all films released). Six out of ten films released in the UK went out on 49 prints or fewer.
Table 1.7 Number of releases and average box office gross by number of sites at widest point of release, 2006
Average Number of sites at widest point of release Number % releases box office (£)
>500 8 1.6 28,330,000
400–499 29 5.7 8,626,000
300–399 54 10.7 3,893,000
200–299 48 9.5 1,836,000
100–199 26 5.1 905,000
50–99 34 6.7 558,000
10–49 128 25.3 174,000
<10 178 35.2 30,000
Total 505 100.0 1,674,000
Source: Nielsen EDI, RSU analysis.
1.4 Country of origin of film releases
We apply the Department for Culture, Media and Sport (DCMS) definition of a UK film under Schedule 1 of theFilms Act (1985) for our analysis. Films released during the period under review needed a minimum UK spend of 70% and a specified proportion of labour costs paid to qualifying individuals to qualify under Schedule 1. A film could also qualify if it satisfied the terms of one of the UK’s co-production treaties. From 1 April 2006 new Schedule 1 criteria applied, but the UK films discussed here fall within the old definition, as the definition is applied at the point of production rather than release.*
As Table 1.8 indicates, of all films released last year, 44% were of US origin (excluding UK co-productions), andthese films accounted for 77% of the total box office earnings (up from 63% in 2005).
UK films, including co-productions, accounted for 21% of releases and 19% of the box office, out of whichUK/USA collaborations earned over 15% of the box office despite representing only 5% of releases. This was due mainly to Casino Royale, The Da Vinci Code and Flushed Away.
Films whose country of origin lies outside the UK and USA accounted for 35% of releases but only 3.7% ofearnings. Indian films alone, such as Kabhi Alvida Naa Kehna, Don and Fanaa, represented 15.6% of all releasesand 1.8% of revenues. Films from the rest of the world (excluding Europe) accounted for 0.7% of the box officefrom 9% of the releases and European films represented 1.2% of the box office gross from 12.5% of releases.
*The new Cultural Test definition came into force on 1 January 2007.
Left Don, courtesy of UTV Motionpictures.
18 | UK Film Council Statistical Yearbook
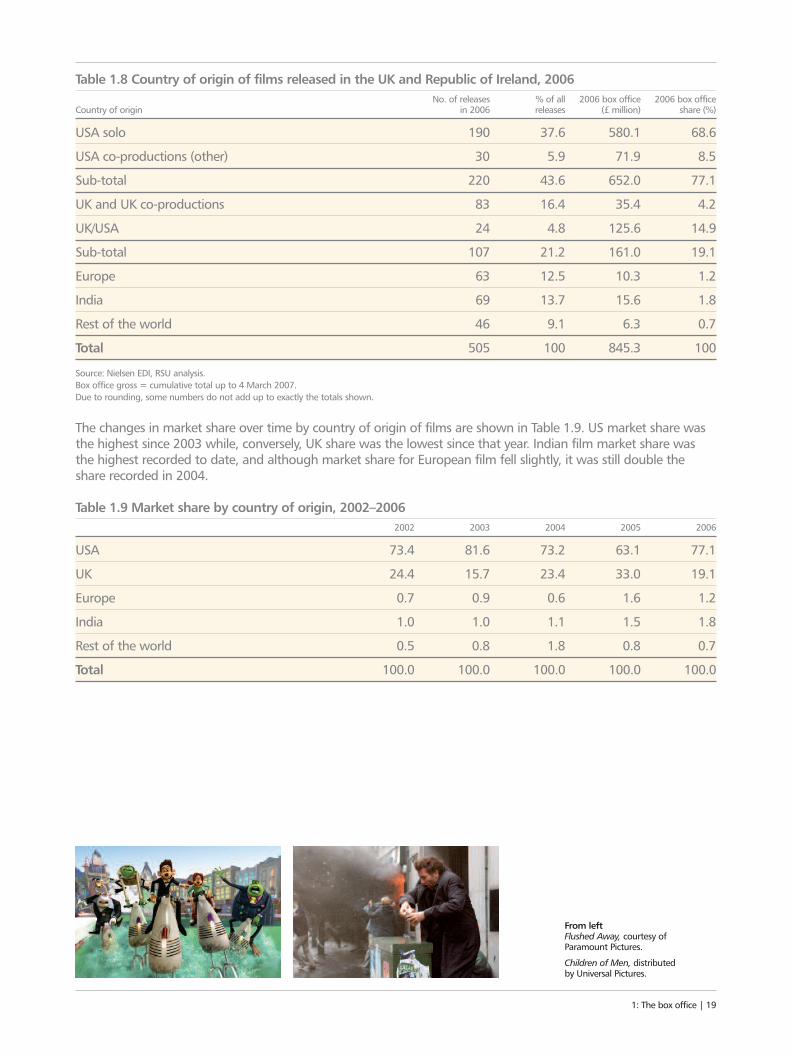
Table 1.8 Country of origin of films released in the UK and Republic of Ireland, 2006No. of releases % of all 2006 box office 2006 box office
Country of origin in 2006 releases (£ million) share (%)
USA solo 190 37.6 580.1 68.6
USA co-productions (other) 30 5.9 71.9 8.5
Sub-total 220 43.6 652.0 77.1
UK and UK co-productions 83 16.4 35.4 4.2
UK/USA 24 4.8 125.6 14.9
Sub-total 107 21.2 161.0 19.1
Europe 63 12.5 10.3 1.2
India 69 13.7 15.6 1.8
Rest of the world 46 9.1 6.3 0.7
Total 505 100 845.3 100
Source: Nielsen EDI, RSU analysis.Box office gross = cumulative total up to 4 March 2007.Due to rounding, some numbers do not add up to exactly the totals shown.
The changes in market share over time by country of origin of films are shown in Table 1.9. US market share wasthe highest since 2003 while, conversely, UK share was the lowest since that year. Indian film market share wasthe highest recorded to date, and although market share for European film fell slightly, it was still double theshare recorded in 2004.
Table 1.9 Market share by country of origin, 2002–20062002 2003 2004 2005 2006
USA 73.4 81.6 73.2 63.1 77.1
UK 24.4 15.7 23.4 33.0 19.1
Europe 0.7 0.9 0.6 1.6 1.2
India 1.0 1.0 1.1 1.5 1.8
Rest of the world 0.5 0.8 1.8 0.8 0.7
Total 100.0 100.0 100.0 100.0 100.0
From left Flushed Away, courtesy of Paramount Pictures.
Children of Men, distributed by Universal Pictures.
1: The box office | 19
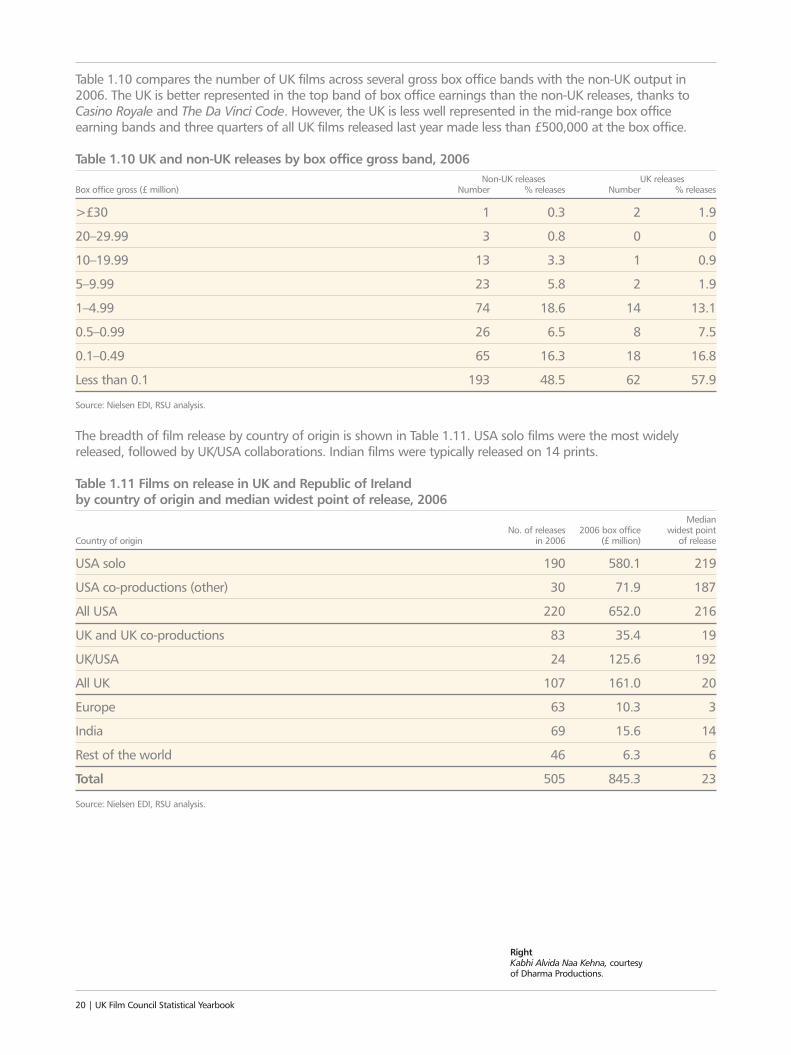
Table 1.10 compares the number of UK films across several gross box office bands with the non-UK output in2006. The UK is better represented in the top band of box office earnings than the non-UK releases, thanks toCasino Royale and The Da Vinci Code. However, the UK is less well represented in the mid-range box officeearning bands and three quarters of all UK films released last year made less than £500,000 at the box office.
Table 1.10 UK and non-UK releases by box office gross band, 2006Non-UK releases UK releases
Box office gross (£ million) Number % releases Number % releases
>£30 1 0.3 2 1.9
20–29.99 3 0.8 0 0
10–19.99 13 3.3 1 0.9
5–9.99 23 5.8 2 1.9
1–4.99 74 18.6 14 13.1
0.5–0.99 26 6.5 8 7.5
0.1–0.49 65 16.3 18 16.8
Less than 0.1 193 48.5 62 57.9
Source: Nielsen EDI, RSU analysis.
The breadth of film release by country of origin is shown in Table 1.11. USA solo films were the most widelyreleased, followed by UK/USA collaborations. Indian films were typically released on 14 prints.
Table 1.11 Films on release in UK and Republic of Ireland by country of origin and median widest point of release, 2006
MedianNo. of releases 2006 box office widest point
Country of origin in 2006 (£ million) of release
USA solo 190 580.1 219
USA co-productions (other) 30 71.9 187
All USA 220 652.0 216
UK and UK co-productions 83 35.4 19
UK/USA 24 125.6 192
All UK 107 161.0 20
Europe 63 10.3 3
India 69 15.6 14
Rest of the world 46 6.3 6
Total 505 845.3 23
Source: Nielsen EDI, RSU analysis.
RightKabhi Alvida Naa Kehna, courtesy of Dharma Productions.
20 | UK Film Council Statistical Yearbook
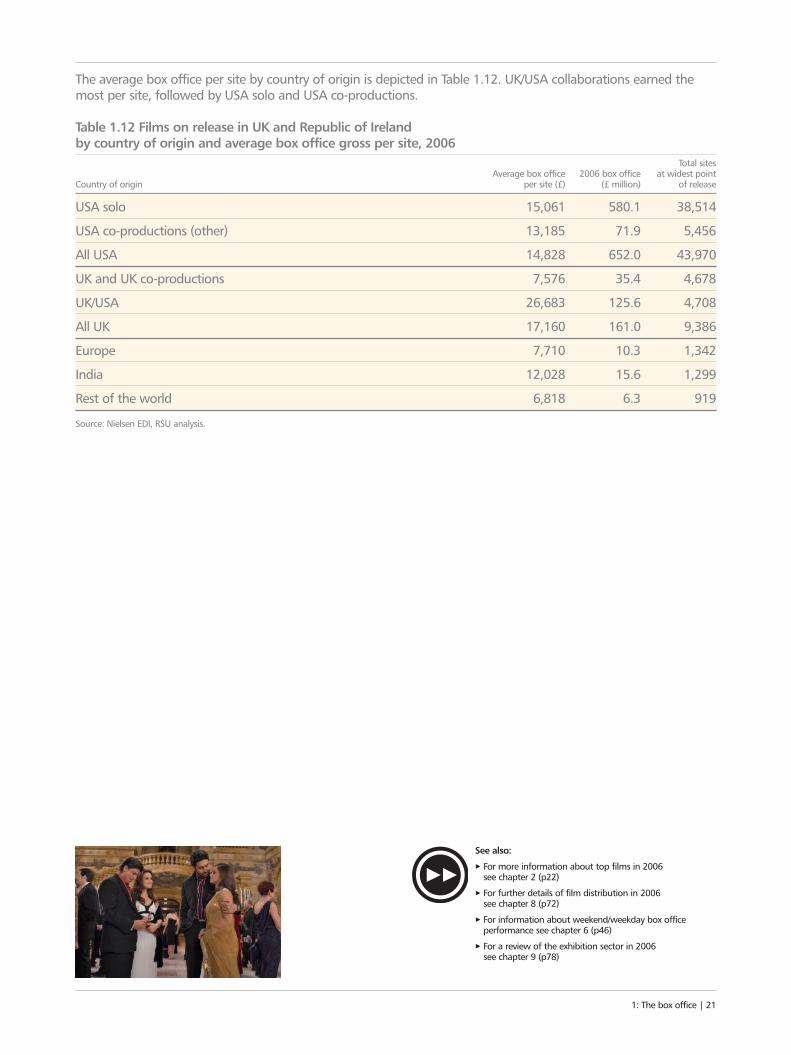
The average box office per site by country of origin is depicted in Table 1.12. UK/USA collaborations earned themost per site, followed by USA solo and USA co-productions.
Table 1.12 Films on release in UK and Republic of Ireland by country of origin and average box office gross per site, 2006
Total sitesAverage box office 2006 box office at widest point
Country of origin per site (£) (£ million) of release
USA solo 15,061 580.1 38,514
USA co-productions (other) 13,185 71.9 5,456
All USA 14,828 652.0 43,970
UK and UK co-productions 7,576 35.4 4,678
UK/USA 26,683 125.6 4,708
All UK 17,160 161.0 9,386
Europe 7,710 10.3 1,342
India 12,028 15.6 1,299
Rest of the world 6,818 6.3 919
Source: Nielsen EDI, RSU analysis.
1: The box office | 21
See also:
3 For more information about top films in 2006 see chapter 2 (p22)
3 For further details of film distribution in 2006 see chapter 8 (p72)
3 For information about weekend/weekday box officeperformance see chapter 6 (p46)
3 For a review of the exhibition sector in 2006 see chapter 9 (p78)
22 | UK Film Council Statistical Yearbook
2: TOP FILMS IN 2006Two films dominated the charts in 2006 – Casino Royale,which exceeded all expectations even by Bond’sstandards, and Pirates of the Caribbean: Dead Man’sChest. Three UK films appeared in the top 20 but many achieved distinction through film awards.22 | UK Film Council Statistical Yearbook
“YOU’RE THE BESTThe top 20 UK filmsgrossed £151 million at
the UK box office
Three UK films featured in the
top 20 – Casino Royale, The Da Vinci Codeand Flushed Away

2: Top films in 2006 | 23
From left Caption to images goes here ego cumtene sententian Itaque earud reruamhist entuary sapiente.
2: Top films in 2006 | 23
“YOU’RE THE BESTThe USA was involved
in all of the top 20 films at the UK box office,partnering the UK
on three
Casino Royale was the biggest film of
the year, earning over£55 million
UK films topped the weekly box office five
times in 2006
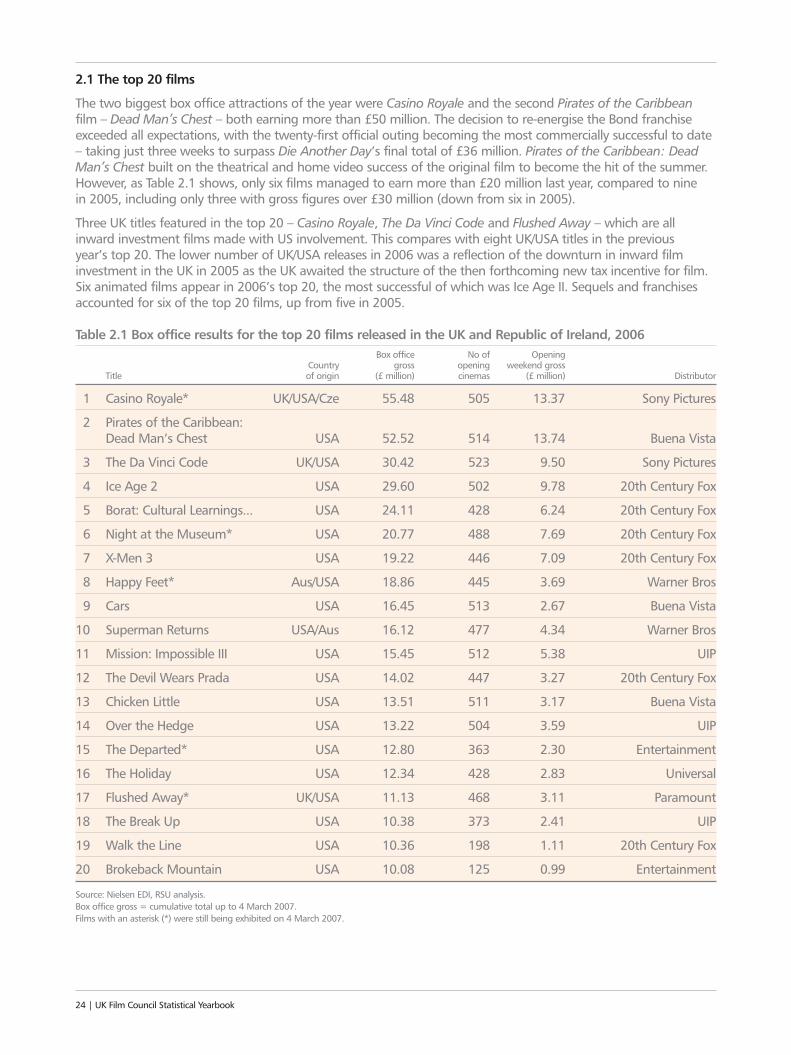
2.1 The top 20 films
The two biggest box office attractions of the year were Casino Royale and the second Pirates of the Caribbeanfilm – Dead Man’s Chest – both earning more than £50 million. The decision to re-energise the Bond franchiseexceeded all expectations, with the twenty-first official outing becoming the most commercially successful to date– taking just three weeks to surpass Die Another Day’s final total of £36 million. Pirates of the Caribbean: DeadMan’s Chest built on the theatrical and home video success of the original film to become the hit of the summer.However, as Table 2.1 shows, only six films managed to earn more than £20 million last year, compared to nine in 2005, including only three with gross figures over £30 million (down from six in 2005).
Three UK titles featured in the top 20 – Casino Royale, The Da Vinci Code and Flushed Away – which are allinward investment films made with US involvement. This compares with eight UK/USA titles in the previous year’s top 20. The lower number of UK/USA releases in 2006 was a reflection of the downturn in inward filminvestment in the UK in 2005 as the UK awaited the structure of the then forthcoming new tax incentive for film. Six animated films appear in 2006’s top 20, the most successful of which was Ice Age II. Sequels and franchisesaccounted for six of the top 20 films, up from five in 2005.
Table 2.1 Box office results for the top 20 films released in the UK and Republic of Ireland, 2006Box office No of Opening
Country gross opening weekend gross Title of origin (£ million) cinemas (£ million) Distributor
1 Casino Royale* UK/USA/Cze 55.48 505 13.37 Sony Pictures
2 Pirates of the Caribbean: Dead Man’s Chest USA 52.52 514 13.74 Buena Vista
3 The Da Vinci Code UK/USA 30.42 523 9.50 Sony Pictures
4 Ice Age 2 USA 29.60 502 9.78 20th Century Fox
5 Borat: Cultural Learnings... USA 24.11 428 6.24 20th Century Fox
6 Night at the Museum* USA 20.77 488 7.69 20th Century Fox
7 X-Men 3 USA 19.22 446 7.09 20th Century Fox
8 Happy Feet* Aus/USA 18.86 445 3.69 Warner Bros
9 Cars USA 16.45 513 2.67 Buena Vista
10 Superman Returns USA/Aus 16.12 477 4.34 Warner Bros
11 Mission: Impossible III USA 15.45 512 5.38 UIP
12 The Devil Wears Prada USA 14.02 447 3.27 20th Century Fox
13 Chicken Little USA 13.51 511 3.17 Buena Vista
14 Over the Hedge USA 13.22 504 3.59 UIP
15 The Departed* USA 12.80 363 2.30 Entertainment
16 The Holiday USA 12.34 428 2.83 Universal
17 Flushed Away* UK/USA 11.13 468 3.11 Paramount
18 The Break Up USA 10.38 373 2.41 UIP
19 Walk the Line USA 10.36 198 1.11 20th Century Fox
20 Brokeback Mountain USA 10.08 125 0.99 Entertainment
Source: Nielsen EDI, RSU analysis.Box office gross = cumulative total up to 4 March 2007.Films with an asterisk (*) were still being exhibited on 4 March 2007.
24 | UK Film Council Statistical Yearbook
2: Top films in 2006 | 25
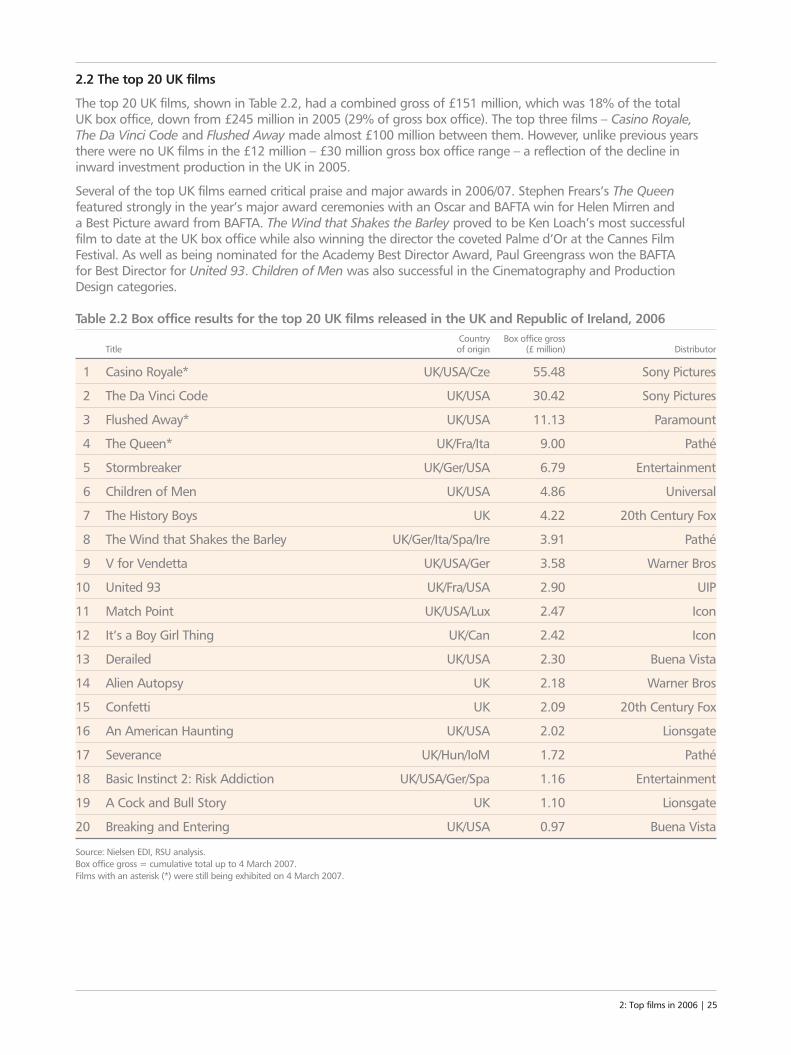
2.2 The top 20 UK films
The top 20 UK films, shown in Table 2.2, had a combined gross of £151 million, which was 18% of the total UK box office, down from £245 million in 2005 (29% of gross box office). The top three films – Casino Royale,The Da Vinci Code and Flushed Away made almost £100 million between them. However, unlike previous yearsthere were no UK films in the £12 million – £30 million gross box office range – a reflection of the decline ininward investment production in the UK in 2005.
Several of the top UK films earned critical praise and major awards in 2006/07. Stephen Frears’s The Queenfeatured strongly in the year’s major award ceremonies with an Oscar and BAFTA win for Helen Mirren and a Best Picture award from BAFTA. The Wind that Shakes the Barley proved to be Ken Loach’s most successful film to date at the UK box office while also winning the director the coveted Palme d’Or at the Cannes FilmFestival. As well as being nominated for the Academy Best Director Award, Paul Greengrass won the BAFTA for Best Director for United 93. Children of Men was also successful in the Cinematography and ProductionDesign categories.
Table 2.2 Box office results for the top 20 UK films released in the UK and Republic of Ireland, 2006Country Box office gross
Title of origin (£ million) Distributor
1 Casino Royale* UK/USA/Cze 55.48 Sony Pictures
2 The Da Vinci Code UK/USA 30.42 Sony Pictures
3 Flushed Away* UK/USA 11.13 Paramount
4 The Queen* UK/Fra/Ita 9.00 Pathé
5 Stormbreaker UK/Ger/USA 6.79 Entertainment
6 Children of Men UK/USA 4.86 Universal
7 The History Boys UK 4.22 20th Century Fox
8 The Wind that Shakes the Barley UK/Ger/Ita/Spa/Ire 3.91 Pathé
9 V for Vendetta UK/USA/Ger 3.58 Warner Bros
10 United 93 UK/Fra/USA 2.90 UIP
11 Match Point UK/USA/Lux 2.47 Icon
12 It’s a Boy Girl Thing UK/Can 2.42 Icon
13 Derailed UK/USA 2.30 Buena Vista
14 Alien Autopsy UK 2.18 Warner Bros
15 Confetti UK 2.09 20th Century Fox
16 An American Haunting UK/USA 2.02 Lionsgate
17 Severance UK/Hun/IoM 1.72 Pathé
18 Basic Instinct 2: Risk Addiction UK/USA/Ger/Spa 1.16 Entertainment
19 A Cock and Bull Story UK 1.10 Lionsgate
20 Breaking and Entering UK/USA 0.97 Buena Vista
Source: Nielsen EDI, RSU analysis.Box office gross = cumulative total up to 4 March 2007.Films with an asterisk (*) were still being exhibited on 4 March 2007.
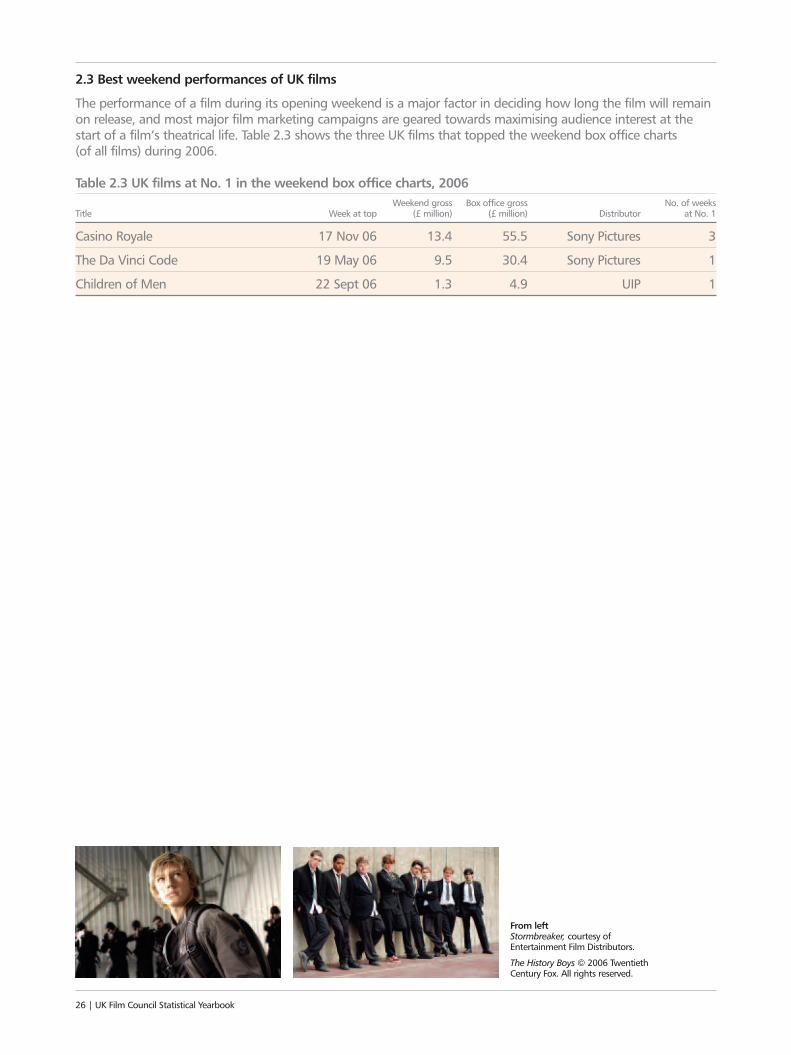
2.3 Best weekend performances of UK films
The performance of a film during its opening weekend is a major factor in deciding how long the film will remainon release, and most major film marketing campaigns are geared towards maximising audience interest at thestart of a film’s theatrical life. Table 2.3 shows the three UK films that topped the weekend box office charts (of all films) during 2006.
Table 2.3 UK films at No. 1 in the weekend box office charts, 2006Weekend gross Box office gross No. of weeks
Title Week at top (£ million) (£ million) Distributor at No. 1
Casino Royale 17 Nov 06 13.4 55.5 Sony Pictures 3
The Da Vinci Code 19 May 06 9.5 30.4 Sony Pictures 1
Children of Men 22 Sept 06 1.3 4.9 UIP 1
26 | UK Film Council Statistical Yearbook
From left Stormbreaker, courtesy ofEntertainment Film Distributors.
The History Boys © 2006 TwentiethCentury Fox. All rights reserved.

2: Top films in 2006 | 27
AboveThe Queen, courtesy of Pathé Distribution.
See also:
3 For more about top films since 1997 see chapter 3 (p28)
3 For further information about film distribution in2006 see chapter 8 (p72)
3 For information about weekend/weekday boxoffice performance see chapter 6 (p46)
3 For an overview of the exhibition sector in 2006see chapter 9 (p78)

3: TOP FILMS 1997–2006Two films from 2006 – Casino Royale and Pirates of theCaribbean: Dead Man’s Chest – entered the top 20 filmsof the decade. Harry Potter and Lord of the Rings filmsdominated the decade’s favourites, while UK writersprovided the inspiration for 12 out of the top 20 films.
28 | UK Film Council Statistical Yearbook
“IT’S ALL ABOUT
The Da Vinci Code was the only other 2006 UK
release in the last decade’sUK top 20
Casino Royale isthe second highestgrossing UK film
of all time
From left Caption to images goes here ego cumtene sententian Itaque earud reruamhist entuary sapiente.
3: Top films 1997–2006 | 29
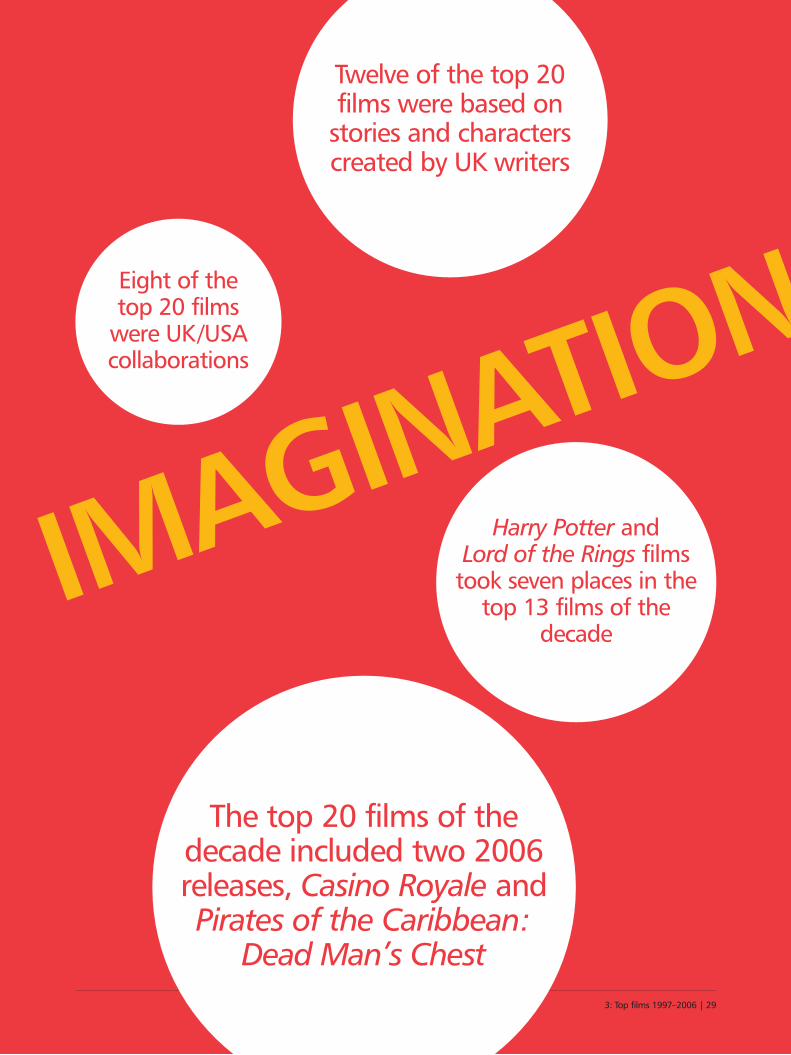
IMAGINATION
The top 20 films of thedecade included two 2006releases, Casino Royale andPirates of the Caribbean:
Dead Man’s Chest
Twelve of the top 20 films were based on
stories and characterscreated by UK writers
Eight of the top 20 films
were UK/USAcollaborations
Harry Potter and Lord of the Rings films
took seven places in thetop 13 films of the
decade
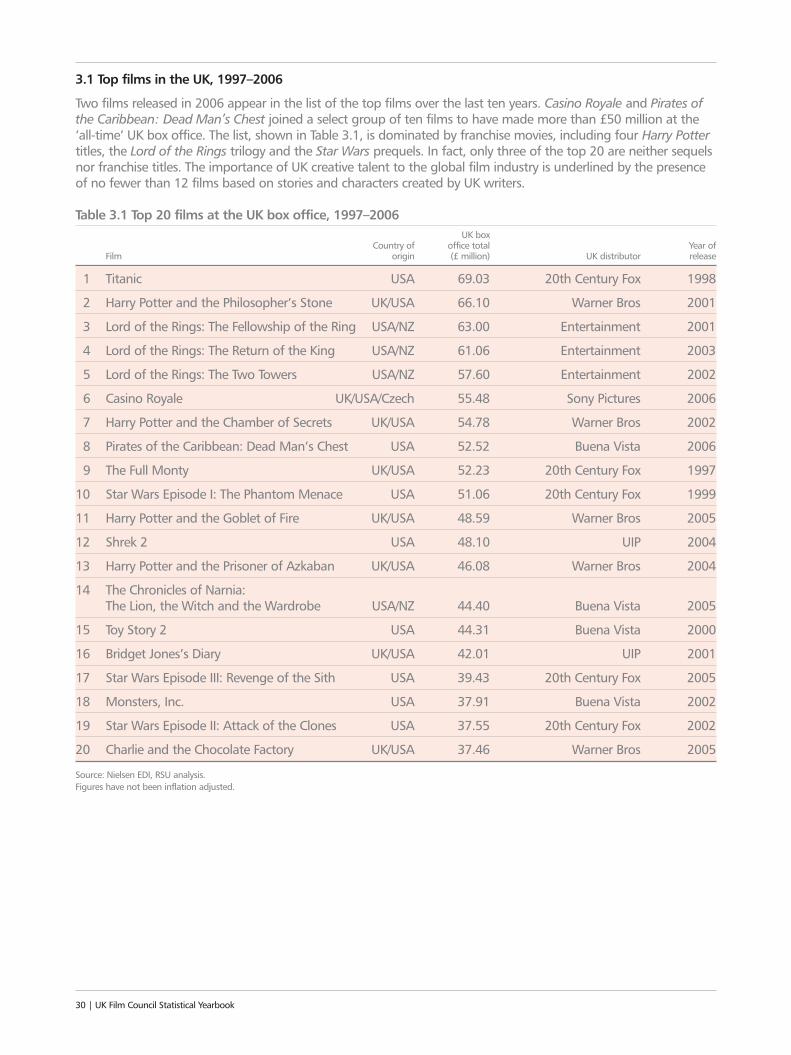
3.1 Top films in the UK, 1997–2006
Two films released in 2006 appear in the list of the top films over the last ten years. Casino Royale and Pirates ofthe Caribbean: Dead Man’s Chest joined a select group of ten films to have made more than £50 million at the’all-time’ UK box office. The list, shown in Table 3.1, is dominated by franchise movies, including four Harry Pottertitles, the Lord of the Rings trilogy and the Star Wars prequels. In fact, only three of the top 20 are neither sequelsnor franchise titles. The importance of UK creative talent to the global film industry is underlined by the presenceof no fewer than 12 films based on stories and characters created by UK writers.
Table 3.1 Top 20 films at the UK box office, 1997–2006UK box
Country of office total Year ofFilm origin (£ million) UK distributor release
1 Titanic USA 69.03 20th Century Fox 1998
2 Harry Potter and the Philosopher’s Stone UK/USA 66.10 Warner Bros 2001
3 Lord of the Rings: The Fellowship of the Ring USA/NZ 63.00 Entertainment 2001
4 Lord of the Rings: The Return of the King USA/NZ 61.06 Entertainment 2003
5 Lord of the Rings: The Two Towers USA/NZ 57.60 Entertainment 2002
6 Casino Royale UK/USA/Czech 55.48 Sony Pictures 2006
7 Harry Potter and the Chamber of Secrets UK/USA 54.78 Warner Bros 2002
8 Pirates of the Caribbean: Dead Man’s Chest USA 52.52 Buena Vista 2006
9 The Full Monty UK/USA 52.23 20th Century Fox 1997
10 Star Wars Episode I: The Phantom Menace USA 51.06 20th Century Fox 1999
11 Harry Potter and the Goblet of Fire UK/USA 48.59 Warner Bros 2005
12 Shrek 2 USA 48.10 UIP 2004
13 Harry Potter and the Prisoner of Azkaban UK/USA 46.08 Warner Bros 2004
14 The Chronicles of Narnia: The Lion, the Witch and the Wardrobe USA/NZ 44.40 Buena Vista 2005
15 Toy Story 2 USA 44.31 Buena Vista 2000
16 Bridget Jones’s Diary UK/USA 42.01 UIP 2001
17 Star Wars Episode III: Revenge of the Sith USA 39.43 20th Century Fox 2005
18 Monsters, Inc. USA 37.91 Buena Vista 2002
19 Star Wars Episode II: Attack of the Clones USA 37.55 20th Century Fox 2002
20 Charlie and the Chocolate Factory UK/USA 37.46 Warner Bros 2005
Source: Nielsen EDI, RSU analysis.Figures have not been inflation adjusted.
30 | UK Film Council Statistical Yearbook
3: Top films 1997–2006 | 31
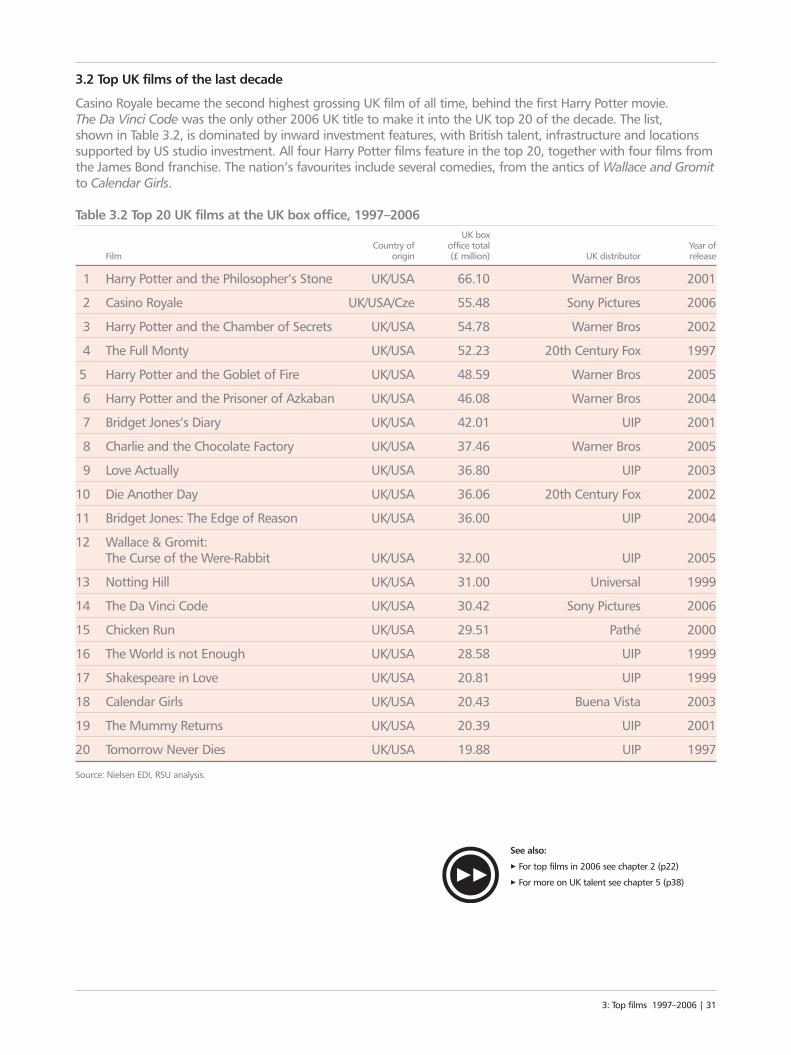
3.2 Top UK films of the last decade
Casino Royale became the second highest grossing UK film of all time, behind the first Harry Potter movie. The Da Vinci Code was the only other 2006 UK title to make it into the UK top 20 of the decade. The list, shown in Table 3.2, is dominated by inward investment features, with British talent, infrastructure and locationssupported by US studio investment. All four Harry Potter films feature in the top 20, together with four films fromthe James Bond franchise. The nation’s favourites include several comedies, from the antics of Wallace and Gromitto Calendar Girls.
Table 3.2 Top 20 UK films at the UK box office, 1997–2006UK box
Country of office total Year ofFilm origin (£ million) UK distributor release
1 Harry Potter and the Philosopher’s Stone UK/USA 66.10 Warner Bros 2001
2 Casino Royale UK/USA/Cze 55.48 Sony Pictures 2006
3 Harry Potter and the Chamber of Secrets UK/USA 54.78 Warner Bros 2002
4 The Full Monty UK/USA 52.23 20th Century Fox 1997
5 Harry Potter and the Goblet of Fire UK/USA 48.59 Warner Bros 2005
6 Harry Potter and the Prisoner of Azkaban UK/USA 46.08 Warner Bros 2004
7 Bridget Jones’s Diary UK/USA 42.01 UIP 2001
8 Charlie and the Chocolate Factory UK/USA 37.46 Warner Bros 2005
9 Love Actually UK/USA 36.80 UIP 2003
10 Die Another Day UK/USA 36.06 20th Century Fox 2002
11 Bridget Jones: The Edge of Reason UK/USA 36.00 UIP 2004
12 Wallace & Gromit: The Curse of the Were-Rabbit UK/USA 32.00 UIP 2005
13 Notting Hill UK/USA 31.00 Universal 1999
14 The Da Vinci Code UK/USA 30.42 Sony Pictures 2006
15 Chicken Run UK/USA 29.51 Pathé 2000
16 The World is not Enough UK/USA 28.58 UIP 1999
17 Shakespeare in Love UK/USA 20.81 UIP 1999
18 Calendar Girls UK/USA 20.43 Buena Vista 2003
19 The Mummy Returns UK/USA 20.39 UIP 2001
20 Tomorrow Never Dies UK/USA 19.88 UIP 1997
Source: Nielsen EDI, RSU analysis.
See also:
3 For top films in 2006 see chapter 2 (p22)
3 For more on UK talent see chapter 5 (p38)

4: UK FILMS INTERNATIONALLYAfter last year’s outstanding success in the globalmarketplace, UK films delivered a more averageperformance in 2006. Even so, the top 10 UK filmsgrossed almost $2 billion worldwide.32 | UK Film Council Statistical Yearbook
“PLAY IT TO
WORLD
Worldwide the gross box office for all filmsincreased by 11% in2006 to $26 billion
UK filmsaccounted for
12% of releases in the USA
The Da Vinci Codewas the strongest UKfilm at the worldwide
box office
From left Caption to images goes here ego cumtene sententian Itaque earud reruamhist entuary sapiente.
4: UK films internationally | 334: UK films internationally | 33
“PLAY IT TO THE WORLD
The market share ofBritish films at the USA boxoffice was 9%, down from16% in 2005, at a value of
$845 million
In Europe, the top British films were The Da
Vinci Code with 31.2 millionadmissions and CasinoRoyale with 23 million
The top 10 performing UK films worldwide grossed
$1,960 million in 2006, 25% down on 2005
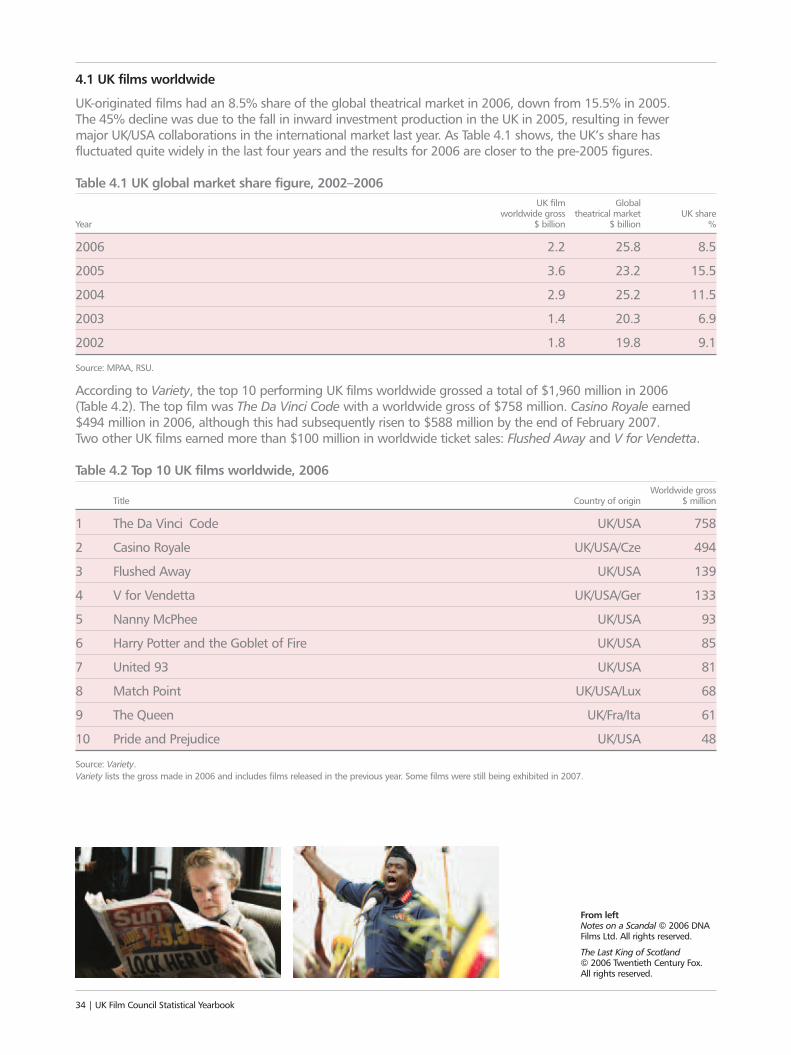
4.1 UK films worldwide
UK-originated films had an 8.5% share of the global theatrical market in 2006, down from 15.5% in 2005. The 45% decline was due to the fall in inward investment production in the UK in 2005, resulting in fewer major UK/USA collaborations in the international market last year. As Table 4.1 shows, the UK’s share hasfluctuated quite widely in the last four years and the results for 2006 are closer to the pre-2005 figures.
Table 4.1 UK global market share figure, 2002–2006UK film Global
worldwide gross theatrical market UK shareYear $ billion $ billion %
2006 2.2 25.8 8.5
2005 3.6 23.2 15.5
2004 2.9 25.2 11.5
2003 1.4 20.3 6.9
2002 1.8 19.8 9.1
Source: MPAA, RSU.
According to Variety, the top 10 performing UK films worldwide grossed a total of $1,960 million in 2006 (Table 4.2). The top film was The Da Vinci Code with a worldwide gross of $758 million. Casino Royale earned$494 million in 2006, although this had subsequently risen to $588 million by the end of February 2007. Two other UK films earned more than $100 million in worldwide ticket sales: Flushed Away and V for Vendetta.
Table 4.2 Top 10 UK films worldwide, 2006Worldwide gross
Title Country of origin $ million
1 The Da Vinci Code UK/USA 758
2 Casino Royale UK/USA/Cze 494
3 Flushed Away UK/USA 139
4 V for Vendetta UK/USA/Ger 133
5 Nanny McPhee UK/USA 93
6 Harry Potter and the Goblet of Fire UK/USA 85
7 United 93 UK/USA 81
8 Match Point UK/USA/Lux 68
9 The Queen UK/Fra/Ita 61
10 Pride and Prejudice UK/USA 48
Source: Variety.Variety lists the gross made in 2006 and includes films released in the previous year. Some films were still being exhibited in 2007.
34 | UK Film Council Statistical Yearbook
From left Notes on a Scandal © 2006 DNA Films Ltd. All rights reserved.
The Last King of Scotland© 2006 Twentieth Century Fox. All rights reserved.
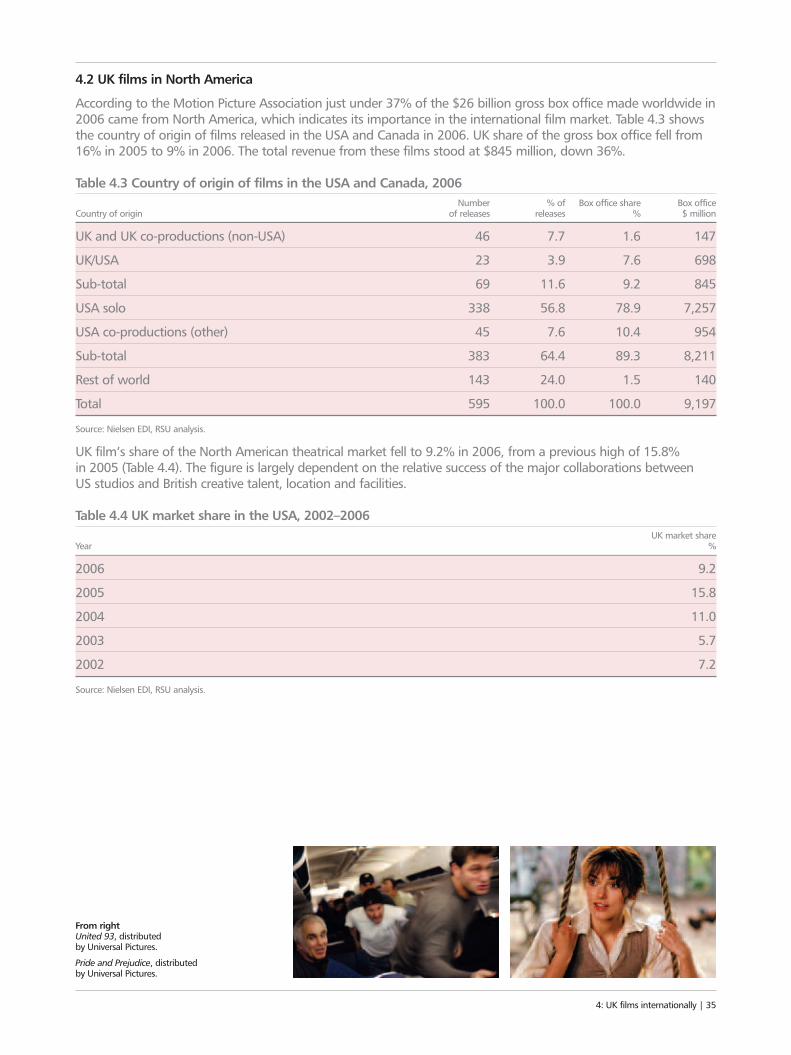
4.2 UK films in North America
According to the Motion Picture Association just under 37% of the $26 billion gross box office made worldwide in2006 came from North America, which indicates its importance in the international film market. Table 4.3 showsthe country of origin of films released in the USA and Canada in 2006. UK share of the gross box office fell from16% in 2005 to 9% in 2006. The total revenue from these films stood at $845 million, down 36%.
Table 4.3 Country of origin of films in the USA and Canada, 2006Number % of Box office share Box office
Country of origin of releases releases % $ million
UK and UK co-productions (non-USA) 46 7.7 1.6 147
UK/USA 23 3.9 7.6 698
Sub-total 69 11.6 9.2 845
USA solo 338 56.8 78.9 7,257
USA co-productions (other) 45 7.6 10.4 954
Sub-total 383 64.4 89.3 8,211
Rest of world 143 24.0 1.5 140
Total 595 100.0 100.0 9,197
Source: Nielsen EDI, RSU analysis.
UK film’s share of the North American theatrical market fell to 9.2% in 2006, from a previous high of 15.8% in 2005 (Table 4.4). The figure is largely dependent on the relative success of the major collaborations between US studios and British creative talent, location and facilities.
Table 4.4 UK market share in the USA, 2002–2006UK market share
Year %
2006 9.2
2005 15.8
2004 11.0
2003 5.7
2002 7.2
Source: Nielsen EDI, RSU analysis.
4: UK films internationally | 35
From rightUnited 93, distributed by Universal Pictures.
Pride and Prejudice, distributed by Universal Pictures.
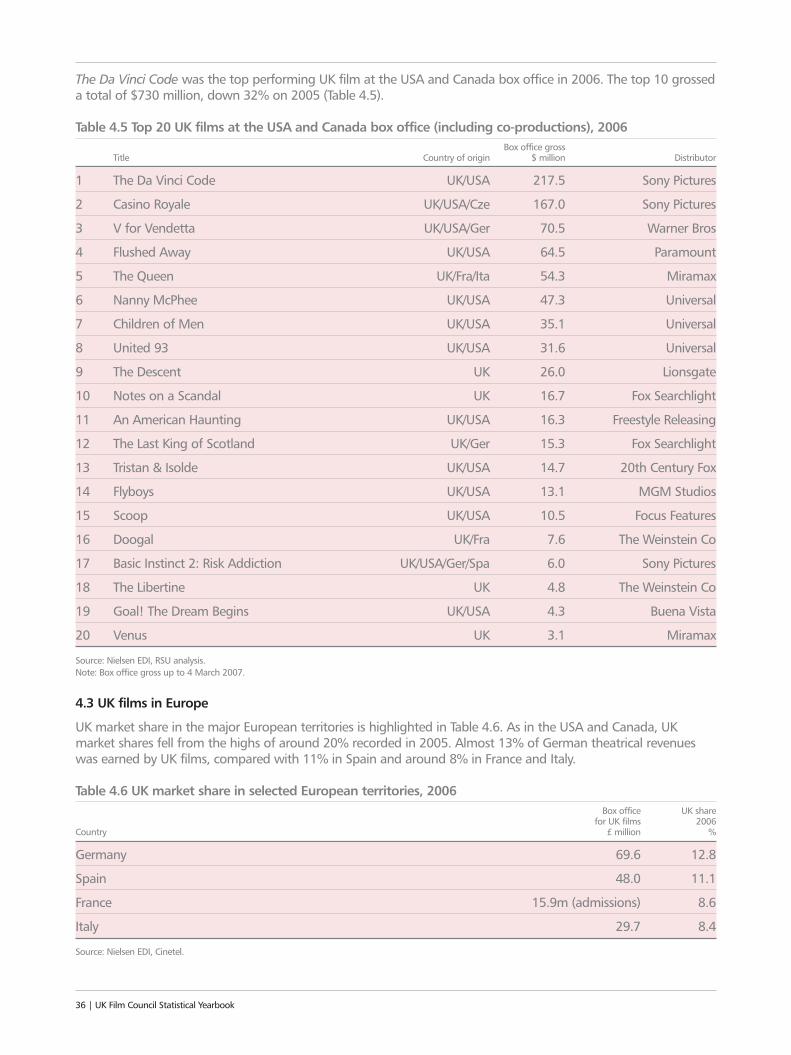
The Da Vinci Code was the top performing UK film at the USA and Canada box office in 2006. The top 10 grosseda total of $730 million, down 32% on 2005 (Table 4.5).
Table 4.5 Top 20 UK films at the USA and Canada box office (including co-productions), 2006Box office gross
Title Country of origin $ million Distributor
1 The Da Vinci Code UK/USA 217.5 Sony Pictures
2 Casino Royale UK/USA/Cze 167.0 Sony Pictures
3 V for Vendetta UK/USA/Ger 70.5 Warner Bros
4 Flushed Away UK/USA 64.5 Paramount
5 The Queen UK/Fra/Ita 54.3 Miramax
6 Nanny McPhee UK/USA 47.3 Universal
7 Children of Men UK/USA 35.1 Universal
8 United 93 UK/USA 31.6 Universal
9 The Descent UK 26.0 Lionsgate
10 Notes on a Scandal UK 16.7 Fox Searchlight
11 An American Haunting UK/USA 16.3 Freestyle Releasing
12 The Last King of Scotland UK/Ger 15.3 Fox Searchlight
13 Tristan & Isolde UK/USA 14.7 20th Century Fox
14 Flyboys UK/USA 13.1 MGM Studios
15 Scoop UK/USA 10.5 Focus Features
16 Doogal UK/Fra 7.6 The Weinstein Co
17 Basic Instinct 2: Risk Addiction UK/USA/Ger/Spa 6.0 Sony Pictures
18 The Libertine UK 4.8 The Weinstein Co
19 Goal! The Dream Begins UK/USA 4.3 Buena Vista
20 Venus UK 3.1 Miramax
Source: Nielsen EDI, RSU analysis.Note: Box office gross up to 4 March 2007.
4.3 UK films in Europe
UK market share in the major European territories is highlighted in Table 4.6. As in the USA and Canada, UKmarket shares fell from the highs of around 20% recorded in 2005. Almost 13% of German theatrical revenueswas earned by UK films, compared with 11% in Spain and around 8% in France and Italy.
Table 4.6 UK market share in selected European territories, 2006Box office UK share
for UK films 2006Country £ million %
Germany 69.6 12.8
Spain 48.0 11.1
France 15.9m (admissions) 8.6
Italy 29.7 8.4
Source: Nielsen EDI, Cinetel.
36 | UK Film Council Statistical Yearbook
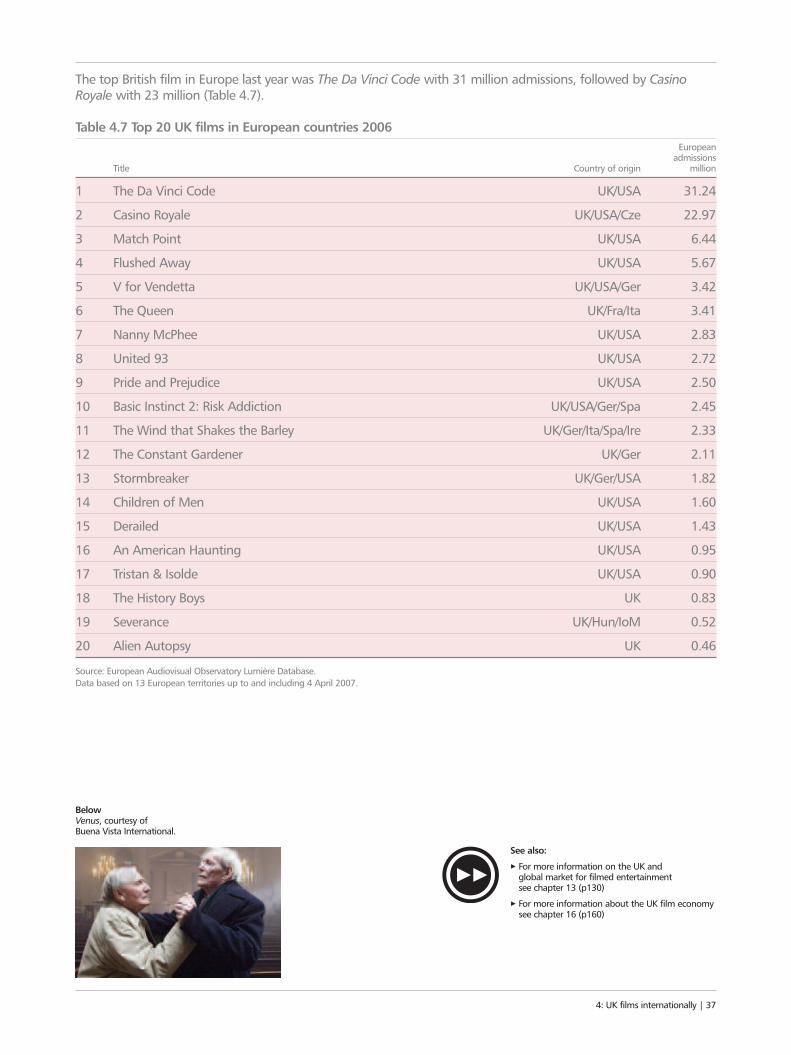
The top British film in Europe last year was The Da Vinci Code with 31 million admissions, followed by CasinoRoyale with 23 million (Table 4.7).
Table 4.7 Top 20 UK films in European countries 2006European
admissions Title Country of origin million
1 The Da Vinci Code UK/USA 31.24
2 Casino Royale UK/USA/Cze 22.97
3 Match Point UK/USA 6.44
4 Flushed Away UK/USA 5.67
5 V for Vendetta UK/USA/Ger 3.42
6 The Queen UK/Fra/Ita 3.41
7 Nanny McPhee UK/USA 2.83
8 United 93 UK/USA 2.72
9 Pride and Prejudice UK/USA 2.50
10 Basic Instinct 2: Risk Addiction UK/USA/Ger/Spa 2.45
11 The Wind that Shakes the Barley UK/Ger/Ita/Spa/Ire 2.33
12 The Constant Gardener UK/Ger 2.11
13 Stormbreaker UK/Ger/USA 1.82
14 Children of Men UK/USA 1.60
15 Derailed UK/USA 1.43
16 An American Haunting UK/USA 0.95
17 Tristan & Isolde UK/USA 0.90
18 The History Boys UK 0.83
19 Severance UK/Hun/IoM 0.52
20 Alien Autopsy UK 0.46
Source: European Audiovisual Observatory Lumière Database.Data based on 13 European territories up to and including 4 April 2007.
4: UK films internationally | 37
See also:
3 For more information on the UK and global market for filmed entertainment see chapter 13 (p130)
3 For more information about the UK film economysee chapter 16 (p160)
BelowVenus, courtesy of Buena Vista International.

5: UK TALENT AND THE GLOBAL BOX OFFICEStories created by UK writers have dominated the globalbox office over the last few years and British actingtalent has also played a starring role in many recentblockbusters. Both help to project strong images of UKcultural and national identity across the world.
38 | UK Film Council Statistical Yearbook
“WHERE’S THE WRITER?Six of the top 10 earners worldwide
are from novels by the British writers
JRR Tolkien and JK Rowling

5: UK talent and the global box office | 39
“WHERE’S THE WRITER?31 of the top 200
films worldwide are based on stories andcharacters created by UK writers and haveearned more than $13 billion over the
last five years
British directors have directed 19
of the 200 biggestfilms over the last
six years
UK acting talentfeature in more
than half of the top200 films released
worldwide since 2001
5.1 UK story material
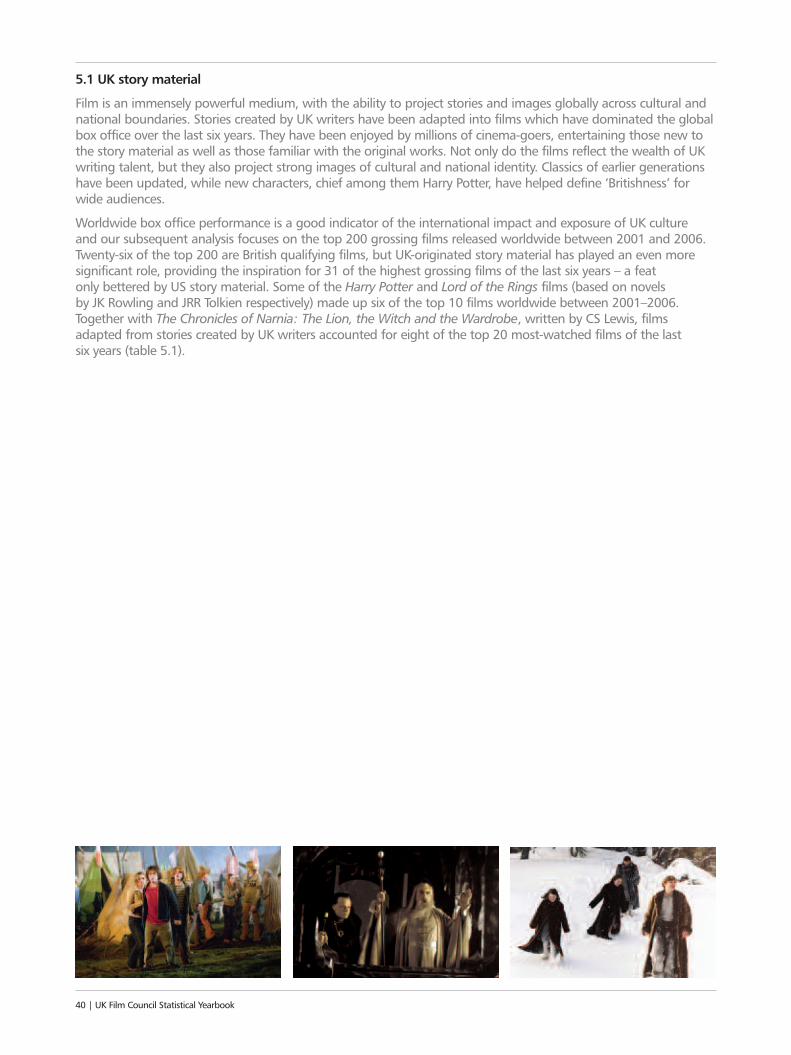
Film is an immensely powerful medium, with the ability to project stories and images globally across cultural andnational boundaries. Stories created by UK writers have been adapted into films which have dominated the globalbox office over the last six years. They have been enjoyed by millions of cinema-goers, entertaining those new tothe story material as well as those familiar with the original works. Not only do the films reflect the wealth of UKwriting talent, but they also project strong images of cultural and national identity. Classics of earlier generationshave been updated, while new characters, chief among them Harry Potter, have helped define ‘Britishness’ forwide audiences.
Worldwide box office performance is a good indicator of the international impact and exposure of UK culture and our subsequent analysis focuses on the top 200 grossing films released worldwide between 2001 and 2006.Twenty-six of the top 200 are British qualifying films, but UK-originated story material has played an even moresignificant role, providing the inspiration for 31 of the highest grossing films of the last six years – a feat only bettered by US story material. Some of the Harry Potter and Lord of the Rings films (based on novels by JK Rowling and JRR Tolkien respectively) made up six of the top 10 films worldwide between 2001–2006.Together with The Chronicles of Narnia: The Lion, the Witch and the Wardrobe, written by CS Lewis, filmsadapted from stories created by UK writers accounted for eight of the top 20 most-watched films of the last six years (table 5.1).
40 | UK Film Council Statistical Yearbook
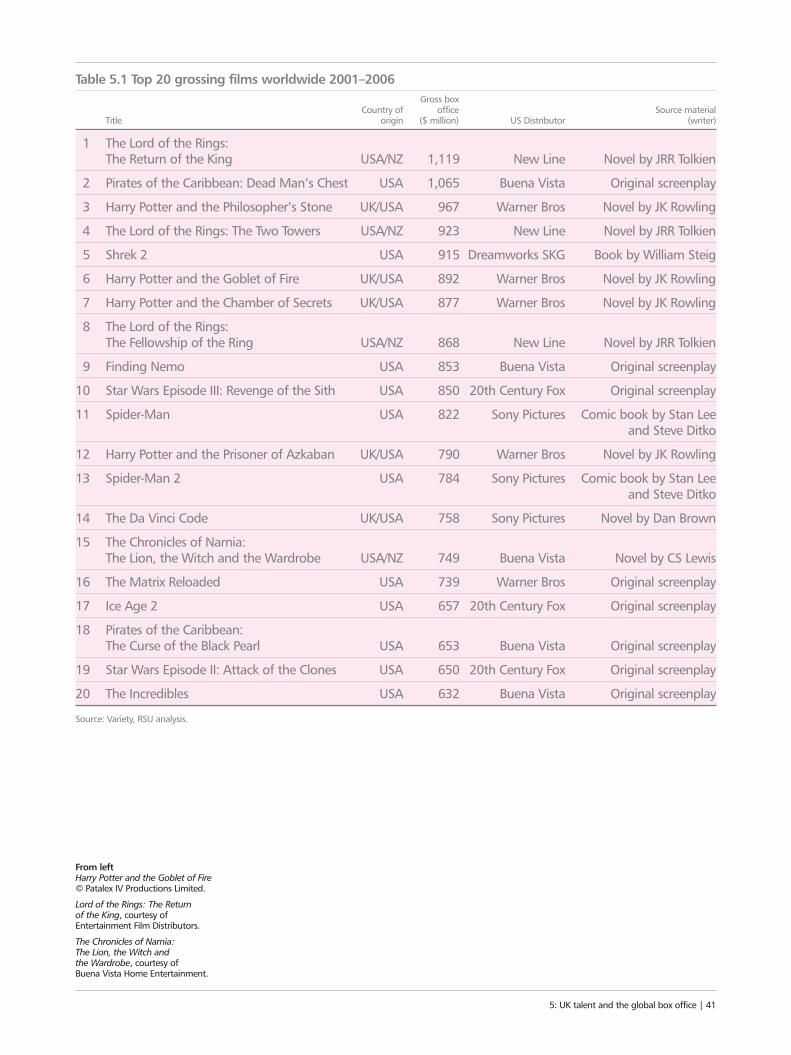
Table 5.1 Top 20 grossing films worldwide 2001–2006Gross box
Country of office Source materialTitle origin ($ million) US Distributor (writer)
1 The Lord of the Rings: The Return of the King USA/NZ 1,119 New Line Novel by JRR Tolkien
2 Pirates of the Caribbean: Dead Man’s Chest USA 1,065 Buena Vista Original screenplay
3 Harry Potter and the Philosopher’s Stone UK/USA 967 Warner Bros Novel by JK Rowling
4 The Lord of the Rings: The Two Towers USA/NZ 923 New Line Novel by JRR Tolkien
5 Shrek 2 USA 915 Dreamworks SKG Book by William Steig
6 Harry Potter and the Goblet of Fire UK/USA 892 Warner Bros Novel by JK Rowling
7 Harry Potter and the Chamber of Secrets UK/USA 877 Warner Bros Novel by JK Rowling
8 The Lord of the Rings: The Fellowship of the Ring USA/NZ 868 New Line Novel by JRR Tolkien
9 Finding Nemo USA 853 Buena Vista Original screenplay
10 Star Wars Episode III: Revenge of the Sith USA 850 20th Century Fox Original screenplay
11 Spider-Man USA 822 Sony Pictures Comic book by Stan Leeand Steve Ditko
12 Harry Potter and the Prisoner of Azkaban UK/USA 790 Warner Bros Novel by JK Rowling
13 Spider-Man 2 USA 784 Sony Pictures Comic book by Stan Leeand Steve Ditko
14 The Da Vinci Code UK/USA 758 Sony Pictures Novel by Dan Brown
15 The Chronicles of Narnia: The Lion, the Witch and the Wardrobe USA/NZ 749 Buena Vista Novel by CS Lewis
16 The Matrix Reloaded USA 739 Warner Bros Original screenplay
17 Ice Age 2 USA 657 20th Century Fox Original screenplay
18 Pirates of the Caribbean: The Curse of the Black Pearl USA 653 Buena Vista Original screenplay
19 Star Wars Episode II: Attack of the Clones USA 650 20th Century Fox Original screenplay
20 The Incredibles USA 632 Buena Vista Original screenplay
Source: Variety, RSU analysis.
5: UK talent and the global box office | 41
From left Harry Potter and the Goblet of Fire© Patalex IV Productions Limited.
Lord of the Rings: The Return of the King, courtesy of Entertainment Film Distributors.
The Chronicles of Narnia: The Lion, the Witch and the Wardrobe, courtesy of Buena Vista Home Entertainment.
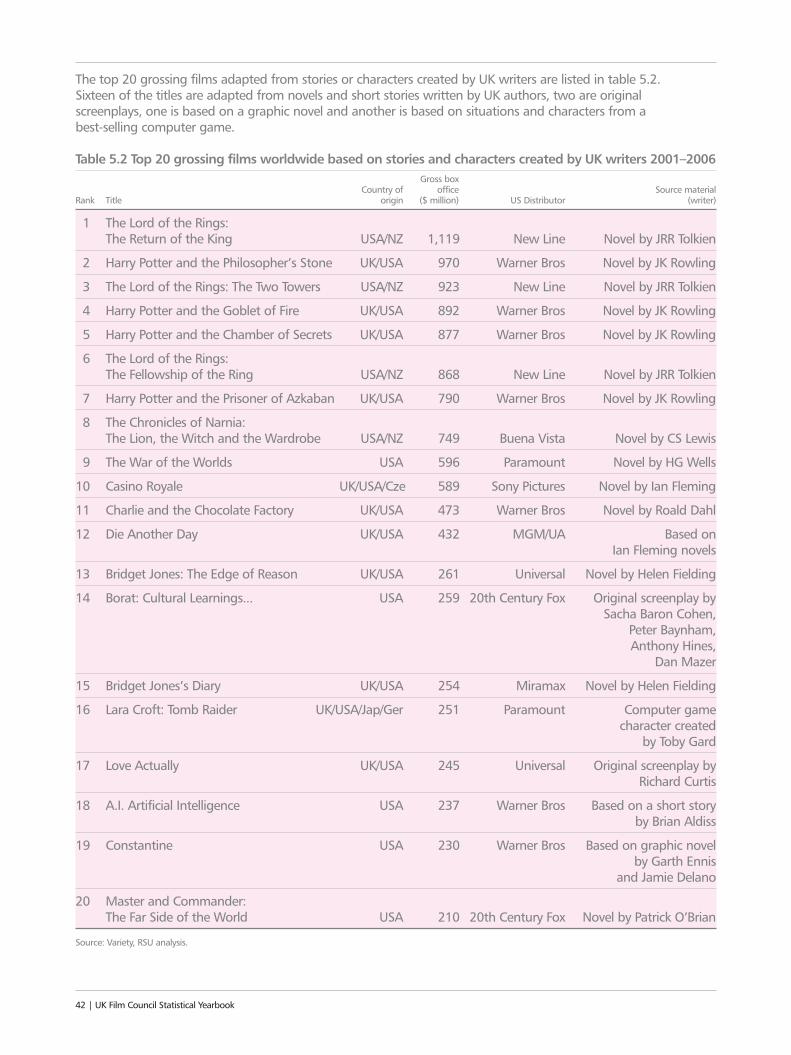
The top 20 grossing films adapted from stories or characters created by UK writers are listed in table 5.2. Sixteen of the titles are adapted from novels and short stories written by UK authors, two are original screenplays, one is based on a graphic novel and another is based on situations and characters from a best-selling computer game.
Table 5.2 Top 20 grossing films worldwide based on stories and characters created by UK writers 2001–2006Gross box
Country of office Source materialRank Title origin ($ million) US Distributor (writer)
1 The Lord of the Rings: The Return of the King USA/NZ 1,119 New Line Novel by JRR Tolkien
2 Harry Potter and the Philosopher’s Stone UK/USA 970 Warner Bros Novel by JK Rowling
3 The Lord of the Rings: The Two Towers USA/NZ 923 New Line Novel by JRR Tolkien
4 Harry Potter and the Goblet of Fire UK/USA 892 Warner Bros Novel by JK Rowling
5 Harry Potter and the Chamber of Secrets UK/USA 877 Warner Bros Novel by JK Rowling
6 The Lord of the Rings: The Fellowship of the Ring USA/NZ 868 New Line Novel by JRR Tolkien
7 Harry Potter and the Prisoner of Azkaban UK/USA 790 Warner Bros Novel by JK Rowling
8 The Chronicles of Narnia:The Lion, the Witch and the Wardrobe USA/NZ 749 Buena Vista Novel by CS Lewis
9 The War of the Worlds USA 596 Paramount Novel by HG Wells
10 Casino Royale UK/USA/Cze 589 Sony Pictures Novel by Ian Fleming
11 Charlie and the Chocolate Factory UK/USA 473 Warner Bros Novel by Roald Dahl
12 Die Another Day UK/USA 432 MGM/UA Based on Ian Fleming novels
13 Bridget Jones: The Edge of Reason UK/USA 261 Universal Novel by Helen Fielding
14 Borat: Cultural Learnings... USA 259 20th Century Fox Original screenplay by Sacha Baron Cohen,
Peter Baynham, Anthony Hines,
Dan Mazer
15 Bridget Jones’s Diary UK/USA 254 Miramax Novel by Helen Fielding
16 Lara Croft: Tomb Raider UK/USA/Jap/Ger 251 Paramount Computer game character created
by Toby Gard
17 Love Actually UK/USA 245 Universal Original screenplay by Richard Curtis
18 A.I. Artificial Intelligence USA 237 Warner Bros Based on a short storyby Brian Aldiss
19 Constantine USA 230 Warner Bros Based on graphic novel by Garth Ennis
and Jamie Delano
20 Master and Commander: The Far Side of the World USA 210 20th Century Fox Novel by Patrick O’Brian
Source: Variety, RSU analysis.
42 | UK Film Council Statistical Yearbook
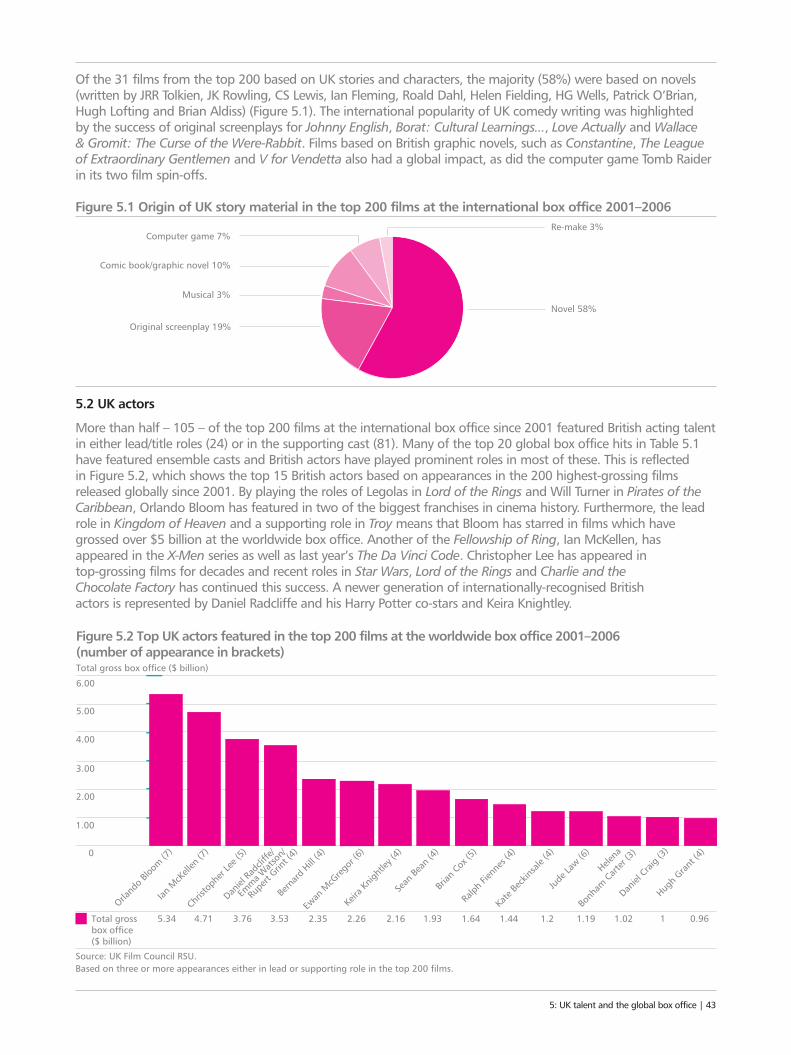
Of the 31 films from the top 200 based on UK stories and characters, the majority (58%) were based on novels(written by JRR Tolkien, JK Rowling, CS Lewis, Ian Fleming, Roald Dahl, Helen Fielding, HG Wells, Patrick O’Brian,Hugh Lofting and Brian Aldiss) (Figure 5.1). The international popularity of UK comedy writing was highlighted by the success of original screenplays for Johnny English, Borat: Cultural Learnings..., Love Actually and Wallace & Gromit: The Curse of the Were-Rabbit. Films based on British graphic novels, such as Constantine, The Leagueof Extraordinary Gentlemen and V for Vendetta also had a global impact, as did the computer game Tomb Raiderin its two film spin-offs.
Figure 5.1 Origin of UK story material in the top 200 films at the international box office 2001–2006
5.2 UK actors
More than half – 105 – of the top 200 films at the international box office since 2001 featured British acting talentin either lead/title roles (24) or in the supporting cast (81). Many of the top 20 global box office hits in Table 5.1have featured ensemble casts and British actors have played prominent roles in most of these. This is reflected in Figure 5.2, which shows the top 15 British actors based on appearances in the 200 highest-grossing filmsreleased globally since 2001. By playing the roles of Legolas in Lord of the Rings and Will Turner in Pirates of theCaribbean, Orlando Bloom has featured in two of the biggest franchises in cinema history. Furthermore, the leadrole in Kingdom of Heaven and a supporting role in Troy means that Bloom has starred in films which havegrossed over $5 billion at the worldwide box office. Another of the Fellowship of Ring, Ian McKellen, hasappeared in the X-Men series as well as last year’s The Da Vinci Code. Christopher Lee has appeared in top-grossing films for decades and recent roles in Star Wars, Lord of the Rings and Charlie and the Chocolate Factory has continued this success. A newer generation of internationally-recognised British actors is represented by Daniel Radcliffe and his Harry Potter co-stars and Keira Knightley.
5: UK talent and the global box office | 43
0
5.00
6.00
Orland
o Bloo
m (7)
Ian M
cKell
en (7
)
Christ
ophe
r Lee
(5)
Rupe
rt Grin
t (4)
Emma W
atson
/
Daniel
Radc
liffe/
Bern
ard H
ill (4)
Ewan
McG
regor
(6)
Keira
Knigh
tley (
4)
Brian
Cox (5
)
Ralph
Fien
nes (
4)
Kate
Beck
insale
(4)
Jude
Law (6
)
Helena
Bonh
am Cart
er (3)
Daniel
Craig (
3)
Hugh G
rant (
4)
Sean
Bean
(4)
Total gross box office ($ billion)
Figure 5.2 Top UK actors featured in the top 200 films at the worldwide box office 2001–2006 (number of appearance in brackets)
3.00
Source: UK Film Council RSU.Based on three or more appearances either in lead or supporting role in the top 200 films.
4.00
2.00
1.00
5.34 4.71 3.76 3.53 2.35 2.26 2.16 1.93 1.64 1.44 1.2 1.19 1.02 1 0.96Total gross box office ($ billion)
Novel 58%
Re-make 3%
Musical 3%
Computer game 7%
Comic book/graphic novel 10%
Original screenplay 19%
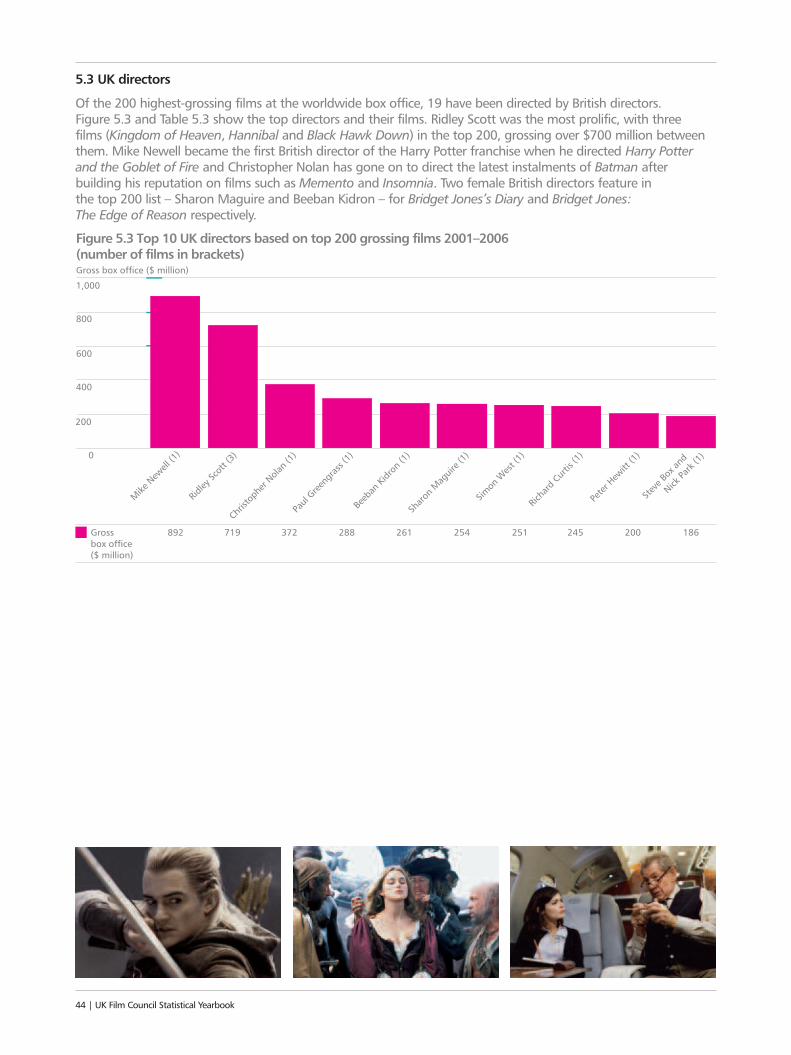
5.3 UK directors
Of the 200 highest-grossing films at the worldwide box office, 19 have been directed by British directors. Figure 5.3 and Table 5.3 show the top directors and their films. Ridley Scott was the most prolific, with three films (Kingdom of Heaven, Hannibal and Black Hawk Down) in the top 200, grossing over $700 million betweenthem. Mike Newell became the first British director of the Harry Potter franchise when he directed Harry Potterand the Goblet of Fire and Christopher Nolan has gone on to direct the latest instalments of Batman afterbuilding his reputation on films such as Memento and Insomnia. Two female British directors feature in the top 200 list – Sharon Maguire and Beeban Kidron – for Bridget Jones’s Diary and Bridget Jones: The Edge of Reason respectively.
44 | UK Film Council Statistical Yearbook
892 719 372 288 261 254 251 245 200 186Gross box office ($ million)
0
800
1,000
Mike
New
ell (1
)
Ridley
Scot
t (3)
Christ
ophe
r Nola
n (1)
Paul
Greeng
rass (
1)
Beeb
an Ki
dron
(1)
Sharo
n Mag
uire (
1)
Richa
rd Cur
tis (1
)
Peter
Hew
itt (1
)
Steve
Box a
nd
Nick
Park
(1)
Simon
Wes
t (1)
Gross box office ($ million)
Figure 5.3 Top 10 UK directors based on top 200 grossing films 2001–2006 (number of films in brackets)
600
400
200
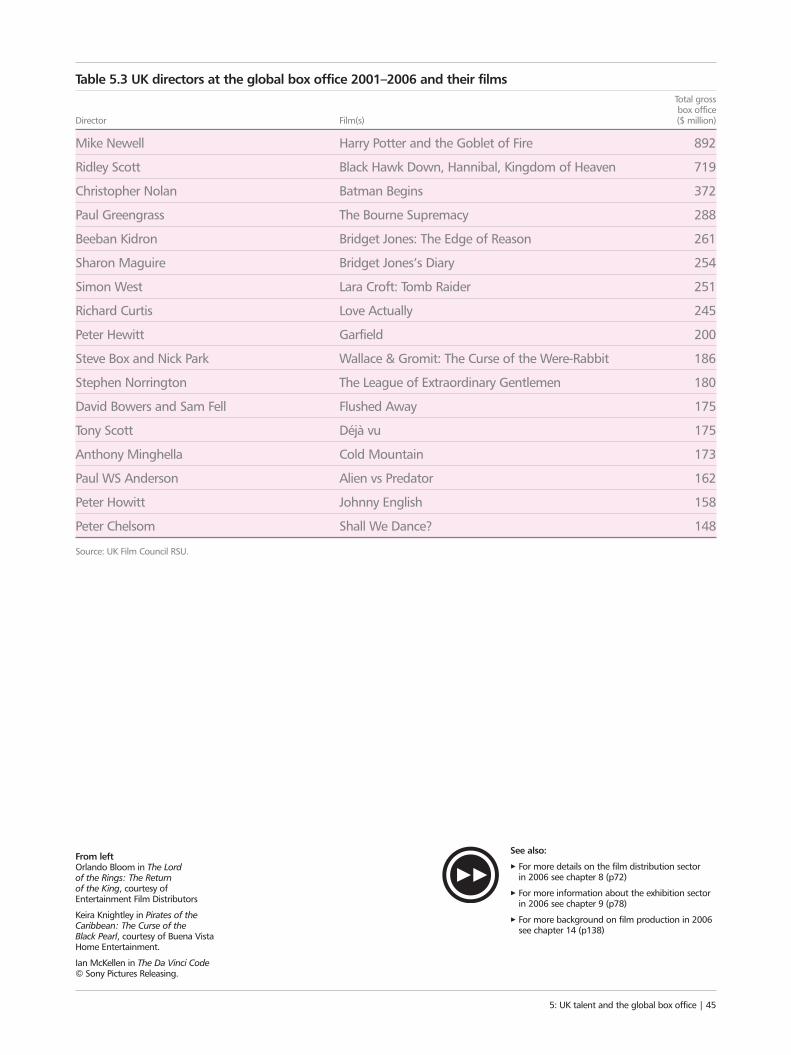
Table 5.3 UK directors at the global box office 2001–2006 and their filmsTotal grossbox office
Director Film(s) ($ million)
Mike Newell Harry Potter and the Goblet of Fire 892
Ridley Scott Black Hawk Down, Hannibal, Kingdom of Heaven 719
Christopher Nolan Batman Begins 372
Paul Greengrass The Bourne Supremacy 288
Beeban Kidron Bridget Jones: The Edge of Reason 261
Sharon Maguire Bridget Jones’s Diary 254
Simon West Lara Croft: Tomb Raider 251
Richard Curtis Love Actually 245
Peter Hewitt Garfield 200
Steve Box and Nick Park Wallace & Gromit: The Curse of the Were-Rabbit 186
Stephen Norrington The League of Extraordinary Gentlemen 180
David Bowers and Sam Fell Flushed Away 175
Tony Scott Déjà vu 175
Anthony Minghella Cold Mountain 173
Paul WS Anderson Alien vs Predator 162
Peter Howitt Johnny English 158
Peter Chelsom Shall We Dance? 148
Source: UK Film Council RSU.
From left Orlando Bloom in The Lord of the Rings: The Return of the King, courtesy of Entertainment Film Distributors
Keira Knightley in Pirates of theCaribbean: The Curse of the Black Pearl, courtesy of Buena VistaHome Entertainment.
Ian McKellen in The Da Vinci Code© Sony Pictures Releasing.
5: UK talent and the global box office | 45
See also:
3 For more details on the film distribution sector in 2006 see chapter 8 (p72)
3 For more information about the exhibition sectorin 2006 see chapter 9 (p78)
3 For more background on film production in 2006see chapter 14 (p138)
6: RELEASE HISTORY OF UK FILMS The cinema release of a feature film has an importantinfluence on its performance in later release windows. It helps create a buzz around the film that echoesthrough its subsequent releases in ancillary markets,such as retail and rental DVD and video-on-demand.However, not all UK films get the chance to betheatrically released internationally or even locally.46 | UK Film Council Statistical Yearbook
The international release rate of British films
certified between 2000 and 2005 improved from 60% to 70%
British films were more likely to be
released in the UK,Ireland and
internationally than UK co-productions Almost 100% of UK
studio films have achieved an international theatricalrelease compared with just
57% for independent UK films
“LET’S GET THIS ON SCREEN

6: Release history of UK films | 47
International UK filmreleases increased as a
proportion of internationalrelease opportunities
60.2% of UK films were released
internationally accountingfor 82.3% of total UK
film budgets
Almost half of the UK films certified
(2000–2005) andaccounting for 71.8%
of total UK film budgetshave been released in
the UK and Ireland
ON SCREEN
6.1 UK films released in the UK and the Republic of Ireland
In this chapter, a UK film is defined as one that:
• qualified as British under Schedule 1 of the Films Act 1985 (Schedule 1); or
• a co-production made under one of the UK’s official international co-production treaties or the EuropeanConvention on Cinematographic Co-production (Co-pro).
We restrict our analysis to the years of certification from 2000 to 2005 due to availability of historical data and the fact that it may take a number of years before a certified film is theatrically released. As of 4 March 2007, the median elapsed time from certification to a UK release was 153 days over this six-year period. It should benoted that the two types of certification considered here are not pre-conditions to the UK release of a UK film. In fact, 59 (6.8%) of the 871 certified UK films included in this analysis were theatrically released before receivingtheir certification.
Here a film is considered to be theatrically released if it was recorded as such on the multi-territory Nielsen EDI box office database. This database covers 12 territories including the UK and the Republic of Ireland which areconsidered as one territory. Short films, re-releases, releases in film festivals and films with budgets of less than£100,000 have been excluded from this analysis.
It should be borne in mind that the number of effective theatrical release slots each year is tightly constrained(there being only 52 weekends per year) and films can also be released on DVD/video, shown on television or downloaded.
Out of 871 UK films certified between 2000 and 2005, only 414 (47.5%) had been theatrically released in the UK and the Republic of Ireland by 4 March 2007, as shown in Table 6.1. Films certified in 2003 had the lowestrelease rate (43.7%) while those certified in 2005 had a release rate of 48.8%, slightly above the average for thewhole period.
Table 6.1 UK films released in the UK and Republic of Ireland, certification years 2000–2005 2000 2001 2002 2003 2004 2005 Total
Number of films released 68 54 61 69 79 83 414
% released 52.7 45.4 49.2 43.7 46.2 48.8 47.5
Number of films certified 129 119 124 158 171 170 871
Source: Nielsen EDI, DCMS, RSU analysis.Release rates up to 4 March 2007.
Generally speaking, bigger budget films were more likely to be released. In 2000 to 2005, films that had atheatrical release in the UK and Republic of Ireland accounted for 72% of the total budgets of UK films. Table 6.2shows the gradual increase (except for 2003) in the proportions of budgets spent on UK films that were releasedin the UK and the Republic of Ireland.
Table 6.2 Total budget (£ million) of UK films released in the UK and Republic of Ireland, certification years2000–2005
2000 2001 2002 2003 2004 2005 Total
Budget of released films£ million 306 566 725 468 1,378 1,239 4,681
% of total budget 68.6 67.8 70.4 61.8 75.6 75.9 71.8
Total budget £ million 445 834 1,031 756 1,822 1,632 6,520
Source: Nielsen EDI, DCMS, RSU analysis. Release rates up to 4 March 2007.
48 | UK Film Council Statistical Yearbook
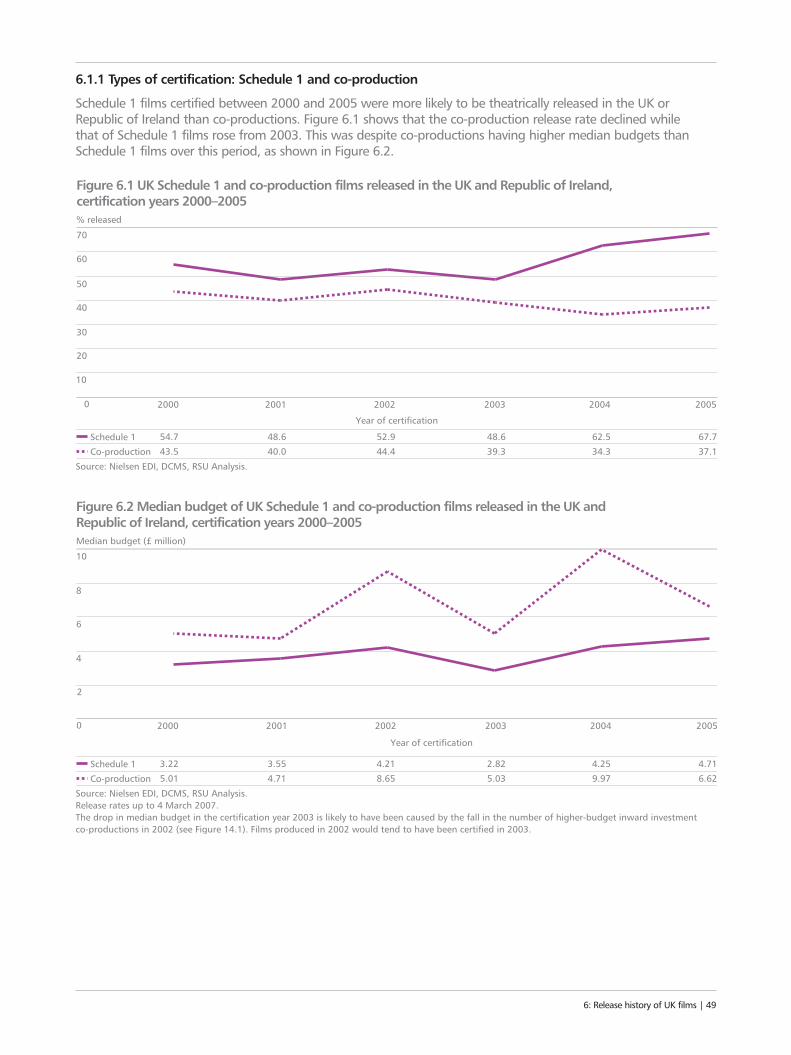
6.1.1 Types of certification: Schedule 1 and co-production
Schedule 1 films certified between 2000 and 2005 were more likely to be theatrically released in the UK orRepublic of Ireland than co-productions. Figure 6.1 shows that the co-production release rate declined while that of Schedule 1 films rose from 2003. This was despite co-productions having higher median budgets thanSchedule 1 films over this period, as shown in Figure 6.2.
6: Release history of UK films | 49
0
20
10
30
50
40
70
60
2000 2001 2002
Year of certification
2003 20052004
% released
Figure 6.1 UK Schedule 1 and co-production films released in the UK and Republic of Ireland, certification years 2000–2005
Source: Nielsen EDI, DCMS, RSU Analysis.
54.7 52.9 48.6 67.7Schedule 143.5 44.4 39.3 37.1Co-production
62.534.3
48.640.0
0
2
4
6
10
8
2000 2001 2002 2003 20052004
Median budget (£ million)
Figure 6.2 Median budget of UK Schedule 1 and co-production films released in the UK and Republic of Ireland, certification years 2000–2005
Year of certification
Source: Nielsen EDI, DCMS, RSU Analysis.Release rates up to 4 March 2007.The drop in median budget in the certification year 2003 is likely to have been caused by the fall in the number of higher-budget inward investmentco-productions in 2002 (see Figure 14.1). Films produced in 2002 would tend to have been certified in 2003.
3.22 4.21 2.82 4.71Schedule 15.01 8.65 5.03 6.62Co-production
4.259.97
3.554.71
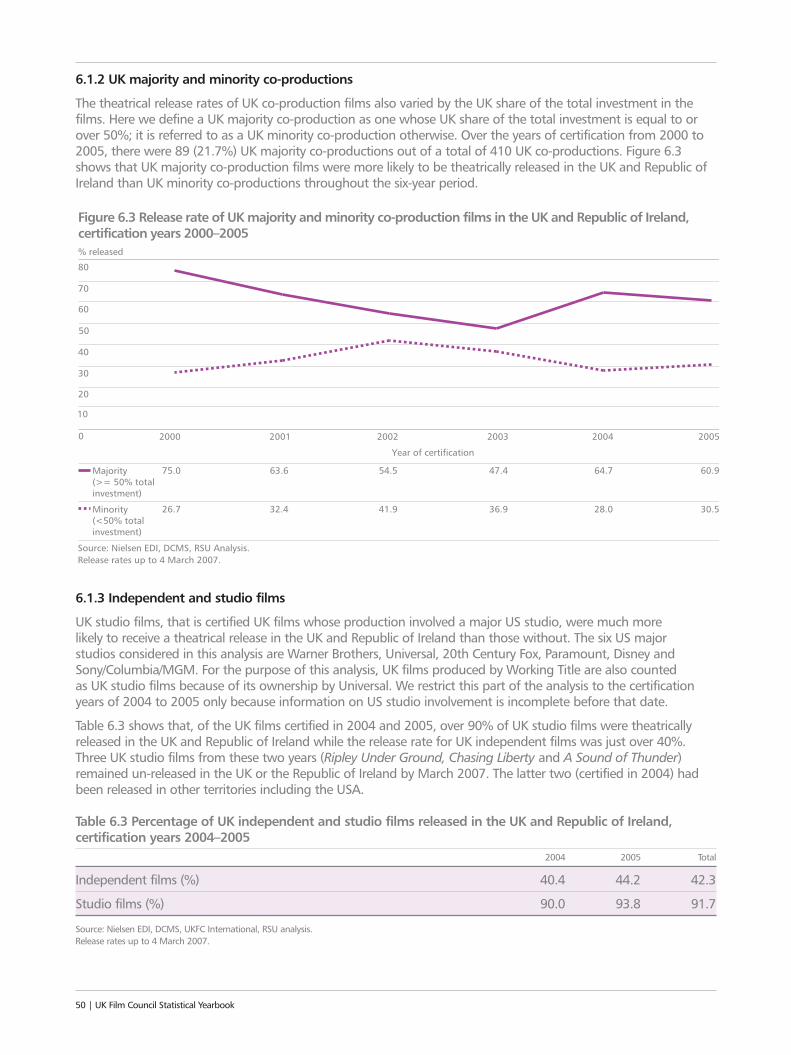
6.1.2 UK majority and minority co-productions
The theatrical release rates of UK co-production films also varied by the UK share of the total investment in thefilms. Here we define a UK majority co-production as one whose UK share of the total investment is equal to orover 50%; it is referred to as a UK minority co-production otherwise. Over the years of certification from 2000 to2005, there were 89 (21.7%) UK majority co-productions out of a total of 410 UK co-productions. Figure 6.3shows that UK majority co-production films were more likely to be theatrically released in the UK and Republic ofIreland than UK minority co-productions throughout the six-year period.
6.1.3 Independent and studio films
UK studio films, that is certified UK films whose production involved a major US studio, were much more likely to receive a theatrical release in the UK and Republic of Ireland than those without. The six US major studios considered in this analysis are Warner Brothers, Universal, 20th Century Fox, Paramount, Disney andSony/Columbia/MGM. For the purpose of this analysis, UK films produced by Working Title are also counted as UK studio films because of its ownership by Universal. We restrict this part of the analysis to the certificationyears of 2004 to 2005 only because information on US studio involvement is incomplete before that date.
Table 6.3 shows that, of the UK films certified in 2004 and 2005, over 90% of UK studio films were theatricallyreleased in the UK and Republic of Ireland while the release rate for UK independent films was just over 40%.Three UK studio films from these two years (Ripley Under Ground, Chasing Liberty and A Sound of Thunder)remained un-released in the UK or the Republic of Ireland by March 2007. The latter two (certified in 2004) hadbeen released in other territories including the USA.
Table 6.3 Percentage of UK independent and studio films released in the UK and Republic of Ireland,certification years 2004–2005
2004 2005 Total
Independent films (%) 40.4 44.2 42.3
Studio films (%) 90.0 93.8 91.7
Source: Nielsen EDI, DCMS, UKFC International, RSU analysis. Release rates up to 4 March 2007.
50 | UK Film Council Statistical Yearbook
0
20
40
60
80
70
2000 2001 2002 2003 20052004
% released
Figure 6.3 Release rate of UK majority and minority co-production films in the UK and Republic of Ireland, certification years 2000–2005
50
30
10
Year of certification
Source: Nielsen EDI, DCMS, RSU Analysis.Release rates up to 4 March 2007.
75.0 54.5 47.4 60.9Majority (>= 50% total investment)
26.7 41.9 36.9 30.5Minority (<50% total investment)
64.7
28.0
63.6
32.4
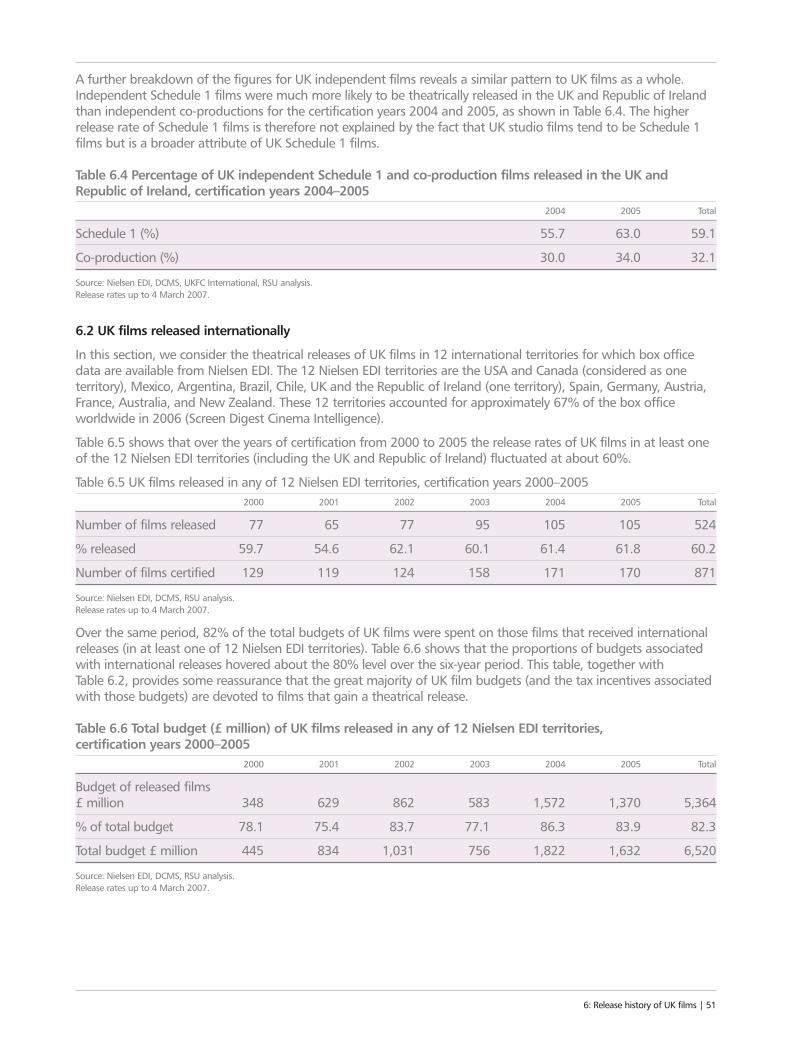
A further breakdown of the figures for UK independent films reveals a similar pattern to UK films as a whole.Independent Schedule 1 films were much more likely to be theatrically released in the UK and Republic of Irelandthan independent co-productions for the certification years 2004 and 2005, as shown in Table 6.4. The higherrelease rate of Schedule 1 films is therefore not explained by the fact that UK studio films tend to be Schedule 1films but is a broader attribute of UK Schedule 1 films.
Table 6.4 Percentage of UK independent Schedule 1 and co-production films released in the UK andRepublic of Ireland, certification years 2004–2005
2004 2005 Total
Schedule 1 (%) 55.7 63.0 59.1
Co-production (%) 30.0 34.0 32.1
Source: Nielsen EDI, DCMS, UKFC International, RSU analysis.Release rates up to 4 March 2007.
6.2 UK films released internationally
In this section, we consider the theatrical releases of UK films in 12 international territories for which box officedata are available from Nielsen EDI. The 12 Nielsen EDI territories are the USA and Canada (considered as oneterritory), Mexico, Argentina, Brazil, Chile, UK and the Republic of Ireland (one territory), Spain, Germany, Austria,France, Australia, and New Zealand. These 12 territories accounted for approximately 67% of the box officeworldwide in 2006 (Screen Digest Cinema Intelligence).
Table 6.5 shows that over the years of certification from 2000 to 2005 the release rates of UK films in at least oneof the 12 Nielsen EDI territories (including the UK and Republic of Ireland) fluctuated at about 60%.
Table 6.5 UK films released in any of 12 Nielsen EDI territories, certification years 2000–2005 2000 2001 2002 2003 2004 2005 Total
Number of films released 77 65 77 95 105 105 524
% released 59.7 54.6 62.1 60.1 61.4 61.8 60.2
Number of films certified 129 119 124 158 171 170 871
Source: Nielsen EDI, DCMS, RSU analysis.Release rates up to 4 March 2007.
Over the same period, 82% of the total budgets of UK films were spent on those films that received internationalreleases (in at least one of 12 Nielsen EDI territories). Table 6.6 shows that the proportions of budgets associatedwith international releases hovered about the 80% level over the six-year period. This table, together with Table 6.2, provides some reassurance that the great majority of UK film budgets (and the tax incentives associatedwith those budgets) are devoted to films that gain a theatrical release.
Table 6.6 Total budget (£ million) of UK films released in any of 12 Nielsen EDI territories, certification years 2000–2005
2000 2001 2002 2003 2004 2005 Total
Budget of released films£ million 348 629 862 583 1,572 1,370 5,364
% of total budget 78.1 75.4 83.7 77.1 86.3 83.9 82.3
Total budget £ million 445 834 1,031 756 1,822 1,632 6,520
Source: Nielsen EDI, DCMS, RSU analysis.Release rates up to 4 March 2007.
6: Release history of UK films | 51
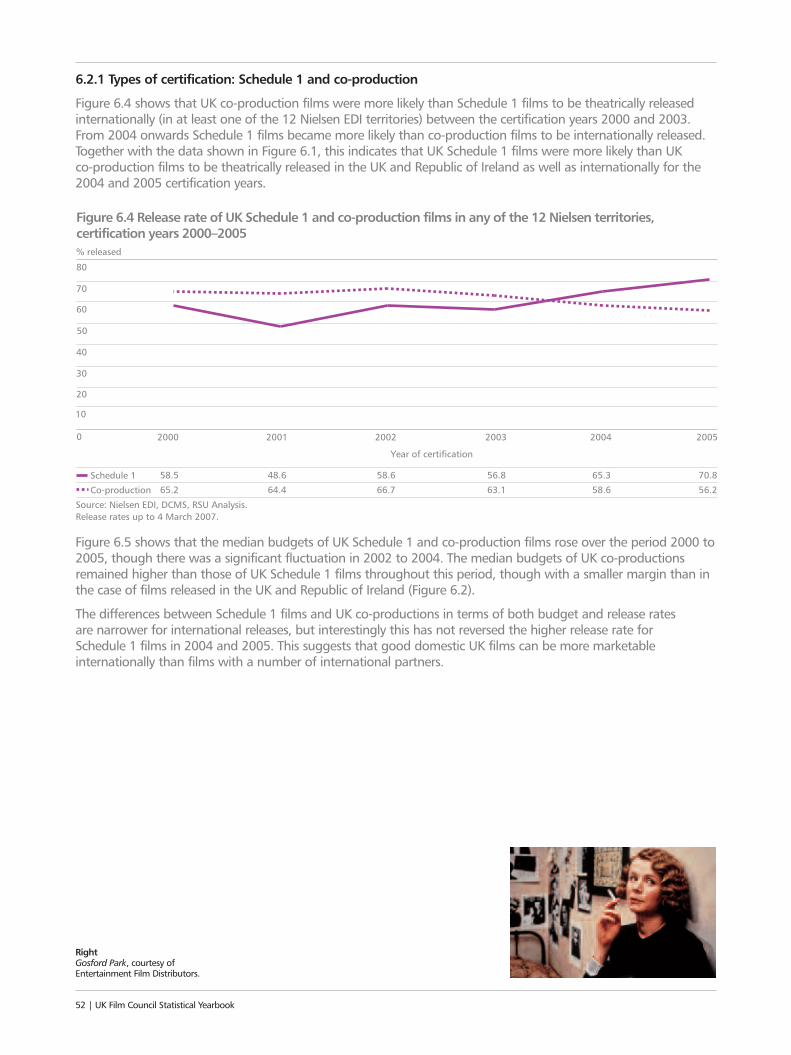
6.2.1 Types of certification: Schedule 1 and co-production
Figure 6.4 shows that UK co-production films were more likely than Schedule 1 films to be theatrically releasedinternationally (in at least one of the 12 Nielsen EDI territories) between the certification years 2000 and 2003.From 2004 onwards Schedule 1 films became more likely than co-production films to be internationally released.Together with the data shown in Figure 6.1, this indicates that UK Schedule 1 films were more likely than UK co-production films to be theatrically released in the UK and Republic of Ireland as well as internationally for the2004 and 2005 certification years.
Figure 6.5 shows that the median budgets of UK Schedule 1 and co-production films rose over the period 2000 to2005, though there was a significant fluctuation in 2002 to 2004. The median budgets of UK co-productionsremained higher than those of UK Schedule 1 films throughout this period, though with a smaller margin than inthe case of films released in the UK and Republic of Ireland (Figure 6.2).
The differences between Schedule 1 films and UK co-productions in terms of both budget and release rates are narrower for international releases, but interestingly this has not reversed the higher release rate for Schedule 1 films in 2004 and 2005. This suggests that good domestic UK films can be more marketableinternationally than films with a number of international partners.
52 | UK Film Council Statistical Yearbook
20
40
60
80
70
% released
Figure 6.4 Release rate of UK Schedule 1 and co-production films in any of the 12 Nielsen territories, certification years 2000–2005
50
30
10
0 2000 2001 2002 2003 20052004
Year of certification
Source: Nielsen EDI, DCMS, RSU Analysis.Release rates up to 4 March 2007.
58.5 58.6 56.8 70.8Schedule 165.2 66.7 63.1 56.2Co-production
65.358.6
48.664.4
RightGosford Park, courtesy ofEntertainment Film Distributors.
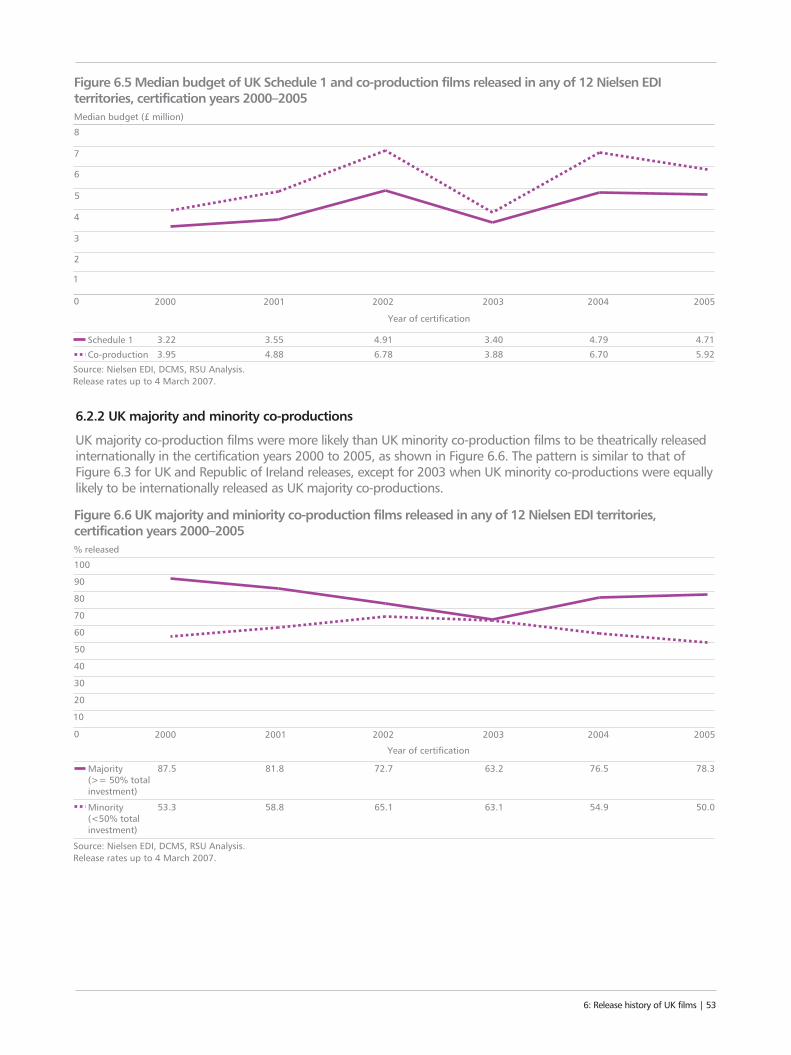
6.2.2 UK majority and minority co-productions
UK majority co-production films were more likely than UK minority co-production films to be theatrically releasedinternationally in the certification years 2000 to 2005, as shown in Figure 6.6. The pattern is similar to that ofFigure 6.3 for UK and Republic of Ireland releases, except for 2003 when UK minority co-productions were equallylikely to be internationally released as UK majority co-productions.
6: Release history of UK films | 53
20
40
60
100
70
80
90
% released
Figure 6.6 UK majority and miniority co-production films released in any of 12 Nielsen EDI territories, certification years 2000–2005
50
30
10
0 2000 2001 2002 2003 20052004
Year of certification
Source: Nielsen EDI, DCMS, RSU Analysis.Release rates up to 4 March 2007.
87.5 72.7 63.2 78.3Majority (>= 50% total investment)
53.3 65.1 63.1 50.0Minority (<50% total investment)
76.5
54.9
81.8
58.8
2
4
6
8
7
Median budget (£ million)
Figure 6.5 Median budget of UK Schedule 1 and co-production films released in any of 12 Nielsen EDI territories, certification years 2000–2005
5
3
1
0 2000 2001 2002 2003 20052004
Year of certification
Source: Nielsen EDI, DCMS, RSU Analysis.Release rates up to 4 March 2007.
3.22 4.91 3.40 4.71Schedule 13.95 6.78 3.88 5.92Co-production
4.796.70
3.554.88
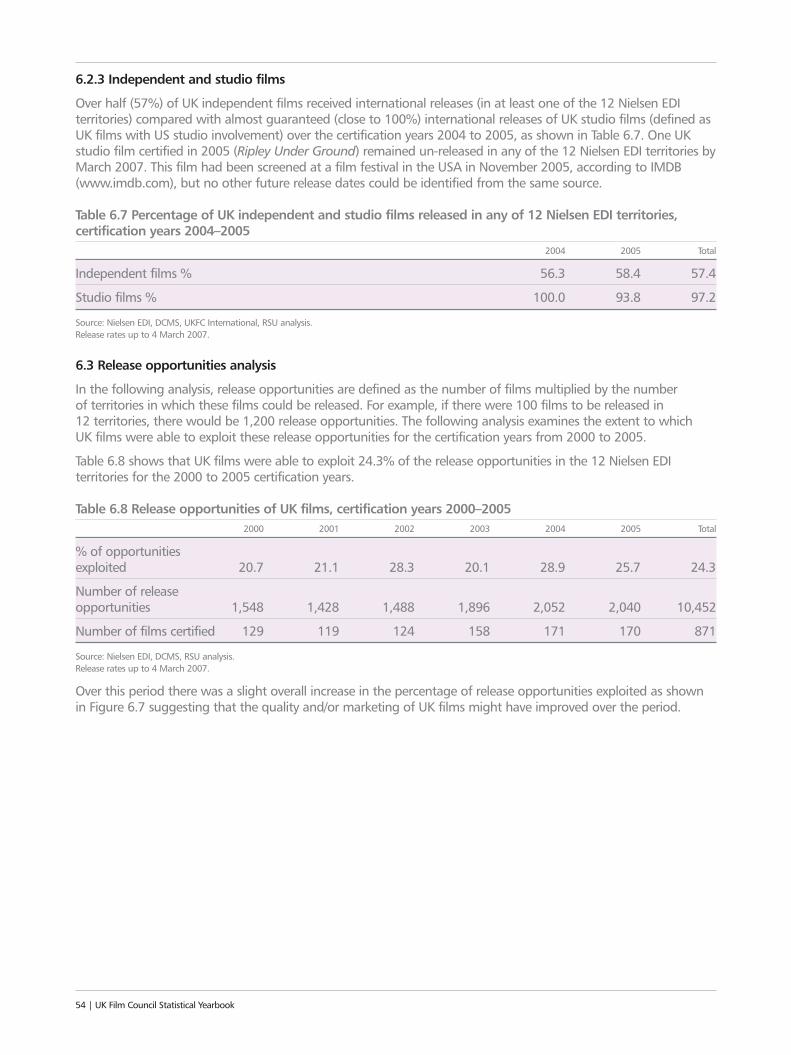
6.2.3 Independent and studio films
Over half (57%) of UK independent films received international releases (in at least one of the 12 Nielsen EDIterritories) compared with almost guaranteed (close to 100%) international releases of UK studio films (defined asUK films with US studio involvement) over the certification years 2004 to 2005, as shown in Table 6.7. One UKstudio film certified in 2005 (Ripley Under Ground) remained un-released in any of the 12 Nielsen EDI territories byMarch 2007. This film had been screened at a film festival in the USA in November 2005, according to IMDB(www.imdb.com), but no other future release dates could be identified from the same source.
Table 6.7 Percentage of UK independent and studio films released in any of 12 Nielsen EDI territories,certification years 2004–2005
2004 2005 Total
Independent films % 56.3 58.4 57.4
Studio films % 100.0 93.8 97.2
Source: Nielsen EDI, DCMS, UKFC International, RSU analysis. Release rates up to 4 March 2007.
6.3 Release opportunities analysis
In the following analysis, release opportunities are defined as the number of films multiplied by the number of territories in which these films could be released. For example, if there were 100 films to be released in 12 territories, there would be 1,200 release opportunities. The following analysis examines the extent to which UK films were able to exploit these release opportunities for the certification years from 2000 to 2005.
Table 6.8 shows that UK films were able to exploit 24.3% of the release opportunities in the 12 Nielsen EDIterritories for the 2000 to 2005 certification years.
Table 6.8 Release opportunities of UK films, certification years 2000–20052000 2001 2002 2003 2004 2005 Total
% of opportunitiesexploited 20.7 21.1 28.3 20.1 28.9 25.7 24.3
Number of release opportunities 1,548 1,428 1,488 1,896 2,052 2,040 10,452
Number of films certified 129 119 124 158 171 170 871
Source: Nielsen EDI, DCMS, RSU analysis. Release rates up to 4 March 2007.
Over this period there was a slight overall increase in the percentage of release opportunities exploited as shownin Figure 6.7 suggesting that the quality and/or marketing of UK films might have improved over the period.
54 | UK Film Council Statistical Yearbook
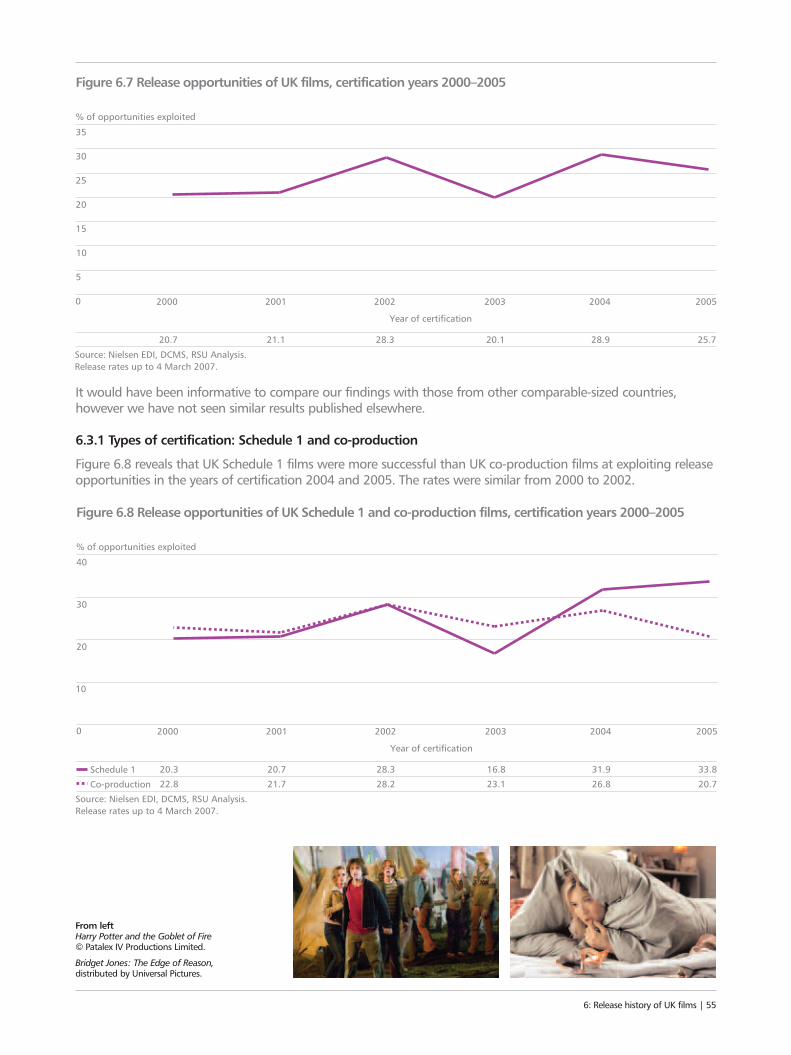
It would have been informative to compare our findings with those from other comparable-sized countries,however we have not seen similar results published elsewhere.
6.3.1 Types of certification: Schedule 1 and co-production
Figure 6.8 reveals that UK Schedule 1 films were more successful than UK co-production films at exploiting releaseopportunities in the years of certification 2004 and 2005. The rates were similar from 2000 to 2002.
6: Release history of UK films | 55
From left Harry Potter and the Goblet of Fire © Patalex IV Productions Limited.
Bridget Jones: The Edge of Reason,distributed by Universal Pictures.
5
15
35
20
25
30
% of opportunities exploited
Figure 6.7 Release opportunities of UK films, certification years 2000–2005
10
0 2000 2001 2002 2003 20052004
Year of certification
Source: Nielsen EDI, DCMS, RSU Analysis.Release rates up to 4 March 2007.
20.7 28.3 20.1 25.728.921.1
20
40
% of opportunities exploited
Figure 6.8 Release opportunities of UK Schedule 1 and co-production films, certification years 2000–2005
30
10
0 2000 2001 2002 2003 20052004
Year of certification
Source: Nielsen EDI, DCMS, RSU Analysis.Release rates up to 4 March 2007.
20.3 28.3 16.8 33.8Schedule 122.8 28.2 23.1 20.7Co-production
31.926.8
20.721.7
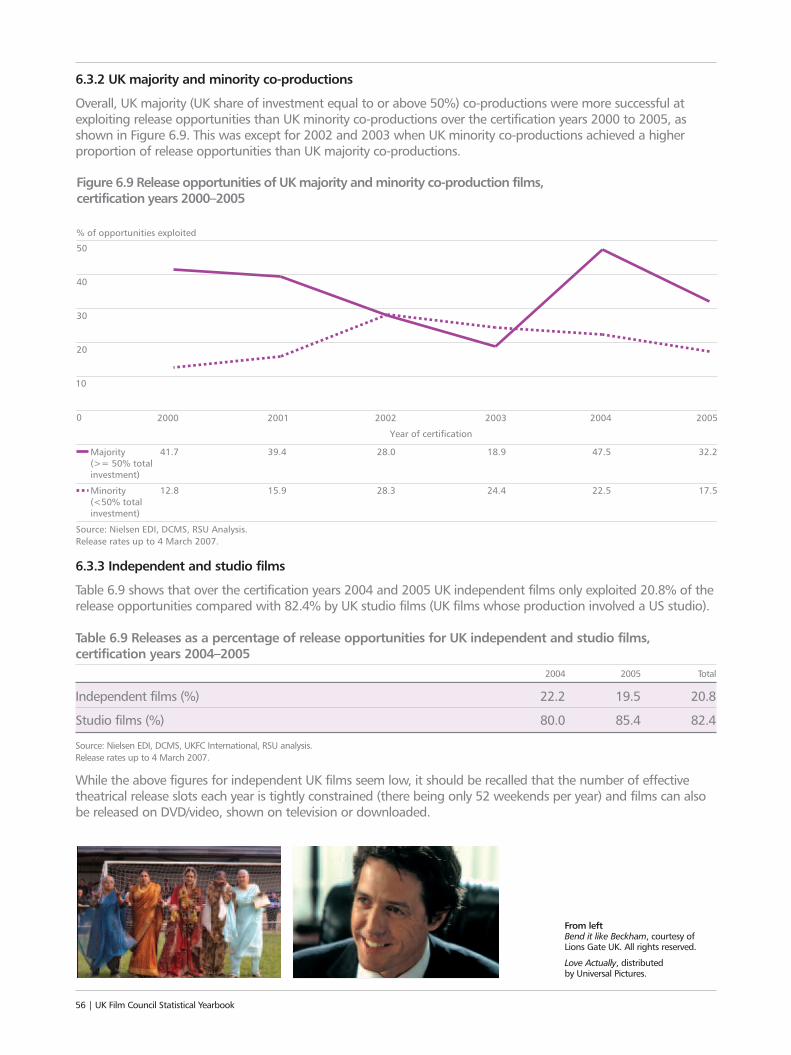
From left Bend it like Beckham, courtesy ofLions Gate UK. All rights reserved.
Love Actually, distributed by Universal Pictures.
6.3.2 UK majority and minority co-productions
Overall, UK majority (UK share of investment equal to or above 50%) co-productions were more successful atexploiting release opportunities than UK minority co-productions over the certification years 2000 to 2005, asshown in Figure 6.9. This was except for 2002 and 2003 when UK minority co-productions achieved a higherproportion of release opportunities than UK majority co-productions.
6.3.3 Independent and studio films
Table 6.9 shows that over the certification years 2004 and 2005 UK independent films only exploited 20.8% of therelease opportunities compared with 82.4% by UK studio films (UK films whose production involved a US studio).
Table 6.9 Releases as a percentage of release opportunities for UK independent and studio films,certification years 2004–2005
2004 2005 Total
Independent films (%) 22.2 19.5 20.8
Studio films (%) 80.0 85.4 82.4
Source: Nielsen EDI, DCMS, UKFC International, RSU analysis. Release rates up to 4 March 2007.
While the above figures for independent UK films seem low, it should be recalled that the number of effectivetheatrical release slots each year is tightly constrained (there being only 52 weekends per year) and films can alsobe released on DVD/video, shown on television or downloaded.
56 | UK Film Council Statistical Yearbook
20
40
50
% of opportunities exploited
Figure 6.9 Release opportunities of UK majority and minority co-production films, certification years 2000–2005
30
10
0 2000 2001 2002 2003 20052004
Year of certification
Source: Nielsen EDI, DCMS, RSU Analysis.Release rates up to 4 March 2007.
41.7 28.0 18.9 32.2Majority (>= 50% total investment)
12.8 28.3 24.4 17.5Minority (<50% total investment)
47.5
22.5
39.4
15.9
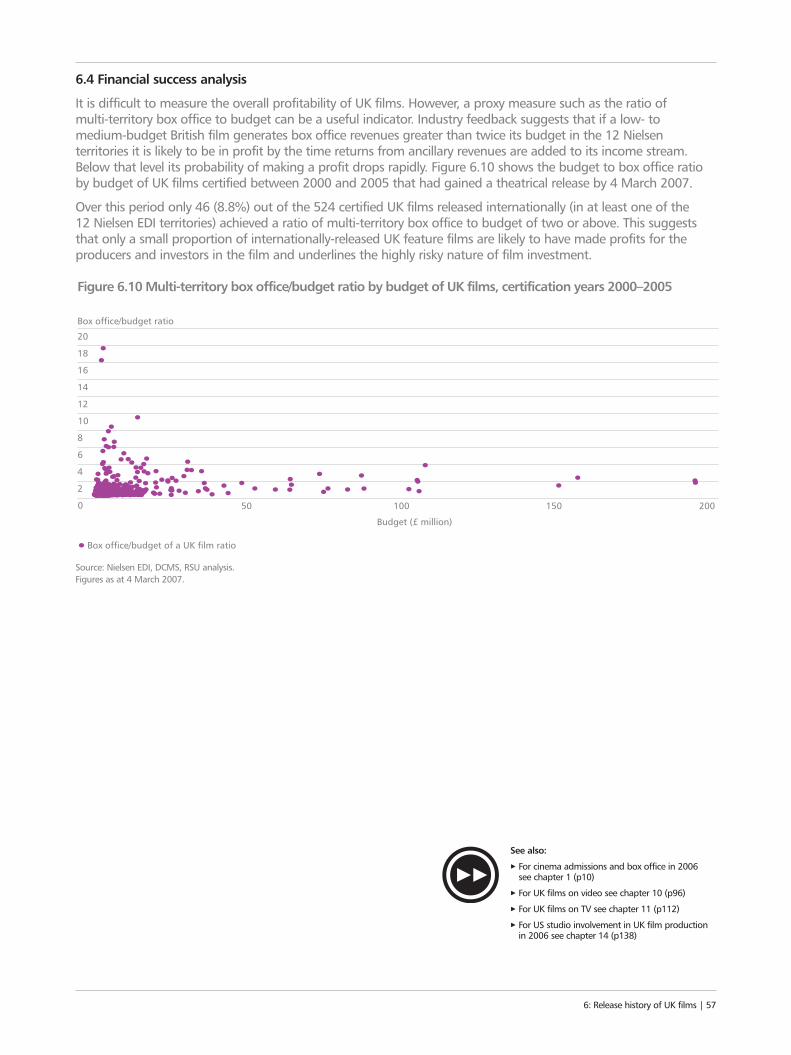
6.4 Financial success analysis
It is difficult to measure the overall profitability of UK films. However, a proxy measure such as the ratio of multi-territory box office to budget can be a useful indicator. Industry feedback suggests that if a low- to medium-budget British film generates box office revenues greater than twice its budget in the 12 Nielsenterritories it is likely to be in profit by the time returns from ancillary revenues are added to its income stream.Below that level its probability of making a profit drops rapidly. Figure 6.10 shows the budget to box office ratioby budget of UK films certified between 2000 and 2005 that had gained a theatrical release by 4 March 2007.
Over this period only 46 (8.8%) out of the 524 certified UK films released internationally (in at least one of the 12 Nielsen EDI territories) achieved a ratio of multi-territory box office to budget of two or above. This suggeststhat only a small proportion of internationally-released UK feature films are likely to have made profits for theproducers and investors in the film and underlines the highly risky nature of film investment.
Source: Nielsen EDI, DCMS, RSU analysis. Figures as at 4 March 2007.
6: Release history of UK films | 57
0
8
6
4
2
12
20
14
16
18
50 100 150 200
Box office/budget ratio
Figure 6.10 Multi-territory box office/budget ratio by budget of UK films, certification years 2000–2005
Box office/budget of a UK film ratio
10
Budget (£ million)
See also:
3 For cinema admissions and box office in 2006 see chapter 1 (p10)
3 For UK films on video see chapter 10 (p96)
3 For UK films on TV see chapter 11 (p112)
3 For US studio involvement in UK film productionin 2006 see chapter 14 (p138)
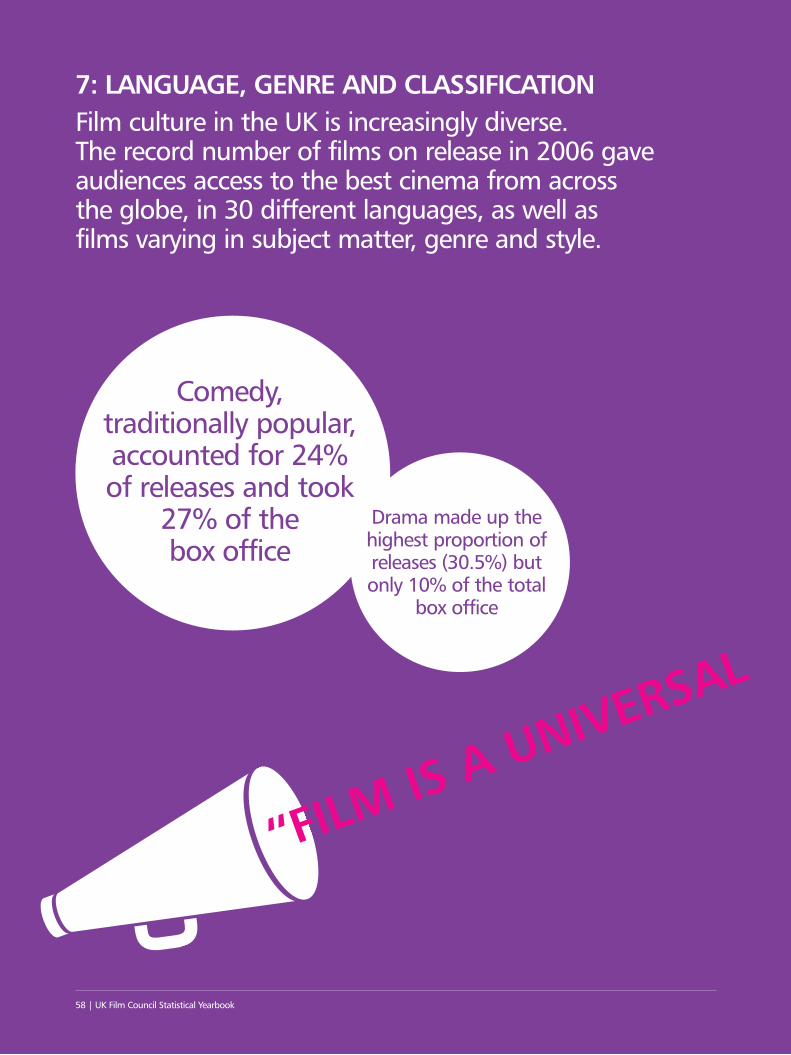
7: LANGUAGE, GENRE AND CLASSIFICATION Film culture in the UK is increasingly diverse. The record number of films on release in 2006 gaveaudiences access to the best cinema from across the globe, in 30 different languages, as well as films varying in subject matter, genre and style.
58 | UK Film Council Statistical Yearbook
“FILM IS A UNIVERSALNGUAGE
Drama made up thehighest proportion ofreleases (30.5%) butonly 10% of the total
box office
Comedy,traditionally popular,accounted for 24% of releases and took
27% of the box office

7: Language, genre and classification | 59
“FILM IS A UNIVERSAL LANGUAGE
171 foreign language films were released,
33.9% of all films
Foreign language films accounted for over a third of UK
releases but just 3.5% of the box office
Hindi was the most common
foreign language in films released
Films in 30 different
languages werereleased in
the UK
More ‘15’ certificate films were released than any other category but ‘12A’ films accounted
for the largest box office share
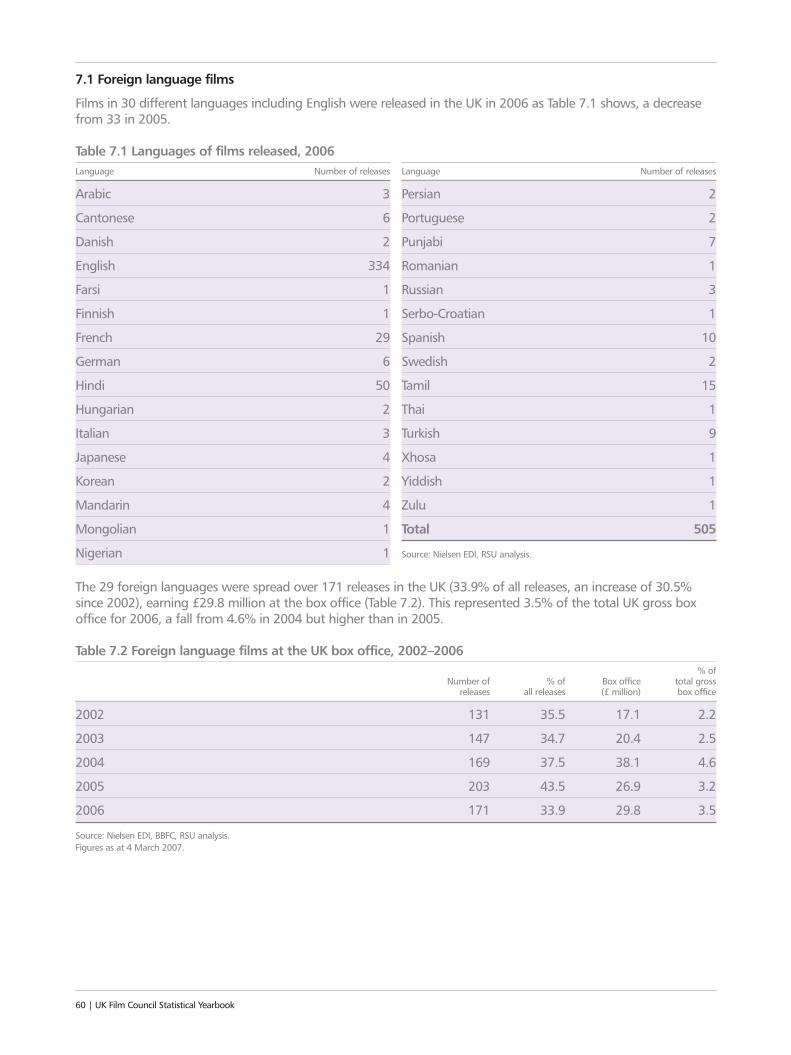
Language Number of releases
Arabic 3
Cantonese 6
Danish 2
English 334
Farsi 1
Finnish 1
French 29
German 6
Hindi 50
Hungarian 2
Italian 3
Japanese 4
Korean 2
Mandarin 4
Mongolian 1
Nigerian 1
60 | UK Film Council Statistical Yearbook
Language Number of releases
Persian 2
Portuguese 2
Punjabi 7
Romanian 1
Russian 3
Serbo-Croatian 1
Spanish 10
Swedish 2
Tamil 15
Thai 1
Turkish 9
Xhosa 1
Yiddish 1
Zulu 1
Total 505
Source: Nielsen EDI, RSU analysis.
7.1 Foreign language films
Films in 30 different languages including English were released in the UK in 2006 as Table 7.1 shows, a decreasefrom 33 in 2005.
Table 7.1 Languages of films released, 2006
The 29 foreign languages were spread over 171 releases in the UK (33.9% of all releases, an increase of 30.5%since 2002), earning £29.8 million at the box office (Table 7.2). This represented 3.5% of the total UK gross boxoffice for 2006, a fall from 4.6% in 2004 but higher than in 2005.
Table 7.2 Foreign language films at the UK box office, 2002–2006% of
Number of % of Box office total gross releases all releases (£ million) box office
2002 131 35.5 17.1 2.2
2003 147 34.7 20.4 2.5
2004 169 37.5 38.1 4.6
2005 203 43.5 26.9 3.2
2006 171 33.9 29.8 3.5
Source: Nielsen EDI, BBFC, RSU analysis.Figures as at 4 March 2007.
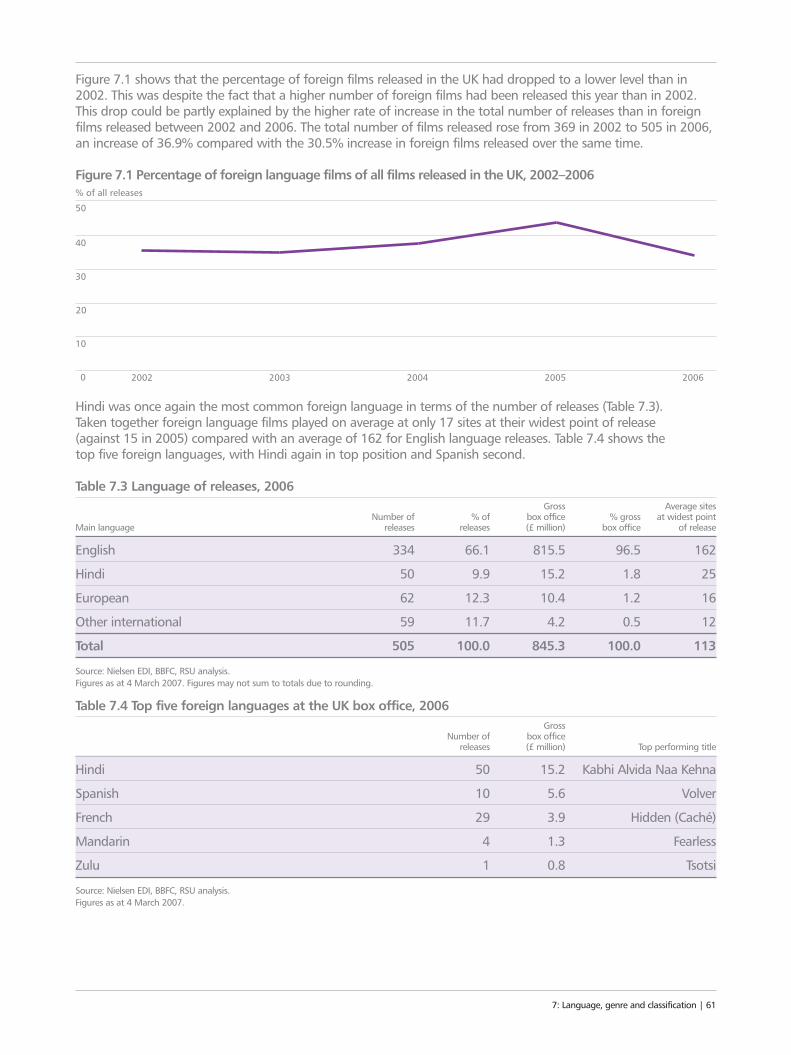
Figure 7.1 shows that the percentage of foreign films released in the UK had dropped to a lower level than in2002. This was despite the fact that a higher number of foreign films had been released this year than in 2002.This drop could be partly explained by the higher rate of increase in the total number of releases than in foreignfilms released between 2002 and 2006. The total number of films released rose from 369 in 2002 to 505 in 2006,an increase of 36.9% compared with the 30.5% increase in foreign films released over the same time.
Hindi was once again the most common foreign language in terms of the number of releases (Table 7.3). Taken together foreign language films played on average at only 17 sites at their widest point of release (against 15 in 2005) compared with an average of 162 for English language releases. Table 7.4 shows the top five foreign languages, with Hindi again in top position and Spanish second.
Table 7.3 Language of releases, 2006Gross Average sites
Number of % of box office % gross at widest pointMain language releases releases (£ million) box office of release
English 334 66.1 815.5 96.5 162
Hindi 50 9.9 15.2 1.8 25
European 62 12.3 10.4 1.2 16
Other international 59 11.7 4.2 0.5 12
Total 505 100.0 845.3 100.0 113
Source: Nielsen EDI, BBFC, RSU analysis.Figures as at 4 March 2007. Figures may not sum to totals due to rounding.
Table 7.4 Top five foreign languages at the UK box office, 2006Gross
Number of box officereleases (£ million) Top performing title
Hindi 50 15.2 Kabhi Alvida Naa Kehna
Spanish 10 5.6 Volver
French 29 3.9 Hidden (Caché)
Mandarin 4 1.3 Fearless
Zulu 1 0.8 Tsotsi
Source: Nielsen EDI, BBFC, RSU analysis.Figures as at 4 March 2007.
7: Language, genre and classification | 61
0
10
50
30
40
2002 2003 2004 20062005
% of all releases
Figure 7.1 Percentage of foreign language films of all films released in the UK, 2002–2006
20
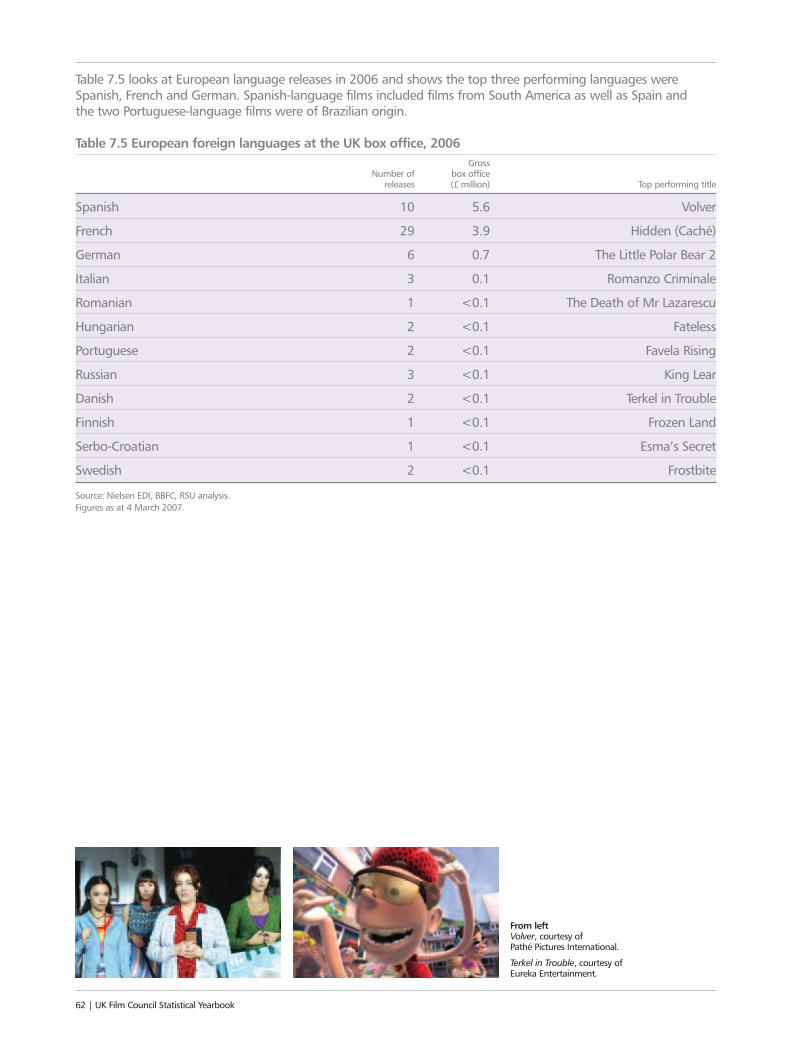
Table 7.5 looks at European language releases in 2006 and shows the top three performing languages wereSpanish, French and German. Spanish-language films included films from South America as well as Spain and the two Portuguese-language films were of Brazilian origin.
Table 7.5 European foreign languages at the UK box office, 2006Gross
Number of box officereleases (£ million) Top performing title
Spanish 10 5.6 Volver
French 29 3.9 Hidden (Caché)
German 6 0.7 The Little Polar Bear 2
Italian 3 0.1 Romanzo Criminale
Romanian 1 <0.1 The Death of Mr Lazarescu
Hungarian 2 <0.1 Fateless
Portuguese 2 <0.1 Favela Rising
Russian 3 <0.1 King Lear
Danish 2 <0.1 Terkel in Trouble
Finnish 1 <0.1 Frozen Land
Serbo-Croatian 1 <0.1 Esma’s Secret
Swedish 2 <0.1 Frostbite
Source: Nielsen EDI, BBFC, RSU analysis.Figures as at 4 March 2007.
62 | UK Film Council Statistical Yearbook
From left Volver, courtesy of Pathé Pictures International.
Terkel in Trouble, courtesy of Eureka Entertainment.
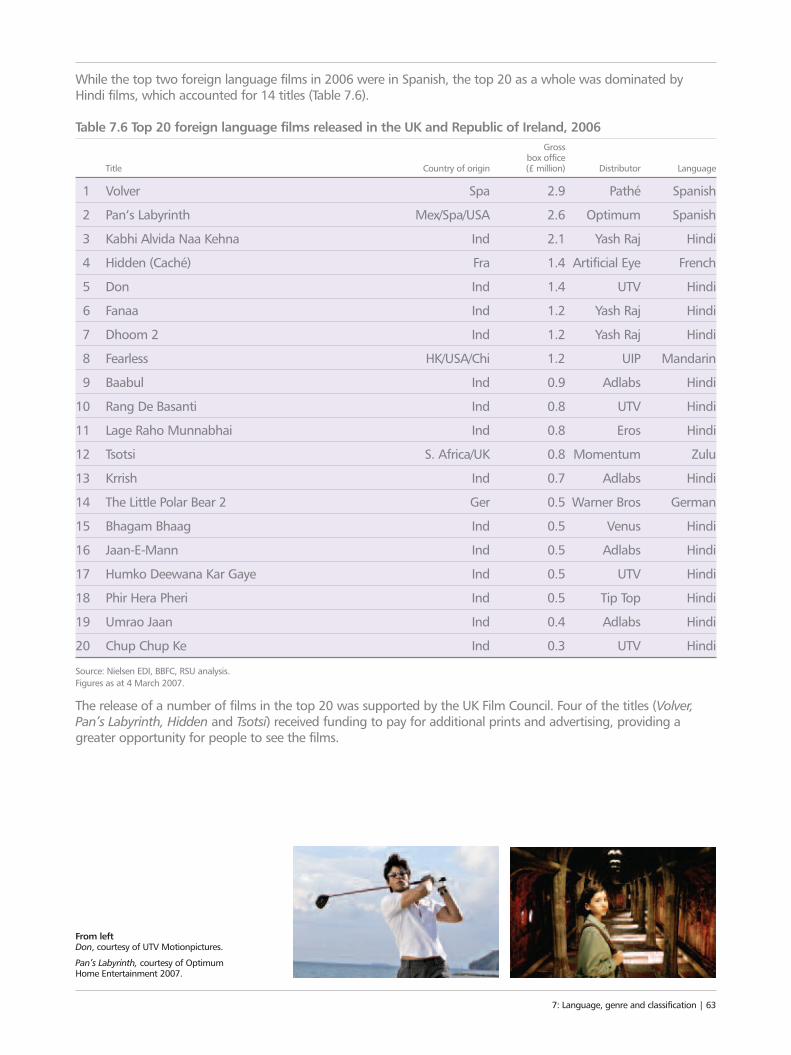
While the top two foreign language films in 2006 were in Spanish, the top 20 as a whole was dominated byHindi films, which accounted for 14 titles (Table 7.6).
Table 7.6 Top 20 foreign language films released in the UK and Republic of Ireland, 2006Gross
box officeTitle Country of origin (£ million) Distributor Language
1 Volver Spa 2.9 Pathé Spanish
2 Pan’s Labyrinth Mex/Spa/USA 2.6 Optimum Spanish
3 Kabhi Alvida Naa Kehna Ind 2.1 Yash Raj Hindi
4 Hidden (Caché) Fra 1.4 Artificial Eye French
5 Don Ind 1.4 UTV Hindi
6 Fanaa Ind 1.2 Yash Raj Hindi
7 Dhoom 2 Ind 1.2 Yash Raj Hindi
8 Fearless HK/USA/Chi 1.2 UIP Mandarin
9 Baabul Ind 0.9 Adlabs Hindi
10 Rang De Basanti Ind 0.8 UTV Hindi
11 Lage Raho Munnabhai Ind 0.8 Eros Hindi
12 Tsotsi S. Africa/UK 0.8 Momentum Zulu
13 Krrish Ind 0.7 Adlabs Hindi
14 The Little Polar Bear 2 Ger 0.5 Warner Bros German
15 Bhagam Bhaag Ind 0.5 Venus Hindi
16 Jaan-E-Mann Ind 0.5 Adlabs Hindi
17 Humko Deewana Kar Gaye Ind 0.5 UTV Hindi
18 Phir Hera Pheri Ind 0.5 Tip Top Hindi
19 Umrao Jaan Ind 0.4 Adlabs Hindi
20 Chup Chup Ke Ind 0.3 UTV Hindi
Source: Nielsen EDI, BBFC, RSU analysis.Figures as at 4 March 2007.
The release of a number of films in the top 20 was supported by the UK Film Council. Four of the titles (Volver,Pan’s Labyrinth, Hidden and Tsotsi) received funding to pay for additional prints and advertising, providing agreater opportunity for people to see the films.
7: Language, genre and classification | 63
From left Don, courtesy of UTV Motionpictures.
Pan’s Labyrinth, courtesy of OptimumHome Entertainment 2007.
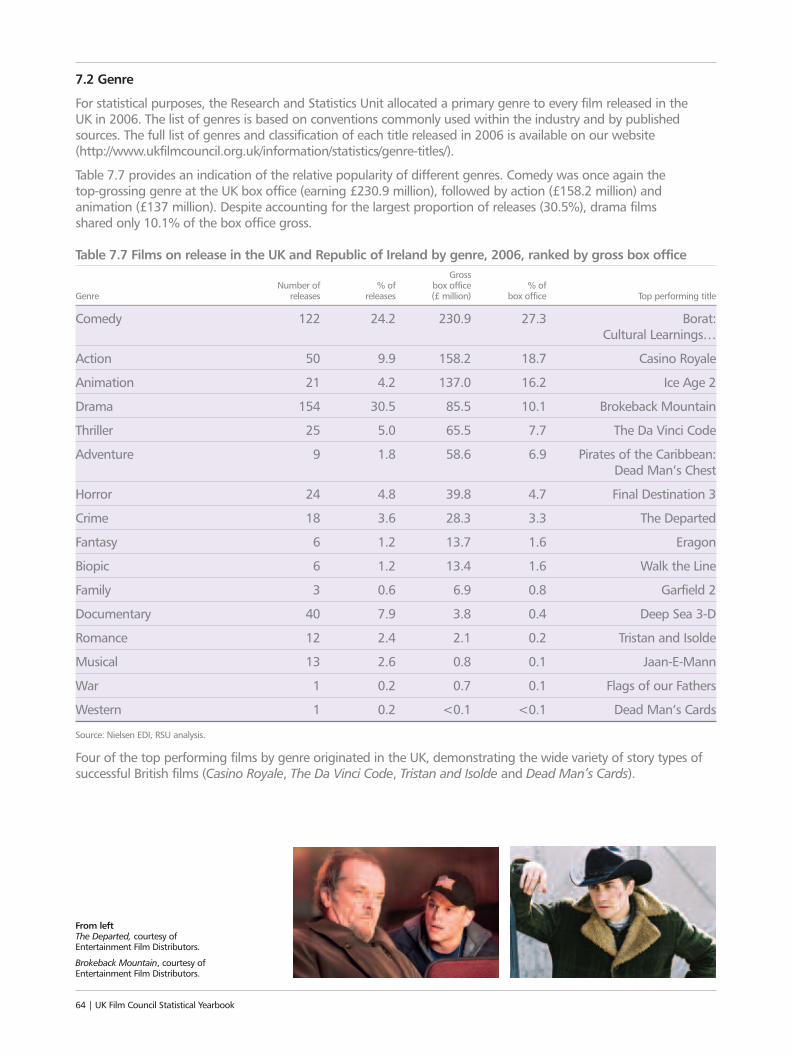
7.2 Genre
For statistical purposes, the Research and Statistics Unit allocated a primary genre to every film released in the UK in 2006. The list of genres is based on conventions commonly used within the industry and by publishedsources. The full list of genres and classification of each title released in 2006 is available on our website(http://www.ukfilmcouncil.org.uk/information/statistics/genre-titles/).
Table 7.7 provides an indication of the relative popularity of different genres. Comedy was once again the top-grossing genre at the UK box office (earning £230.9 million), followed by action (£158.2 million) andanimation (£137 million). Despite accounting for the largest proportion of releases (30.5%), drama films shared only 10.1% of the box office gross.
Table 7.7 Films on release in the UK and Republic of Ireland by genre, 2006, ranked by gross box officeGross
Number of % of box office % of Genre releases releases (£ million) box office Top performing title
Comedy 122 24.2 230.9 27.3 Borat: Cultural Learnings…
Action 50 9.9 158.2 18.7 Casino Royale
Animation 21 4.2 137.0 16.2 Ice Age 2
Drama 154 30.5 85.5 10.1 Brokeback Mountain
Thriller 25 5.0 65.5 7.7 The Da Vinci Code
Adventure 9 1.8 58.6 6.9 Pirates of the Caribbean: Dead Man’s Chest
Horror 24 4.8 39.8 4.7 Final Destination 3
Crime 18 3.6 28.3 3.3 The Departed
Fantasy 6 1.2 13.7 1.6 Eragon
Biopic 6 1.2 13.4 1.6 Walk the Line
Family 3 0.6 6.9 0.8 Garfield 2
Documentary 40 7.9 3.8 0.4 Deep Sea 3-D
Romance 12 2.4 2.1 0.2 Tristan and Isolde
Musical 13 2.6 0.8 0.1 Jaan-E-Mann
War 1 0.2 0.7 0.1 Flags of our Fathers
Western 1 0.2 <0.1 <0.1 Dead Man’s Cards
Source: Nielsen EDI, RSU analysis.
Four of the top performing films by genre originated in the UK, demonstrating the wide variety of story types ofsuccessful British films (Casino Royale, The Da Vinci Code, Tristan and Isolde and Dead Man’s Cards).
From left The Departed, courtesy ofEntertainment Film Distributors.
Brokeback Mountain, courtesy ofEntertainment Film Distributors.
64 | UK Film Council Statistical Yearbook
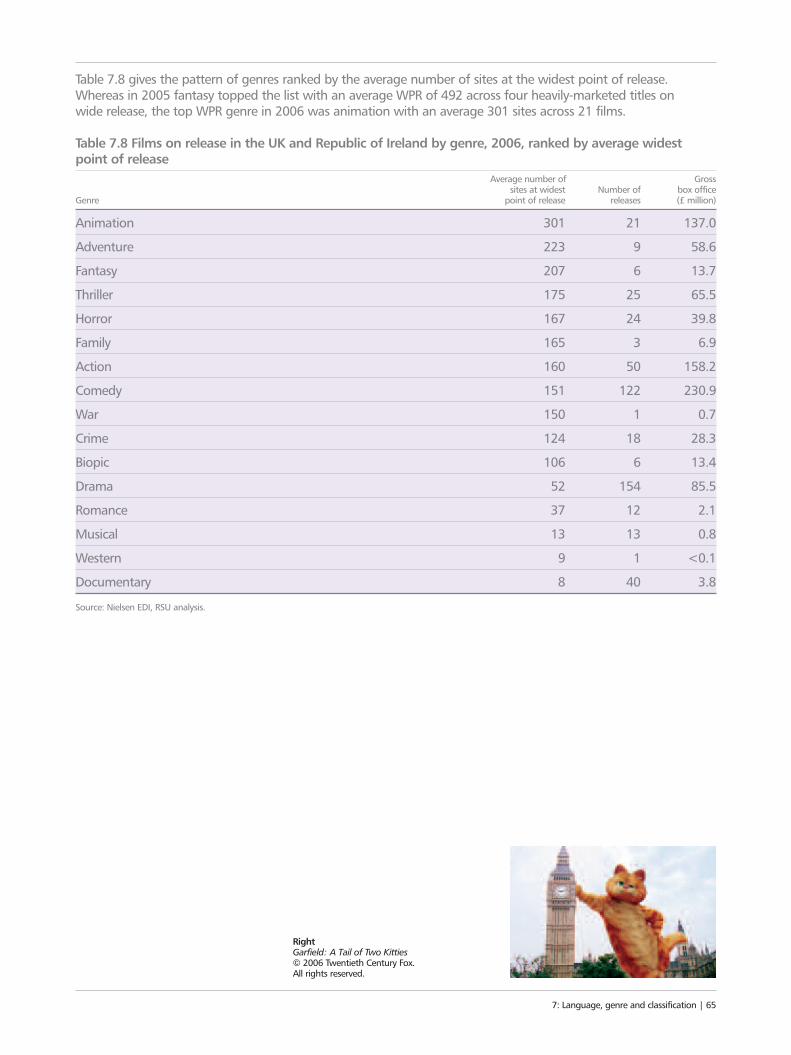
Table 7.8 gives the pattern of genres ranked by the average number of sites at the widest point of release.Whereas in 2005 fantasy topped the list with an average WPR of 492 across four heavily-marketed titles on wide release, the top WPR genre in 2006 was animation with an average 301 sites across 21 films.
Table 7.8 Films on release in the UK and Republic of Ireland by genre, 2006, ranked by average widestpoint of release
Average number of Gross sites at widest Number of box office
Genre point of release releases (£ million)
Animation 301 21 137.0
Adventure 223 9 58.6
Fantasy 207 6 13.7
Thriller 175 25 65.5
Horror 167 24 39.8
Family 165 3 6.9
Action 160 50 158.2
Comedy 151 122 230.9
War 150 1 0.7
Crime 124 18 28.3
Biopic 106 6 13.4
Drama 52 154 85.5
Romance 37 12 2.1
Musical 13 13 0.8
Western 9 1 <0.1
Documentary 8 40 3.8
Source: Nielsen EDI, RSU analysis.
RightGarfield: A Tail of Two Kitties © 2006 Twentieth Century Fox. All rights reserved.
7: Language, genre and classification | 65
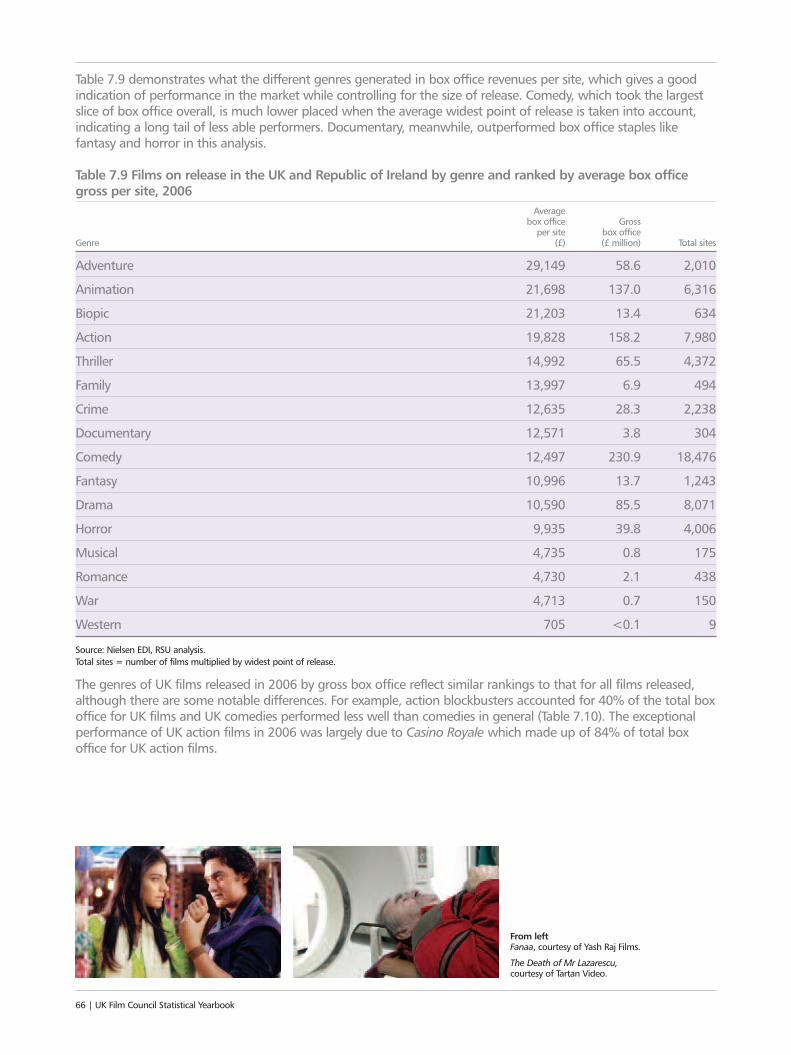
From left Fanaa, courtesy of Yash Raj Films.
The Death of Mr Lazarescu, courtesy of Tartan Video.
Table 7.9 demonstrates what the different genres generated in box office revenues per site, which gives a goodindication of performance in the market while controlling for the size of release. Comedy, which took the largestslice of box office overall, is much lower placed when the average widest point of release is taken into account,indicating a long tail of less able performers. Documentary, meanwhile, outperformed box office staples likefantasy and horror in this analysis.
Table 7.9 Films on release in the UK and Republic of Ireland by genre and ranked by average box officegross per site, 2006
Average box office Gross
per site box office Genre (£) (£ million) Total sites
Adventure 29,149 58.6 2,010
Animation 21,698 137.0 6,316
Biopic 21,203 13.4 634
Action 19,828 158.2 7,980
Thriller 14,992 65.5 4,372
Family 13,997 6.9 494
Crime 12,635 28.3 2,238
Documentary 12,571 3.8 304
Comedy 12,497 230.9 18,476
Fantasy 10,996 13.7 1,243
Drama 10,590 85.5 8,071
Horror 9,935 39.8 4,006
Musical 4,735 0.8 175
Romance 4,730 2.1 438
War 4,713 0.7 150
Western 705 <0.1 9
Source: Nielsen EDI, RSU analysis.Total sites = number of films multiplied by widest point of release.
The genres of UK films released in 2006 by gross box office reflect similar rankings to that for all films released,although there are some notable differences. For example, action blockbusters accounted for 40% of the total boxoffice for UK films and UK comedies performed less well than comedies in general (Table 7.10). The exceptionalperformance of UK action films in 2006 was largely due to Casino Royale which made up of 84% of total boxoffice for UK action films.
66 | UK Film Council Statistical Yearbook
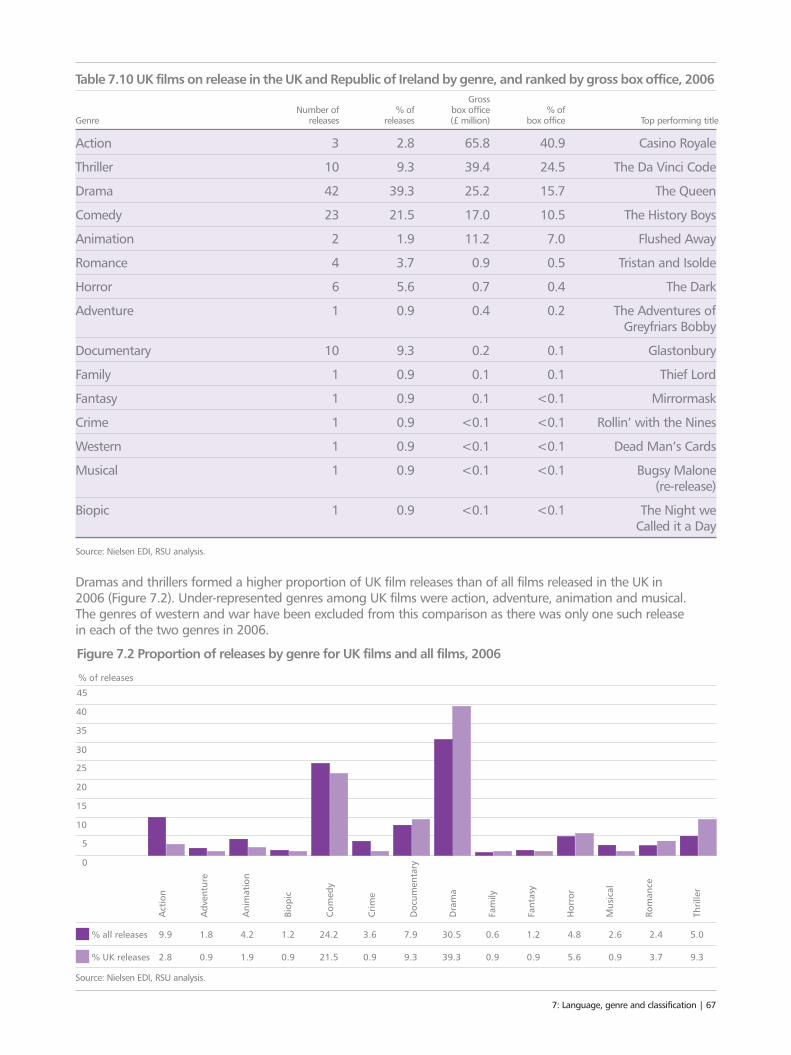
Table 7.10 UK films on release in the UK and Republic of Ireland by genre, and ranked by gross box office, 2006Gross
Number of % of box office % ofGenre releases releases (£ million) box office Top performing title
Action 3 2.8 65.8 40.9 Casino Royale
Thriller 10 9.3 39.4 24.5 The Da Vinci Code
Drama 42 39.3 25.2 15.7 The Queen
Comedy 23 21.5 17.0 10.5 The History Boys
Animation 2 1.9 11.2 7.0 Flushed Away
Romance 4 3.7 0.9 0.5 Tristan and Isolde
Horror 6 5.6 0.7 0.4 The Dark
Adventure 1 0.9 0.4 0.2 The Adventures ofGreyfriars Bobby
Documentary 10 9.3 0.2 0.1 Glastonbury
Family 1 0.9 0.1 0.1 Thief Lord
Fantasy 1 0.9 0.1 <0.1 Mirrormask
Crime 1 0.9 <0.1 <0.1 Rollin’ with the Nines
Western 1 0.9 <0.1 <0.1 Dead Man’s Cards
Musical 1 0.9 <0.1 <0.1 Bugsy Malone (re-release)
Biopic 1 0.9 <0.1 <0.1 The Night we Called it a Day
Source: Nielsen EDI, RSU analysis.
Dramas and thrillers formed a higher proportion of UK film releases than of all films released in the UK in 2006 (Figure 7.2). Under-represented genres among UK films were action, adventure, animation and musical. The genres of western and war have been excluded from this comparison as there was only one such release in each of the two genres in 2006.
Source: Nielsen EDI, RSU analysis.
7: Language, genre and classification | 67
0
5
35
40
45
Figure 7.2 Proportion of releases by genre for UK films and all films, 2006
% all releases 9.9
Act
ion
Adv
entu
re
Ani
mat
ion
Biop
ic
Com
edy
Crim
e
Doc
umen
tary
Dra
ma
Fam
ily
Fant
asy
Hor
ror
Mus
ical
Rom
ance
Thril
ler
1.8 4.2 1.2 24.2 3.6 7.9 30.5 0.6 1.2 4.8 2.6 2.4 5.0
% UK releases 2.8 0.9 1.9 0.9 21.5 0.9 9.3 39.3 0.9 0.9 5.6 0.9 3.7 9.3
30
20
15
10
25
% of releases
7.3 Classification
All films in the UK must carry a certificate indicating their age suitability for exhibition in premises licensed for the purpose by local authorities. The British Board of Film Classification (BBFC) classifies the majority of films fortheatrical release, although local authorities may grant their own classification.
The symbols used by the BBFC and their meanings are given in Table 7.11.
Table 7.11 BBFC film classifications
U (Universal) – Suitable for all.
PG (Parental Guidance) – General viewing, but some scenes may be unsuitable for some children.
12A – No one younger than 12 may see a ‘12A’ film at the cinema unless accompanied by an adult.
15 – No one younger than 15 may see a ‘15’ film at the cinema.
18 – No one younger than 18 may see an ‘18’ film at the cinema .Source: BBFC website.
Table 7.12 provides a picture of how 2006 releases were classified. It shows that as in previous years more ‘15’ films were released than any other category (38.8% of all releases) although they accounted for a smallerproportion of the gross box office (21.2%). There were increases in the proportions of ‘12A’ and ‘15’ certified films in 2006, up from 25% and 37% in 2005 to 28% and 39%.
Table 7.12 Releases in UK and Republic of Ireland by film certificate, 2006Number of % of % of gross
Certificate releases releases box office Top performing title
U 29 5.7 13.9 Ice Age 2
PG 75 14.9 15.2 Night at the Museum
12A 139 27.5 43.9 Casino Royale
15 196 38.8 21.2 Borat: Cultural Learnings…
18 46 9.1 5.7 The Departed
No certificate 20 4.0 <0.1 Jillunu Oru Kaadhal
Total 505 100.0 100.0
Source: Nielsen EDI, BBFC, RSU analysis
68 | UK Film Council Statistical Yearbook
From left Tsotsi, courtesy of Momentum Pictures.
Night at the Museum © 2006Twentieth Century Fox. All rights reserved.
Table 7.13 gives the top 10 ‘U’ certified films in 2006. With seven out of 10 titles the list is dominated byanimated features (traditionally aimed at the youngest audiences for whom a ‘U’ certificate is preferable). Only one of the 10 films had UK involvement, compared with five last year.
Table 7.13 Top 10 ‘U’ certified films, 2006Gross
box officeTitle Country of origin (£ million) Distributor Genre
1 Ice Age 2 USA 29.6 20th Century Fox Animation
2 Happy Feet Aus/USA 18.9 Warner Bros Animation
3 Chicken Little USA 13.5 Buena Vista Animation
4 Over the Hedge USA 13.2 UIP Animation
5 Flushed Away UK/USA 11.1 Paramount Animation
6 Garfield 2 USA 6.5 20th Century Fox Family
7 The Santa Clause 3 USA 6.3 BVI Comedy
8 Hoodwinked USA 5.8 Momentum Animation
9 The Wild USA 4.3 BVI Animation
10 The Shaggy Dog USA 2.9 BVI Comedy
Source: Nielsen EDI, BBFC, RSU analysis.
The top 10 performing ‘PG’ certified films are a more varied group (Table 7.14). The table is topped by thesuccessful comedy, Night at the Museum. The top 10 ‘PG’ films are dominated by comedies and animations.
Table 7.14 Top 10 ‘PG’ certified films, 2006Gross
box office Title Country of origin (£ million) Distributor Genre
1 Night at the Museum USA 20.8 20th Century Fox Comedy
2 Cars USA 16.4 Buena Vista Animation
3 The Devil Wears Prada USA 14.0 20th Century Fox Comedy
4 Big Momma’s House 2 USA 9.2 20th Century Fox Comedy
5 Open Season USA 7.4 Sony Pictures Animation
6 Stormbreaker UK/Ger/USA 6.8 Entertainment Action
7 Monster House USA 6.6 Sony Pictures Animation
8 The Pink Panther USA 6.0 20th Century Fox Comedy
9 Eragon USA 5.6 20th Century Fox Fantasy
10 Barnyard: the Original Party USA 4.6 Paramount Animation
Source: Nielsen EDI, BBFC, RSU analysis.
7: Language, genre and classification | 69
70 | UK Film Council Statistical Yearbook
As noted in Table 7.12, the largest share of gross box office was earned by ‘12A’ films (43.9%). Traditionally this is largely due to the success of popular family-oriented films which also managed to attract older audiences (Table 7.15). The hugely successful and relatively violent (for a ‘12A’ certificate) Bond-franchise, Casino Royale, is somewhat of an exception. Three of the top 10 ‘12A’ films had UK involvement.
Table 7.15 Top 10 ‘12A’ certified films, 2006Gross
box office Title Country of origin (£ million) Distributor Genre
1 Casino Royale UK/Cze/Ger/USA 55.5 Sony Pictures Action
2 Pirates of the Caribbean: Dead Man’s Chest USA 52.5 Buena Vista Adventure
3 The Da Vinci Code UK/USA 30.4 Sony Pictures Thriller
4 X-Men III USA 19.2 20th Century Fox Action
5 Superman Returns USA/Aus 16.1 Warner Bros Action
6 Mission: Impossible III USA 15.5 UIP Action
7 The Holiday USA 12.3 Universal Pictures Comedy
8 The Break up USA 10.4 UIP Comedy
9 Walk the Line USA 10.4 20th Century Fox Biopic
10 The Queen UK/Fra/Ita 9 Pathé Drama
Source: Nielsen EDI, BBFC, RSU analysis.
By definition, ‘15’ certified films contain stronger material than the younger categories. Depending on the type offilm they are likely to involve more adult-oriented themes, action, comedy and language. This is reflected in thetop 10, shown in Table 7.16. The top 10 ‘15’ films were topped by the hit comedy featuring the character, Borat,created by British actor, Sacha Baron Cohen. This was followed by the multiple-award winning, gay-themedBrokeback Mountain. The rest of the list is made up of action, horror and thrillers.
Table 7.16 Top 10 ‘15’ certified films, 2006Gross
box office Title Country of origin (£ million) Distributor Genre
1 Borat: Cultural Learnings… USA 24.1 20th Century Fox Comedy
2 Brokeback Mountain USA 10.1 Entertainment Drama
3 Final Destination 3 USA 9.0 Entertainment Horror
4 The Inside Man USA 8.3 UIP Crime
5 Miami Vice USA/Ger 7.5 UIP Action
6 Scary Movie 4 USA 5.9 Buena Vista Comedy
7 Jarhead USA 5.4 UIP Drama
8 Munich USA 5.1 UIP Thriller
9 The Children of Men UK/USA 4.9 Universal Pictures Thriller
10 The Omen USA 4.4 20th Century Fox Horror
Source: Nielsen EDI, BBFC, RSU analysis.
Because of the challenging nature of ‘18’ certified films, which contain the strongest content, their audienceappeal is generally much narrower than other categories. However, the Oscar-winning, The Departed, broke the £10 million barrier this year (Table 7.17). Where as none of the films in this category broke this barrier in 2005.It is followed by the third part of the horror sequel, Saw. Saw 2 was the top film in this category in 2005.Nearly half of the top 10 ‘18’ films were horror titles, along with two action films and a mix of other genres.Unlike 2005 (when there were five UK titles on this list) there were no UK titles among the top 10 ‘18’ films in 2006.
Table 7.17 Top 10 ‘18’ certified films, 2006Gross
box office Title Country of origin (£ million) Distributor Genre
1 The Departed USA 12.8 Entertainment Crime
2 Saw 3 USA 8.5 Lionsgate Horror
3 Lucky Number Slevin USA 4.6 Entertainment Thriller
4 Hostel USA 4.2 Sony Pictures Horror
5 The Hills have Eyes USA 3.6 20th Century Fox Horror
6 Underworld: Evolution USA 3.2 Entertainment Action
7 Hard Candy USA 1.9 Lionsgate Drama
8 Jackass 2 USA 1.7 Paramount Comedy
9 Texas Chainsaw: the Beginning USA 1.5 Entertainment Horror
10 Crank USA 1.5 UIP Action
Source: Nielsen EDI, BBFC, RSU analysis.
7: Language, genre and classification | 71
See also:
3 For cinema admissions and box office in 2006 see chapter 1 (p10)
3 For a look at cinema audiences see chapter 10 (p96)
3 For information about film classification in the UK see www.bbfc.org.uk
3 For details of local film societies that screenforeign language films in your area seewww.bffs.org.uk
3 For further insight into what the UK Film Council does to support specialised films seehttp://www.ukfilmcouncil.org.uk/cinemagoing/distributionandexhibition/
3 For more details about genre classification seehttp://www.ukfilmcouncil.org.uk/information/statistics/genre-titles/

72 | UK Film Council Statistical Yearbook
8: DISTRIBUTIONA small number of large companies dominate thedistribution of films in the UK. They invest millions of pounds in attracting audiences to the cinema.72 | UK Film Council Statistical Yearbook
“THINK OF THE
UDIENCEWeekends
(Friday to Sunday)accounted for 60%of the box office
Opening weekendsaccounted for 27% of
the total box office

8: Distribution | 738: Distribution | 73
“THINK OF THE AUDIENCE
The top tendistributors had
a 96% share of themarket in 2006
Total advertisingspend increased
by 3.3% to£171.3 million
8.1 Distributors in 2006
As shown in Table 8.1, the top ten distributors had a 96% share of the market, down from 97% in 2005. The remaining 57 distributors handled a total of 295 titles (58% of the total), but gained only a 3.6% share of the box office, up from 2.7% in 2005. The leading distributor was 20th Century Fox, which handled major hitssuch as Ice Age 2, Borat, X-Men 3, The Devil Wears Prada and Walk the Line. UIP was in second place havingdistributed 51 titles over the course of the year, including Mission: Impossible III, Over the Hedge and The BreakUp. Sony Pictures was in third place, having launched the year’s biggest hit, Casino Royale and also The Da VinciCode. Buena Vista’s hits Pirates of the Caribbean: Dead Man’s Chest and Cars ensured fourth place. The majorchange in film distribution in 2006 was the break-up of UIP into its two constituent companies, Paramount andUniversal Pictures International in December. Because this change was so late in the year, the final market share for UIP in the table below includes the separate figures for Paramount and Universal recorded in December.
Table 8.1 Distributor share of box office, UK and Republic of Ireland, 2006Market Films on Box office
Distributor share (%) release 2006 gross (£ million)
20th Century Fox 20.9 33 179.5
UIP* 18.9 51 162.6
Sony Pictures 16.1 34 138.5
Buena Vista 15.7 27 135.1
Warner Bros 8.2 25 70.8
Entertainment 7.9 22 67.5
Pathé 3.2 22 27.4
Lionsgate 2.4 24 20.3
Momentum 2.3 18 19.6
Icon 0.8 11 7.0
Sub-total 96.4 267 828.3
Others (57 distributors) 3.6 295 31.5
Total 100.0 562 859.8
Source: Nielsen EDI.Box office gross = cumulative box office total for all films handled by the distributor in the period 2 January 2006 to 4 January 2007.*UIP figure includes Paramount and Universal shares from December 2006.
74 | UK Film Council Statistical Yearbook
8.2 Distributors, 2002–2006
Table 8.2 shows that the top six distributors form a stable leading group, although their individual market sharesvary considerably from year to year, depending on the particular mix of films distributed. The share of box officemade by distributors outside the top ten increased to 3.6%.
Table 8.2 Distributor market share as percentage of box office gross, 2002–20062002 2003 2004 2005 2006
Distributor % % % % %
20th Century Fox 17.9 8.8 10.7 14.3 20.9
UIP 12.5 22.5 29.8 29.1 18.9
Sony Pictures 12.3 9.7 10.0 6.8 16.1
Buena Vista 15.2 26.3 14.5 13.1 15.7
Warner Bros 15.4 10.4 14.7 18.2 8.2
Entertainment 16.6 14.6 7.9 9.4 7.9
Pathé 2.1 2.0 2.8 3.5 3.2
Lionsgate 1.7 0.7 1.0 0.3 2.4
Momentum 1.9 1.3 2.2 1.9 2.3
Icon 0.9 0.7 2.3 0.2 0.8
Top 10 total* 96.8 97.1 96.1 97.3 96.4
Others 3.2 2.9 3.9 2.7 3.6
Total 100.0 100.0 100.0 100.0 100.0
Source: Nielsen EDI.*Top 10 total refers to the top 10 distributors of that particular year. Table is ranked by top 10 distributors in 2006.
8: Distribution | 75
From left Ice Age 2 © 2006 Twentieth Century Fox. All rights reserved.Borat: Cultural Learnings of America for makeBenefit Glorious Nation of Kazakhstan © 2006Twentieth Century Fox. All rights reserved.Mission: Impossible III, courtesy of Paramount Pictures.Cars, courtesy of Buena Vista Home Entertainment.Walk the Line © 2005 Twentieth Century Fox. All rights reserved.
8.3 Weekend box office
In 2006, 60% of the box office was taken at weekends (Friday to Sunday), down from 64% in 2005, as Table 8.3 shows.
Table 8.3 Box office percentage share by weekday/weekend, 2002–20062002 2003 2004 2005 2006
Friday 16.9 16.0 15.3 18.0 16.5
Saturday 29.4 26.6 24.5 27.0 25.1
Sunday 21.3 18.7 19.9 19.0 18.7
Weekend 67.6 61.3 59.7 64.0 60.3
Monday 7.2 8.9 9.7 8.0 9.5
Tuesday 8.5 10.0 10.1 8.0 9.5
Wednesday 8.6 9.8 10.7 10.0 10.9
Thursday 8.1 10.0 9.8 10.0 9.7
Weekday 32.4 38.7 40.3 36.0 39.7
Total 100.0 100.0 100.0 100.0 100.0
Source: Nielsen EDI.
The opening weekend box office as a share of total theatrical revenue increased slightly in 2006 as shown in Table 8.4.
Table 8.4 UK opening weekend as percentage of total box office, 2005–06% of total % of total
in opening in openingRange of box office results weekend 2005 weekend 2006
All films 26.3 26.5
More than £30 million 27.2 26.4
£20 million – £30 million 25.9 31.8
£10 million – £29.9 million 23.4 23.7
£5 million – £9.9 million 24.3 23.3
£1 million – £4.9 million 28.3 28.6
£200,000 – £999,000 29.2 31.2
Less than £200,000 27.1 30.9
Source: Nielsen EDI.Opening weekends include preview figures. For films with a limited initial opening, the wider release figure is included in the analysis.
76 | UK Film Council Statistical Yearbook
From left The Devil Wears Prada © 2006 Twentieth Century Fox. All rights reserved.
The Break-Up © Universal Studios. All rights reserved.
8.4 Release costs
The opening weekend of a film is recognised as being crucial to the lifetime of a film, both in cinemas and onsubsequent release platforms. Distributors invest heavily in advertising in order to raise a film’s profile across allmedia (outdoor posters, print media, TV, radio and increasingly online). From data provided by Nielsen MediaResearch (Table 8.5) the estimated total distributor advertising spend in 2006 was £171.3 million, up 3.3% from£165.8 million in 2005.
Table 8.5 Estimated advertising spend, 2006 (£ million)
TV 73.1
Outdoor 60.1
Press 29.0
Radio 8.8
Other 0.3
Total 171.3
Source: Nielsen Media Research.
Where the data are available, we have estimated the total release costs for various release widths. By taking a typical print cost of £1,000 per print and adding the Nielsen Media Research advertising spend data plus 20%for other public relations campaigns and publicity and premiere costs, we can calculate an average release cost for each level of theatrical release (see table 8.6).
Table 8.6 Estimated release cost by width of release, 2006Average
release cost Sites at widest point of release (£ million)
>500 3.72
400–499 2.33
300–399 1.50
200–299 1.10
100–199 0.52
50–99 0.26
10–49 0.08
<10 0.02
Source: Nielsen Media Research, Nielsen EDI, RSU analysis.
8: Distribution | 77
See also:
3 For further details about the UK box office in 2006 see chapter 1 (p10)
3 For more information about the top films at the UK box office in 2006 see chapter 2 (p22)
3 For an overview of employment in filmdistribution see chapter 17 (p166)

9: EXHIBITIONFor most film-lovers, the best way to enjoy film is on thebig screen, with a large audience. The fortunes of theexhibition sector are therefore an important indicator ofthe vitality of film culture. On this basis, film is thriving,with the number of screens increasing year on year since2002. Screenings run by providers serving their localcommunities, including film societies and mixed-usevenues such as arts centres, are also an important part of the UK’s diverse exhibition landscape.
78 | UK Film Council Statistical Yearbook
“AT A CINEMA NEAR YOUThe averageticket pricewas £4.87
Northern Ireland had the highest numberof screens per 100,000
and England hadthe lowest
Only 7% of screens were
dedicated to‘specialised’
films
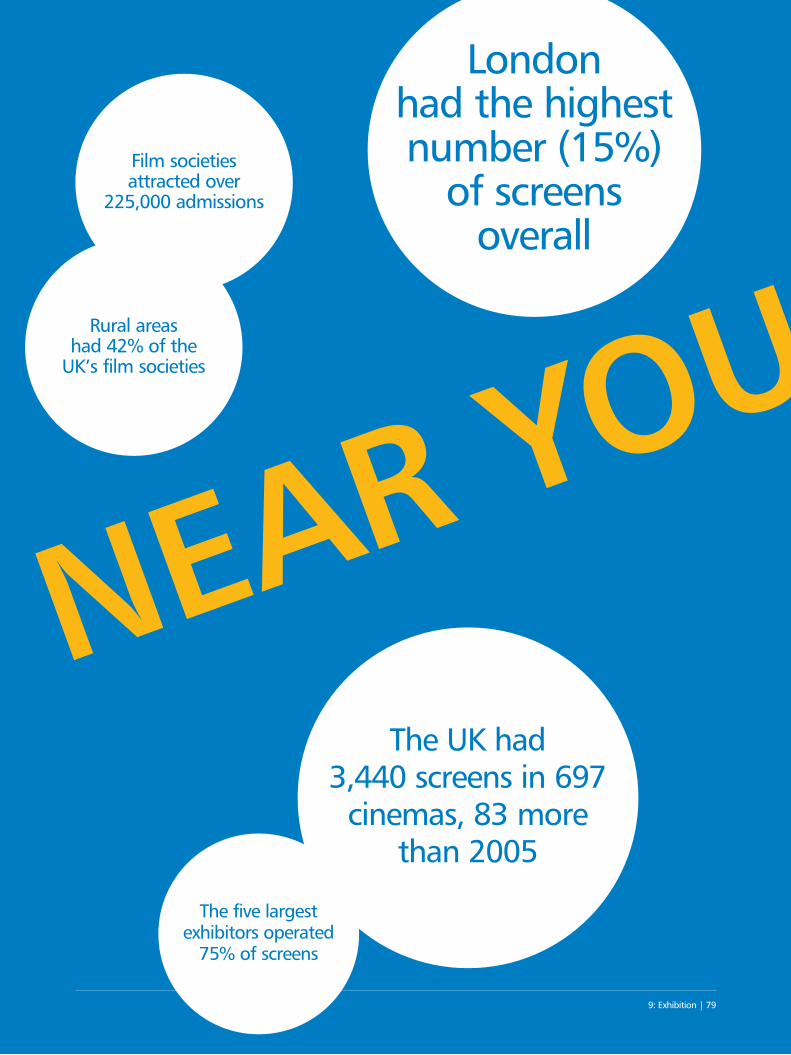
9: Exhibition | 79
“AT A CINEMA NEAR YOU
The UK had 3,440 screens in 697
cinemas, 83 more than 2005
Film societies attracted over
225,000 admissions
Rural areas had 42% of the
UK’s film societies
The five largest exhibitors operated
75% of screens
London had the highestnumber (15%)
of screens overall
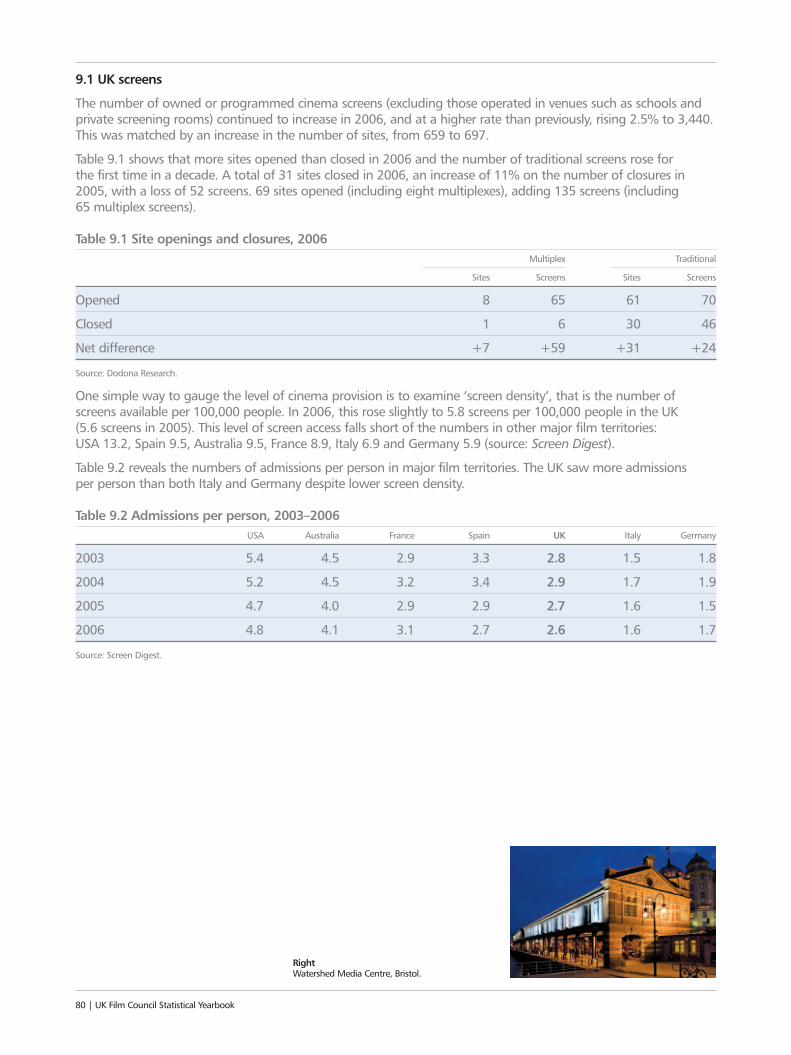
9.1 UK screens
The number of owned or programmed cinema screens (excluding those operated in venues such as schools andprivate screening rooms) continued to increase in 2006, and at a higher rate than previously, rising 2.5% to 3,440. This was matched by an increase in the number of sites, from 659 to 697.
Table 9.1 shows that more sites opened than closed in 2006 and the number of traditional screens rose for the first time in a decade. A total of 31 sites closed in 2006, an increase of 11% on the number of closures in2005, with a loss of 52 screens. 69 sites opened (including eight multiplexes), adding 135 screens (including 65 multiplex screens).
Table 9.1 Site openings and closures, 2006Multiplex Traditional
Sites Screens Sites Screens
Opened 8 65 61 70
Closed 1 6 30 46
Net difference +7 +59 +31 +24
Source: Dodona Research.
One simple way to gauge the level of cinema provision is to examine ‘screen density’, that is the number ofscreens available per 100,000 people. In 2006, this rose slightly to 5.8 screens per 100,000 people in the UK (5.6 screens in 2005). This level of screen access falls short of the numbers in other major film territories: USA 13.2, Spain 9.5, Australia 9.5, France 8.9, Italy 6.9 and Germany 5.9 (source: Screen Digest).
Table 9.2 reveals the numbers of admissions per person in major film territories. The UK saw more admissions per person than both Italy and Germany despite lower screen density.
Table 9.2 Admissions per person, 2003–2006USA Australia France Spain UK Italy Germany
2003 5.4 4.5 2.9 3.3 2.8 1.5 1.8
2004 5.2 4.5 3.2 3.4 2.9 1.7 1.9
2005 4.7 4.0 2.9 2.9 2.7 1.6 1.5
2006 4.8 4.1 3.1 2.7 2.6 1.6 1.7
Source: Screen Digest.
80 | UK Film Council Statistical Yearbook
RightWatershed Media Centre, Bristol.
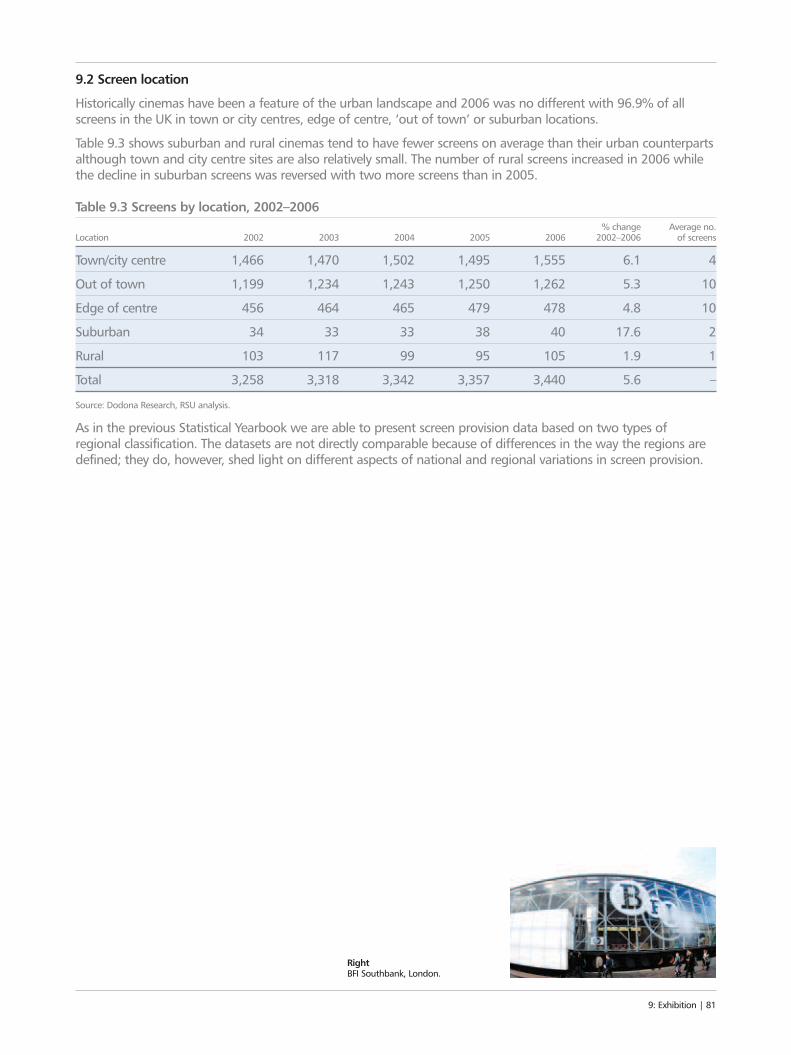
9.2 Screen location
Historically cinemas have been a feature of the urban landscape and 2006 was no different with 96.9% of allscreens in the UK in town or city centres, edge of centre, ‘out of town’ or suburban locations.
Table 9.3 shows suburban and rural cinemas tend to have fewer screens on average than their urban counterpartsalthough town and city centre sites are also relatively small. The number of rural screens increased in 2006 whilethe decline in suburban screens was reversed with two more screens than in 2005.
Table 9.3 Screens by location, 2002–2006% change Average no.
Location 2002 2003 2004 2005 2006 2002–2006 of screens
Town/city centre 1,466 1,470 1,502 1,495 1,555 6.1 4
Out of town 1,199 1,234 1,243 1,250 1,262 5.3 10
Edge of centre 456 464 465 479 478 4.8 10
Suburban 34 33 33 38 40 17.6 2
Rural 103 117 99 95 105 1.9 1
Total 3,258 3,318 3,342 3,357 3,440 5.6 –
Source: Dodona Research, RSU analysis.
As in the previous Statistical Yearbook we are able to present screen provision data based on two types ofregional classification. The datasets are not directly comparable because of differences in the way the regions aredefined; they do, however, shed light on different aspects of national and regional variations in screen provision.
9: Exhibition | 81
RightBFI Southbank, London.
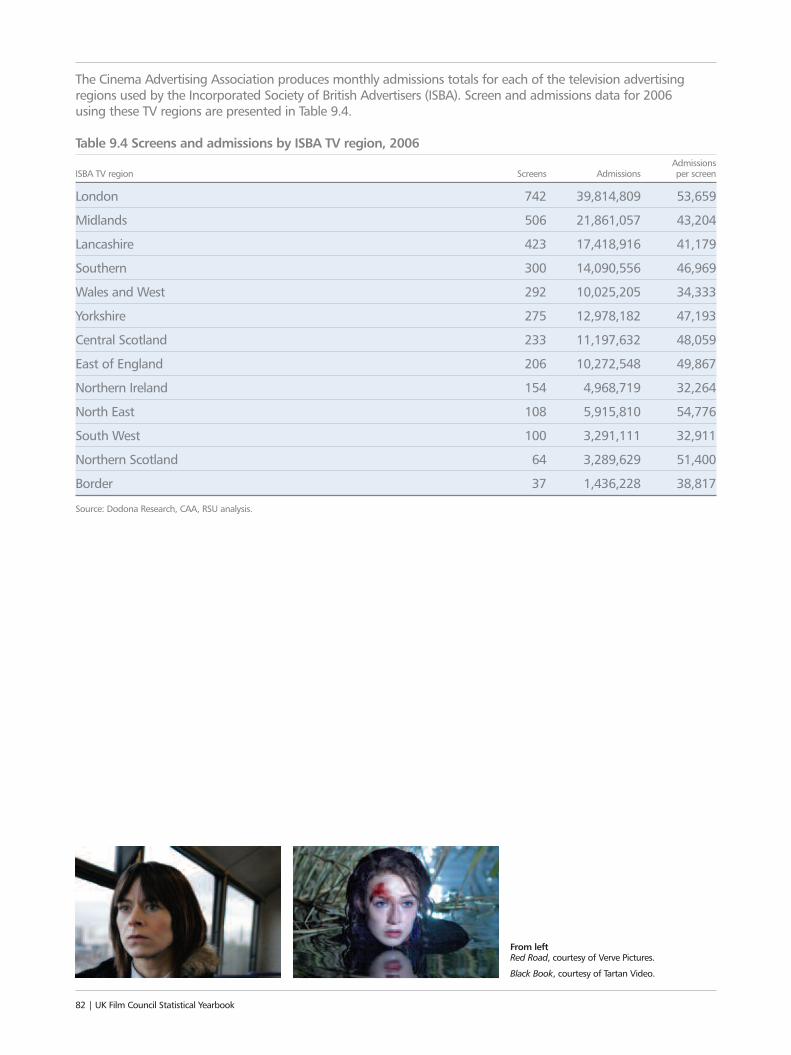
82 | UK Film Council Statistical Yearbook
The Cinema Advertising Association produces monthly admissions totals for each of the television advertisingregions used by the Incorporated Society of British Advertisers (ISBA). Screen and admissions data for 2006 using these TV regions are presented in Table 9.4.
Table 9.4 Screens and admissions by ISBA TV region, 2006Admissions
ISBA TV region Screens Admissions per screen
London 742 39,814,809 53,659
Midlands 506 21,861,057 43,204
Lancashire 423 17,418,916 41,179
Southern 300 14,090,556 46,969
Wales and West 292 10,025,205 34,333
Yorkshire 275 12,978,182 47,193
Central Scotland 233 11,197,632 48,059
East of England 206 10,272,548 49,867
Northern Ireland 154 4,968,719 32,264
North East 108 5,915,810 54,776
South West 100 3,291,111 32,911
Northern Scotland 64 3,289,629 51,400
Border 37 1,436,228 38,817
Source: Dodona Research, CAA, RSU analysis.
From leftRed Road, courtesy of Verve Pictures.
Black Book, courtesy of Tartan Video.
Table 9.5 gives screen information for each of the English Government Office Regions, plus Scotland, Northern Ireland and Wales, which correspond to the areas covered by the nine English Regional Screen Agencies,Scottish Screen, the Northern Ireland Film and Television Commission and the Film Agency for Wales.
Table 9.5 Screens and population in the nations and Government Office Regions, 2006Screens Average no. of
Government office region Screens Population* per 100,000 screens per site
London 532 7,388,000 7.2 5
South East 468 8,080,000 5.8 4
North West 436 6,805,000 6.4 7
West Midlands 309 5,320,000 5.8 6
Scotland 309 5,057,000 6.1 5
South West 296 4,999,000 5.9 4
Yorkshire 238 5,009,000 4.8 6
East of England 225 5,463,000 4.1 5
Wales 182 2,938,000 6.2 3
East Midlands 170 4,252,000 4.0 5
Northern Ireland 154 1,703,000 9.0 7
North East 104 2,539,000 4.1 5
Other** 17 N/A N/A 4
Total 3,440 59,553,000 5.8 5
Source: Dodona Research, RSU analysis.*2003 population data.**Other includes the Channel Islands and the Isle of Man.
The pattern of regional and national variations in screen provision remains unchanged in 2006. It is still the casethat areas of high population in urban areas, such as London, the South East and the North West, had higherscreen numbers. Northern Ireland had the highest number of screens per 100,000 people of the four nations (9) followed by Scotland (6.1), Wales (6.2) and England (5.6). Table 9.5 also reveals that the North West, West Midlands and Northern Ireland had on average six screens per site compared with the national average of five. The South East, South West and Wales all fell below the average, showing a tendency towards smallercinemas and proportionately fewer multiplexes (see Table 9.7 on page 85).
9: Exhibition | 83
The Road to Guantánamo, courtesy of Revolution Films.
9.3 Multiplexes
The proportion of multiplex screens (defined by Dodona Research as those in purpose-built cinemas with five ormore screens) remained the same as in 2005, as shown in Table 9.6. There has been a rise of 55% in the numberof multiplex screens since 1999 compared with an 18% fall in the number of traditional and mixed-use screens(used for film screenings only part of the time). The UK has gained 888 multiplex screens since 1999 and lost 206traditional or mixed-use screens. The proportion of multiplex screens has increased from 58.9% in 1999 to 73% in 2006.
Table 9.6 Cinema screens by type, 1999–2006Traditional and
Year Multiplex % multiplex mixed-use Total
1999 1,624 58.9 1,134 2,758
2000 1,874 63.4 1,080 2,954
2001 2,115 66.8 1,049 3,164
2002 2,299 70.6 959 3,258
2003 2,362 71.2 956 3,318
2004 2,426 72.6 916 3,342
2005 2,453 73.1 904 3,357
2006 2,512 73.0 928 3,440
Source: Dodona Research.
Table 9.7 provides a snapshot of variations in multiplex provision around the UK. The North West had the largestnumber of multiplex screens (367), 22 more than London; and the highest proportion of multiplex screens(84.2%). By far the lowest concentration of multiplex screens was found in the South West (57.8%), which had aparticularly high number of traditional and mixed-use screens (the third highest after London and the South East).Wales (68.1%) and the Channel Islands and Isle of Man (58.8%) also had proportionally fewer multiplex screensthan the national average.
84 | UK Film Council Statistical Yearbook
Romanzo Criminale.
Table 9.7 Cinema screens by type and nation or Government Office Region, 2006Traditional and
Government office region Multiplex % multiplex mixed use Total screens
North West 367 84.2 69 436
London 345 64.8 187 532
South East 331 70.7 137 468
West Midlands 234 75.7 75 309
Scotland 230 74.4 79 309
Yorkshire 197 82.8 41 238
South West 171 57.8 125 296
East of England 169 75.1 56 225
East Midlands 127 74.7 43 170
Wales 124 68.1 58 182
Northern Ireland 120 77.9 34 154
North East 87 83.7 17 104
Other* 10 58.8 7 17
Total 2,512 73.0 928 3,440
Source: Dodona Research, RSU analysis.*Other includes the Channel Islands and the Isle of Man.
9: Exhibition | 85
From leftTransamerica, courtesy of Pathé Distribution and Belladonna Productions.
Kidulthood, courtesy of Revolver Entertainment.
9.4 Programming
Dodona Research categorises screens according to whether they show mainly mainstream, specialised (that is non-mainstream, including art-house) or South Asian (Bollywood) films.
By far, the majority of screens mainly show mainstream films. In 2006, 535 cinemas with 3,191 screens showedmainly mainstream films, compared with 157 (231 screens) showing specialised films, and five cinemas (18 screens) dedicated mainly to South Asian films.
Table 9.8 compares figures for 2005 and 2006 and shows that the number of sites and screens showingmainstream and specialised films increased in 2006 while the number of sites and screens programming South Asian films remained unchanged.
Table 9.8 Sites and screens by programme, 2005–2006Sites Screens
Programme 2005 2006 2005 2006
South Asian 5 5 18 18
Specialised 132 157 206 231
Mainstream 522 535 3,133 3,191
Source: Dodona Research, RSU analysis.
The majority (68%) of specialised screens were found in single, independently-owned cinemas (that is, not part of a chain).
The pattern of programme type by location in 2006 is shown in Table 9.9. Screens showing mainly South Asianfilms were located in town or city centre and suburban areas, while those devoted to specialised film were mainlyfound in town or city centres. The overall pattern remained similar to last year except that the rural proportion ofscreens showing specialised films had risen sharply from 4.9% in 2005 to 7.4%.
Table 9.9 Proportion of screens by location and programme, 2006South Asian Specialised Mainstream
(%) (%) (%)
Town/city centre 44.4 82.7 42.5
Edge of centre 0.0 1.7 14.9
Out of town 0.0 3.5 39.3
Suburban 55.6 4.8 0.6
Rural 0.0 7.4 2.8
Total 100.0 100.0 100.0
Source: Dodona Research, RSU analysis.
This geographical analysis is extended in Tables 9.10 and 9.11, which reveal the distribution of South Asian andspecialised screens around the country.
86 | UK Film Council Statistical Yearbook
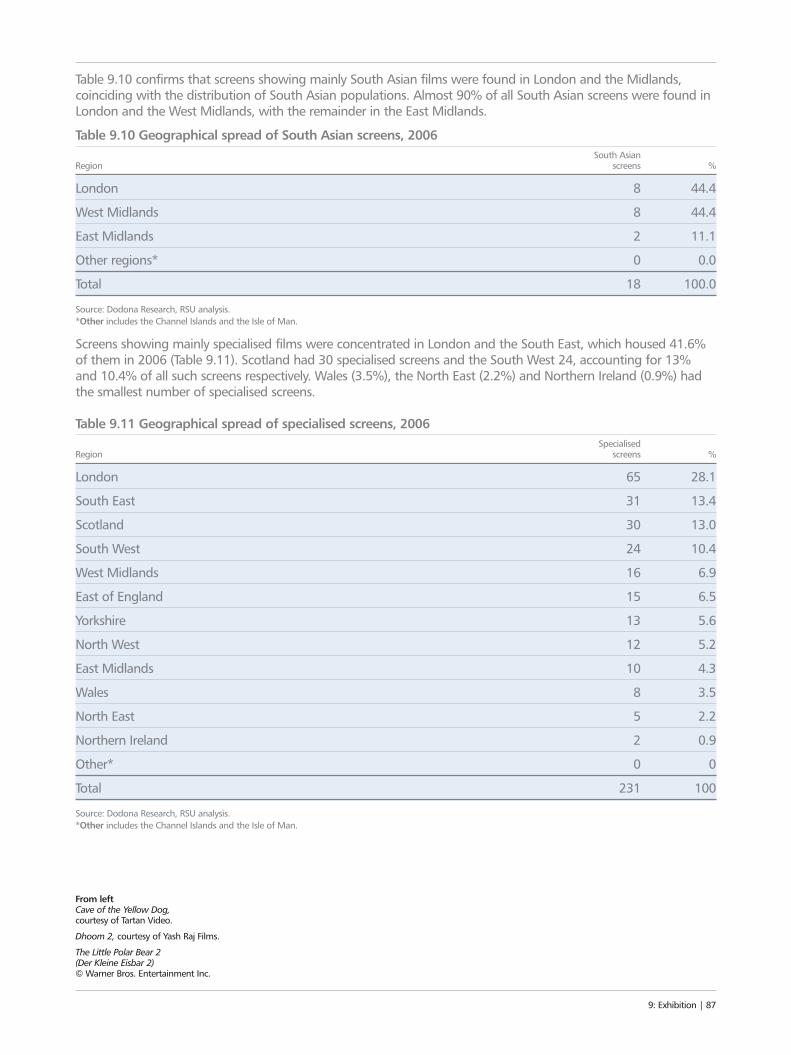
Table 9.10 confirms that screens showing mainly South Asian films were found in London and the Midlands,coinciding with the distribution of South Asian populations. Almost 90% of all South Asian screens were found inLondon and the West Midlands, with the remainder in the East Midlands.
Table 9.10 Geographical spread of South Asian screens, 2006South Asian
Region screens %
London 8 44.4
West Midlands 8 44.4
East Midlands 2 11.1
Other regions* 0 0.0
Total 18 100.0
Source: Dodona Research, RSU analysis.*Other includes the Channel Islands and the Isle of Man.
Screens showing mainly specialised films were concentrated in London and the South East, which housed 41.6%of them in 2006 (Table 9.11). Scotland had 30 specialised screens and the South West 24, accounting for 13%and 10.4% of all such screens respectively. Wales (3.5%), the North East (2.2%) and Northern Ireland (0.9%) hadthe smallest number of specialised screens.
Table 9.11 Geographical spread of specialised screens, 2006Specialised
Region screens %
London 65 28.1
South East 31 13.4
Scotland 30 13.0
South West 24 10.4
West Midlands 16 6.9
East of England 15 6.5
Yorkshire 13 5.6
North West 12 5.2
East Midlands 10 4.3
Wales 8 3.5
North East 5 2.2
Northern Ireland 2 0.9
Other* 0 0
Total 231 100
Source: Dodona Research, RSU analysis.*Other includes the Channel Islands and the Isle of Man.
9: Exhibition | 87
From left Cave of the Yellow Dog, courtesy of Tartan Video.
Dhoom 2, courtesy of Yash Raj Films.
The Little Polar Bear 2 (Der Kleine Eisbar 2) © Warner Bros. Entertainment Inc.
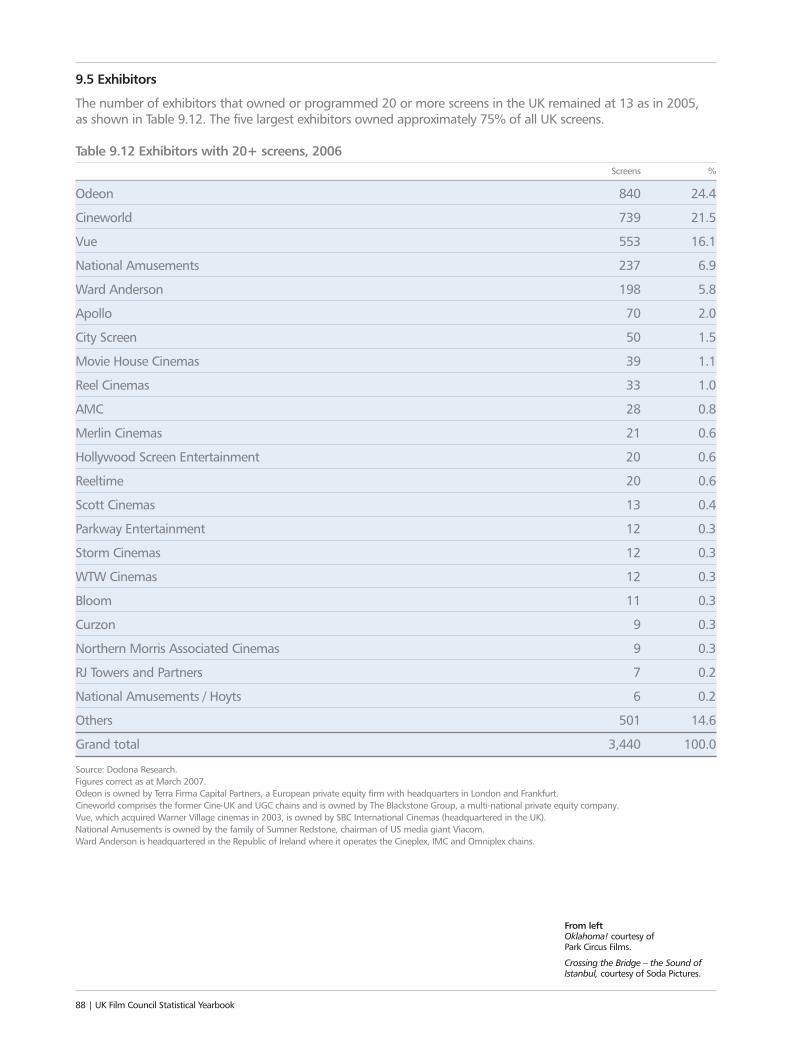
9.5 Exhibitors
The number of exhibitors that owned or programmed 20 or more screens in the UK remained at 13 as in 2005, as shown in Table 9.12. The five largest exhibitors owned approximately 75% of all UK screens.
Table 9.12 Exhibitors with 20+ screens, 2006Screens %
Odeon 840 24.4
Cineworld 739 21.5
Vue 553 16.1
National Amusements 237 6.9
Ward Anderson 198 5.8
Apollo 70 2.0
City Screen 50 1.5
Movie House Cinemas 39 1.1
Reel Cinemas 33 1.0
AMC 28 0.8
Merlin Cinemas 21 0.6
Hollywood Screen Entertainment 20 0.6
Reeltime 20 0.6
Scott Cinemas 13 0.4
Parkway Entertainment 12 0.3
Storm Cinemas 12 0.3
WTW Cinemas 12 0.3
Bloom 11 0.3
Curzon 9 0.3
Northern Morris Associated Cinemas 9 0.3
RJ Towers and Partners 7 0.2
National Amusements / Hoyts 6 0.2
Others 501 14.6
Grand total 3,440 100.0
Source: Dodona Research.Figures correct as at March 2007.Odeon is owned by Terra Firma Capital Partners, a European private equity firm with headquarters in London and Frankfurt.Cineworld comprises the former Cine-UK and UGC chains and is owned by The Blackstone Group, a multi-national private equity company.Vue, which acquired Warner Village cinemas in 2003, is owned by SBC International Cinemas (headquartered in the UK).National Amusements is owned by the family of Sumner Redstone, chairman of US media giant Viacom.Ward Anderson is headquartered in the Republic of Ireland where it operates the Cineplex, IMC and Omniplex chains.
88 | UK Film Council Statistical Yearbook
From left Oklahoma! courtesy of Park Circus Films.
Crossing the Bridge – the Sound ofIstanbul, courtesy of Soda Pictures.
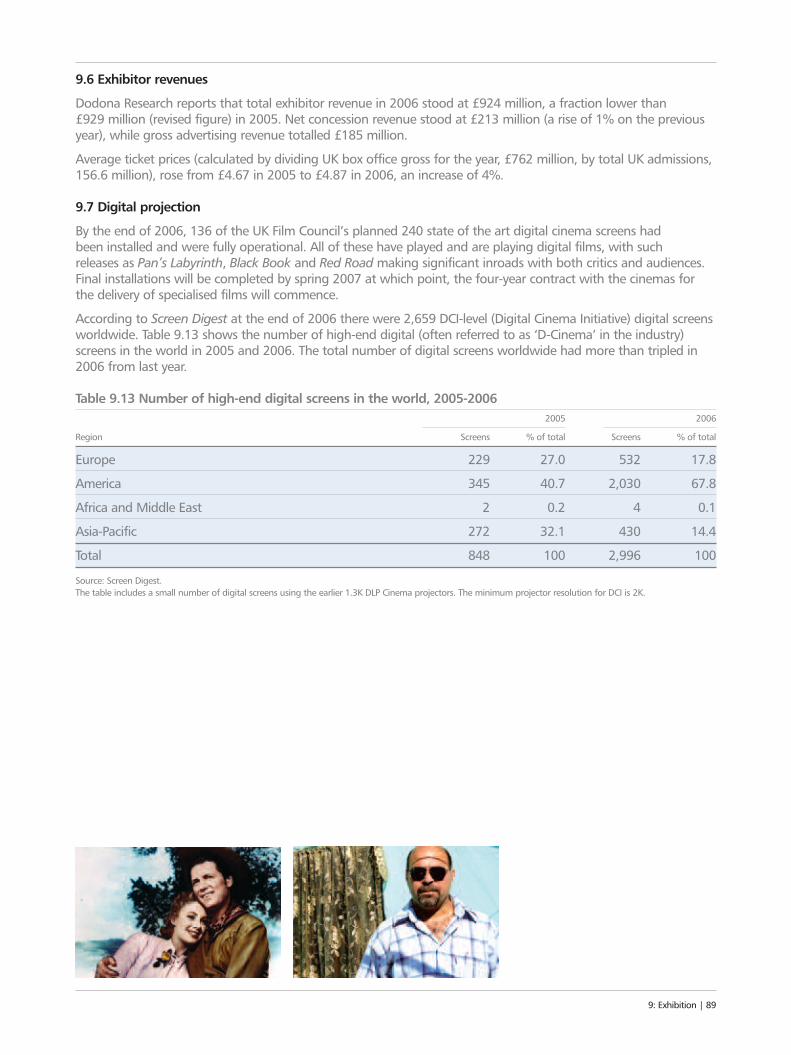
9.6 Exhibitor revenues
Dodona Research reports that total exhibitor revenue in 2006 stood at £924 million, a fraction lower than £929 million (revised figure) in 2005. Net concession revenue stood at £213 million (a rise of 1% on the previousyear), while gross advertising revenue totalled £185 million.
Average ticket prices (calculated by dividing UK box office gross for the year, £762 million, by total UK admissions,156.6 million), rose from £4.67 in 2005 to £4.87 in 2006, an increase of 4%.
9.7 Digital projection
By the end of 2006, 136 of the UK Film Council’s planned 240 state of the art digital cinema screens had been installed and were fully operational. All of these have played and are playing digital films, with such releases as Pan’s Labyrinth, Black Book and Red Road making significant inroads with both critics and audiences. Final installations will be completed by spring 2007 at which point, the four-year contract with the cinemas for the delivery of specialised films will commence.
According to Screen Digest at the end of 2006 there were 2,659 DCI-level (Digital Cinema Initiative) digital screensworldwide. Table 9.13 shows the number of high-end digital (often referred to as ‘D-Cinema’ in the industry)screens in the world in 2005 and 2006. The total number of digital screens worldwide had more than tripled in2006 from last year.
Table 9.13 Number of high-end digital screens in the world, 2005-20062005 2006
Region Screens % of total Screens % of total
Europe 229 27.0 532 17.8
America 345 40.7 2,030 67.8
Africa and Middle East 2 0.2 4 0.1
Asia-Pacific 272 32.1 430 14.4
Total 848 100 2,996 100
Source: Screen Digest.The table includes a small number of digital screens using the earlier 1.3K DLP Cinema projectors. The minimum projector resolution for DCI is 2K.
9: Exhibition | 89
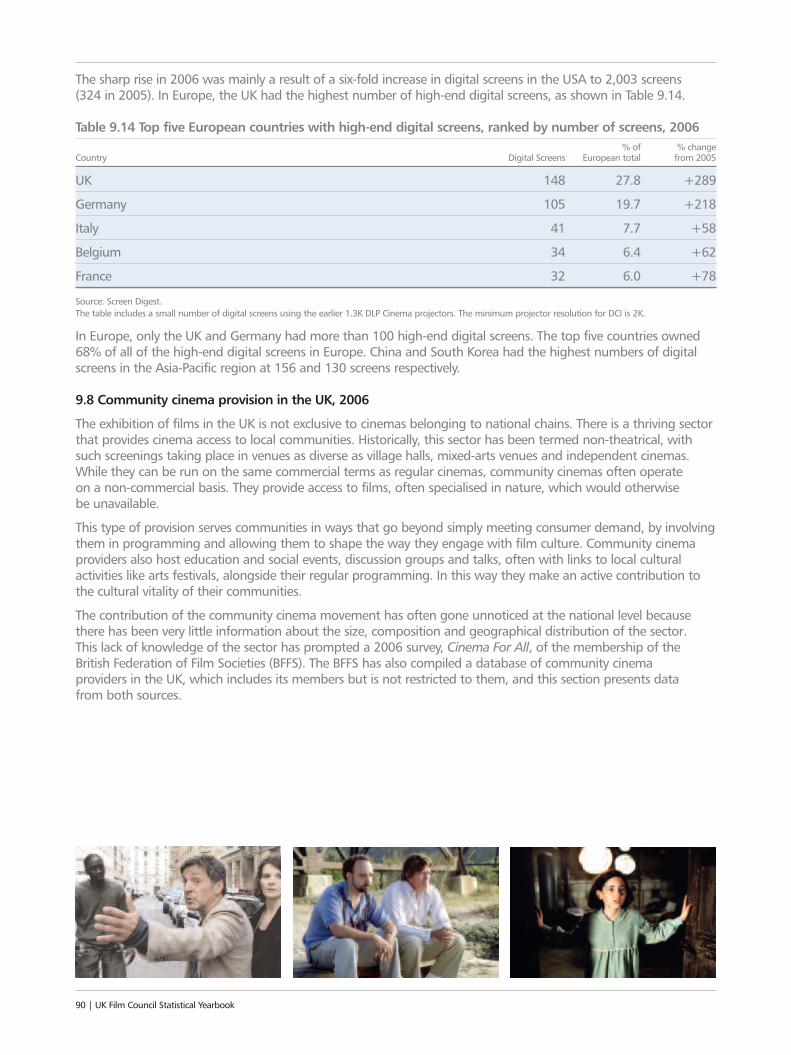
The sharp rise in 2006 was mainly a result of a six-fold increase in digital screens in the USA to 2,003 screens (324 in 2005). In Europe, the UK had the highest number of high-end digital screens, as shown in Table 9.14.
Table 9.14 Top five European countries with high-end digital screens, ranked by number of screens, 2006% of % change
Country Digital Screens European total from 2005
UK 148 27.8 +289
Germany 105 19.7 +218
Italy 41 7.7 +58
Belgium 34 6.4 +62
France 32 6.0 +78
Source: Screen Digest.The table includes a small number of digital screens using the earlier 1.3K DLP Cinema projectors. The minimum projector resolution for DCI is 2K.
In Europe, only the UK and Germany had more than 100 high-end digital screens. The top five countries owned68% of all of the high-end digital screens in Europe. China and South Korea had the highest numbers of digitalscreens in the Asia-Pacific region at 156 and 130 screens respectively.
9.8 Community cinema provision in the UK, 2006
The exhibition of films in the UK is not exclusive to cinemas belonging to national chains. There is a thriving sectorthat provides cinema access to local communities. Historically, this sector has been termed non-theatrical, withsuch screenings taking place in venues as diverse as village halls, mixed-arts venues and independent cinemas.While they can be run on the same commercial terms as regular cinemas, community cinemas often operateon a non-commercial basis. They provide access to films, often specialised in nature, which would otherwise be unavailable.
This type of provision serves communities in ways that go beyond simply meeting consumer demand, by involvingthem in programming and allowing them to shape the way they engage with film culture. Community cinemaproviders also host education and social events, discussion groups and talks, often with links to local culturalactivities like arts festivals, alongside their regular programming. In this way they make an active contribution tothe cultural vitality of their communities.
The contribution of the community cinema movement has often gone unnoticed at the national level becausethere has been very little information about the size, composition and geographical distribution of the sector.This lack of knowledge of the sector has prompted a 2006 survey, Cinema For All, of the membership of theBritish Federation of Film Societies (BFFS). The BFFS has also compiled a database of community cinema providers in the UK, which includes its members but is not restricted to them, and this section presents data from both sources.
90 | UK Film Council Statistical Yearbook
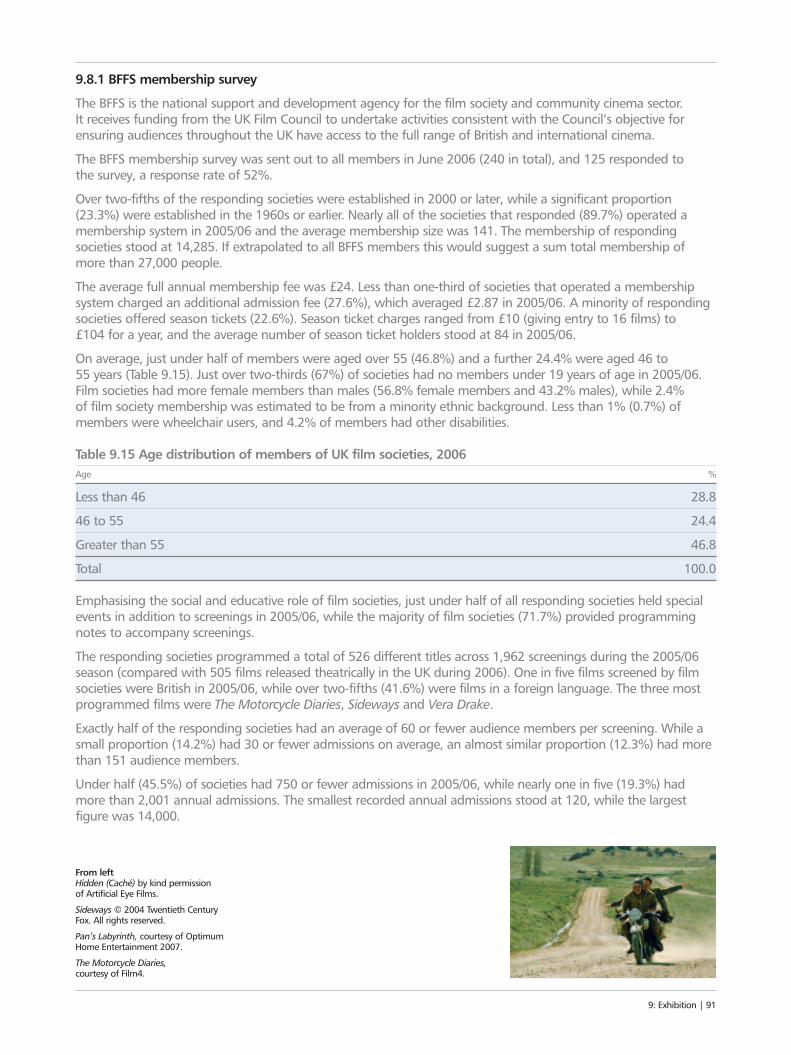
9.8.1 BFFS membership survey
The BFFS is the national support and development agency for the film society and community cinema sector. It receives funding from the UK Film Council to undertake activities consistent with the Council’s objective forensuring audiences throughout the UK have access to the full range of British and international cinema.
The BFFS membership survey was sent out to all members in June 2006 (240 in total), and 125 responded to the survey, a response rate of 52%.
Over two-fifths of the responding societies were established in 2000 or later, while a significant proportion(23.3%) were established in the 1960s or earlier. Nearly all of the societies that responded (89.7%) operated amembership system in 2005/06 and the average membership size was 141. The membership of respondingsocieties stood at 14,285. If extrapolated to all BFFS members this would suggest a sum total membership of more than 27,000 people.
The average full annual membership fee was £24. Less than one-third of societies that operated a membershipsystem charged an additional admission fee (27.6%), which averaged £2.87 in 2005/06. A minority of respondingsocieties offered season tickets (22.6%). Season ticket charges ranged from £10 (giving entry to 16 films) to £104 for a year, and the average number of season ticket holders stood at 84 in 2005/06.
On average, just under half of members were aged over 55 (46.8%) and a further 24.4% were aged 46 to 55 years (Table 9.15). Just over two-thirds (67%) of societies had no members under 19 years of age in 2005/06. Film societies had more female members than males (56.8% female members and 43.2% males), while 2.4% of film society membership was estimated to be from a minority ethnic background. Less than 1% (0.7%) ofmembers were wheelchair users, and 4.2% of members had other disabilities.
Table 9.15 Age distribution of members of UK film societies, 2006Age %
Less than 46 28.8
46 to 55 24.4
Greater than 55 46.8
Total 100.0
Emphasising the social and educative role of film societies, just under half of all responding societies held specialevents in addition to screenings in 2005/06, while the majority of film societies (71.7%) provided programmingnotes to accompany screenings.
The responding societies programmed a total of 526 different titles across 1,962 screenings during the 2005/06season (compared with 505 films released theatrically in the UK during 2006). One in five films screened by filmsocieties were British in 2005/06, while over two-fifths (41.6%) were films in a foreign language. The three mostprogrammed films were The Motorcycle Diaries, Sideways and Vera Drake.
Exactly half of the responding societies had an average of 60 or fewer audience members per screening. While asmall proportion (14.2%) had 30 or fewer admissions on average, an almost similar proportion (12.3%) had morethan 151 audience members.
Under half (45.5%) of societies had 750 or fewer admissions in 2005/06, while nearly one in five (19.3%) had more than 2,001 annual admissions. The smallest recorded annual admissions stood at 120, while the largestfigure was 14,000.
9: Exhibition | 91
From left Hidden (Caché) by kind permission of Artificial Eye Films.
Sideways © 2004 Twentieth CenturyFox. All rights reserved.
Pan’s Labyrinth, courtesy of OptimumHome Entertainment 2007.
The Motorcycle Diaries, courtesy of Film4.
The sum total of all admissions from responding societies was 116,040 for 2005/06. If this were extrapolated to all BFFS members, the total number of admissions would have been around 225,000. Putting this inperspective, theatrical ticket sales on this scale would have generated gross box office receipts of over £1 million(225,000 multiplied by £4.87 [the average ticket price in 2006] = £1,095,750).
Just under half of societies (47.8%) used more than one format to screen films. The most commonly used formatwas DVD (used by 85.5% of responding societies). But despite the dominance of digital technology, just overone-third of societies still use VHS. A slightly smaller proportion (31.6%) used 35mm, with 13.7% using 16mm.
On average, film societies were located 9.43 miles from their nearest commercial cinema, ranging from less than a mile to 80 miles. Just under half of societies (47.5%) operated in town locations with 42.4% in rural areas(14.4% in remote rural locations more than 10 miles from a large settlement).
9.8.2 Community cinema provision
As of October 2006, there were 746 community cinema providers operating in the UK (see 9.8 for the source ofthis data). Community cinema providers include film societies, independent cinemas, mixed-use venues thatscreen films, and mobile and touring screen networks. Some of the independently owned and run cinemasincluded in the community cinema database also appear in the exhibition analysis presented in previous chapters.Readers should not assume that the 746 community cinema providers are in addition to the 697 cinemasdescribed in section 9.1 as there is some overlap in the two datasets.
Table 9.16 shows the number of community cinema providers by type. The majority were general film societies(32%) followed by independent cinema (29%). It also reveals that there were nearly as many mixed-use venues(eg local authority-run community arts venues) screening films as independent cinemas in 2006.
Table 9.16: Number of community cinema providers by typeType Number %
General film society* 242 32.2
Independent cinema 214 28.7
Mixed-use venue 203 27.2
Higher education film society 82 11.0
Miscellaneous 5 0.7
Festival 2 0.3
Total 746 100.0
*General film society includes two film festivals that are members of the BFFS.Source: BFFS.
92 | UK Film Council Statistical Yearbook
Left The Proposition,courtesy of Tartan Video.
Table 9.17 looks at the spread of the community cinema providers across the nations and regions. The majority(80%) of the community cinemas in the UK were in England, followed by Wales and Scotland both at around 9%.The South West had the largest number of community cinemas (135) while over half of the community cinemaswere located in the South West, South East, London and Wales.
Table 9.17: Number of community cinemas across UK nations and regionsNation/region Number %
South West 135 18.1
South East 123 16.5
London 78 10.5
Wales 69 9.2
Scotland 68 9.1
North West 60 8.0
East of England 58 7.8
Yorkshire 54 7.2
East Midlands 38 5.1
West Midlands 30 4.0
North East 17 2.3
Northern Ireland 10 1.3
Other* 6 0.8
Total 746 100.0
Source: BBFS.
9: Exhibition | 93
From left Cockles & Muscles, courtesy of Peccadillo Pictures.
Vera Drake, courtesy of Momentum Pictures.
Just under one-third of all community cinema providers in England were general film societies as Table 9.18reveals. Scotland had the highest number of general film societies as a proportion of all community cinemaproviders (39.7%). Over half of all providers in Wales were mixed-use venues (52.2%). Independent cinemasdominated Northern Ireland’s community cinema provision (70% of the total).
Table 9.18: Proportion of community cinema providers by type across nations and regionsNorthern
England Wales Scotland IrelandType (%) (%) (%) (%)
Festival 0.3 0.0 0.0 0.0
General film society 32.9 21.7 39.7 0.0
Higher education film society 11.8 7.2 10.3 0.0
Independent cinema 28.7 18.8 30.9 70.0
Miscellaneous 0.8 0.0 0.0 0.0
Mixed-use venue 25.5 52.2 19.1 30.0
Total 100.0 100.0 100.0 100.0
Source: BFFS.
The majority (80% as shown in Table 9.17) of community cinema providers could be found in the English regions.Table 9.19 shows the spread of different types of community cinema provision across the English regions.
The South West (which had the highest number of community cinema providers in England) had the highestproportion of general film societies (47.8%). The lowest was in the North East (11.8%). London had the highestproportion of independent cinemas (36.8%), which made up the largest section of community cinema providers inthe capital. The North East had the lowest proportion of independent cinemas (17.6%), but the highest proportionof mixed-use venues (47.1%). The lowest proportion of mixed-use venues was found in Yorkshire (14.8%).
Table 9.19: Proportion of community cinemas by type across English regionsGeneral Higher education Independent Mixed-use
Region film society film society cinema venue
East Midlands 26.3 15.8 26.3 31.6
East of England 28.6 19.6 16.1 35.7
London 22.4 22.4 36.8 18.4
North East 11.8 23.5 17.6 47.1
North West 39.7 8.6 29.3 22.4
South East 28.5 8.9 32.5 30.1
South West 47.8 5.2 26.1 20.9
West Midlands 30.0 6.7 26.7 36.7
Yorkshire 35.2 13.0 37.0 14.8
Source: BFFS.For ease of reporting, film festivals and miscellaneous categories have been omitted.
94 | UK Film Council Statistical Yearbook
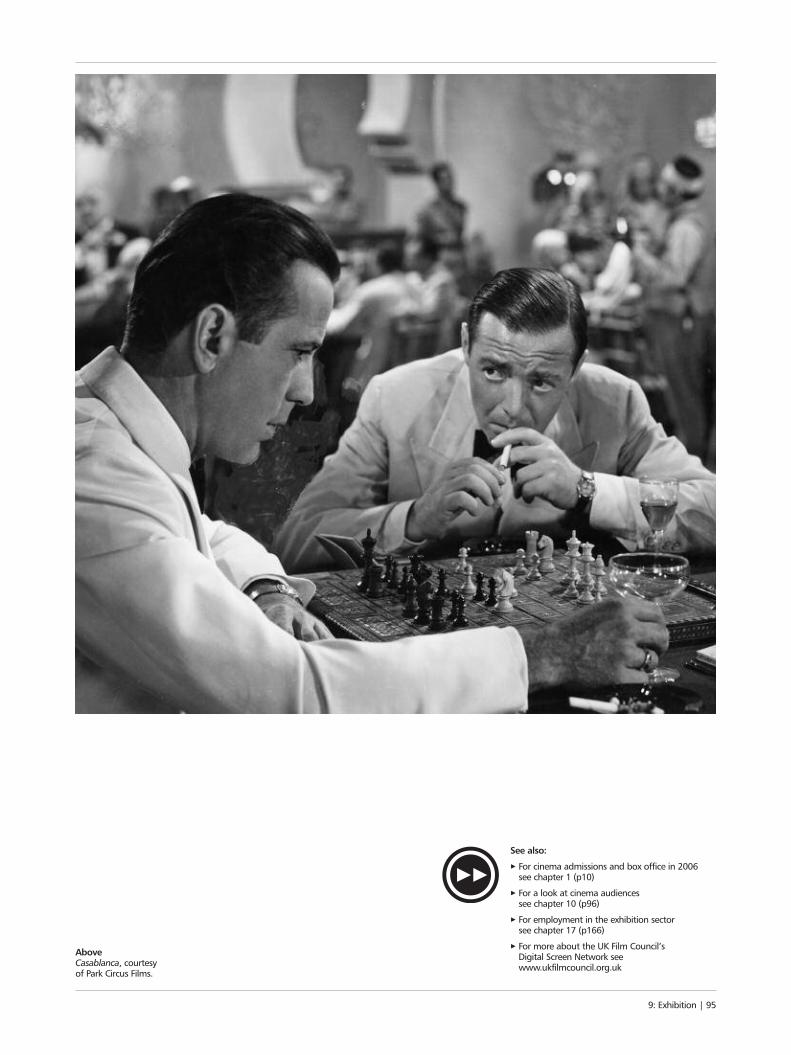
9: Exhibition | 95
See also:
3 For cinema admissions and box office in 2006 see chapter 1 (p10)
3 For a look at cinema audiences see chapter 10 (p96)
3 For employment in the exhibition sector see chapter 17 (p166)
3 For more about the UK Film Council’s Digital Screen Network see www.ukfilmcouncil.org.uk
AboveCasablanca, courtesy of Park Circus Films.

10: AUDIENCESDespite the ready availability of home-basedentertainment, going to the cinema is still a highlypopular activity, particularly for younger age groups. This chapter takes a detailed look at cinema audiencesby age, gender and film preferences. It also summarisesa recent study showing who downloads film free fromthe Internet.96 | UK Film Council Statistical Yearbook
“THINK ACTION MEETS
18% went once a month
or more
There was an even split between
men and women in thecinema audience for
the top 20 films
In 2006, 60% of the UK populationsaid they went to
the cinema at leastonce a year

10: Audiences | 97
CHICK-FLICKThe cinema audience for the top 20 films in
2006 was predominantlyyoung, with the 7-34 age
group (40% of the population) making up 64% of the audience
Dramas and comedies with women
in leading roles plusfamily films appealedmost to the female
audience12% of the cinema-going population
reported that they had downloaded
a film for free off the Internet
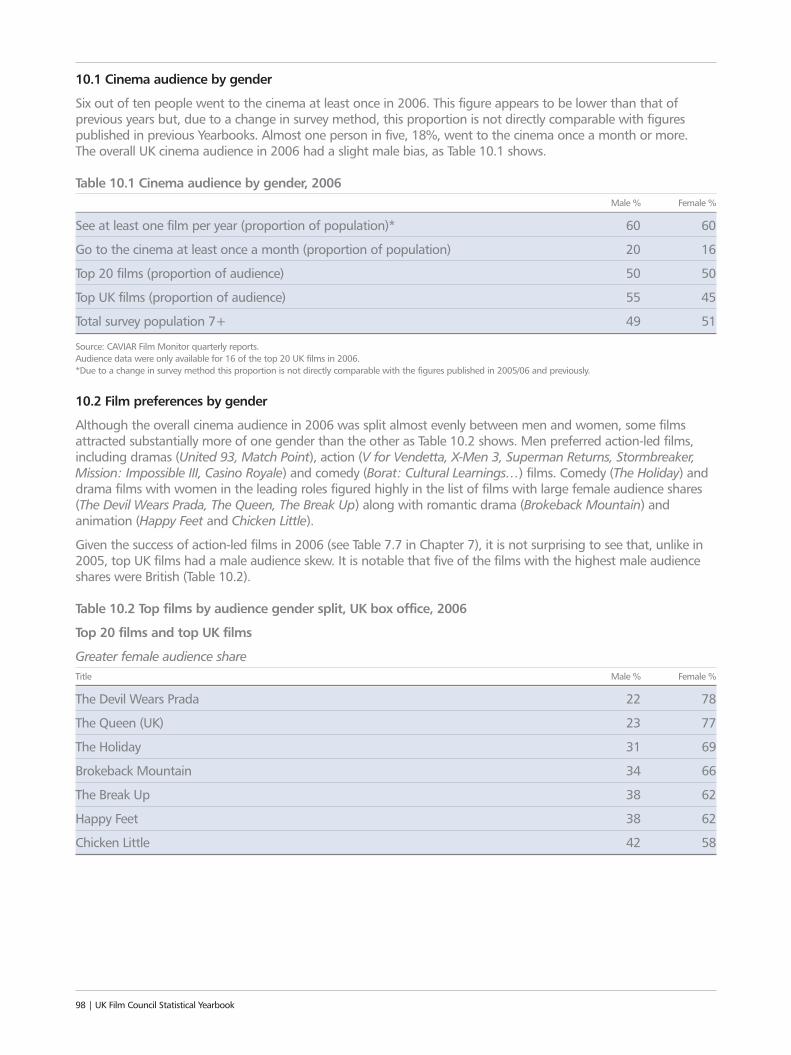
10.1 Cinema audience by gender
Six out of ten people went to the cinema at least once in 2006. This figure appears to be lower than that ofprevious years but, due to a change in survey method, this proportion is not directly comparable with figurespublished in previous Yearbooks. Almost one person in five, 18%, went to the cinema once a month or more. The overall UK cinema audience in 2006 had a slight male bias, as Table 10.1 shows.
Table 10.1 Cinema audience by gender, 2006Male % Female %
See at least one film per year (proportion of population)* 60 60
Go to the cinema at least once a month (proportion of population) 20 16
Top 20 films (proportion of audience) 50 50
Top UK films (proportion of audience) 55 45
Total survey population 7+ 49 51
Source: CAVIAR Film Monitor quarterly reports.Audience data were only available for 16 of the top 20 UK films in 2006.*Due to a change in survey method this proportion is not directly comparable with the figures published in 2005/06 and previously.
10.2 Film preferences by gender
Although the overall cinema audience in 2006 was split almost evenly between men and women, some filmsattracted substantially more of one gender than the other as Table 10.2 shows. Men preferred action-led films,including dramas (United 93, Match Point), action (V for Vendetta, X-Men 3, Superman Returns, Stormbreaker,Mission: Impossible III, Casino Royale) and comedy (Borat: Cultural Learnings…) films. Comedy (The Holiday) anddrama films with women in the leading roles figured highly in the list of films with large female audience shares(The Devil Wears Prada, The Queen, The Break Up) along with romantic drama (Brokeback Mountain) andanimation (Happy Feet and Chicken Little).
Given the success of action-led films in 2006 (see Table 7.7 in Chapter 7), it is not surprising to see that, unlike in2005, top UK films had a male audience skew. It is notable that five of the films with the highest male audienceshares were British (Table 10.2).
Table 10.2 Top films by audience gender split, UK box office, 2006
Top 20 films and top UK films
Greater female audience shareTitle Male % Female %
The Devil Wears Prada 22 78
The Queen (UK) 23 77
The Holiday 31 69
Brokeback Mountain 34 66
The Break Up 38 62
Happy Feet 38 62
Chicken Little 42 58
98 | UK Film Council Statistical Yearbook
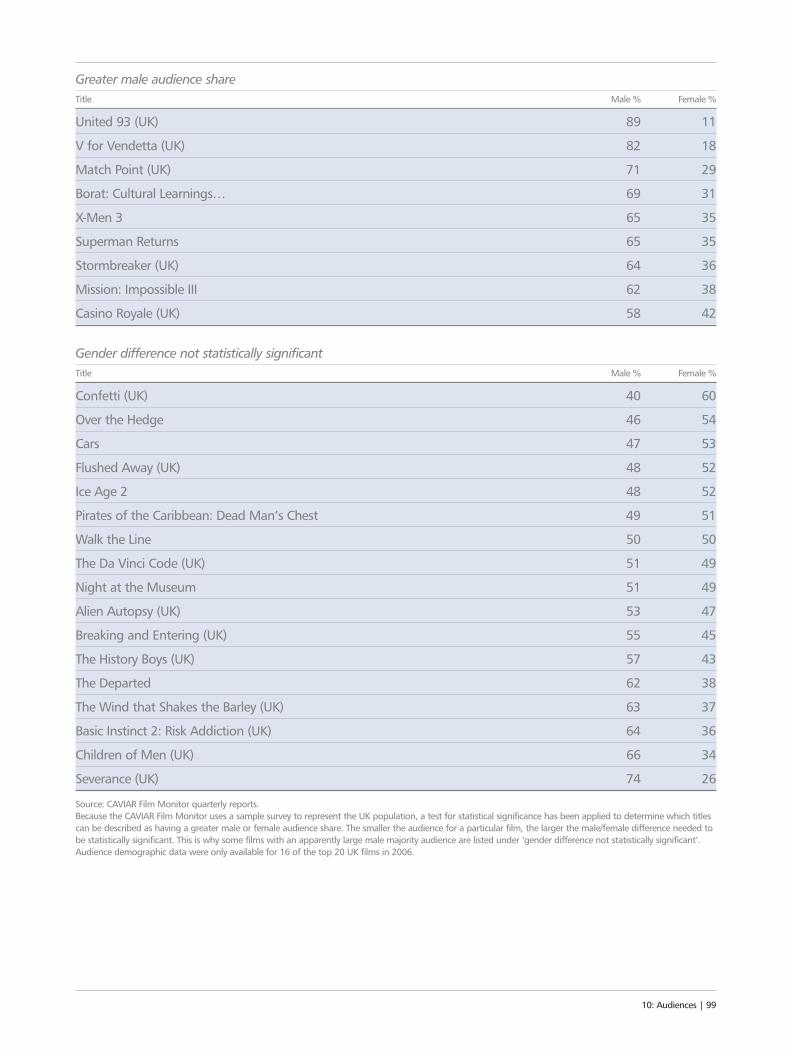
Greater male audience shareTitle Male % Female %
United 93 (UK) 89 11
V for Vendetta (UK) 82 18
Match Point (UK) 71 29
Borat: Cultural Learnings… 69 31
X-Men 3 65 35
Superman Returns 65 35
Stormbreaker (UK) 64 36
Mission: Impossible III 62 38
Casino Royale (UK) 58 42
Gender difference not statistically significantTitle Male % Female %
Confetti (UK) 40 60
Over the Hedge 46 54
Cars 47 53
Flushed Away (UK) 48 52
Ice Age 2 48 52
Pirates of the Caribbean: Dead Man’s Chest 49 51
Walk the Line 50 50
The Da Vinci Code (UK) 51 49
Night at the Museum 51 49
Alien Autopsy (UK) 53 47
Breaking and Entering (UK) 55 45
The History Boys (UK) 57 43
The Departed 62 38
The Wind that Shakes the Barley (UK) 63 37
Basic Instinct 2: Risk Addiction (UK) 64 36
Children of Men (UK) 66 34
Severance (UK) 74 26
Source: CAVIAR Film Monitor quarterly reports.Because the CAVIAR Film Monitor uses a sample survey to represent the UK population, a test for statistical significance has been applied to determine which titlescan be described as having a greater male or female audience share. The smaller the audience for a particular film, the larger the male/female difference needed tobe statistically significant. This is why some films with an apparently large male majority audience are listed under ‘gender difference not statistically significant’.Audience demographic data were only available for 16 of the top 20 UK films in 2006.
10: Audiences | 99
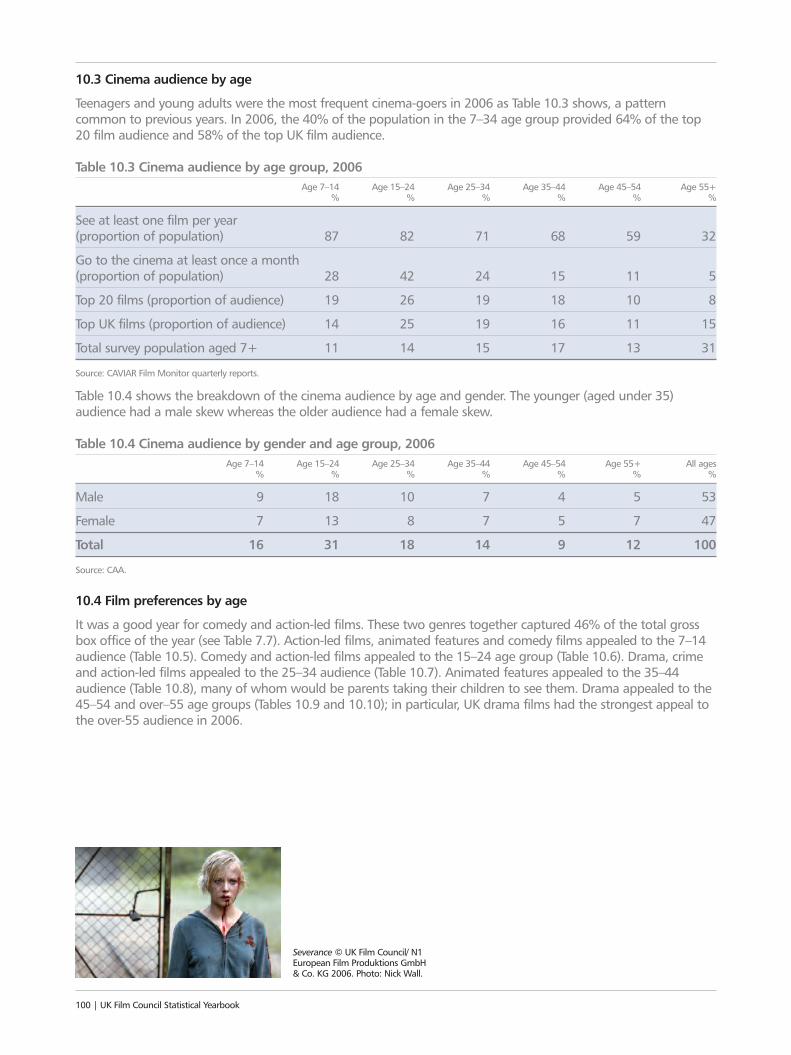
Severance © UK Film Council/ N1European Film Produktions GmbH & Co. KG 2006. Photo: Nick Wall.
10.3 Cinema audience by age
Teenagers and young adults were the most frequent cinema-goers in 2006 as Table 10.3 shows, a patterncommon to previous years. In 2006, the 40% of the population in the 7–34 age group provided 64% of the top20 film audience and 58% of the top UK film audience.
Table 10.3 Cinema audience by age group, 2006Age 7–14 Age 15–24 Age 25–34 Age 35–44 Age 45–54 Age 55+
% % % % % %
See at least one film per year(proportion of population) 87 82 71 68 59 32
Go to the cinema at least once a month(proportion of population) 28 42 24 15 11 5
Top 20 films (proportion of audience) 19 26 19 18 10 8
Top UK films (proportion of audience) 14 25 19 16 11 15
Total survey population aged 7+ 11 14 15 17 13 31
Source: CAVIAR Film Monitor quarterly reports.
Table 10.4 shows the breakdown of the cinema audience by age and gender. The younger (aged under 35)audience had a male skew whereas the older audience had a female skew.
Table 10.4 Cinema audience by gender and age group, 2006Age 7–14 Age 15–24 Age 25–34 Age 35–44 Age 45–54 Age 55+ All ages
% % % % % % %
Male 9 18 10 7 4 5 53
Female 7 13 8 7 5 7 47
Total 16 31 18 14 9 12 100
Source: CAA.
10.4 Film preferences by age
It was a good year for comedy and action-led films. These two genres together captured 46% of the total grossbox office of the year (see Table 7.7). Action-led films, animated features and comedy films appealed to the 7–14audience (Table 10.5). Comedy and action-led films appealed to the 15–24 age group (Table 10.6). Drama, crimeand action-led films appealed to the 25–34 audience (Table 10.7). Animated features appealed to the 35–44audience (Table 10.8), many of whom would be parents taking their children to see them. Drama appealed to the45–54 and over–55 age groups (Tables 10.9 and 10.10); in particular, UK drama films had the strongest appeal tothe over-55 audience in 2006.
100 | UK Film Council Statistical Yearbook
Table 10.5 Films with an above-average audience in 7–14 age group, 2006
Top 20 films and top UK filmsAge group %
Title of the film’s total audience
Stormbreaker (UK) 41.9
Flushed Away (UK) 40.7
Night at the Museum 33.7
Ice Age 2 31.0
Over the Hedge 29.9
Happy Feet 29.6
Cars 28.8
Chicken Little 27.6
7–14 age group in top 20 audience (%) 19.3
7–14 age group in top UK audience (%) 13.6
7–14 age group in total survey population (%) 11.1
Source: CAVIAR Film Monitor quarterly reports.Only those films that had a statistically significantly higher than average audience in the above age group are reported in this table.
Table 10.6 Films with an above-average audience in 15–24 age group, 2006
Top 20 films and top UK filmsAge group %
Title of the film’s total audience
Severance (UK) 63.2
Borat: Cultural Learnings... 62.4
V for Vendetta (UK) 50.6
The Break Up 49.7
Confetti (UK) 45.7
Children of Men (UK) 45.2
Alien Autopsy (UK) 40.3
X-Men 3 36.4
The Devil Wears Prada 36.0
Superman Returns 35.5
15–24 age group in top 20 audience (%) 26.1
15–24 age group in top UK audience (%) 24.7
15–24 age group in total survey population (%) 13.8
Source: CAVIAR Film Monitor quarterly reports.Only those films that had a statistically significantly higher than average audience in the above age group are reported in this table.
10: Audiences | 101
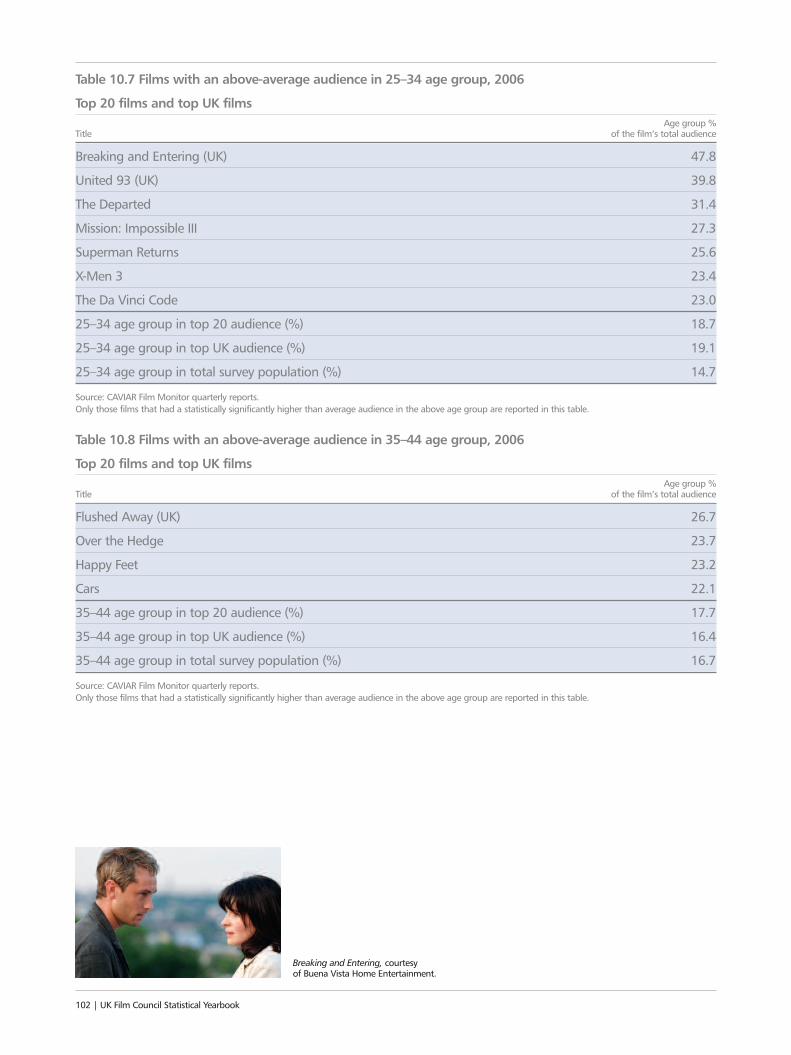
Table 10.7 Films with an above-average audience in 25–34 age group, 2006
Top 20 films and top UK filmsAge group %
Title of the film’s total audience
Breaking and Entering (UK) 47.8
United 93 (UK) 39.8
The Departed 31.4
Mission: Impossible III 27.3
Superman Returns 25.6
X-Men 3 23.4
The Da Vinci Code 23.0
25–34 age group in top 20 audience (%) 18.7
25–34 age group in top UK audience (%) 19.1
25–34 age group in total survey population (%) 14.7
Source: CAVIAR Film Monitor quarterly reports.Only those films that had a statistically significantly higher than average audience in the above age group are reported in this table.
Table 10.8 Films with an above-average audience in 35–44 age group, 2006
Top 20 films and top UK filmsAge group %
Title of the film’s total audience
Flushed Away (UK) 26.7
Over the Hedge 23.7
Happy Feet 23.2
Cars 22.1
35–44 age group in top 20 audience (%) 17.7
35–44 age group in top UK audience (%) 16.4
35–44 age group in total survey population (%) 16.7
Source: CAVIAR Film Monitor quarterly reports.Only those films that had a statistically significantly higher than average audience in the above age group are reported in this table.
102 | UK Film Council Statistical Yearbook
Breaking and Entering, courtesy of Buena Vista Home Entertainment.
Table 10.9 Films with an above-average audience in 45–54 age group, 2006
Top 20 films and top UK filmsAge group %
Title of the film’s total audience
The Wind that Shakes the Barley (UK) 23.9
Brokeback Mountain 20.5
The Queen (UK) 17.6
The Da Vinci Code (UK) 14.5
Pirates of the Caribbean: Dead Man’s Chest 12.4
45–54 age group in top 20 audience (%) 9.8
45–54 age group in top UK audience (%) 10.9
45–54 age group in total survey population (%) 13.2
Source: CAVIAR Film Monitor quarterly reports.Only those films that had a statistically significantly higher than average audience in the above age group are reported in this table.
Table 10.10 Films with an above-average audience in 55+ age group, 2006
Top 20 films and top UK filmsAge group %
Title of the film’s total audience
The Queen (UK) 58.8
The History Boys (UK) 40.4
The Wind that Shakes the Barley (UK) 33.9
Walk the Line 31.7
Brokeback Mountain 20.5
The Da Vinci Code (UK) 17.2
Casino Royale (UK) 13.5
55+ age group in top 20 audience (%) 8.4
55+ age group in top UK audience (%) 15.3
55+ age group in total survey population (%) 30.6
Source: CAVIAR Film Monitor quarterly reports.Only those films that had a statistically significantly higher than average audience in the above age group are reported in this table.
10: Audiences | 103
Casino Royale © 2006 Danjaq, LLC and United Artists Corporationand Columbia Pictures Industries, Inc.
V for Vendetta © Warner Bros.Entertainment Inc.
10.5 Cinema audience by social group
The cinema audience for both the top 20 films and top UK films had a higher incidence of people in professionaland higher-skilled manual occupations than in the population as a whole (Table 10.11).
Table 10.11 Cinema audience by social group, 2006AB C1 C2 DE
See at least one film per year (% proportion of population) 73 65 59 44
Go to the cinema at least once a month (% proportion of population) 22 21 16 12
Top 20 films (% proportion of audience) 30 34 20 16
Top UK films (% proportion of audience) 35 33 17 15
Total survey population 7+ 25 29 21 25
Source: CAVIAR Film Monitor quarterly reports.AB: Professional, business and white collar, C1: Higher-skilled manual, C2: Lower-skilled manual, DE: ‘Semi-’ and ‘Un-skilled’ manual.
10.6 Film preferences by social group
Six films had a particularly high appeal to the AB audience (compared with three last year): The Queen,Stormbreaker, Brokeback Mountain, The Devil Wears Prada, Casino Royale and The Da Vinci Code, four of themcertified as UK films (Table 10.12). The Departed and Mission: Impossible III had a particularly high appeal to theC1 audience (Table 10.13). Basic Instinct 2: Risk Addiction and Cars appealed to the DE audience (Table 10.14). No titles stood out for the C2 group.
Table 10.12 Films with above-average AB audience share, 2006
Top 20 films and top UK filmsTitle AB group %
of film’s total audience
The Queen (UK) 42.0
Stormbreaker (UK) 40.1
Brokeback Mountain 39.9
The Devil Wears Prada 38.7
Casino Royale (UK) 37.6
The Da Vinci Code (UK) 37.1
AB share of top 20 audience 29.9
AB share of top UK audience 34.7
AB in total survey population (%) 24.7
Source: CAVIAR Film Monitor quarterly reports.Only those films that had a statistically significantly higher than average audience in the above age group are reported in this table.
104 | UK Film Council Statistical Yearbook
Table 10.13 Films with above-average C1 audience share, 2006
Top 20 films and top UK filmsC1 group %
Title of film’s total audience
The Departed 46.3
Mission: Impossible III 40.6
C1 share of top 20 audience 33.8
C1 share of top UK audience 32.5
C1 in total survey population (%) 29.1
Source: CAVIAR Film Monitor quarterly reports.Only those films that had a statistically significantly higher than average audience in the above age group are reported in this table.
Table 10.14 Films with above-average DE audience share, 2006
Top 20 films and top UK filmsDE group %
Title of film’s total audience
Basic Instinct 2: Risk Addiction (UK) 28.7
Cars 21.1
DE share of top 20 audience 16.5
DE share of top UK audience 15.4
DE in total survey population (%) 25.3
Source: CAVIAR Film Monitor quarterly reports.Only those films that had a statistically significantly higher than average audience in the above age group are reported in this table.
10.7 Film audiences by ethnicity
Once again, minority ethnic groups were over-represented among buyers of cinema tickets, rental films andpay-per-view (PPV) and under-represented among buyers of DVDs/videos (Table 10.15). The picture was broadlysimilar to that of the previous three years except for buyers of pay-per-view which nearly doubled from last year.
Table 10.15 Ethnicity of audiences aged 12–74 for cinema, rental and retail DVD/video, PPV, 2006Black, Asian, Chinese,
mixed and other % White %
Population aged 12–74 8.7 91.3
Buyers of cinema, rental, retail and PPV film 8.4 91.6
DVD/video renters 11.2 88.8
DVD/video buyers 7.6 92.3
Cinema-goers 13.1 86.9
PPV buyers 15.8 84.2
Source: TNS.
For reference, the size of each of these markets as measured in the TNS survey is shown in Table 10.16.
10: Audiences | 105
Table 10.16 Size of cinema, rental, retail and PPV markets for 12–74 age groups, 2006Number of Market volume
persons/buyers (millions (millions) of purchases)
Population aged 12–74 48.2 n/a
Total buyers: cinema, rental, retail and PPV film 37.8 519.4
DVD/video renters 12.7 125.7
Cinema-goers 20.9 146.3
PPV 4.1 8.2
DVD/video buyers 24.6 238.9
Source: TNS.
As in 2005 there was a common core of films that were popular across the main ethnic groups, but certain titleshad stronger appeal to particular groups, as illustrated in Table 10.17, which shows the top ten films for the black,white and Indian and Pakistani ethnic groups. The popular adventure film, Pirates of the Caribbean: Dead Man’sChest, was the favourite film for all three ethnic groups.
Cars, Click, The Devil Wears Prada and The Departed appear in the white population’s top ten but in neither ofthe other top tens. Saw 3, Little Man and You, Me and Dupree appear in black people’s top 10 but did not getinto the top 10 lists of the other groups. Miami Vice and Mission: Impossible III appear in the Indian and Pakistanigroup but did not make it into the top 10 lists in the other groups.
Table 10.17 Top films by ethnicity of audience, 2006Rank White Black Indian and Pakistani
1 Pirates of the Caribbean: Pirates of the Caribbean: Pirates of the Caribbean: Dead Man’s Chest Dead Man’s Chest Dead Man’s Chest
2 The Da Vinci Code Borat: Cultural Learnings… Superman Returns
3 X-Men 3 Superman Returns The Break Up
4 Cars Saw 3 The Da Vinci Code
5 Borat: Cultural Learnings… X-Men 3 Casino Royale
6 Over the Hedge Little Man Borat: Cultural Learnings…
7 Click The Break Up X-Men 3
8 The Devil Wears Prada Casino Royale Miami Vice
9 The Departed The Da Vinci Code Over the Hedge
10 Superman Returns You, Me and Dupree Mission: Impossible III
Source: FAME.Black means the sum of black Caribbean, black African and ‘black other’ groups. ‘Indian and Pakistani’ is the sum of Indian and Pakistani. Other ethnic groups havenot been shown separately due to small sample sizes.
106 | UK Film Council Statistical Yearbook
10.8 Film audiences by disability
As in the previous three years, disabled people were significantly under-represented overall among those whopaid to watch films. Retail DVD/video was the only market segment in which disabled purchasers matched theiroverall population percentage.
Table 10.18 Disabled audiences aged 12–74 for cinema, rental and retail DVD/video, PPV, 2006Disabled % Not disabled %
Population aged 12–74 14.9 85.0
Buyers of cinema, rental, retail and PPV film 12.0 88.0
DVD/video renters 6.0 94.1
Cinema-goers 6.0 93.9
PPV buyers 2.5 97.5
DVD/video buyers 15.3 84.6
Source: TNS.
10.9 Film preferences by region
The regional distribution of the audiences for most top 20 and top UK films was close to that of the top 20audience as a whole. Eight titles had unusually high audience shares in particular regions: The History Boys,Mission: Impossible III and X-Men 3 in London (Table 10.19), Alien Autopsy and V for Vendetta in the South/SouthEast (Table 10.20), Happy Feet in South West/Wales (Table 10.21), Night at the Museum in Tyne Tees/Yorkshire(Table 10.22) and The Break Up and Happy Feet in Scotland (Table 10.23).
Table 10.19 Films with above-average London audience share, 2006
Top 20 films and top UK filmsLondon %
Title of film’s total audience
The History Boys (UK) 37.1
Mission: Impossible III 30.5
X-Men 3 30.1
London share of top 20 audience 22.8
London share of top UK audience 25.7
London total survey population (%) 19.8
Source: CAVIAR Film Monitor quarterly reports.Only those films that had a statistically significantly higher than average audience in the above age group are reported in this table.
10: Audiences | 107
From leftOver the Hedge, courtesy of Paramount Pictures.
Brokeback Mountain, courtesy ofEntertainment Film Distributors.
Table 10.20 Films with above-average South/South East audience share, 2006
Top 20 films and top UK filmsSouth/South East %
Title of film’s total audience
Alien Autopsy (UK) 33.2
V for Vendetta (UK) 28.5
South/South East share of top 20 audience 17.4
South/South East share of top UK audience 18.7
South/South East total survey population (%) 17.4
Source: CAVIAR Film Monitor quarterly reports.Only those films that had a statistically significantly higher than average audience in the above age group are reported in this table.
Table 10.21 Films with above-average South West/Wales audience share, 2006
Top 20 films and top UK filmsSouth West/Wales %
Title of film’s total audience
Happy Feet 13.0
South West/Wales share of top 20 audience 8.3
South West/Wales share of top UK audience 7.4
South West/Wales total survey population (%) 9.0
Source: CAVIAR Film Monitor quarterly reports.Only those films that had a statistically significantly higher than average audience in the above age group are reported in this table.
Table 10.22 Films with above-average Tyne Tees/Yorkshire audience share, 2006
Top 20 films and top UK filmsTyne Tees/Yorkshire %
Title of film’s total audience
Night at the Museum 17.8
Tyne Tees/Yorkshire share of top 20 audience 13.8
Tyne Tees/Yorkshire share of top UK audience 12.0
Tyne Tees/Yorkshire total survey population (%) 14.5
Source: CAVIAR Film Monitor quarterly reports.Only those films that had a statistically significantly higher than average audience in the above age group are reported in this table.
108 | UK Film Council Statistical Yearbook
The Departed, courtesy of Entertainment Film Distributors.
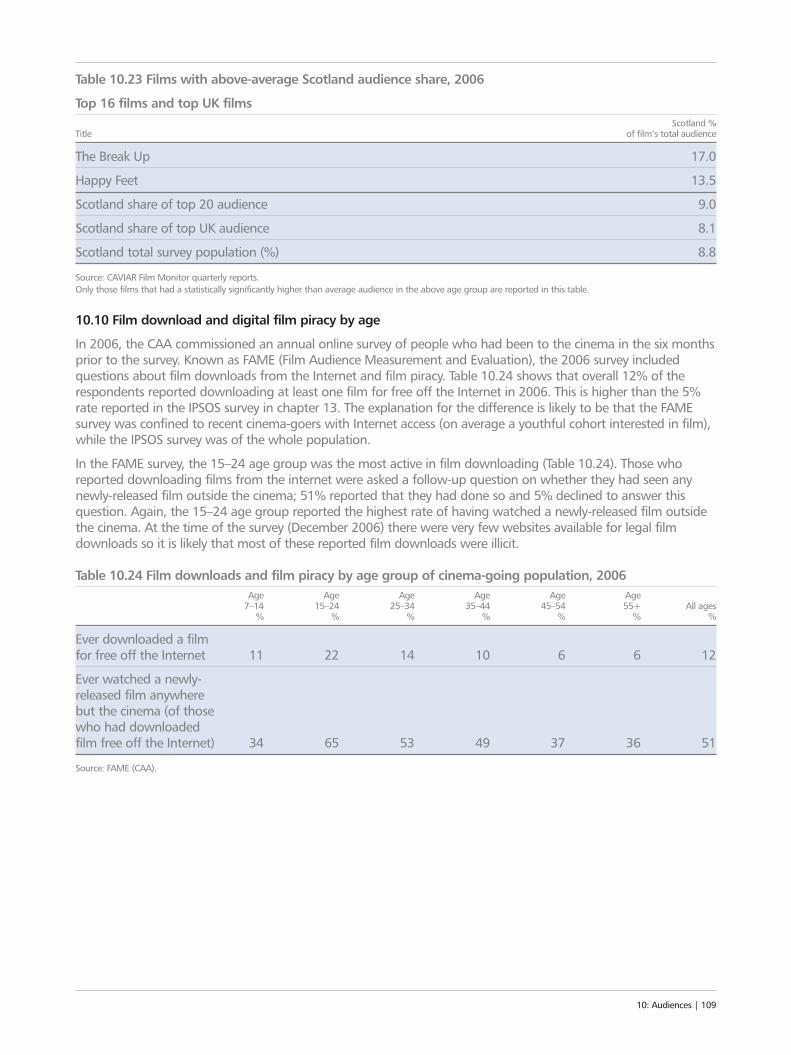
Table 10.23 Films with above-average Scotland audience share, 2006
Top 16 films and top UK filmsScotland %
Title of film’s total audience
The Break Up 17.0
Happy Feet 13.5
Scotland share of top 20 audience 9.0
Scotland share of top UK audience 8.1
Scotland total survey population (%) 8.8
Source: CAVIAR Film Monitor quarterly reports.Only those films that had a statistically significantly higher than average audience in the above age group are reported in this table.
10.10 Film download and digital film piracy by age
In 2006, the CAA commissioned an annual online survey of people who had been to the cinema in the six monthsprior to the survey. Known as FAME (Film Audience Measurement and Evaluation), the 2006 survey includedquestions about film downloads from the Internet and film piracy. Table 10.24 shows that overall 12% of therespondents reported downloading at least one film for free off the Internet in 2006. This is higher than the 5%rate reported in the IPSOS survey in chapter 13. The explanation for the difference is likely to be that the FAMEsurvey was confined to recent cinema-goers with Internet access (on average a youthful cohort interested in film),while the IPSOS survey was of the whole population.
In the FAME survey, the 15–24 age group was the most active in film downloading (Table 10.24). Those whoreported downloading films from the internet were asked a follow-up question on whether they had seen anynewly-released film outside the cinema; 51% reported that they had done so and 5% declined to answer thisquestion. Again, the 15–24 age group reported the highest rate of having watched a newly-released film outsidethe cinema. At the time of the survey (December 2006) there were very few websites available for legal filmdownloads so it is likely that most of these reported film downloads were illicit.
Table 10.24 Film downloads and film piracy by age group of cinema-going population, 2006Age Age Age Age Age Age
7–14 15–24 25–34 35–44 45–54 55+ All ages% % % % % % %
Ever downloaded a film for free off the Internet 11 22 14 10 6 6 12
Ever watched a newly-released film anywhere but the cinema (of those who had downloaded film free off the Internet) 34 65 53 49 37 36 51
Source: FAME (CAA).
10: Audiences | 109
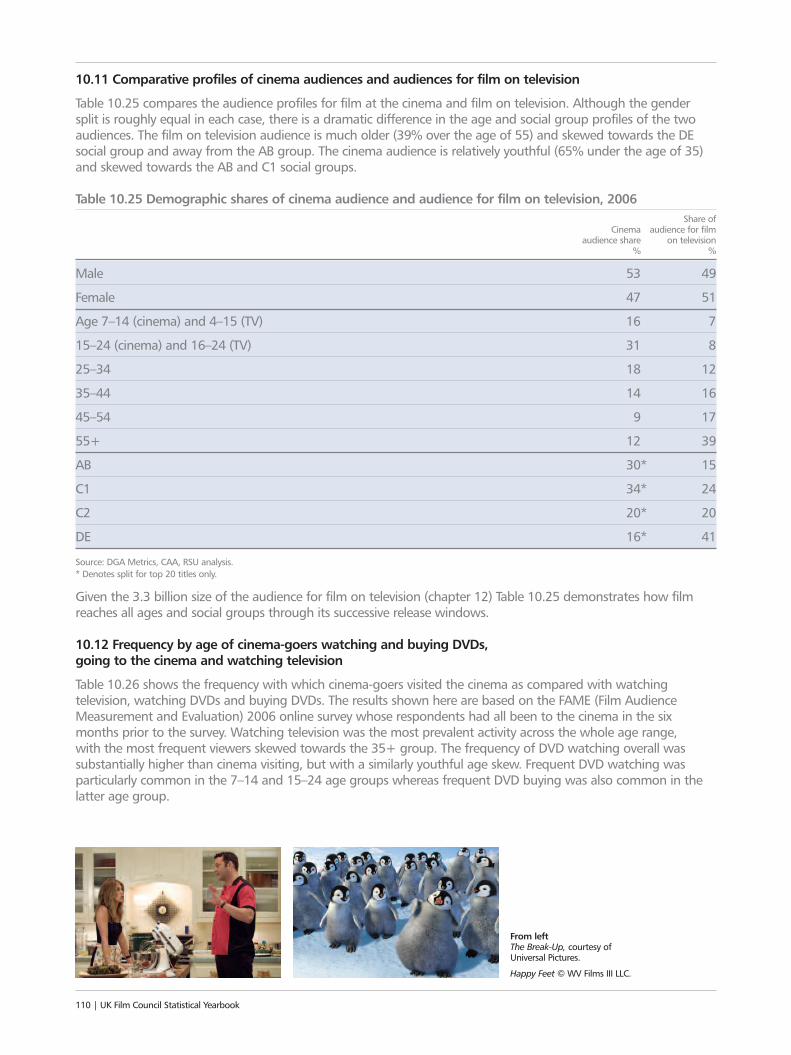
From left The Break-Up, courtesy of Universal Pictures.
Happy Feet © WV Films III LLC.
10.11 Comparative profiles of cinema audiences and audiences for film on television
Table 10.25 compares the audience profiles for film at the cinema and film on television. Although the gendersplit is roughly equal in each case, there is a dramatic difference in the age and social group profiles of the twoaudiences. The film on television audience is much older (39% over the age of 55) and skewed towards the DEsocial group and away from the AB group. The cinema audience is relatively youthful (65% under the age of 35)and skewed towards the AB and C1 social groups.
Table 10.25 Demographic shares of cinema audience and audience for film on television, 2006Share of
Cinema audience for film audience share on television
% %
Male 53 49
Female 47 51
Age 7–14 (cinema) and 4–15 (TV) 16 7
15–24 (cinema) and 16–24 (TV) 31 8
25–34 18 12
35–44 14 16
45–54 9 17
55+ 12 39
AB 30* 15
C1 34* 24
C2 20* 20
DE 16* 41
Source: DGA Metrics, CAA, RSU analysis.* Denotes split for top 20 titles only.
Given the 3.3 billion size of the audience for film on television (chapter 12) Table 10.25 demonstrates how filmreaches all ages and social groups through its successive release windows.
10.12 Frequency by age of cinema-goers watching and buying DVDs, going to the cinema and watching television
Table 10.26 shows the frequency with which cinema-goers visited the cinema as compared with watchingtelevision, watching DVDs and buying DVDs. The results shown here are based on the FAME (Film AudienceMeasurement and Evaluation) 2006 online survey whose respondents had all been to the cinema in the sixmonths prior to the survey. Watching television was the most prevalent activity across the whole age range, with the most frequent viewers skewed towards the 35+ group. The frequency of DVD watching overall wassubstantially higher than cinema visiting, but with a similarly youthful age skew. Frequent DVD watching wasparticularly common in the 7–14 and 15–24 age groups whereas frequent DVD buying was also common in thelatter age group.
110 | UK Film Council Statistical Yearbook
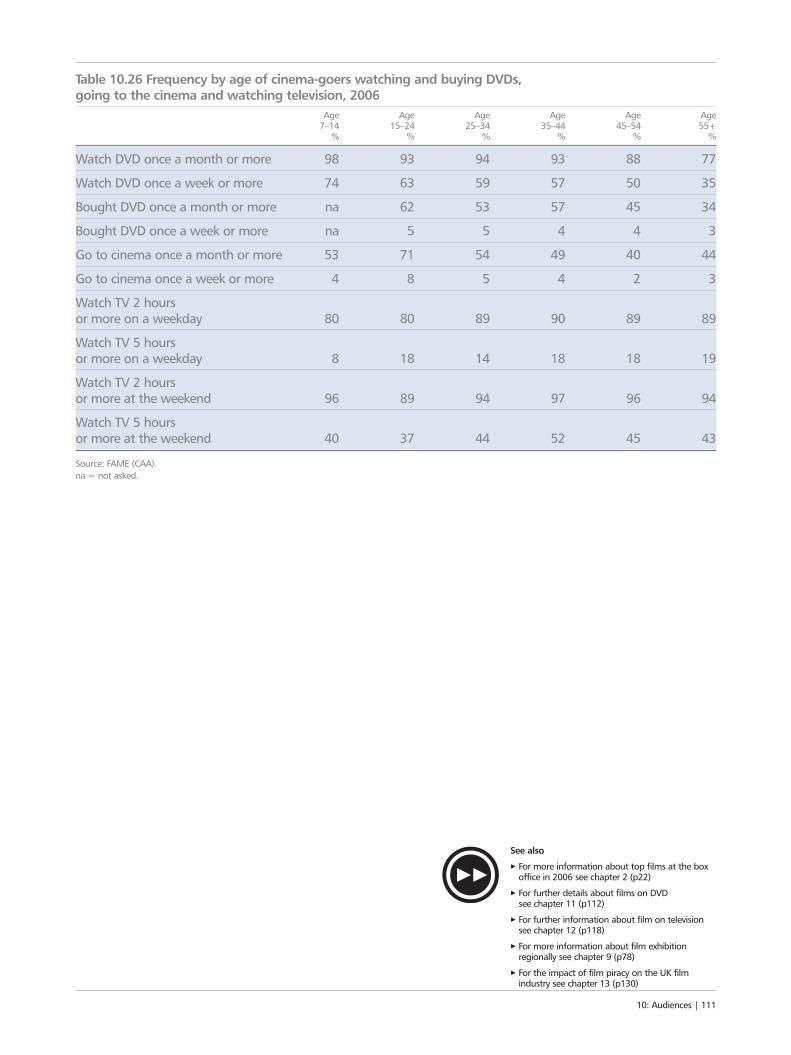
Table 10.26 Frequency by age of cinema-goers watching and buying DVDs, going to the cinema and watching television, 2006
Age Age Age Age Age Age7–14 15–24 25–34 35–44 45–54 55+
% % % % % %
Watch DVD once a month or more 98 93 94 93 88 77
Watch DVD once a week or more 74 63 59 57 50 35
Bought DVD once a month or more na 62 53 57 45 34
Bought DVD once a week or more na 5 5 4 4 3
Go to cinema once a month or more 53 71 54 49 40 44
Go to cinema once a week or more 4 8 5 4 2 3
Watch TV 2 hours or more on a weekday 80 80 89 90 89 89
Watch TV 5 hours or more on a weekday 8 18 14 18 18 19
Watch TV 2 hours or more at the weekend 96 89 94 97 96 94
Watch TV 5 hours or more at the weekend 40 37 44 52 45 43
Source: FAME (CAA).na = not asked.
10: Audiences | 111
See also
3 For more information about top films at the boxoffice in 2006 see chapter 2 (p22)
3 For further details about films on DVD see chapter 11 (p112)
3 For further information about film on televisionsee chapter 12 (p118)
3 For more information about film exhibitionregionally see chapter 9 (p78)
3 For the impact of film piracy on the UK filmindustry see chapter 13 (p130)
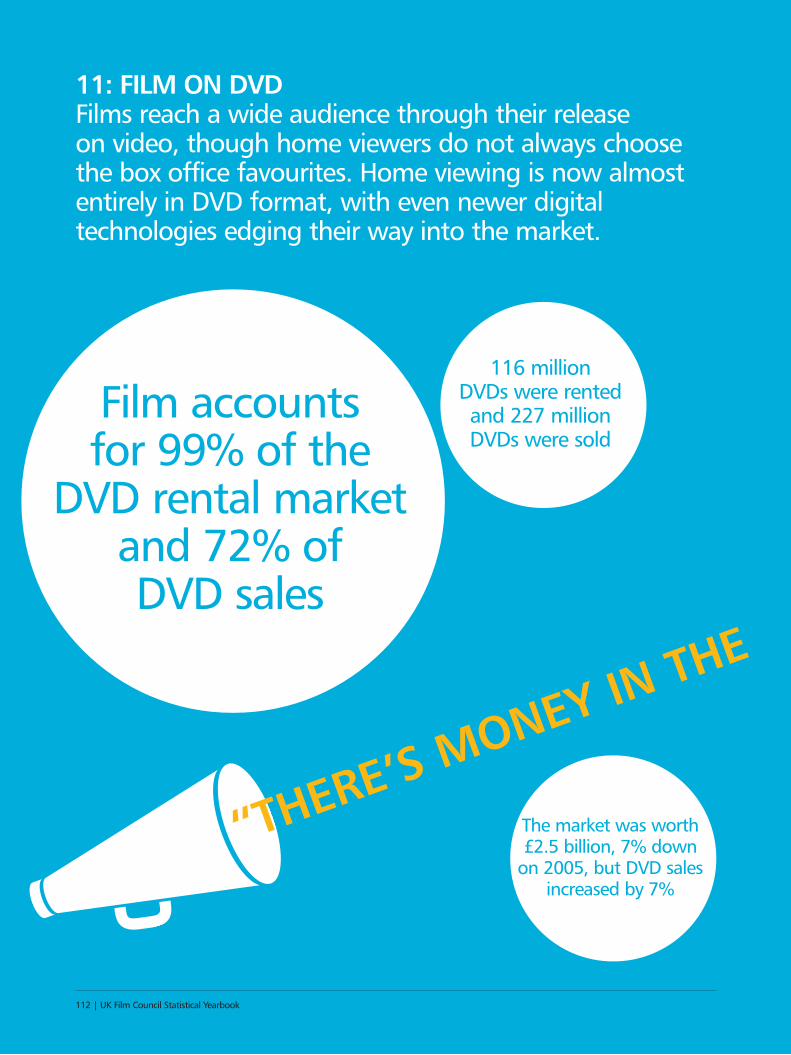
11: FILM ON DVDFilms reach a wide audience through their release on video, though home viewers do not always choosethe box office favourites. Home viewing is now almostentirely in DVD format, with even newer digitaltechnologies edging their way into the market.
“THERE’S MONEY IN THE
Film accounts for 99% of the
DVD rental marketand 72% of DVD sales
The market was worth £2.5 billion, 7% down
on 2005, but DVD sales increased by 7%
116 million DVDs were rentedand 227 millionDVDs were sold
112 | UK Film Council Statistical Yearbook

11: Film on DVD | 113
SMALL SCREEN
Flightplan was the top rental title and Pirates of
the Caribbean: DeadMan’s Chest was thehighest DVD seller Online DVD
rental accounted for 24% of rental
transactions
British films accountedfor 17% of all
DVD rental transactionsand 19% of sales
80% of householdsnow own aDVD player
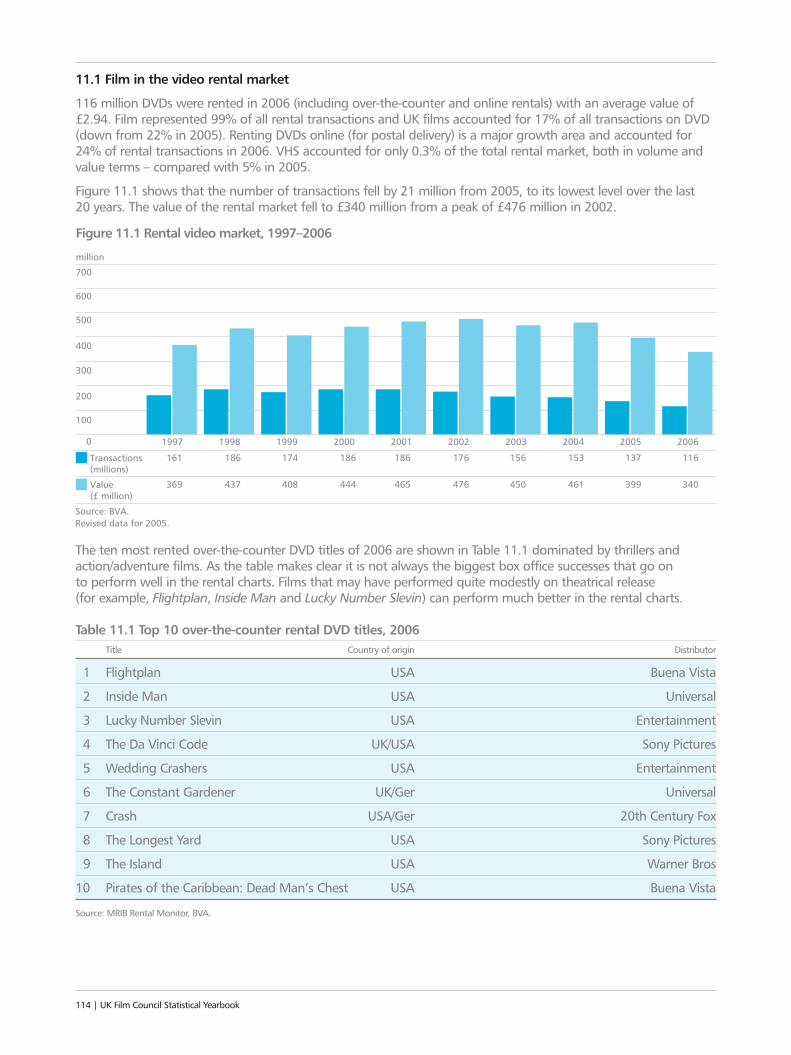
11.1 Film in the video rental market
116 million DVDs were rented in 2006 (including over-the-counter and online rentals) with an average value of£2.94. Film represented 99% of all rental transactions and UK films accounted for 17% of all transactions on DVD(down from 22% in 2005). Renting DVDs online (for postal delivery) is a major growth area and accounted for24% of rental transactions in 2006. VHS accounted for only 0.3% of the total rental market, both in volume andvalue terms – compared with 5% in 2005.
Figure 11.1 shows that the number of transactions fell by 21 million from 2005, to its lowest level over the last 20 years. The value of the rental market fell to £340 million from a peak of £476 million in 2002.
The ten most rented over-the-counter DVD titles of 2006 are shown in Table 11.1 dominated by thrillers andaction/adventure films. As the table makes clear it is not always the biggest box office successes that go on to perform well in the rental charts. Films that may have performed quite modestly on theatrical release(for example, Flightplan, Inside Man and Lucky Number Slevin) can perform much better in the rental charts.
Table 11.1 Top 10 over-the-counter rental DVD titles, 2006Title Country of origin Distributor
1 Flightplan USA Buena Vista
2 Inside Man USA Universal
3 Lucky Number Slevin USA Entertainment
4 The Da Vinci Code UK/USA Sony Pictures
5 Wedding Crashers USA Entertainment
6 The Constant Gardener UK/Ger Universal
7 Crash USA/Ger 20th Century Fox
8 The Longest Yard USA Sony Pictures
9 The Island USA Warner Bros
10 Pirates of the Caribbean: Dead Man’s Chest USA Buena Vista
Source: MRIB Rental Monitor, BVA.
114 | UK Film Council Statistical Yearbook
100
200
300
400
500
600
700
1997 1998 1999 2000 2001 2002 2003 2004 2005 2006
million
Figure 11.1 Rental video market, 1997–2006
0
Source: BVA.Revised data for 2005.
161 174 186 176 156 137Transactions (millions)
369 408 444 476 450 399Value (£ million)
153
461
186
465
186
437
116
340
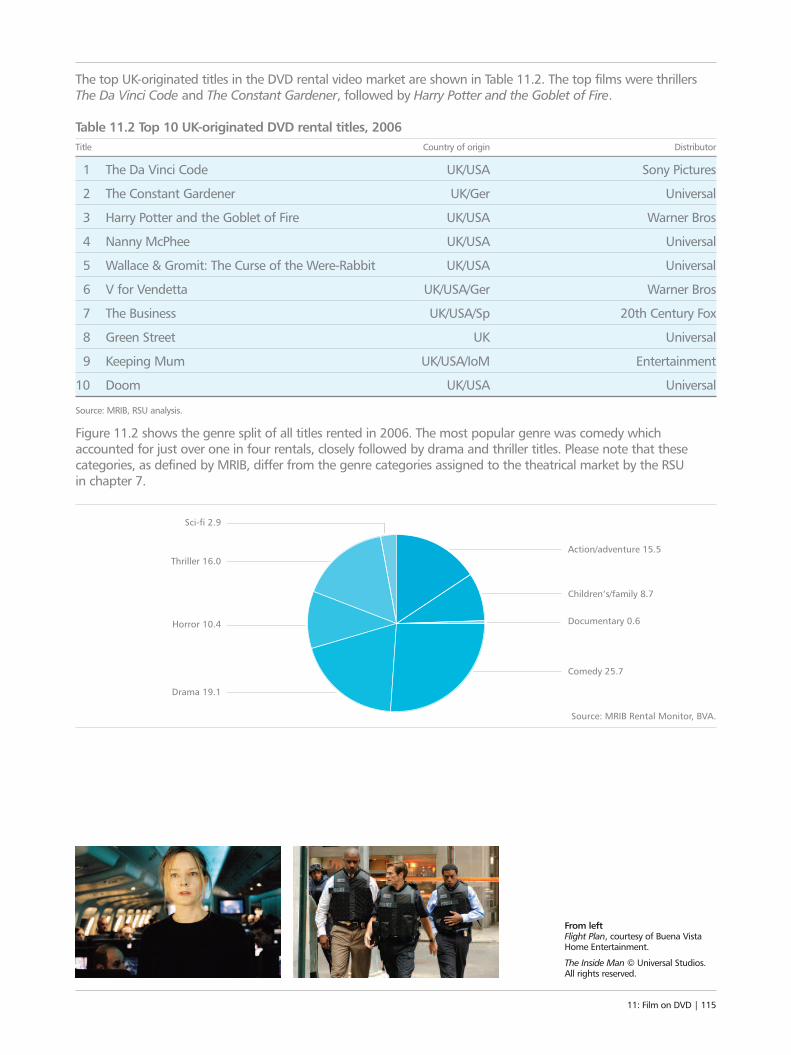
The top UK-originated titles in the DVD rental video market are shown in Table 11.2. The top films were thrillersThe Da Vinci Code and The Constant Gardener, followed by Harry Potter and the Goblet of Fire.
Table 11.2 Top 10 UK-originated DVD rental titles, 2006Title Country of origin Distributor
1 The Da Vinci Code UK/USA Sony Pictures
2 The Constant Gardener UK/Ger Universal
3 Harry Potter and the Goblet of Fire UK/USA Warner Bros
4 Nanny McPhee UK/USA Universal
5 Wallace & Gromit: The Curse of the Were-Rabbit UK/USA Universal
6 V for Vendetta UK/USA/Ger Warner Bros
7 The Business UK/USA/Sp 20th Century Fox
8 Green Street UK Universal
9 Keeping Mum UK/USA/IoM Entertainment
10 Doom UK/USA Universal
Source: MRIB, RSU analysis.
Figure 11.2 shows the genre split of all titles rented in 2006. The most popular genre was comedy whichaccounted for just over one in four rentals, closely followed by drama and thriller titles. Please note that thesecategories, as defined by MRIB, differ from the genre categories assigned to the theatrical market by the RSU in chapter 7.
11: Film on DVD | 115
From left Flight Plan, courtesy of Buena VistaHome Entertainment.
The Inside Man © Universal Studios.All rights reserved.
Action/adventure 15.5
Documentary 0.6
Children’s/family 8.7
Comedy 25.7
Drama 19.1
Source: MRIB Rental Monitor, BVA.
Horror 10.4
Thriller 16.0
Sci-fi 2.9
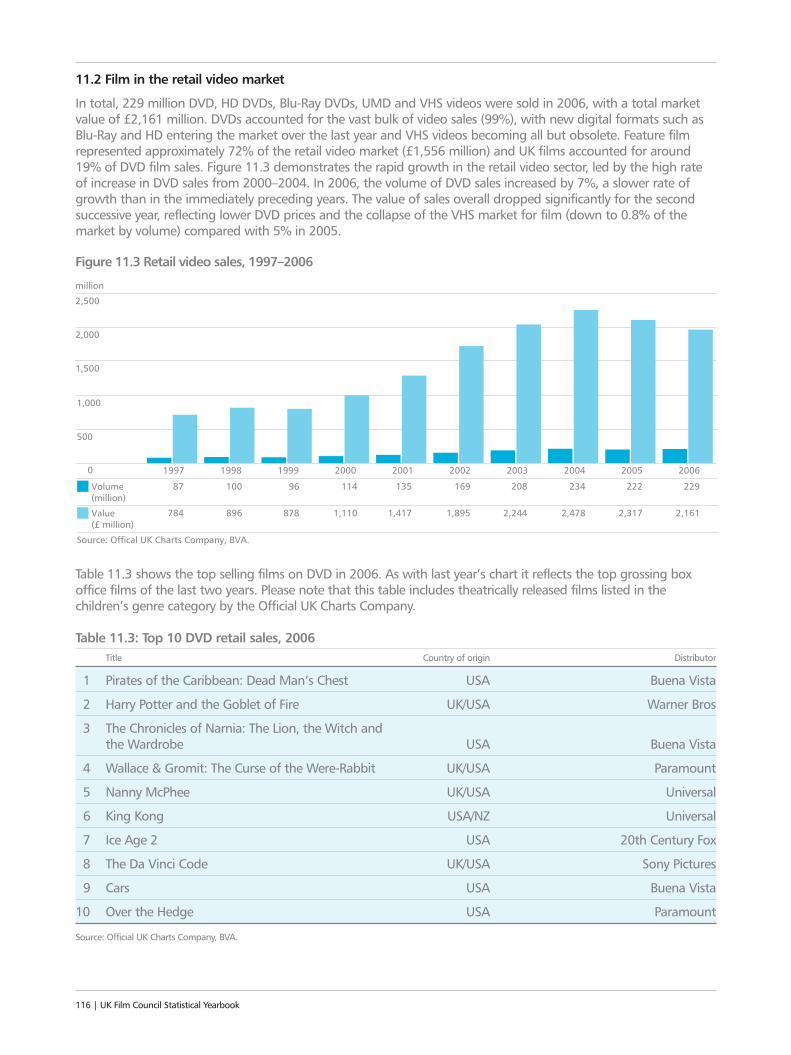
11.2 Film in the retail video market
In total, 229 million DVD, HD DVDs, Blu-Ray DVDs, UMD and VHS videos were sold in 2006, with a total marketvalue of £2,161 million. DVDs accounted for the vast bulk of video sales (99%), with new digital formats such asBlu-Ray and HD entering the market over the last year and VHS videos becoming all but obsolete. Feature filmrepresented approximately 72% of the retail video market (£1,556 million) and UK films accounted for around19% of DVD film sales. Figure 11.3 demonstrates the rapid growth in the retail video sector, led by the high rateof increase in DVD sales from 2000–2004. In 2006, the volume of DVD sales increased by 7%, a slower rate ofgrowth than in the immediately preceding years. The value of sales overall dropped significantly for the secondsuccessive year, reflecting lower DVD prices and the collapse of the VHS market for film (down to 0.8% of themarket by volume) compared with 5% in 2005.
Table 11.3 shows the top selling films on DVD in 2006. As with last year’s chart it reflects the top grossing boxoffice films of the last two years. Please note that this table includes theatrically released films listed in thechildren’s genre category by the Official UK Charts Company.
Table 11.3: Top 10 DVD retail sales, 2006Title Country of origin Distributor
1 Pirates of the Caribbean: Dead Man’s Chest USA Buena Vista
2 Harry Potter and the Goblet of Fire UK/USA Warner Bros
3 The Chronicles of Narnia: The Lion, the Witch and the Wardrobe USA Buena Vista
4 Wallace & Gromit: The Curse of the Were-Rabbit UK/USA Paramount
5 Nanny McPhee UK/USA Universal
6 King Kong USA/NZ Universal
7 Ice Age 2 USA 20th Century Fox
8 The Da Vinci Code UK/USA Sony Pictures
9 Cars USA Buena Vista
10 Over the Hedge USA Paramount
Source: Official UK Charts Company, BVA.
116 | UK Film Council Statistical Yearbook
1,000
500
1,500
2,000
2,500
million
Figure 11.3 Retail video sales, 1997–2006
1997 1998 1999 2000 2001 2002 2003 2004 2005 20060
Source: Offical UK Charts Company, BVA.
87 96 114 169 208 222Volume (million)
784 878 1,110 1,895 2,244 2,317Value (£ million)
234
2,478
135
1,417
100
896
229
2,161
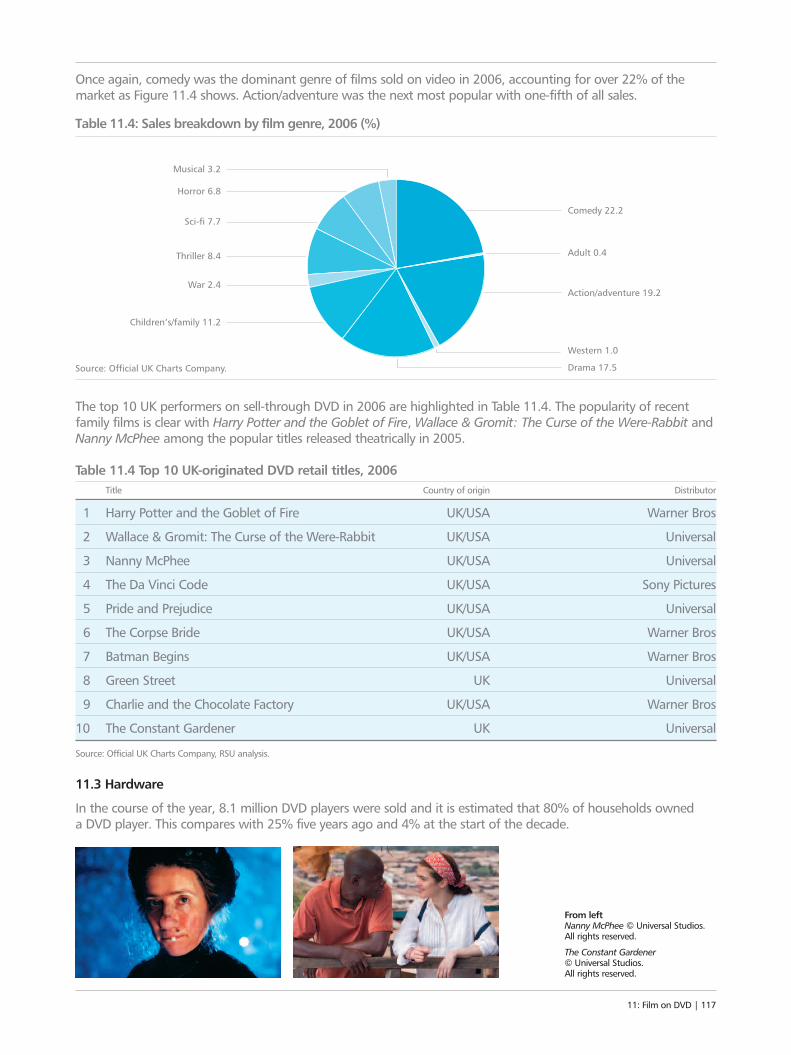
Once again, comedy was the dominant genre of films sold on video in 2006, accounting for over 22% of themarket as Figure 11.4 shows. Action/adventure was the next most popular with one-fifth of all sales.
The top 10 UK performers on sell-through DVD in 2006 are highlighted in Table 11.4. The popularity of recentfamily films is clear with Harry Potter and the Goblet of Fire, Wallace & Gromit: The Curse of the Were-Rabbit andNanny McPhee among the popular titles released theatrically in 2005.
Table 11.4 Top 10 UK-originated DVD retail titles, 2006Title Country of origin Distributor
1 Harry Potter and the Goblet of Fire UK/USA Warner Bros
2 Wallace & Gromit: The Curse of the Were-Rabbit UK/USA Universal
3 Nanny McPhee UK/USA Universal
4 The Da Vinci Code UK/USA Sony Pictures
5 Pride and Prejudice UK/USA Universal
6 The Corpse Bride UK/USA Warner Bros
7 Batman Begins UK/USA Warner Bros
8 Green Street UK Universal
9 Charlie and the Chocolate Factory UK/USA Warner Bros
10 The Constant Gardener UK Universal
Source: Official UK Charts Company, RSU analysis.
11.3 Hardware
In the course of the year, 8.1 million DVD players were sold and it is estimated that 80% of households owned a DVD player. This compares with 25% five years ago and 4% at the start of the decade.
11: Film on DVD | 117
From left Nanny McPhee © Universal Studios.All rights reserved.
The Constant Gardener © Universal Studios. All rights reserved.
Table 11.4: Sales breakdown by film genre, 2006 (%)
Comedy 22.2
Adult 0.4
Western 1.0
Action/adventure 19.2
Drama 17.5
Children’s/family 11.2
Source: Official UK Charts Company.
Thriller 8.4
Sci-fi 7.7
Horror 6.8
Musical 3.2
War 2.4
12: FILM ON UK TELEVISIONOpportunities to watch film on television have neverbeen wider, with multi-channel television gaining inpopularity. Viewing patterns have correspondinglyfragmented. Even so, one person in six in the UKwatched the year’s favourite TV film, Pirates of theCaribbean: The Curse of the Black Pearl, on BBC1.
118 | UK Film Council Statistical Yearbook
“YOU’LL BE A
2,011 films wereshown on terrestrialchannels in 2006,
down 14% on 2005but the proportion of
UK films increased
Multi-channel television accounted for over 33% of the
UK television audiencein 2006, up from
30% in 2005
12: Film on UK television | 119
HOUSEHOLD NAME
An average of 1.5 million people
watched each film onpeak time television
(down from 2 million in 2005)
There were 3.3 billionviewings of feature film
across all TV formats (exceptPay Per View) in 2006 –
over 21 times the number of cinema admissions
There were nearly five times more films on
television in 2006 than a decade ago, largely as a result of subscription
film channels
The value of film tobroadcasters was
approximately £1.07 billion
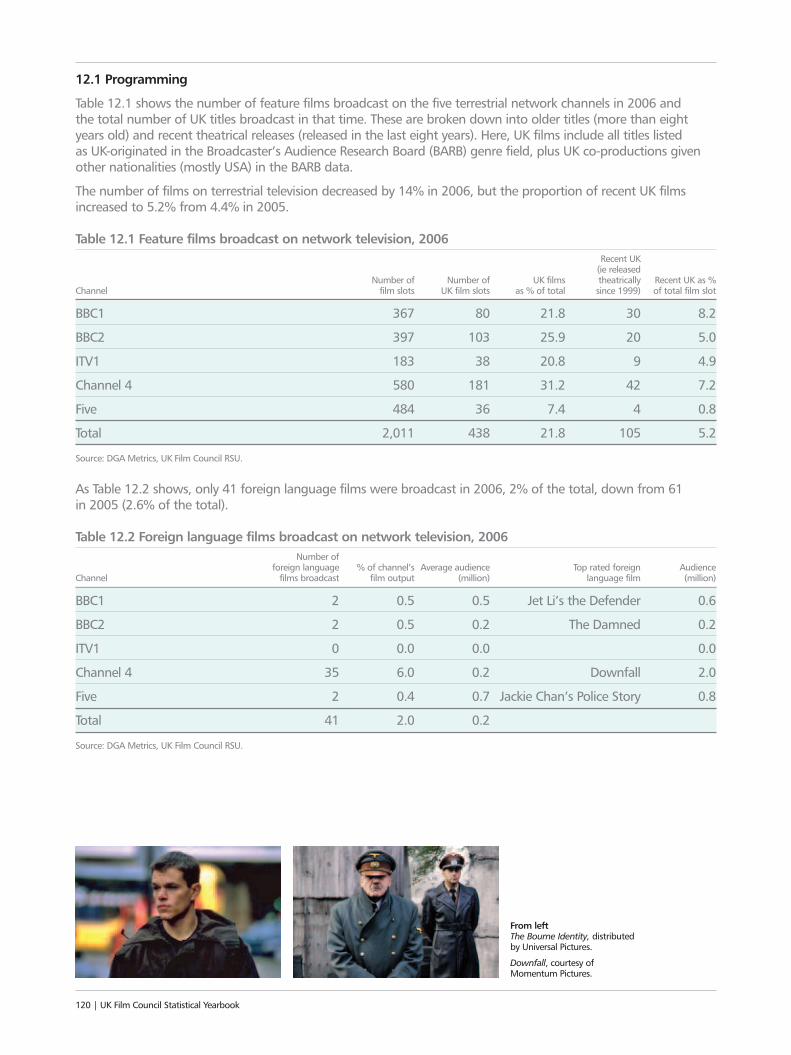
12.1 Programming
Table 12.1 shows the number of feature films broadcast on the five terrestrial network channels in 2006 and the total number of UK titles broadcast in that time. These are broken down into older titles (more than eightyears old) and recent theatrical releases (released in the last eight years). Here, UK films include all titles listed as UK-originated in the Broadcaster’s Audience Research Board (BARB) genre field, plus UK co-productions givenother nationalities (mostly USA) in the BARB data.
The number of films on terrestrial television decreased by 14% in 2006, but the proportion of recent UK filmsincreased to 5.2% from 4.4% in 2005.
Table 12.1 Feature films broadcast on network television, 2006Recent UK
(ie releasedNumber of Number of UK films theatrically Recent UK as %
Channel film slots UK film slots as % of total since 1999) of total film slot
BBC1 367 80 21.8 30 8.2
BBC2 397 103 25.9 20 5.0
ITV1 183 38 20.8 9 4.9
Channel 4 580 181 31.2 42 7.2
Five 484 36 7.4 4 0.8
Total 2,011 438 21.8 105 5.2
Source: DGA Metrics, UK Film Council RSU.
As Table 12.2 shows, only 41 foreign language films were broadcast in 2006, 2% of the total, down from 61 in 2005 (2.6% of the total).
Table 12.2 Foreign language films broadcast on network television, 2006Number of
foreign language % of channel’s Average audience Top rated foreign AudienceChannel films broadcast film output (million) language film (million)
BBC1 2 0.5 0.5 Jet Li’s the Defender 0.6
BBC2 2 0.5 0.2 The Damned 0.2
ITV1 0 0.0 0.0 0.0
Channel 4 35 6.0 0.2 Downfall 2.0
Five 2 0.4 0.7 Jackie Chan’s Police Story 0.8
Total 41 2.0 0.2
Source: DGA Metrics, UK Film Council RSU.
120 | UK Film Council Statistical Yearbook
From left The Bourne Identity, distributed by Universal Pictures.
Downfall, courtesy of Momentum Pictures.
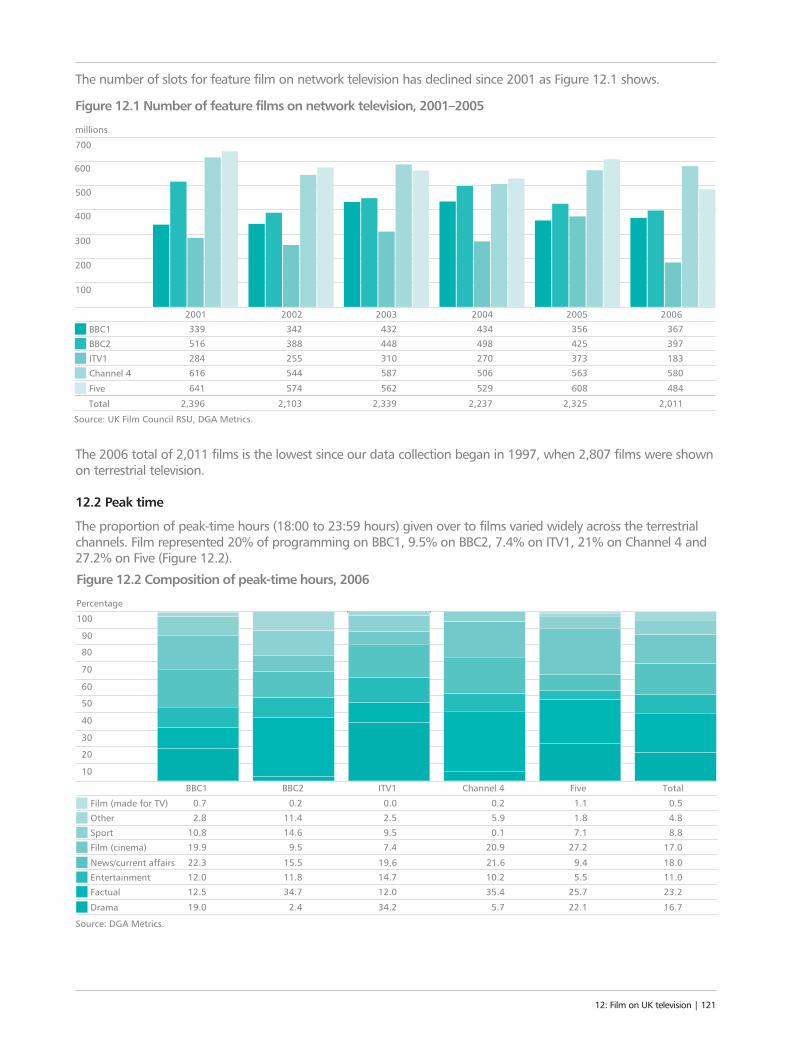
The number of slots for feature film on network television has declined since 2001 as Figure 12.1 shows.
The 2006 total of 2,011 films is the lowest since our data collection began in 1997, when 2,807 films were shownon terrestrial television.
12.2 Peak time
The proportion of peak-time hours (18:00 to 23:59 hours) given over to films varied widely across the terrestrialchannels. Film represented 20% of programming on BBC1, 9.5% on BBC2, 7.4% on ITV1, 21% on Channel 4 and27.2% on Five (Figure 12.2).
12: Film on UK television | 121
400
500
600
700
2001 2002 2003 2004 2005 2006339 342 432 434 356 367
millions
Figure 12.1 Number of feature films on network television, 2001–2005
300
200
100
BBC1516 388 448 498 425 397BBC2284 255 310 270 373 183ITV1616 544 587 506 563 580Channel 4
641 574 562 529 608 484Five
Source: UK Film Council RSU, DGA Metrics.
2,396 2,103 2,339 2,237 2,325 2,011Total
19.0 2.4 34.2 5.7 22.1 16.7Drama
12.5 34.7 12.0 35.4 25.7 23.2Factual
12.0 11.8 14.7 10.2 5.5 11.0Entertainment
22.3 15.5 19.6 21.6 9.4 18.0News/current affairs
19.9 9.5 7.4 20.9 27.2 17.0Film (cinema)
10.8 14.6 9.5 0.1 7.1 8.8Sport
2.8 11.4 2.5 5.9 1.8 4.8Other
0.7 0.2 0.0 0.2 1.1 0.5Film (made for TV)
70
80
90
100
BBC1 BBC2 ITV1 Channel 4 Five Total
Percentage
Figure 12.2 Composition of peak-time hours, 2006
60
50
40
30
20
10
Source: DGA Metrics.
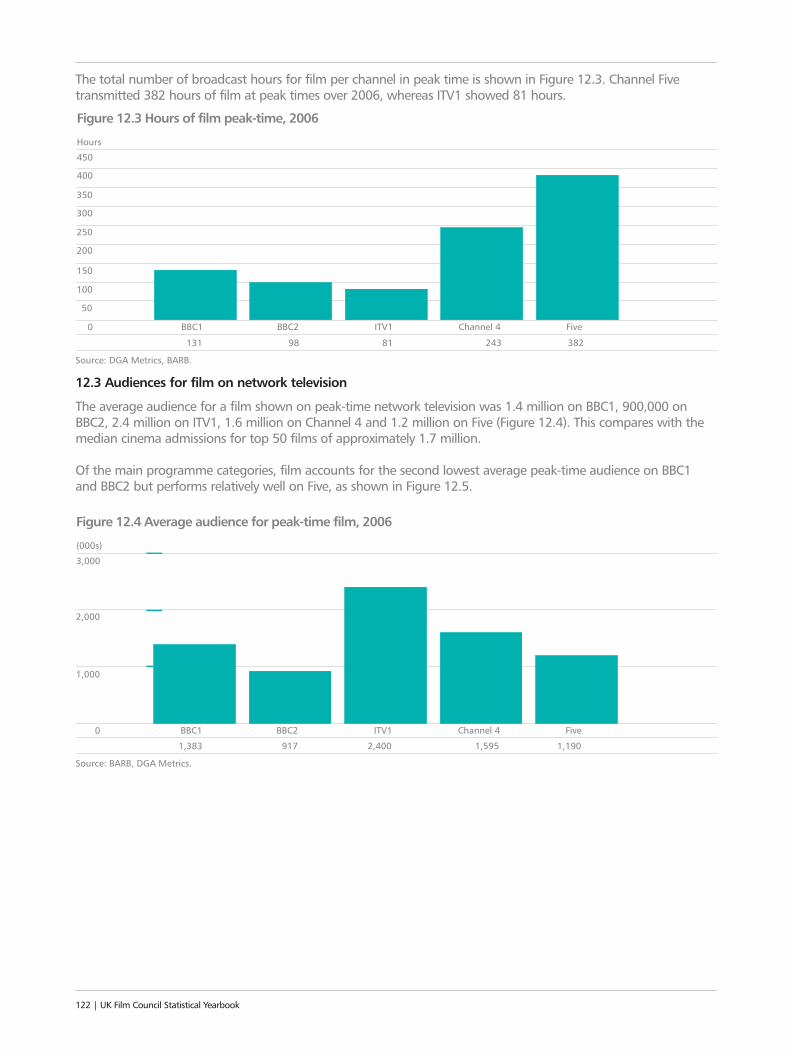
The total number of broadcast hours for film per channel in peak time is shown in Figure 12.3. Channel Fivetransmitted 382 hours of film at peak times over 2006, whereas ITV1 showed 81 hours.
12.3 Audiences for film on network television
The average audience for a film shown on peak-time network television was 1.4 million on BBC1, 900,000 onBBC2, 2.4 million on ITV1, 1.6 million on Channel 4 and 1.2 million on Five (Figure 12.4). This compares with themedian cinema admissions for top 50 films of approximately 1.7 million.
Of the main programme categories, film accounts for the second lowest average peak-time audience on BBC1and BBC2 but performs relatively well on Five, as shown in Figure 12.5.
122 | UK Film Council Statistical Yearbook
0
300
350
400
450
BBC1 BBC2 ITV1 Channel 4 Five
Hours
Figure 12.3 Hours of film peak-time, 2006
250
200
150
100
50
131 98 81 243 382
Source: DGA Metrics, BARB.
0
2,000
3,000
BBC1 BBC2 ITV1 Channel 4 Five
(000s)
Figure 12.4 Average audience for peak-time film, 2006
1,000
1,383 917 2,400 1,595 1,190
Source: BARB, DGA Metrics.
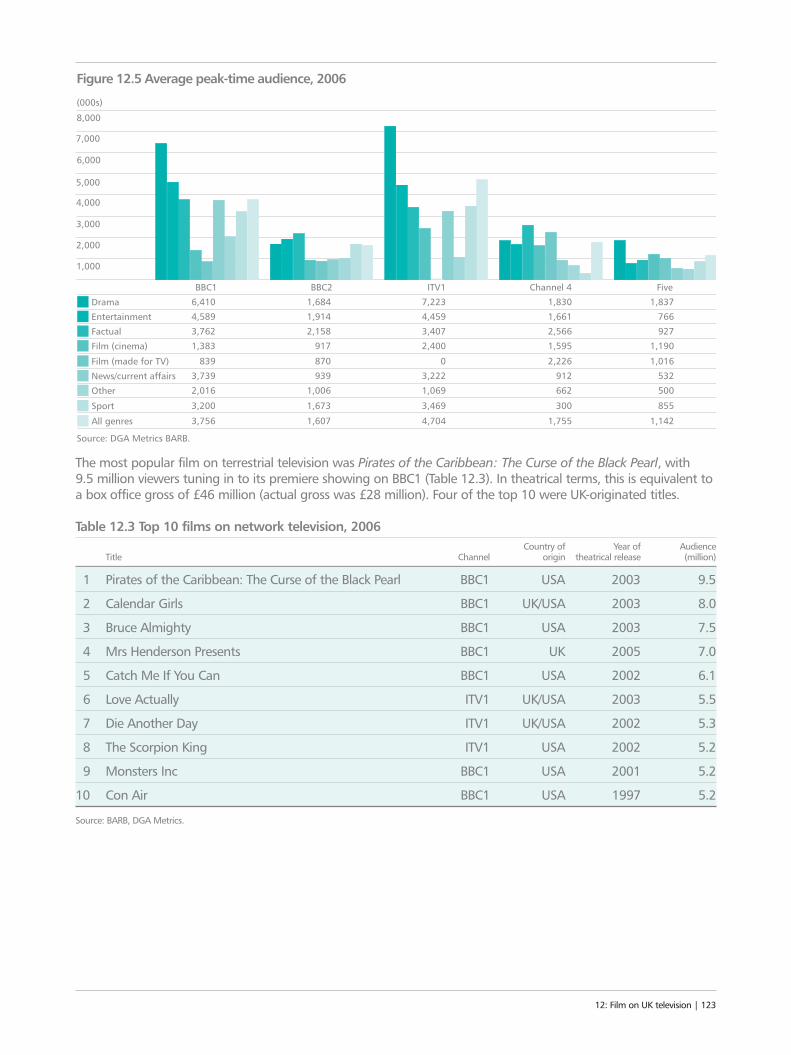
The most popular film on terrestrial television was Pirates of the Caribbean: The Curse of the Black Pearl, with 9.5 million viewers tuning in to its premiere showing on BBC1 (Table 12.3). In theatrical terms, this is equivalent toa box office gross of £46 million (actual gross was £28 million). Four of the top 10 were UK-originated titles.
Table 12.3 Top 10 films on network television, 2006Country of Year of Audience
Title Channel origin theatrical release (million)
1 Pirates of the Caribbean: The Curse of the Black Pearl BBC1 USA 2003 9.5
2 Calendar Girls BBC1 UK/USA 2003 8.0
3 Bruce Almighty BBC1 USA 2003 7.5
4 Mrs Henderson Presents BBC1 UK 2005 7.0
5 Catch Me If You Can BBC1 USA 2002 6.1
6 Love Actually ITV1 UK/USA 2003 5.5
7 Die Another Day ITV1 UK/USA 2002 5.3
8 The Scorpion King ITV1 USA 2002 5.2
9 Monsters Inc BBC1 USA 2001 5.2
10 Con Air BBC1 USA 1997 5.2
Source: BARB, DGA Metrics.
12: Film on UK television | 123
5,000
6,000
7,000
8,000
BBC2 ITV1 Channel 4 Five
(000s)
Figure 12.5 Average peak-time audience, 2006
4,000
3,000
2,000
1,000
1,684 7,223 1,830 1,837Drama 1,914 4,459 1,661 766Entertainment2,158 3,407 2,566 927Factual
917 2,400 1,595 1,190Film (cinema)
870 0 2,226 1,016Film (made for TV) 939 3,222 912 532News/current affairs
1,006 1,069 662 500Other
1,673 3,469 300 855Sport
BBC16,4104,5893,7621,383
8393,7392,016
3,200
3,756 1,607 4,704 1,755 1,142All genres
Source: DGA Metrics BARB.
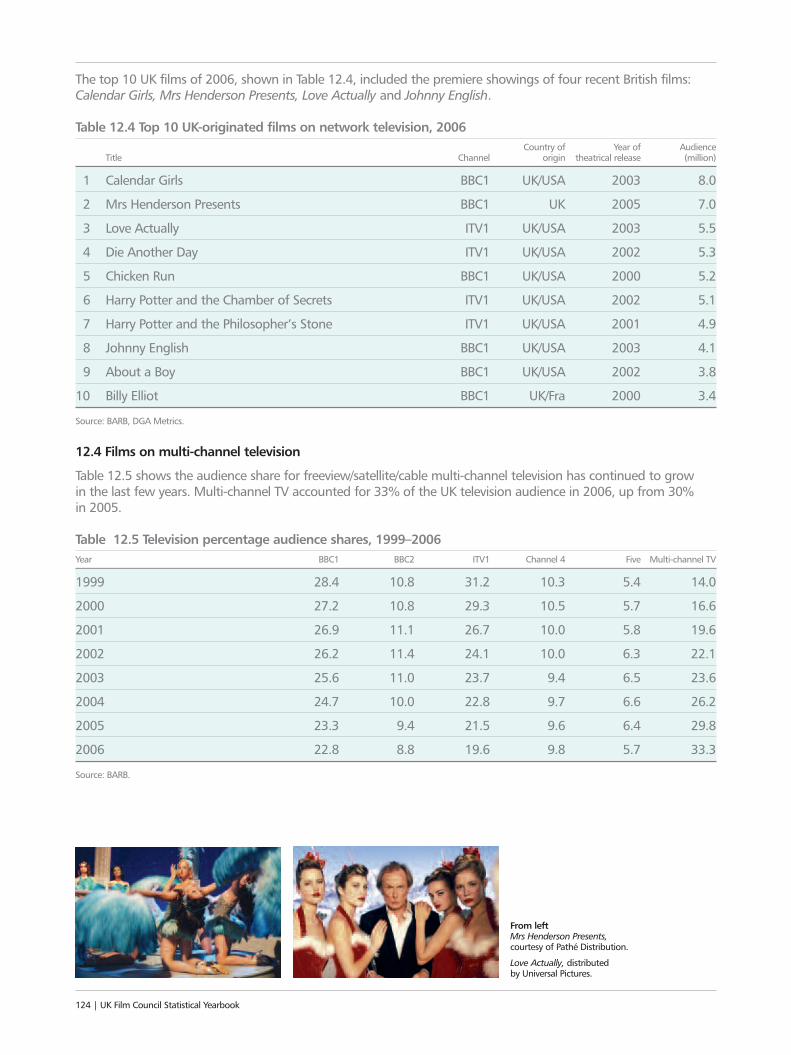
From left Mrs Henderson Presents,courtesy of Pathé Distribution.
Love Actually, distributed by Universal Pictures.
The top 10 UK films of 2006, shown in Table 12.4, included the premiere showings of four recent British films:Calendar Girls, Mrs Henderson Presents, Love Actually and Johnny English.
Table 12.4 Top 10 UK-originated films on network television, 2006Country of Year of Audience
Title Channel origin theatrical release (million)
1 Calendar Girls BBC1 UK/USA 2003 8.0
2 Mrs Henderson Presents BBC1 UK 2005 7.0
3 Love Actually ITV1 UK/USA 2003 5.5
4 Die Another Day ITV1 UK/USA 2002 5.3
5 Chicken Run BBC1 UK/USA 2000 5.2
6 Harry Potter and the Chamber of Secrets ITV1 UK/USA 2002 5.1
7 Harry Potter and the Philosopher’s Stone ITV1 UK/USA 2001 4.9
8 Johnny English BBC1 UK/USA 2003 4.1
9 About a Boy BBC1 UK/USA 2002 3.8
10 Billy Elliot BBC1 UK/Fra 2000 3.4
Source: BARB, DGA Metrics.
12.4 Films on multi-channel television
Table 12.5 shows the audience share for freeview/satellite/cable multi-channel television has continued to grow in the last few years. Multi-channel TV accounted for 33% of the UK television audience in 2006, up from 30% in 2005.
Table 12.5 Television percentage audience shares, 1999–2006Year BBC1 BBC2 ITV1 Channel 4 Five Multi-channel TV
1999 28.4 10.8 31.2 10.3 5.4 14.0
2000 27.2 10.8 29.3 10.5 5.7 16.6
2001 26.9 11.1 26.7 10.0 5.8 19.6
2002 26.2 11.4 24.1 10.0 6.3 22.1
2003 25.6 11.0 23.7 9.4 6.5 23.6
2004 24.7 10.0 22.8 9.7 6.6 26.2
2005 23.3 9.4 21.5 9.6 6.4 29.8
2006 22.8 8.8 19.6 9.8 5.7 33.3
Source: BARB.
124 | UK Film Council Statistical Yearbook
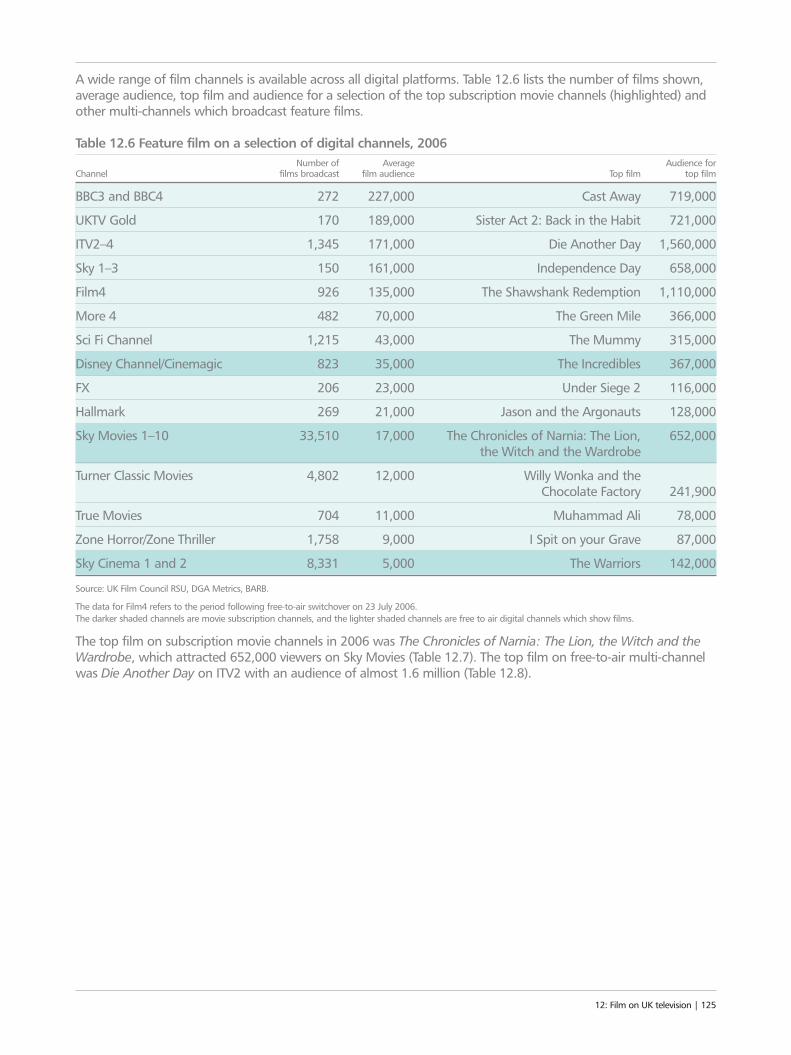
A wide range of film channels is available across all digital platforms. Table 12.6 lists the number of films shown,average audience, top film and audience for a selection of the top subscription movie channels (highlighted) andother multi-channels which broadcast feature films.
Table 12.6 Feature film on a selection of digital channels, 2006Number of Average Audience for
Channel films broadcast film audience Top film top film
BBC3 and BBC4 272 227,000 Cast Away 719,000
UKTV Gold 170 189,000 Sister Act 2: Back in the Habit 721,000
ITV2–4 1,345 171,000 Die Another Day 1,560,000
Sky 1–3 150 161,000 Independence Day 658,000
Film4 926 135,000 The Shawshank Redemption 1,110,000
More 4 482 70,000 The Green Mile 366,000
Sci Fi Channel 1,215 43,000 The Mummy 315,000
Disney Channel/Cinemagic 823 35,000 The Incredibles 367,000
FX 206 23,000 Under Siege 2 116,000
Hallmark 269 21,000 Jason and the Argonauts 128,000
Sky Movies 1–10 33,510 17,000 The Chronicles of Narnia: The Lion, 652,000the Witch and the Wardrobe
Turner Classic Movies 4,802 12,000 Willy Wonka and the Chocolate Factory 241,900
True Movies 704 11,000 Muhammad Ali 78,000
Zone Horror/Zone Thriller 1,758 9,000 I Spit on your Grave 87,000
Sky Cinema 1 and 2 8,331 5,000 The Warriors 142,000
Source: UK Film Council RSU, DGA Metrics, BARB.
The data for Film4 refers to the period following free-to-air switchover on 23 July 2006.The darker shaded channels are movie subscription channels, and the lighter shaded channels are free to air digital channels which show films.
The top film on subscription movie channels in 2006 was The Chronicles of Narnia: The Lion, the Witch and theWardrobe, which attracted 652,000 viewers on Sky Movies (Table 12.7). The top film on free-to-air multi-channelwas Die Another Day on ITV2 with an audience of almost 1.6 million (Table 12.8).
12: Film on UK television | 125
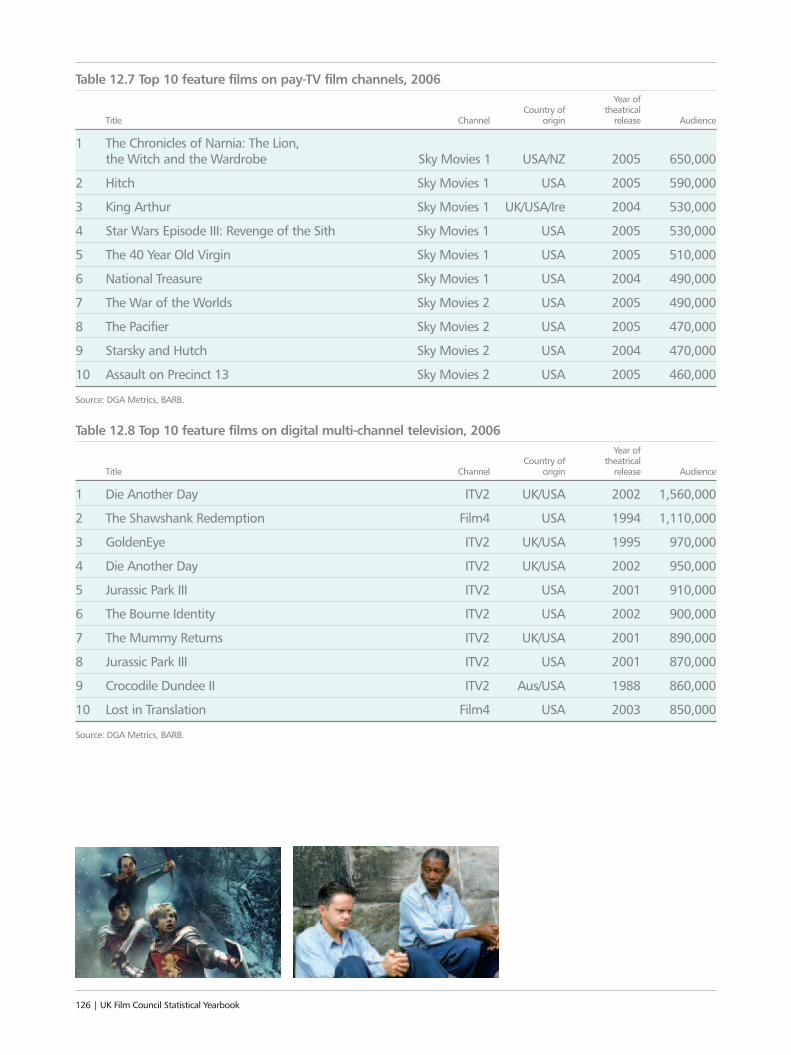
Table 12.7 Top 10 feature films on pay-TV film channels, 2006Year of
Country of theatrical Title Channel origin release Audience
1 The Chronicles of Narnia: The Lion, the Witch and the Wardrobe Sky Movies 1 USA/NZ 2005 650,000
2 Hitch Sky Movies 1 USA 2005 590,000
3 King Arthur Sky Movies 1 UK/USA/Ire 2004 530,000
4 Star Wars Episode III: Revenge of the Sith Sky Movies 1 USA 2005 530,000
5 The 40 Year Old Virgin Sky Movies 1 USA 2005 510,000
6 National Treasure Sky Movies 1 USA 2004 490,000
7 The War of the Worlds Sky Movies 2 USA 2005 490,000
8 The Pacifier Sky Movies 2 USA 2005 470,000
9 Starsky and Hutch Sky Movies 2 USA 2004 470,000
10 Assault on Precinct 13 Sky Movies 2 USA 2005 460,000
Source: DGA Metrics, BARB.
Table 12.8 Top 10 feature films on digital multi-channel television, 2006Year of
Country of theatrical Title Channel origin release Audience
1 Die Another Day ITV2 UK/USA 2002 1,560,000
2 The Shawshank Redemption Film4 USA 1994 1,110,000
3 GoldenEye ITV2 UK/USA 1995 970,000
4 Die Another Day ITV2 UK/USA 2002 950,000
5 Jurassic Park III ITV2 USA 2001 910,000
6 The Bourne Identity ITV2 USA 2002 900,000
7 The Mummy Returns ITV2 UK/USA 2001 890,000
8 Jurassic Park III ITV2 USA 2001 870,000
9 Crocodile Dundee II ITV2 Aus/USA 1988 860,000
10 Lost in Translation Film4 USA 2003 850,000
Source: DGA Metrics, BARB.
126 | UK Film Council Statistical Yearbook
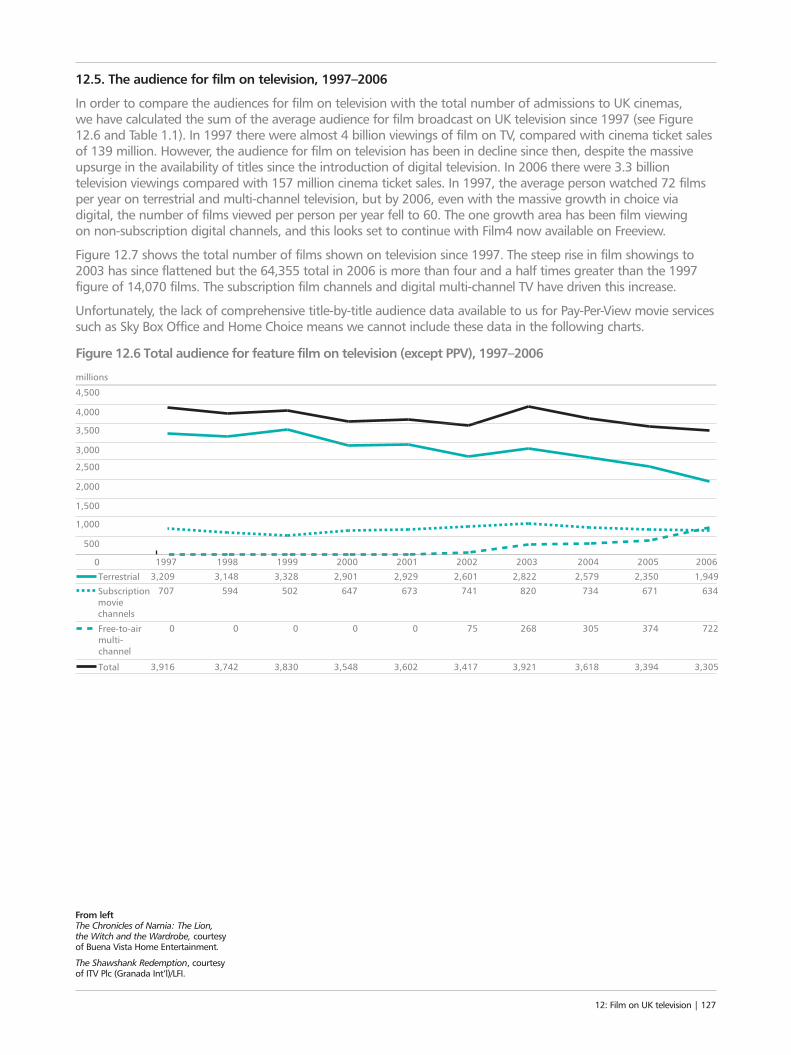
12.5. The audience for film on television, 1997–2006
In order to compare the audiences for film on television with the total number of admissions to UK cinemas, we have calculated the sum of the average audience for film broadcast on UK television since 1997 (see Figure12.6 and Table 1.1). In 1997 there were almost 4 billion viewings of film on TV, compared with cinema ticket salesof 139 million. However, the audience for film on television has been in decline since then, despite the massiveupsurge in the availability of titles since the introduction of digital television. In 2006 there were 3.3 billiontelevision viewings compared with 157 million cinema ticket sales. In 1997, the average person watched 72 filmsper year on terrestrial and multi-channel television, but by 2006, even with the massive growth in choice viadigital, the number of films viewed per person per year fell to 60. The one growth area has been film viewing on non-subscription digital channels, and this looks set to continue with Film4 now available on Freeview.
Figure 12.7 shows the total number of films shown on television since 1997. The steep rise in film showings to2003 has since flattened but the 64,355 total in 2006 is more than four and a half times greater than the 1997figure of 14,070 films. The subscription film channels and digital multi-channel TV have driven this increase.
Unfortunately, the lack of comprehensive title-by-title audience data available to us for Pay-Per-View movie servicessuch as Sky Box Office and Home Choice means we cannot include these data in the following charts.
12: Film on UK television | 127
0
1,000
500
2,000
1,500
3,000
2,500
4,500
3,500
4,000
1997 1998 1999 2000 2001 2002 2003 2004 20062005
millions
Figure 12.6 Total audience for feature film on television (except PPV), 1997–2006
3,209 2,929 2,601 1,949Terrestrial 2,5793,148 3,328 2,901 2,822 2,350
3,916 3,602 3,417 3,305Total 3,6183,742 3,830 3,548 3,921 3,394
707 673 741 634Subscription moviechannels
734594 502 647 820 671
0 0 75 722Free-to-air multi- channel
3050 0 0 268 374
From left The Chronicles of Narnia: The Lion, the Witch and the Wardrobe, courtesyof Buena Vista Home Entertainment.
The Shawshank Redemption, courtesyof ITV Plc (Granada Int’l)/LFI.
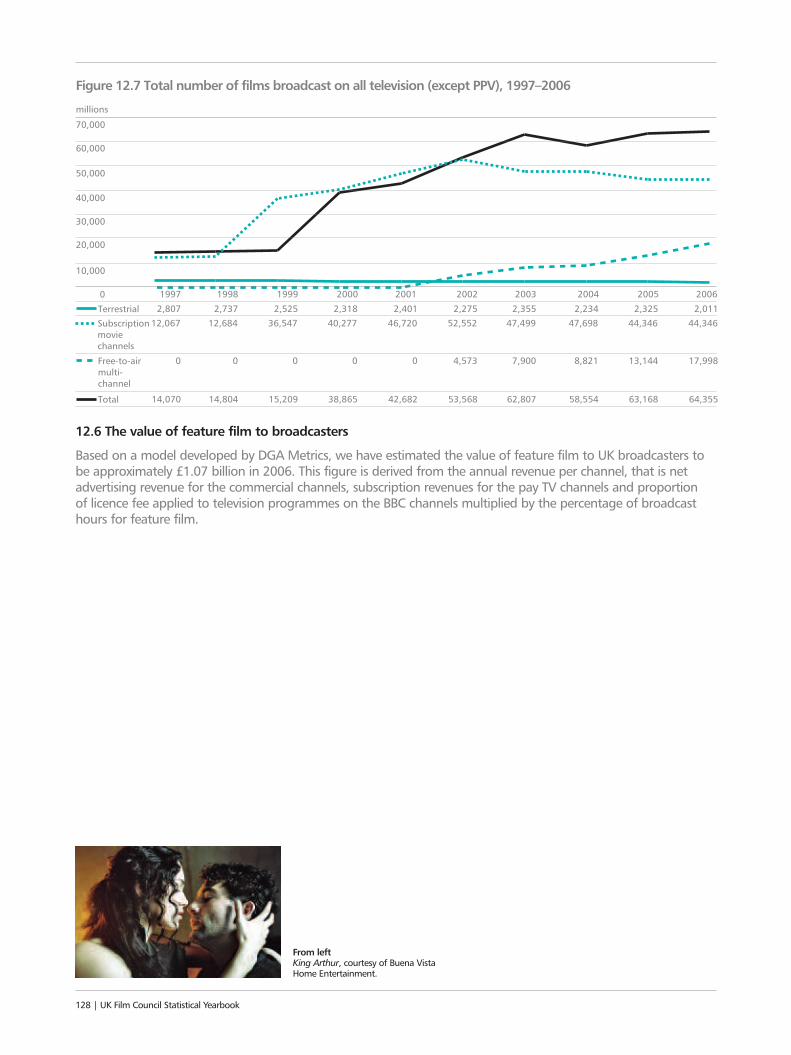
12.6 The value of feature film to broadcasters
Based on a model developed by DGA Metrics, we have estimated the value of feature film to UK broadcasters tobe approximately £1.07 billion in 2006. This figure is derived from the annual revenue per channel, that is netadvertising revenue for the commercial channels, subscription revenues for the pay TV channels and proportion of licence fee applied to television programmes on the BBC channels multiplied by the percentage of broadcasthours for feature film.
128 | UK Film Council Statistical Yearbook
0
10,000
30,000
20,000
40,000
70,000
50,000
60,000
1997 1998 1999 2000 2001 2002 2003 2004 20062005
millions
Figure 12.7 Total number of films broadcast on all television (except PPV), 1997–2006
2,807 2,401 2,275 2,011Terrestrial 2,2342,737 2,525 2,318 2,355 2,325
14,070 42,682 53,568 64,355Total 58,55414,804 15,209 38,865 62,807 63,168
12,067 46,720 52,552 44,346Subscription movie channels
47,69812,684 36,547 40,277 47,499 44,346
0 0 4,573 17,998Free-to-air multi- channel
8,8210 0 0 7,900 13,144
From left King Arthur, courtesy of Buena VistaHome Entertainment.

See also:
3 For cinema admissions see chapter 1 on (p10)
3 For an overview of the film market as a whole see chapter 13 on (p130)
12: Film on UK television | 129
AboveDie Another Day © 2002 Danjaq, LLCand United Artists Corporation.All rights reserved.
13: THE UK FILM MARKET AS A WHOLEWhile much of the publicity and media attention for films occurs around the cinema release, it is the film market as a whole that recovers the costs ofproduction and marketing and makes profits (or not) for film producers and investors. The sale and rental of DVDs/videos are particularly important for filmmakers and distributors in revenue terms and sales to television also generate significant income. This chapter looks at the UK film market as a whole over the period 1998–2006.130 | UK Film Council Statistical Yearbook
“LET ME SEESell-throughDVD/video
accounted for thelargest share
(42%) of UK filmrevenues
Sell-through revenues boomed
between 2000and 2004
13: The UK film market as a whole | 131
EVOLUTION
Film piracy and competition from new digital leisure activities,
particularly onlineentertainment are creating
a plateau in film revenues
Research suggests that the decreasing
theatrical window has not so far contributed
to the fall in UK cinemaadmissions
Film revenues in the UK peaked in 2004 and then
declined significantly
The UK had the third largest filmed
entertainment market in the world after the USA and
Japan (2005)
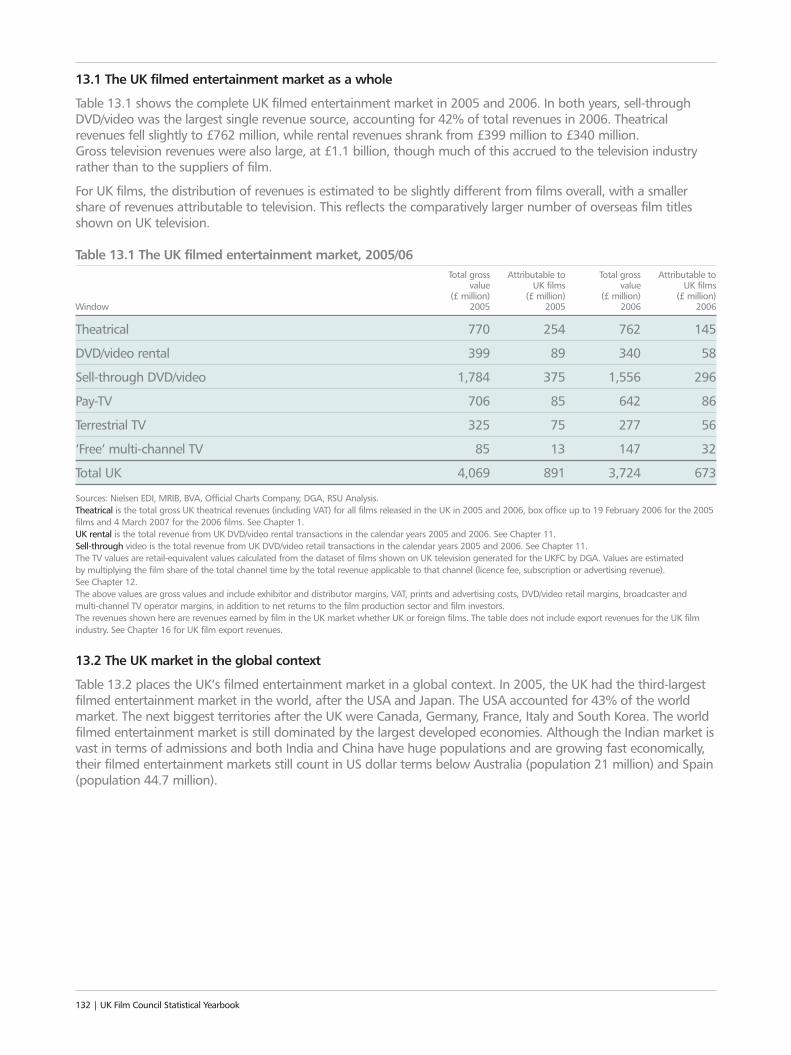
13.1 The UK filmed entertainment market as a whole
Table 13.1 shows the complete UK filmed entertainment market in 2005 and 2006. In both years, sell-throughDVD/video was the largest single revenue source, accounting for 42% of total revenues in 2006. Theatricalrevenues fell slightly to £762 million, while rental revenues shrank from £399 million to £340 million. Gross television revenues were also large, at £1.1 billion, though much of this accrued to the television industryrather than to the suppliers of film.
For UK films, the distribution of revenues is estimated to be slightly different from films overall, with a smallershare of revenues attributable to television. This reflects the comparatively larger number of overseas film titlesshown on UK television.
Table 13.1 The UK filmed entertainment market, 2005/06Total gross Attributable to Total gross Attributable to
value UK films value UK films(£ million) (£ million) (£ million) (£ million)
Window 2005 2005 2006 2006
Theatrical 770 254 762 145
DVD/video rental 399 89 340 58
Sell-through DVD/video 1,784 375 1,556 296
Pay-TV 706 85 642 86
Terrestrial TV 325 75 277 56
‘Free’ multi-channel TV 85 13 147 32
Total UK 4,069 891 3,724 673
Sources: Nielsen EDI, MRIB, BVA, Official Charts Company, DGA, RSU Analysis.Theatrical is the total gross UK theatrical revenues (including VAT) for all films released in the UK in 2005 and 2006, box office up to 19 February 2006 for the 2005films and 4 March 2007 for the 2006 films. See Chapter 1.UK rental is the total revenue from UK DVD/video rental transactions in the calendar years 2005 and 2006. See Chapter 11.Sell-through video is the total revenue from UK DVD/video retail transactions in the calendar years 2005 and 2006. See Chapter 11.The TV values are retail-equivalent values calculated from the dataset of films shown on UK television generated for the UKFC by DGA. Values are estimated by multiplying the film share of the total channel time by the total revenue applicable to that channel (licence fee, subscription or advertising revenue). See Chapter 12.The above values are gross values and include exhibitor and distributor margins, VAT, prints and advertising costs, DVD/video retail margins, broadcaster and multi-channel TV operator margins, in addition to net returns to the film production sector and film investors.The revenues shown here are revenues earned by film in the UK market whether UK or foreign films. The table does not include export revenues for the UK filmindustry. See Chapter 16 for UK film export revenues.
13.2 The UK market in the global context
Table 13.2 places the UK’s filmed entertainment market in a global context. In 2005, the UK had the third-largestfilmed entertainment market in the world, after the USA and Japan. The USA accounted for 43% of the worldmarket. The next biggest territories after the UK were Canada, Germany, France, Italy and South Korea. The worldfilmed entertainment market is still dominated by the largest developed economies. Although the Indian market isvast in terms of admissions and both India and China have huge populations and are growing fast economically,their filmed entertainment markets still count in US dollar terms below Australia (population 21 million) and Spain(population 44.7 million).
132 | UK Film Council Statistical Yearbook
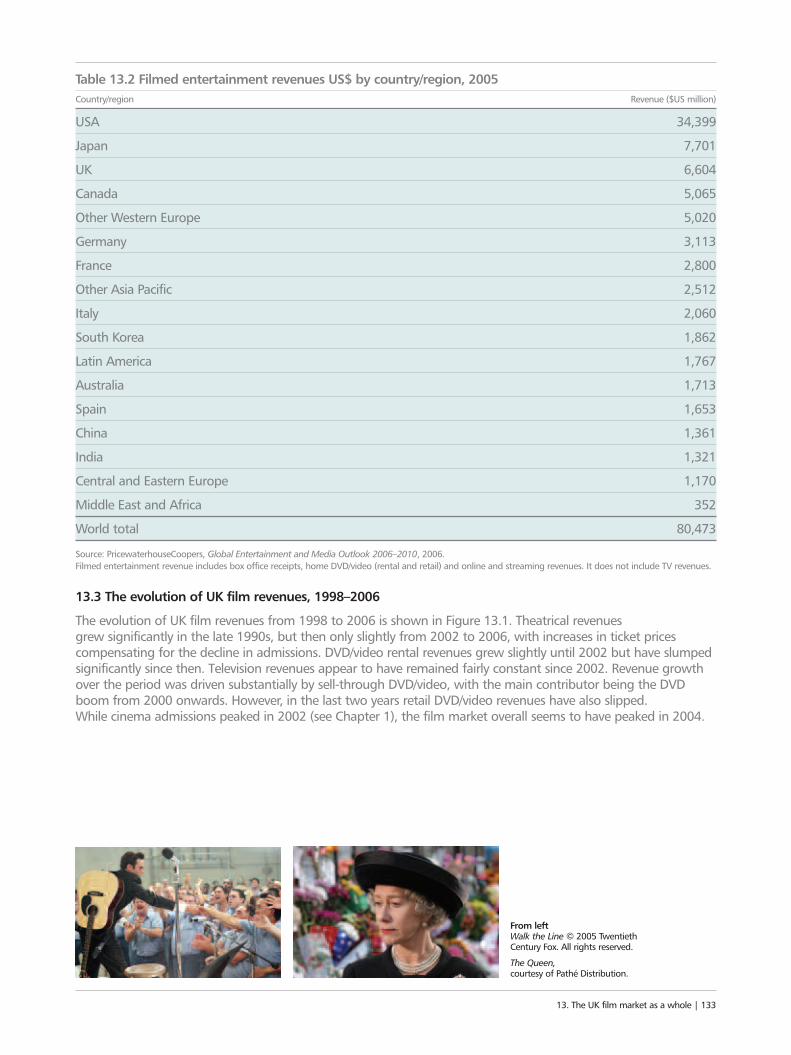
Table 13.2 Filmed entertainment revenues US$ by country/region, 2005Country/region Revenue ($US million)
USA 34,399
Japan 7,701
UK 6,604
Canada 5,065
Other Western Europe 5,020
Germany 3,113
France 2,800
Other Asia Pacific 2,512
Italy 2,060
South Korea 1,862
Latin America 1,767
Australia 1,713
Spain 1,653
China 1,361
India 1,321
Central and Eastern Europe 1,170
Middle East and Africa 352
World total 80,473
Source: PricewaterhouseCoopers, Global Entertainment and Media Outlook 2006–2010, 2006.Filmed entertainment revenue includes box office receipts, home DVD/video (rental and retail) and online and streaming revenues. It does not include TV revenues.
13.3 The evolution of UK film revenues, 1998–2006
The evolution of UK film revenues from 1998 to 2006 is shown in Figure 13.1. Theatrical revenues grew significantly in the late 1990s, but then only slightly from 2002 to 2006, with increases in ticket pricescompensating for the decline in admissions. DVD/video rental revenues grew slightly until 2002 but have slumpedsignificantly since then. Television revenues appear to have remained fairly constant since 2002. Revenue growthover the period was driven substantially by sell-through DVD/video, with the main contributor being the DVDboom from 2000 onwards. However, in the last two years retail DVD/video revenues have also slipped. While cinema admissions peaked in 2002 (see Chapter 1), the film market overall seems to have peaked in 2004.
13. The UK film market as a whole | 133
From left Walk the Line © 2005 TwentiethCentury Fox. All rights reserved.
The Queen, courtesy of Pathé Distribution.
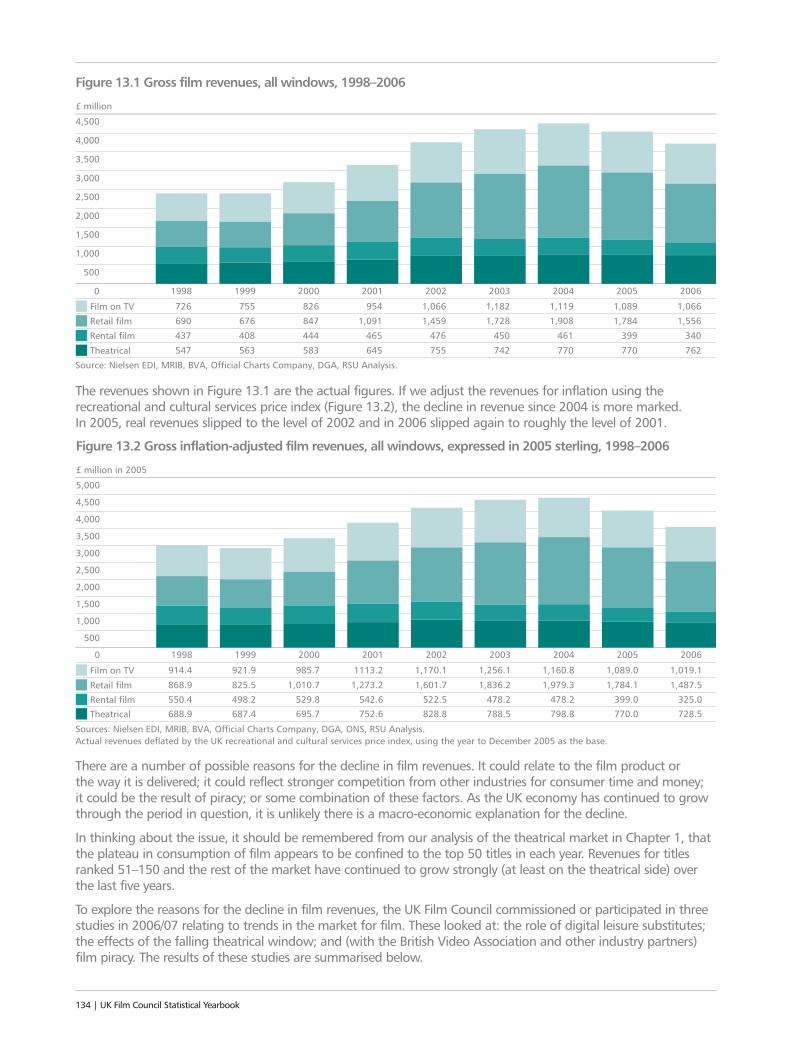
134 | UK Film Council Statistical Yearbook
The revenues shown in Figure 13.1 are the actual figures. If we adjust the revenues for inflation using therecreational and cultural services price index (Figure 13.2), the decline in revenue since 2004 is more marked.In 2005, real revenues slipped to the level of 2002 and in 2006 slipped again to roughly the level of 2001.
There are a number of possible reasons for the decline in film revenues. It could relate to the film product or the way it is delivered; it could reflect stronger competition from other industries for consumer time and money;it could be the result of piracy; or some combination of these factors. As the UK economy has continued to growthrough the period in question, it is unlikely there is a macro-economic explanation for the decline.
In thinking about the issue, it should be remembered from our analysis of the theatrical market in Chapter 1, thatthe plateau in consumption of film appears to be confined to the top 50 titles in each year. Revenues for titlesranked 51–150 and the rest of the market have continued to grow strongly (at least on the theatrical side) overthe last five years.
To explore the reasons for the decline in film revenues, the UK Film Council commissioned or participated in threestudies in 2006/07 relating to trends in the market for film. These looked at: the role of digital leisure substitutes;the effects of the falling theatrical window; and (with the British Video Association and other industry partners)film piracy. The results of these studies are summarised below.
0
1,000
500
2,500
2,000
1,500
3,500
3,000
4,500
4,000
1998 1999 2000 2001 2002 2003 2004 2005 2006
£ million
Figure 13.1 Gross film revenues, all windows, 1998–2006
Source: Nielsen EDI, MRIB, BVA, Official Charts Company, DGA, RSU Analysis.547 583 645 742 770 762Theatrical
437 444 465 450 461 340Rental film
690 847 1,091 1,728 1,908 1,556Retail film
726 826 954 1,182 1,119 1,066Film on TV
770
3991,7841,089
755
4761,4591,066
563
408676755
0
1,000
500
3,000
2,500
2,000
1,500
4,000
3,500
5,000
4,500
1998 1999 2000 2001 2002 2003 2004 2005 2006
£ million in 2005
Figure 13.2 Gross inflation-adjusted film revenues, all windows, expressed in 2005 sterling, 1998–2006
Sources: Nielsen EDI, MRIB, BVA, Official Charts Company, DGA, ONS, RSU Analysis.Actual revenues deflated by the UK recreational and cultural services price index, using the year to December 2005 as the base.
688.9 695.7 752.6 788.5 798.8 728.5Theatrical550.4 529.8 542.6 478.2 478.2 325.0Rental film868.9 1,010.7 1,273.2 1,836.2 1,979.3 1,487.5Retail film
914.4 985.7 1113.2 1,256.1 1,160.8 1,019.1Film on TV
770.0399.0
1,784.1
1,089.0
828.8522.5
1,601.7
1,170.1
687.4498.2825.5
921.9
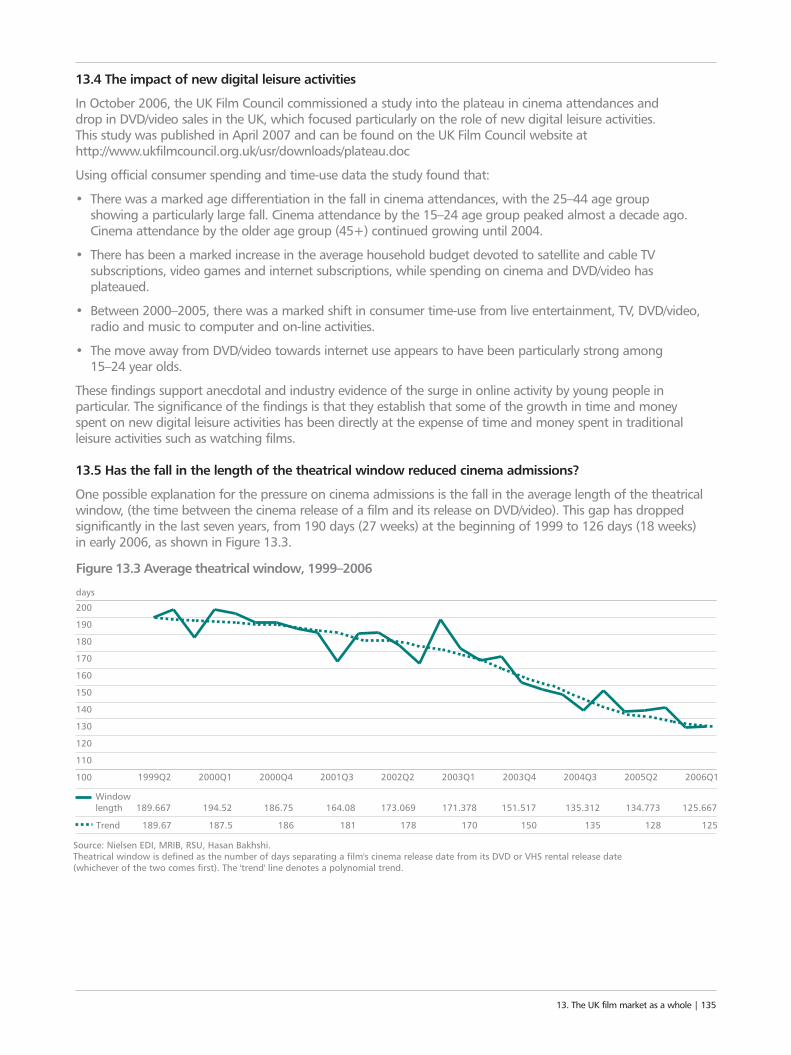
13.4 The impact of new digital leisure activities
In October 2006, the UK Film Council commissioned a study into the plateau in cinema attendances and drop in DVD/video sales in the UK, which focused particularly on the role of new digital leisure activities. This study was published in April 2007 and can be found on the UK Film Council website athttp://www.ukfilmcouncil.org.uk/usr/downloads/plateau.doc
Using official consumer spending and time-use data the study found that:
• There was a marked age differentiation in the fall in cinema attendances, with the 25–44 age group showing a particularly large fall. Cinema attendance by the 15–24 age group peaked almost a decade ago.Cinema attendance by the older age group (45+) continued growing until 2004.
• There has been a marked increase in the average household budget devoted to satellite and cable TVsubscriptions, video games and internet subscriptions, while spending on cinema and DVD/video hasplateaued.
• Between 2000–2005, there was a marked shift in consumer time-use from live entertainment, TV, DVD/video,radio and music to computer and on-line activities.
• The move away from DVD/video towards internet use appears to have been particularly strong among15–24 year olds.
These findings support anecdotal and industry evidence of the surge in online activity by young people inparticular. The significance of the findings is that they establish that some of the growth in time and money spent on new digital leisure activities has been directly at the expense of time and money spent in traditionalleisure activities such as watching films.
13.5 Has the fall in the length of the theatrical window reduced cinema admissions?
One possible explanation for the pressure on cinema admissions is the fall in the average length of the theatricalwindow, (the time between the cinema release of a film and its release on DVD/video). This gap has droppedsignificantly in the last seven years, from 190 days (27 weeks) at the beginning of 1999 to 126 days (18 weeks) in early 2006, as shown in Figure 13.3.
13. The UK film market as a whole | 135
100
120
110
150
140
130
170
160
200
180
190
1999Q2 2000Q1 2000Q4 2001Q3 2002Q2 2003Q1 2003Q4 2004Q3 2006Q12005Q2
days
Figure 13.3 Average theatrical window, 1999–2006
Source: Nielsen EDI, MRIB, RSU, Hasan Bakhshi. Theatrical window is defined as the number of days separating a film's cinema release date from its DVD or VHS rental release date (whichever of the two comes first). The 'trend' line denotes a polynomial trend.
Window length 189.667 194.52 186.75 164.08 173.069 171.378 151.517 135.312 134.773 125.667
Trend 189.67 187.5 186 181 178 170 150 135 128 125
136 | UK Film Council Statistical Yearbook
To test the hypothesis that the falling window has cannibalised theatrical admissions, the UK Film Councilcommissioned an analysis of the relationship between the box office and the theatrical window in the UK. This study was published in April 2007 and can be found on the UK Film Council’s website athttp://www.ukfilmcouncil.org.uk/usr/downloads/Theatrical%20window.doc.
The study used multi-variable econometric techniques to separate the impact of the theatrical window from othervariables affecting box office returns. Key findings were:
• There was robust evidence that the growing importance of the DVD market over time was an important factorin explaining the trend towards shorter theatrical windows.
• At any one time, theatrical windows were closely bunched around the median despite wide differences in therelative box office and DVD/video performances of different titles. This suggests that window length has beendetermined institutionally rather than by unfettered market forces.
• There was no statistically significant relationship between box office returns and window length, suggestingthat box office revenues have not been cannibalised to date by DVD/video transactions.
• There was strong evidence that windows fell by more in 2004–2006 than could be explained by the set ofvariables examined in the study. Prime candidates for the ‘other factors’ were film piracy and competition fromnew digital leisure technologies.
While the finding of this study was that box office revenues have not been affected by the shorter window, this finding holds only as far as the current evidence goes, which is to a window length of around 15 weeks.Below that, there could be a threshold below which cannibalisation might occur, but it is not possible to tell from this particular study where the threshold might be.
13.6 The impact of film piracy
With the development of digital technology, including cheap methods of burning DVDs, the film industry hasbecome increasingly concerned about the impact of film piracy on legal sales of film over the last five or six years.
The industry’s enforcement body, the Federation Against Copyright Theft (FACT) has adopted strategies to combatwide-scale commercial piracy utilising the new technology. The UK Film Council is a member of FACT and hasparticipated with industry partners in the British Video Association piracy research group. This group contractedIPSOS to conduct an annual survey of film and TV piracy, the latest wave of which was carried out in November2006. The research was based on a sample survey of the UK population, asking a series of questions relating topirate consumption in general and the impact on particular high-profile titles released in 2006.
The aggregate loss to the industry of film piracy was estimated to be £388 million in 2006. This is the estimatedimpact on legal sales of the acquisition and viewing of pirate material. The breakdown is shown in Table 13.3.
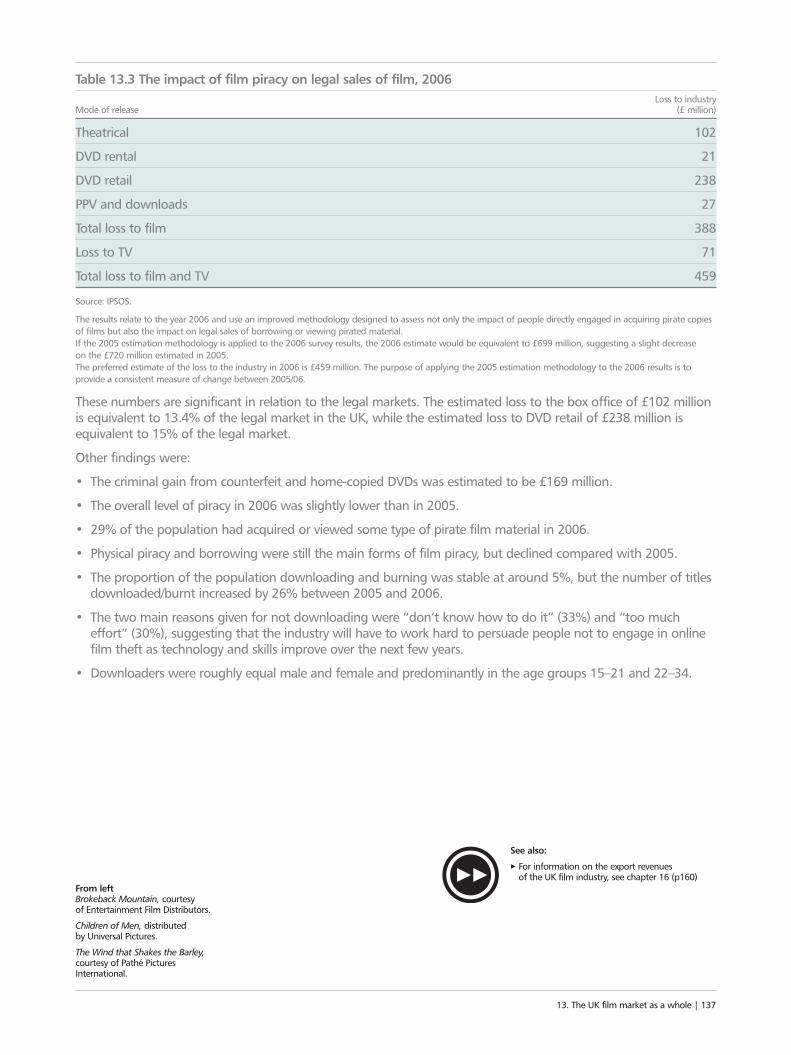
Table 13.3 The impact of film piracy on legal sales of film, 2006Loss to industry
Mode of release (£ million)
Theatrical 102
DVD rental 21
DVD retail 238
PPV and downloads 27
Total loss to film 388
Loss to TV 71
Total loss to film and TV 459
Source: IPSOS.
The results relate to the year 2006 and use an improved methodology designed to assess not only the impact of people directly engaged in acquiring pirate copiesof films but also the impact on legal sales of borrowing or viewing pirated material.If the 2005 estimation methodology is applied to the 2006 survey results, the 2006 estimate would be equivalent to £699 million, suggesting a slight decrease on the £720 million estimated in 2005.The preferred estimate of the loss to the industry in 2006 is £459 million. The purpose of applying the 2005 estimation methodology to the 2006 results is toprovide a consistent measure of change between 2005/06.
These numbers are significant in relation to the legal markets. The estimated loss to the box office of £102 millionis equivalent to 13.4% of the legal market in the UK, while the estimated loss to DVD retail of £238 million isequivalent to 15% of the legal market.
Other findings were:
• The criminal gain from counterfeit and home-copied DVDs was estimated to be £169 million.
• The overall level of piracy in 2006 was slightly lower than in 2005.
• 29% of the population had acquired or viewed some type of pirate film material in 2006.
• Physical piracy and borrowing were still the main forms of film piracy, but declined compared with 2005.
• The proportion of the population downloading and burning was stable at around 5%, but the number of titlesdownloaded/burnt increased by 26% between 2005 and 2006.
• The two main reasons given for not downloading were “don’t know how to do it” (33%) and “too mucheffort” (30%), suggesting that the industry will have to work hard to persuade people not to engage in onlinefilm theft as technology and skills improve over the next few years.
• Downloaders were roughly equal male and female and predominantly in the age groups 15–21 and 22–34.
13. The UK film market as a whole | 137
From left Brokeback Mountain, courtesy of Entertainment Film Distributors.
Children of Men, distributed by Universal Pictures.
The Wind that Shakes the Barley,courtesy of Pathé PicturesInternational.
See also:
3 For information on the export revenues of the UK film industry, see chapter 16 (p160)
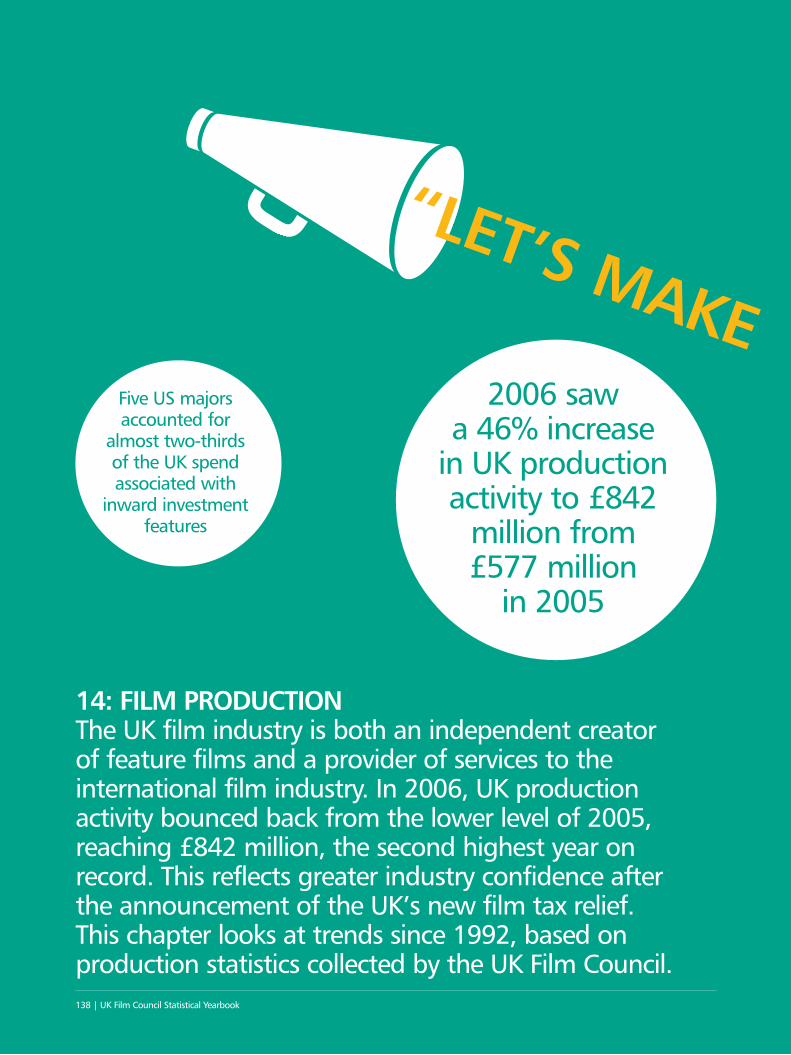
14: FILM PRODUCTIONThe UK film industry is both an independent creator of feature films and a provider of services to theinternational film industry. In 2006, UK productionactivity bounced back from the lower level of 2005,reaching £842 million, the second highest year onrecord. This reflects greater industry confidence after the announcement of the UK’s new film tax relief.This chapter looks at trends since 1992, based onproduction statistics collected by the UK Film Council.138 | UK Film Council Statistical Yearbook
“LET’S MAKE A MOVIE2006 saw
a 46% increase in UK productionactivity to £842
million from £577 million
in 2005
Five US majorsaccounted for
almost two-thirds of the UK spendassociated with
inward investmentfeatures
14: Film production | 139
“LET’S MAKE A MOVIE
The number of UK domestic features increased significantly,
from 39 in 2005 to 50 in 2006; however
their median budget fell significantly
Budgets for inward investment
films increased substantially, reflecting the higher number of
big-budget studio filmsmade in the UK
in 2006
The number of UK co-productions
continued to fall, though the UK spendincreased compared
with 2005
The UK spend associated with
inward investmentfeatures jumped
84% from £309 million
to £570 million
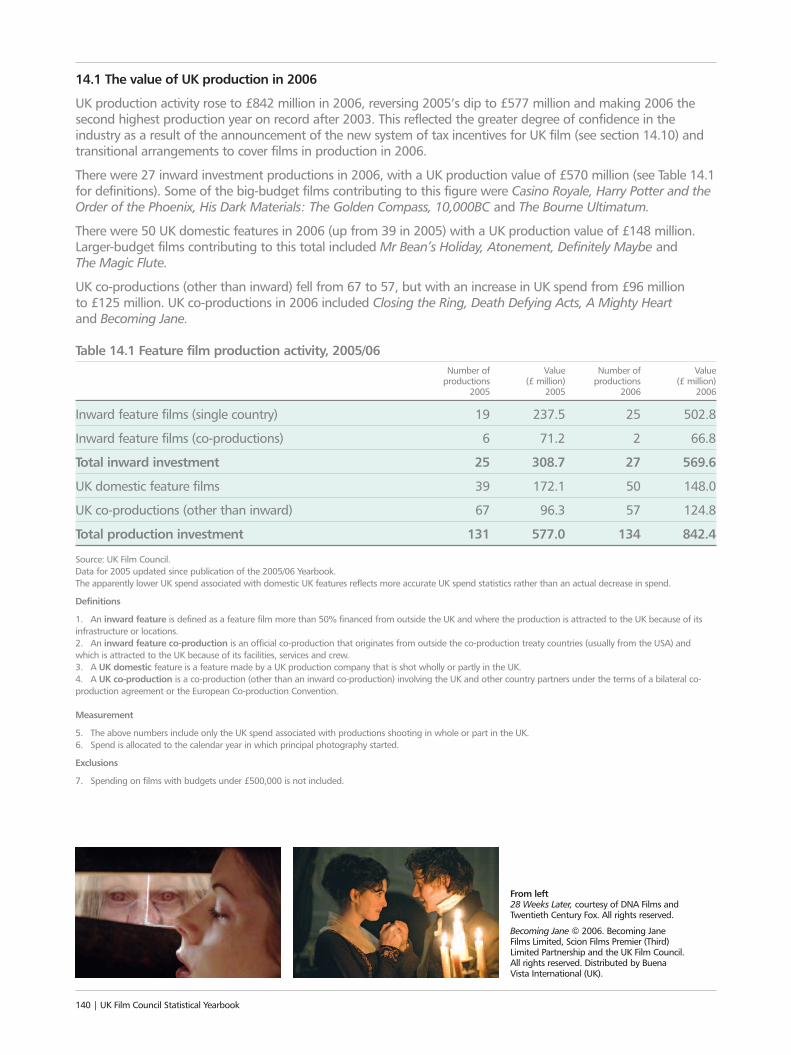
140 | UK Film Council Statistical Yearbook
14.1 The value of UK production in 2006
UK production activity rose to £842 million in 2006, reversing 2005’s dip to £577 million and making 2006 thesecond highest production year on record after 2003. This reflected the greater degree of confidence in theindustry as a result of the announcement of the new system of tax incentives for UK film (see section 14.10) andtransitional arrangements to cover films in production in 2006.
There were 27 inward investment productions in 2006, with a UK production value of £570 million (see Table 14.1for definitions). Some of the big-budget films contributing to this figure were Casino Royale, Harry Potter and theOrder of the Phoenix, His Dark Materials: The Golden Compass, 10,000BC and The Bourne Ultimatum.
There were 50 UK domestic features in 2006 (up from 39 in 2005) with a UK production value of £148 million.Larger-budget films contributing to this total included Mr Bean’s Holiday, Atonement, Definitely Maybe andThe Magic Flute.
UK co-productions (other than inward) fell from 67 to 57, but with an increase in UK spend from £96 million to £125 million. UK co-productions in 2006 included Closing the Ring, Death Defying Acts, A Mighty Heart and Becoming Jane.
Table 14.1 Feature film production activity, 2005/06Number of Value Number of Value
productions (£ million) productions (£ million)2005 2005 2006 2006
Inward feature films (single country) 19 237.5 25 502.8
Inward feature films (co-productions) 6 71.2 2 66.8
Total inward investment 25 308.7 27 569.6
UK domestic feature films 39 172.1 50 148.0
UK co-productions (other than inward) 67 96.3 57 124.8
Total production investment 131 577.0 134 842.4
Source: UK Film Council.Data for 2005 updated since publication of the 2005/06 Yearbook.The apparently lower UK spend associated with domestic UK features reflects more accurate UK spend statistics rather than an actual decrease in spend.
Definitions
1. An inward feature is defined as a feature film more than 50% financed from outside the UK and where the production is attracted to the UK because of itsinfrastructure or locations.2. An inward feature co-production is an official co-production that originates from outside the co-production treaty countries (usually from the USA) andwhich is attracted to the UK because of its facilities, services and crew.3. A UK domestic feature is a feature made by a UK production company that is shot wholly or partly in the UK.4. A UK co-production is a co-production (other than an inward co-production) involving the UK and other country partners under the terms of a bilateral co-production agreement or the European Co-production Convention.
Measurement
5. The above numbers include only the UK spend associated with productions shooting in whole or part in the UK.6. Spend is allocated to the calendar year in which principal photography started.
Exclusions
7. Spending on films with budgets under £500,000 is not included.
From left 28 Weeks Later, courtesy of DNA Films andTwentieth Century Fox. All rights reserved.
Becoming Jane © 2006. Becoming JaneFilms Limited, Scion Films Premier (Third)Limited Partnership and the UK Film Council.All rights reserved. Distributed by BuenaVista International (UK).
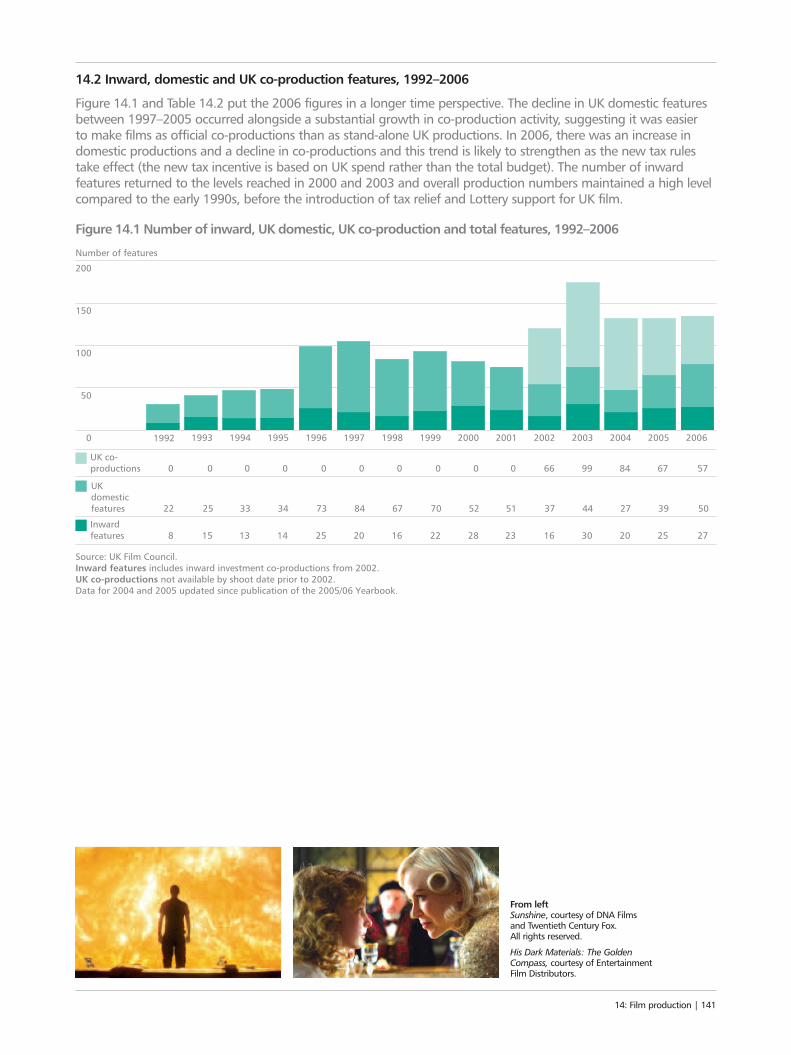
14.2 Inward, domestic and UK co-production features, 1992–2006
Figure 14.1 and Table 14.2 put the 2006 figures in a longer time perspective. The decline in UK domestic featuresbetween 1997–2005 occurred alongside a substantial growth in co-production activity, suggesting it was easier to make films as official co-productions than as stand-alone UK productions. In 2006, there was an increase indomestic productions and a decline in co-productions and this trend is likely to strengthen as the new tax rulestake effect (the new tax incentive is based on UK spend rather than the total budget). The number of inwardfeatures returned to the levels reached in 2000 and 2003 and overall production numbers maintained a high levelcompared to the early 1990s, before the introduction of tax relief and Lottery support for UK film.
14: Film production | 141
From left Sunshine, courtesy of DNA Films and Twentieth Century Fox. All rights reserved.
His Dark Materials: The GoldenCompass, courtesy of EntertainmentFilm Distributors.
UK co- productions 0 0 0 0 0 0 0 0 0 0 66 99 84 67 57
Inward features 8 15 13 14 25 20 16 22 28 23 16 30 20 25 27
UK domestic features 22 25 33 34 73 84 67 70 52 51 37 44 27 39 50
0
50
100
150
200
1992 1993 1994 1995 1996 1997 1998 1999 2000 2001 2002 2003 2004 2005 2006
Number of features
Figure 14.1 Number of inward, UK domestic, UK co-production and total features, 1992–2006
Source: UK Film Council.Inward features includes inward investment co-productions from 2002.UK co-productions not available by shoot date prior to 2002.Data for 2004 and 2005 updated since publication of the 2005/06 Yearbook.
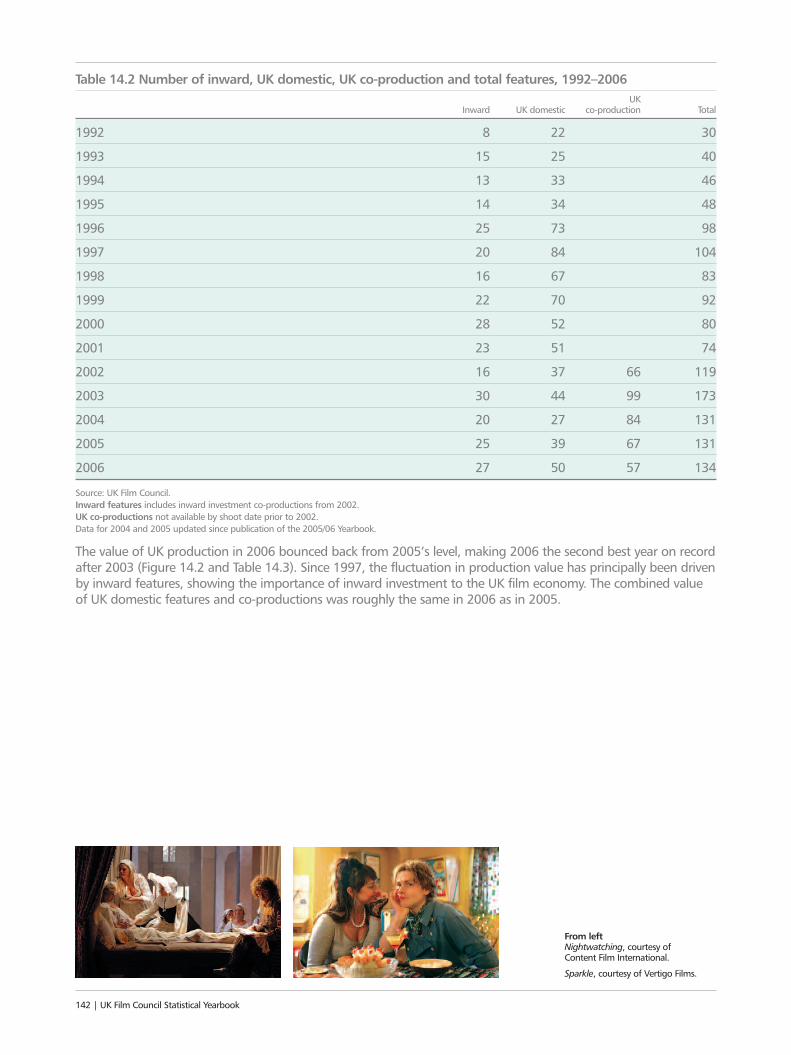
142 | UK Film Council Statistical Yearbook
Table 14.2 Number of inward, UK domestic, UK co-production and total features, 1992–2006UK
Inward UK domestic co-production Total
1992 8 22 30
1993 15 25 40
1994 13 33 46
1995 14 34 48
1996 25 73 98
1997 20 84 104
1998 16 67 83
1999 22 70 92
2000 28 52 80
2001 23 51 74
2002 16 37 66 119
2003 30 44 99 173
2004 20 27 84 131
2005 25 39 67 131
2006 27 50 57 134
Source: UK Film Council.Inward features includes inward investment co-productions from 2002.UK co-productions not available by shoot date prior to 2002.Data for 2004 and 2005 updated since publication of the 2005/06 Yearbook.
The value of UK production in 2006 bounced back from 2005’s level, making 2006 the second best year on recordafter 2003 (Figure 14.2 and Table 14.3). Since 1997, the fluctuation in production value has principally been drivenby inward features, showing the importance of inward investment to the UK film economy. The combined valueof UK domestic features and co-productions was roughly the same in 2006 as in 2005.
From left Nightwatching, courtesy of Content Film International.
Sparkle, courtesy of Vertigo Films.
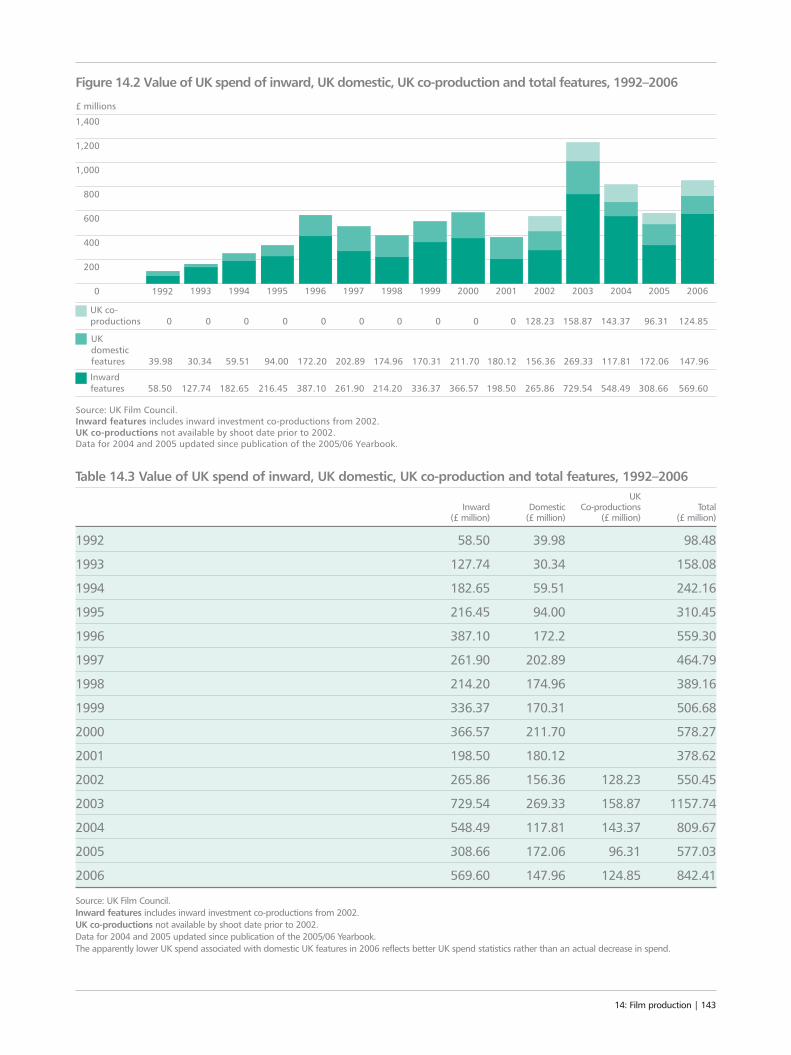
Table 14.3 Value of UK spend of inward, UK domestic, UK co-production and total features, 1992–2006UK
Inward Domestic Co-productions Total(£ million) (£ million) (£ million) (£ million)
1992 58.50 39.98 98.48
1993 127.74 30.34 158.08
1994 182.65 59.51 242.16
1995 216.45 94.00 310.45
1996 387.10 172.2 559.30
1997 261.90 202.89 464.79
1998 214.20 174.96 389.16
1999 336.37 170.31 506.68
2000 366.57 211.70 578.27
2001 198.50 180.12 378.62
2002 265.86 156.36 128.23 550.45
2003 729.54 269.33 158.87 1157.74
2004 548.49 117.81 143.37 809.67
2005 308.66 172.06 96.31 577.03
2006 569.60 147.96 124.85 842.41
Source: UK Film Council.Inward features includes inward investment co-productions from 2002.UK co-productions not available by shoot date prior to 2002.Data for 2004 and 2005 updated since publication of the 2005/06 Yearbook.The apparently lower UK spend associated with domestic UK features in 2006 reflects better UK spend statistics rather than an actual decrease in spend.
14: Film production | 143
0
Source: UK Film Council.Inward features includes inward investment co-productions from 2002.UK co-productions not available by shoot date prior to 2002.Data for 2004 and 2005 updated since publication of the 2005/06 Yearbook.
200
400
600
800
1,000
1,400
1,200
1992 19941993 1995 1996 1997 1998 20001999 2001 2002 200520042003 2006
£ millions
Figure 14.2 Value of UK spend of inward, UK domestic, UK co-production and total features, 1992–2006
UK co- productions 0 0 0 0 0 0 0 0 0 0 128.23 158.87 143.37 96.31 124.85
Inward features 58.50 127.74 182.65 216.45 387.10 261.90 214.20 336.37 366.57 198.50 265.86 729.54 548.49 308.66 569.60
UK domestic features 39.98 30.34 59.51 94.00 172.20 202.89 174.96 170.31 211.70 180.12 156.36 269.33 117.81 172.06 147.96
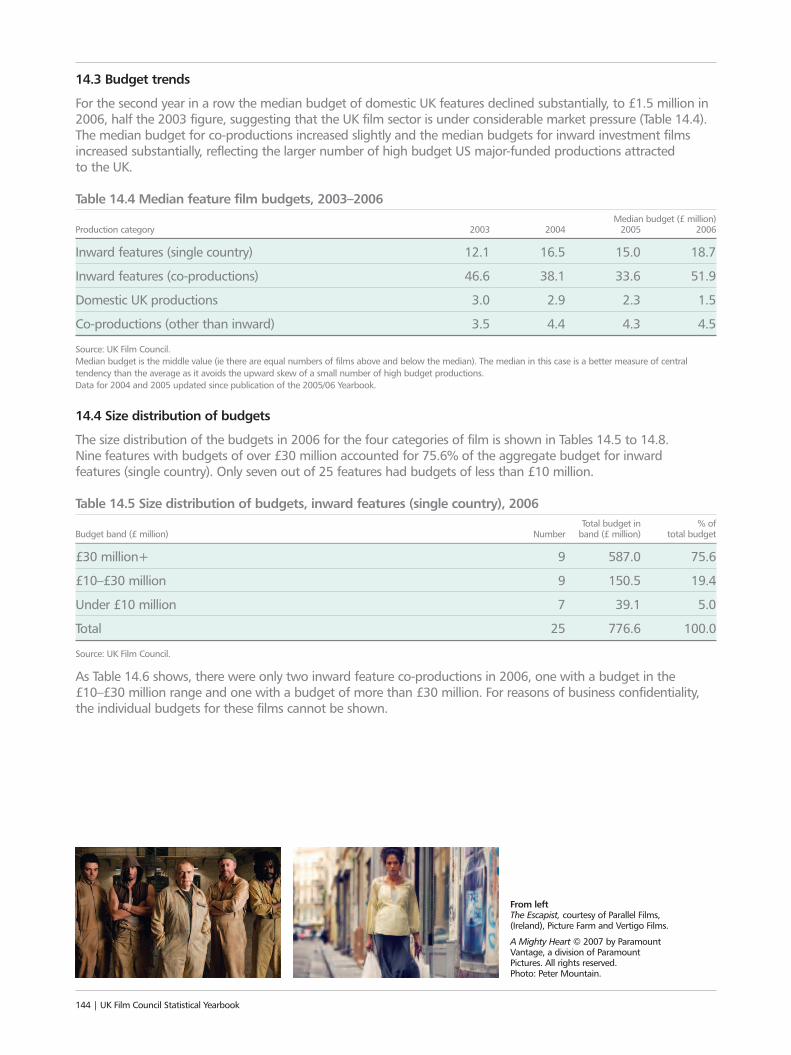
14.3 Budget trends
For the second year in a row the median budget of domestic UK features declined substantially, to £1.5 million in2006, half the 2003 figure, suggesting that the UK film sector is under considerable market pressure (Table 14.4).The median budget for co-productions increased slightly and the median budgets for inward investment filmsincreased substantially, reflecting the larger number of high budget US major-funded productions attracted to the UK.
Table 14.4 Median feature film budgets, 2003–2006Median budget (£ million)
Production category 2003 2004 2005 2006
Inward features (single country) 12.1 16.5 15.0 18.7
Inward features (co-productions) 46.6 38.1 33.6 51.9
Domestic UK productions 3.0 2.9 2.3 1.5
Co-productions (other than inward) 3.5 4.4 4.3 4.5
Source: UK Film Council.Median budget is the middle value (ie there are equal numbers of films above and below the median). The median in this case is a better measure of centraltendency than the average as it avoids the upward skew of a small number of high budget productions.Data for 2004 and 2005 updated since publication of the 2005/06 Yearbook.
14.4 Size distribution of budgets
The size distribution of the budgets in 2006 for the four categories of film is shown in Tables 14.5 to 14.8. Nine features with budgets of over £30 million accounted for 75.6% of the aggregate budget for inward features (single country). Only seven out of 25 features had budgets of less than £10 million.
Table 14.5 Size distribution of budgets, inward features (single country), 2006Total budget in % of
Budget band (£ million) Number band (£ million) total budget
£30 million+ 9 587.0 75.6
£10–£30 million 9 150.5 19.4
Under £10 million 7 39.1 5.0
Total 25 776.6 100.0
Source: UK Film Council.
As Table 14.6 shows, there were only two inward feature co-productions in 2006, one with a budget in the £10–£30 million range and one with a budget of more than £30 million. For reasons of business confidentiality,the individual budgets for these films cannot be shown.
144 | UK Film Council Statistical Yearbook
From left The Escapist, courtesy of Parallel Films,(Ireland), Picture Farm and Vertigo Films.
A Mighty Heart © 2007 by ParamountVantage, a division of ParamountPictures. All rights reserved. Photo: Peter Mountain.
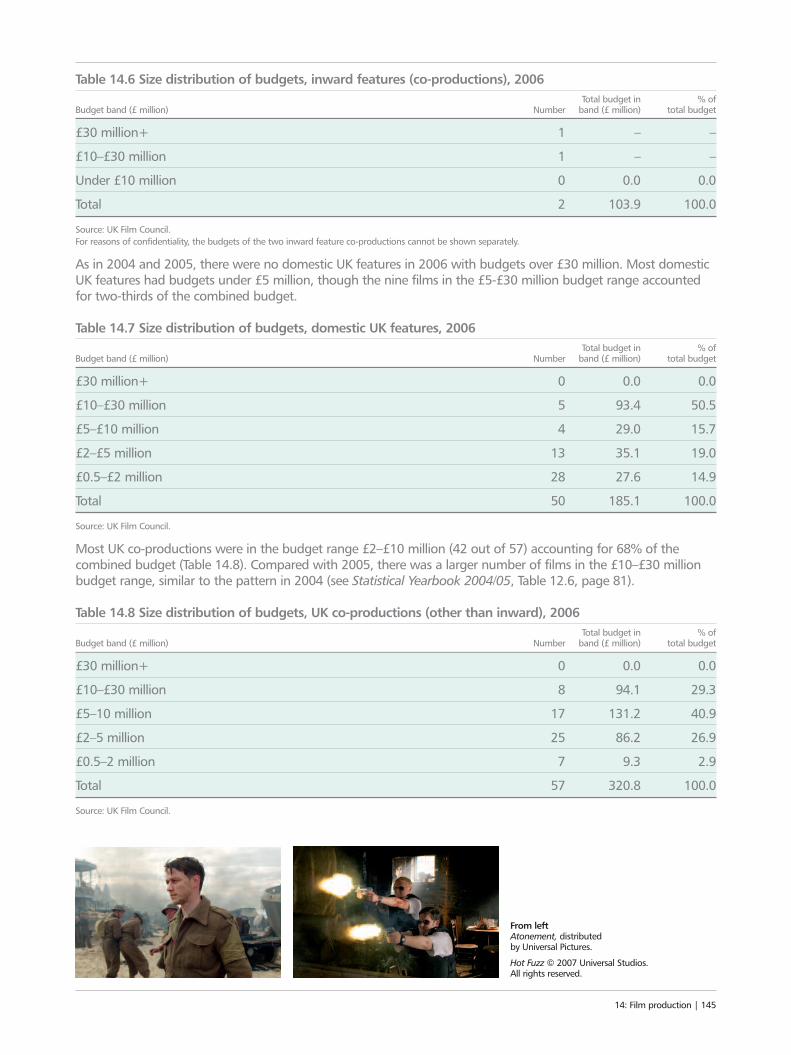
Table 14.6 Size distribution of budgets, inward features (co-productions), 2006Total budget in % of
Budget band (£ million) Number band (£ million) total budget
£30 million+ 1 – –
£10–£30 million 1 – –
Under £10 million 0 0.0 0.0
Total 2 103.9 100.0
Source: UK Film Council.For reasons of confidentiality, the budgets of the two inward feature co-productions cannot be shown separately.
As in 2004 and 2005, there were no domestic UK features in 2006 with budgets over £30 million. Most domesticUK features had budgets under £5 million, though the nine films in the £5-£30 million budget range accountedfor two-thirds of the combined budget.
Table 14.7 Size distribution of budgets, domestic UK features, 2006Total budget in % of
Budget band (£ million) Number band (£ million) total budget
£30 million+ 0 0.0 0.0
£10–£30 million 5 93.4 50.5
£5–£10 million 4 29.0 15.7
£2–£5 million 13 35.1 19.0
£0.5–£2 million 28 27.6 14.9
Total 50 185.1 100.0
Source: UK Film Council.
Most UK co-productions were in the budget range £2–£10 million (42 out of 57) accounting for 68% of thecombined budget (Table 14.8). Compared with 2005, there was a larger number of films in the £10–£30 millionbudget range, similar to the pattern in 2004 (see Statistical Yearbook 2004/05, Table 12.6, page 81).
Table 14.8 Size distribution of budgets, UK co-productions (other than inward), 2006Total budget in % of
Budget band (£ million) Number band (£ million) total budget
£30 million+ 0 0.0 0.0
£10–£30 million 8 94.1 29.3
£5–10 million 17 131.2 40.9
£2–5 million 25 86.2 26.9
£0.5–2 million 7 9.3 2.9
Total 57 320.8 100.0
Source: UK Film Council.
14: Film production | 145
From left Atonement, distributed by Universal Pictures.
Hot Fuzz © 2007 Universal Studios. All rights reserved.
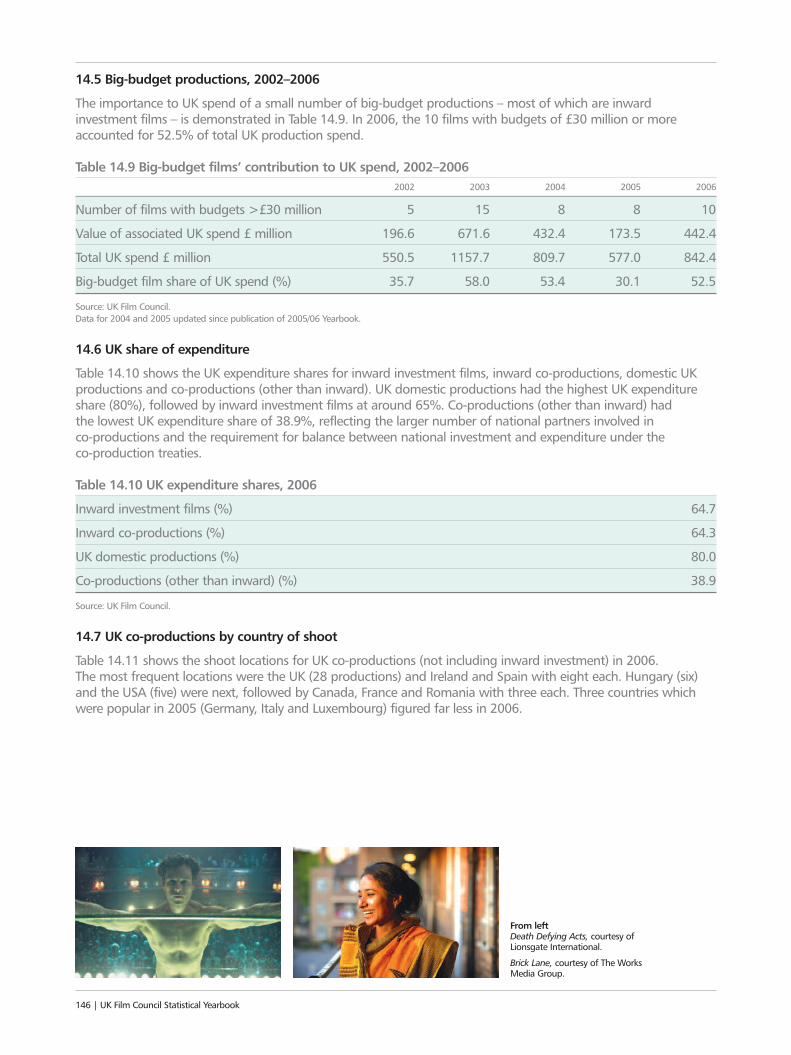
14.5 Big-budget productions, 2002–2006
The importance to UK spend of a small number of big-budget productions – most of which are inwardinvestment films – is demonstrated in Table 14.9. In 2006, the 10 films with budgets of £30 million or moreaccounted for 52.5% of total UK production spend.
Table 14.9 Big-budget films’ contribution to UK spend, 2002–20062002 2003 2004 2005 2006
Number of films with budgets >£30 million 5 15 8 8 10
Value of associated UK spend £ million 196.6 671.6 432.4 173.5 442.4
Total UK spend £ million 550.5 1157.7 809.7 577.0 842.4
Big-budget film share of UK spend (%) 35.7 58.0 53.4 30.1 52.5
Source: UK Film Council.Data for 2004 and 2005 updated since publication of 2005/06 Yearbook.
14.6 UK share of expenditure
Table 14.10 shows the UK expenditure shares for inward investment films, inward co-productions, domestic UKproductions and co-productions (other than inward). UK domestic productions had the highest UK expenditureshare (80%), followed by inward investment films at around 65%. Co-productions (other than inward) had the lowest UK expenditure share of 38.9%, reflecting the larger number of national partners involved in co-productions and the requirement for balance between national investment and expenditure under the co-production treaties.
Table 14.10 UK expenditure shares, 2006
Inward investment films (%) 64.7
Inward co-productions (%) 64.3
UK domestic productions (%) 80.0
Co-productions (other than inward) (%) 38.9
Source: UK Film Council.
14.7 UK co-productions by country of shoot
Table 14.11 shows the shoot locations for UK co-productions (not including inward investment) in 2006. The most frequent locations were the UK (28 productions) and Ireland and Spain with eight each. Hungary (six)and the USA (five) were next, followed by Canada, France and Romania with three each. Three countries whichwere popular in 2005 (Germany, Italy and Luxembourg) figured far less in 2006.
146 | UK Film Council Statistical Yearbook
From left Death Defying Acts, courtesy ofLionsgate International.
Brick Lane, courtesy of The WorksMedia Group.
Table 14.11 UK co-productions by country of shoot, 2006Country Number of productions
UK 28
Ireland 8
Spain 8
Hungary 6
USA 5
Canada 3
France 3
Romania 3
Belgium 2
Bulgaria 2
Czech Republic 2
Portugal 2
Russia 2
South Africa 2
Others 17
Source: UK Film Council.Some productions were shot in more than one country, hence the total in Table 14.11 is greater than the number of UK co-productions.
The shoot locations by region for UK co-productions shot abroad between 2004 and 2006 are shown in Table14.12. Western Europe (not including the UK) was once again the most frequent destination. Shoots in EasternEurope and Russia (led by Hungary and Romania) increased for the second year in a row, after dropping in 2004.Shoots in North America were also up (more in the USA than Canada). Elsewhere, numbers continued to berelatively small in 2006.
14: Film production | 147
RightMr Bean’s Holiday, distributed byUniversal Pictures.
Table 14.12 Location of shoot by region, UK co-productions shot abroad, 2004–2006Shot abroad Shot abroad Shot abroad
Region in 2004 in 2005 in 2006
Not available 19 2 1
Western Europe 49 48 30
North America 7 4 8
South and Central America, Caribbean 4 1 1
Eastern Europe and Russia 8 16 20
Australia and New Zealand 7 1 1
Asia 0 0 1
Africa and Indian Ocean 4 4 4
Source: UK Film Council.Of the co-productions in 2004 for which location information was not available, some may have been shot in the UK.
14.8 Production company activity levels
UK film production in 2006 was, as usual, dispersed over a large number of production companies, as shown in Table 14.13. The UK Film Council recorded 342 production companies associated with films shot in the UK or co-productions involving the UK in 2006. Of these, 332 companies were associated with a single feature. These were a mixture of distinct production companies and single-purpose vehicles (that is, companies set up to make a single film). The most prolific production company was associated with six features, followed by one with five features, two companies with three features and six with two features.
Table 14.13 Film production company activity, 2006Number of
Number of features per company companies
6 1
5 1
3 2
2 6
1 332
Total companies 342
Source: UK Film Council.Includes all types of films involving the UK.Films frequently have several production companies associated with them (including single purpose vehicle subsidiaries of parent companies), so the sum of thenumber of features x the number of companies is substantially greater than the total number of features involving the UK in 2006.
148 | UK Film Council Statistical Yearbook
This is England, courtesy of Optimum Releasing.
14.9 US studios’ involvement in inward features
US studios increased their activity in the UK in 2006. This reflected a greater degree of certainty about the tax regime, particularly as it applied to the types of studio film suitable for making in the UK. The US majorsaccounted for 11 out 27 inward features (single country and co-productions) and £360 million (63%) out of £570 million UK spend associated with inward features (Table 14.14).
Table 14.14 US studios’ involvement in inward features and inward co-productions, 2006Number of
inward features Studio in 2006
Warner Bros 3
20th Century Fox 1
Universal 2
Sony/Columbia/MGM 5
Paramount 1
Total films 11
Source: UK Film Council.Universal and Columbia collaborated on one film, hence the sum of studio involvement (12) is one greater than the number of films (11).In addition to the films tabulated above, Universal Pictures financed four domestic UK features via its output deal with Working Title. 20th Century Fox financed two UK domestic features.
14.10 The new UK film tax incentive
2006 saw a switch from the previous UK tax incentives for film (Section 42 and Section 48) using the sale andleaseback mechanism. The new tax incentive is based on an enhanced deduction from taxable income for filmproduction companies that can be converted into a payable tax credit. For UK films with production budgets upto £20 million, the value of the relief increases to a maximum of 20% of production costs where 80% or more ofthe budget is spent in the UK. For UK films with production budgets of £20 million and over, the maximum valueis 16%. In addition to meeting a minimum spend test (25% of qualifying expenditure must be spent in the UK),UK films must pass a ‘cultural test’ administered by the UK Film Council and issued by the Department for Culture Media and Sport, the emphasis of which is on the film’s story, setting, characters and contribution to British elements.
The new incentive system received state aid approval from the European Commission on 22 November 2006 andcame into force on 1 January 2007. It applies to films starting principal photography on or after 1 January 2007.Transitional provisions apply to UK-qualifying films that commenced principal photography before 1 January 2007but were still uncompleted on that date.
14: Film production | 149
See also:
3 Information about film companies is given in chapter 15 (p150)
3 For details about employment in the filmproduction sector see chapter 17 (p166)
3 For more information about the UK film economy see chapter 16 (p160)
3 For information on film production in the UK priorto 1992, see the annual handbooks published bythe bfi (British Film Institute) or the bfi’s website
15: FILM INDUSTRY COMPANIESThe number of film production companies has grownyear-on-year since 1996. Many of these companies aresmall in size but there has also been expansion in thebigger companies. The French topped the league of the20 leading film production companies in Europe, but anumber of British companies were also prominent.150 | UK Film Council Statistical Yearbook
US majors, video distributors
and exhibitors wereprominent in the top 16 UK film
companies
French companies were prominent acrossEurope in addition to
the US majors
“BUILD ME A STUDIO
15: Film industry companies | 151
French, UK, German and Italian companies were prominent in thetop 20 European filmproduction companies
in 2005
Only six UK companies featured inthe top 100 European
film productioncompanies
The number of small production
companies grew the most
The number of film productioncompanies grew
by 256% between 1996 and 2006“BUILD ME A STUDIO
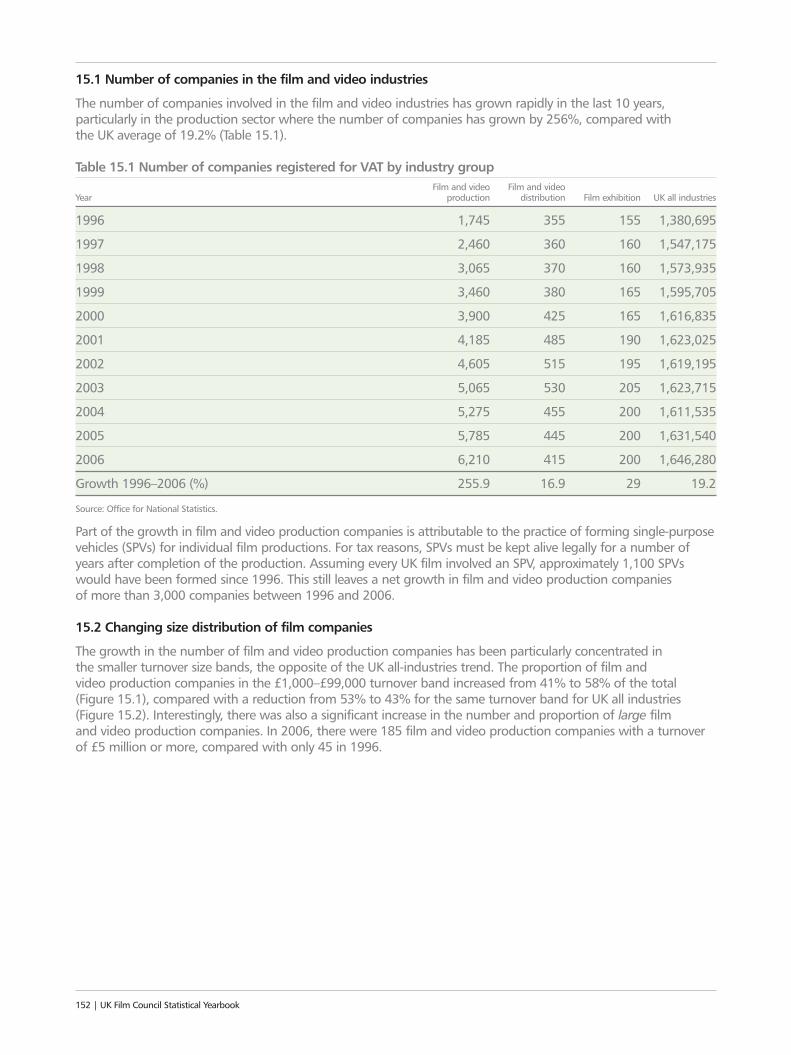
152 | UK Film Council Statistical Yearbook
15.1 Number of companies in the film and video industries
The number of companies involved in the film and video industries has grown rapidly in the last 10 years,particularly in the production sector where the number of companies has grown by 256%, compared with the UK average of 19.2% (Table 15.1).
Table 15.1 Number of companies registered for VAT by industry groupFilm and video Film and video
Year production distribution Film exhibition UK all industries
1996 1,745 355 155 1,380,695
1997 2,460 360 160 1,547,175
1998 3,065 370 160 1,573,935
1999 3,460 380 165 1,595,705
2000 3,900 425 165 1,616,835
2001 4,185 485 190 1,623,025
2002 4,605 515 195 1,619,195
2003 5,065 530 205 1,623,715
2004 5,275 455 200 1,611,535
2005 5,785 445 200 1,631,540
2006 6,210 415 200 1,646,280
Growth 1996–2006 (%) 255.9 16.9 29 19.2
Source: Office for National Statistics.
Part of the growth in film and video production companies is attributable to the practice of forming single-purposevehicles (SPVs) for individual film productions. For tax reasons, SPVs must be kept alive legally for a number ofyears after completion of the production. Assuming every UK film involved an SPV, approximately 1,100 SPVswould have been formed since 1996. This still leaves a net growth in film and video production companies of more than 3,000 companies between 1996 and 2006.
15.2 Changing size distribution of film companies
The growth in the number of film and video production companies has been particularly concentrated inthe smaller turnover size bands, the opposite of the UK all-industries trend. The proportion of film and video production companies in the £1,000–£99,000 turnover band increased from 41% to 58% of the total (Figure 15.1), compared with a reduction from 53% to 43% for the same turnover band for UK all industries(Figure 15.2). Interestingly, there was also a significant increase in the number and proportion of large film and video production companies. In 2006, there were 185 film and video production companies with a turnoverof £5 million or more, compared with only 45 in 1996.
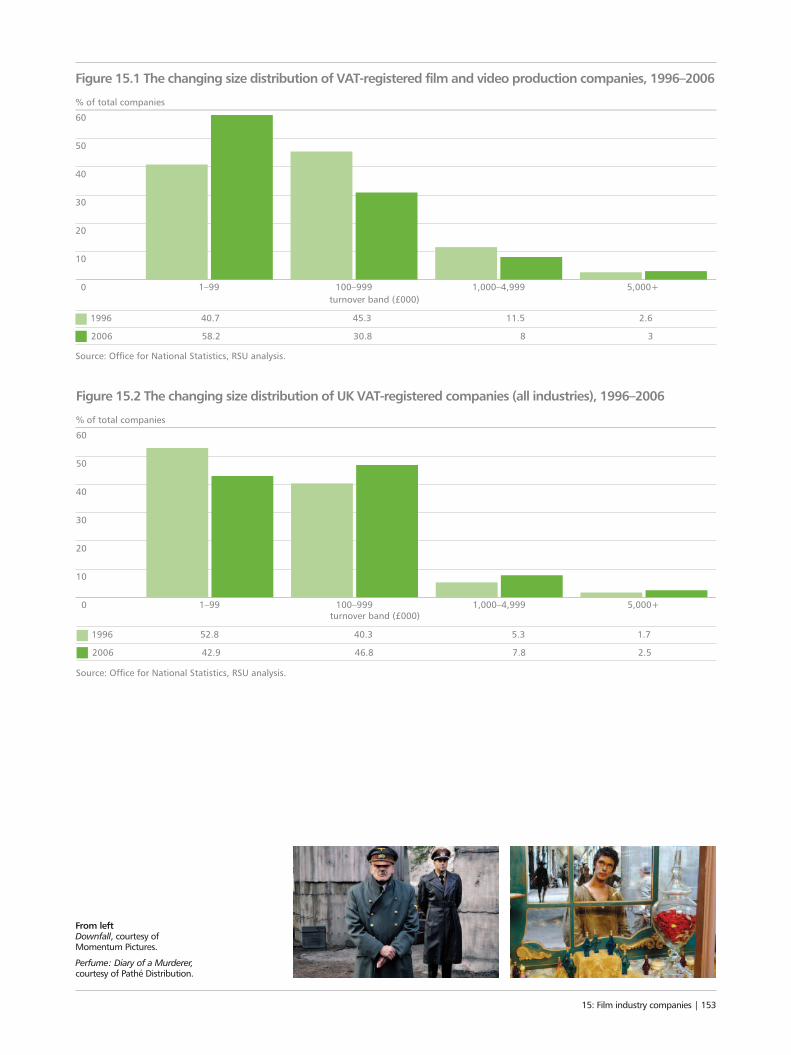
15: Film industry companies | 153
From left Downfall, courtesy of Momentum Pictures.
Perfume: Diary of a Murderer, courtesy of Pathé Distribution.
0
20
10
50
40
30
60
1–99 100–999turnover band (£000)
1,000–4,999 5,000+
% of total companies
Figure 15.1 The changing size distribution of VAT-registered film and video production companies, 1996–2006
Source: Office for National Statistics, RSU analysis.
1996 40.7 45.3 11.5 2.6
2006 58.2 30.8 8 3
0
20
10
50
40
30
60
1–99 100–999 1,000–4,999 5,000+
% of total companies
Figure 15.2 The changing size distribution of UK VAT-registered companies (all industries), 1996–2006
Source: Office for National Statistics, RSU analysis.
turnover band (£000)
1996 52.8 40.3 5.3 1.7
2006 42.9 46.8 7.8 2.5
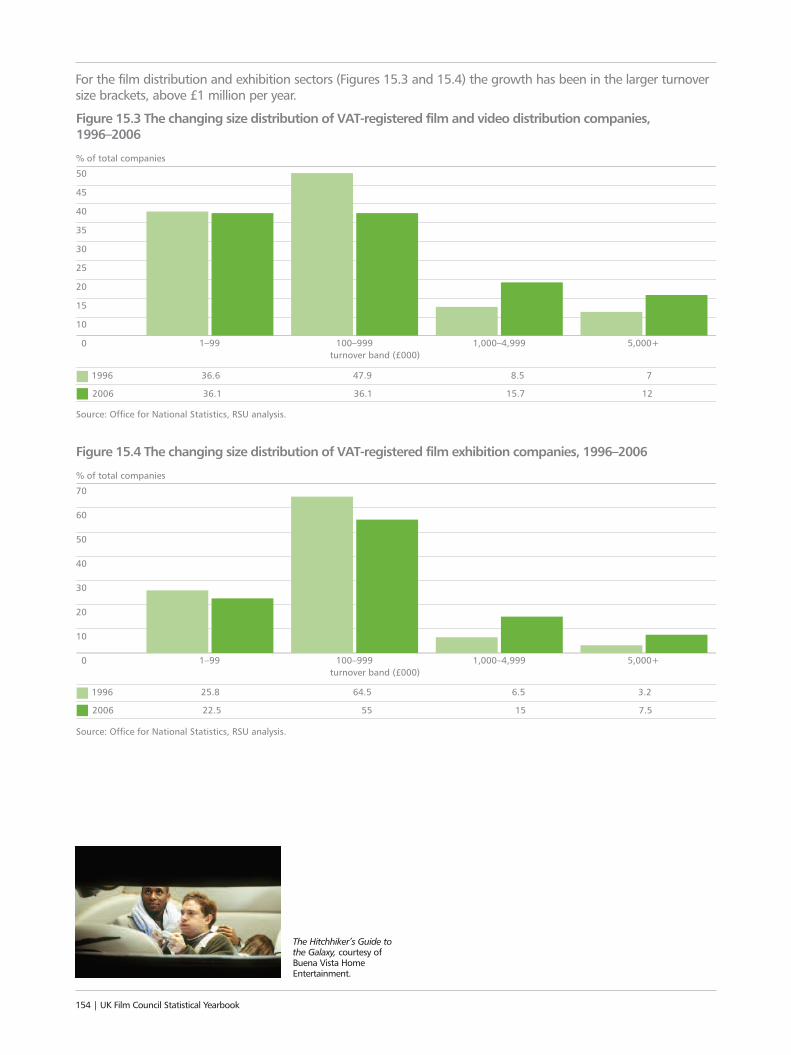
154 | UK Film Council Statistical Yearbook
For the film distribution and exhibition sectors (Figures 15.3 and 15.4) the growth has been in the larger turnoversize brackets, above £1 million per year.
0
20
15
10
45
40
35
30
25
50
1–99 100–999 1,000–4,999 5,000+
% of total companies
Figure 15.3 The changing size distribution of VAT-registered film and video distribution companies, 1996–2006
Source: Office for National Statistics, RSU analysis.
turnover band (£000)
1996 36.6 47.9 8.5 7
2006 36.1 36.1 15.7 12
0
20
10
60
50
40
30
70
1–99 100–999 1,000–4,999 5,000+
% of total companies
Figure 15.4 The changing size distribution of VAT-registered film exhibition companies, 1996–2006
Source: Office for National Statistics, RSU analysis.
turnover band (£000)
1996 25.8 64.5 6.5 3.2
2006 22.5 55 15 7.5
The Hitchhiker’s Guide to the Galaxy, courtesy of Buena Vista HomeEntertainment.
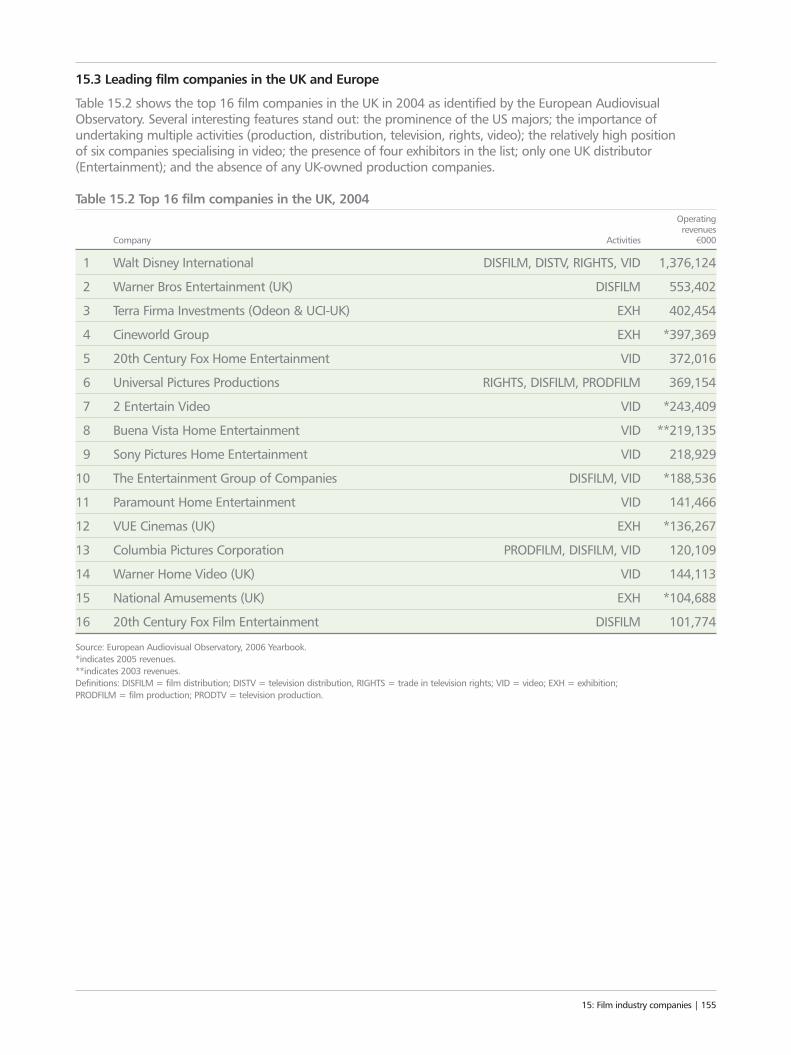
15.3 Leading film companies in the UK and Europe
Table 15.2 shows the top 16 film companies in the UK in 2004 as identified by the European AudiovisualObservatory. Several interesting features stand out: the prominence of the US majors; the importance ofundertaking multiple activities (production, distribution, television, rights, video); the relatively high position of six companies specialising in video; the presence of four exhibitors in the list; only one UK distributor(Entertainment); and the absence of any UK-owned production companies.
Table 15.2 Top 16 film companies in the UK, 2004Operatingrevenues
Company Activities 1000
1 Walt Disney International DISFILM, DISTV, RIGHTS, VID 1,376,124
2 Warner Bros Entertainment (UK) DISFILM 553,402
3 Terra Firma Investments (Odeon & UCI-UK) EXH 402,454
4 Cineworld Group EXH *397,369
5 20th Century Fox Home Entertainment VID 372,016
6 Universal Pictures Productions RIGHTS, DISFILM, PRODFILM 369,154
7 2 Entertain Video VID *243,409
8 Buena Vista Home Entertainment VID **219,135
9 Sony Pictures Home Entertainment VID 218,929
10 The Entertainment Group of Companies DISFILM, VID *188,536
11 Paramount Home Entertainment VID 141,466
12 VUE Cinemas (UK) EXH *136,267
13 Columbia Pictures Corporation PRODFILM, DISFILM, VID 120,109
14 Warner Home Video (UK) VID 144,113
15 National Amusements (UK) EXH *104,688
16 20th Century Fox Film Entertainment DISFILM 101,774
Source: European Audiovisual Observatory, 2006 Yearbook.*indicates 2005 revenues.**indicates 2003 revenues.Definitions: DISFILM = film distribution; DISTV = television distribution, RIGHTS = trade in television rights; VID = video; EXH = exhibition; PRODFILM = film production; PRODTV = television production.
15: Film industry companies | 155
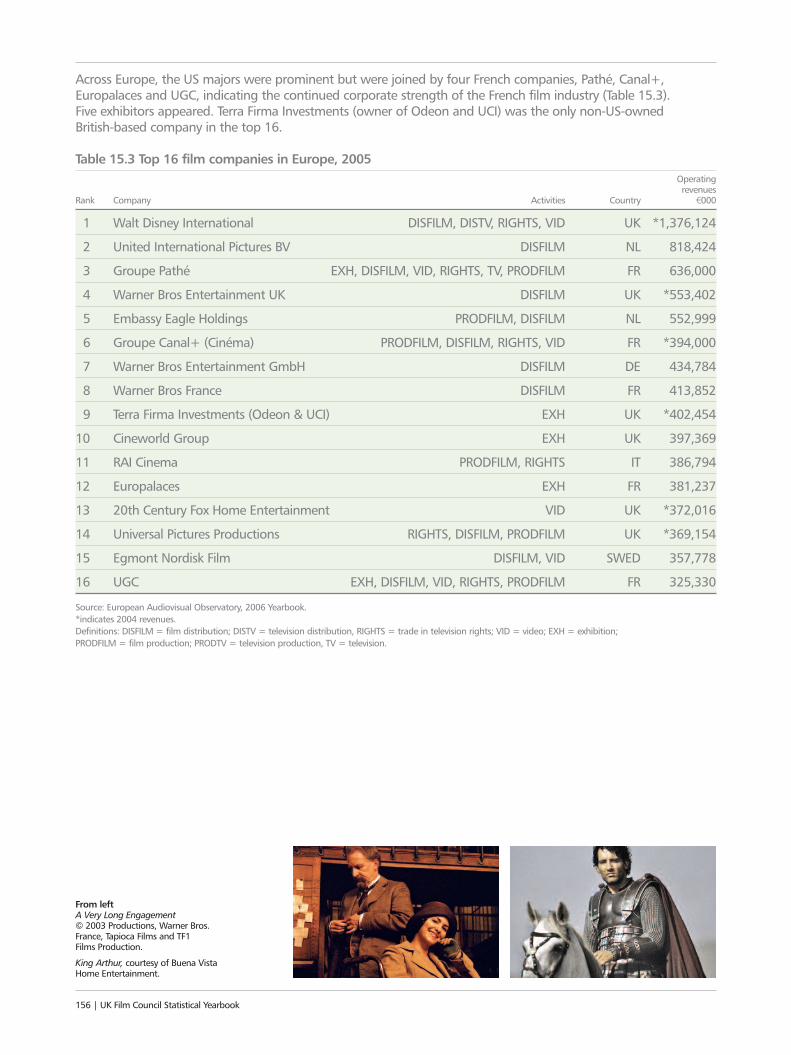
Across Europe, the US majors were prominent but were joined by four French companies, Pathé, Canal+,Europalaces and UGC, indicating the continued corporate strength of the French film industry (Table 15.3). Five exhibitors appeared. Terra Firma Investments (owner of Odeon and UCI) was the only non-US-owned British-based company in the top 16.
Table 15.3 Top 16 film companies in Europe, 2005Operatingrevenues
Rank Company Activities Country 1000
1 Walt Disney International DISFILM, DISTV, RIGHTS, VID UK *1,376,124
2 United International Pictures BV DISFILM NL 818,424
3 Groupe Pathé EXH, DISFILM, VID, RIGHTS, TV, PRODFILM FR 636,000
4 Warner Bros Entertainment UK DISFILM UK *553,402
5 Embassy Eagle Holdings PRODFILM, DISFILM NL 552,999
6 Groupe Canal+ (Cinéma) PRODFILM, DISFILM, RIGHTS, VID FR *394,000
7 Warner Bros Entertainment GmbH DISFILM DE 434,784
8 Warner Bros France DISFILM FR 413,852
9 Terra Firma Investments (Odeon & UCI) EXH UK *402,454
10 Cineworld Group EXH UK 397,369
11 RAI Cinema PRODFILM, RIGHTS IT 386,794
12 Europalaces EXH FR 381,237
13 20th Century Fox Home Entertainment VID UK *372,016
14 Universal Pictures Productions RIGHTS, DISFILM, PRODFILM UK *369,154
15 Egmont Nordisk Film DISFILM, VID SWED 357,778
16 UGC EXH, DISFILM, VID, RIGHTS, PRODFILM FR 325,330
Source: European Audiovisual Observatory, 2006 Yearbook.*indicates 2004 revenues.Definitions: DISFILM = film distribution; DISTV = television distribution, RIGHTS = trade in television rights; VID = video; EXH = exhibition; PRODFILM = film production; PRODTV = television production, TV = television.
156 | UK Film Council Statistical Yearbook
From left A Very Long Engagement © 2003 Productions, Warner Bros.France, Tapioca Films and TF1 Films Production.
King Arthur, courtesy of Buena VistaHome Entertainment.
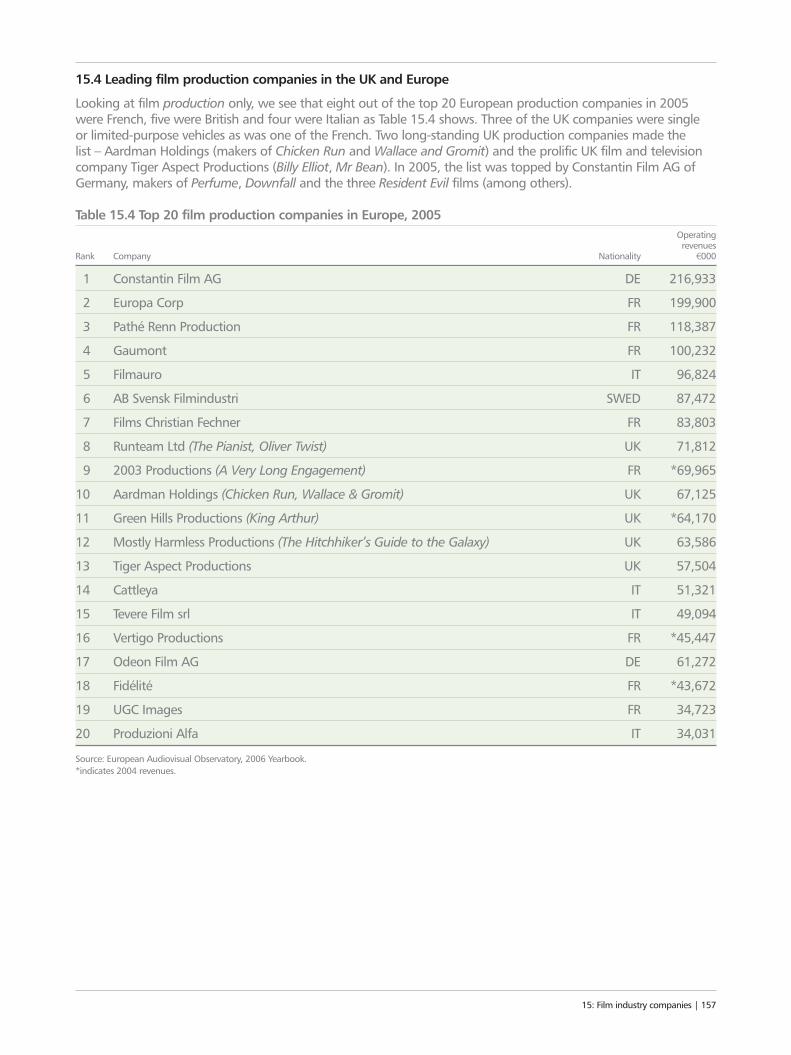
15.4 Leading film production companies in the UK and Europe
Looking at film production only, we see that eight out of the top 20 European production companies in 2005were French, five were British and four were Italian as Table 15.4 shows. Three of the UK companies were single or limited-purpose vehicles as was one of the French. Two long-standing UK production companies made the list – Aardman Holdings (makers of Chicken Run and Wallace and Gromit) and the prolific UK film and televisioncompany Tiger Aspect Productions (Billy Elliot, Mr Bean). In 2005, the list was topped by Constantin Film AG ofGermany, makers of Perfume, Downfall and the three Resident Evil films (among others).
Table 15.4 Top 20 film production companies in Europe, 2005Operating revenues
Rank Company Nationality 1000
1 Constantin Film AG DE 216,933
2 Europa Corp FR 199,900
3 Pathé Renn Production FR 118,387
4 Gaumont FR 100,232
5 Filmauro IT 96,824
6 AB Svensk Filmindustri SWED 87,472
7 Films Christian Fechner FR 83,803
8 Runteam Ltd (The Pianist, Oliver Twist) UK 71,812
9 2003 Productions (A Very Long Engagement) FR *69,965
10 Aardman Holdings (Chicken Run, Wallace & Gromit) UK 67,125
11 Green Hills Productions (King Arthur) UK *64,170
12 Mostly Harmless Productions (The Hitchhiker’s Guide to the Galaxy) UK 63,586
13 Tiger Aspect Productions UK 57,504
14 Cattleya IT 51,321
15 Tevere Film srl IT 49,094
16 Vertigo Productions FR *45,447
17 Odeon Film AG DE 61,272
18 Fidélité FR *43,672
19 UGC Images FR 34,723
20 Produzioni Alfa IT 34,031
Source: European Audiovisual Observatory, 2006 Yearbook.*indicates 2004 revenues.
15: Film industry companies | 157
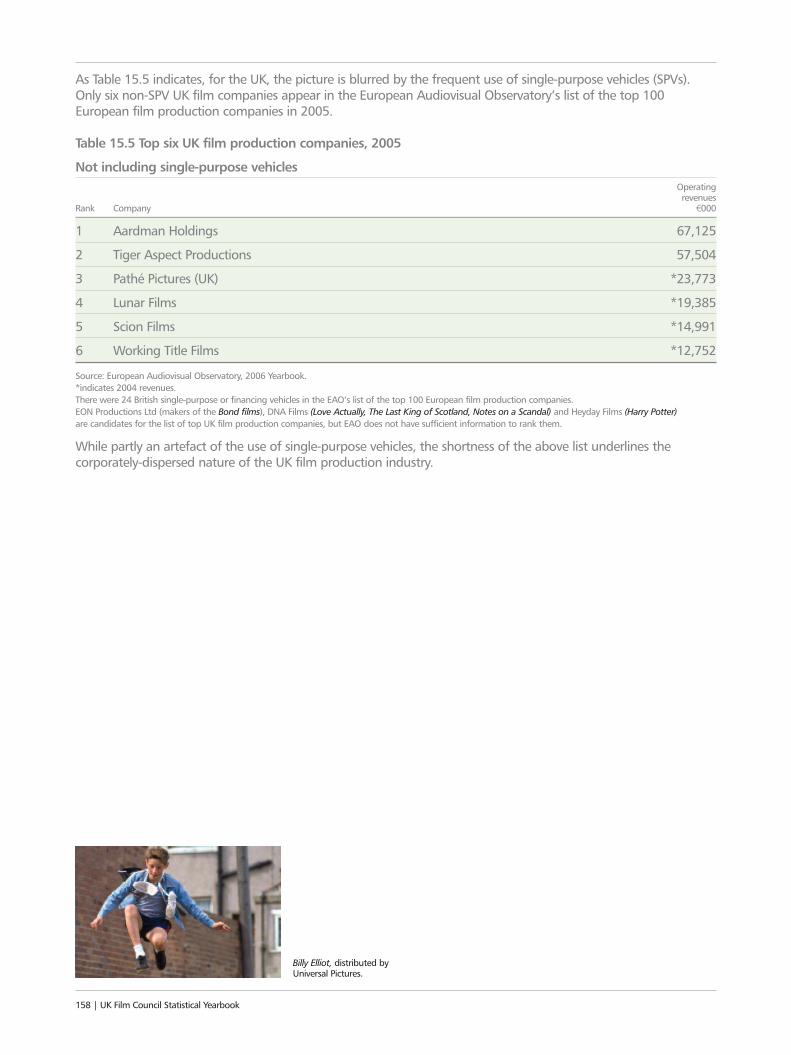
Billy Elliot, distributed by Universal Pictures.
As Table 15.5 indicates, for the UK, the picture is blurred by the frequent use of single-purpose vehicles (SPVs).Only six non-SPV UK film companies appear in the European Audiovisual Observatory’s list of the top 100European film production companies in 2005.
Table 15.5 Top six UK film production companies, 2005
Not including single-purpose vehiclesOperating revenues
Rank Company 1000
1 Aardman Holdings 67,125
2 Tiger Aspect Productions 57,504
3 Pathé Pictures (UK) *23,773
4 Lunar Films *19,385
5 Scion Films *14,991
6 Working Title Films *12,752
Source: European Audiovisual Observatory, 2006 Yearbook.*indicates 2004 revenues.There were 24 British single-purpose or financing vehicles in the EAO’s list of the top 100 European film production companies.EON Productions Ltd (makers of the Bond films), DNA Films (Love Actually, The Last King of Scotland, Notes on a Scandal) and Heyday Films (Harry Potter)are candidates for the list of top UK film production companies, but EAO does not have sufficient information to rank them.
While partly an artefact of the use of single-purpose vehicles, the shortness of the above list underlines thecorporately-dispersed nature of the UK film production industry.
158 | UK Film Council Statistical Yearbook

AboveWallace & Gromit © Aardman Animations 2007.
15: Film industry companies | 159
See also:
3 For film production company activity levels in 2006 see chapter 14 (p138)
3 For US studio involvement in UK film productionin 2006 see chapter 14 (p138)
3 For leading film distributors in the UK in 2006 see chapter 8 (p72)
3 For leading film exhibitors in the UK in 2006 see chapter 9 (p78)
3 For numbers and size distribution of filmworkplaces in 2005 see chapter 17 (p166)

16: UK FILM EXPORTSThe UK film industry is a strong exporter, earning royaltyincome from around the world, providing productionservices to overseas (particularly USA) film producersand contributing a trade surplus to the UK’s balance of payments. The size and geographical distribution of the UK’s overseas trade in film indicates where export opportunities are well developed and wherethere may be growth.
160 | UK Film Council Statistical Yearbook
“THINK ABOUT
UK film imports largelycomprise royalties to
overseas rights’ owners
The UK film industryexported £967 million
worth of services in 2005.Exports grew by 65%
between 2003 and 2005
16: UK film exports | 161
THE ROYALTIES
The USA was the largest market for UK film exports,
taking 61% in 2005
UK exports performed better in Australia and
Oceania, but wereunder-represented in Asia
Europe was the UK’s second largest export
market at 19%
The UK’s film trade surplus grew in 2005 to£163 million, the highest
for the 11 yearsunder review
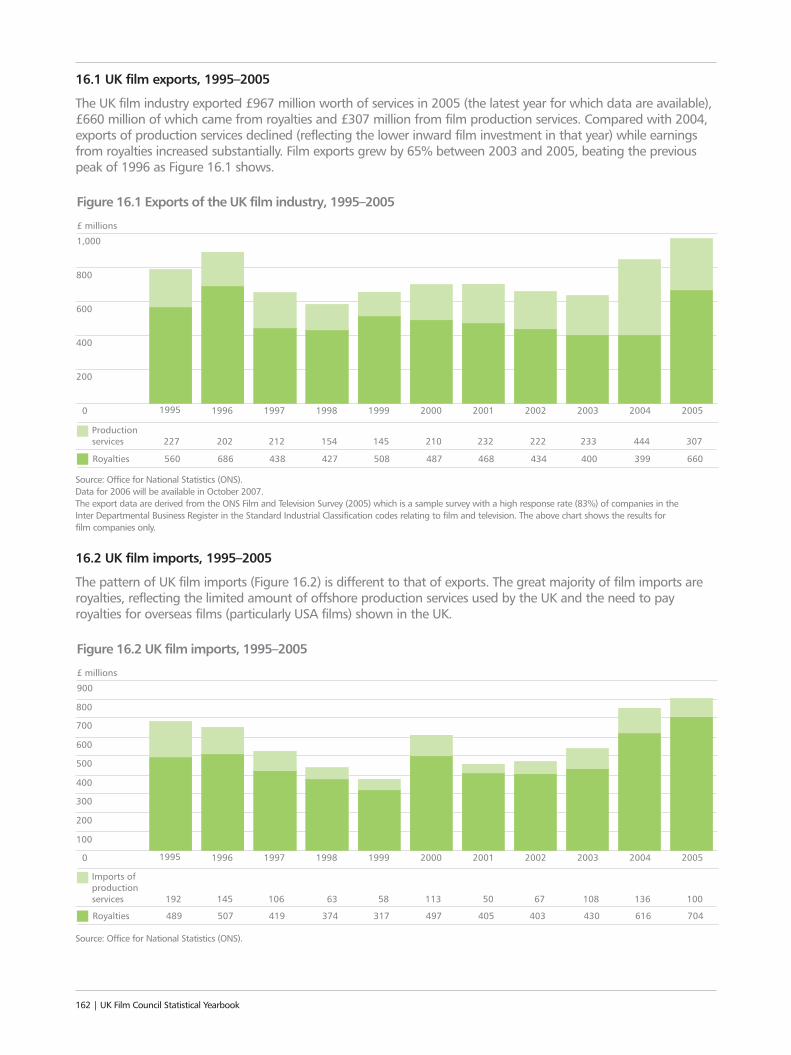
16.1 UK film exports, 1995–2005
The UK film industry exported £967 million worth of services in 2005 (the latest year for which data are available),£660 million of which came from royalties and £307 million from film production services. Compared with 2004,exports of production services declined (reflecting the lower inward film investment in that year) while earningsfrom royalties increased substantially. Film exports grew by 65% between 2003 and 2005, beating the previouspeak of 1996 as Figure 16.1 shows.
Source: Office for National Statistics (ONS). Data for 2006 will be available in October 2007.The export data are derived from the ONS Film and Television Survey (2005) which is a sample survey with a high response rate (83%) of companies in the Inter Departmental Business Register in the Standard Industrial Classification codes relating to film and television. The above chart shows the results for film companies only.
16.2 UK film imports, 1995–2005
The pattern of UK film imports (Figure 16.2) is different to that of exports. The great majority of film imports areroyalties, reflecting the limited amount of offshore production services used by the UK and the need to payroyalties for overseas films (particularly USA films) shown in the UK.
Source: Office for National Statistics (ONS).
162 | UK Film Council Statistical Yearbook
0
600
800
1,000
1995 1996 1997 1998 1999 2000 2001 2002 2003 2004 2005
£ millions
Figure 16.1 Exports of the UK film industry, 1995–2005
200
400
Production services 227 202 212 154 145 210 232 222 233 444 307
Royalties 560 686 438 427 508 487 468 434 400 399 660
0
100
500
700
800
900
1995 1996 1997 1998 1999 2000 2001 2002 2003 2004 2005
£ millions
Figure 16.2 UK film imports, 1995–2005
600
400
200
300
Imports of production services 192 145 106 63 58 113 50 67 108 136 100
Royalties 489 507 419 374 317 497 405 403 430 616 704
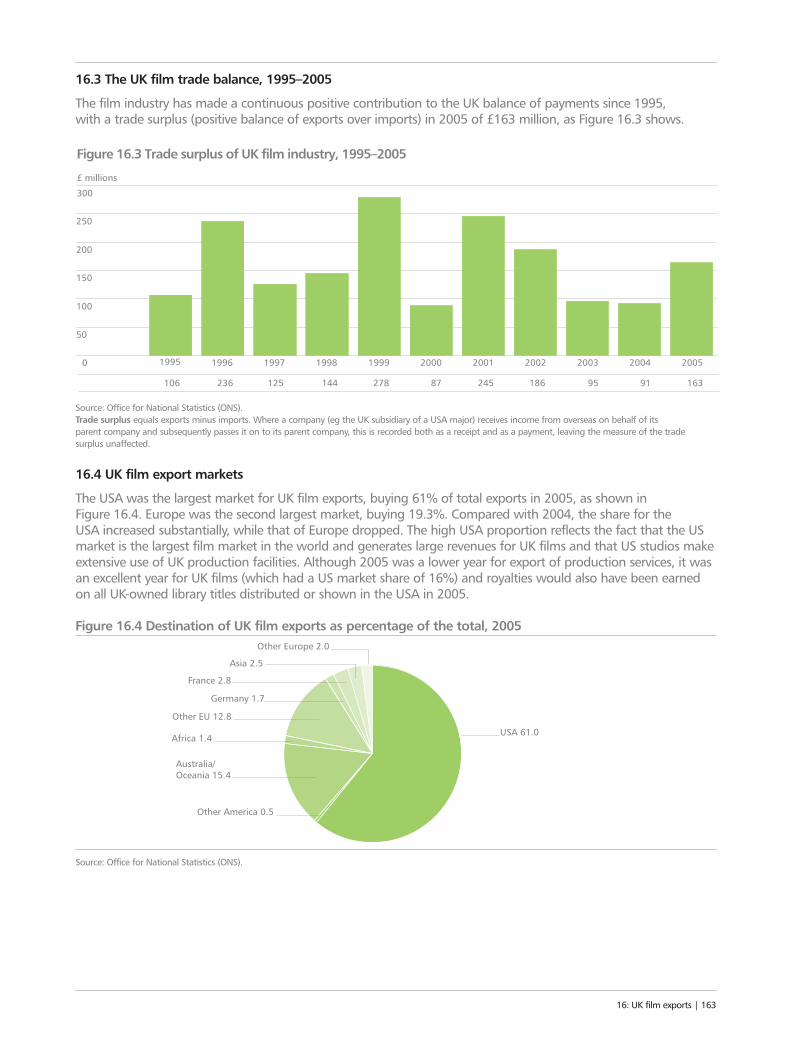
16.3 The UK film trade balance, 1995–2005
The film industry has made a continuous positive contribution to the UK balance of payments since 1995, with a trade surplus (positive balance of exports over imports) in 2005 of £163 million, as Figure 16.3 shows.
Source: Office for National Statistics (ONS).Trade surplus equals exports minus imports. Where a company (eg the UK subsidiary of a USA major) receives income from overseas on behalf of its parent company and subsequently passes it on to its parent company, this is recorded both as a receipt and as a payment, leaving the measure of the trade surplus unaffected.
16.4 UK film export markets
The USA was the largest market for UK film exports, buying 61% of total exports in 2005, as shown in Figure 16.4. Europe was the second largest market, buying 19.3%. Compared with 2004, the share for the USA increased substantially, while that of Europe dropped. The high USA proportion reflects the fact that the USmarket is the largest film market in the world and generates large revenues for UK films and that US studios makeextensive use of UK production facilities. Although 2005 was a lower year for export of production services, it wasan excellent year for UK films (which had a US market share of 16%) and royalties would also have been earnedon all UK-owned library titles distributed or shown in the USA in 2005.
Figure 16.4 Destination of UK film exports as percentage of the total, 2005
Source: Office for National Statistics (ONS).
16: UK film exports | 163
0
50
250
300
1995 1996 1997 1998 1999 2000 2001 2002 2003 2004 2005
£ millions
Figure 16.3 Trade surplus of UK film industry, 1995–2005
200
150
100
106 236 125 144 278 87 245 186 95 91 163
Other America 0.5
Africa 1.4
France 2.8
Asia 2.5
Other EU 12.8
Australia/ Oceania 15.4
Other Europe 2.0
USA 61.0
Germany 1.7
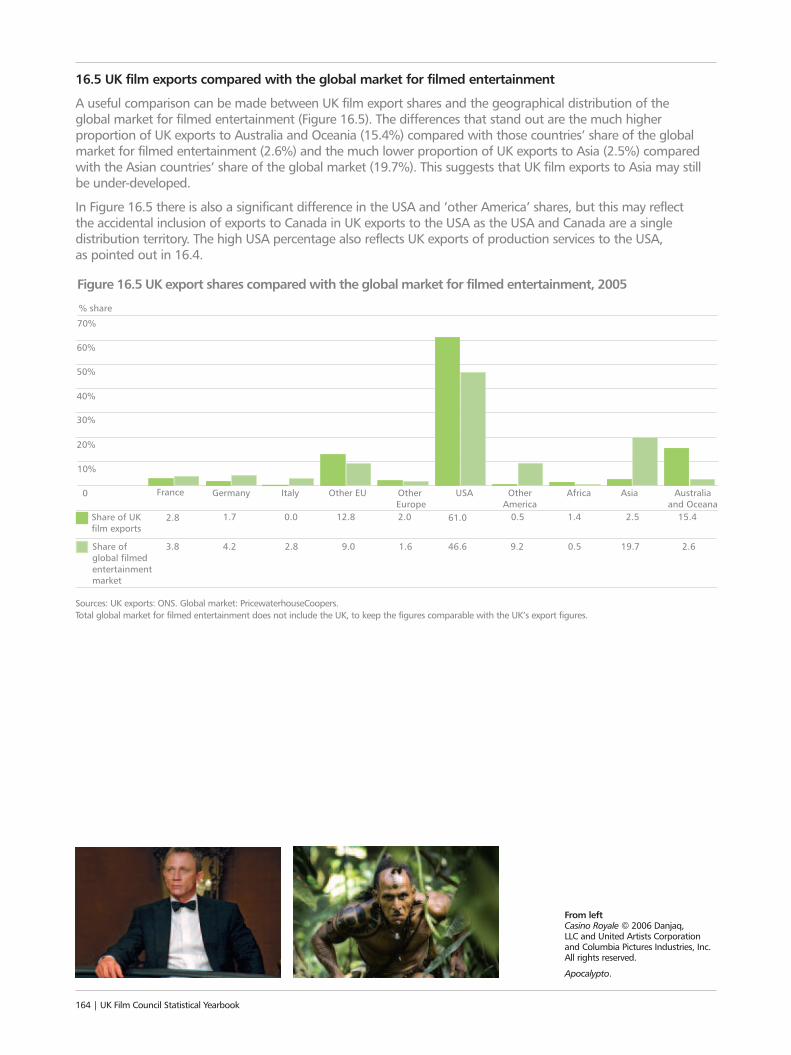
16.5 UK film exports compared with the global market for filmed entertainment
A useful comparison can be made between UK film export shares and the geographical distribution of the global market for filmed entertainment (Figure 16.5). The differences that stand out are the much higherproportion of UK exports to Australia and Oceania (15.4%) compared with those countries’ share of the globalmarket for filmed entertainment (2.6%) and the much lower proportion of UK exports to Asia (2.5%) comparedwith the Asian countries’ share of the global market (19.7%). This suggests that UK film exports to Asia may stillbe under-developed.
In Figure 16.5 there is also a significant difference in the USA and ’other America’ shares, but this may reflect the accidental inclusion of exports to Canada in UK exports to the USA as the USA and Canada are a singledistribution territory. The high USA percentage also reflects UK exports of production services to the USA, as pointed out in 16.4.
Sources: UK exports: ONS. Global market: PricewaterhouseCoopers. Total global market for filmed entertainment does not include the UK, to keep the figures comparable with the UK’s export figures.
164 | UK Film Council Statistical Yearbook
From left Casino Royale © 2006 Danjaq, LLC and United Artists Corporationand Columbia Pictures Industries, Inc.All rights reserved.
Apocalypto.
0
10%
50%
60%
70%
France Germany Italy Other EU Other Europe
USA Other America
Africa Asia Australia and Oceana
Figure 16.5 UK export shares compared with the global market for filmed entertainment, 2005
40%
20%
30%
% share
Share of UK film exports
Share of global filmed entertainment market
2.8 1.7 0.0 12.8 2.0 61.0 0.5 1.4 2.5 15.4
3.8 4.2 2.8 9.0 2.619.70.59.246.61.6
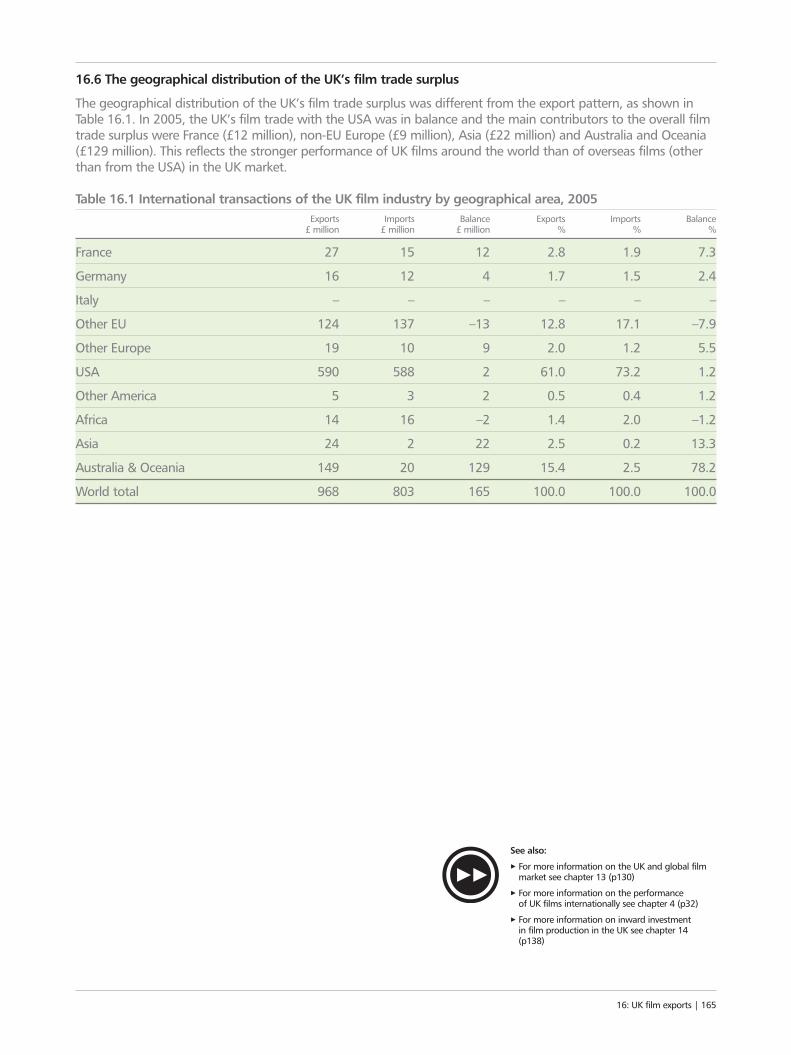
16.6 The geographical distribution of the UK’s film trade surplus
The geographical distribution of the UK’s film trade surplus was different from the export pattern, as shown inTable 16.1. In 2005, the UK’s film trade with the USA was in balance and the main contributors to the overall filmtrade surplus were France (£12 million), non-EU Europe (£9 million), Asia (£22 million) and Australia and Oceania(£129 million). This reflects the stronger performance of UK films around the world than of overseas films (otherthan from the USA) in the UK market.
Table 16.1 International transactions of the UK film industry by geographical area, 2005Exports Imports Balance Exports Imports Balance
£ million £ million £ million % % %
France 27 15 12 2.8 1.9 7.3
Germany 16 12 4 1.7 1.5 2.4
Italy – – – – – –
Other EU 124 137 –13 12.8 17.1 –7.9
Other Europe 19 10 9 2.0 1.2 5.5
USA 590 588 2 61.0 73.2 1.2
Other America 5 3 2 0.5 0.4 1.2
Africa 14 16 –2 1.4 2.0 –1.2
Asia 24 2 22 2.5 0.2 13.3
Australia & Oceania 149 20 129 15.4 2.5 78.2
World total 968 803 165 100.0 100.0 100.0
See also:
3 For more information on the UK and global filmmarket see chapter 13 (p130)
3 For more information on the performance of UK films internationally see chapter 4 (p32)
3 For more information on inward investment in film production in the UK see chapter 14(p138)
16: UK film exports | 165
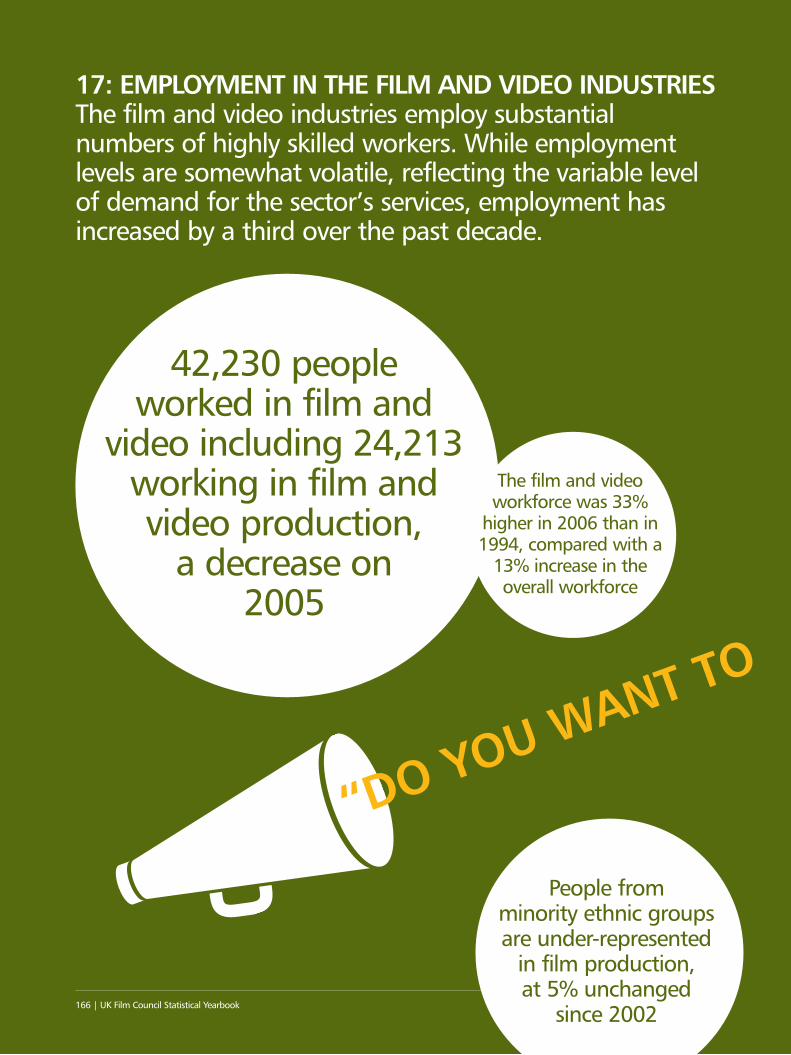
17: EMPLOYMENT IN THE FILM AND VIDEO INDUSTRIESThe film and video industries employ substantialnumbers of highly skilled workers. While employmentlevels are somewhat volatile, reflecting the variable levelof demand for the sector’s services, employment hasincreased by a third over the past decade.
166 | UK Film Council Statistical Yearbook
“DO YOU WANT TO
People from minority ethnic groupsare under-represented
in film production, at 5% unchanged
since 2002
42,230 people worked in film and
video including 24,213working in film andvideo production,
a decrease on 2005
The film and videoworkforce was 33%
higher in 2006 than in1994, compared with a
13% increase in theoverall workforce
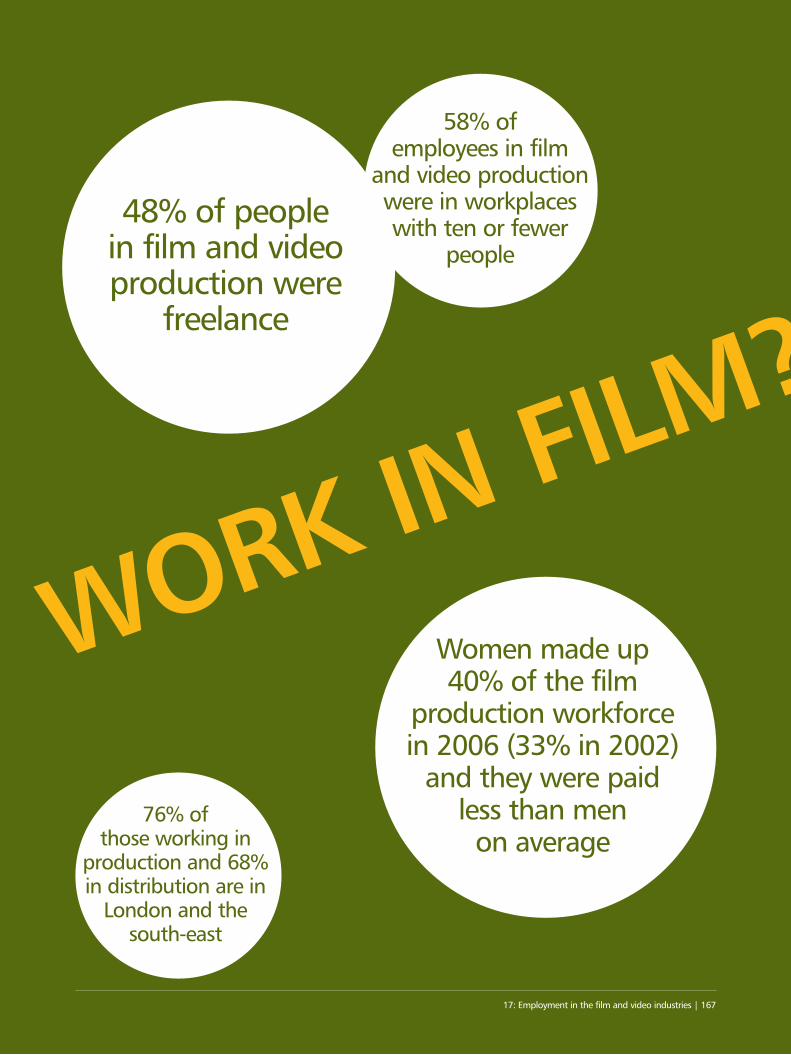
17: Employment in the film and video industries | 167
WORK IN FILM?
48% of people in film and videoproduction were
freelance
58% of employees in film
and video productionwere in workplaces with ten or fewer
people
Women made up 40% of the film
production workforce in 2006 (33% in 2002)
and they were paid less than men
on average76% of
those working inproduction and 68% in distribution are in
London and the south-east
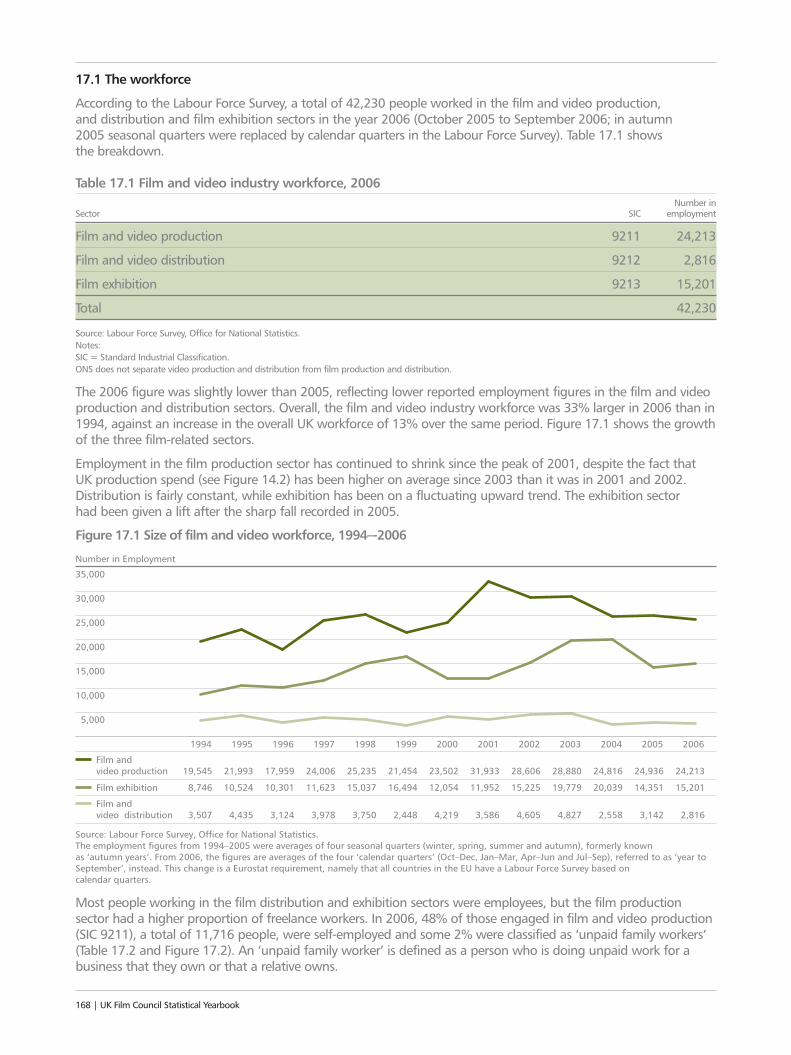
17.1 The workforce
According to the Labour Force Survey, a total of 42,230 people worked in the film and video production, and distribution and film exhibition sectors in the year 2006 (October 2005 to September 2006; in autumn 2005 seasonal quarters were replaced by calendar quarters in the Labour Force Survey). Table 17.1 shows the breakdown.
Table 17.1 Film and video industry workforce, 2006Number in
Sector SIC employment
Film and video production 9211 24,213
Film and video distribution 9212 2,816
Film exhibition 9213 15,201
Total 42,230
Source: Labour Force Survey, Office for National Statistics.Notes: SIC = Standard Industrial Classification.ONS does not separate video production and distribution from film production and distribution.
The 2006 figure was slightly lower than 2005, reflecting lower reported employment figures in the film and videoproduction and distribution sectors. Overall, the film and video industry workforce was 33% larger in 2006 than in1994, against an increase in the overall UK workforce of 13% over the same period. Figure 17.1 shows the growthof the three film-related sectors.
Employment in the film production sector has continued to shrink since the peak of 2001, despite the fact thatUK production spend (see Figure 14.2) has been higher on average since 2003 than it was in 2001 and 2002.Distribution is fairly constant, while exhibition has been on a fluctuating upward trend. The exhibition sector had been given a lift after the sharp fall recorded in 2005.
Most people working in the film distribution and exhibition sectors were employees, but the film productionsector had a higher proportion of freelance workers. In 2006, 48% of those engaged in film and video production(SIC 9211), a total of 11,716 people, were self-employed and some 2% were classified as ‘unpaid family workers’(Table 17.2 and Figure 17.2). An ‘unpaid family worker’ is defined as a person who is doing unpaid work for abusiness that they own or that a relative owns.
168 | UK Film Council Statistical Yearbook
10,000
5,000
20,000
15,000
35,000
25,000
30,000
1994 1995 1996 1997 1998 1999 2000 2001 2002 2003 2004 2005 2006
19,545 21,993 17,959 24,006 25,235 21,454 23,502 31,933 28,606 28,880 24,816 24,936 24,213
Number in Employment
Figure 17.1 Size of film and video workforce, 1994–-2006
Film and video production
3,507 4,435 3,124 3,978 3,750 2,448 4,219 3,586 4,605 4,827 2,558 3,142 2,816
Film exhibition 8,746 10,524 10,301 11,623 15,037 16,494 12,054 11,952 15,225 19,779 20,039 14,351 15,201
Film and video distribution
Source: Labour Force Survey, Office for National Statistics.The employment figures from 1994–2005 were averages of four seasonal quarters (winter, spring, summer and autumn), formerly known as ‘autumn years’. From 2006, the figures are averages of the four ‘calendar quarters’ (Oct–Dec, Jan–Mar, Apr–Jun and Jul–Sep), referred to as ‘year to September’, instead. This change is a Eurostat requirement, namely that all countries in the EU have a Labour Force Survey based on calendar quarters.
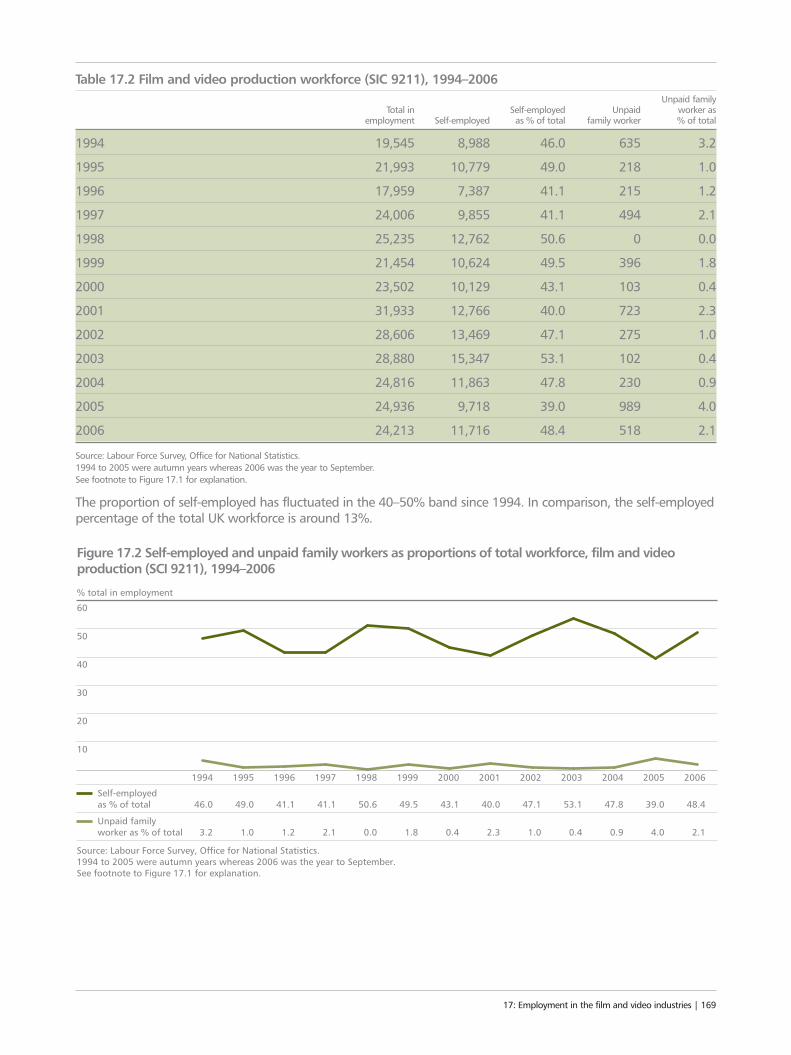
Table 17.2 Film and video production workforce (SIC 9211), 1994–2006Unpaid family
Total in Self-employed Unpaid worker as employment Self-employed as % of total family worker % of total
1994 19,545 8,988 46.0 635 3.2
1995 21,993 10,779 49.0 218 1.0
1996 17,959 7,387 41.1 215 1.2
1997 24,006 9,855 41.1 494 2.1
1998 25,235 12,762 50.6 0 0.0
1999 21,454 10,624 49.5 396 1.8
2000 23,502 10,129 43.1 103 0.4
2001 31,933 12,766 40.0 723 2.3
2002 28,606 13,469 47.1 275 1.0
2003 28,880 15,347 53.1 102 0.4
2004 24,816 11,863 47.8 230 0.9
2005 24,936 9,718 39.0 989 4.0
2006 24,213 11,716 48.4 518 2.1
Source: Labour Force Survey, Office for National Statistics.1994 to 2005 were autumn years whereas 2006 was the year to September.See footnote to Figure 17.1 for explanation.
The proportion of self-employed has fluctuated in the 40–50% band since 1994. In comparison, the self-employedpercentage of the total UK workforce is around 13%.
17: Employment in the film and video industries | 169
10
30
20
60
40
50
% total in employment
Figure 17.2 Self-employed and unpaid family workers as proportions of total workforce, film and video production (SCI 9211), 1994–2006
Source: Labour Force Survey, Office for National Statistics.1994 to 2005 were autumn years whereas 2006 was the year to September.See footnote to Figure 17.1 for explanation.
1994 1995 1996 1997 1998 1999 2000 2001 2002 2003 2004 2005 2006
46.0 49.0
3.2 1.0
41.1 41.1 50.6 49.5 43.1 40.0 47.1 53.1 47.8 39.0 48.4Self-employed as % of total
1.2 2.1 0.0 1.8 0.4 2.3 1.0 0.4 0.9 4.0 2.1Unpaid family worker as % of total
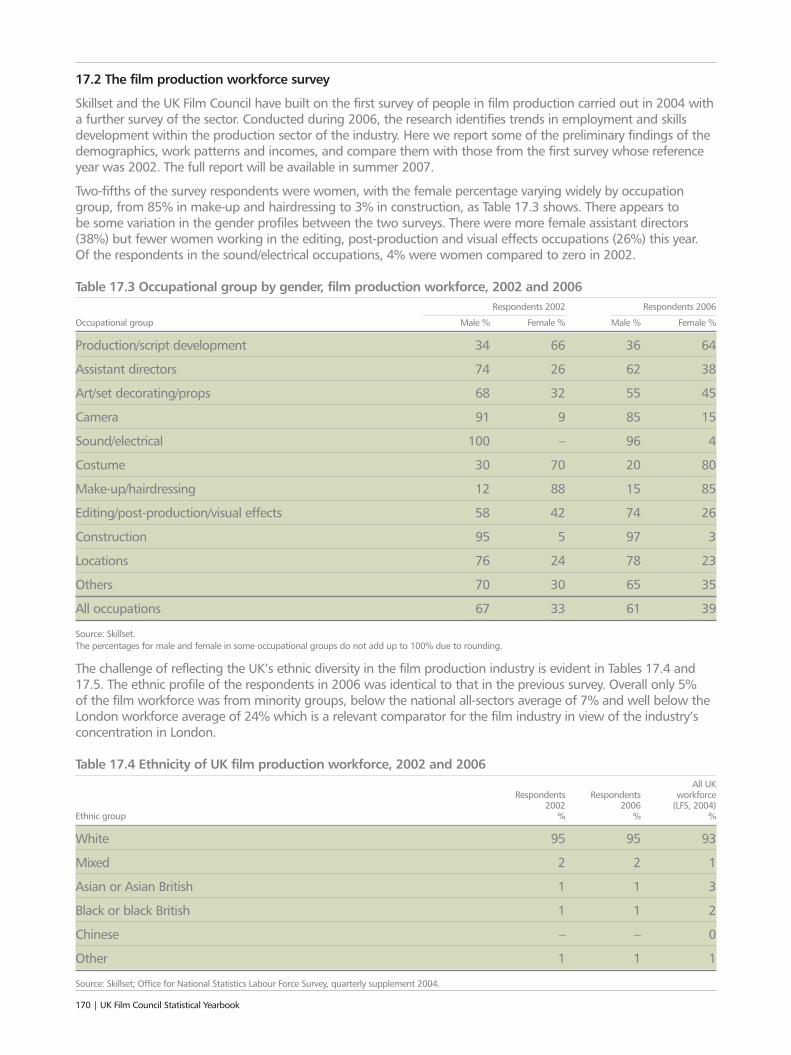
17.2 The film production workforce survey
Skillset and the UK Film Council have built on the first survey of people in film production carried out in 2004 witha further survey of the sector. Conducted during 2006, the research identifies trends in employment and skillsdevelopment within the production sector of the industry. Here we report some of the preliminary findings of thedemographics, work patterns and incomes, and compare them with those from the first survey whose referenceyear was 2002. The full report will be available in summer 2007.
Two-fifths of the survey respondents were women, with the female percentage varying widely by occupationgroup, from 85% in make-up and hairdressing to 3% in construction, as Table 17.3 shows. There appears to be some variation in the gender profiles between the two surveys. There were more female assistant directors (38%) but fewer women working in the editing, post-production and visual effects occupations (26%) this year. Of the respondents in the sound/electrical occupations, 4% were women compared to zero in 2002.
Table 17.3 Occupational group by gender, film production workforce, 2002 and 2006Respondents 2002 Respondents 2006
Occupational group Male % Female % Male % Female %
Production/script development 34 66 36 64
Assistant directors 74 26 62 38
Art/set decorating/props 68 32 55 45
Camera 91 9 85 15
Sound/electrical 100 – 96 4
Costume 30 70 20 80
Make-up/hairdressing 12 88 15 85
Editing/post-production/visual effects 58 42 74 26
Construction 95 5 97 3
Locations 76 24 78 23
Others 70 30 65 35
All occupations 67 33 61 39
Source: Skillset.The percentages for male and female in some occupational groups do not add up to 100% due to rounding.
The challenge of reflecting the UK’s ethnic diversity in the film production industry is evident in Tables 17.4 and17.5. The ethnic profile of the respondents in 2006 was identical to that in the previous survey. Overall only 5% of the film workforce was from minority groups, below the national all-sectors average of 7% and well below theLondon workforce average of 24% which is a relevant comparator for the film industry in view of the industry’sconcentration in London.
Table 17.4 Ethnicity of UK film production workforce, 2002 and 2006All UK
Respondents Respondents workforce 2002 2006 (LFS, 2004)
Ethnic group % % %
White 95 95 93
Mixed 2 2 1
Asian or Asian British 1 1 3
Black or black British 1 1 2
Chinese – – 0
Other 1 1 1
Source: Skillset; Office for National Statistics Labour Force Survey, quarterly supplement 2004.
170 | UK Film Council Statistical Yearbook
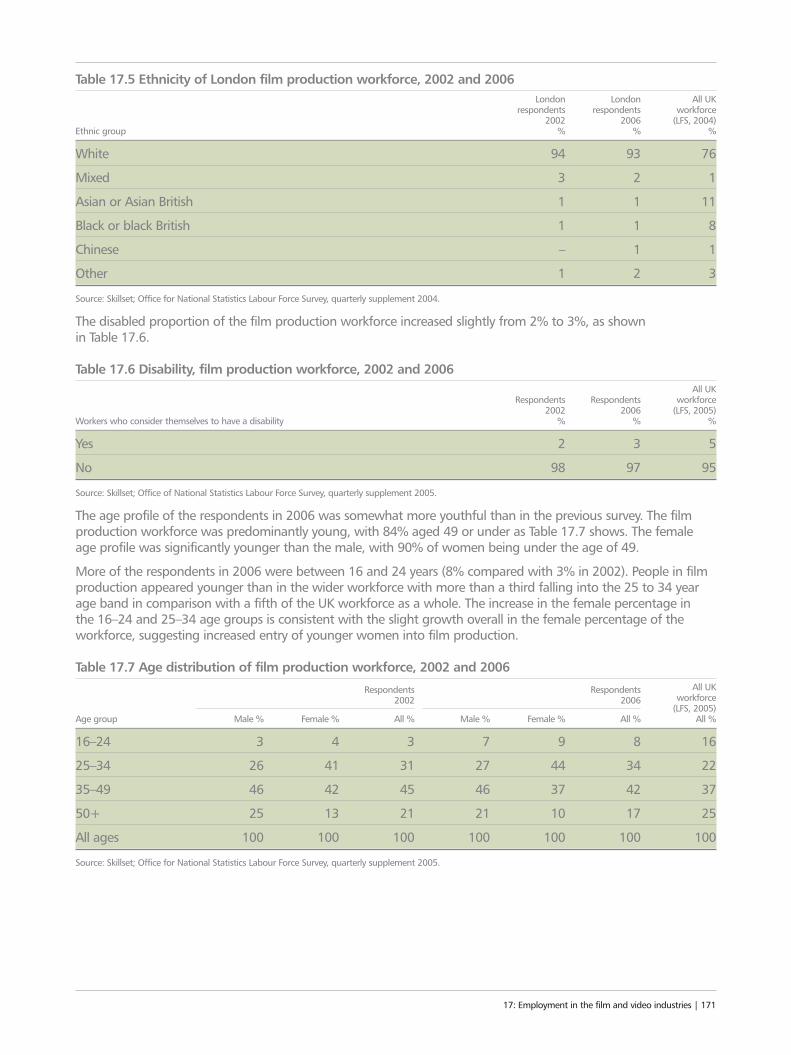
Table 17.5 Ethnicity of London film production workforce, 2002 and 2006London London All UK
respondents respondents workforce 2002 2006 (LFS, 2004)
Ethnic group % % %
White 94 93 76
Mixed 3 2 1
Asian or Asian British 1 1 11
Black or black British 1 1 8
Chinese – 1 1
Other 1 2 3
Source: Skillset; Office for National Statistics Labour Force Survey, quarterly supplement 2004.
The disabled proportion of the film production workforce increased slightly from 2% to 3%, as shown in Table 17.6.
Table 17.6 Disability, film production workforce, 2002 and 2006All UK
Respondents Respondents workforce 2002 2006 (LFS, 2005)
Workers who consider themselves to have a disability % % %
Yes 2 3 5
No 98 97 95
Source: Skillset; Office of National Statistics Labour Force Survey, quarterly supplement 2005.
The age profile of the respondents in 2006 was somewhat more youthful than in the previous survey. The filmproduction workforce was predominantly young, with 84% aged 49 or under as Table 17.7 shows. The femaleage profile was significantly younger than the male, with 90% of women being under the age of 49.
More of the respondents in 2006 were between 16 and 24 years (8% compared with 3% in 2002). People in filmproduction appeared younger than in the wider workforce with more than a third falling into the 25 to 34 yearage band in comparison with a fifth of the UK workforce as a whole. The increase in the female percentage in the 16–24 and 25–34 age groups is consistent with the slight growth overall in the female percentage of theworkforce, suggesting increased entry of younger women into film production.
Table 17.7 Age distribution of film production workforce, 2002 and 2006All UK Respondents Respondents
workforce 2002 2006(LFS, 2005)
Age group Male % Female % All % Male % Female % All % All %
16–24 3 4 3 7 9 8 16
25–34 26 41 31 27 44 34 22
35–49 46 42 45 46 37 42 37
50+ 25 13 21 21 10 17 25
All ages 100 100 100 100 100 100 100
Source: Skillset; Office for National Statistics Labour Force Survey, quarterly supplement 2005.
17: Employment in the film and video industries | 171
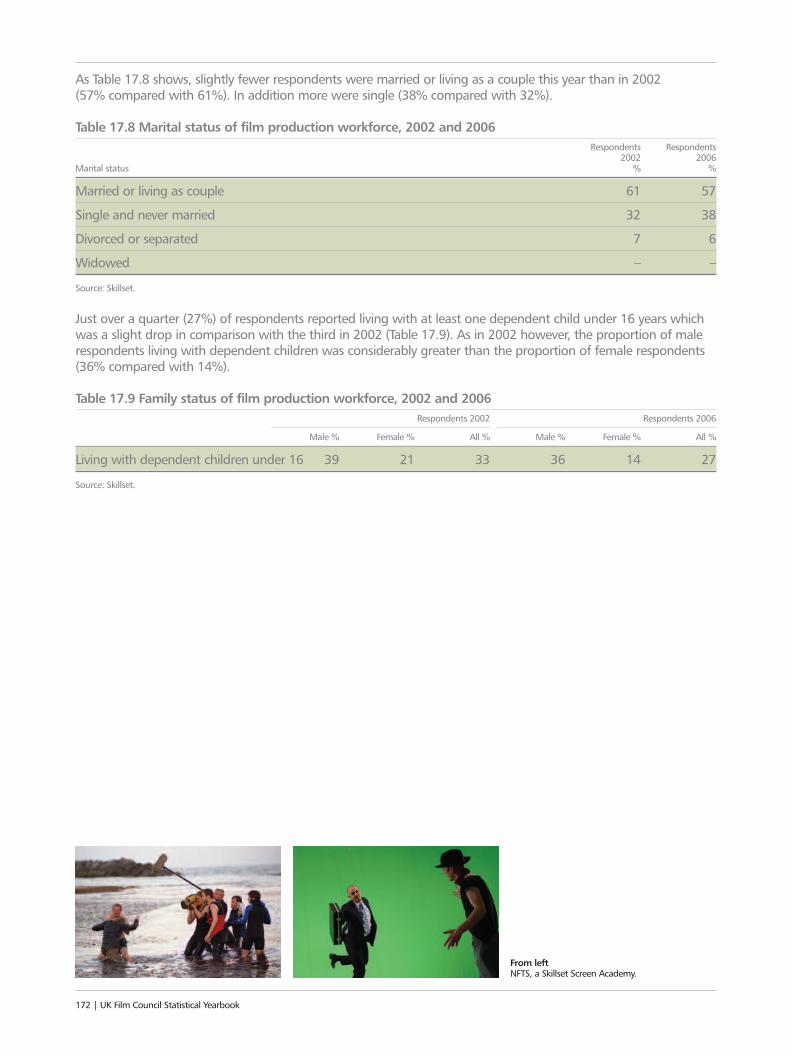
As Table 17.8 shows, slightly fewer respondents were married or living as a couple this year than in 2002 (57% compared with 61%). In addition more were single (38% compared with 32%).
Table 17.8 Marital status of film production workforce, 2002 and 2006Respondents Respondents
2002 2006Marital status % %
Married or living as couple 61 57
Single and never married 32 38
Divorced or separated 7 6
Widowed – –
Source: Skillset.
Just over a quarter (27%) of respondents reported living with at least one dependent child under 16 years whichwas a slight drop in comparison with the third in 2002 (Table 17.9). As in 2002 however, the proportion of malerespondents living with dependent children was considerably greater than the proportion of female respondents(36% compared with 14%).
Table 17.9 Family status of film production workforce, 2002 and 2006Respondents 2002 Respondents 2006
Male % Female % All % Male % Female % All %
Living with dependent children under 16 39 21 33 36 14 27
Source: Skillset.
172 | UK Film Council Statistical Yearbook
From left NFTS, a Skillset Screen Academy.
All respondents were asked to indicate the total gross income they had received from feature film work duringthe 12 months preceding the survey. Table 17.10 shows that, in 2006, one in 10 (9%) had earned £75,000 ormore and the same percentage (9%) had received between £50,000 and £74,999. By far the most common rangeof income from feature film work reported however was under £20,000 and this was the experience of almosthalf (47%) the respondents. In 2002 as many as one in 10 respondents (10%) reported that they had not receivedany income from feature film work, and this improved to just 2% of the 2006 respondents.
Table 17.10 Distribution of gross income from feature film work, 2002 and 2006Respondents 2002 Respondents 2006
Male % Female % All % Male % Female % All %
No income from feature film work in past year 8 14 10 2 2 2
£1–£19,999 31 45 36 45 50 47
£20,000–£29,999 15 11 14 13 14 13
£30,000–£39,999 15 10 13 12 14 13
£40,000–£49,999 11 8 9 9 6 8
£50,000–£74,999 11 10 11 11 7 9
£75,000 or more 9 3 7 9 7 9
100 100 100 100 100 100
Source: Skillset.
Slightly more male than female respondents fell into higher income brackets with a fifth (20%) of malerespondents earning £50,000 or more in comparison with 14% of the women. On the whole however, genderdifferences in feature film incomes appear to have reduced since the 2004 survey, with women becomingrelatively more numerous in the £20,000–£39,999 and £75,000+ bands. The proportion of very low-paid men (under £20,000) increased between 2002 and 2006.
17: Employment in the film and video industries | 173
Skillset Screen Academy at LondonCollege of Communications (LLC) & Ealing Institute of Media (EIM).
Table 17.11 shows the distribution of weekly rates paid for feature film work. As in 2002 women tended to report lower weekly rates than men. For example a third of the female respondents in 2006 received under £800 per week in comparison with a fifth (21%) of male respondents, while a fifth (21%) received the higher rate of £1,400 per week or more in comparison with a third (33%) of male respondents.
Table 17.11 Weekly rates for feature film work, 2002 and 2006Respondents 2002 Respondents 2006
Weekly rate Male % Female % All % Male % Female % All %
Less than £400 per week 4 7 5 9 12 10
£400–£599 per week 4 6 5 6 11 8
£600–£799 per week 6 15 9 6 10 8
£800–£999 per week 16 13 15 16 15 16
£1,000–£1,199 per week 15 15 15 17 17 17
£1,200–£1,399 per week 11 14 12 13 15 14
£1,400–£1,599 per week 14 11 13 11 7 9
£1,600–£1,799 per week 6 4 5 5 4 5
£1,800 or more per week 24 14 21 17 10 14
Source: Skillset.The high weekly rates paid to most people in the industry reflect, among other things, the long working hours involved in film production. A working weektypically consists of six days, with an average day of 11 hours.
More results from the feature film production workforce survey will be available in the full report of the surveydue to be published in summer 2007 (see www.skillset.org).
17.3 The workplace location
The film production and distribution sectors are concentrated in London and the South East, as shown in Table17.12. In contrast, the London and South East share of the exhibition sector workforce is closer to the UK average.
Table 17.12 London and South East employment as percentage of total, 2006London and
London and South East Total UK South East as % of
Sector SIC employment employment UK total
UK all industries All 28,308,801 7,605,938 26.9
Film and video production 9211 24,213 18,397 76.0
Film and video distribution 9212 2,816 1,924 68.3
Film exhibition 9213 15,201 4,414 29.0
Source: Labour Force Survey, Office for National Statistics. The South East region wraps around London to include the major studios to the west of London.Figures shown in this table are averages of the four calendar quarters from October 2005 to September 2006.
The London and South East share of the film and video production workforce (SIC 9211) was 76% in the year toSeptember 2006, closer to its long-term average than the low 2004 figures of 50.7% which may have been dueto statistical error arising from the small size of the Labour Force Survey at industry sub-sector level. Figure 17.3suggests that the share of the film and video production workforce in London and the South East is reverting tothe higher level of the late 1990s.
174 | UK Film Council Statistical Yearbook
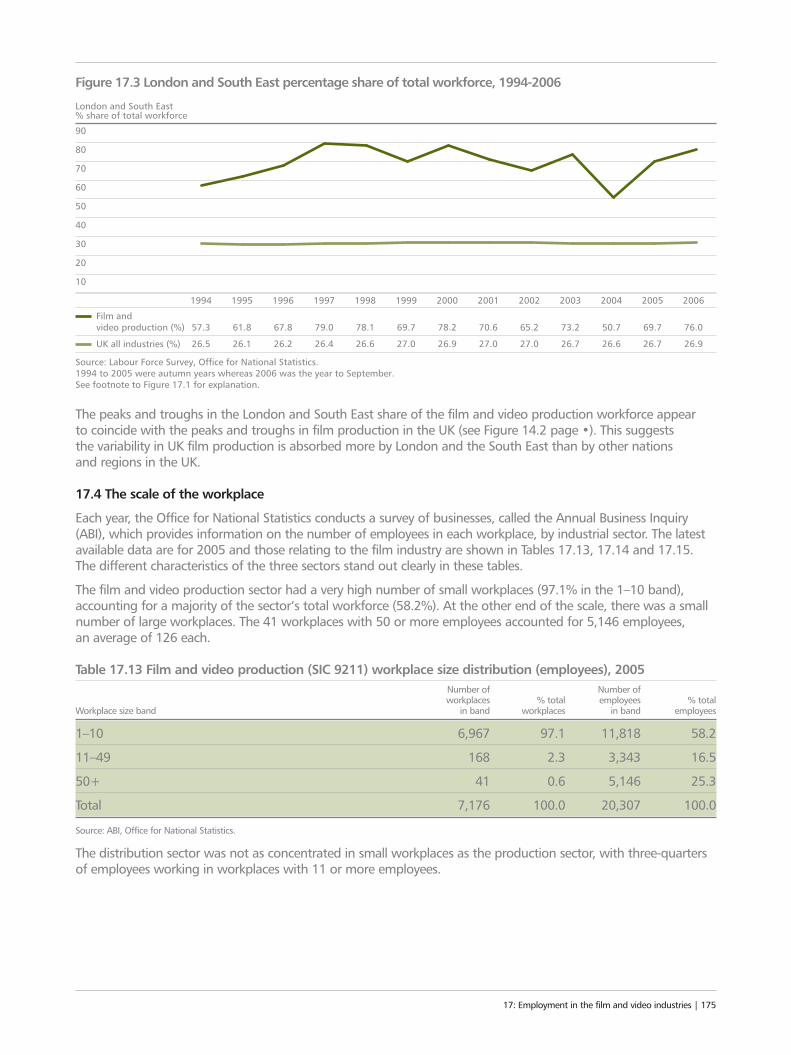
The peaks and troughs in the London and South East share of the film and video production workforce appear to coincide with the peaks and troughs in film production in the UK (see Figure 14.2 page •). This suggests the variability in UK film production is absorbed more by London and the South East than by other nations and regions in the UK.
17.4 The scale of the workplace
Each year, the Office for National Statistics conducts a survey of businesses, called the Annual Business Inquiry(ABI), which provides information on the number of employees in each workplace, by industrial sector. The latestavailable data are for 2005 and those relating to the film industry are shown in Tables 17.13, 17.14 and 17.15. The different characteristics of the three sectors stand out clearly in these tables.
The film and video production sector had a very high number of small workplaces (97.1% in the 1–10 band),accounting for a majority of the sector’s total workforce (58.2%). At the other end of the scale, there was a smallnumber of large workplaces. The 41 workplaces with 50 or more employees accounted for 5,146 employees, an average of 126 each.
Table 17.13 Film and video production (SIC 9211) workplace size distribution (employees), 2005Number of Number of workplaces % total employees % total
Workplace size band in band workplaces in band employees
1–10 6,967 97.1 11,818 58.2
11–49 168 2.3 3,343 16.5
50+ 41 0.6 5,146 25.3
Total 7,176 100.0 20,307 100.0
Source: ABI, Office for National Statistics.
The distribution sector was not as concentrated in small workplaces as the production sector, with three-quartersof employees working in workplaces with 11 or more employees.
17: Employment in the film and video industries | 175
10
30
20
90
80
50
40
70
60
London and South East% share of total workforce
Figure 17.3 London and South East percentage share of total workforce, 1994-2006
Source: Labour Force Survey, Office for National Statistics.1994 to 2005 were autumn years whereas 2006 was the year to September.See footnote to Figure 17.1 for explanation.
1994 1995 1996 1997 1998 1999 2000 2001 2002 2003 2004 2005 2006
57.3 61.8
26.5 26.1
67.8 79.0 78.1 69.7 78.2 70.6 65.2 73.2 50.7 69.7 76.0Film and video production (%)
26.2 26.4 26.6 27.0 26.9 27.0 27.0 26.7 26.6 26.7 26.9UK all industries (%)
Table 17.14 Film and video distribution (SIC 9212) workplace size distribution (employees), 2005Number of Number of workplaces % total employees % total
Workplace size band in band workplaces in band employees
1–10 445 89.7 1,178 25.5
11+ 51 10.3 3,444 74.5
Total 496 100.0 4,622 100.0
Source: ABI, Office for National Statistics.
Workplace numbers for bands above 11 employees cannot be published for confidentiality reasons (too fewworkplaces in the bands). 59% of distribution employees worked in workplaces of 50 employees or more. There was a small number of workplaces in the 200–plus employee size range.
The exhibition sector had a concentration that was the reverse of the production sector with 57% of employees in workplaces of 50 or more, and only 4% in workplaces in the 1–10 employee band.
Table 17.15 Film exhibition (SIC 9213) workplace size distribution (employees), 2005Number of Number of workplaces % total employees % total
Workplace size band in band workplaces in band employees
1–10 180 31.5 650 3.6
11–49 241 42.2 7,126 39.8
50+ 150 26.3 10,122 56.6
Total 571 100.0 17,898 100.0
Source: ABI, Office for National Statistics.
The declining trend in the proportion of employment in workplaces with 50 or more employees in the film and video production sector (SIC 9211) in the early part of the last decade has been reversed in recent years. In contrast the rapid growth in the proportion of employment in workplaces with 1–10 employees from 1995 has slowed and reached a level of just below 60% of the sector as a whole in 2005
176 | UK Film Council Statistical Yearbook
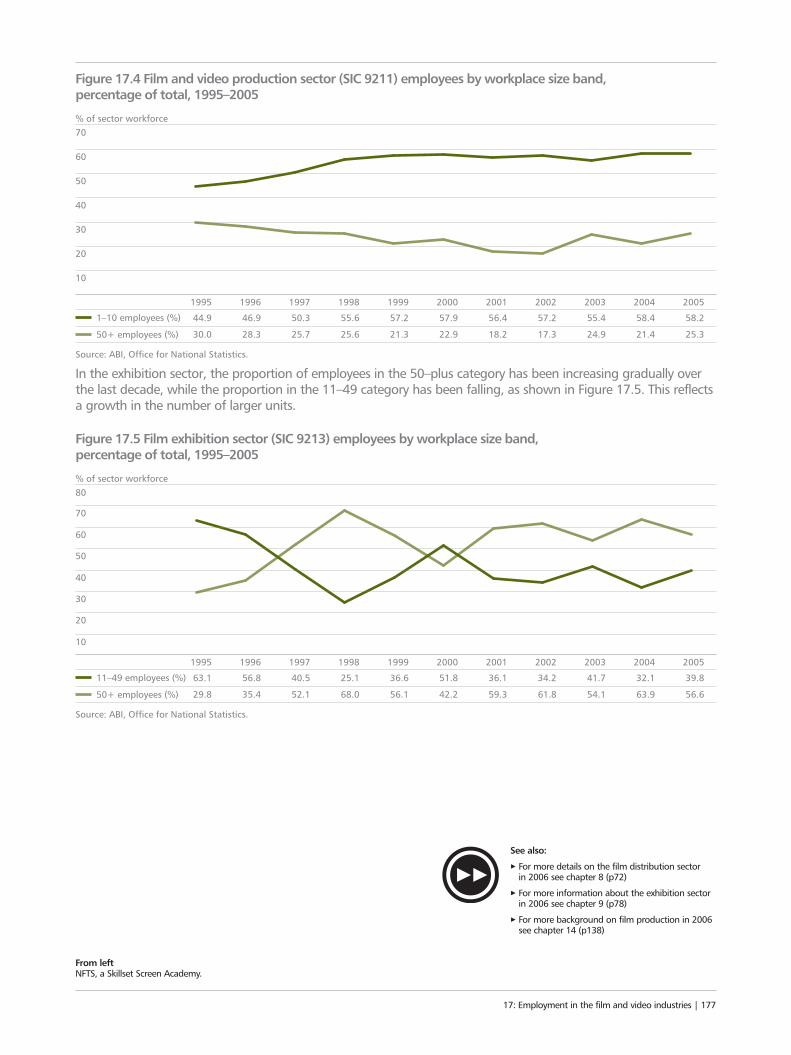
In the exhibition sector, the proportion of employees in the 50–plus category has been increasing gradually overthe last decade, while the proportion in the 11–49 category has been falling, as shown in Figure 17.5. This reflectsa growth in the number of larger units.
From left NFTS, a Skillset Screen Academy.
17: Employment in the film and video industries | 177
10
30
20
70
50
40
60
% of sector workforce
Figure 17.4 Film and video production sector (SIC 9211) employees by workplace size band, percentage of total, 1995–2005
Source: ABI, Office for National Statistics.
1995 1996 1997 1998 1999 2000 2001 2002 2003 2004 2005
44.9 46.9
30.0 28.3
50.3 55.6 57.2 57.9 56.4 57.2 55.4 58.4 58.21–10 employees (%)
25.7 25.6 22.921.3 18.2 17.3 24.9 21.4 25.350+ employees (%)
10
30
20
80
50
40
60
70
% of sector workforce
Figure 17.5 Film exhibition sector (SIC 9213) employees by workplace size band, percentage of total, 1995–2005
1995 1996 1997 1998 1999 2000 2001 2002 2003 2004 2005
63.1 56.8
29.8 35.4
40.5 25.1 36.6 51.8 36.1 34.2 41.7 32.1 39.811–49 employees (%)
52.1 68.0 42.256.1 59.3 61.8 54.1 63.9 56.650+ employees (%)
Source: ABI, Office for National Statistics.
See also:
3 For more details on the film distribution sector in 2006 see chapter 8 (p72)
3 For more information about the exhibition sectorin 2006 see chapter 9 (p78)
3 For more background on film production in 2006see chapter 14 (p138)
Glossary
Asian programming Films originating from South Asia, for exampleBollywood, and generally, though not exclusively, aimed at a South Asian audience and in a South Asian language
BAFTA British Academy of Film and Television Arts
BARBBroadcasters’ Audience Research Board Ltd. The company that compiles audience figures for UK television (www.barb.co.uk)
BBFCBritish Board of Film Classification. Independent body responsible for classifying films and video (see Film certificate) (www.bbfc.org.uk)
Box officeTotal value of ticket sales for a film screenedcommercially at cinemas
Box office grossBox office takings before deduction of Value Added Tax (VAT)
BVABritish Video Association. The trade body representingthe interests of publishers and rights owners of pre-recorded home entertainment on video(www.bva.org.uk)
CAACinema Advertising Association. The trade associationof cinema advertising contractors operating in the UK and Eire
Concession revenueRevenue from sales of food, drink and merchandise at cinemas
Co-productionA film made by companies from more than one country, often under the terms of a bilateral co-production treaty or the European Convention on Cinematographic Co-Production
Country of originThe nationality of a film. In the case of co-productions,this may include more than one country
DCMSDepartment for Culture, Media and Sport. The UK FilmCouncil’s sponsoring department
Digital Cinema InitiativesDigital Cinema Initiatives, LLC (DCI) was created inMarch 2002 and is a joint venture of Disney, Fox,Paramount, Sony Pictures, Universal and Warner Bros.DCI’s primary purpose is to establish and documentvoluntary specifications for an open architecture fordigital cinema that ensures a uniform and high level of technical performance, reliability and quality control(www.dcimovies.com)
DLP CinemaDLP Cinema is the trademark of Texas Instruments’digital projection system. ’DLP‘ stands for ’digital light processing’
Digital projectionThe projection of a film onto a cinema screen using a digital master and a digital projector, that is usingelectronic signals to direct light onto the screen ratherthan passing light through a celluloid strip
DistributorA person or company that acquires the right to exploitthe commercial and creative values of a film in thetheatrical, video and TV market. Also conducts thepromotional and marketing activities necessary toattract audiences to the film
DVDDigital versatile disc
ExhibitorA cinema operator that rents a film from a distributorto show to a cinema audience
Feature film A film made for cinema release, as opposed to a film made for television, and usually of at least 80 minutes duration
Film certificateClassification given to a film by the British Board of Film Classification. Indicates the film’s suitability for audiences according to their age
Film rentalThe sum of money paid to the distributor by theexhibitor in return for the right to show a particularfilm. Usually calculated as a percentage of net box office
FranchiseA film series such as Harry Potter and the Philosopher’sStone, The Lord of the Rings, or the James Bond films
178 | UK Film Council Statistical Yearbook
GenreA style or category of film defined on the basis ofcommon story and cinematic conventions (for exampleaction, crime, romantic comedy, drama, etc)
Government office regionsClassification of English regions used to establish theboundaries of the Regional Development Agencies andthe Regional Screen Agencies
Inward featuresA term used by the UK Film Council to denote a filmwhere more than 50% of the total financing is fromoutside the UK and where the production is attractedto the UK by the UK’s filmmaking infrastructure or locations
ISBA TV regionsSystem for classifying regions developed by theIncorporated Society of British Advertisers for use by the advertising industry
Mainstream programmingCategory of films aimed at the general audience
Megaplex siteDefined by Dodona Research as a purpose-builtcinema with 20 or more screens
Multiplex siteDodona Research defines a multiplex as a purpose-built cinema with five or more screens
Net box officeBox office takings after deduction of VAT
Multi-channel televisionDigital television programming carried by satellite, cable or freeview delivery systems, in this caseexcluding the five main network channels (BBC1,BBC2, ITV1, Channel 4 and Five)
Online rentalSelecting and renting DVDs via a website for postal delivery
ONSOffice for National Statistics
Out of town cinemaCinema located on the outskirts of a town, typically in a large shopping development
Pay-per-viewA system in which television viewers purchaseindividual films to view. The film is shown at the sametime to everyone ordering it, as opposed to video ondemand, which allows the viewers to see the film atany time. Films can be purchased via on-screen guide,automated telephone or customer services line
Standard Industrial Classification (SIC)A numbering system used by the Office for NationalStatistics to identify different industries in the UK’sofficial statistics
SitesIndividual cinema premises
Socio-economic groupSection of the population defined by employment status
Specialised programmingGenerally, non-mainstream films. This category includes foreign-language and sub-titled films, art-house productions and films aimed at niche audiences
Terrestrial televisionThe five main analogue free-to-air channels: BBC1, BBC2, ITV1, Channel 4 and Five
Traditional cinemaA cinema generally with fewer than five screens andthat shows more mainstream product. Often an olderbuilding located in city centres or suburbs
Video on Demand (VOD)A VOD system allows users to select and watch films at the time they want over a network as part of aninteractive television system. VOD systems enable theuser to download films to own or rent before viewingstarts or to stream content to be viewed in real time
Glossary | 179
AcknowledgementsWe would like to thank the following organisations for kindly allowing us to reproduce their data:Attentional Ltd (formerly David Graham and Associates(DGA) Ltd)Broadcasters’ Audience Research Board Ltd (BARB)British Board of Film Classification (BBFC)British Federation of Film Societies (BFFS)British Market Research Bureau (BMRB)British Video Association (BVA)Cinema Advertising Association (CAA)Department for Culture Media and Sport (DCMS)Dodona ResearchEuropean Audiovisual Observatory (EAO)Motion Picture Association of America (MPAA)MRIBNielsen EDINielsen Media ResearchOffice for National Statistics (ONS)Official UK Charts CompanyPricewaterhouseCoopersScreen DigestSkillsetTNSPlease note that nothing in this Yearbook may be reproduced in any form without prior permissionfrom the authors or copyright owners.
Sources
Chapters 1 to 10: Films, audiences and talent• Nielsen EDI, weekly UK box office reports• Nielsen EDI, weekly US box office reports• Independent Film and Television Alliance (IFTA),
international box office reports• Cinetel (Italy), box office reports• Kogyo Tsushinsha (Japan), box office reports• Motion Picture Association of America,
US admissions report• European Audiovisual Observatory Lumiere
Database• Department for Culture, Media and Sport, list of
UK qualifying films• Dodona Research, Cinema-going 16, March 2007
• Screen Digest, digital screen numbers• British Board of Film Classification (BBFC), database
of film classifications• British Federation of Film Societies, Cinema for
All membership survey, 2006• Nielsen Media Research, monthly media
spend reports• Cinema Advertising Association, Cinema and Video
Industry Audience Research (CAVIAR) survey, 2006 Quarterly Reports and FAME: Film AudienceMeasurement and Evaluation, December 2006
• TNS, Disability and ethnicity groups within visualentertainments, 52 weeks ending 7 January 2007
• Variety, Top Worldwide Grossers 2006,15–21 January 2007
Chapters 11 and 12: Films on video/DVD andtelevision• British Video Association, BVA Yearbook 2007• MRIB, Rental Monitor weekly report• Official UK Charts Company, video charts• Broadcasters’ Audience Research Board, Television
Audience Measurement Service• Attentional Ltd (formerly David Graham
and Associates Ltd), database of film on UKtelevision, 2006
Chapters 13 to 17: The UK film industry and UK film workforceSources from previous chapters, plus:• PricewaterhouseCoopers, Global Entertainment
and Media Outlook 2006–2010, 2006• IPSOS & BVA film theft research group, Digital and
Physical Piracy in GB, Wave 4, November 2006,March 2007
• European Audiovisual Observatory, 2006 Yearbook,Volume 3
• Office for National Statistics, Annual BusinessInquiry, 2005
• Office for National Statistics, Labour Force Survey,Quarterly to September 2006
• Office for National Statistics, 2005 Film andTelevision Survey, October 2006
• Office for National Statistics, Size Analysis of UK Businesses 2005 (VAT data)
• Skillset, Film production workforce survey,March 2007
180 | UK Film Council Statistical Yearbook Acknowledgements

Designed and produced by Radley Yeldar (London)
The UK Film Council is the Government-backed leadagency for film in the UK ensuring that the economic,cultural and educational aspects of film are effectivelyrepresented at home and abroad. Our goal is to helpmake the UK a global hub for film in the digital age,with the world’s most imaginative, diverse and vibrantfilm culture, underpinned by a flourishing, competitivefilm industry.
We invest Government Grant-in-aid and Lottery moneyin developing new filmmakers, in funding exciting newBritish films and in getting a wider choice of films toaudiences throughout the UK. We also invest intraining, promoting Britain as an internationalfilmmaking location and in raising the profile of British films abroad.
We aim to deliver lasting benefits to the industry andthe public through:
Creativity – encouraging the development of newtalent, skills, and creative and technological innovationin UK film and assisting new and establishedfilmmakers to produce successful and distinctive British films;
Enterprise – supporting the creation and growth ofsustainable businesses in the film sector, providingaccess to finance and helping the UK film industrycompete successfully in the domestic and globalmarketplace;
Imagination – promoting education and anappreciation and enjoyment of cinema by giving UKaudiences access to the widest range of UK andinternational cinema, and by supporting film cultureand heritage.
We want to ensure there are no barriers to accessingour printed materials. If you, or someone you know,would like a large print, Braille, disc or audiotapeversion of this report, please contact ourCommunications Department at the following address:
UK Film Council10 Little Portland StreetLondon W1W 7JG
T +44 (0)20 7861 7861F +44 (0)20 7861 [email protected]
www.ukfilmcouncil.org.uk

UK Film Council10 Little Portland StreetLondon W1W 7JGT +44 (0)20 7861 7861F +44 (0)20 7861 7862
This Statistical Yearbook is available online atwww.ukfilmcouncil.org.uk
“IT’S AWRAP”
STATISTICAL YEARBOOK2006/07
“ANDACTION”
UK
FILMCO
UN
CILSTATISTIC
AL
YEARBO
OK
2006/07