Embed Size (px)
Citation preview
UBS Australian FinancialServices Conference
BANKING INSURANCE INVESTMENT
23 June 2004
2
• Key Success Drivers
- Unique Business Model
- Diversified Financial Services Strategy
- Proven Execution Capability
- Performance Culture
• The Future
• Questions
Agenda
3
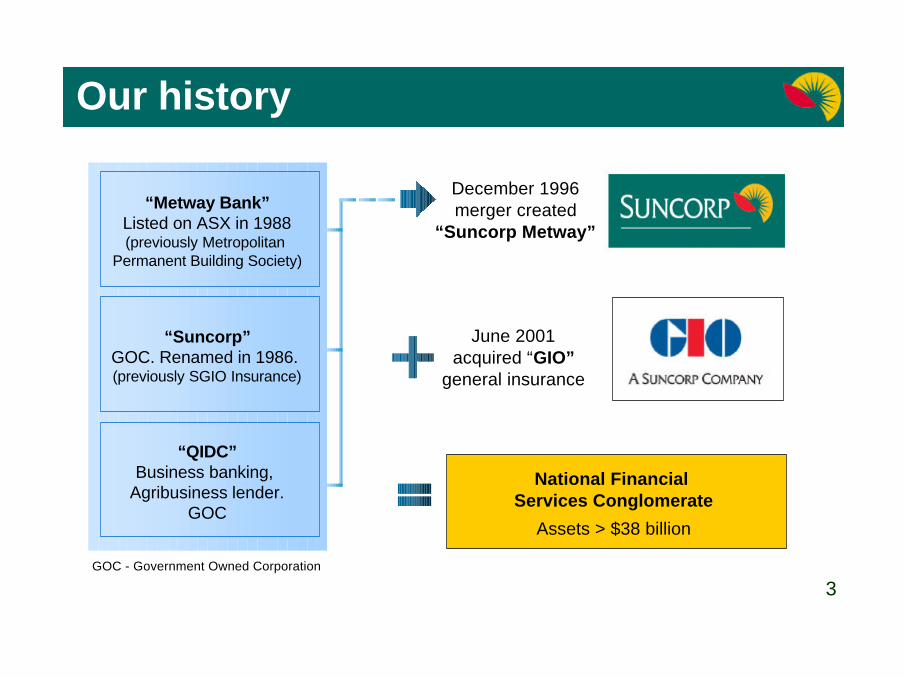
Our history
December 1996merger created
“Suncorp Metway”
June 2001acquired “GIO”
general insurance
“Metway Bank”Listed on ASX in 1988(previously Metropolitan
Permanent Building Society)
“QIDC”Business banking,
Agribusiness lender.GOC
“Suncorp”GOC. Renamed in 1986. (previously SGIO Insurance)
National Financial Services Conglomerate
Assets > $38 billion
GOC - Government Owned Corporation
4
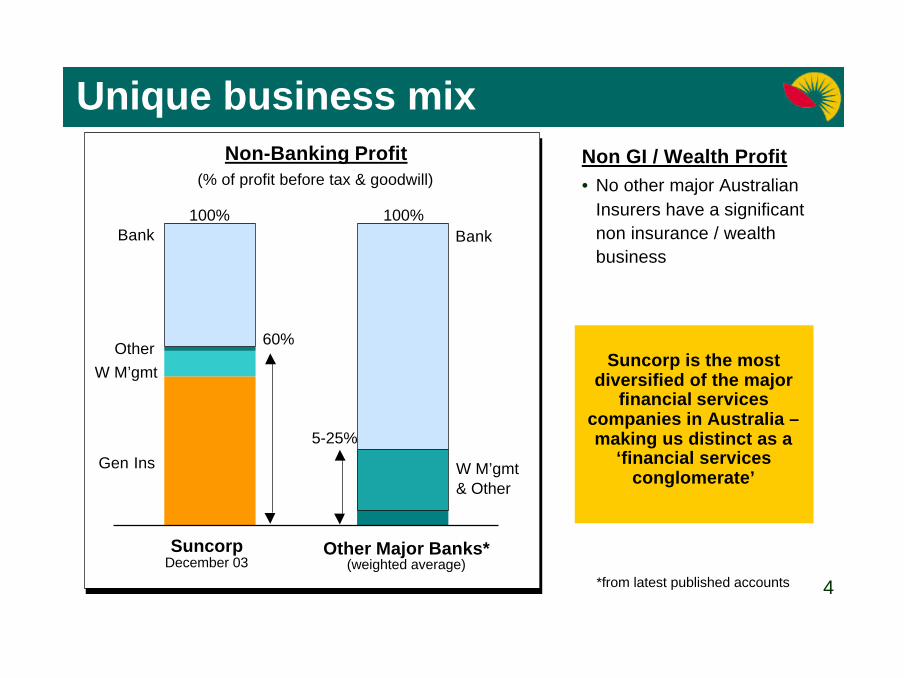
Non-Banking Profit(% of profit before tax & goodwill)
SuncorpDecember 03
Suncorp is the mostdiversified of the major
financial servicescompanies in Australia –making us distinct as a
‘financial servicesconglomerate’
Other Major Banks*(weighted average)
5-25%
Non GI / Wealth Profit• No other major Australian
Insurers have a significantnon insurance / wealthbusiness
Unique business mix
60%
100%
OtherW M’gmt
Gen Ins
Bank
W M’gmt& Other
Bank
*from latest published accounts
100%
4
5
Agenda
• Key Success Drivers
- Unique Business Model
- Diversified Financial Services Strategy
- Proven Execution Capability
- Performance Culture
• The Future
• Questions
5
6
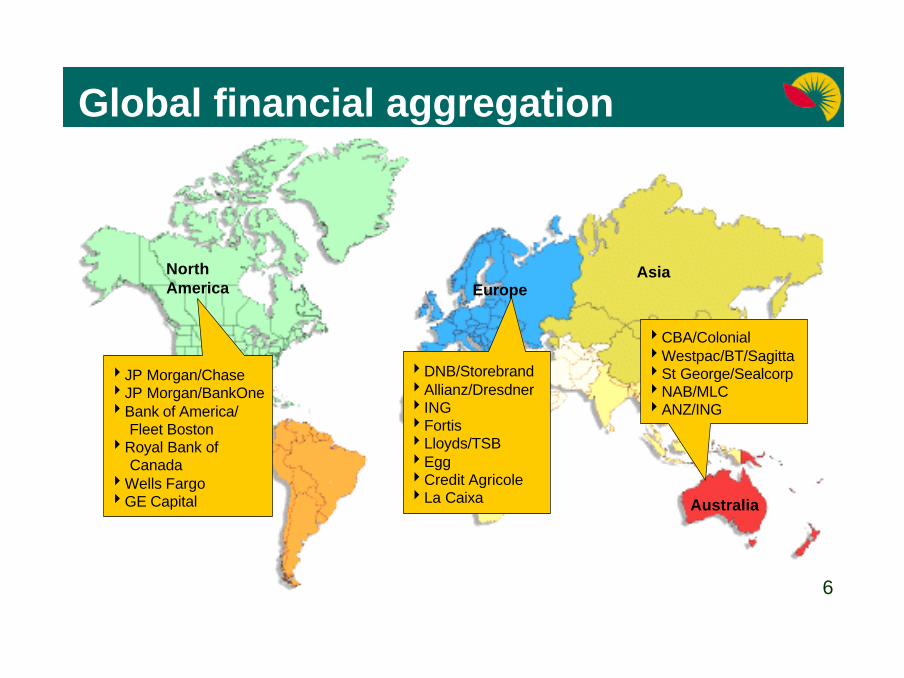
Global financial aggregation
4DNB/Storebrand4Allianz/Dresdner4ING4Fortis4Lloyds/TSB4Egg4Credit Agricole4La Caixa
4CBA/Colonial4Westpac/BT/Sagitta4St George/Sealcorp4NAB/MLC4ANZ/ING
4JP Morgan/Chase4JP Morgan/BankOne4Bank of America/ Fleet Boston4Royal Bank of Canada4Wells Fargo4GE Capital
NorthAmerica Europe
Australia
Asia
6
7
• Financial deregulation
• Banking businesses under siege
• Leveraging customer base
• Scale efficiencies & leveraging infrastructure
What is driving aggregation
7
8
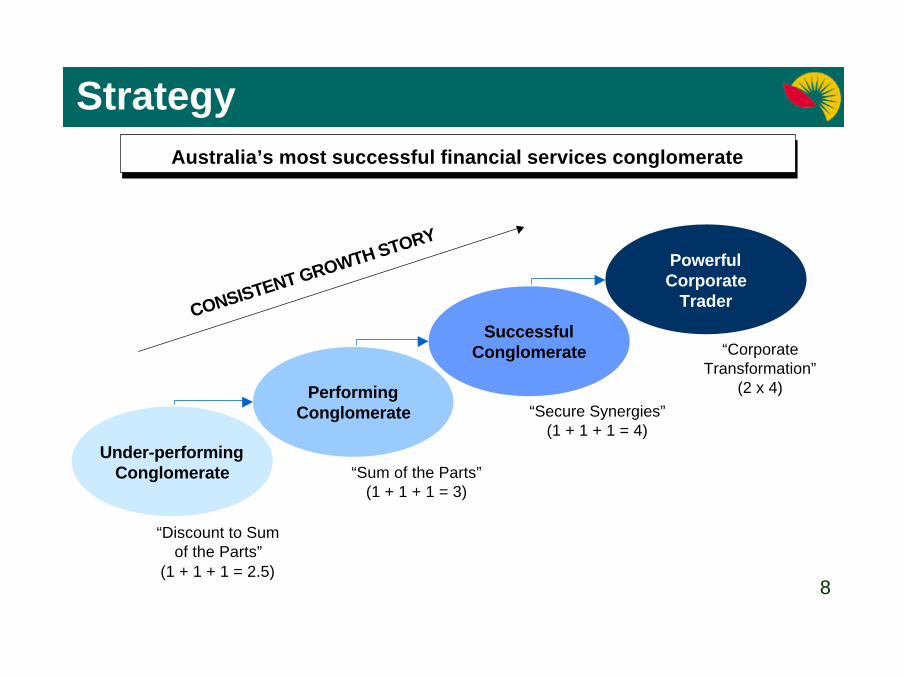
Strategy
Under-performingConglomerate
“Discount to Sumof the Parts”
(1 + 1 + 1 = 2.5)
PerformingConglomerate
“Sum of the Parts”(1 + 1 + 1 = 3)
“Secure Synergies”(1 + 1 + 1 = 4)
PowerfulCorporate
Trader
“CorporateTransformation”
(2 x 4)
CONSISTENT GROWTH STORY
SuccessfulConglomerate
Australia’s most successful financial services conglomerate
8

9
Agenda
• Key Success Drivers
- Unique Business Model
- Diversified Financial Services Strategy
- Proven Execution Capability
- Performance Culture
• The Future
• Questions
9
10
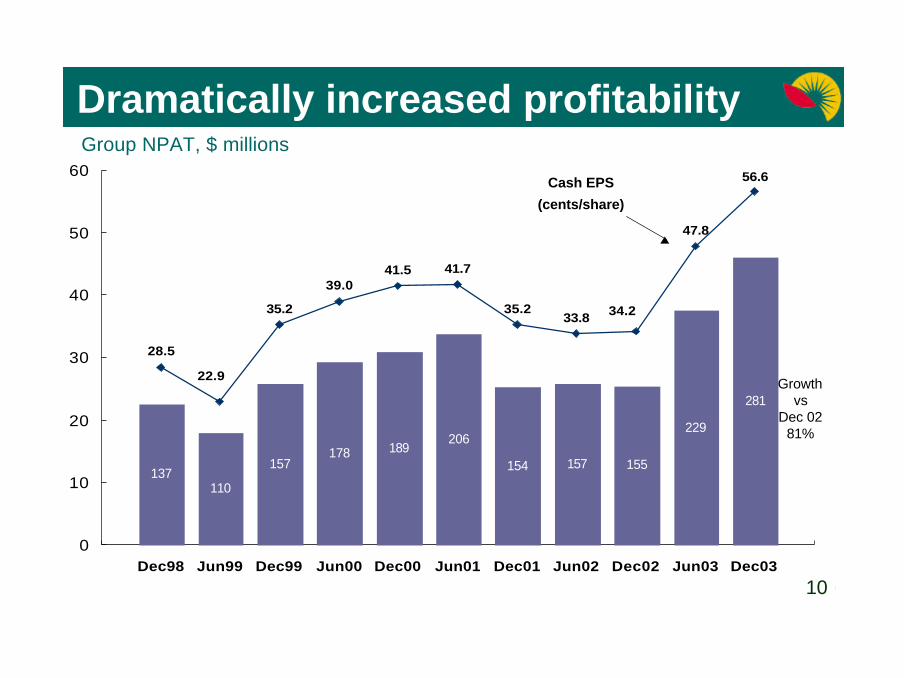
28.5
35.2
39.041.5 41.7
35.233.8
47.8
56.6
34.2
22.9
0
10
20
30
40
50
60
Dec98 Jun99 Dec99 Jun00 Dec00 Jun01 Dec01 Jun02 Dec02 Jun03 Dec03
137110
157178 189
206
154 157 155
229
281
Dramatically increased profitabilityGroup NPAT, $ millions
Growthvs
Dec 0281%
Cash EPS
(cents/share)
10
11
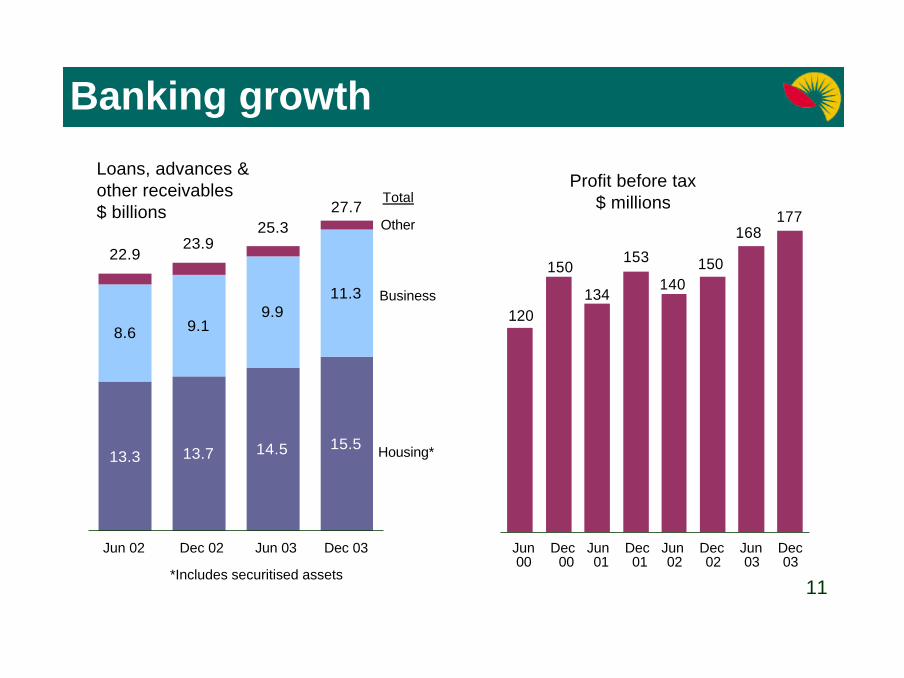
177168
150140
153
134
150
120Business
13.3 13.7 14.5 15.5
8.6 9.19.9
11.3
22.923.9
27.725.3
Banking growth
Housing*
Total
*Includes securitised assets
Loans, advances &other receivables$ billions
Jun 02 Dec 02 Jun 03 Dec 03 Jun Dec Jun Dec Jun Dec Jun Dec 00 00 01 01 02 02 03 03
Other
Profit before tax$ millions
11
12
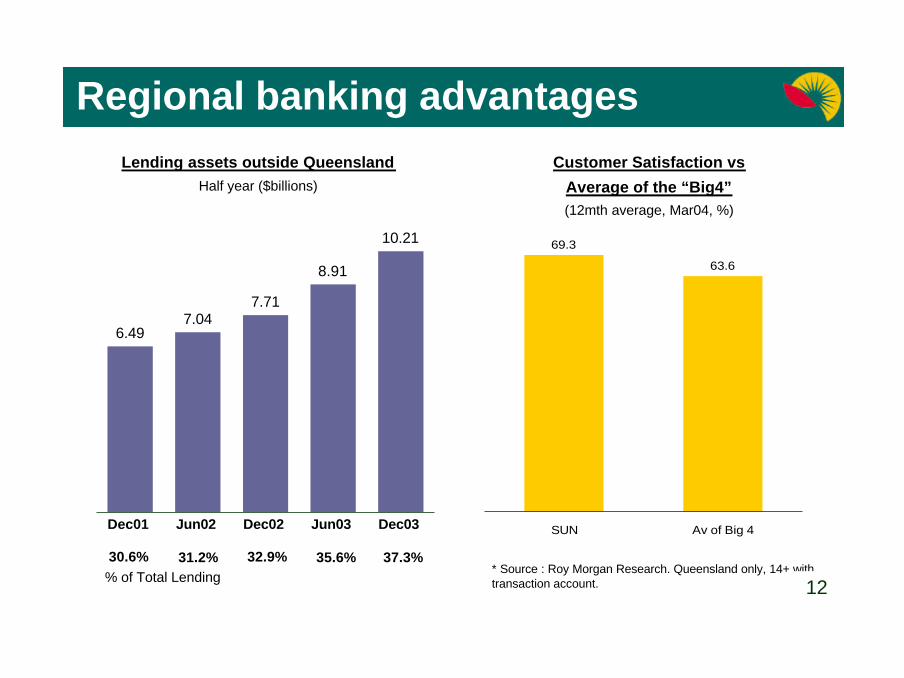
10.21
8.91
7.717.04
6.49
Lending assets outside QueenslandHalf year ($billions)
Regional banking advantages
Dec01 Jun02 Dec02 Jun03 Dec03
% of Total Lending30.6% 31.2% 32.9% 35.6% 37.3%
Customer Satisfaction vs
Average of the “Big4”(12mth average, Mar04, %)
* Source : Roy Morgan Research. Queensland only, 14+ withtransaction account.
69.3
63.6
SUN Av of Big 4
12

13
Qld growth outpaces AustraliaGross State/Domestic Product Growth, %
* Source: QLD Treasury. Financial year growth rate.
0
1
2
3
4
5
6
7
8
1995/96 1996/97 1997/98 1998/99 1999/00 2000/01 2001/02 2002/03 2003/2004 2004/2005
Queensland GSP
Australia GDP
4.25%
3.5%
13

14
IndustryTotal GWP $1.7bn $4.6bn $18.1bn
1979
Top 1556%
Top 1575%
Others44% Others
25%
Others22%
1987 June 2002
INDUSTRY CONSOLIDATIONPremium share (GWP): Private sector direct underwriters
Source: APRA, Deloitte Trowbridge, JP Morgan, KPMG
Top 578%
GI external environment
14
15
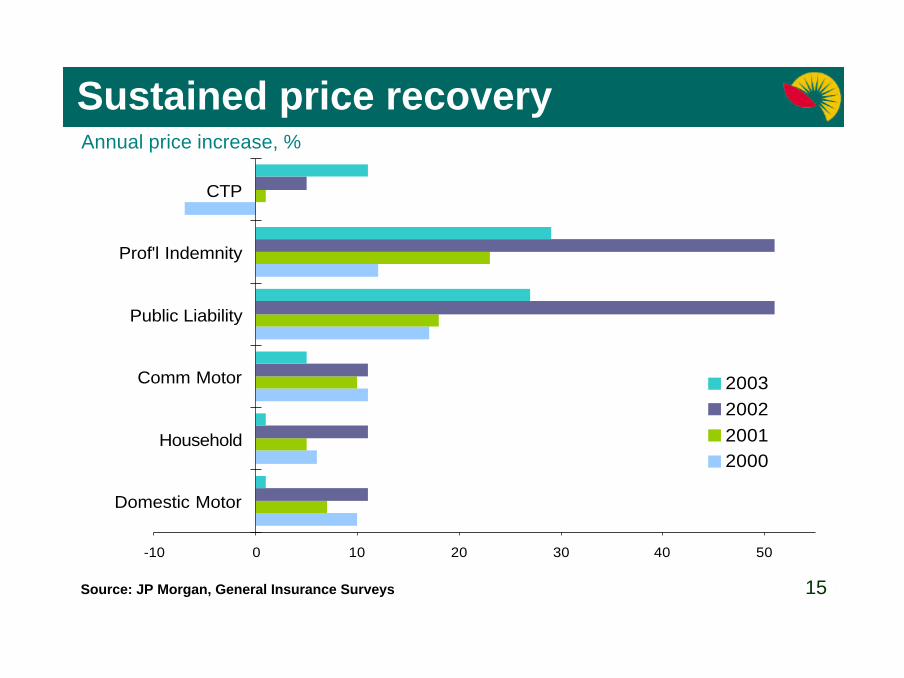
-10 0 10 20 30 40 50
Domestic Motor
Household
Comm Motor
Public Liability
Prof'l Indemnity
CTP
2003200220012000
Annual price increase, %
Source: JP Morgan, General Insurance Surveys
Sustained price recovery
15
16
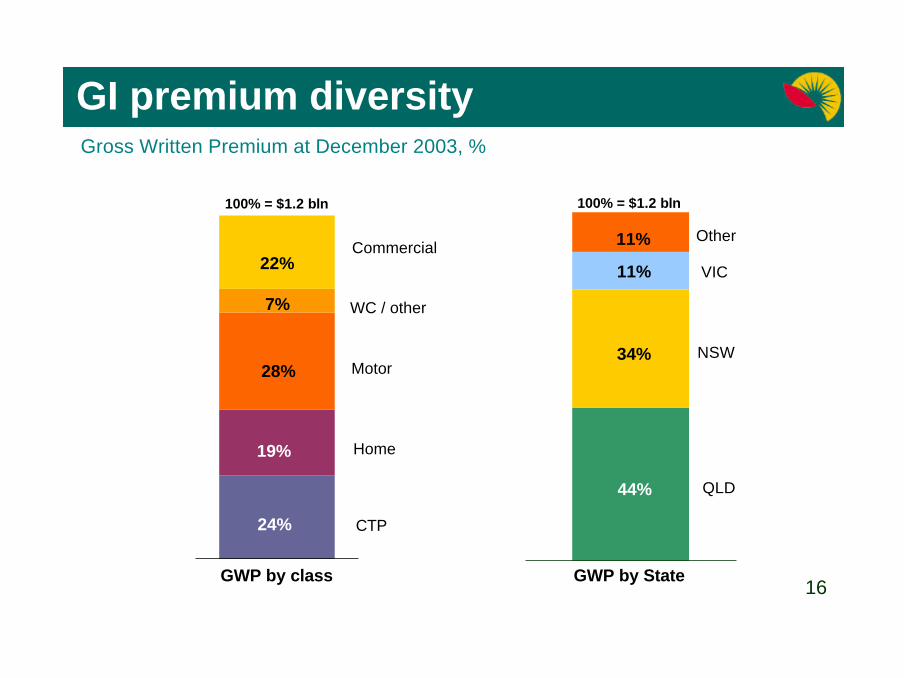
GI premium diversity
Commercial
100% = $1.2 bln
19%
28%
24%
7%
22%
CTP
WC / other
Motor
Home
44%
34%
11%
11% VIC
QLD
NSW
Other
Gross Written Premium at December 2003, %
100% = $1.2 bln
GWP by class GWP by State16

17
51
26
7
-18-34
-69
1
42
7180
129145
Underwriting Result
Insurance Trading Result
Half-year, $ millions
Strong GI profit trend
Jun 01 Dec 01 Jun 02 Dec 02 Jun 03 Dec 03
4.8%*7.7%*
8.0%*
12.8%*
13.5%*
* Insurance MarginExcluding discount rate adjustment 17
18
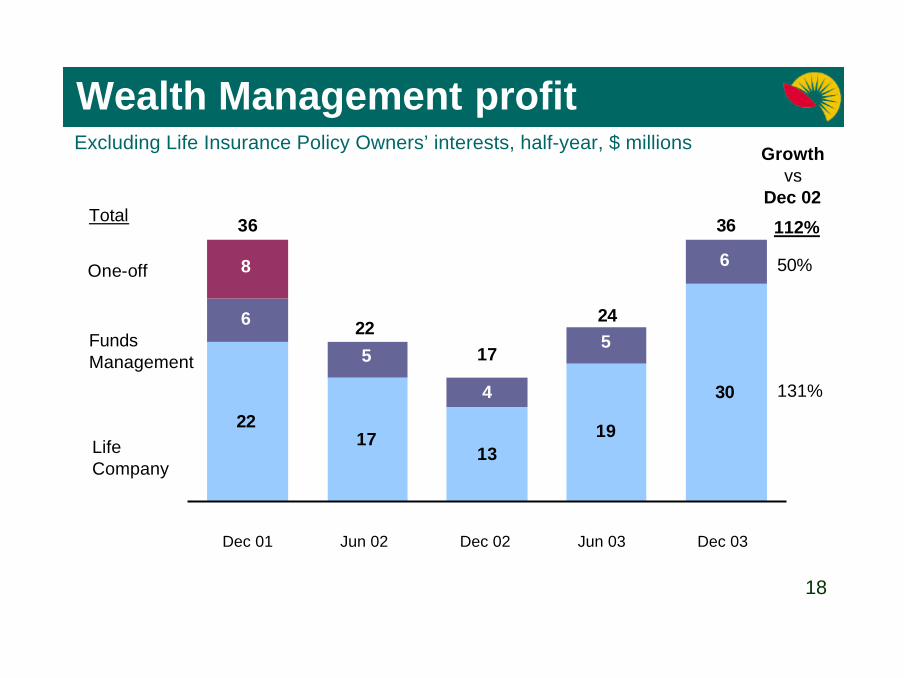
Excluding Life Insurance Policy Owners’ interests, half-year, $ millions
22
30
6
55
6
131917
4
8
36 36
24
1722
Dec 01 Jun 02 Dec 02 Jun 03 Dec 03
One-off
Life Company
Wealth Management profit
FundsManagement
Total
Growthvs
Dec 02
112%
50%
131%
18

19
63.3
57.5
50.9 50.7 50.6 48.745.6 45.1
0
10
20
30
40
50
60
70
BoQ ADB NAB CBA SUN WBC SGB ANZ
28.4
24.9 24.6
21.9
0
5
10
15
20
25
30
35
Promina IAG QBE Suncorp
*QBE’s Australian operations onlySource: Latest Annual/Half-Year Accounts, Annual Reports, and Analyst Presentations
Banking Cost to Income ratio, % GI Expense ratio, %
Demonstrated cost synergies
19
20
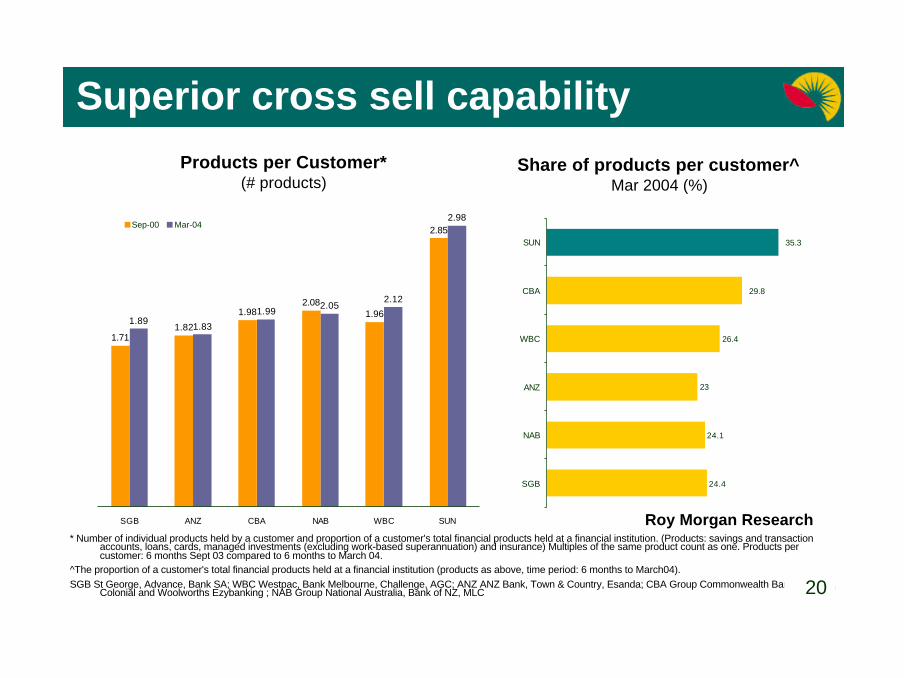
* Number of individual products held by a customer and proportion of a customer's total financial products held at a financial institution. (Products: savings and transactionaccounts, loans, cards, managed investments (excluding work-based superannuation) and insurance) Multiples of the same product count as one. Products percustomer: 6 months Sept 03 compared to 6 months to March 04.
^The proportion of a customer's total financial products held at a financial institution (products as above, time period: 6 months to March04).SGB St George, Advance, Bank SA; WBC Westpac, Bank Melbourne, Challenge, AGC; ANZ ANZ Bank, Town & Country, Esanda; CBA Group Commonwealth Bank,
Colonial and Woolworths Ezybanking ; NAB Group National Australia, Bank of NZ, MLC
Superior cross sell capability
1.711.82
1.982.08
1.96
2.85
1.891.83
1.992.05
2.12
2.98
SGB ANZ CBA NAB WBC SUN
Sep-00 Mar-04
Products per Customer*(# products)
24.4
24.1
23
26.4
35.3
29.8
SGB
NAB
ANZ
WBC
CBA
SUN
Share of products per customer^Mar 2004 (%)
Roy Morgan Research
20
21
Agenda
• Key Success Drivers
- Unique Business Model
- Diversified Financial Services Strategy
- Proven Execution Capability
- Performance Culture
• The Future
• Questions
21
22
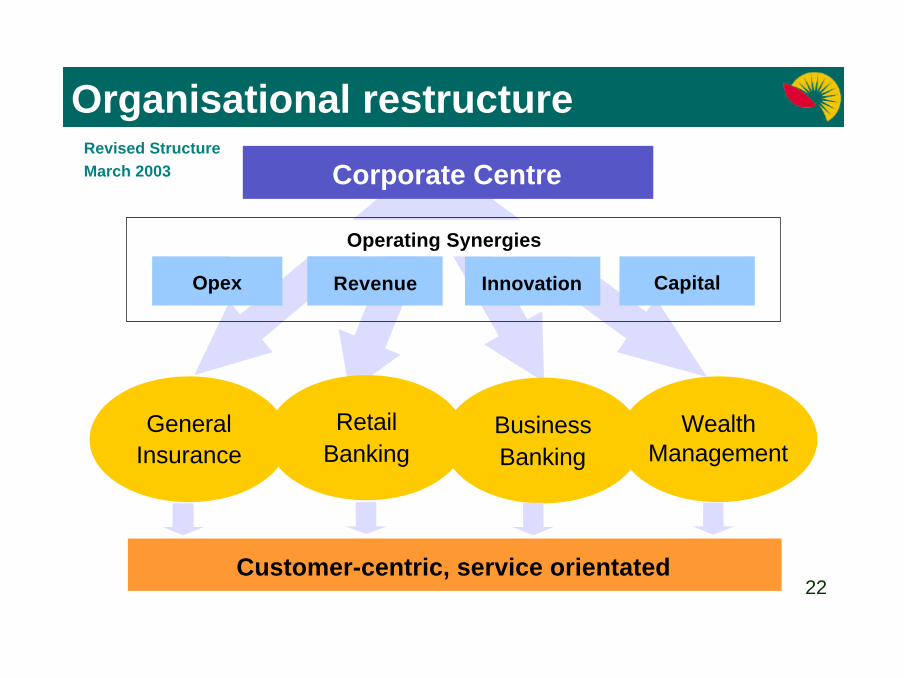
Organisational restructureRevised StructureMarch 2003
GeneralInsurance
RetailBanking
BusinessBanking
WealthManagement
Corporate Centre
Opex Innovation
Operating Synergies
CapitalRevenue
Customer-centric, service orientated22

23
Agenda
• Key Success Drivers
- Unique Business Model
- Diversified Financial Services Strategy
- Proven Execution Capability
- Performance Culture
• The Future
• Questions
23
24
• Economic growth remains robust
• Housing to moderate, but growth to continue
• Credit quality remains healthy
• Improved GI environment is sustainable. Structuralreforms create a solid platform for growth
• Wealth Management conditions favourable due torenewed investor confidence
Fundamentals remain strong
24