Embed Size (px)
Citation preview

UBS Australian Healthcare C fConferenceMark FitzgibbonManaging DirectorManaging DirectorNovember 2010

Investment thesis
Growth in Australia's health expenditure (currently circa A$100 billion) has out paced GDP growth over the last decade and is expected to continue
Government outlays account for almost 70% of healthcare expenditure. An ageing y p g gpopulation and increasing dependency ratio means that this relative level of Government funding is not sustainable
The private health insurance (PHI) sector is growing and will inevitably play an p ( ) g g y p yincreased role in funding the nation’s healthcare.
nib is a “challenger brand” and the only publicly listed insurer in Australia. It has the fastest growth rate of the major insurers, both in terms of policyholder numbers and g j , p ypremium revenue. Underlying earnings in FY10 were 98.7% higher than in FY07.
The PHI industry is certain to consolidate creating additional opportunities for nib. There are currently 37 health insurers and nib has since listing retained a “war chest” y gto fund such investments. Capital management opportunities exist.
2
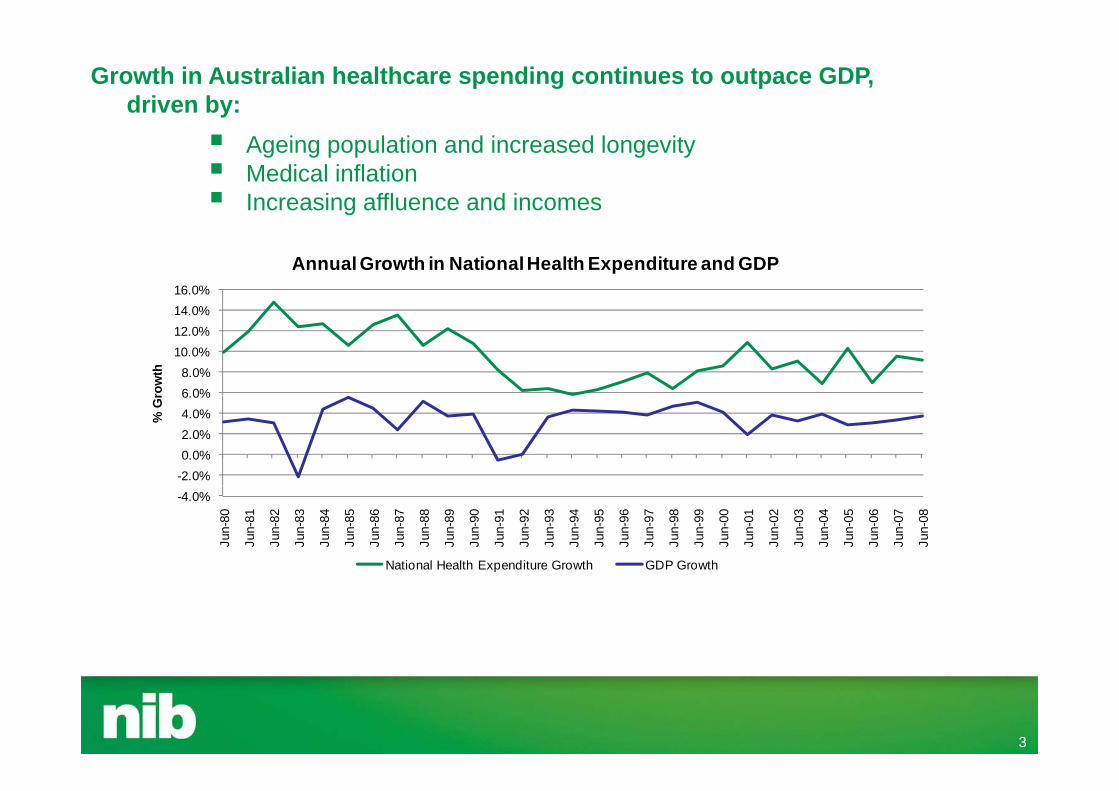
Growth in Australian healthcare spending continues to outpace GDP, driven by:
Ageing population and increased longevity Medical inflation Increasing affluence and incomes
%16.0%
Annual Growth in National Health Expenditure and GDP
6 0%8.0%
10.0%12.0%14.0%
row
th
-2.0%0.0%2.0%4.0%6.0%
% G
r
-4.0%
Jun-
80
Jun-
81
Jun-
82
Jun-
83
Jun-
84
Jun-
85
Jun-
86
Jun-
87
Jun-
88
Jun-
89
Jun-
90
Jun-
91
Jun-
92
Jun-
93
Jun-
94
Jun-
95
Jun-
96
Jun-
97
Jun-
98
Jun-
99
Jun-
00
Jun-
01
Jun-
02
Jun-
03
Jun-
04
Jun-
05
Jun-
06
Jun-
07
Jun-
08
National Health Expenditure Growth GDP Growth
3
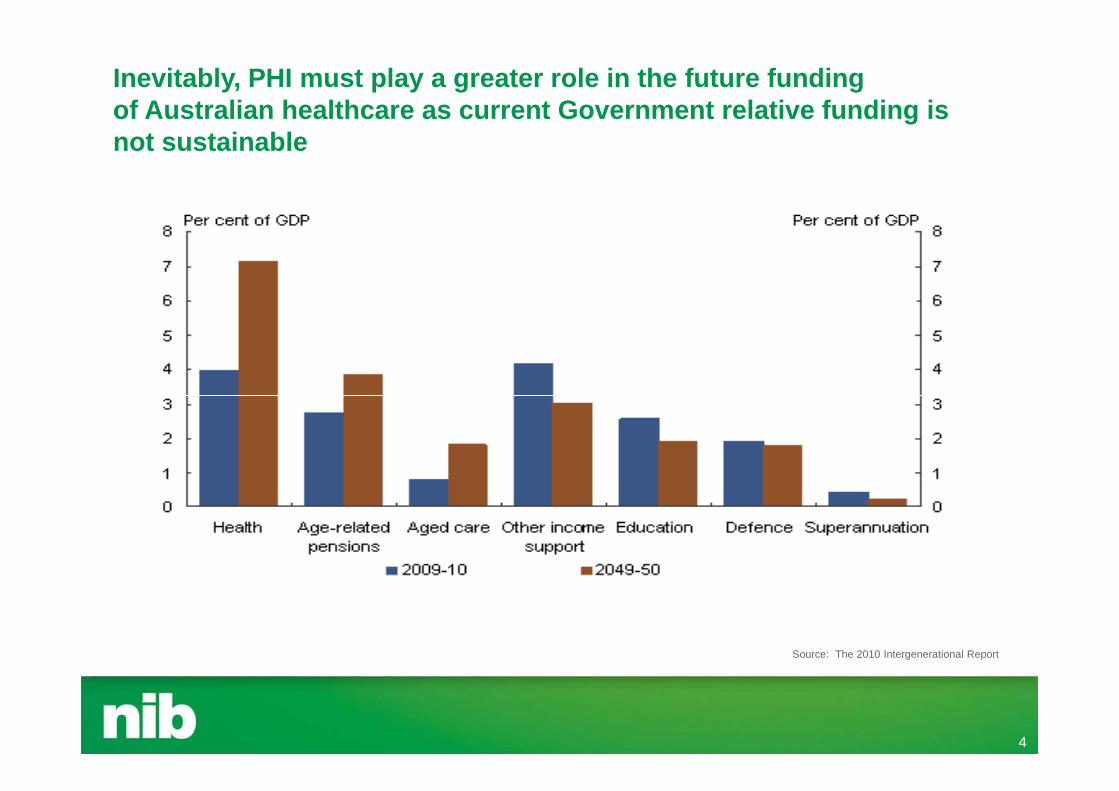
Inevitably, PHI must play a greater role in the future funding of Australian healthcare as current Government relative funding is not sustainable
Source: The 2010 Intergenerational Report
4
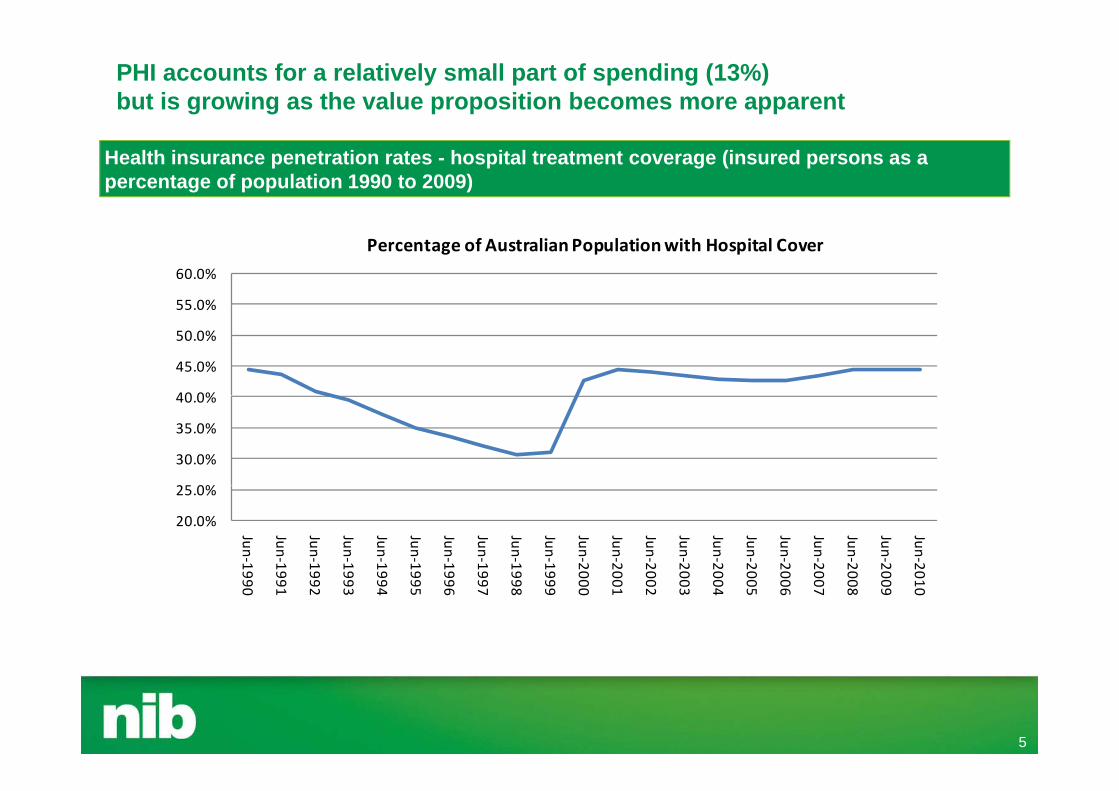
PHI accounts for a relatively small part of spending (13%) but is growing as the value proposition becomes more apparent
Health insurance penetration rates - hospital treatment coverage (insured persons as a percentage of population 1990 to 2009)
55 0%
60.0%
Percentage of Australian Population with Hospital Cover
40 0%
45.0%
50.0%
55.0%
25 0%
30.0%
35.0%
40.0%
20.0%
25.0%
Jun‐19
Jun‐19
Jun‐19
Jun‐19
Jun‐19
Jun‐19
Jun‐19
Jun‐19
Jun‐19
Jun‐19
Jun‐20
Jun‐20
Jun‐20
Jun‐20
Jun‐20
Jun‐20
Jun‐20
Jun‐20
Jun‐20
Jun‐20
Jun‐20990
991
992
993
994
995
996
997
998
999
000
001
002
003
004
005
006
007
008
009
010
5
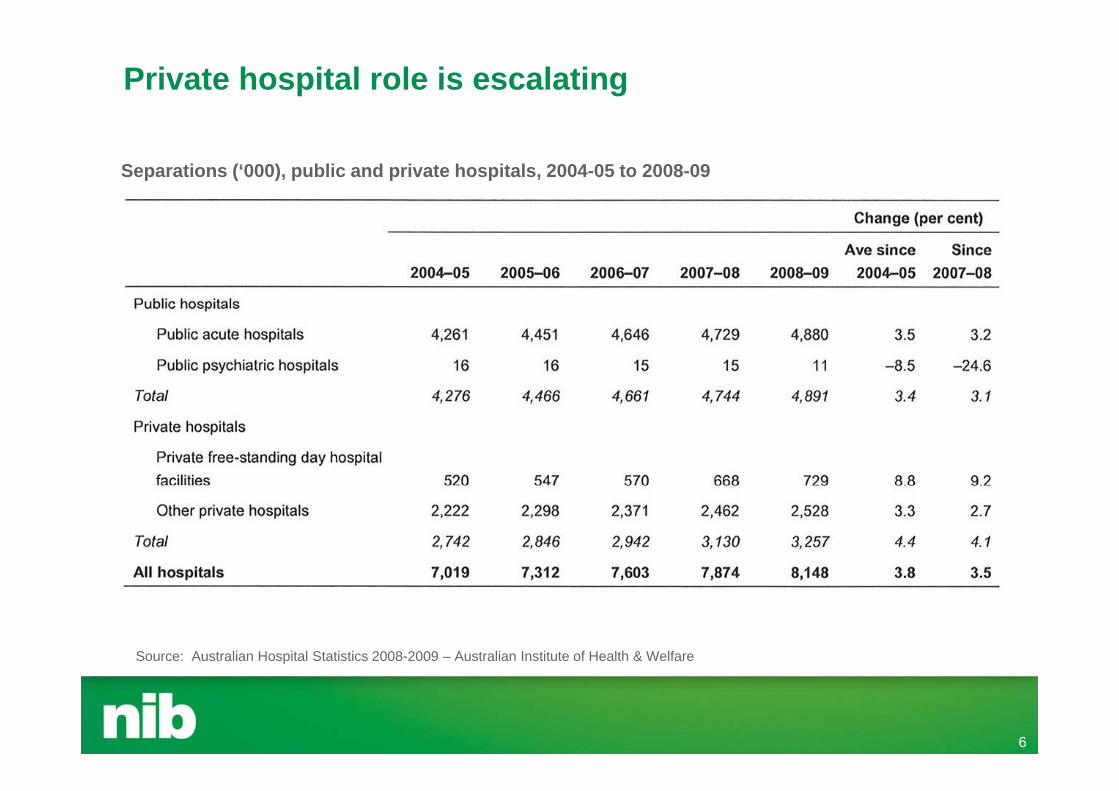
Private hospital role is escalating
Separations (‘000), public and private hospitals, 2004-05 to 2008-09
Source: Australian Hospital Statistics 2008-2009 – Australian Institute of Health & Welfare
6
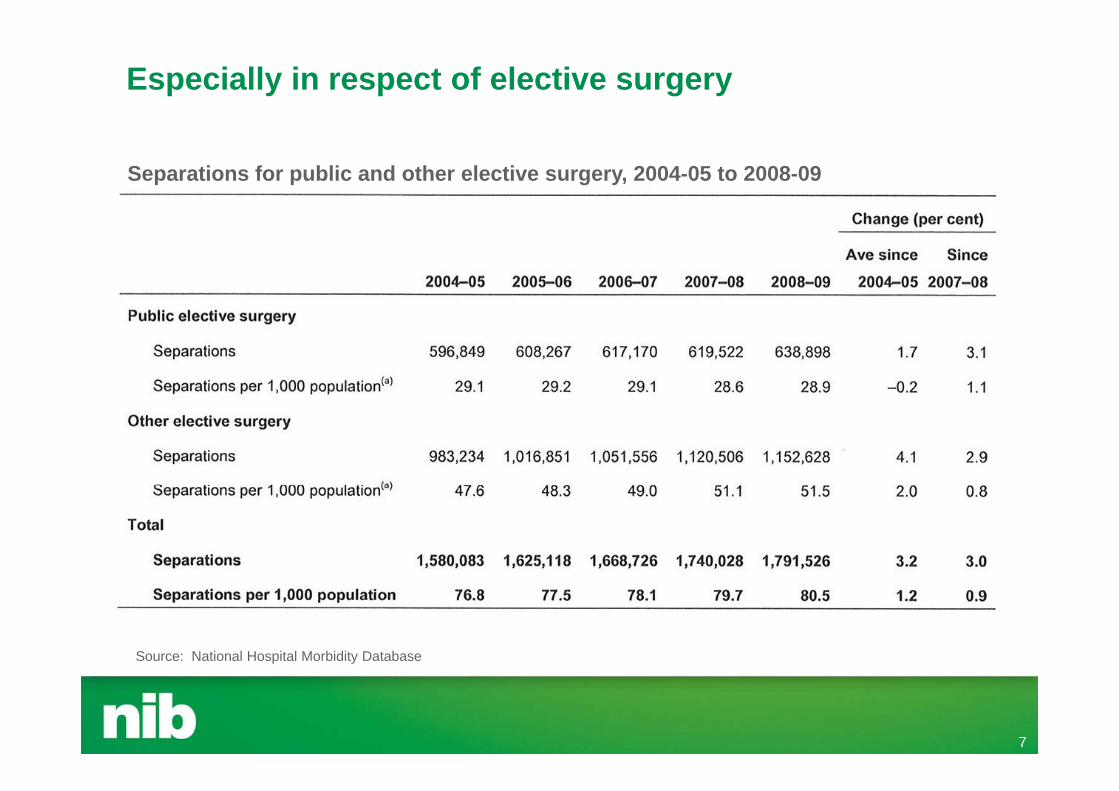
Especially in respect of elective surgery
Separations for public and other elective surgery, 2004-05 to 2008-09
Source: National Hospital Morbidity Database
7
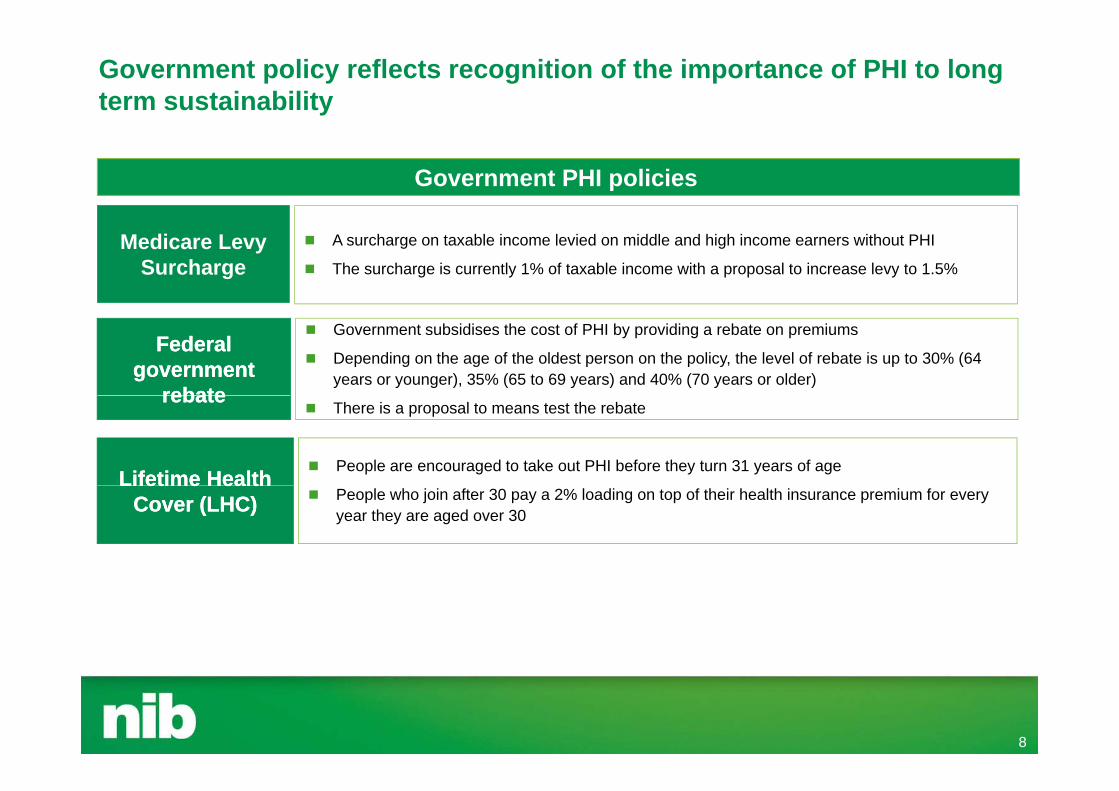
Government policy reflects recognition of the importance of PHI to long term sustainability
Government PHI policies
A surcharge on taxable income levied on middle and high income earners without PHI
The surcharge is currently 1% of taxable income with a proposal to increase levy to 1.5%Medicare Levy
Surcharge
Government subsidises the cost of PHI by providing a rebate on premiums
Depending on the age of the oldest person on the policy, the level of rebate is up to 30% (64 years or younger), 35% (65 to 69 years) and 40% (70 years or older)
Federal Federal government government
rebaterebate
People are encouraged to take out PHI before they turn 31 years of ageLifetime HealthLifetime Health
There is a proposal to means test the rebaterebaterebate
People who join after 30 pay a 2% loading on top of their health insurance premium for every year they are aged over 30
Lifetime Health Lifetime Health Cover (LHC) Cover (LHC)
8

nib is Australia’s only listed health insurer Market capitalisation ~A$620m*
Australia’s fifth largest health fund (only listed Australian private health insurer) based in Newcastle
Approximately 415,000 policyholders, providing cover for over 800,000 people (NSW/ACT 70%, Victoria 14%, QLD 10%)
Employees (FTEs) 470 (as at 30 June 2010)p y ( ) ( ) Primary distribution channels:
• Customer Care Centre• Online• Online• Retail and Corporate Sales
Recently entered market for temporary migrant workers and international students health iinsurance
Key financial targets• ROE 15% (minimum)• Underlying earnings accretion of 10% pa (minimum)• Normal Dividend payout ratio 50-60% of earnings
* based on a share price of $1.26 (4 November 2010 closing share price) and 495,431,427 shares on issue
9
based on a share price of $1.26 (4 November 2010 closing share price) and 495,431,427 shares on issue
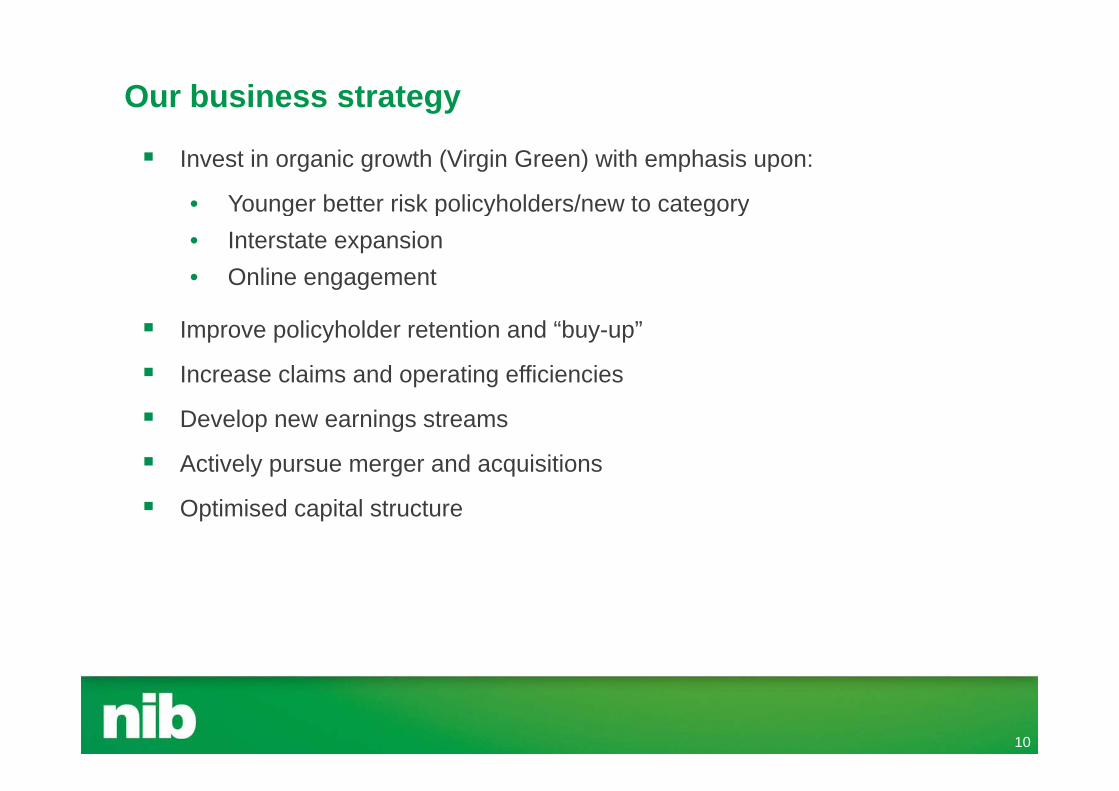
Our business strategy
Invest in organic growth (Virgin Green) with emphasis upon:
• Younger better risk policyholders/new to categoryg p y g y• Interstate expansion• Online engagement
Improve policyholder retention and “buy-up”
Increase claims and operating efficiencies
Develop new earnings streams
Actively pursue merger and acquisitions
Optimised capital structure
10

Our results so far are impressive
(%) FY06 FY07 FY08 FY09 FY10
Net policyholder growth (nib) 3 9 8 8 11 1 5 2 5 9Net policyholder growth (nib) 3.9 8.8 11.1 5.2 5.9
Net policyholder growth (industry) 2.1 4.2 4.2 3.3 2.9
% of new sales new to category 70.8 74.4 78.2 67.4 62.2
% of new sales “under 40” target segment 73.6 78.5 79.2 78.7 77.4
% of new sales online 13.5 32.5 38.8 36.2 33.1
% of new sales outside core state of NSW/ACT 23 4 32 3 44 0 42 6 42 7% of new sales outside core state of NSW/ACT 23.4 32.3 44.0 42.6 42.7
CAGR since FY05 of 6.5% (industry 2.9%), since FY05 nib has represented 13.8% of total industry growth
nib with 7.3% market share, accounted for 14.3% of national growth in FY10 (FY09: 11.0%) nib with 10.2% market share (FY09: 9.8%) in 20-39 age group accounted for 31.1% of total industry
growth (FY09: 25.5%) Net policyholder growth (excluding overseas students and temporary migrant workers) for three months Net policyholder growth (excluding overseas students and temporary migrant workers) for three months
ending 30 September 2010 was 8,563 policies (same period last year: 6,923)
11
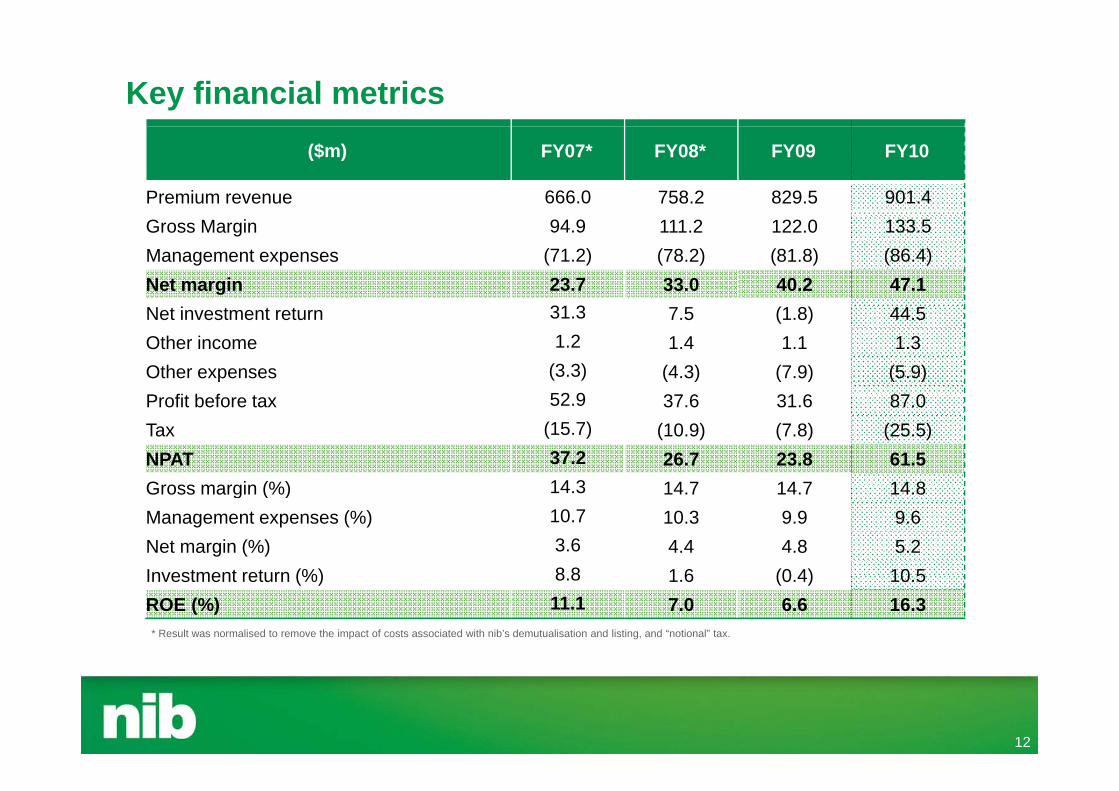
Key financial metrics($m) FY07* FY08* FY09 FY10
Premium revenue 666.0 758.2 829.5 901.4Gross Margin 94.9 111.2 122.0 133.5Management expenses (71.2) (78.2) (81.8) (86.4)Net margin 23.7 33.0 40.2 47.1
31 3Net investment return 31.3 7.5 (1.8) 44.5Other income 1.2 1.4 1.1 1.3Other expenses (3.3) (4.3) (7.9) (5.9)P fit b f t 52 9 37 6 31 6 87 0Profit before tax 52.9 37.6 31.6 87.0Tax (15.7) (10.9) (7.8) (25.5)NPAT 37.2 26.7 23.8 61.5Gross margin (%) 14 3 14 7 14 7 14 8Gross margin (%) 14.3 14.7 14.7 14.8Management expenses (%) 10.7 10.3 9.9 9.6Net margin (%) 3.6 4.4 4.8 5.2Investment return (%) 8 8 1 6 (0 4) 10 5Investment return (%) 8.8 1.6 (0.4) 10.5ROE (%) 11.1 7.0 6.6 16.3* Result was normalised to remove the impact of costs associated with nib’s demutualisation and listing, and “notional” tax.
12
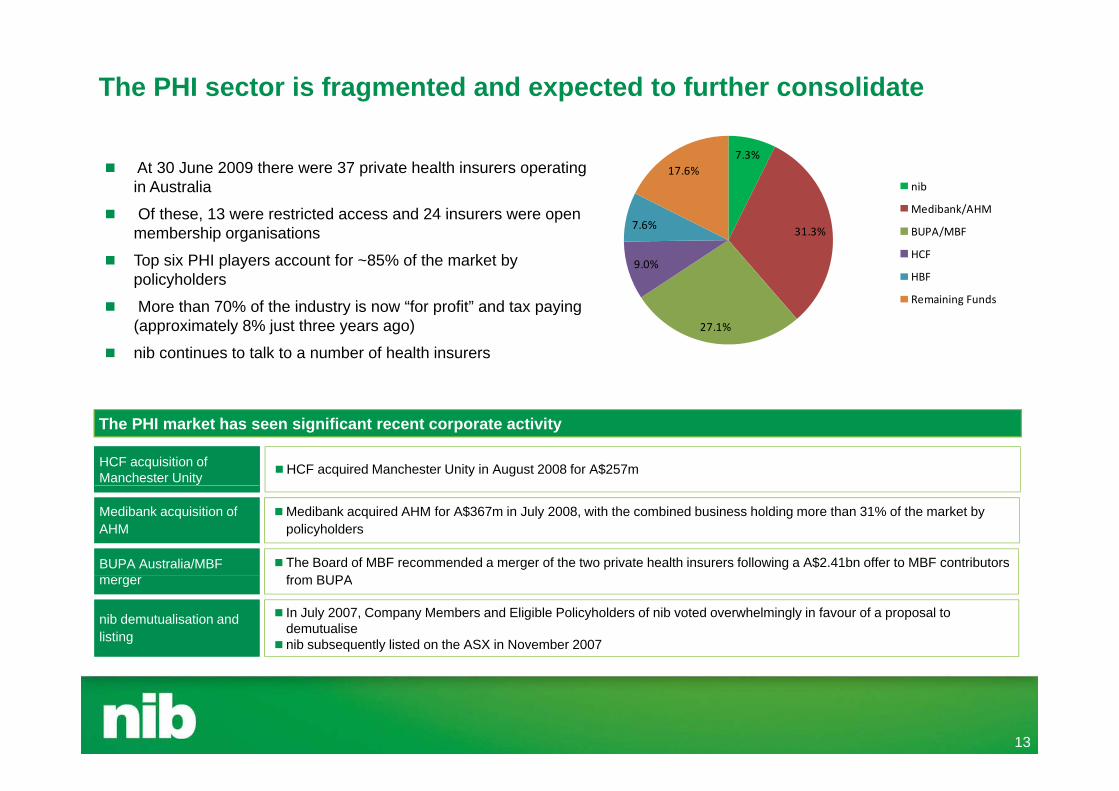
The PHI sector is fragmented and expected to further consolidate
At 30 June 2009 there were 37 private health insurers operating in Australia
Of these 13 were restricted access and 24 insurers were open
7.3%17.6%
nib
Medibank/AHM Of these, 13 were restricted access and 24 insurers were open membership organisations
Top six PHI players account for ~85% of the market by policyholders
More than 70% of the industry is now “for profit” and tax paying
31.3%
9.0%
7.6% BUPA/MBF
HCF
HBF
Remaining Funds More than 70% of the industry is now for profit and tax paying
(approximately 8% just three years ago)
nib continues to talk to a number of health insurers
27.1%
The PHI market has seen significant recent corporate activity
HCF acquisition of Manchester Unity HCF acquired Manchester Unity in August 2008 for A$257m
Medibank acquisition of AHM
Medibank acquired AHM for A$367m in July 2008, with the combined business holding more than 31% of the market by policyholders
BUPA Australia/MBF The Board of MBF recommended a merger of the two private health insurers following a A$2.41bn offer to MBF contributors f BUPAmerger from BUPA
nib demutualisation and listing
In July 2007, Company Members and Eligible Policyholders of nib voted overwhelmingly in favour of a proposal to demutualise
nib subsequently listed on the ASX in November 2007
13
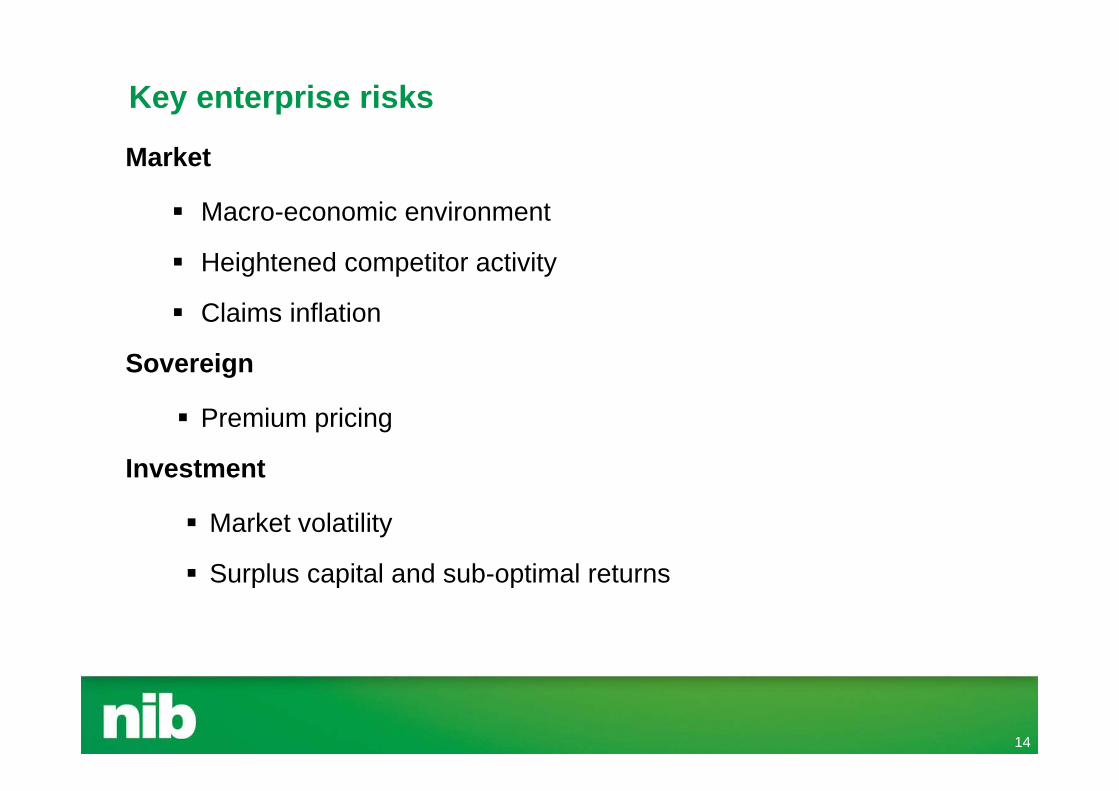
Key enterprise risks
Market
Macro-economic environmentMacro economic environment
Heightened competitor activity
Cl i i fl ti Claims inflation
Sovereign
Premium pricing
Investment
Market volatility
Surplus capital and sub-optimal returns Surplus capital and sub-optimal returns
14
Capital Management
As at 30 September 2010 and following the acqusition of IMAN, nib had capital of $120.8 million above its current internal prudential target (1.4X) and no debt. nib intends to retain capital above its prudential target in the near term to fund potential M&A investmentcapital above its prudential target in the near term to fund potential M&A investment opportunities.
The Board has previously indicated to the market that it would consider a debt-to-capital ratio of 20-30% as part of any funding requirement. There is potential to optimise capital structure through debt.
In the absence of M&A opportunities coming to fruition, the Board will consider more significant capital management in the 2011 calendar year.Di id d li ill ti t b h il i fl d b f ki dit il bilit Dividend policy will continue to be heavily influenced by franking credit availability. To the extent made possible by franking credits, the Board will release capital above internal target by way of special dividends.
We have bought back 22 575 369 million shares since August 2008 We intend to continueWe have bought back 22,575,369 million shares since August 2008. We intend to continue the on-market share buy back of up to 10% of our issued capital (calculated at the time of commencing the buy back in August 2008)
Cancelation of approximately 27 million shares (5.5% of issued capital) following expiry of Unverified Policyholders and Overseas Policyholders Trust. We expect the shares will be cancelled by the end of November 2010
15
Summing up nib is a “challenger brand” already making significant progress in
increasing market share through focused organic growth strategy. E t FY11 t li h ld th f 5 6%Expect FY11 net policyholder growth of 5-6%
Strong underlying earnings accretion can be expected to continue, driven by organic growth Expect pre-tax net underwriting result fordriven by organic growth. Expect pre tax net underwriting result for FY11 of $50- $55 million (net underwriting margin of 4.9% - 5.4%)
Hopefully value enhancing M&A opportunities remain
nib will reassess capital position at FY11 half year results
The long-term outlook for PHI in Australia is positive given g p gincreasing health care demand and the un-sustainability of current levels of Government healthcare funding
16
UBS Australian Healthcare C fConferenceMark FitzgibbonManaging DirectorManaging DirectorNovember 2010