Embed Size (px)
Citation preview
Demand Scenarios
TYNDP 2013-2022
Brussels -- 18 December 2013
Carmen Rodríguez
Adviser

2
Demand scenarios (1)
Enhanced analysis
> Underlying assumptions
> Demand disaggregation: DOM & COM & IND vs. Power generation
One single (ENTSOG) demand scenario for modelling
> Following situations covered
Yearly demand (Average daily demand)
High daily demand
o 1-day Design Conditions -- strictly bottom-up (national plans)
o 1-day Uniform Risk
o 14-day Uniform Risk
Cooperation with ENTSO-E
> Comparison of the scenarios in Electricity and Gas TYNDPs – gas in the electricity mix
> Ongoing cooperation
3
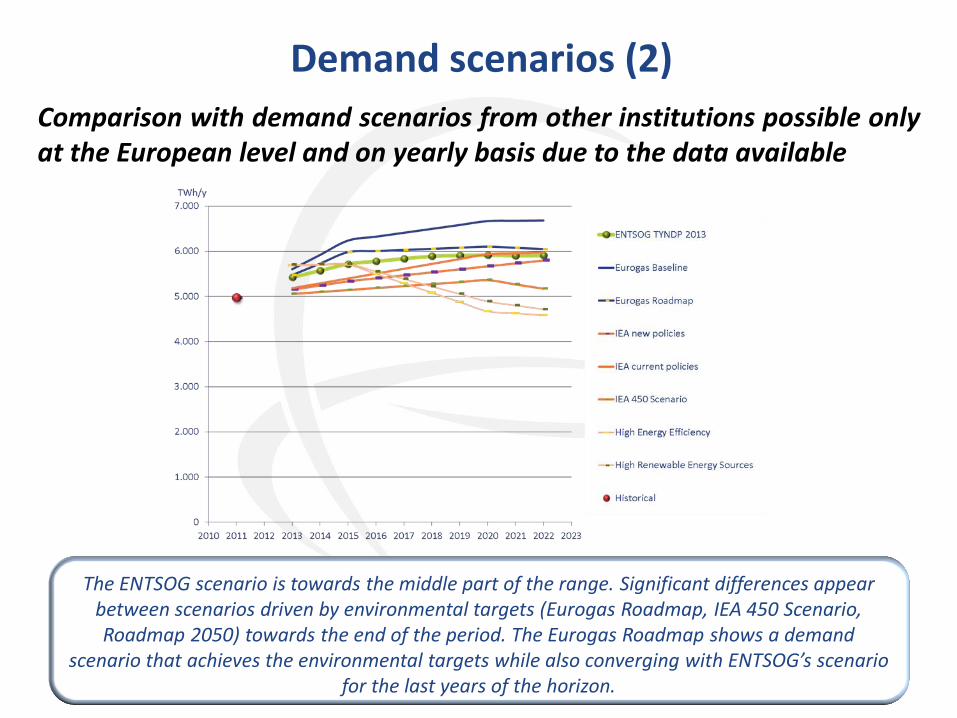
Demand scenarios (2)
The ENTSOG scenario is towards the middle part of the range. Significant differences appear between scenarios driven by environmental targets (Eurogas Roadmap, IEA 450 Scenario, Roadmap 2050) towards the end of the period. The Eurogas Roadmap shows a demand
scenario that achieves the environmental targets while also converging with ENTSOG’s scenario for the last years of the horizon.
Comparison with demand scenarios from other institutions possible only at the European level and on yearly basis due to the data available

4
Average demand situation
Yearly demand
> Average yearly growth 1% - coming from power generation sector
> Total growth (2013-2022): 9%
Power generation: +33%
DOM&COM&IND: +1%
2020
Austria
Belgium
Croatia
Cyprus
Denmark
Estonia
Finland
France
Fyrom
Germany
Greece
Hungary
Ireland
Italy
Latvia
Lithuania
Malta
Poland
Portugal
Romania
Serbia
Slovakia
Slovenia
Spain
Sweden
- (0 - 5) % - (5 - 10) % - (10 - 15) % < - 15 %
+ (0 - 5) % + (5 - 10) % + (10 - 15) % > + 15 %
n/a
Demand evolution 2013-2022

5
High daily demand situations (1)
Evolution of High daily demand High daily demand
> Design-Case
Average yearly growth 0.6% - coming from the power generation sector
Slight yearly decrease -0.2% in the peak demand for DOM & COM & IND
> 1-day Uniform Risk
demand is only slightly lower than the Design-Case (-3%)
> 14-day Uniform Risk
demand significantly lower (-10%) than the Design-Case

6
High daily demand situations (2)
Design Case
> Total growth (2013-2022): 5%
Power generation: +31%
DOM&COM&IND: -2%

7
Power generation (1)
Installed capacity Gas consumption Power generation in gas consumption (2013)
Relative (%) Evolution in Installed capacities, peak and yearly consumptions between 2013 and 2022
Austria
Belgium
Bulgaria (*)
Croatia
Cyprus
Czech Republic
Denmark
Estonia
Finland
France
Fyrom
Germany
Greece
Hungary
Ireland
Italy
Latvia
Lithuania
Luxembourg (*)
Malta
Netherlands
Poland
Portugal
Romania
Serbia
Slovakia
Slovenia
Spain
Sweden
Switzerland (*)
United Kingdom
% of power generation in gas demandYear 2013

8
Power generation (2)
Cooperation with ENTSO-E
> Comparison of the TYNDP scenarios between ENTSOG and ENTSO-E
ENTSO-E Scenario 20-20 (top-down, based on the European 20-20-20 objectives and the NREAPs)
ENTSO-E Scenario B (bottom-up , extrapolates information from market players’ present investments
perspectives)
> Consistency in the installed capacities, significant differences in the demand scenarios
Relative dispersion of ENTSO-E scenarios from ENTSOG scenario

9
TYNDP 2013 vs. TYNDP 2011
Yearly demand
> The aggregated is the reiteration of the outlook in 2011
> Significant differences at country level

10
High daily demand
> Minor decrease in the High daily demand (1-day Design conditions)
> Differences at country level
TYNDP 2013 vs. TYNDP 2011

Thank You for Your Attention
ENTSOG -- European Network of Transmission System Operators for Gas Avenue de Cortenbergh 100, B-1000 Brussels
EML: WWW: www.entsog.eu
Carmen Rodríguez ENTSOG Adviser, System Development