Embed Size (px)
Citation preview
Shamsoddin Saeed et al. International Journal of Geo-Engineering (2015) 6:9 DOI 10.1186/s40703-015-0009-0
ORIGINAL RESEARCH Open Access
Two and three-dimensional slope stabilityanalyses of final wall for Miduk mine
Masoud Shamsoddin Saeed1*, Parviz Maarefvand2 and Ebrahim Yaaghubi2* Correspondence:[email protected] Madan Consulting Eng,Tehran, IranFull list of author information isavailable at the end of the article
©4rt
Abstract
Background: In this research, Two and three-dimensional slope stability analyses offinal slope for Miduk copper mine is investigated by using distinct element code. Theseanalyses were repeated in three positions (dry- drained- wet) and were done for fourwalls of the mine; including eastern wall, northern wall, western wall and southern wall.
Methods: The stability of Miduk copper mine walls were accomplished by distinctelement code (UDEC&3DEC). Both 2D and 3D slope stability analyses were performedto establish the representative shear strength parameters to use in the analyses and toexamine the differences in the results. The extended Mohr–Coulomb failure criterionwas used for analyses. The rock mass was assumed to be permeable and also by theobtained data from surveying, laboratory tests and field observations.
Results: The results are as follows:- Water and pore pressure in the faults and main joints were the most importantdestabilizer factors in these analyses.- The factor of safety after the drainage improved (27–34) % and (20–28) % based onthe 3D and 2D slope stability analyses, respectively.- The difference in factors of safety between the 2D and 3D slope stability analyses forthe deeper groundwater table (water level in the elevation 2540 on the walls) is lessthan 7 %.
Conclusion: The factors of safety obtained from 2D slope stability analyses are notnecessarily more conservative than 3D slope stability analyses. Analyses of the slope afterlowering of groundwater table by horizontal drains showed that the factor of safety ofthe slope has improved tremendously. The differences in factors of safety for 2D and 3Dslope stability analyses are greater for low groundwater table as compared with thosefor high groundwater table. The results illustrated how 3D slope stability analyses havebecome less daunting to perform and can be incorporated into routine slope designs.
Keywords: Two dimensional; Three dimensional; Slope stability; Distinct element code;Factor of safety
IntroductionSlopes of mines and quarries, some of which may reach several hundred meters deep,
must be regarded as "geotechnical works" in the sense that we speak of mine works or
civil engineering works. Their design and their implementation must be conducted ac-
cording to rules of art with the general objective to define the geometry that will en-
sure the safety of the structure while minimizing the volume of material to be
excavated, and therefore the final cost of the project. In addition to these economic
2015 Shamsoddin Saeed et al. Open Access This article is distributed under the terms of the Creative Commons Attribution.0 International License (http://creativecommons.org/licenses/by/4.0/), which permits unrestricted use, distribution, andeproduction in any medium, provided you give appropriate credit to the original author(s) and the source, provide a link tohe Creative Commons license, and indicate if changes were made.
Shamsoddin Saeed et al. International Journal of Geo-Engineering (2015) 6:9 Page 2 of 13
issues, specific concerns about the environment must be considered, particularly in the
context of procedures for abandonment of mine sites where the problems of long-term
slope stability may arise. But these works are, above all, geomechanical objects for
which the geological structure, the nature of the constituent materials and their mech-
anical behavior control the process of deformation and failure considered in the slope
design This close connection with the geological structures therefore requires first to
identify these structures in order to implement the appropriate means of investigation,
modelling and calculation (Fleurisson 2012).
Three-dimensional (3D) slope stability analysis is still not routinely used by geotech-
nical engineers even though most slope stability problems are three-dimensional. This
is due to several reasons. Firstly, it is commonly believed that two-dimensional (2D)
slope stability analysis provides a more conservative estimate of the 3D slope stability
problem (e.g., (Li et al. 2009; Li et al. 2010; Michalowski 2010)). Secondly a 3D slope sta-
bility analysis is more elaborate to conduct as compared with a 2D slope stability analysis.
Thirdly, it is more difficult to input data and visualise the output of a 3D slope stability
analysis. However, rapid progress in computation and visualisation is making 3D slope
stability analysis more accessible to geotechnical engineers (Leong and Rahardjo 2012).
Discontinuum modelingDiscontinuum methods treat the rock slope as a discontinuous rock mass by considering
it as an assemblage of rigid or deformable blocks. The analysis includes sliding along and
opening/closure of rock discontinuities controlled principally by the joint normal and joint
shear stiffness. Discontinuum modeling constitutes the most commonly applied numerical
approach to rock slope analysis, the most popular method being the distinct-element
method (Itasca 2001). Distinct-element codes such as UDEC and 3DEC (Hart 1993) use a
force-displacement law specifying interaction between the deformable joint bounded
blocks and Newton’s second law of motion, providing displacements induced within the
rock slope. UDEC and 3DEC are particularly well suited to problems involving jointed
media and have been used extensively in the investigation of both landslides and surface
mine slopes. The influence of external factors such as underground mining, earthquakes
and groundwater pressure on block sliding and deformation can also be simulated.
Discontinuities play a major role in the design and maintenance of opencast pits,
their presence affecting the mechanical and hydrogeological properties of the rock
masses. Scanline surveys were carried out in selected areas of the open pit at Miduk ei-
ther where failure had occurred or where the potential for failure existed (Sen and Kazi
1984). Numerous parameters were measured for each discontinuity such as roughness,
dip and dip direction, spacing, continuity, joint aperture, and the presence of gouge.
Joint profile readings were taken (Stimpson 1982) with a carpenters comb and com-
pared with the joint roughness profiles of (Barton 1976). Detailed structural mapping
was also undertaken of each face, the data collected including the lithology, dominant
joint sets, critical joint spacing, veins and any faults.
The DIPS software program was used to generate the stereonets from the scanline
survey data collected. For each region a contoured pole data stereonet with joint set
windows was constructed. The stereonets then were analysed according to procedures
given in (Hoek and Bray 1981) in order to assess potential modes of failure, thereby
allowing potential failure zones to be identified.
Shamsoddin Saeed et al. International Journal of Geo-Engineering (2015) 6:9 Page 3 of 13
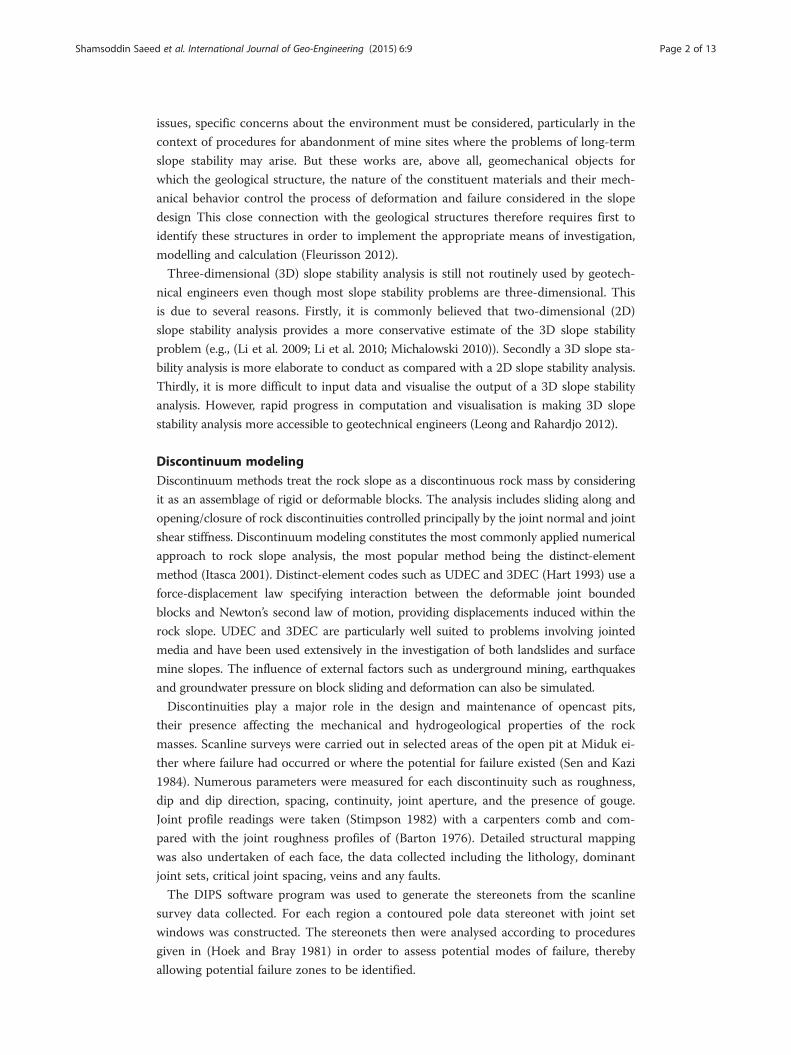
Case descriptionThe Miduk porphyry copper deposit is positioned in the Shahr-Babak area in Kerman
province, Iran (Fig. 1). Ore in Miduk is fungi-form with 350*400 m dimensions and its
upper part consists of oxide-zone (malachite and azurite mineral) and supergene-zone
(mostly culcosite). Figure 2 shows Geological map of Miduk Copper mine.
This deposit is located 85 km NW of the Sar Cheshmeh porphyry copper deposit. Pre-
liminary mineral exploration was carried out in 1967–1970 by Parjam and Metallge-
sellschaft (Hassanzadeh 1993). So far, more than 50 diamond drill holes with a maximum
depth of 1013 m have proved the existence of the sizeable and potential porphyry copper
mineralization at the Miduk deposit. The orebody contains 170 million tons of ore, with
an average grade of 0.86 % Cu, 0.007 % Mo, 82 ppb Au and 1.8 ppm Ag. Supergene en-
richment blankets average approximately 50 m thickness and comprise the primary
source of Cu ore (Taghipour et al. 2008).
In the course of the study, geotechnical mapping was undertaken to determine the
critical orientation of geological discontinuities. Physico-mechanical properties of the
rock materials were obtained by laboratory tests conducted on samples cored from ex-
ploration drilling and rock blocks taken directly from the mine.
Three major joint sets have been recognized at Miduk, which are related to the regional
tectonic history. They have an important influence on slope stability in the open pit, not-
ably in terms of planar and wedge failures. Detailed geological and geotechnical data are
Fig. 1 Location of MIDUK copper mine
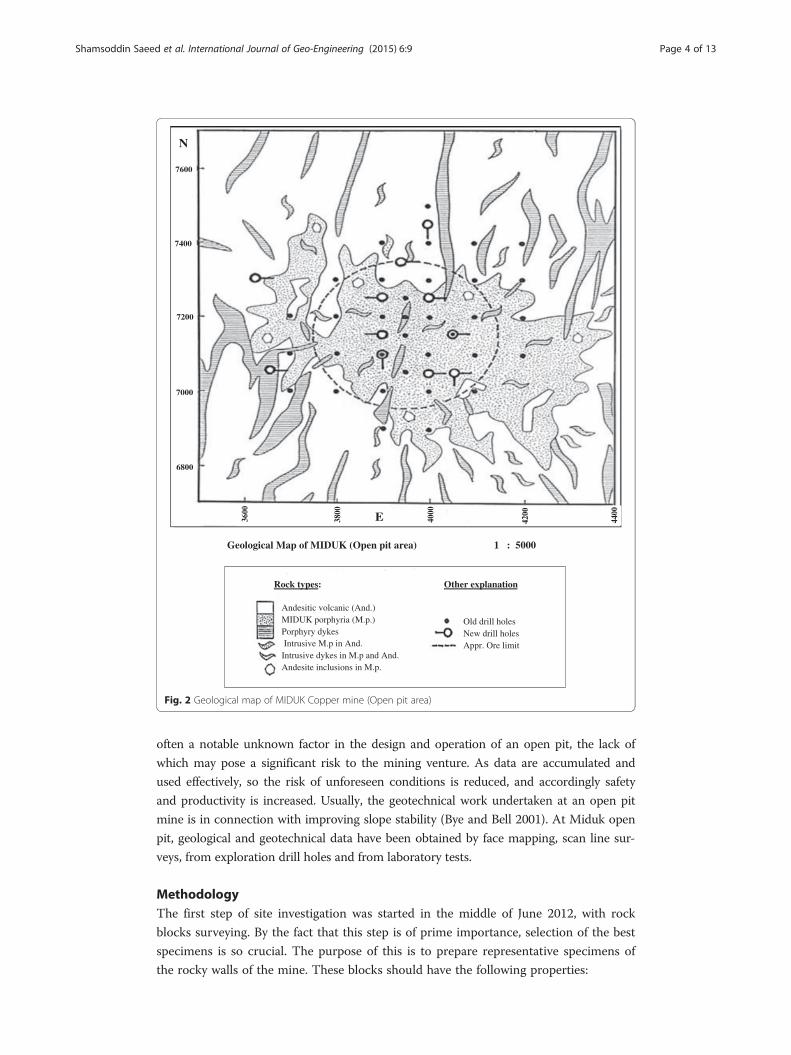
Geological Map of MIDUK (Open pit area) 1 : 5000
Rock types: Other explanation
Andesitic volcanic (And.)MIDUK porphyria (M.p.)Porphyry dykes Intrusive M.p in And.
Intrusive dykes in M.p and And.Andesite inclusions in M.p.
Old drill holesNew drill holesAppr. Ore limit
3600
3800
4000
4200
4400
6800
7000
7200
7400
7600
N
E
Fig. 2 Geological map of MIDUK Copper mine (Open pit area)
Shamsoddin Saeed et al. International Journal of Geo-Engineering (2015) 6:9 Page 4 of 13
often a notable unknown factor in the design and operation of an open pit, the lack of
which may pose a significant risk to the mining venture. As data are accumulated and
used effectively, so the risk of unforeseen conditions is reduced, and accordingly safety
and productivity is increased. Usually, the geotechnical work undertaken at an open pit
mine is in connection with improving slope stability (Bye and Bell 2001). At Miduk open
pit, geological and geotechnical data have been obtained by face mapping, scan line sur-
veys, from exploration drill holes and from laboratory tests.
MethodologyThe first step of site investigation was started in the middle of June 2012, with rock
blocks surveying. By the fact that this step is of prime importance, selection of the best
specimens is so crucial. The purpose of this is to prepare representative specimens of
the rocky walls of the mine. These blocks should have the following properties:
Shamsoddin Saeed et al. International Journal of Geo-Engineering (2015) 6:9 Page 5 of 13
– Be representative
– Should have minimum amount of joint and discontinuity
– Can be carried to the place of coring
Because of high jointing, large amount of discontinuities and accessibility restrictions
to the all benches of the mine, this step encountered with limitations. At first, rocky
units of every benches and their contacts characterized by an engineering team. After
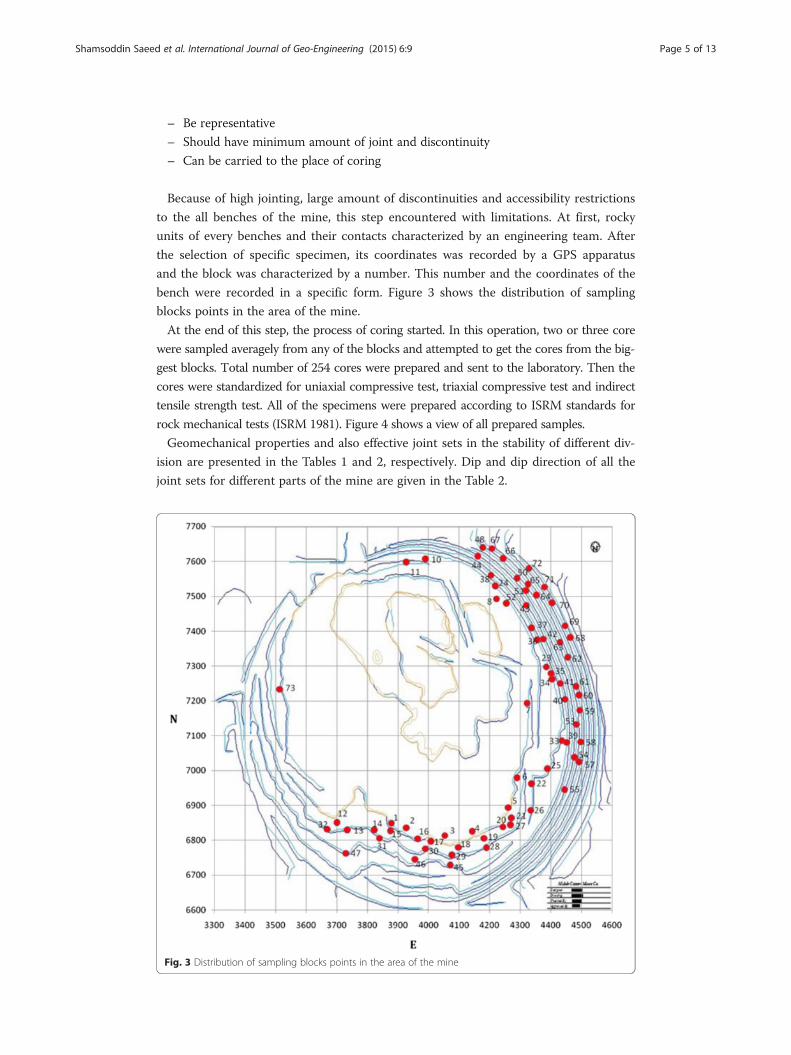
the selection of specific specimen, its coordinates was recorded by a GPS apparatus
and the block was characterized by a number. This number and the coordinates of the
bench were recorded in a specific form. Figure 3 shows the distribution of sampling
blocks points in the area of the mine.
At the end of this step, the process of coring started. In this operation, two or three core
were sampled averagely from any of the blocks and attempted to get the cores from the big-
gest blocks. Total number of 254 cores were prepared and sent to the laboratory. Then the
cores were standardized for uniaxial compressive test, triaxial compressive test and indirect
tensile strength test. All of the specimens were prepared according to ISRM standards for
rock mechanical tests (ISRM 1981). Figure 4 shows a view of all prepared samples.
Geomechanical properties and also effective joint sets in the stability of different div-
ision are presented in the Tables 1 and 2, respectively. Dip and dip direction of all the
joint sets for different parts of the mine are given in the Table 2.
Fig. 3 Distribution of sampling blocks points in the area of the mine
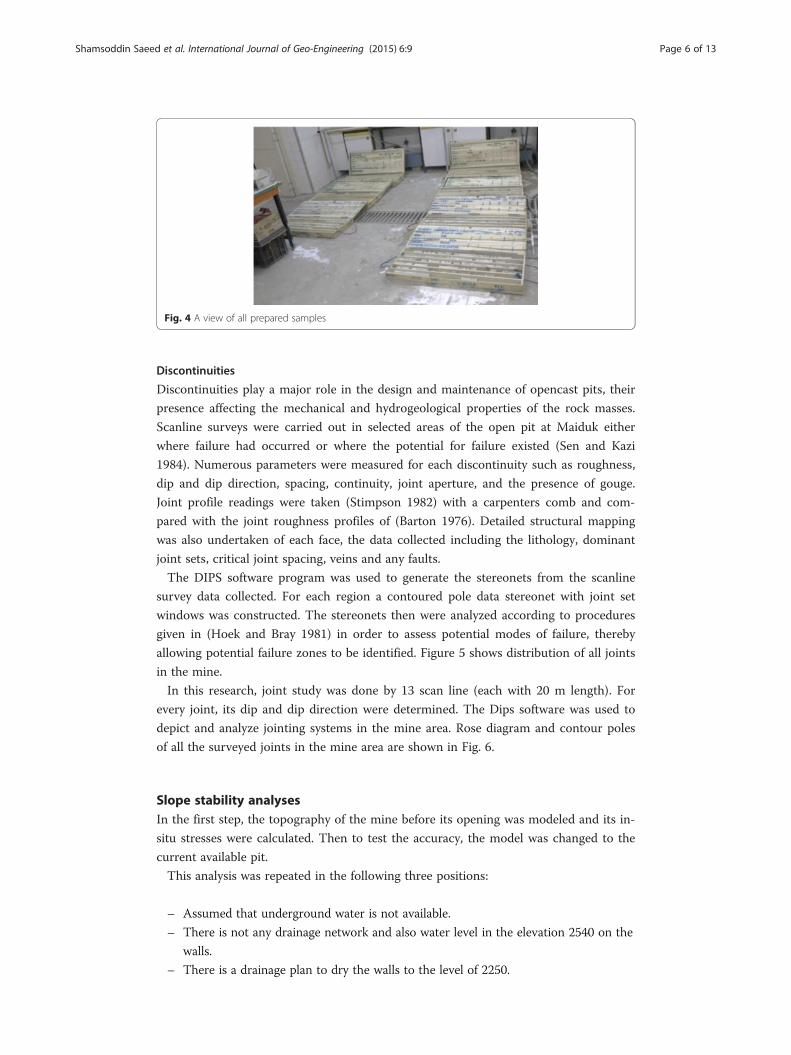
Fig. 4 A view of all prepared samples
Shamsoddin Saeed et al. International Journal of Geo-Engineering (2015) 6:9 Page 6 of 13
Discontinuities
Discontinuities play a major role in the design and maintenance of opencast pits, their
presence affecting the mechanical and hydrogeological properties of the rock masses.
Scanline surveys were carried out in selected areas of the open pit at Maiduk either
where failure had occurred or where the potential for failure existed (Sen and Kazi
1984). Numerous parameters were measured for each discontinuity such as roughness,
dip and dip direction, spacing, continuity, joint aperture, and the presence of gouge.
Joint profile readings were taken (Stimpson 1982) with a carpenters comb and com-
pared with the joint roughness profiles of (Barton 1976). Detailed structural mapping
was also undertaken of each face, the data collected including the lithology, dominant
joint sets, critical joint spacing, veins and any faults.
The DIPS software program was used to generate the stereonets from the scanline
survey data collected. For each region a contoured pole data stereonet with joint set
windows was constructed. The stereonets then were analyzed according to procedures
given in (Hoek and Bray 1981) in order to assess potential modes of failure, thereby
allowing potential failure zones to be identified. Figure 5 shows distribution of all joints
in the mine.
In this research, joint study was done by 13 scan line (each with 20 m length). For
every joint, its dip and dip direction were determined. The Dips software was used to
depict and analyze jointing systems in the mine area. Rose diagram and contour poles
of all the surveyed joints in the mine area are shown in Fig. 6.
Slope stability analysesIn the first step, the topography of the mine before its opening was modeled and its in-
situ stresses were calculated. Then to test the accuracy, the model was changed to the
current available pit.
This analysis was repeated in the following three positions:
– Assumed that underground water is not available.
– There is not any drainage network and also water level in the elevation 2540 on the
walls.
– There is a drainage plan to dry the walls to the level of 2250.
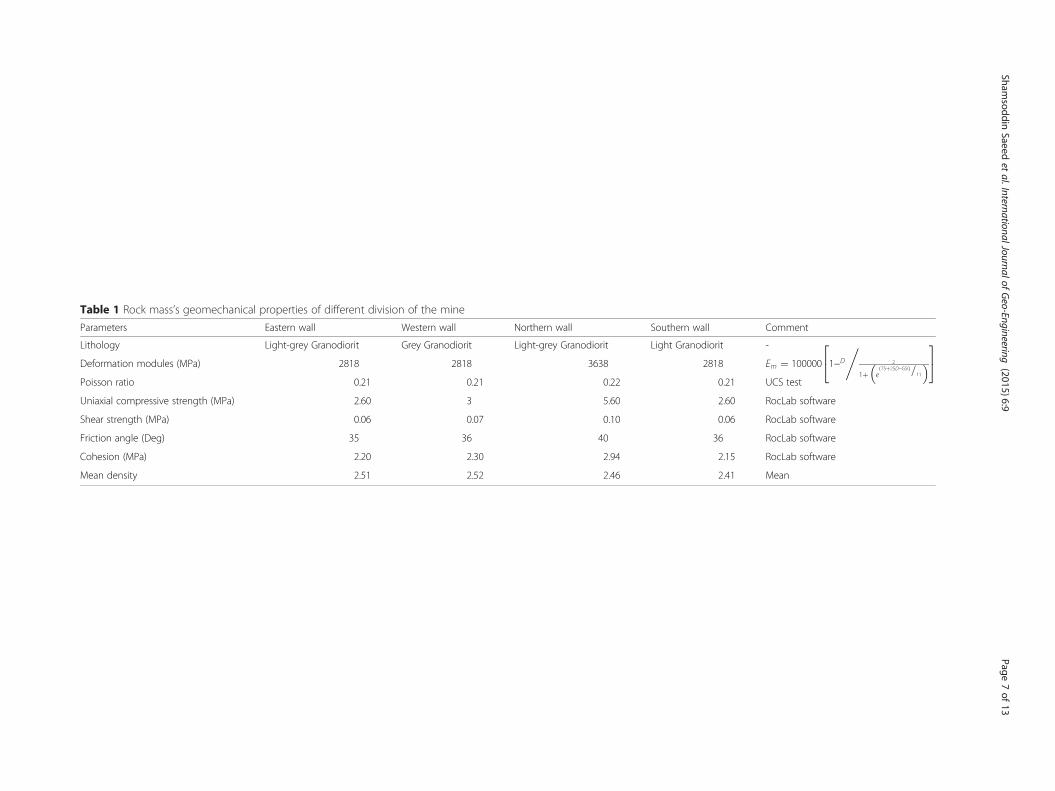
Table 1 Rock mass’s geomechanical properties of different division of the mine
Parameters Eastern wall Western wall Northern wall Southern wall Comment
Lithology Light-grey Granodiorit Grey Granodiorit Light-grey Granodiorit Light Granodiorit -
Deformation modules (MPa) 2818 2818 3638 2818 Em ¼ 100000 1−D 2
1þ e75þ25D−GSIð Þ=11
� �, 3
524
Poisson ratio 0.21 0.21 0.22 0.21 UCS test
Uniaxial compressive strength (MPa) 2.60 3 5.60 2.60 RocLab software
Shear strength (MPa) 0.06 0.07 0.10 0.06 RocLab software
Friction angle (Deg) 35 36 40 36 RocLab software
Cohesion (MPa) 2.20 2.30 2.94 2.15 RocLab software
Mean density 2.51 2.52 2.46 2.41 Mean
Shamsoddin
Saeedet
al.InternationalJournalofGeo-Engineering
(2015) 6:9 Page
7of
13
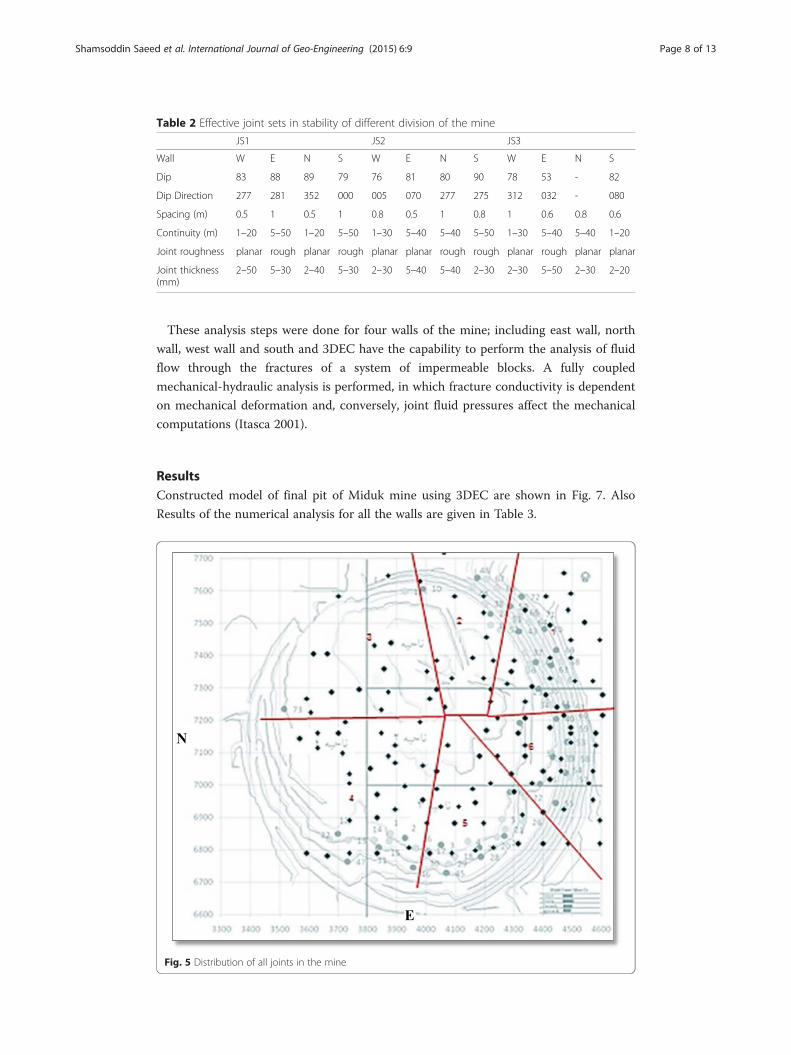
Table 2 Effective joint sets in stability of different division of the mine
JS1 JS2 JS3
Wall W E N S W E N S W E N S
Dip 83 88 89 79 76 81 80 90 78 53 - 82
Dip Direction 277 281 352 000 005 070 277 275 312 032 - 080
Spacing (m) 0.5 1 0.5 1 0.8 0.5 1 0.8 1 0.6 0.8 0.6
Continuity (m) 1–20 5–50 1–20 5–50 1–30 5–40 5–40 5–50 1–30 5–40 5–40 1–20
Joint roughness planar rough planar rough planar planar rough rough planar rough planar planar
Joint thickness(mm)
2–50 5–30 2–40 5–30 2–30 5–40 5–40 2–30 2–30 5–50 2–30 2–20
Shamsoddin Saeed et al. International Journal of Geo-Engineering (2015) 6:9 Page 8 of 13
These analysis steps were done for four walls of the mine; including east wall, north
wall, west wall and south and 3DEC have the capability to perform the analysis of fluid
flow through the fractures of a system of impermeable blocks. A fully coupled
mechanical-hydraulic analysis is performed, in which fracture conductivity is dependent
on mechanical deformation and, conversely, joint fluid pressures affect the mechanical
computations (Itasca 2001).
ResultsConstructed model of final pit of Miduk mine using 3DEC are shown in Fig. 7. Also
Results of the numerical analysis for all the walls are given in Table 3.
Fig. 5 Distribution of all joints in the mine
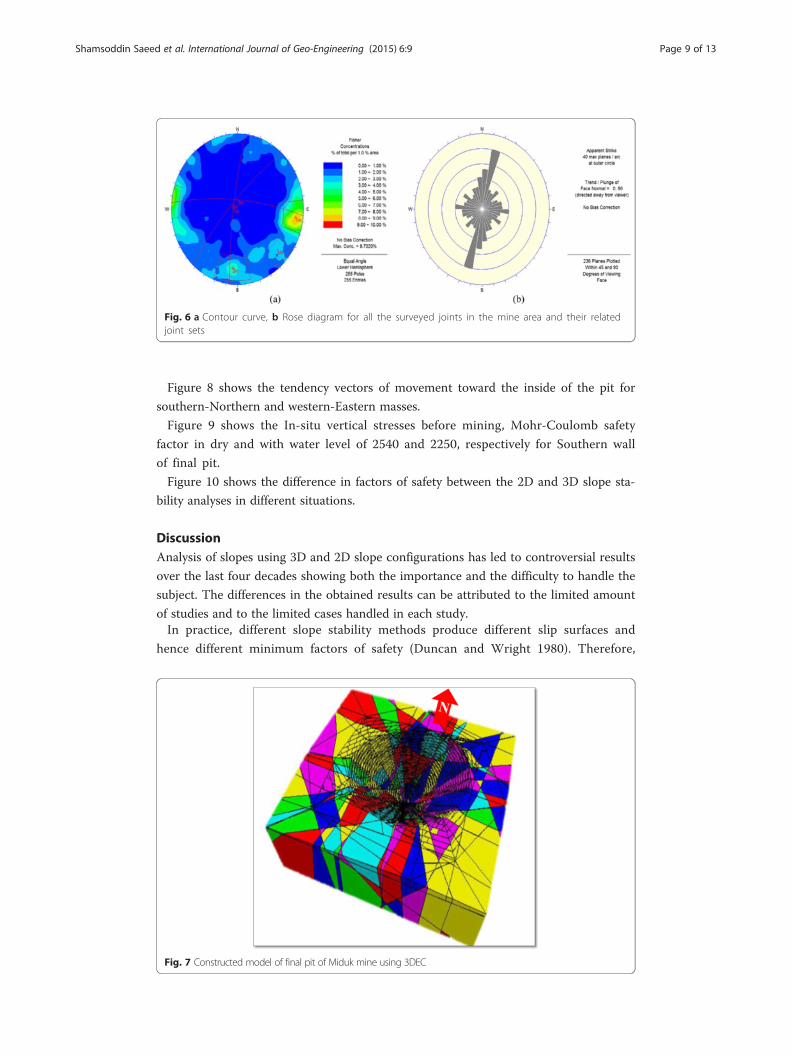
Fig. 6 a Contour curve, b Rose diagram for all the surveyed joints in the mine area and their relatedjoint sets
Shamsoddin Saeed et al. International Journal of Geo-Engineering (2015) 6:9 Page 9 of 13
Figure 8 shows the tendency vectors of movement toward the inside of the pit for
southern-Northern and western-Eastern masses.
Figure 9 shows the In-situ vertical stresses before mining, Mohr-Coulomb safety
factor in dry and with water level of 2540 and 2250, respectively for Southern wall
of final pit.
Figure 10 shows the difference in factors of safety between the 2D and 3D slope sta-
bility analyses in different situations.
DiscussionAnalysis of slopes using 3D and 2D slope configurations has led to controversial results
over the last four decades showing both the importance and the difficulty to handle the
subject. The differences in the obtained results can be attributed to the limited amount
of studies and to the limited cases handled in each study.In practice, different slope stability methods produce different slip surfaces and
hence different minimum factors of safety (Duncan and Wright 1980). Therefore,
Fig. 7 Constructed model of final pit of Miduk mine using 3DEC
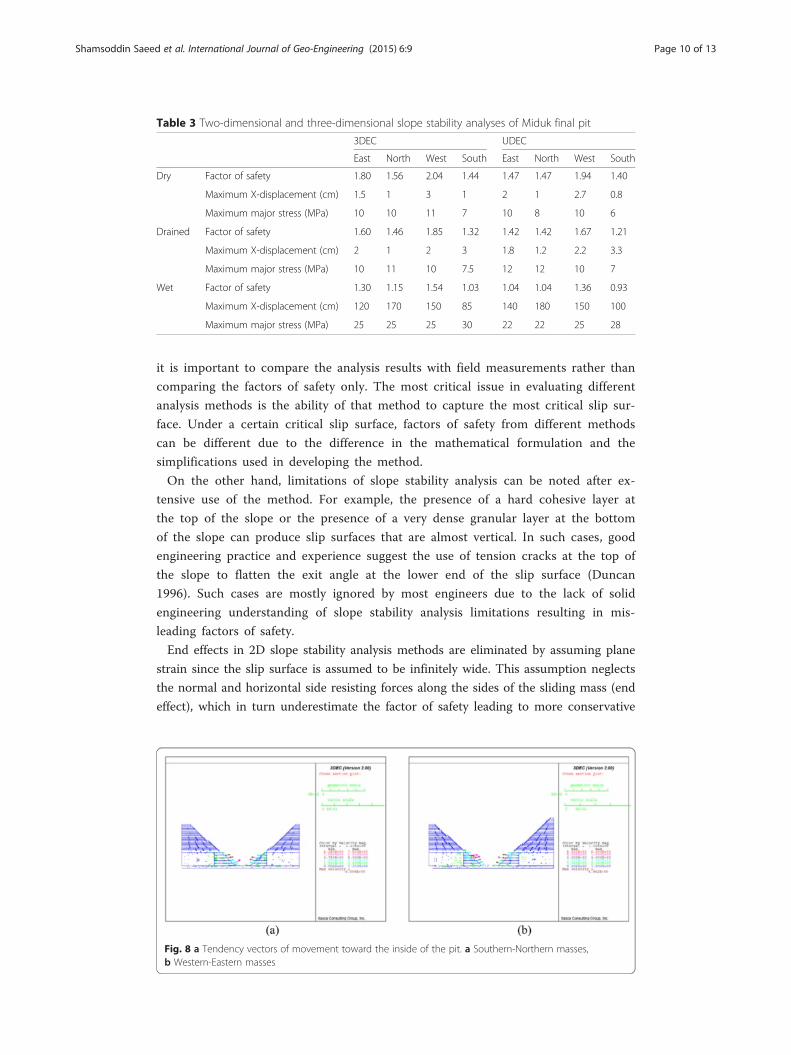
Table 3 Two-dimensional and three-dimensional slope stability analyses of Miduk final pit
3DEC UDEC
East North West South East North West South
Dry Factor of safety 1.80 1.56 2.04 1.44 1.47 1.47 1.94 1.40
Maximum X-displacement (cm) 1.5 1 3 1 2 1 2.7 0.8
Maximum major stress (MPa) 10 10 11 7 10 8 10 6
Drained Factor of safety 1.60 1.46 1.85 1.32 1.42 1.42 1.67 1.21
Maximum X-displacement (cm) 2 1 2 3 1.8 1.2 2.2 3.3
Maximum major stress (MPa) 10 11 10 7.5 12 12 10 7
Wet Factor of safety 1.30 1.15 1.54 1.03 1.04 1.04 1.36 0.93
Maximum X-displacement (cm) 120 170 150 85 140 180 150 100
Maximum major stress (MPa) 25 25 25 30 22 22 25 28
Shamsoddin Saeed et al. International Journal of Geo-Engineering (2015) 6:9 Page 10 of 13
it is important to compare the analysis results with field measurements rather than
comparing the factors of safety only. The most critical issue in evaluating different
analysis methods is the ability of that method to capture the most critical slip sur-
face. Under a certain critical slip surface, factors of safety from different methods
can be different due to the difference in the mathematical formulation and the
simplifications used in developing the method.
On the other hand, limitations of slope stability analysis can be noted after ex-
tensive use of the method. For example, the presence of a hard cohesive layer at
the top of the slope or the presence of a very dense granular layer at the bottom
of the slope can produce slip surfaces that are almost vertical. In such cases, good
engineering practice and experience suggest the use of tension cracks at the top of
the slope to flatten the exit angle at the lower end of the slip surface (Duncan
1996). Such cases are mostly ignored by most engineers due to the lack of solid
engineering understanding of slope stability analysis limitations resulting in mis-
leading factors of safety.
End effects in 2D slope stability analysis methods are eliminated by assuming plane
strain since the slip surface is assumed to be infinitely wide. This assumption neglects
the normal and horizontal side resisting forces along the sides of the sliding mass (end
effect), which in turn underestimate the factor of safety leading to more conservative
Fig. 8 a Tendency vectors of movement toward the inside of the pit. a Southern-Northern masses,b Western-Eastern masses
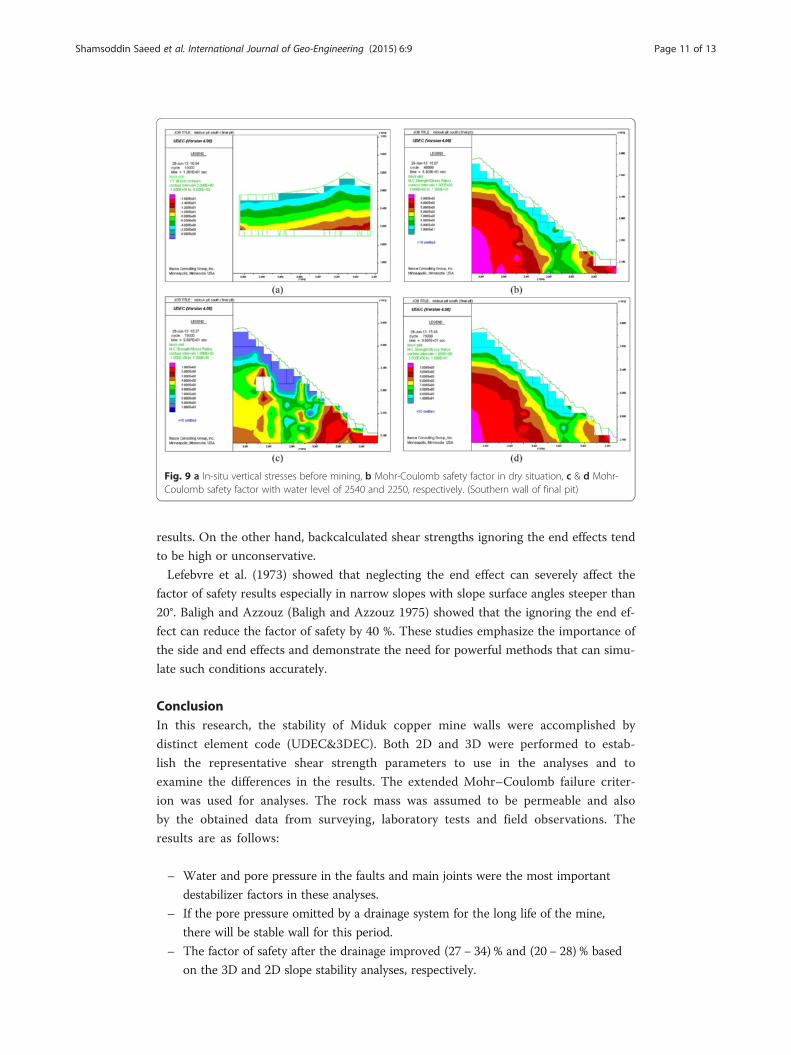
Fig. 9 a In-situ vertical stresses before mining, b Mohr-Coulomb safety factor in dry situation, c & d Mohr-Coulomb safety factor with water level of 2540 and 2250, respectively. (Southern wall of final pit)
Shamsoddin Saeed et al. International Journal of Geo-Engineering (2015) 6:9 Page 11 of 13
results. On the other hand, backcalculated shear strengths ignoring the end effects tend
to be high or unconservative.
Lefebvre et al. (1973) showed that neglecting the end effect can severely affect the
factor of safety results especially in narrow slopes with slope surface angles steeper than
20°. Baligh and Azzouz (Baligh and Azzouz 1975) showed that the ignoring the end ef-
fect can reduce the factor of safety by 40 %. These studies emphasize the importance of
the side and end effects and demonstrate the need for powerful methods that can simu-
late such conditions accurately.
ConclusionIn this research, the stability of Miduk copper mine walls were accomplished by
distinct element code (UDEC&3DEC). Both 2D and 3D were performed to estab-
lish the representative shear strength parameters to use in the analyses and to
examine the differences in the results. The extended Mohr–Coulomb failure criter-
ion was used for analyses. The rock mass was assumed to be permeable and also
by the obtained data from surveying, laboratory tests and field observations. The
results are as follows:
– Water and pore pressure in the faults and main joints were the most important
destabilizer factors in these analyses.
– If the pore pressure omitted by a drainage system for the long life of the mine,
there will be stable wall for this period.
– The factor of safety after the drainage improved (27 − 34) % and (20 − 28) % based
on the 3D and 2D slope stability analyses, respectively.
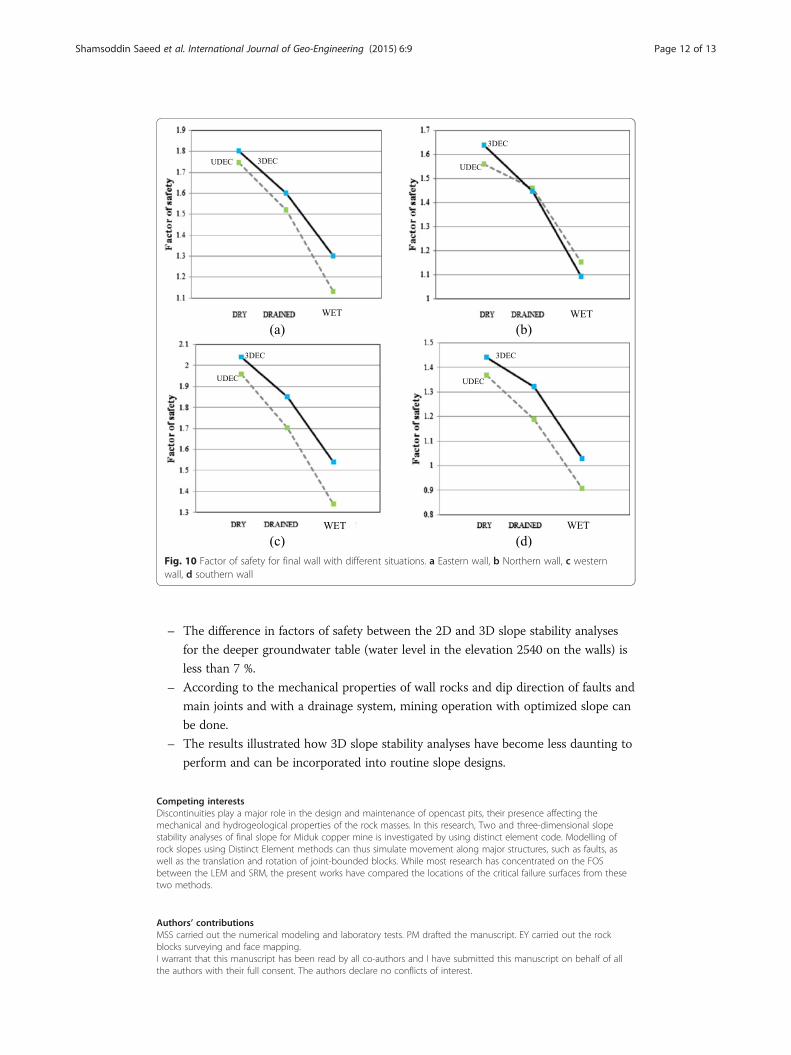
Fig. 10 Factor of safety for final wall with different situations. a Eastern wall, b Northern wall, c westernwall, d southern wall
Shamsoddin Saeed et al. International Journal of Geo-Engineering (2015) 6:9 Page 12 of 13
– The difference in factors of safety between the 2D and 3D slope stability analyses
for the deeper groundwater table (water level in the elevation 2540 on the walls) is
less than 7 %.
– According to the mechanical properties of wall rocks and dip direction of faults and
main joints and with a drainage system, mining operation with optimized slope can
be done.
– The results illustrated how 3D slope stability analyses have become less daunting to
perform and can be incorporated into routine slope designs.
Competing interestsDiscontinuities play a major role in the design and maintenance of opencast pits, their presence affecting themechanical and hydrogeological properties of the rock masses. In this research, Two and three-dimensional slopestability analyses of final slope for Miduk copper mine is investigated by using distinct element code. Modelling ofrock slopes using Distinct Element methods can thus simulate movement along major structures, such as faults, aswell as the translation and rotation of joint-bounded blocks. While most research has concentrated on the FOSbetween the LEM and SRM, the present works have compared the locations of the critical failure surfaces from thesetwo methods.
Authors’ contributionsMSS carried out the numerical modeling and laboratory tests. PM drafted the manuscript. EY carried out the rockblocks surveying and face mapping.I warrant that this manuscript has been read by all co-authors and I have submitted this manuscript on behalf of allthe authors with their full consent. The authors declare no conflicts of interest.
Shamsoddin Saeed et al. International Journal of Geo-Engineering (2015) 6:9 Page 13 of 13
Author details1Kusha Madan Consulting Eng, Tehran, Iran. 2Department of Mining and Metallurgical, AmirKabir University ofTechnology, Tehran, Iran.
Received: 8 August 2014 Accepted: 10 August 2015
References
Baligh, M, & Azzouz, AS. (1975). End effects on stability of cohesive slopes. Journal of the Geotechnical EngineeringDivision, ASCE, 101(GT11), 1105–1117.Barton, N. (1976). The shear strength of rock and rock joints. International Journal of Rock Mechanics and Mining Science
and Geomechanics Abstracts, 13, 255–279.Bye, AR, & Bell, FG. (2001). Stability assessment and slope design at sandsloot open pit, South Africa. International
Journal of Rock Mechanics and Mining Sciences, 38, 449–466.Duncan, JM. (1996). State of the Art: limit equilibrium and finite element analysis of slopes. Journal of Geotechnical
Engineering, 122(7), 577596.Duncan, JM, & Wright, SG. (1980). The accuracy of equilibrium methods of slope stability analysis. Engineering Geology
(Amsterdam, Netherlands), 16(1/2), 5–17.Fleurisson, J-A. (2012). “Slope Design and Implementation in Open Pit Mines: Geological and Geomechanical
Approach”. Procedia Engineering, 46, 27–38.Hart, RD. (1993). An introduction to distinct element modeling for rock engineering. In Comprehensive rock engineering:
principles, practice & projects (pp. 245–261). Oxford: Pergamon Press.Hassanzadeh, J. (1993). Metallogenic and tectono-magmatic events in SE sector of the Cenozoic active continental margin
of central Iran (Shahr-Babak, Kerman Province) (PhD Thesis, p. 201). Los Angeles: University of California.Hoek, E, & Bray, JW. (1981). Rock slope engineering,3rd ed. London: Institution Mining and Metallurgy.ISRM. (1981). Rock characterizition, testing and monitoring. In ET Brown (Ed.), ISRM suggested methods (p. 211). New-York:
Pergamon Press.Itasca. (2001). Itasca software products - FLAC, FLAC3D, UDEC, 3DEC, PFC. Minneapolis: Itasca Consulting Group Inc.Lefebvre, G, Duncan, JM, & Wilson, EL. (1973). Three dimensional finite element analysis of dams. Journal of Soil
Mechanics and Found Division, ASCE, 99(7), 495–507.Leong, EC, & Rahardjo, H. (2012). Two and three-dimensional slope stability reanalyses of Bukit Batok slope. Computers
and Geotechnics, 42, 81–88.Li, AJ, Merifield, RS, & Lyamin, AV. (2009). Limit analysis solutions for three dimensional undrained slopes. Computers
and Geotechnics, 36, 1330–1351.Li, AJ, Merifield, RS, & Lyamin, AV. (2010). Three-dimensional stability charts for slopes based on limit analysis methods.
Canadian Geotechnical Journal, 47, 1316–1334.Michalowski, RL. (2010). Limit analysis and stability charts for 3D slope failures. Journal of Geotechnical and
Geoenvironmental Engineering, 136(4), 583–593.Sen, Z, & Kazi, A. (1984). Discontinuity spacing and RQD estimates from finite length scanlines. International Journal of
Rock Mechanics and Mining Science and Geomechanics Abstracts, 21, 203–212.Stimpson, B. (1982). A rapid field method for recording joint roughness profiles. International Journal of Rock Mechanics
and Mining Science and Geomechanics Abstracts, 19, 345–346.Taghipour, N, Aftabi, A, & Mathur, R. (2008). Geology and Re-Os geochronology of mineralization of the maiduk
porphyry copper deposit, Iran. Resource Geology, 58(2), 143–160.
Submit your manuscript to a journal and benefi t from:
7 Convenient online submission
7 Rigorous peer review
7 Immediate publication on acceptance
7 Open access: articles freely available online
7 High visibility within the fi eld
7 Retaining the copyright to your article
Submit your next manuscript at 7 springeropen.com