Embed Size (px)
Citation preview
Research Report 470
SOME UNCERTAINTIES OF SLOPE STABILITY ANALYSES
by
Robert C. Deen Assistant Director
Tommy C. Hopkins Research Engineer Chief
and
David L. Allen Research Engiqeer Pri'ncipal
Division of Research Bureau of Highways
DEPARTMENT OF TRANSPORTATION Commonwealth of Kentucky
offered for publication to the
Transportation Research Board
April 1977

SOME UNCERTAINTIES OF
SLOPE STABILITY ANALYSES
by
R. C. Deen, T. C. Hopkins, and D. L. Allen
ABSTRACT
Some practical limitations of total stress and effective stress analyses are discussed. For clays having
a liquidity index of 0.36 or greater, ¢-equal-zero analyses based on laboratory undrained shear strengths
give factors of safety close to the actual factor of safety. However, based on field vane strengths,
¢·equal-zero analyses may yield factors of safety which may be too high. The difference between field
vane and calculated shear strengths increased as the plasticity index increased. For clays having a liquidity
index less than 0.36, ¢-equal-zero analyses using laboratory undrained shear strengths give factors of
safety that are much too high; but the strength parameters can be corrected by the empirical relationship
presented herein. An empirical relationship for correcting vane shear strength is also presented. A method
is proposed for predicting the probable success of a ¢-equal-zero analysis.
Data suggest that overconsolidated clays and clay shales or clays having a liquidity index less than
0.36 pose the greatest slope design dilemma. An effective stress analysis based on peak triaxial shear
strength parameters generally yields factors of safety which are too high; residual shear strength parameters
frequently yield factors of safety which are too low. To approximate the theoretical strength of an
overconsolidated clay which has undergone a process of softening, the effective stress parameters might
be obtained from triaxial tests performed on remolded, normally consolidated clay. It is suggested the
soil be remolded to a moisture content equal to the plastic limit plus the product of 0.36 and the
plasticity index.

Deen, Hopkins, and Allen
SOME UNCERTAINTIES OF
SLOPE STABILITY ANALYSES
by
Robert C. Deen
Assistant Director
Tommy C. Hopkins
Research Engineer Chief
and
David L. Allen
Research Engineer Principal
INTRODUCTION
Two limiting conditions (2) are generally recognized when designing a cutting in a clay or an
embankment on a clay foundation against a "first-time" failure (no pre-existing shear plane). The first
condition is the shortMterm or end-of-const�uction · case in which the water content of the clay does
not change. Excess pore pressures are 100ntrolled by the magnitude of the stresses acting in the clay
or tending toward instability. Significant pore pressure dissipation does not occur. Prediction of the excess
pore pressures is difficult. Consequently, the short-term design is made using the ¢-equal-zero analysis
and the undrained shear strength obtained from unconsolidated-undrained (UU) triaxial tests, unconfined
compression (U) tests, field vane shear (FV) tests, or a combination of these tests.
The second limiting condition is the long-term, steady-seepage case. Pore pressures do not depend
on the magnitude of total stresses and are controlled by the flow pattern of underground water or
the ground-water level. Excess pore pressure dissipation has occurred and the clay exists in a drained
state. Long-term design is performed in terms of effective stress and the drained shear strength parameters,
¢'and c', conventionally obtained from consolidated isotropically, drained triaxial (CID) tests; consolidated
isotropically, undrained triaxial tests with pore pressure measurements (CIU); consolidated-drained, direct
shear (slow) (CDS) tests; or a combination of these tests.
Deen, Hopkins, and Allen 2
For a cutting in a clay, the long-term stability is considered more critical since pore pressures are
initially small or negative and gradually increase toward steady-seepage pore pressures. The increase of
pore pressures causes a decrease in the shear strength of the clay since there is a reduction in effective
stresses. In the case of an embankment on a clay foundation, the short-term stability is considered the
more critical case. For this case, pressures steadily increase to maximum values during construction and
gradually decrease thereafter toward the initial pore pressures, increasing shear strengths with time.
LIMITATIONS OF TOTAL STRESS ANALYSES
Application of the first limiting condition to the design of embankments founded on clay foundations
or to cut slopes without regard to the stress history and moisture state of the clays in the foundation
or slope may lead to erroneous conclusions concerning the safety factor ( 11 ); that is, the undrained
shear strengths obtained from laboratory or field tests may be larger than the actual (back-computed)
shear strengths existing at failure.
Long-Term Stability of Cut and Natural Slopes-- Bishop and Bjerrum (2), summarizing results of
a number of failures in natural slopes and cuts, showed that application of the ¢-equal-zero analysis
to slopes where pore pressure and water content equilibrium have been attained is unreliable. In these
cases, the ¢-equal-zero analysis gave safety factors ranging from 0.6 for sensitive soils to 20 for heavily
overconsolidated soils. Two reasons for the differences between the in situ shear strength and the shear
strength obtained from the undrained test are differences between field and laboratory pore pressures
and migration of water to the failure zone of a slide in overconsolidated clays (9, 18). Lo, et a!. ( 13)
has also shown that the effect of sample size in stiff fissured clays is an important factor in stability
analyses. The shear strength of large samples is less than that of small specimens.
Examination of case records of long-term failures in cuts and natural slopes revealed that large
safety factors are associated with low to negative values of liquidity index while low safety factors are
associated with high values of liquidity index. In data cited by Bishop and Bjerrum, there were four
cases where the safety factor was near one; the liquidity indices ranged from 0.20 to 1.09. In the other
cases, the liquidity indices ranged from about 0.19 to -0.36 while the safety factors ranged from 1.9
to 20.
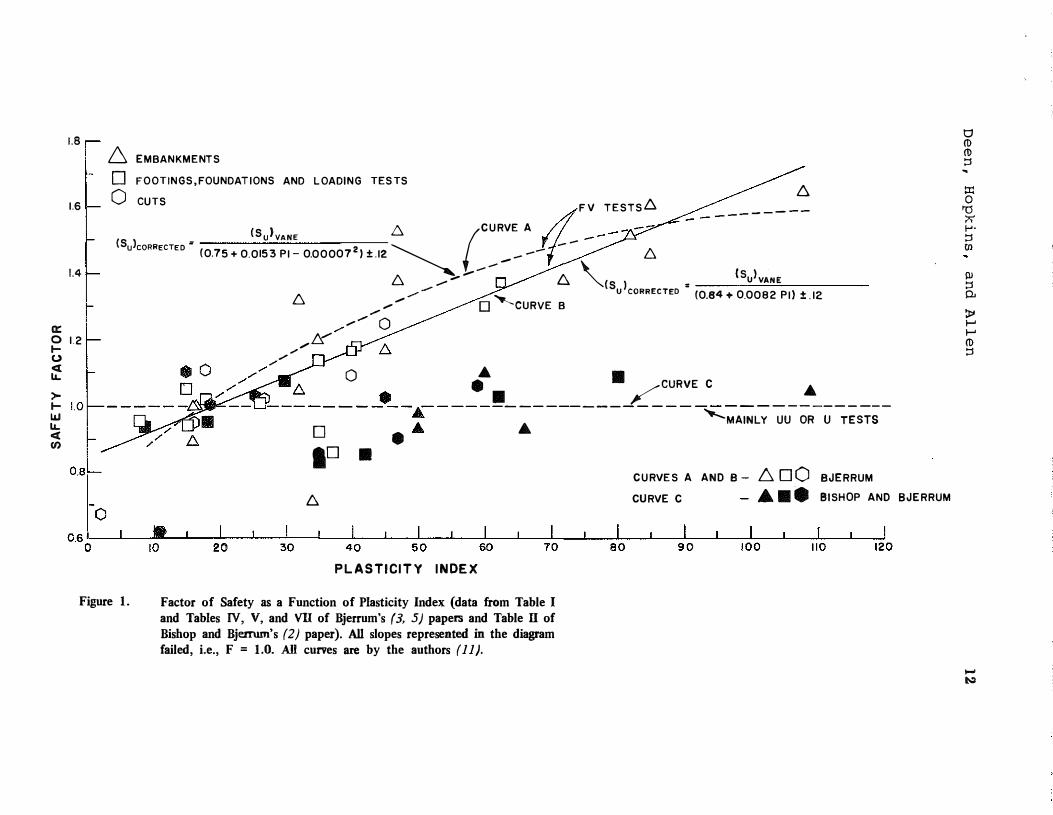
Short-Term Stability of Loads on Soft Foundations -- Bjerrum ( 3, 5) assembled a number of case
records which showed that procedures normally used to determine the short-term stability of
embankments, footings, and load tests on soft clay foundations are unsatisfactory. In those cases, the
¢-equal-zero analysis using undrained shear strengths from field vane shear tests overestimated the safety
factor (open points in Figure I) for soils having liquid limits and plasticity indices in excess of

Deen, Hopkins, and Allen 3
approximately 80 and 30 percent, respectively. Also, the difference between field vane, (Sulvane• and
corrected shear strengths, (Sulcorrected increased as the plasticity index, PI, and the liquid limit of '
the clay increased. Assuming a linear relationship between safety factor and plasticity index, the corrected
shear strength may be expressed as
(Sulcorrected (Sulvane/[(0.84 + 0.0082 PI) ± 0.12]. 1
Data (dark points) assembled by Bishop and Bjerrum (2) representing end-of-construction failures
of footings, fills, and excavations on saturated clay foundations are compared to Bjerrum's data (open
points) in Figure 1. Liquidity indices of the former data ranged from about 0.25 to 1.44. The undrained
strengths of the soils in these analyses were obtained primarily from unconsolidated-undrained tests. While
Bjerrum's data showed that the difference between vane and back-computed shear strengths increased
as the plasticity index of the clay increased, Bishop and Bjerrum's data, in marked contrast, showed
that the computed shear strength and laboratory shear strength were almost equal.
Short-Term Stability of Embankments Founded on Overconsolidated Clays and Clay Shales -- A
number of short-term failures of embankments on overconsolidated soils have occurred, even though
the ¢-equal-zero analysis indicated the embankment slopes should have been stable. Some examples include
case histories by Beene (I), Wright (20), Peterson, et al. (16), and Hopkins and Allen (10). Safety factors
from ¢-equal-zero analyses ranged from 1.23 to 4.0 for these cases; all had liquidity indices less than
0.36.
Short-Term Stability of a Cut or Excavated Slope in Overconsolidated Clays and Clay Shales --
Because the short-term safety factory is usually a maximum during or near the end of construction,
the ¢-equal-zero analysis is oftentimes used to determine the short-term stability of a cut or excavated
slope. However, stability of cuts in overconsolidated clays and clay shales may not always conform to
this concept. For instance, Skempton and Hutchinson ( 19) described two slides in a stiff overconsolidated
London clay. Based on a ¢-equal-zero analysis and undrained shear strengths, the short-term safety factors
were about 1.8.
Proposed Method of Predicting Success in a ¢-Equal-Zero Analysis -- Peck and Lowe (15) presented
a portion of Bishop and Bjerrum's data (long-term failures in cuts and natural slopes) which showed
that the computed safety factor of failed slopes, obtained from a ¢-equal-zero analysis using undrained
strengths, was apparently a function of the liquidity index. Peck and Lowe suggested the possibility
of using that empirical relationship to determine correction factors for laboratory undrained strength
parameters.
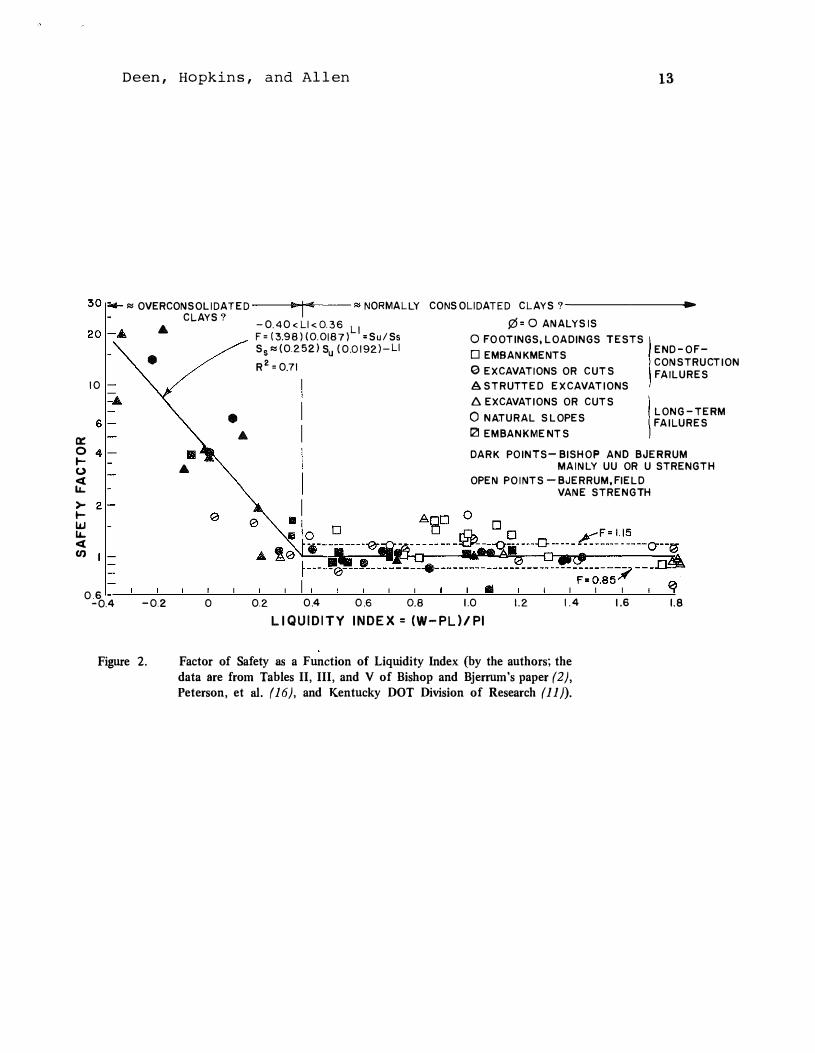
Plotting additional portions of Bishop and Bjerrum's data (2) and Bjerrum's data (5) (safety factor
as a function of liquidity index), a distinctive division can be observed. All data in Figure 2 represent
Deen, Hopkins, and Allen 4
failures where the ¢-equal-zero analysis was performed using undrained shear strengths obtained from
UU, U, or FV tests. In failures where the soils had a liquidity index equal to or greater than approximately
0.36, safety factors estimated from a ¢-equal-zero analysis and UU or U strengths should have an accuracy
within ± 15 percent (see Figure 2), and design safety factors as low as 1.3 may be justified in many
routine designs. Where the undrained strength is obtained from in situ vane shear tests, the vane strength
should be corrected.
In failures where the soils had a liqudity index less than about 0.36, the ¢-equal-zero analysis using
UU or U strengths gave safety factors which were much too high; in situ shear strengths were greatly
overestimated by laboratory tests. For soils having liquidity indices less than 0.36, the safety factor
appears to be a function of the liquidity index, LI:
F (3.98) (o.o1nP. 2 Since the safety factor can be expressed as
F = Su/Ss, 3
where Su is the laboratory undrained shear strength, the corrected laboratory or "softened" shear strength
may be expressed in terms of the standard error as
Ss "' (0.252) Su (O.D192)"LI (10±0.24); 4 and the error in the corrected shear strength may be as large as 70 percent.
LIMITATIONS OF EFFECTIVE STRESS ANALYSES
Uncertainties in the application of the effective stress approach to the design of earth slopes arise
in the selection of shear strength parameters, ¢' and c', and the evaluation of pore pressures. Although
the effective stress method has been successfully applied to normally consolidated and very lightly
overconsolidated clays and silty clays having an intact structure (free of fissures or joints), the method
is not successful when applied to the design of slopes composed of overconsolidated clays and clay
shales. Although much research (4, 17, 18) has been directed toward understanding the characteristics
of those soils, overconsolidated soils still pose the greatest design dilemma to engineers.
Shear Strength Characteristics - Typical stress-strain curves for normally consolidated and
overconsolidated clays, tested similarly under drained conditions, show that both reach a peak strength.
As the overconsolidated soil is strained beyond the peak strength, the shear resistance decreases until
at large strains the strength falls to a (nearly) constant value. This lower limit of resistance is referred
to as the "residual" or "ultimate" strength (17, 18, 19). After the peak strength has been attained,
the shear resistance of the normally consolidated clay may fall only slightly. After large strains, the
shear resistance of the overconsolidated and normally consolidated clays coincide. In heavily
Deen, Hopkins, and Allen 5
overconsolidated plastic clays, there is a large difference in the peak and residual strengths. In silty clays
and soils of low plasticity, this difference is very small. With an increase in clay content, this difference
increases even in normally consolidated clays, although not as much as in overconsolidated clays.
The "softened" shear strength of an overconsolidated clay (as obtained from Equation 4) may be
defmed as the intersection of a horizontal line projected from the peak strength of the normally
consolidated clay with the stress-strain curve of the over consolidated clay (17 ). The softened strength
is intermediate to the peak and residual strengths and probably occurs at much lower strains (representing
a condition wherein a number of small, independent shear planes exist) than the residual strength (wherein
the shear planes have joined to form a well defmed failure plane).
The critical state of a normally consolidated clay can be defined ( 17) as the state (in a drained
condition) in which any further increment in shear distortion will not result in any change in water
content. The water content at the critical state is equal to that ultimately attained by an overconsolidated
clay due to expansion during shear.
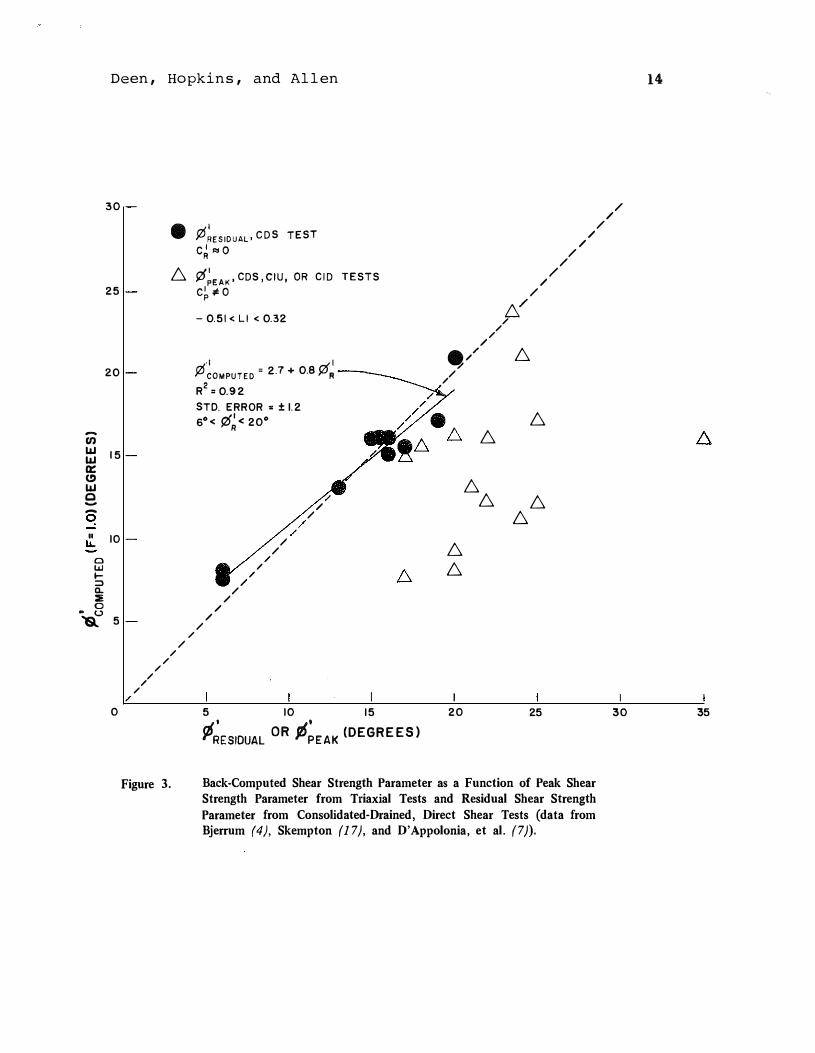
Peak and Residual Shear Strengths -- Bjerrum ( 4) assembled shear strength data on a number of
"first-time" failures of natural and cut slopes in overconsolidated clays and clay shales which showed
that the average shear stress along the failure surface was much smaller than the shear strength measured
from laboratory triaxial tests. In each case, the peak shear strength parameters, ¢ p and c'p• were larger
than the back-computed parameters, ¢'c and c'c (assumed zero), and therefore, the safety factors were
too large. The liquidity indices of these clays ranged from -0.51 to 0.25. Discrepancies between the
field (back-computed) and laboratory strengths are illustrated in Figure 3. The back-computed effective
stress angle of shearing resistance is plotted as a function of the peak effective stress parameter obtained
from triaxial tests. Even neglecting the cohesion, the data plots below the line of equality. If residual
shear strengths are used, there is better agreement between the computed shear strengths and those
determined by direct shear tests.
Use of the residual shear strength parameters, ¢'r and c'r· in effective stress analyses does not
necessarily yield safety factors which are in agreement with the actual safety factor at failure, although
the error in the safety factor based on residual strength is generally smaller than the error in the safety
factor based on peak strength. In Table I, a number of well-documented embankment, cut slope, and
natural slope failures based on the effective stress analysis have been summarized and arranged according
to increasing values of liquidity indices. Except for the case by D' Appolonia, et a!. (7), all cases are
"first-time" failures. Those case records clearly show that the effective stress analysis based on residual
strength generally gives safety factors which are less than one. All of those cases, except for the last
two failures listed in the table, involve soils which have liquidity indices less than 0.36; and the effective

Deen, Hopkins, and Allen 6
stress analysis based on peak strength yields safety factors which are too high and may be as much
as 100 percent in error. Additionally, the use of c'p equal to zero and ¢'p does not always yield the
correct safety factor.
Evaluation of Pore Pressures -- If the excess and initial pore pressures are known when designing
a cutting in clay or an embankment on a clay foundation, the stability of these earth structures may
be determined during or at any time after construction from an effective stress analysis using total pore
pressures. However, methods of estimating excess pore pressures are particularly difficult, and the results
obtained from such methods are highly questionable (see Moh, et a!. (14)). Additionally, to determine
the stability of the cut or embankment at any time, dissipation of excess pore pressures must be estimated,
generally based on the results of consolidation tests which may be very inaccurate. Unless piezometers
are installed to obtain the necessary pore pressure data, the effective stress analysis is limited to analyzing
the long-term stability of cuts and embankments. For this condition, the excess pore pressures are assumed
equal to zero. In the case of a cutting in clay, the pore pressures are obtained from a prediction of
the steady seepage pore pressures. In the case of an embankment, the pore pressures are usually obtained
from groundwater level observations in boreholes. Where large fluctuations in groundwater levels may
exist, inaccurate pore pressure data may be obtained. Where the embankment is located on a sloping
foundation and "damming" of the groundwater may occur, prediction of the steady seepage pore pressures
is very difficult, especially where large fluctuations of the groundwater level may occur.
To make a valid comparison between field and laboratory shear strengths in terms of effective stress,
accurate values of pore pressures existing at the time of failure must be known. The 11back-computed"
shear strength parameters, ¢' c and c' c' are particularly sensitive to the magnitude of the pore pressures
used in the computation. Inaccurate pore pressures may produce an error of several degrees in the
computed parameter, ¢'c· An accurate determination of the pore pressures in a landslide at failure poses
certain difficulties. Even when piezometers are installed, measurements obtained may not correspond
to the pore pressures existing at the time of failure, particularly when the failure is preceded by a heavy
rainfall and field personnel may not be present at the time of failure. In delayed failures where several
years may be required for the pore pressures to reach the steady�state values, use of measured pore
pressures obtained before pore pressure equilization has occurred will lead to computed parameters, ¢'c
and c' c• which cannot validly be compared to laboratory shear strength parameters.
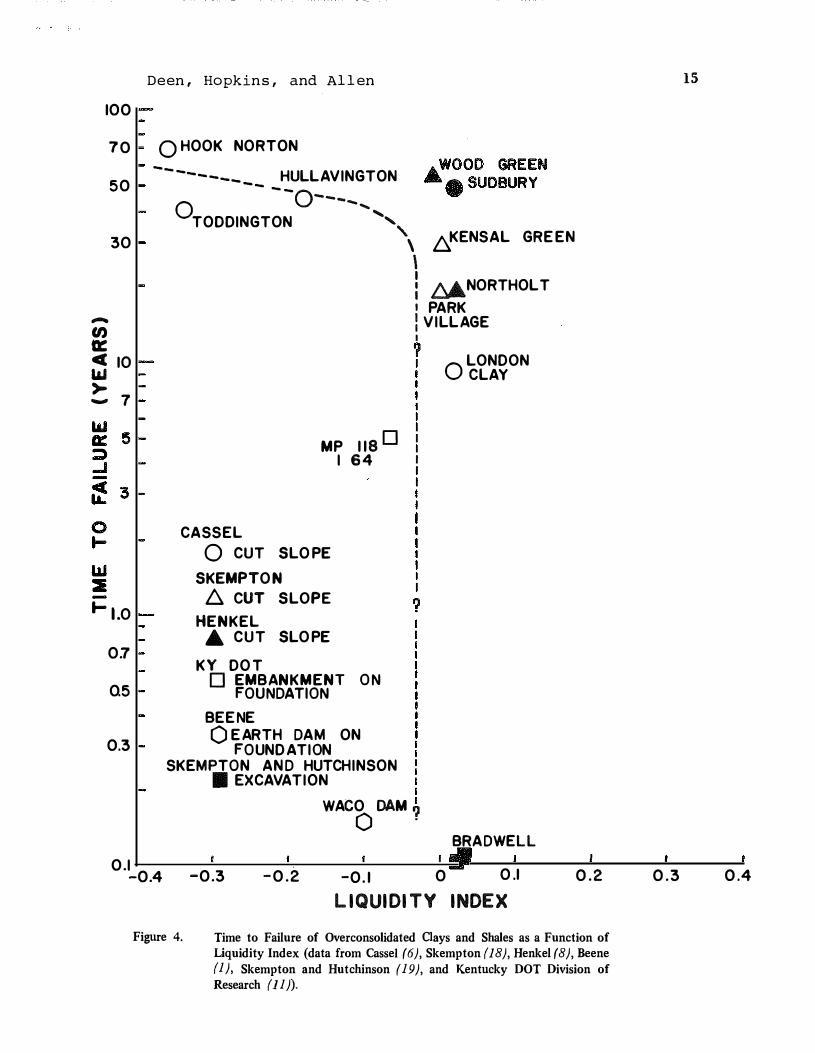
Slope Design Dilemma -- Observations ( 4) suggest the rate of development of a continuous sliding
surface in a clay slope prior to failure varies from one type of clay to another. In the stiffer clays,
the rate may be very small; delay of the failure may be on the order of years. Data in Figure 4 suggest
that, for clay soils having liquidity indices Jess than approximately -0.1 to -0.2 (very stiff clays), the
Deen, Hopkins, and Allen 7
failure delay may be several years. In slopes where the liquidity indices are greater, the delay in failure
may be very short.
Since the critical·state shear strength of overconsolidated clays cannot readily be determined, a
practical approximation to the critical state might be obtained from triaxial tests performed on normally
consolidated samples remolded at a water content given by
w c = (0.36) PI + PL, 5
where PL is the plastic limit and the constant 0.36 is the liquidity index at the break point in Figure
2.
SUMMARY AND CONCLUSIONS
The following summary and tentative conclusions are based on observations and data analyses of
results of several published, well-documented, landslide case histories:
I. Application of the ¢-equal-zero analysis t9 the design of an embankment located on a clay
foundation or to a slope cut in a clay without regard to the stress history and moisture state of the
clay may lead to erroneous conclusion� concerning the stability of the slope. For clays having a liquidity
index equal to or greater than approximately 0.36, the ¢-equal-zero analysis, based on laboratory undrained
strengths, will yield fairly reliable safety factors, provided the liquid limit and plasticity index of the
clay are equal to or below values of about 80 and 30 percent, respectively. For clays having a liquidity
index below a value of about 0.36, the ¢-equal-zero analysis will probably yield safety factors which
are much too high. The reliability of the high safety factors may depend on the liquidity index of
the clay. For clays having a liquidity index less than about -0.1, the time to failure may vary from
a few days or months to several years. If high safety factors are obtained from a ¢-equal-zero analysis,
then Figure 2 should be reviewed to evaluate the probable success of the slope design. The stability
of the slope might be checked using the corrected undrained shear strength given by the empirical
relationship of Equation 4.
2. The use of uncorrected vane shear strength to determine the stability of an embankment on
a soft foundation, cut slopes, footings, and loading tests may yield unreliable results. The vane shear
strength should be corrected by the empirical relationship in Equation I.
3. The liquidity index appears to be a general indicator of the stress history of a clay. Clays having
a liquidity index less than about 0.36 might be considered to be 11Dverconsolidated11 while clays having
a liquidity index greater than 0.36 might be considered 11normally consolidated."
4. The use of residual shear strength may be too conservative and expensive in many slope design
problems involving overconsolidated clay, especially in cases where temporary cuts are made. However,

Deen, Hopkins, and Allen 8
the use of peak shear strength in such soils may be unreliable and unsafe. The intermediate shear strength
obtained from triaxial tests performed on normally consolidated clays remolded to a water content given
by Equation 5 might provide a practical value to use in the de�gn of slopes against "first-time" failures.
REFERENCES
1. Beene, R. B.; Waco Dam Slide, Jo urnal of the Soil Mechanics and Foundations Division, Vol 93,
No. SM4, ASCE, July 1967.
2. Bishop, A. W.; and L. Bjerrum; The Relevance of the Triaxial Test to the Solution of Stability
Problems, Proceedings, Research Conference on Shear Strength of Cohesive Soils, Boulder, Colorado,
ASCE, June 1960.
3. Bjerrum, L.; Embankments on Soft Ground, Proceedings, Specialty Conference on Performance of
Earth and Earth-Supported Structures, Purdue University, Lafayette, Indiana, ASCE, June 11-14,
1972.
4. Bjerrum, L.; Progressive Failure in Slopes in Overconsolidated Plastic Clay and Clay Shales, Journal
of the Soil Mechanics and Foundations Division, Vol 93, SM5, ASCE, September 1967.
5. Bjerrum, L.; Problems of Soil Mechanics on Soft Clays and Structurally Unstable Soils, Proceedings,
Eighth International Conference on Soil Mechanics, Moscow, 1973.
6. Cassel, F. L.; Slips in Fissured Clay, Proceedings, Second International Conference on Soil Mechanics
and Foundation Engineering, Vol 2, Rotterdam, 1948.
7. D'Appolonia, E.; Alperstein, R.; and D'Appolonia, D. J.; Behavior of a Colluvial Slope, Journal
of the Soil Mechanics and Foundation Division, ASCE, July 1967.
8. Henkel, D. J.; Investigation of Two Long·Term Failures in London Clay Slopes at Wood Green
and Northolt, Proceedings, Fourth International Conference on Soil Mechanics and Foundation
Engineering, Vol 2, London, 1957.
9. Henkel, D. J.; and Skempton, A. W.; A Landslide at Jackfield, Shropshire in a Heavily
Over-consolidated Clay, Geotechnique, Vol 5, 1955.
10. Hopkins, T. C.; and Allen, D. L.; Investigation of a Side-Hill Embankment Slope Failure on I 64,
Bath County, Milepost 118, Kentucky Department of Highways, Division of Research, 1971.
11. Hopkins, T. C.; Deen, R. C.; and Allen, D. L.; Effects of Water on Slope Stability, Kentucky Bureau
of Highways, Division of Research, 1975.
12. Lambe, T. W.; Soil Parameters for Predicting Deformations and Stability, Proceedings, Eighth
International Conference on Soil Mechanics, Moscow, 1973.
13. Lo, K. Y.; Adams, J. I.; and Seychuk, J. L.; The Shear Behavior of a Stiff Fissured Clay,
Deen, Hopkins, and Allen 9
Geotechnique, 1970.
14. Moh, Z.; Brand, E. W.; and Nelson, J. D.; Pore Pressures under a Bund on Soft Fissured Clay,
Proceedings, Conference on Performance of Earth and Earth-Suported Structures, ASCE, Purdue
University, June 1972.
15. Peck, R. B.; and Lowe, J.; Shear Strength of Undisturbed Cohesive Soils, Moderators' Report -
Session 4, Proceedings, Research Conference on Shear Strength of Cohesive Soils, Boulder, Colorado,
ASCE, June 1960.
16. Peterson, R.; Jaspar, J. L.; Rivard, P. J.; and Iverson, N. L.; Limitations of Laboratory Shear Strength
in Evaluating Stability of Highly Plastic Clays, Proceedings, Research Conference on Shear Strength
of Cohesive Soils, Boulder, Colorado, ASCE, June 1960.
17. Skempton, A. W.; First Time Slides in Over-Consolidated Clays, Technical Notes, Geotechnique,
Vol 20, 1972.
18. Skempton, A. W.; Long-Term Stability of Clay Slopes, Geotechnique, Vol 14, 1964.
19. Skempton, A. W.; and Hutchinson, J.; Stability of Natural Slopes and Embankment Foundations,
State-of-the Art Report, Proceedings, Seventh International Conference on Soil Mechanics and
Foundation Engineering, Mexico, 1969.
20. Wright, S. G.; A Study of Slope Stability and the Undrained Shear Strength of Clay Shales, a
dissertation submitted in partial satisfaction of the requirements for the Degree of Doctor of
Philosophy, University of California, Berkeley, 1969.
Deen, Hopkins, and Allen lO
Figure I.
Figure 2.
Figure 3.
Figure 4.
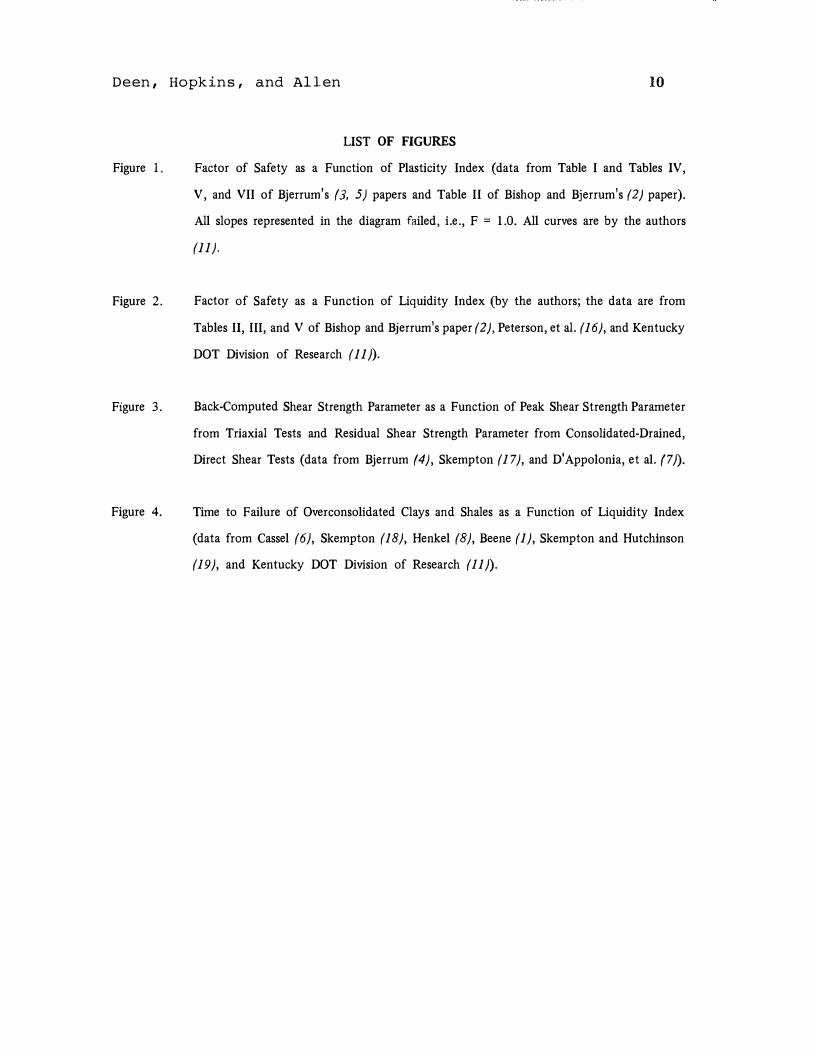
LIST OF FI GURES
Factor of Safety as a Function of Plasticity Index (data from Table I and Tables IV,
V, and VII of Bjerrum's (3, 5) papers and Table II of Bishop and Bjerrum's (2) paper).
All slopes represented in the diagram failed, i.e., F = 1.0. All curves are by the authors
(11).
Factor of Safety as a Function of Liquidity Index (by the authors; the data are from
Tables II, Ill, and V of Bishop and Bjerrum's paper (2), Peterson, et al. (16), and Kentucky
DOT Division of Research ( 11 )).
Back-Computed Shear Strength Parameter as a Function of Peak Shear Strength Parameter
from Triaxial Tests and Residual Shear Strength Parameter from Consolidated-Drained,
Direct Shear Tests (data from Bjerrum (4), Skempton (17), and D'Appolonia, et al. (7)).
Time to Failure of Overconsolidated Clays and Shales as a Function of Liquidity Index
(data from Cassel (6), Skempton (18), Henkel (8), Beene (1), Skempton and Hutchinson
(19), and Kentucky DOT Division of Research (11)).
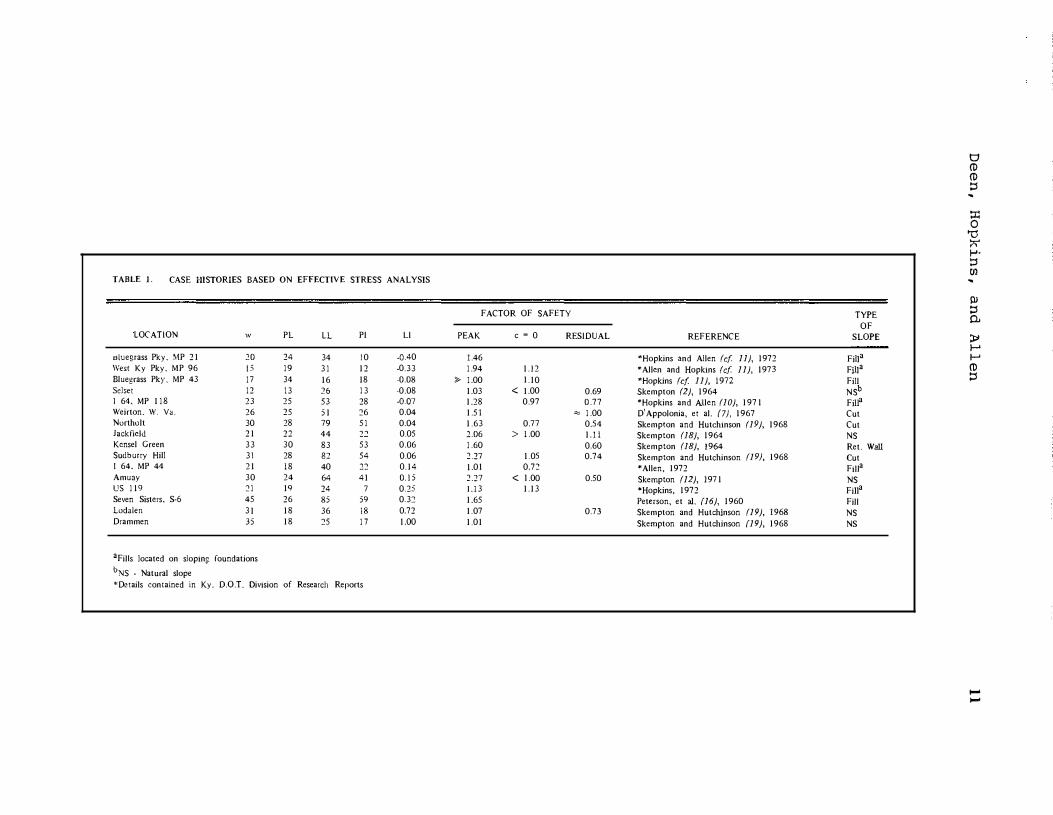
TABLE L CASE HISTORIES BASED ON EFFECTIVE STRESS ANALYSIS
LOCATION w PL LL PI Ll
tiluegrass Pky. �1P 21 20 24 34 10 -0.40
West Ky Pky. MP 96 !5 19 31 12 -0.33
Bluegrass Pky. MP 43 17 34 16 18 -0.08 Selset 12 13 " 13 -0.08
I 64, MP 118 23 25 53 28 -om Weirton. W. Va. 26 25 51 26 0.04
Nurthult 30 28 79 51 0.04
Jack field 21 21 44 "" 0.05
Kcnsel Green 33 30 83 53 0.06
Sudburry Hill 31 28 " 54 0.06
! 64. MP 44 21 18 40 2:! 0.14
Amuny 30 24 64 41 0.15 us 119 21 19 24 7 0.25
Seven Sisters, S-6 45 26 85 59 0.3"2
Lodalen 31 18 36 18 0.72
Dram men 35 18 25 17 1.00
aFills located on sloping foundations bNS Natural slope *Details contained in Ky. D.O.T. Division of Research Reports
FACTOR OF SAFETY
PEAK c = 0 RESIDUAL REFERENCE
1.46 *Hopkins and Allen (cf 11), 1972
1.94 1.12 *Allen and Hopkins (cf 11), 1973
� 1.00 1.10 *Hopkins (cf 11), 1972
1.03 < 1.00 0.69 $kempton (2), 1964
1.28 0.97 0.77 *Hopkins and Allen (10), 1971
1.51 "" 1.00 D'Appolonia, et al. (7), 1967
1.63 0.77 0.54 Skempton and Hutchinson (19), 1968
2.06 > 1.00 1.11 Skempton (18), 1964
1.60 0.60 Skempton (18), 1964
"2.27 1.05 0.74 Skempton and Hutchinson (19}, 1968
1.01 0.7"2 *Allen, 1972
"2."27 < 1.00 0.50 Skempton (12), 1971
i.i3 1.13 *Hopkins, 1972
1.65 Peterson, et a!. (16), 1960
1.07 0.73 Skempton and Hutchinson (19), 1968 1.01 Skempton and Hutchinson (19), 1968
TYPE OF
SLOPE ---Filla
Filla
Fill NSb
Filla
Cut Cut NS Ret. Wall Cut Filla
NS Filla
Fill NS NS
t:1 (!) (!) ::; . :0:: 0
'1:l :» f-'· ::; "' . Ill ::; 0. )" 1-' 1-' (!) ::;
..... .....
1.8
1.6
1.4
a: 0 1.2 1-0 <[ lL >-1-liJ lL <( "'
0
6 EMBANKMENTS
D FOOTINGS, FOUNDATIONS
0 CUTS
AND LOADING TESTS 1:::.
F V TESTS!:::. ---- - ---
CURVE A � --------/:::. ( -- 1:::. {SU)VANE ----
{SU)VANE
{Su>coRRECTED- {0.75 + 0.0153 PI 0.000
�-- 1:::. "{Su>coRRECTED - {0.84 + 0.0082 PI) . 2
-072)±.12 --
-+I
1:::. --1:::. ---
---- 0 'cuRvE B -----
------- 0
/,« .. • '"'"' .. -- - -
--
�/ 0 • II / ___ � ---�U
-;;-R-
u TESTS
""' ---- ------
MAINLY
- ----"'- -: - -- - ...
1:::.
D e ID II
1:::.
CURVES A AND B
CURVE C
.6.00 .All.
BJERRUM
BISHOP AND BJERRUM
0.6�--L-��--L-��--���--�--�--�--�--�--�---L--�---L--��-L--��_L--��_J--���L_�-0 on AA """"' .. ,... � """' �n ..,.,.. ... .... n l"''. "'''1"\ """ I 'll 4v
Figure 1.
PLASTICITY INDEX
Factor of Safety as a Function of Plasticity Index (data from Table I and Tables N, V, and VII of Bjerrum's (3, 5) papers and Table ll of Bishop and Bj errum's (2) paper). All slopes represented in the diagram
failed, i.e., F = 1.0. All curves are by the authors ( 11 ).
0 !D !D � -t:I: 0 '0 X' !-'· � rn
Ill � p. !>' ..... ..... !D �
..... N
1 0
a:: 0 t-0 <t LL. >-t-ILl LL. <t en
0 .6 -0.4
Deen, Hopkins, and Allen 13
"'OVERCONSOLIDATED CLAYS?
....
•
• ....
Ill ....
-0.2 0
-----o-+-c--- "' NORMALLY CONSOLIDATED CLAYS ?--------<o-
-0.40<LI<0.36 L ¢• 0 ANALYSIS
F•l3.98)(0.0187) 1•Su/Ss S5.,(0.252) Su (0.01 92)-LI
R2 • 0.71
0 FOOTINGS, LOADINGS TESTS 0 EMBANKMENTS 0 EXCAVATIONS OR CUTS A STRUTTED EXCAVATIONS /::,EXCAVATIONS OR CUTS 0 NATURAL SLOPES 121 EMBANKMENTS
END-OFCONSTRUCTION FAILURES
LONG-TERM FAILURES
DARK POINTS- BISHOP AND BJERRUM MAINLY UU OR U STRENG T H
OPEN POINTS -BJERRUM,FIELD VANE STRENGTH
0.2 0.4 0 .6 0.8 1.0 1.2 1 . 4 1.6
LIQUIDITY INDEX= (W-PL)/PI 1.8
Figure 2. Factor of Safety as a Function of Liquidity Index (by the authors; the data are from Tables II, III, and V of Bishop and Bjerrum's paper (2), Peterson, et al. (16), and Kentucky DOT Division of Research (11)).
� (f) LIJ LIJ a:: (l) LIJ e -� " ...
C> LU .... :::> a.. :;; 0 • u
'&:
Deen, Hopkins, and Allen
30
•
D. 25
20
15
10
5 /
/ / / / / / / 0
Figure 3.
I ¢RESIDUAL• CDS TEST
c� � o
,¢�EAK, CDS, CIU, OR CID TESTS c� :#:O
-0.51 < Ll < 0.32
¢'�0MPUTED = 2.7 + 0.8 ¢� R
2=0.92
STD. ERROR = ± 1.2 60< {251 < 200 R
/ / / / /
/ / / / / / / / / /
/
5 10 1 5
j2f�ESIDUAL OR jl!�EAK (DEGREES)
/ / /
/ / /
/ d / / / /
./ D. "' / /
D. D.
D. D. D.
D. D. D.
20 25
Back-Computed Shear Strength Parameter as a Function of Peak Shear Strength Parameter from Triaxial Tests and Residual Shear Strength Parameter from Consolidated-Drained, Direct Shear Tests (data from Bjerrum (4), Skempton (17), and D'Appolonia, et al. (7)).
14
/ / /
30 35
100
.... U) a:
70
50
30
41( 10 1&.1 > -7
-1-1.0
0.7
0.5
0.3
Deen, Hopkins, and Allen
0 HOOK NORTON -- ------ HULLAVINGTON -- - -o
OTODDINGTON
----...
..........
6WOOO GREEN - . SUDBURY
\ �KENSA L GREEN
I I : �NORTHOLT
I PARK l VILLAGE I ',1
O LONDON CLAY
MP 118 0 I 64
CA SSEL 0 CUT SLOPE
SKEMPTON �CUT SLOPE
HENKEL A CUT SLOPE
KY DOT 0 EMBANKMENT
FOUNDATION
BEENE
ON
0 EARTH DA M ON FOUNDATION
SKEMPTO N A ND HUTCHINSON II EXCAVATION
WACO DAM '.1 0 .
BRADWEll
O.I_0.4 -0.3 -0.2 -0.1 0 0.1 0.2
Figure 4.
LIQUIDITY INDEX Time to Failure of Overconsolidated Oays and Shales as a Function of Liquidity Index (data from Cassel 16), Skempton I 18), Henkel 18), Beene I I), Skempton and Hutchinson (I 9 ), and Kentucky DOT Division of Research I II)).
15
0.3 0.4