Embed Size (px)
Citation preview
A Case Study of Groundwater Modeling and Slope Stability Analysis in
the Panama Canal M. De Puy, Geotechnical Branch, Engineering Division, Panama Canal Authority, Rep. of Panama J. Ramesch, Geotechnical Branch, Engineering Division, Panama Canal Authority, Rep. of Panama ABSTRACT The Landslide Control Program of the Panama Canal is the responsibility of the Geotechnical Branch of the Engineering Division of the Panama Canal Authority (ACP). Given that pore water pressures have played an integral role in many slope failures along the Gaillard Cut, the Geotechnical Branch has employed both traditional piezometric line – limit equilibrium analysis as well as finite-element seepage analysis coupled with limit equilibrium design methodologies. This paper will describe the methodology of the ACP design process as applied to a case history in the Gaillard Cut of the Panama Canal. A description of geological and piezometric data, pore pressure calculations and slope stability analysis is presented, and results from an analysis performed using traditional piezometric lines and an analysis based on groundwater modeling are presented. A comparison between these two results is discussed within the context of the benefits and limitations of each. RÉSUMÉ Le programme de control des mouvements de terrain le long du canal de Panama est géré par le bureau de Géotechnique du département Ingénierie de l’Administration du Canal de Panama (ACP). Etant donné que les problèmes de pression interstitielle jouent un rôle majeur dans les phénomènes de rupture le long du tronçon Gaillard, le bureau de Géotechnique a utilisé pour son étude à la fois une méthode traditionnelle utilisant des lignes piézométriques couplées à une analyse à l’état limite et une analyse des infiltrations par éléments finis couplée à des méthodes d’équilibre limite. Cet article décrit les méthodes de calcul employées par l’ACP en s’appuyant sur l’étude d’un cas réel dans le tronçon Gaillard du Canal de Panama. Il présente les données géologiques et piézométriques, les calculs de pression interstitielle et les analyses de stabilité des pentes. Les résultats obtenus par une analyse utilisant les lignes piézométriques classiques et par une analyse basée sur la modélisation des nappes souterraines sont aussi détaillés. Les deux résultats sont comparés en termes d’avantages et de restrictions. 1. INTRODUCTION Due to continuous widening projects, dredging activity in the channel, and high precipitation during the rainy season, slope stability is a primary concern to the Geotechnical Branch of the Panama Canal Authority. The Geotechnical Branch has employed both traditional piezometric line – limit equilibrium analysis as well as finite-element seepage analysis coupled with limit equilibrium design methodologies to evaluate slope stability. This involves basing pore pressures on both piezometric lines derived from piezometers and water level measurement data, and those derived through numerical groundwater modeling. The area presented as a case history to illustrate the the two methodologies is known in the Panama Canal as ‘Model Slope’, so named for its historically stable behavior while surrounded by recurrent slides. Geological data includes a geological cross section developed through the slope, rock mass characterization to determine GSI (Marinos & Hoek, 2000) and RMR (Bienawski, 1989) values for hard rock units, and material properties for the well-known Cucaracha Formation, comprised mostly of clayshales, and for the overlying basalt. Piezometric data is obtained from a Westbay multipoint piezometer, Casagrande piezometers,
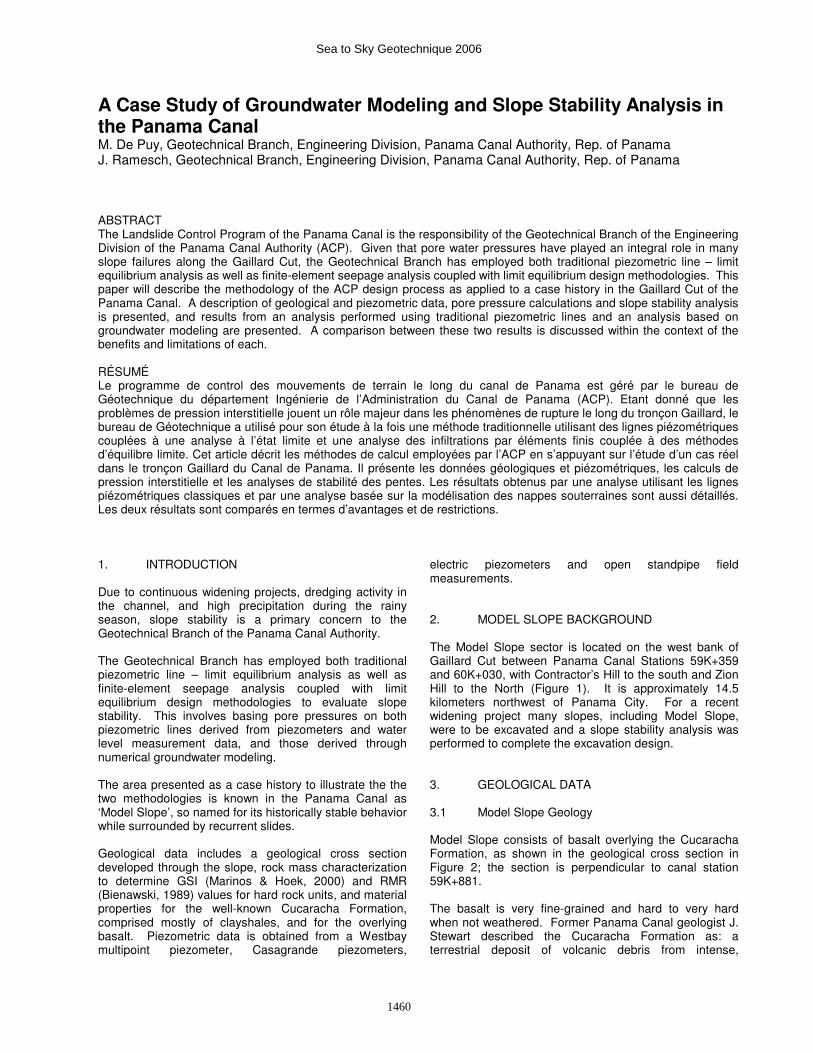
electric piezometers and open standpipe field measurements. 2. MODEL SLOPE BACKGROUND The Model Slope sector is located on the west bank of Gaillard Cut between Panama Canal Stations 59K+359 and 60K+030, with Contractor’s Hill to the south and Zion Hill to the North (Figure 1). It is approximately 14.5 kilometers northwest of Panama City. For a recent widening project many slopes, including Model Slope, were to be excavated and a slope stability analysis was performed to complete the excavation design. 3. GEOLOGICAL DATA 3.1 Model Slope Geology Model Slope consists of basalt overlying the Cucaracha Formation, as shown in the geological cross section in Figure 2; the section is perpendicular to canal station 59K+881. The basalt is very fine-grained and hard to very hard when not weathered. Former Panama Canal geologist J. Stewart described the Cucaracha Formation as: a terrestrial deposit of volcanic debris from intense,
1460
Sea to Sky Geotechnique 2006
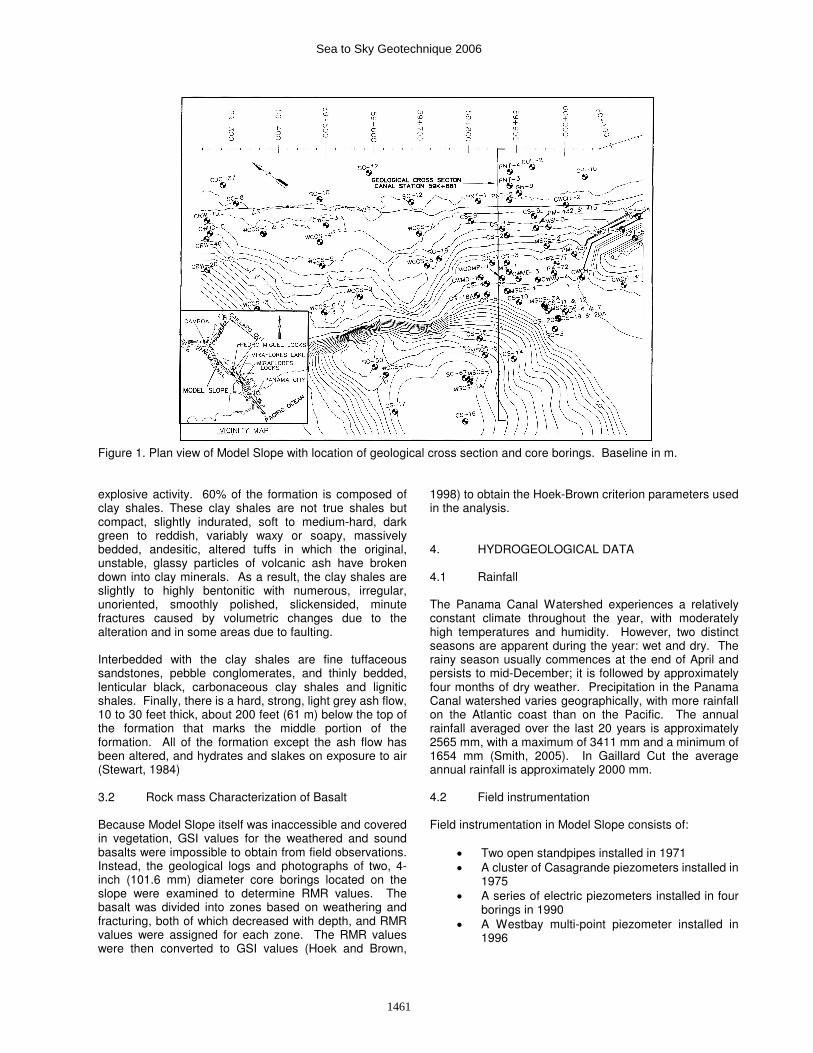
Figure 1. Plan view of Model Slope with location of geological cross section and core borings. Baseline in m. explosive activity. 60% of the formation is composed of clay shales. These clay shales are not true shales but compact, slightly indurated, soft to medium-hard, dark green to reddish, variably waxy or soapy, massively bedded, andesitic, altered tuffs in which the original, unstable, glassy particles of volcanic ash have broken down into clay minerals. As a result, the clay shales are slightly to highly bentonitic with numerous, irregular, unoriented, smoothly polished, slickensided, minute fractures caused by volumetric changes due to the alteration and in some areas due to faulting. Interbedded with the clay shales are fine tuffaceous sandstones, pebble conglomerates, and thinly bedded, lenticular black, carbonaceous clay shales and lignitic shales. Finally, there is a hard, strong, light grey ash flow, 10 to 30 feet thick, about 200 feet (61 m) below the top of the formation that marks the middle portion of the formation. All of the formation except the ash flow has been altered, and hydrates and slakes on exposure to air (Stewart, 1984) 3.2 Rock mass Characterization of Basalt Because Model Slope itself was inaccessible and covered in vegetation, GSI values for the weathered and sound basalts were impossible to obtain from field observations. Instead, the geological logs and photographs of two, 4-inch (101.6 mm) diameter core borings located on the slope were examined to determine RMR values. The basalt was divided into zones based on weathering and fracturing, both of which decreased with depth, and RMR values were assigned for each zone. The RMR values were then converted to GSI values (Hoek and Brown,
1998) to obtain the Hoek-Brown criterion parameters used in the analysis. 4. HYDROGEOLOGICAL DATA 4.1 Rainfall The Panama Canal Watershed experiences a relatively constant climate throughout the year, with moderately high temperatures and humidity. However, two distinct seasons are apparent during the year: wet and dry. The rainy season usually commences at the end of April and persists to mid-December; it is followed by approximately four months of dry weather. Precipitation in the Panama Canal watershed varies geographically, with more rainfall on the Atlantic coast than on the Pacific. The annual rainfall averaged over the last 20 years is approximately 2565 mm, with a maximum of 3411 mm and a minimum of 1654 mm (Smith, 2005). In Gaillard Cut the average annual rainfall is approximately 2000 mm. 4.2 Field instrumentation Field instrumentation in Model Slope consists of:
• Two open standpipes installed in 1971 • A cluster of Casagrande piezometers installed in
1975 • A series of electric piezometers installed in four
borings in 1990 • A Westbay multi-point piezometer installed in
1996
1461
Sea to Sky Geotechnique 2006
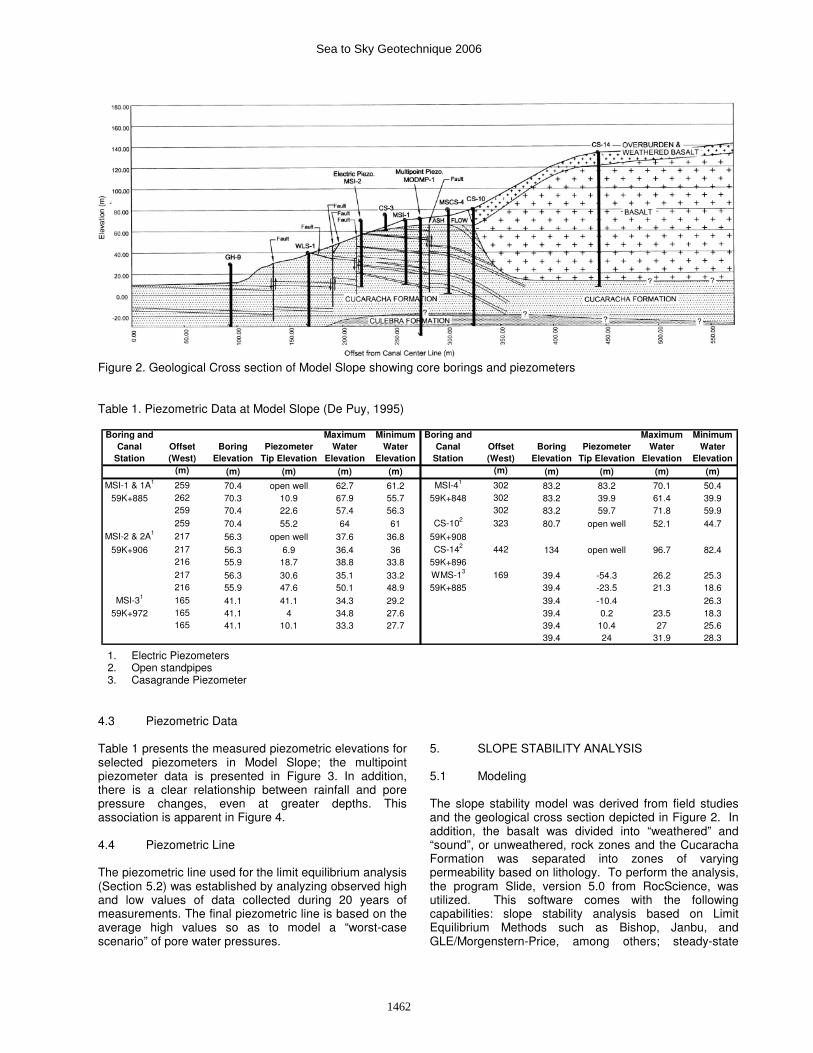
Figure 2. Geological Cross section of Model Slope showing core borings and piezometers Table 1. Piezometric Data at Model Slope (De Puy, 1995)
(m) (m) (m) (m) (m) (m) (m) (m) (m) (m)
MSI-1 & 1A1 259 70.4 open well 62.7 61.2 MSI-41 302 83.2 83.2 70.1 50.459K+885 262 70.3 10.9 67.9 55.7 59K+848 302 83.2 39.9 61.4 39.9
259 70.4 22.6 57.4 56.3 302 83.2 59.7 71.8 59.9259 70.4 55.2 64 61 CS-102 323 80.7 open well 52.1 44.7
MSI-2 & 2A1 217 56.3 open well 37.6 36.8 59K+908
59K+906 217 56.3 6.9 36.4 36 CS-142 442 134 open well 96.7 82.4216 55.9 18.7 38.8 33.8 59K+896217 56.3 30.6 35.1 33.2 WMS-13 169 39.4 -54.3 26.2 25.3216 55.9 47.6 50.1 48.9 59K+885 39.4 -23.5 21.3 18.6
MSI-31 165 41.1 41.1 34.3 29.2 39.4 -10.4 26.359K+972 165 41.1 4 34.8 27.6 39.4 0.2 23.5 18.3
165 41.1 10.1 33.3 27.7 39.4 10.4 27 25.639.4 24 31.9 28.3
Piezometer
Tip Elevation
Maximum
Water
Elevation
Minimum
Water
Elevation
Boring and
Canal
Station
Offset
(West)
Boring
Elevation
Maximum
Water
Elevation
Minimum
Water
Elevation
Boring and
Canal
Station
Offset
(West)
Boring
Elevation
Piezometer
Tip Elevation
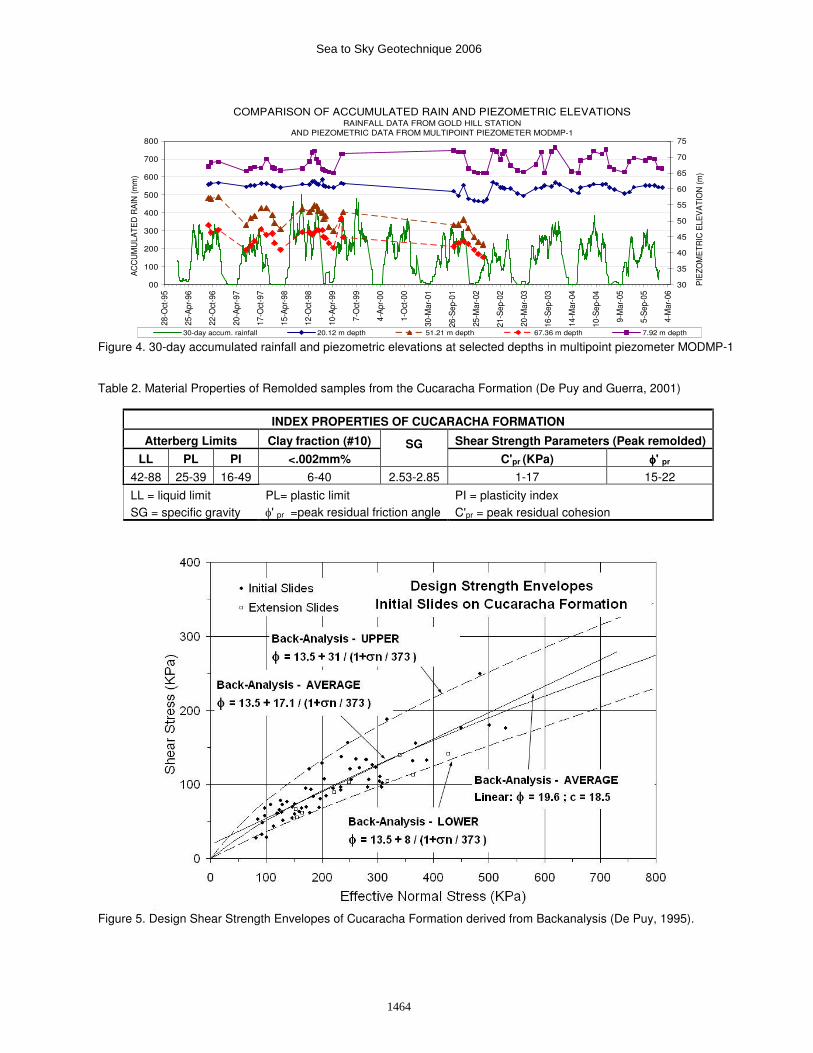
4.3 Piezometric Data Table 1 presents the measured piezometric elevations for selected piezometers in Model Slope; the multipoint piezometer data is presented in Figure 3. In addition, there is a clear relationship between rainfall and pore pressure changes, even at greater depths. This association is apparent in Figure 4. 4.4 Piezometric Line The piezometric line used for the limit equilibrium analysis (Section 5.2) was established by analyzing observed high and low values of data collected during 20 years of measurements. The final piezometric line is based on the average high values so as to model a “worst-case scenario” of pore water pressures.
5. SLOPE STABILITY ANALYSIS 5.1 Modeling The slope stability model was derived from field studies and the geological cross section depicted in Figure 2. In addition, the basalt was divided into “weathered” and “sound”, or unweathered, rock zones and the Cucaracha Formation was separated into zones of varying permeability based on lithology. To perform the analysis, the program Slide, version 5.0 from RocScience, was utilized. This software comes with the following capabilities: slope stability analysis based on Limit Equilibrium Methods such as Bishop, Janbu, and GLE/Morgenstern-Price, among others; steady-state
1. Electric Piezometers 2. Open standpipes 3. Casagrande Piezometer
1462
Sea to Sky Geotechnique 2006
groundwater modeling numerical analysis based on the finite element method, and a complete Hoek-Brown criterion package to generate rock mass shear strength envelopes (RocScience, 2003). Two groundwater models were used for the analysis: first, as described in Section 4.4, a piezometric line was assumed in order to represent the groundwater conditions. Second, a more sophisticated approach was used whereby a finite-element seepage analysis was carried out to calculate the operating pore pressures in the slope. These pressures were then introduced into the limit equilibrium factor of safety computations. The final objective of the second approach is to predict the groundwater condition after the slope is excavated, based on an existing condition model calibrated with available field pore water pressure data. This approach offers an alternative to simply assuming a piezometric line, which does not provide any information regarding the groundwater regime of a slope after excavation. Using a seepage analysis, a model is calibrated to the existing condition of the slope, then the slope geometry is changed to the design geometry and the model is run again to calculate the design condition pore water pressures. In this manner, the model assists in predicting changes in pore pressures based on a given excavation design for the purpose of assessing the stability of the slope. 5.1.1 Shear Strength Parameters
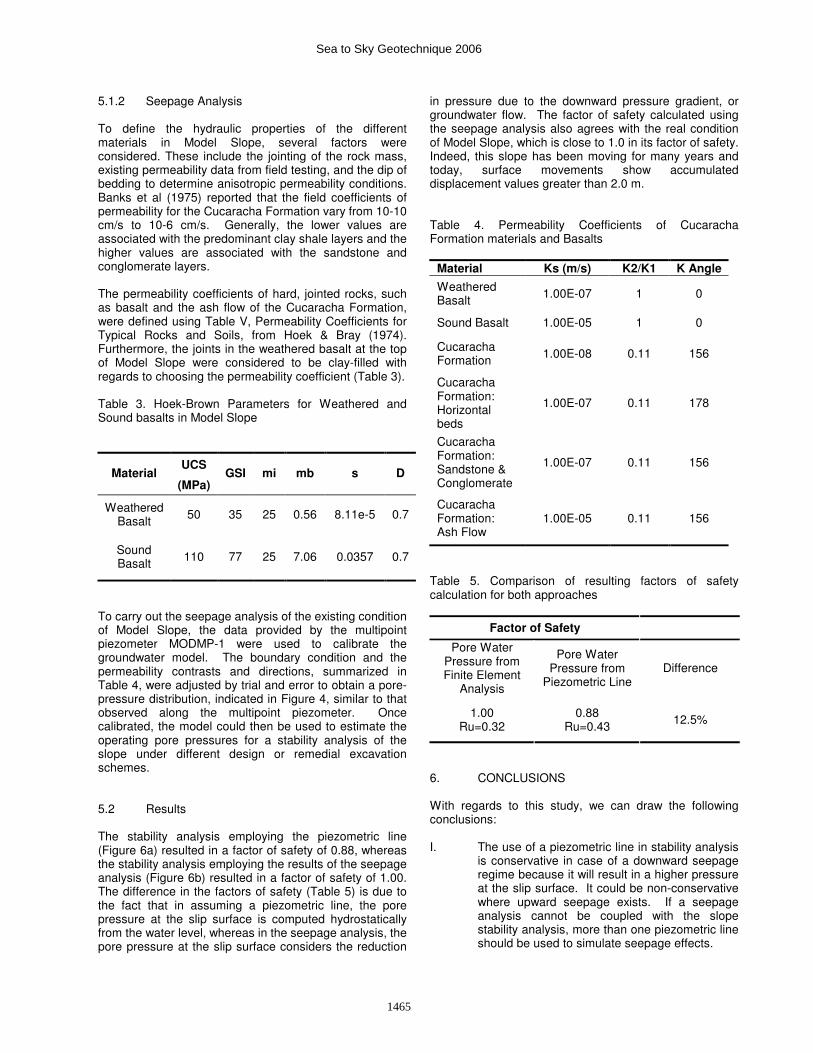
5.1.1.1 Cucaracha Formation Table 2 summarizes the index properties of remolded samples from the Cucaracha Formation (De Puy and Guerra, 2001). Figure 5 presents the design shear strength envelopes derived from backanalysis of past slope failures in the Cucaracha Formation (De Puy, 1995). The non-linear “AVERAGE” envelope represents the average mobilized shear strength along the slip surface of past slides and is considered to be the average shear strength of “first-time failures”. Furthermore, this envelope is close to the “fully-softened” shear strength of soft rocks or overconsolidated soils. For modeling, this envelope was used to characterize the Cucaracha Formation. 5.1.1.2 Basalt The weathered and sound basalts were modeled using the Generalized Hoek-Brown criterion. Table 3 summarizes the basalt material parameters used for the basalts. Highly fractured or faulted zones were not included in the shear strength analysis model, but they were considered when assigning permeabilities in the groundwater model. The faulted zones were not included in the shear strength analysis because the critical failure surface passes through the Cucaracha Formation only and the orientations of the faulted zones in the basalt do not adversely affect the proposed failure mechanism.
MODMP-1
MODEL SLOPE
0.00
10.00
20.00
30.00
40.00
50.00
60.00
70.00
25 35 45 55 65 75
Piezometric Elevation (m)
De
pth
(m
)
-2.91
7.92
18.75
29.58
40.41
51.24
62.07
72.90
Ele
vati
on
(m
)
23-Sep-96 11-Oct-96
5-Dec-96 1-Jul-97
5-Aug-97 4-Sep-97
21-Oct-97 29-Nov-97
13-Jan-98 30-Jan-98
18-Mar-98 26-Aug-98
20-Oct-98 9-Nov-98
24-Nov-98 14-Dec-98
28-Dec-98 26-Jan-99
2-Feb-99 17-Feb-99
15-Mar-99 20-Apr-99
15-Jun-99 29-Jun-99
9-Oct-01 14-Nov-01
20-Dec-01 24-Jan-02
8-Mar-02 9-Apr-02
16-May-02 14-Jun-02
29-Jul-02 26-Aug-02
26-Sep-02 8-Oct-02
24-Oct-02 6-Dec-02
29-Jan-03 14-Mar-03
17-Jun-03 28-Jul-03
19-Aug-03 14-Oct-03
7-Nov-03 11-Dec-03
9-Mar-04 4-May-04
17-May-04 26-Jul-04
23-Aug-04 9-Sep-04
26-Oct-04 24-Nov-04
23-Dec-04 24-Jan-05
11-Apr-05 17-May-05
22-Jun-05 16-Sep-05
20-Oct-05 25-Nov-05
21-Dec-05 19-Jan-06
GEOLOGY FE piez. line
ATM Line
Residual Soil
Clay Shale
Weathered Ash Flow
Ash Flow
Clay Shale
Sandstone
Clay Shale
Conglomerate
Clay Shale
Tuffaceous Sandstone
Clay Shale
Conglomerate
Siltstone
Sandstone
Lignitic Shale
Lignitic Shale
Lignitic ShaleClay Shale
Stratigraphy
Figure 3. Multipoint Piezometer MODMP-1 data with corresponding stratigraphy
Piezometric Line derived from FE seepage analysis
1463
Sea to Sky Geotechnique 2006
COMPARISON OF ACCUMULATED RAIN AND PIEZOMETRIC ELEVATIONSRAINFALL DATA FROM GOLD HILL STATION
AND PIEZOMETRIC DATA FROM MULTIPOINT PIEZOMETER MODMP-1
00
100
200
300
400
500
600
700
800
28-O
ct-9
5
25-A
pr-9
6
22-O
ct-9
6
20-A
pr-9
7
17-O
ct-9
7
15-A
pr-9
8
12-O
ct-9
8
10-A
pr-9
9
7-O
ct-9
9
4-A
pr-0
0
1-O
ct-0
0
30-M
ar-0
1
26-S
ep-0
1
25-M
ar-0
2
21-S
ep-0
2
20-M
ar-0
3
16-S
ep-0
3
14-M
ar-0
4
10-S
ep-0
4
9-M
ar-0
5
5-S
ep-0
5
4-M
ar-0
6
AC
CU
MU
LATE
D R
AIN
(mm
)
30
35
40
45
50
55
60
65
70
75
PIE
ZOM
ETR
IC E
LEV
ATI
ON
(m)
30-day accum. rainfall 20.12 m depth 51.21 m depth 67.36 m depth 7.92 m depth Figure 4. 30-day accumulated rainfall and piezometric elevations at selected depths in multipoint piezometer MODMP-1 Table 2. Material Properties of Remolded samples from the Cucaracha Formation (De Puy and Guerra, 2001)
INDEX PROPERTIES OF CUCARACHA FORMATION
Atterberg Limits Clay fraction (#10) Shear Strength Parameters (Peak remolded)
LL PL PI <.002mm%
SG
C'pr (KPa) φφφφ' pr
42-88 25-39 16-49 6-40 2.53-2.85 1-17 15-22
LL = liquid limit PL= plastic limit PI = plasticity index SG = specific gravity φ' pr =peak residual friction angle C'pr = peak residual cohesion
Figure 5. Design Shear Strength Envelopes of Cucaracha Formation derived from Backanalysis (De Puy, 1995).
1464
Sea to Sky Geotechnique 2006
5.1.2 Seepage Analysis To define the hydraulic properties of the different materials in Model Slope, several factors were considered. These include the jointing of the rock mass, existing permeability data from field testing, and the dip of bedding to determine anisotropic permeability conditions. Banks et al (1975) reported that the field coefficients of permeability for the Cucaracha Formation vary from 10-10 cm/s to 10-6 cm/s. Generally, the lower values are associated with the predominant clay shale layers and the higher values are associated with the sandstone and conglomerate layers. The permeability coefficients of hard, jointed rocks, such as basalt and the ash flow of the Cucaracha Formation, were defined using Table V, Permeability Coefficients for Typical Rocks and Soils, from Hoek & Bray (1974). Furthermore, the joints in the weathered basalt at the top of Model Slope were considered to be clay-filled with regards to choosing the permeability coefficient (Table 3). Table 3. Hoek-Brown Parameters for Weathered and Sound basalts in Model Slope
UCS Material
(MPa) GSI mi mb s D
Weathered Basalt 50 35 25 0.56 8.11e-5 0.7
Sound Basalt 110 77 25 7.06 0.0357 0.7
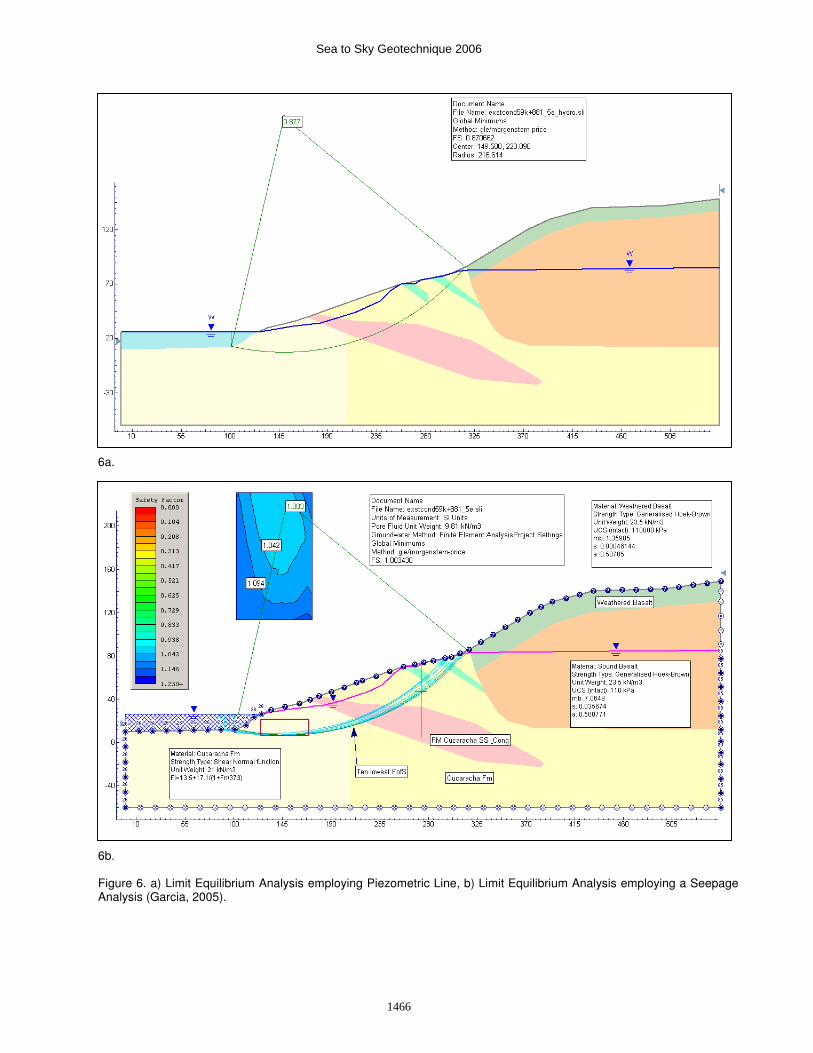
To carry out the seepage analysis of the existing condition of Model Slope, the data provided by the multipoint piezometer MODMP-1 were used to calibrate the groundwater model. The boundary condition and the permeability contrasts and directions, summarized in Table 4, were adjusted by trial and error to obtain a pore-pressure distribution, indicated in Figure 4, similar to that observed along the multipoint piezometer. Once calibrated, the model could then be used to estimate the operating pore pressures for a stability analysis of the slope under different design or remedial excavation schemes. 5.2 Results The stability analysis employing the piezometric line (Figure 6a) resulted in a factor of safety of 0.88, whereas the stability analysis employing the results of the seepage analysis (Figure 6b) resulted in a factor of safety of 1.00. The difference in the factors of safety (Table 5) is due to the fact that in assuming a piezometric line, the pore pressure at the slip surface is computed hydrostatically from the water level, whereas in the seepage analysis, the pore pressure at the slip surface considers the reduction
in pressure due to the downward pressure gradient, or groundwater flow. The factor of safety calculated using the seepage analysis also agrees with the real condition of Model Slope, which is close to 1.0 in its factor of safety. Indeed, this slope has been moving for many years and today, surface movements show accumulated displacement values greater than 2.0 m. Table 4. Permeability Coefficients of Cucaracha Formation materials and Basalts
Material Ks (m/s) K2/K1 K Angle
Weathered Basalt 1.00E-07 1 0
Sound Basalt 1.00E-05 1 0
Cucaracha Formation 1.00E-08 0.11 156
Cucaracha Formation: Horizontal beds
1.00E-07 0.11 178
Cucaracha Formation: Sandstone & Conglomerate
1.00E-07 0.11 156
Cucaracha Formation: Ash Flow
1.00E-05 0.11 156
Table 5. Comparison of resulting factors of safety calculation for both approaches
Factor of Safety Pore Water
Pressure from Finite Element
Analysis
Pore Water Pressure from
Piezometric Line Difference
1.00 Ru=0.32
0.88 Ru=0.43 12.5%
6. CONCLUSIONS With regards to this study, we can draw the following conclusions: I. The use of a piezometric line in stability analysis
is conservative in case of a downward seepage regime because it will result in a higher pressure at the slip surface. It could be non-conservative where upward seepage exists. If a seepage analysis cannot be coupled with the slope stability analysis, more than one piezometric line should be used to simulate seepage effects.
1465
Sea to Sky Geotechnique 2006
6a.
6b. Figure 6. a) Limit Equilibrium Analysis employing Piezometric Line, b) Limit Equilibrium Analysis employing a Seepage Analysis (Garcia, 2005).
1466
Sea to Sky Geotechnique 2006
II. The finite-element seepage analysis coupled with limit equilibrium method is a good approach for the stability analysis of slopes. However, good data, such as pore water pressure measurements from multipoint piezometers, are required to suitably calibrate the model.
III. Furthermore, this approach, if properly calibrated, is an excellent tool for the design of new excavations in the Gaillard Cut.
IV. Finally, Slide 5 has demonstrated itself to be effective in implementing finite-element groundwater modeling into a slope stability analysis.
7. ACKNOWLEDGEMENTS Acknowledgments go to Jose Francisco Garcia of the ACP, Dr. Erik Eberhardt and Dr. Oldrich Hungr of the University of British Columbia, and to the Panama Canal Authority, Engineering Division. 8. REFERENCES Banks, D. C., Strohm, W. E., De Angulo, M.,and
Lutton, R. J. (1975) Study of Clay Shale Slopes Along the Panama Canal, Report 3: Engineering Analysis of Slides and Strength Properties of Clay Shales Along the Gaillard Cut, Technical Report S-70-9, U. S. Army Corps of Engineers Waterways Experiment Station, Vicksburg, Mississippi
Bieniawski, Z.T. (1989) Engineering Rock Mass Classification, Wiley, New York, U.S.A.
De Puy, M. (1995) Shear Strength Envelopes for the Design of Soft Rock Slopes in Gaillard Cut, Internal Report prepared for the Cut Widening Program, Engineering Division, Panama Canal Commission.
De Puy, M and Guerra, G (2001) Summary of Shear Strength Tests on Gaillard Cut Rock Formations, Internal Report prepared for the Cut Widening Program, Engineering Division, Panama Canal Authority
Espinosa, J. (1999) Causes of the Change of Seasons in the Panama Canal Watershed, Internal Report, Panama Canal Commission, Engineering Division, Republic of Panama
Garcia, J.F. (2005) Project No. 7 Contractor-Escobar: Gaillard Cut Straightening and Canal Expansion, Internal Report, Panama Canal Authority, Engineering Division, Republic of Panama
Hoek, E., and Bray, J. W. (1974) Rock Slope Engineering, 3rd ed., The Institution of Mining and Metallurgy, London, England
Hoek, E. and Brown, E.T. (1997) Practical Estimates of Rock Mass Strength, Int. J. Rock Mech. & Mining
Sci. & Geomechanics Abstracts, 34 (8), 1165-1186.
Lutton, R. J. and Banks, D. C. (1970) Study of Clay Shale Slopes Along the Panama Canal, Report 1: East Culebra and West Culebra Slides and The Model Slope, Technical Report S-70-9, U. S. Army Engineer Waterways Experiment Station, Vicksburg, Mississippi.
Marinos, P. and Hoek, E. (2000) GSI – A Geologically Friendly Tool for Rock Mass Strength Estimation, Proc. GeoEng2000 Conference, Melbourne, Australia.
RocScience, Inc. (2003) Slide User Guide Smith, A. (2005) Precipitación Promedio Mensual de la
Cuenca del Canal de Panamá en Pulgadas, Internal Report, Panama Canal Authority, Engineering Division, Republic of Panama.
Stewart, J. (1984) Descriptions of Formations Found in Gaillard Cut, Internal Report, Panama Canal Commission, Engineering Division, Republic of Panama
1467
Sea to Sky Geotechnique 2006