Embed Size (px)
Citation preview
http://social-epistemology.com ISSN: 2471-9560
Commentary on Anderson and Feist’s “Transformative Science” Ryan D. Tweney, Bowling Green State University –––––––––––––––––– Tweney, Ryan D. “Commentary on Anderson and Feist’s ‘Transformative Science’.” Social Epistemology Review and Reply Collective 6, no. 7 (2017): 23-26. http://wp.me/p1Bfg0-3Dx
23
Vol. 6, no. 7 (2017): 23-36 http://wp.me/p1Bfg0-3Dx
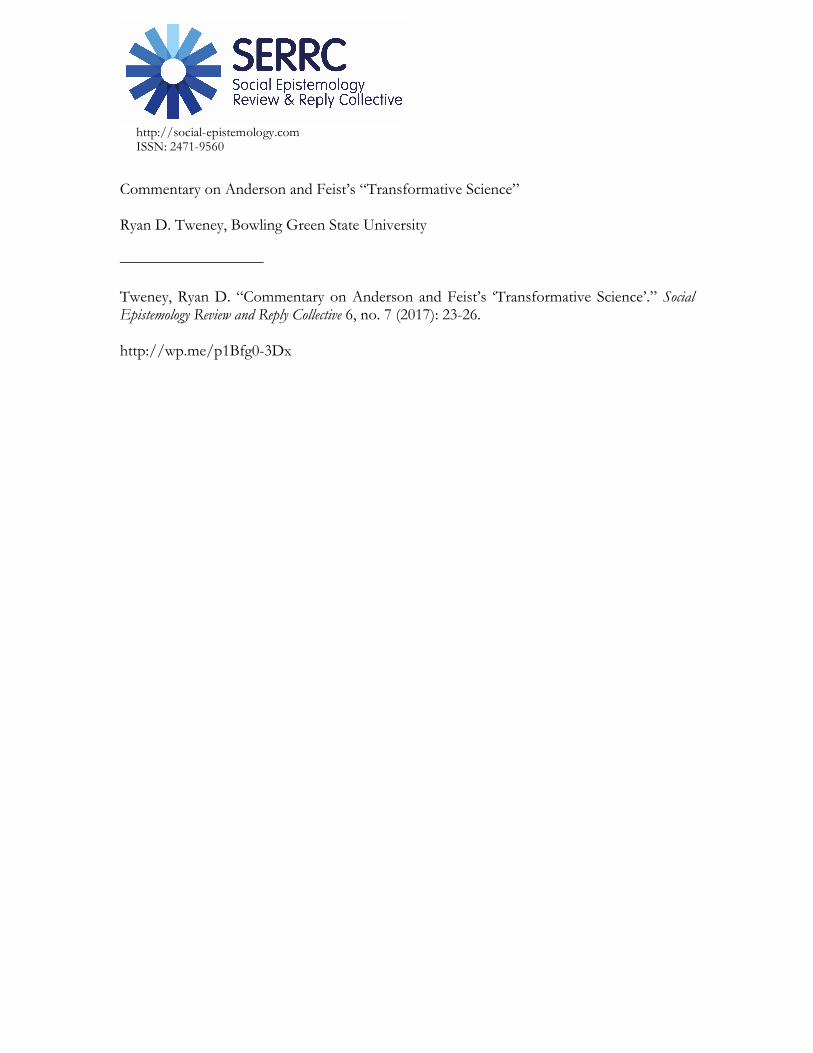
Traditionally, historic transformations in science were seen as the products of “great men”; Copernicus, Newton, Darwin, or, in the modern era, Einstein and Marie Curie. It was “genius” that propelled science to new levels of achievement and understanding. Such views have fallen out of favor as the collective efforts that go into scientific advances have come to be recognized, a change in perspective often attributed to Thomas Kuhn. “Transformative Science” is a new phrase, now used even by funding agencies as one of the criteria for worthy projects. Barrett Anderson and Gregory Feist (2017), however, note how fuzzy the term has been and offer something like a definition. Transformative science, they suggest, is science that leads to a new branch on the “tree of knowledge.” This is not a true definition, of course, since it is based upon a metaphor, one which is itself only fuzzily defined. Anderson and Feist note that the tree metaphor has been formalized in biology via cladistics. The present paper seeks to extend something similar to the domain of research evaluation. As with cladistics, if formal tools can be developed to measure aspects relevant to the growth of knowledge in science, then it may be that we will advance toward an understanding of transformative science. They thus propose a method for measuring the influence of a given, highly-cited, paper in a way potentially leading to the goal of identifying truly transformative results. Plotting Generativity Anderson and Feist’s exploratory study focused upon a single year of publication (2002) from a single field (psychology), selecting randomly some 887 articles that were among the top 10% of most highly cited articles. They then looked at the articles that had cited these 887, identifying those that were themselves among the most cited. They then developed a “generativity score” for each of the original articles. In effect, among the 887 articles, they singled out those that had generated the highest numbers of highly cited articles. Each of the 887 were then examined and coded for funding source. Descriptively, both generativity and times cited were heavily skewed (Figures 6, 140, and 8, 141), leading the authors to carry out a log transformation of each (Figures 7 and 9, 141), in an attempt to normalize the distributions. They claim that this was successful for the generativity scores, but not for the number of times cited. But note that the plots are severely misleading. Since there are 887 articles in the sample, and the number of points on each graph is far smaller, it must be the case that multiple articles are hidden within each of the plotted points. Is it the case that the vast majority of the articles are somewhere in the middle of each distribution? At the lower end? At the upper end? If so, the claim that generativity was successfully normalized is suspect. This is even apparent from the graph (Figure 7, 141) which, while roughly bell-shaped (as far as the outer “envelope” of points is concerned), clearly must have a large majority of points that share the same value. Since the mean and median of “G log 10” (see Table 4, 140) are reported as roughly equal at around 1.0, these shared points must be at the lower end of the scale (below an untransformed
R. Tweney
24
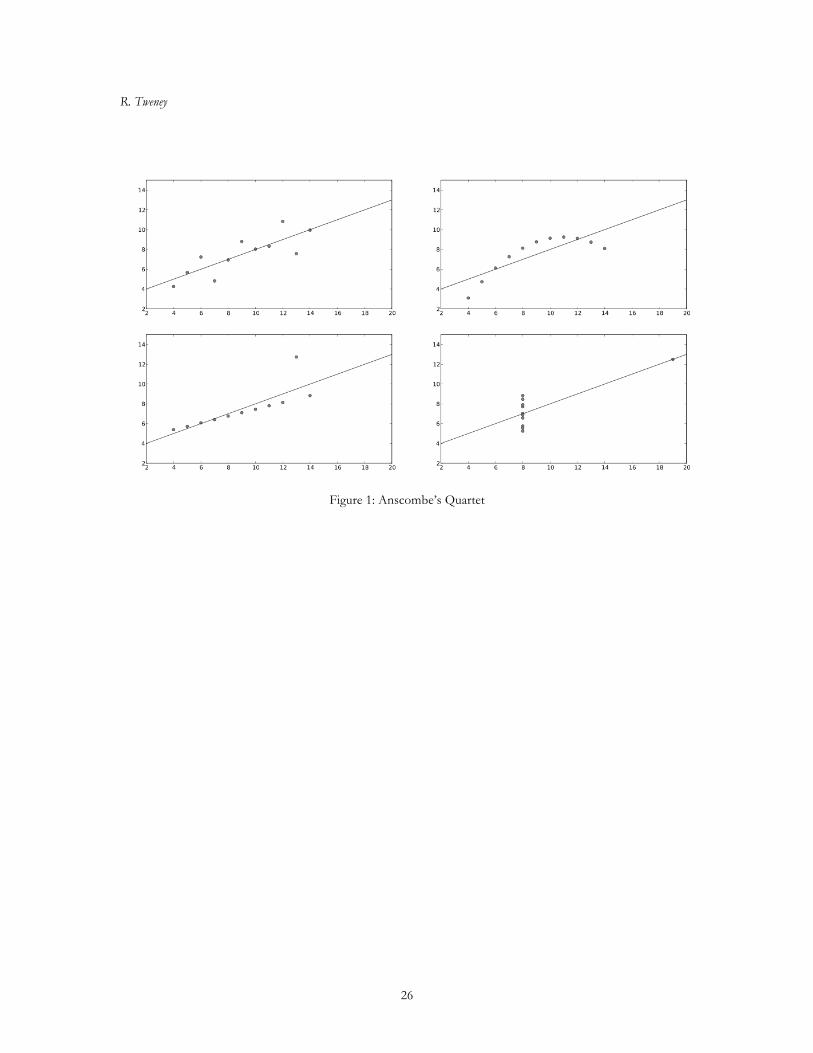
generativity score of 10). A better plot, with the individual points “jittered” to separate them might then make the claim of approximate normality more convincing (Cleveland 1985). Similar considerations applied to the times cited plots suggest a different distribution, though still far from normal, whether in raw scores or log transformed scores. Is it a Poisson distribution? Clearly not, since, in a Poisson, the mean and variance should be roughly equal. This is far from the case, whether raw scores or transformed scores are used. The nature of the distribution matters here because Pearson r was used to determine the relationship between generativity and times cited. But Pearson’s statistic is only appropriate for determining the linear relationship between two bivariate normal variables. Anderson and Feist report the correlations as r = 0.87 for G and TC and 0.69 for G log10 and TC log 10. This strikes me as meaningless, especially if there are large numbers of low generativity points masked by the lack of jittering (as suggested above). From the similarly unjittered scatterplots (Figures 10 and 11, 142), which are superficially, more-or-less bivariate linear, the points at the lower end look to be unrelated. This suggests that a small number of points at the upper end are pulling the regression line upwards, a possibility that recalls “Anscombe’s Quartet” (Tufte 2001, 14), a set of four relationships that each show a Pearson correlation of +0.82, but which are wildly different (see Figure 1 below, page 26). Similar problems with non-normal distributions may affect analysis of the relationship between funding source, generativity, and times cited. In any case, these relationships are incredibly small—among the reported eta-squared values, the largest is only 0.014. Whether or not the result is significant is not the issue; a relationship between variables that accounts for only 1.4% of the variance is too small to be of practical significance. The best conclusion to draw from these data is that there is no relationship between funding source (or its absence) and either generativity or times cited. Ways to Look at the Data Anderson and Feist have, of course, given us an exploratory study, so statistical and graphic nitpicking is not the main point. Instead, the real value of the study has to lie in the directions it points and the issues it raises. What they refer to as the “structure” of citations is an important aspect of scientific literature and, indeed, one that has been overlooked. Their operational implementation of generativity is potentially important, and it suggests a number of new ways to look at their data. In particular (and in the spirit of seeking to move toward a true recognition of transformative science), more attention needs to paid to the extreme outliers in their data. Thus, both generativity and times cited show two (or more?) points at extremely large values in Figures 6 (140) and 8 (141). Are these the same two papers (assuming there are only two), as suggested by the scatterplot in Figure 10 (142)? And what are they and where did they appear? What can be said about their content, the content of the citing articles, and about the purposes for which they were cited? If they are methodological contributions, instead of articles that report a new phenomenon, we might draw different lessons from their structural extremity.
25
Vol. 6, no. 7 (2017): 23-36 http://wp.me/p1Bfg0-3Dx
Many other questions could be raised using the existing data set. Is there a relationship between generativity and the lag in citations? That is, are highly generative articles more likely to show citations increasing over time, as one would expect if the influence of a generative article is to generate more research (which takes time and sometimes funding), rather than simply nods to something interesting. Or, similarly, what does the “decay” curve of citations look like? One might find large differences, even among relatively low generativity articles in their “half life,” thinking perhaps that truly generative articles have a longer half-life than even highly cited, otherwise seemingly generative, articles. There is a great deal more to be learned here. Since this is an exploratory study, it would also make sense to use exploratory data analysis (Tukey 1970) to search for structural patterns in the data set. For example, one could plot the relation between generativity and times cited by dividing the generativity data by deciles and looking at the distribution of times cited for each decile; if the middle ranges of generativity had approximately bell-shaped distributions of times cited, then Pearson correlation coefficients might be appropriate for quantifying the middle range of the relationship. Finally, since the goal is to obtain information about the structure of citations (rather than simply their number), aggregate statistics like means, correlation coefficients, and the like seem to rather miss the point. For example, is it the case that highly generative articles have chains of subsequent citations that branch off when new articles citing them become themselves highly cited? If so, and if non-generative articles (which by definition have simple “fan-like” patterns without branching), one would have a direct look at the structure of the network of citations. At the end of the article, Anderson and Feist make a number of suggestions for further research, all of which suggest gathering more data. These are welcome suggestions and should indeed be pursued, even, as they acknowledge, truly transformative science must ultimately await the judgment of history. In the meantime, I hope that this intriguing contribution can be further strengthened, expanded, and subjected to further exploratory analysis. Contact details: [email protected] References Barrett R. Anderson and Gregory J. Feist. “Transformative Science: A New Index and the
Impact of Non-Funding, Private Funding, and Public Funding.” Social Epistemology 31, no. 2 (2017): 130-151.
Cleveland, William S. The Elements of Graphing Data. Monterey, CA: Wadsworth, 1985. Tufte, Edward R. The Visual Display of Quantitative Information (2nd ed.). Cheshire, CT:
Graphics Press, 2001. Tukey, John W. Exploratory Data Analysis. New York: Addison-Wesley, 1970.
R. Tweney
26
Figure 1: Anscombe’s Quartet


![Artist research -feist[1]](https://img.pdfslide.us/doc/110x75/5495af25b479593a508b4577/artist-research-feist1.jpg)