Embed Size (px)
Citation preview
Experience you can trust.June 5 – 7, 2006
International Conference on SynchrophasorMeasurement Applications, Brasil 2006
Tutorial on PMU Technology and Applications
Dr. Damir [email protected]
Outline• General Concepts and Definitions• Industry Needs• Expected Benefits and Gaps • Industry Projects and Experience • System Architecture • Challenges• Standardization, Tests, and Certification

Experience you can trust.June 5 – 7, 2006
General Concepts and Definitions
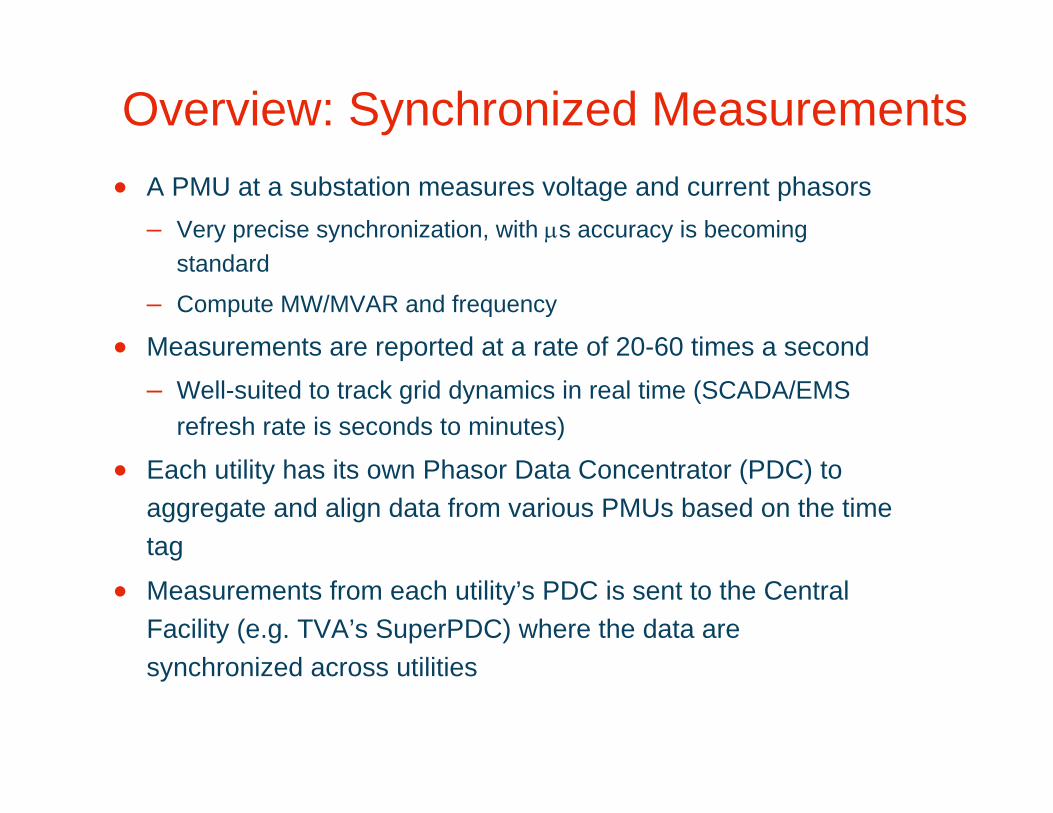
Overview: Synchronized Measurements• A PMU at a substation measures voltage and current phasors
– Very precise synchronization, with µs accuracy is becoming standard
– Compute MW/MVAR and frequency
• Measurements are reported at a rate of 20-60 times a second – Well-suited to track grid dynamics in real time (SCADA/EMS
refresh rate is seconds to minutes)
• Each utility has its own Phasor Data Concentrator (PDC) to aggregate and align data from various PMUs based on the time tag
• Measurements from each utility’s PDC is sent to the Central Facility (e.g. TVA’s SuperPDC) where the data are synchronized across utilities
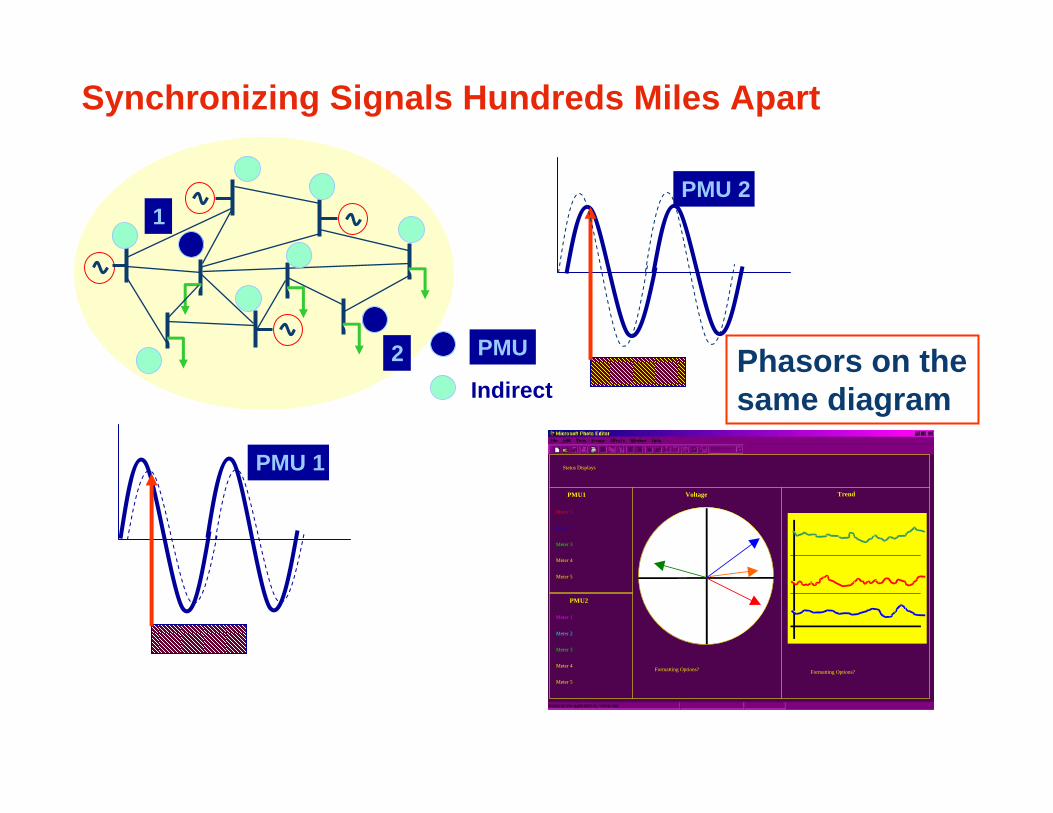
Synchronizing Signals Hundreds Miles Apart
Phasors on the same diagram
Voltage TrendPMU1
PMU2
Meter 1
Meter 2
Meter 3
Meter 4
Meter 5
Meter 1
Meter 2
Meter 3
Meter 4
Meter 5
Status Displays
Formatting Options? Formatting Options?
PMU 1
PMU 21
2 PMU
Indirect
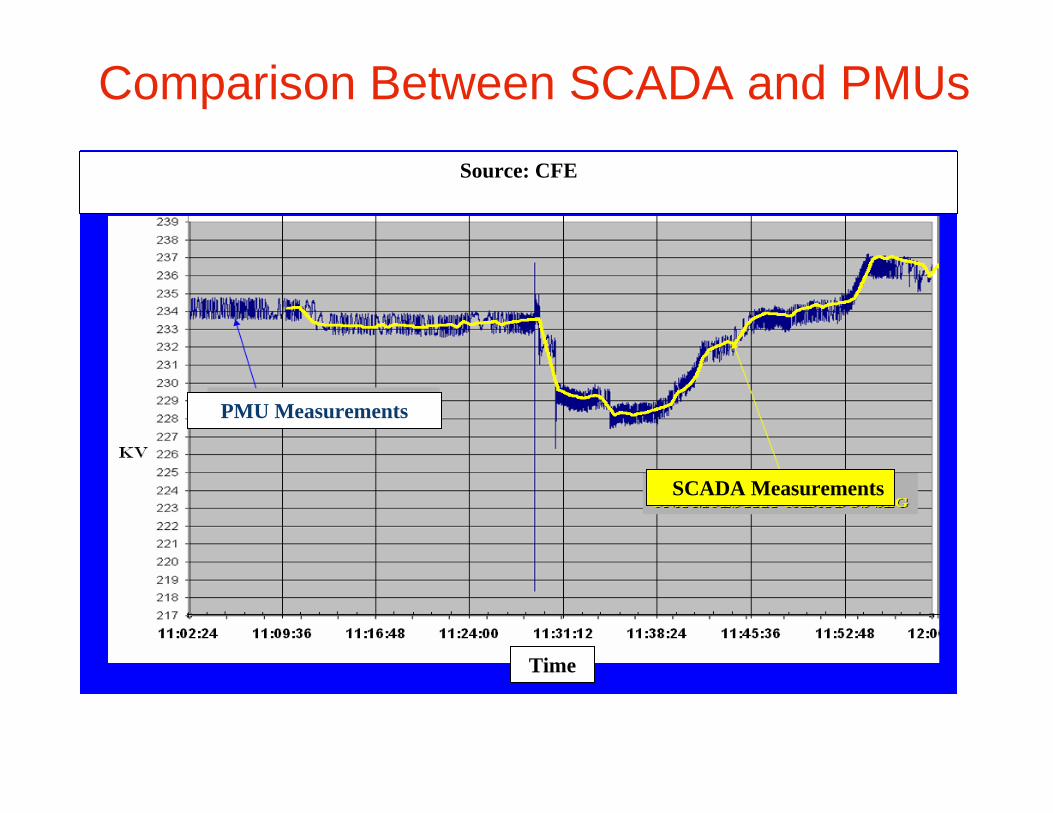
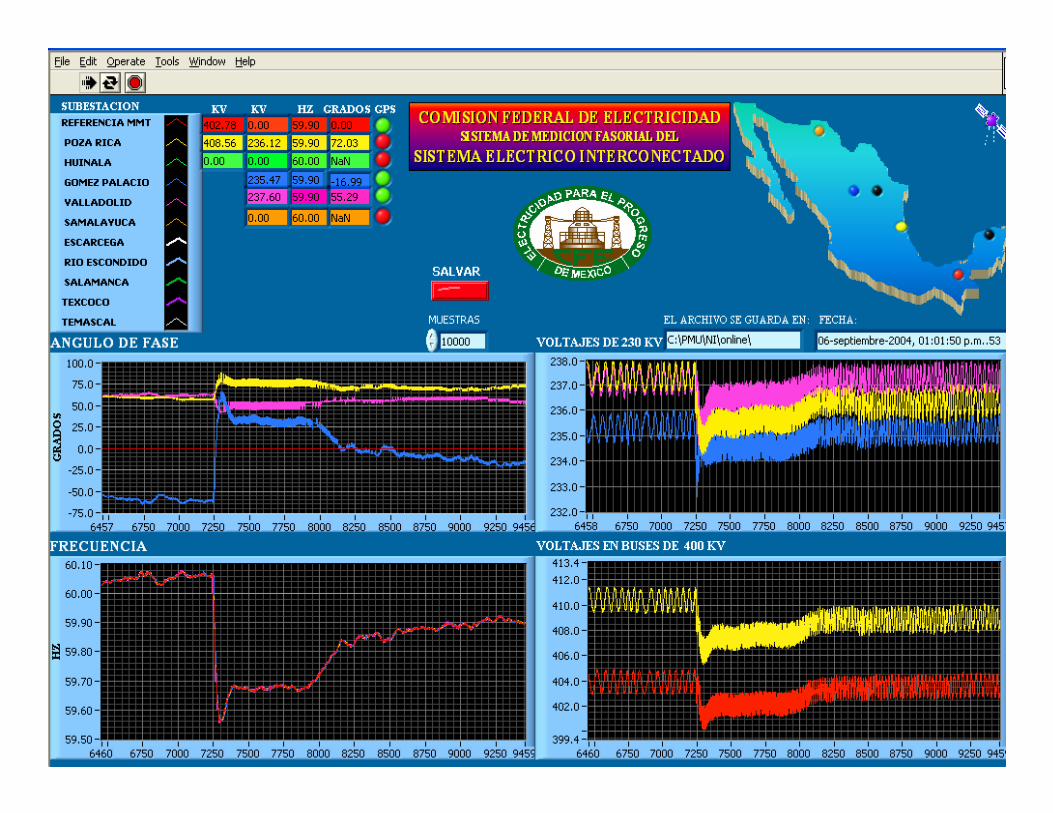
Comparison Between SCADA and PMUs
SCADA Measurements
PMU Measurements
Time
Source: CFE
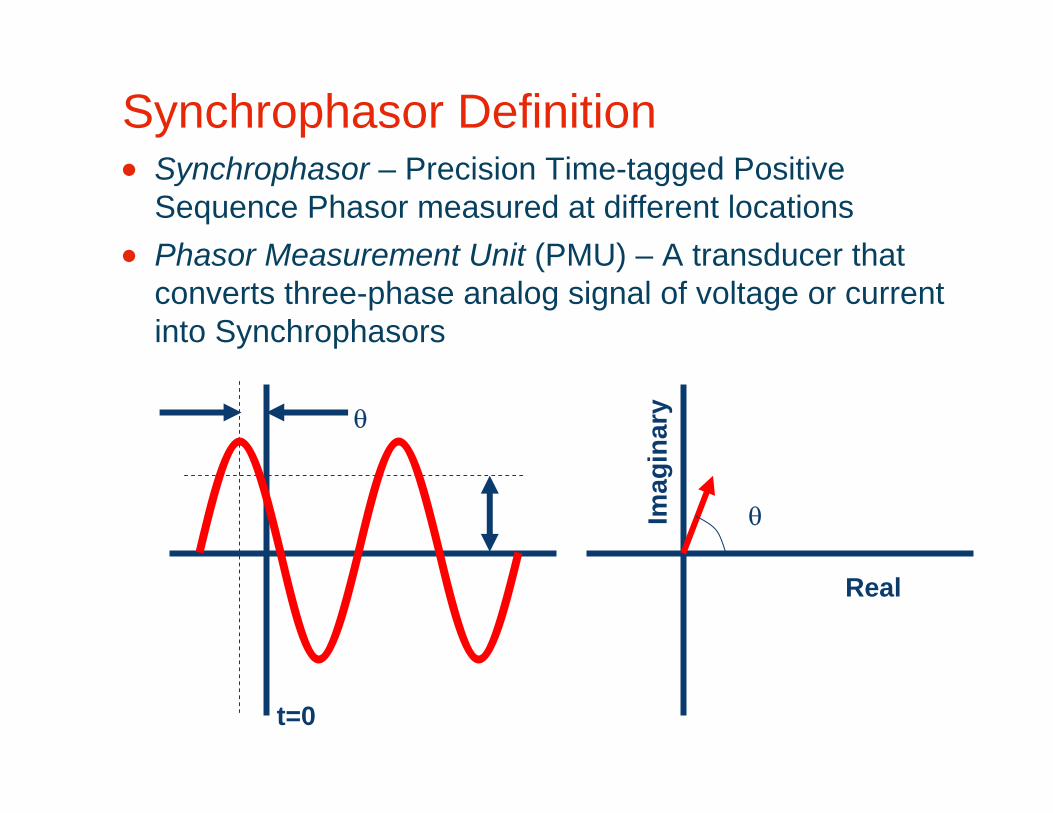
Synchrophasor Definition• Synchrophasor – Precision Time-tagged Positive
Sequence Phasor measured at different locations• Phasor Measurement Unit (PMU) – A transducer that
converts three-phase analog signal of voltage or current into Synchrophasors
θ
Real
Imag
inar
yθ
t=0
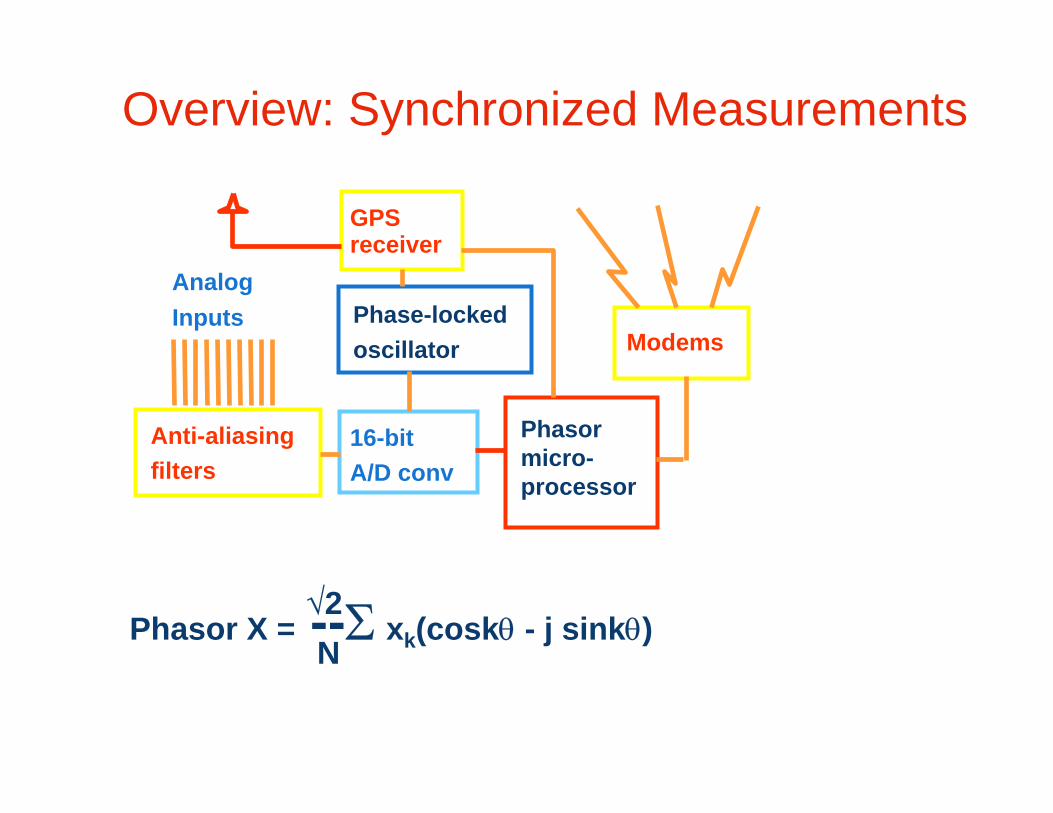
Overview: Synchronized Measurements
Anti-aliasingfilters
16-bitA/D conv
GPSreceiver
Phase-lockedoscillator
AnalogInputs
Phasormicro-processor
Modems
Phasor X = --Σ xk(coskθ - j sinkθ)√2N
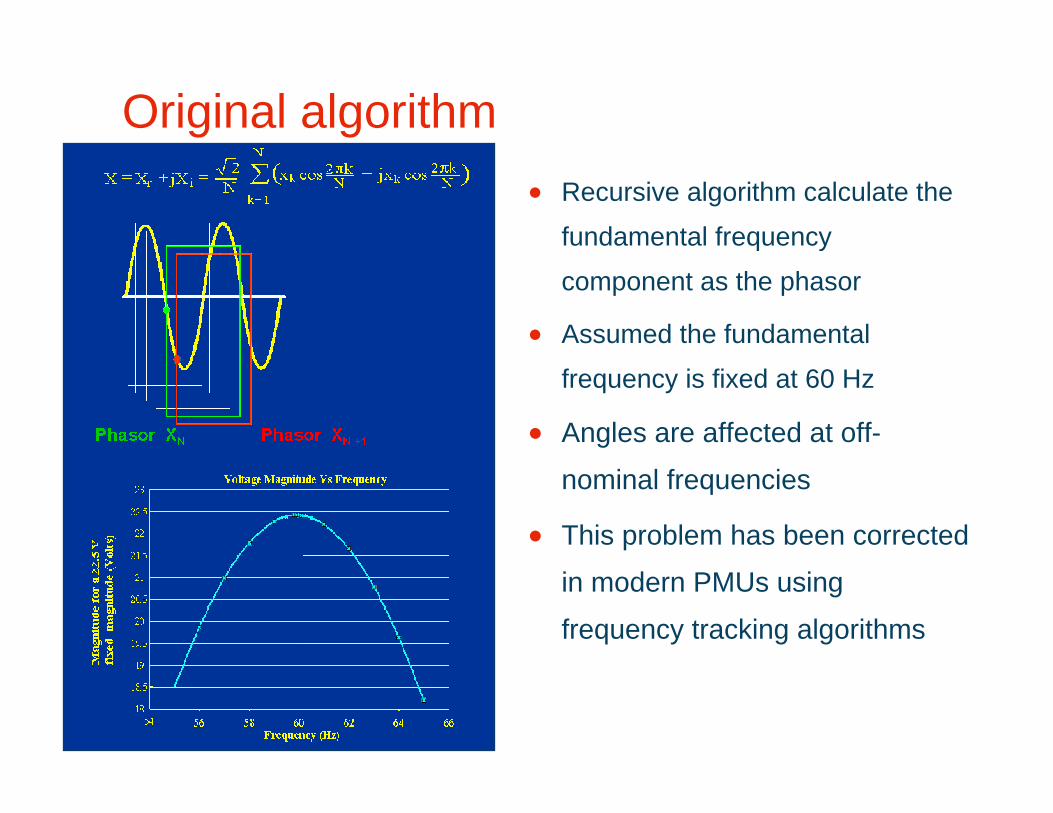
Original algorithm• Recursive algorithm calculate the
fundamental frequency
component as the phasor
• Assumed the fundamental
frequency is fixed at 60 Hz
• Angles are affected at off-
nominal frequencies
• This problem has been corrected
in modern PMUs using
frequency tracking algorithms
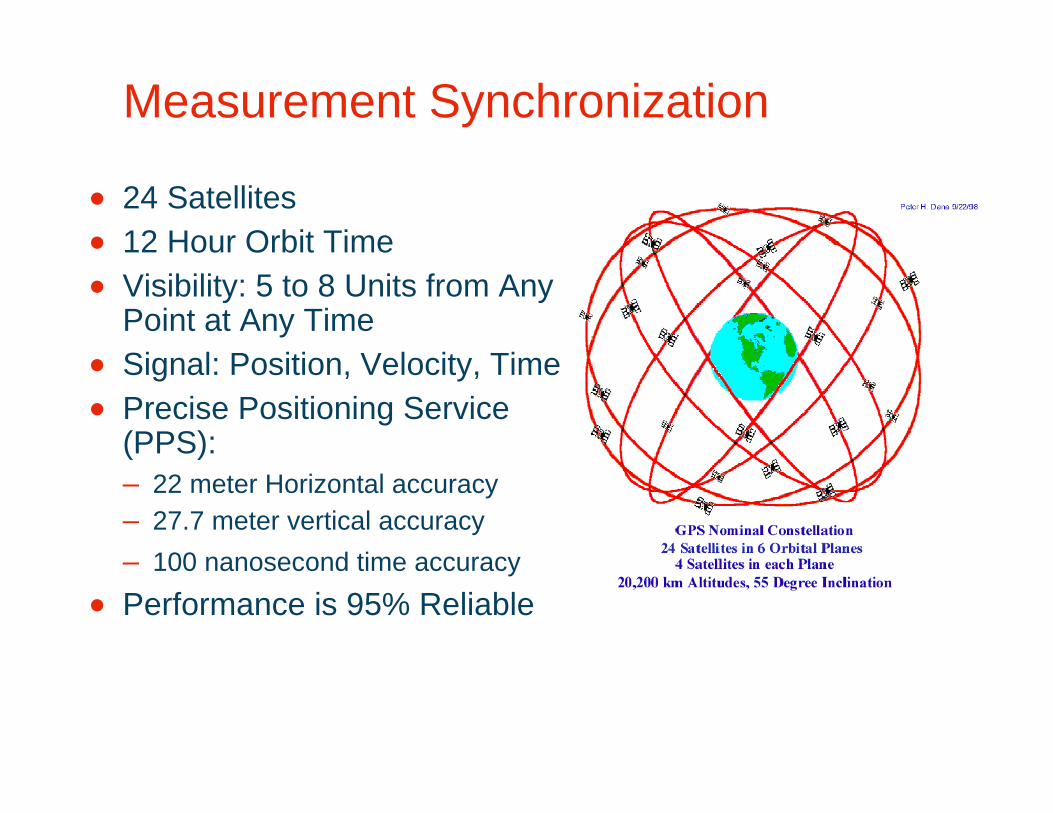
• 24 Satellites• 12 Hour Orbit Time• Visibility: 5 to 8 Units from Any
Point at Any Time• Signal: Position, Velocity, Time• Precise Positioning Service
(PPS):– 22 meter Horizontal accuracy – 27.7 meter vertical accuracy – 100 nanosecond time accuracy
• Performance is 95% Reliable
Measurement Synchronization
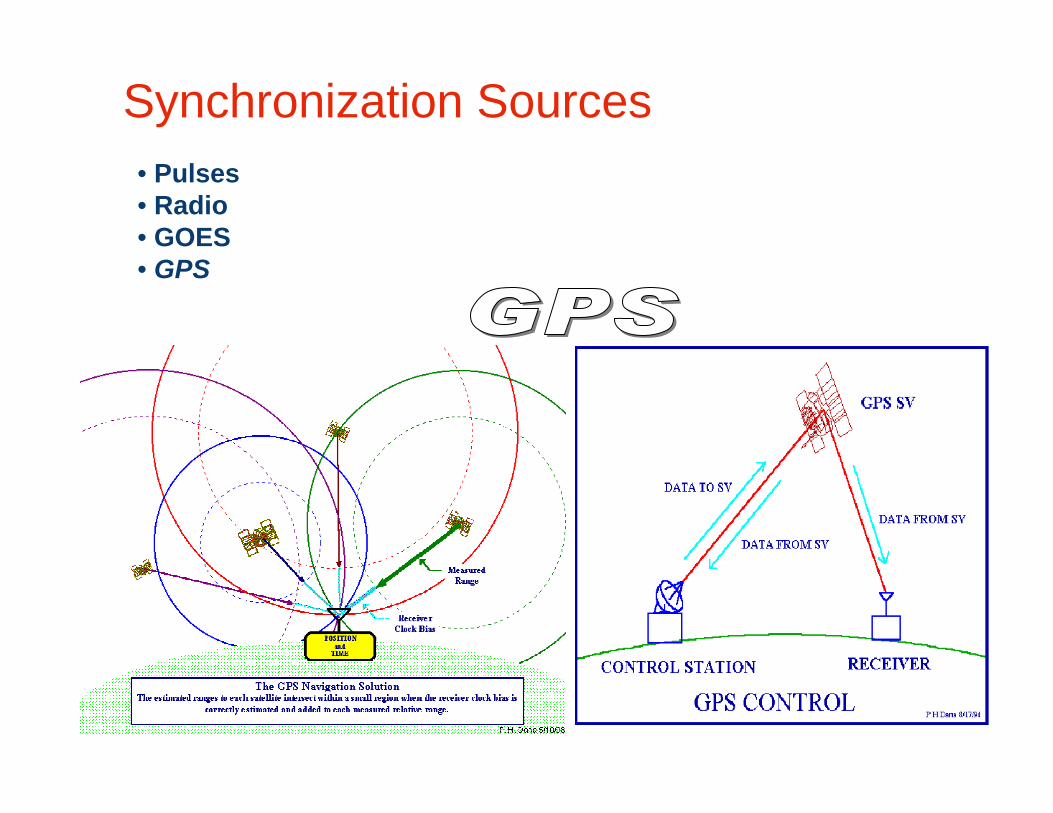
• Pulses• Radio• GOES• GPS
Synchronization Sources

Experience you can trust.June 5 – 7, 2006
Industry Needs
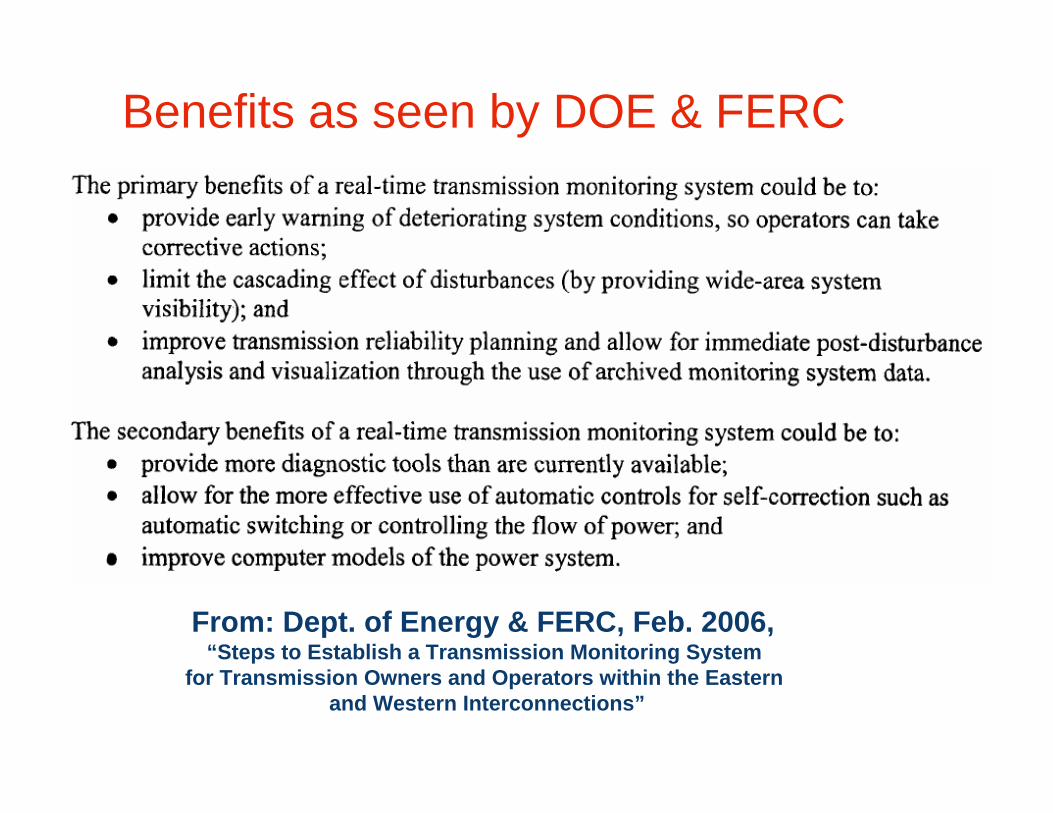
Benefits as seen by DOE & FERC
From: Dept. of Energy & FERC, Feb. 2006, “Steps to Establish a Transmission Monitoring System
for Transmission Owners and Operators within the Eastern and Western Interconnections”
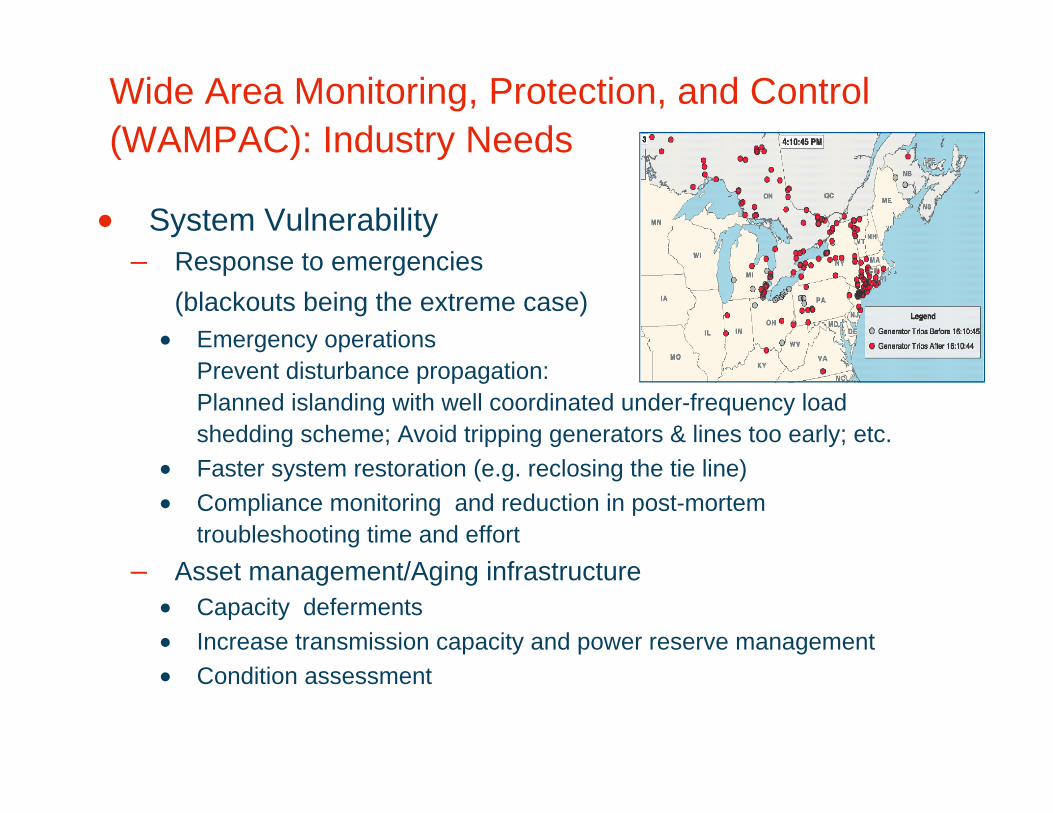
Wide Area Monitoring, Protection, and Control (WAMPAC): Industry Needs
• System Vulnerability– Response to emergencies
(blackouts being the extreme case)• Emergency operations
Prevent disturbance propagation: Planned islanding with well coordinated under-frequency load shedding scheme; Avoid tripping generators & lines too early; etc.
• Faster system restoration (e.g. reclosing the tie line) • Compliance monitoring and reduction in post-mortem
troubleshooting time and effort– Asset management/Aging infrastructure
• Capacity deferments • Increase transmission capacity and power reserve management • Condition assessment
Wide Area Monitoring, Protection, and Control (WAMPAC): Industry Needs
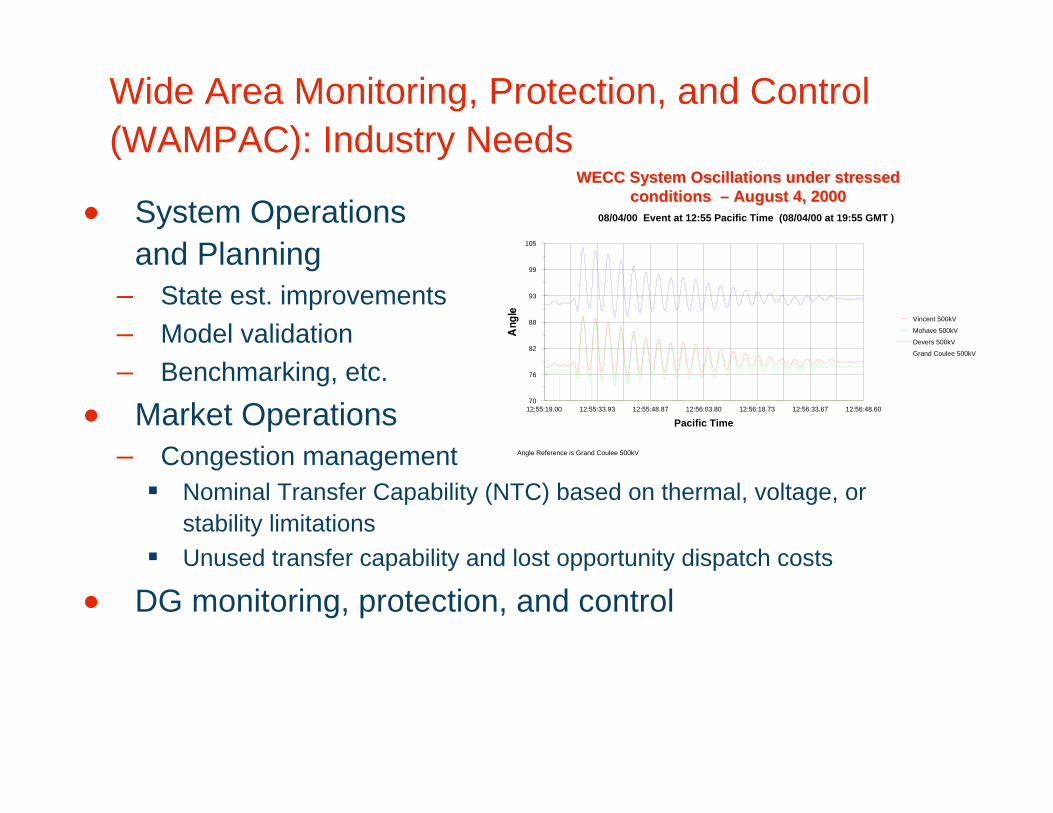
• System Operations and Planning
– State est. improvements– Model validation– Benchmarking, etc.
• Market Operations– Congestion management
Nominal Transfer Capability (NTC) based on thermal, voltage, or stability limitations Unused transfer capability and lost opportunity dispatch costs
• DG monitoring, protection, and control
70
76
82
88
93
99
105
12:55:19.00 12:55:33.93 12:55:48.87 12:56:03.80 12:56:18.73 12:56:33.67 12:56:48.60
Pacific Time
Vincent 500kV
Mohave 500kV
Devers 500kV
Grand Coulee 500kV
Angle Reference is Grand Coulee 500kV
08/04/00 Event at 12:55 Pacific Time (08/04/00 at 19:55 GMT )
WECC System Oscillations under stressed WECC System Oscillations under stressed conditions conditions –– August 4, 2000August 4, 2000

• Application Modules– Angular & voltage stability monitoring and control– Dynamic line models:
Overload monitoring and control and Fault location– Power oscillation monitoring & damping (e.g. PSS)– Critical equipment status and condition monitoring – Frequency and df/dt monitoring and protection– Monitoring machine excitation & governor systems– Adaptive relay settings and protection– Etc.
• Technology– Integrated system-wide communication infrastructure allowing flexible and secure
data collection and transfer where and when needed– Synchronized measurements– Use of standard technology, such as IEC61850, for easier integration,
configuration, engineering, and maintenance – Advanced sensors (line thermal monitors, equipment condition assessment, etc.)– Advanced visualization tools and algorithms
WAMPAC Enablers
Experience you can trust.June 5 – 7, 2006
Expected Benefits and Gaps
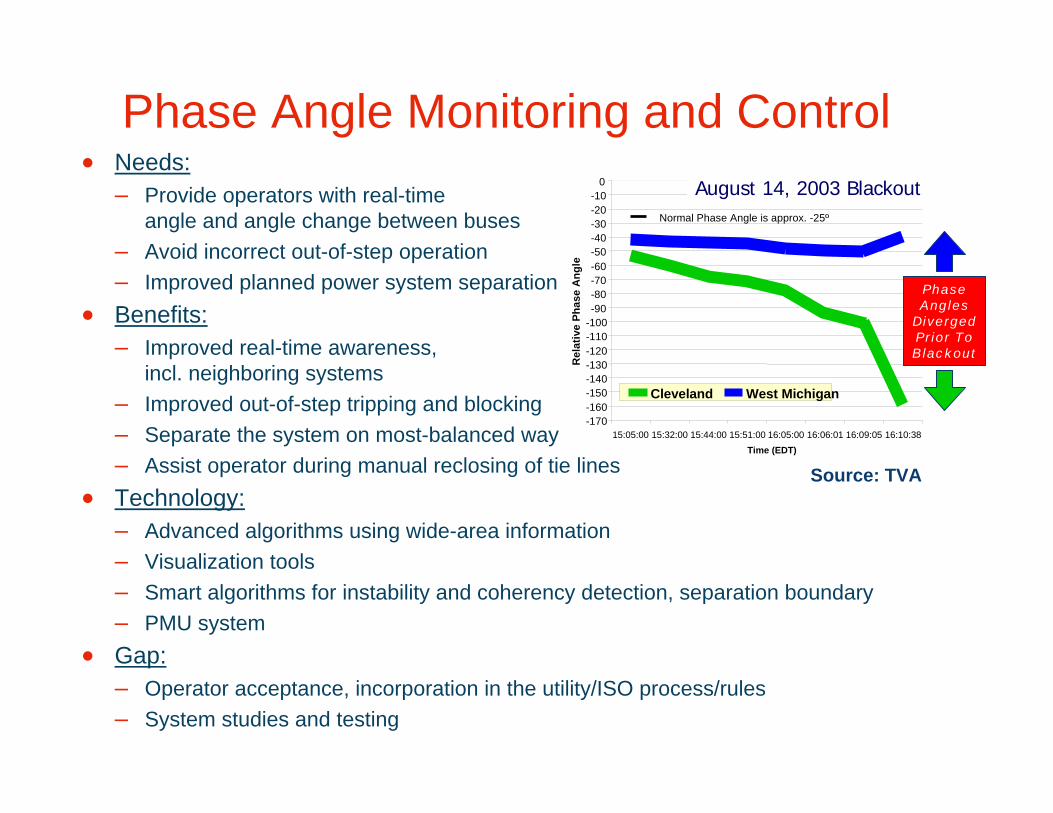
Phase Angle Monitoring and Control• Needs:
– Provide operators with real-time angle and angle change between buses
– Avoid incorrect out-of-step operation– Improved planned power system separation
• Benefits:– Improved real-time awareness,
incl. neighboring systems– Improved out-of-step tripping and blocking– Separate the system on most-balanced way– Assist operator during manual reclosing of tie lines
• Technology:– Advanced algorithms using wide-area information– Visualization tools – Smart algorithms for instability and coherency detection, separation boundary– PMU system
• Gap:– Operator acceptance, incorporation in the utility/ISO process/rules– System studies and testing
-170-160-150-140-130-120-110-100-90-80-70-60-50-40-30-20-10
0
15:05:00 15:32:00 15:44:00 15:51:00 16:05:00 16:06:01 16:09:05 16:10:38Time (EDT)
Rel
ativ
e Ph
ase
Ang
le
Cleveland West Michigan
Normal Phase Angle is approx. -25º
Phase Angles
Diverged Prior To Blackout
August 14, 2003 Blackout
Source: TVA
0.00
20.00
40.00
60.00
80.00
100.00
0 0.5 1 1.5 2 2.5 3 3.5 4
Entropy Reduction
%
0.00
0.05
0.10
0.15
0.20
0.25
0.30
Deg
rees
^2
% Angle Variance ReductionAngle Variance
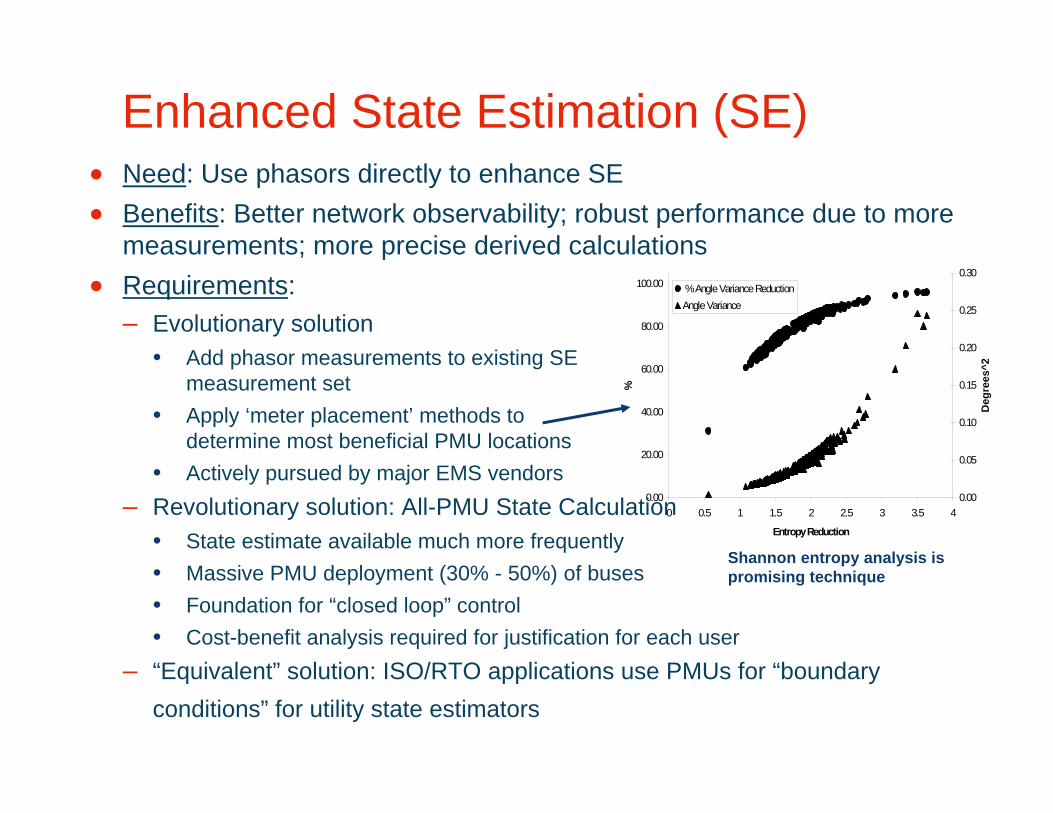
Enhanced State Estimation (SE)• Need: Use phasors directly to enhance SE• Benefits: Better network observability; robust performance due to more
measurements; more precise derived calculations• Requirements:
– Evolutionary solution• Add phasor measurements to existing SE
measurement set• Apply ‘meter placement’ methods to
determine most beneficial PMU locations • Actively pursued by major EMS vendors
– Revolutionary solution: All-PMU State Calculation• State estimate available much more frequently• Massive PMU deployment (30% - 50%) of buses• Foundation for “closed loop” control• Cost-benefit analysis required for justification for each user
– “Equivalent” solution: ISO/RTO applications use PMUs for “boundary conditions” for utility state estimators
Shannon entropy analysis is promising technique
Enhanced State Estimation (SE)• Gap:
– Need for more PMUs to realize benefits– Measurement-error (accuracy) analysis for combined traditional
telemetry and PMUs• What is redundancy with both traditional telemetry and PMU
measurements?– As conventional SE uses app. 10s window, what is the level of
improvements with PMUs?– Time skew impact to be quantified – Bad data detection (robustness) may be affected by accuracy issues– Will positive sequence measurement help as existing telemetry uses
one or two phases?– Further develop “linear” SE application
Scope and nature of SE enhancement is system/customer dependent
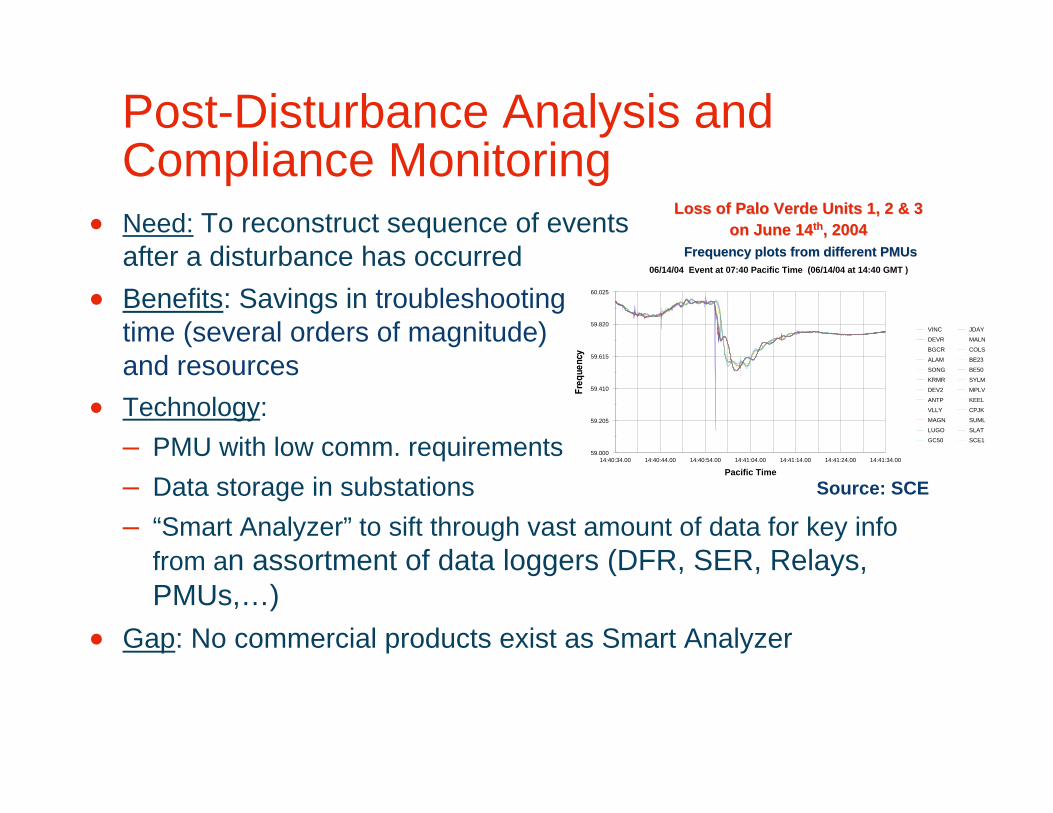
Post-Disturbance Analysis and Compliance Monitoring
• Need: To reconstruct sequence of events after a disturbance has occurred
• Benefits: Savings in troubleshooting time (several orders of magnitude)and resources
• Technology:– PMU with low comm. requirements– Data storage in substations– “Smart Analyzer” to sift through vast amount of data for key info
from an assortment of data loggers (DFR, SER, Relays, PMUs,…)
• Gap: No commercial products exist as Smart Analyzer
59.000
59.205
59.410
59.615
59.820
60.025
14:40:34.00 14:40:44.00 14:40:54.00 14:41:04.00 14:41:14.00 14:41:24.00 14:41:34.00
Pacific Time
VINC
DEVR
BGCR
ALAM
SONG
KRMR
DEV2
ANTP
VLLY
MAGN
LUGO
GC50
JDAY
MALN
COLS
BE23
BE50
SYLM
MPLV
KEEL
CPJK
SUML
SLAT
SCE1
06/14/04 Event at 07:40 Pacific Time (06/14/04 at 14:40 GMT )
Source: SCE
Loss of Palo Verde Units 1, 2 & 3 Loss of Palo Verde Units 1, 2 & 3 on June 14on June 14thth, 2004 , 2004
Frequency plots from different PMUsFrequency plots from different PMUs
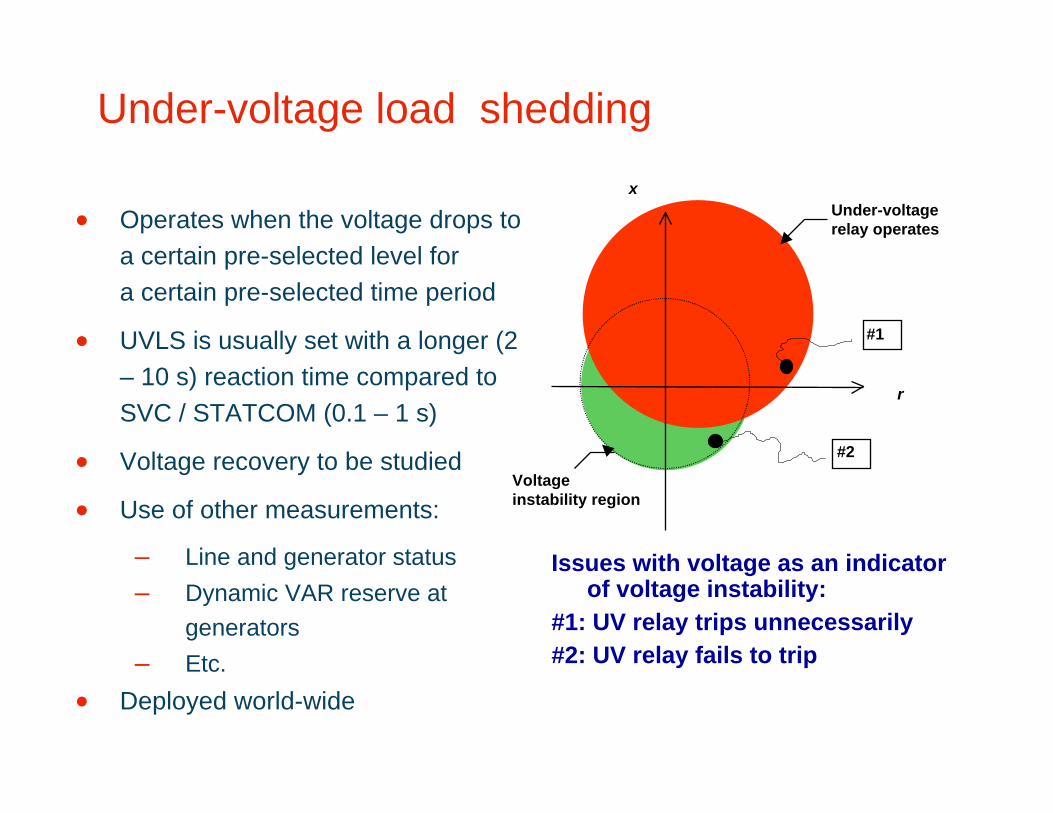
Under-voltage load shedding
• Operates when the voltage drops to a certain pre-selected level fora certain pre-selected time period
• UVLS is usually set with a longer (2 – 10 s) reaction time compared to SVC / STATCOM (0.1 – 1 s)
• Voltage recovery to be studied
• Use of other measurements:
– Line and generator status– Dynamic VAR reserve at
generators– Etc.
• Deployed world-wide
xUnder-voltage relay operates
#1
#2
r
Voltage instability region
Issues with voltage as an indicator of voltage instability:
#1: UV relay trips unnecessarily#2: UV relay fails to trip
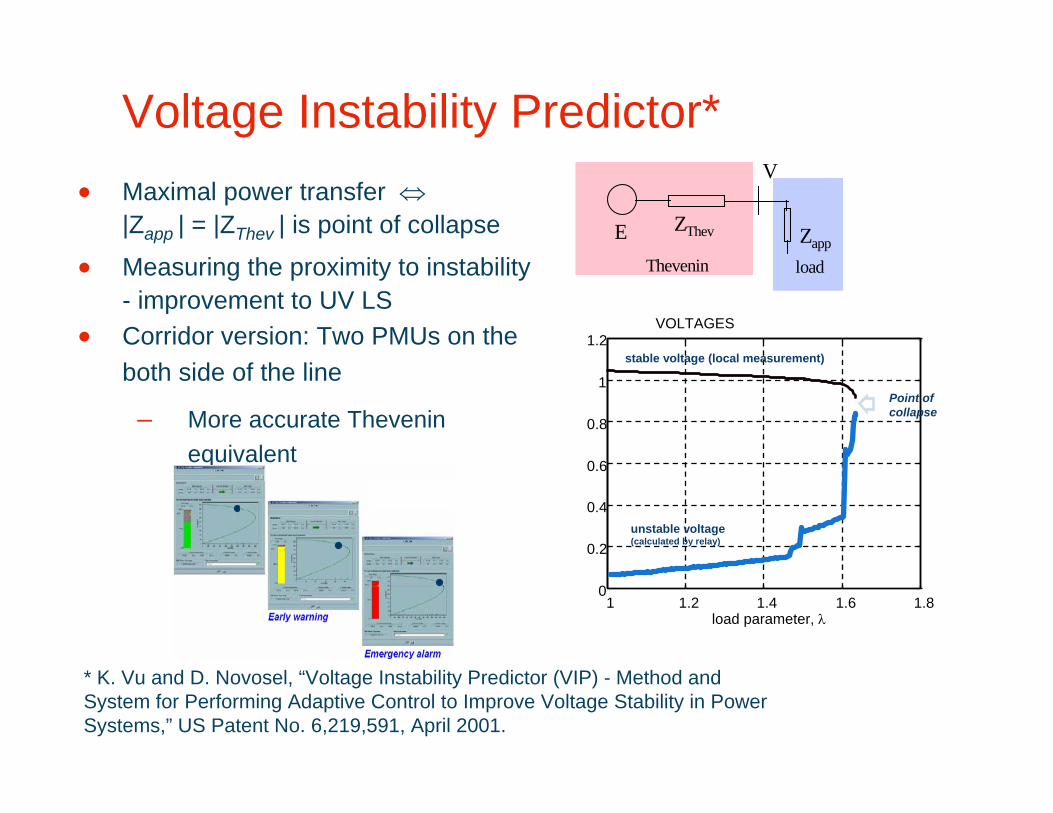
Voltage Instability Predictor*
* K. Vu and D. Novosel, “Voltage Instability Predictor (VIP) - Method and System for Performing Adaptive Control to Improve Voltage Stability in Power Systems,” US Patent No. 6,219,591, April 2001.
ZThev
V
ZappThevenin load
E
• Maximal power transfer ⇔|Zapp | = |ZThev | is point of collapse
• Measuring the proximity to instability - improvement to UV LS
• Corridor version: Two PMUs on the both side of the line
– More accurate Theveninequivalent
1 1.2 1.4 1.6 1.80
0.2
0.4
0.6
0.8
1
1.2VOLTAGES
load parameter, λ
stable voltage (local measurement)
unstable voltage (calculated by relay)
Point ofcollapse
Real-Time Congestion Management• Need: Improve calculation of real-time path flows and increase
transfer limits for optimal market dispatch• Benefits: Avoid large congestion costs
– Avoids unused transfer capability and lost opportunity dispatch costs through more accurate real-time ratings
– Experience from real-time ratings will help hour-ahead, and day-ahead limits
– Leads to better utilization of generation resources and less load curtailment
• Technology:– Adequate visibility of corridors with incorporation of improved basic
modules to EMS/SE: Angular stability, Voltage stability, Thermalconstraints
– PMU applications• Gap:
– Industry and staff adoption of new rules and procedures and PMU-based calculations
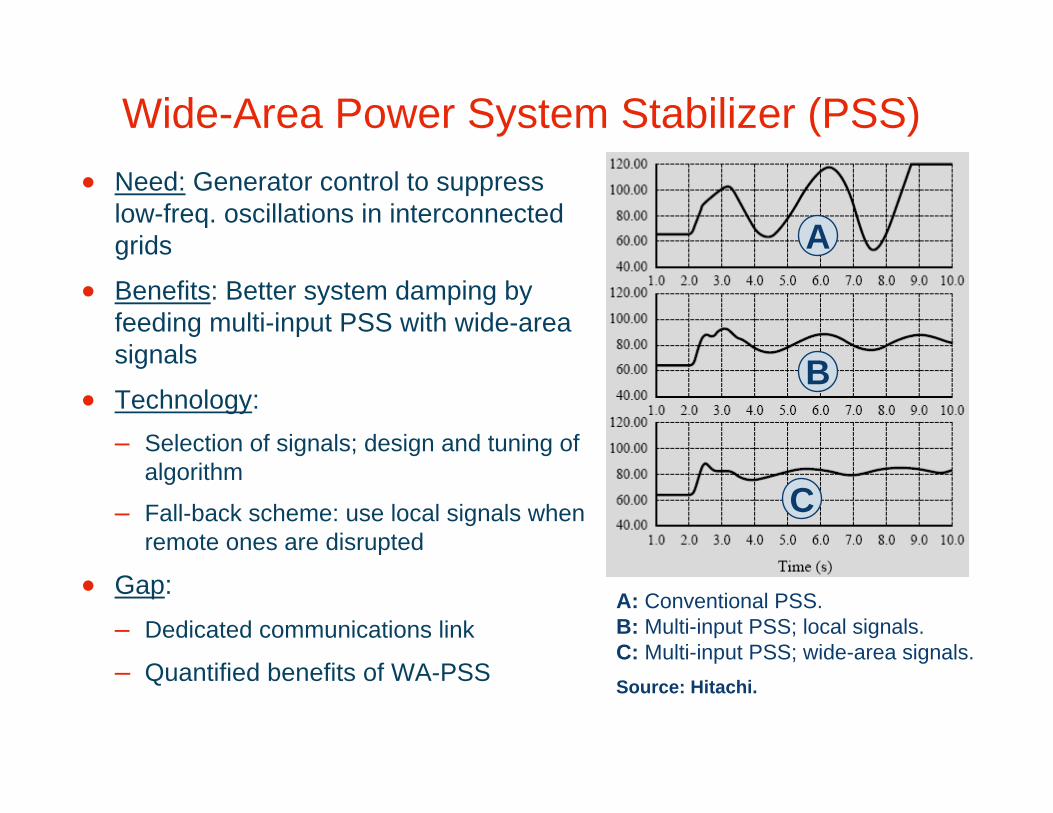
Wide-Area Power System Stabilizer (PSS)• Need: Generator control to suppress
low-freq. oscillations in interconnected grids
• Benefits: Better system damping by feeding multi-input PSS with wide-area signals
• Technology:– Selection of signals; design and tuning of
algorithm
– Fall-back scheme: use local signals when remote ones are disrupted
• Gap: – Dedicated communications link
– Quantified benefits of WA-PSS
A
B
C
A: Conventional PSS. B: Multi-input PSS; local signals. C: Multi-input PSS; wide-area signals.Source: Hitachi.
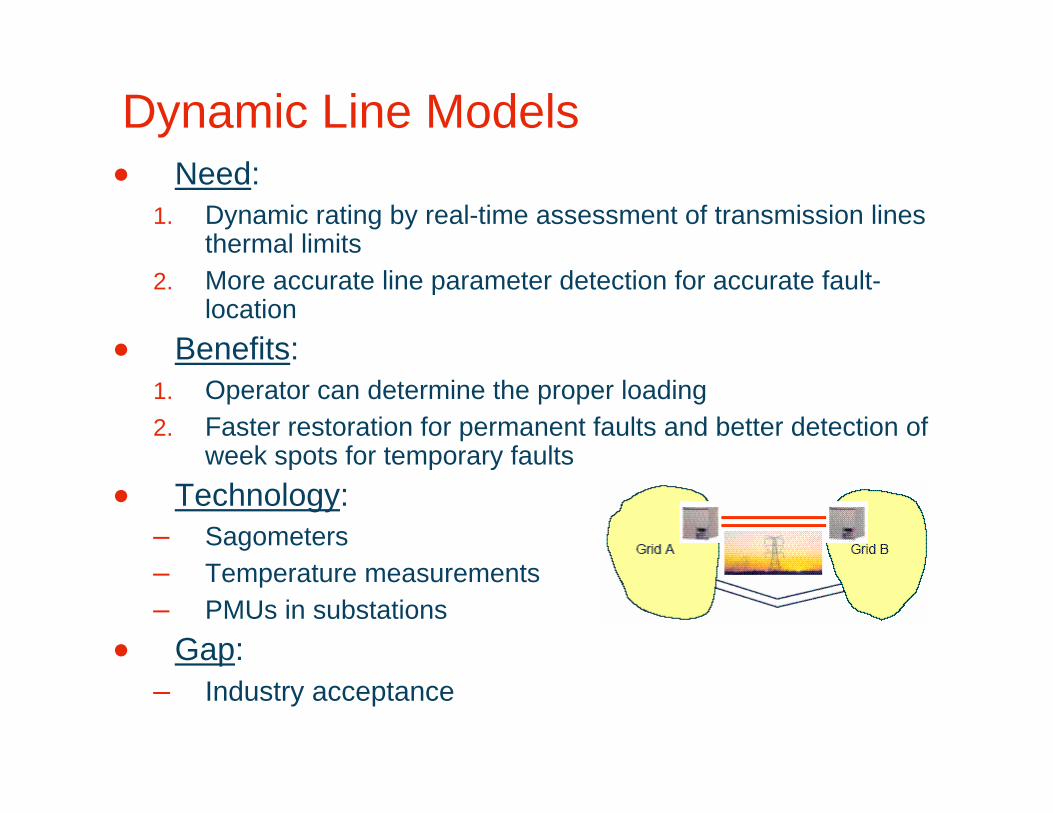
Dynamic Line Models• Need:
1. Dynamic rating by real-time assessment of transmission lines thermal limits
2. More accurate line parameter detection for accurate fault-location
• Benefits:1. Operator can determine the proper loading2. Faster restoration for permanent faults and better detection of
week spots for temporary faults• Technology:
– Sagometers– Temperature measurements– PMUs in substations
• Gap:– Industry acceptance
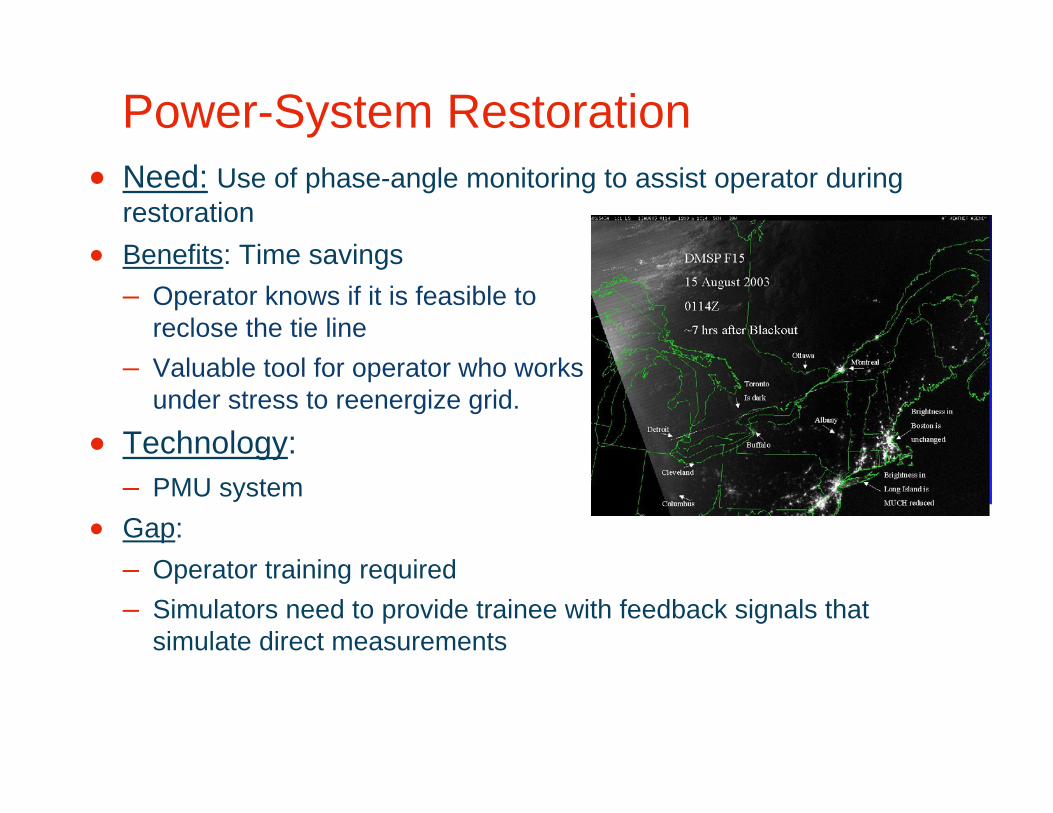
Power-System Restoration• Need: Use of phase-angle monitoring to assist operator during
restoration• Benefits: Time savings
– Operator knows if it is feasible to reclose the tie line
– Valuable tool for operator who works under stress to reenergize grid.
• Technology: – PMU system
• Gap: – Operator training required– Simulators need to provide trainee with feedback signals that
simulate direct measurements
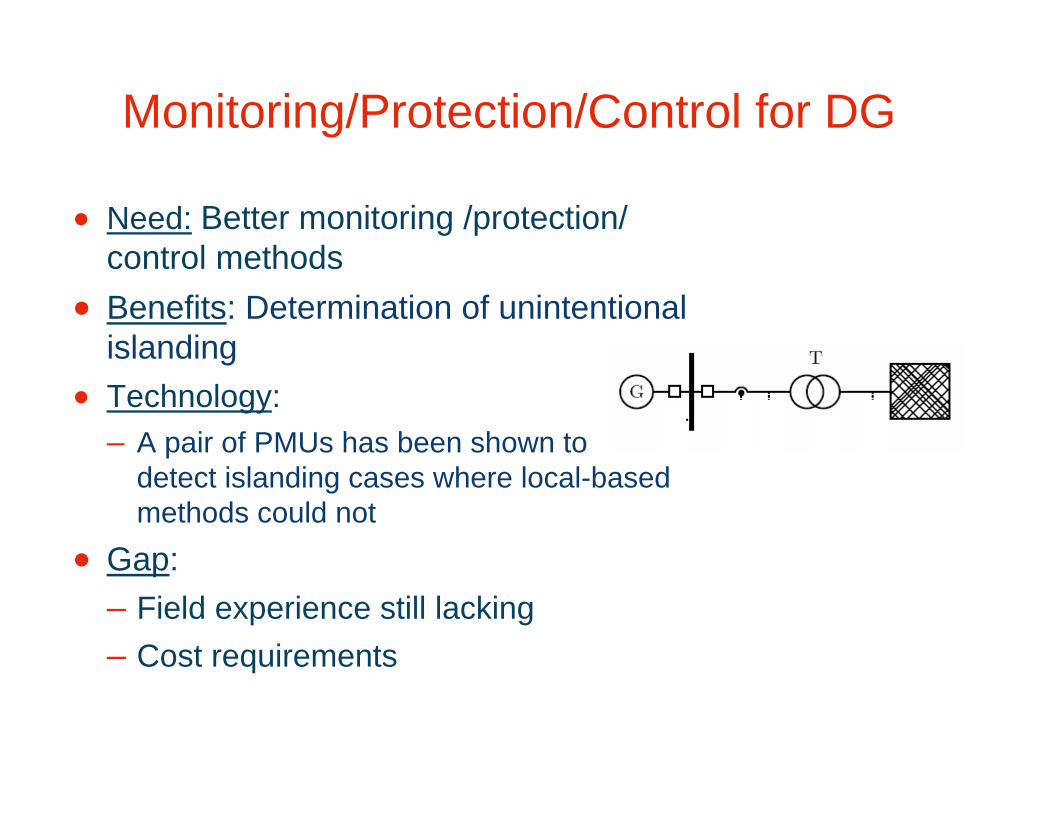
Monitoring/Protection/Control for DG
• Need: Better monitoring /protection/ control methods
• Benefits: Determination of unintentional islanding
• Technology:– A pair of PMUs has been shown to
detect islanding cases where local-based methods could not
• Gap: – Field experience still lacking– Cost requirements
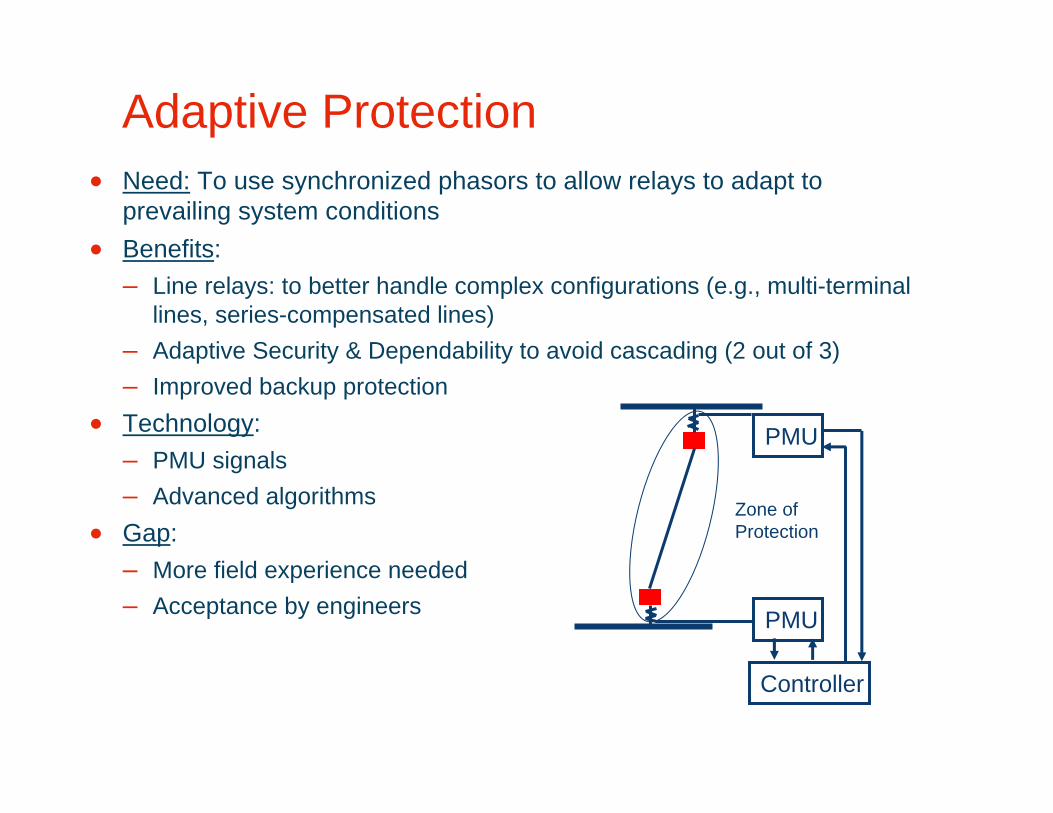
Adaptive Protection• Need: To use synchronized phasors to allow relays to adapt to
prevailing system conditions• Benefits:
– Line relays: to better handle complex configurations (e.g., multi-terminal lines, series-compensated lines)
– Adaptive Security & Dependability to avoid cascading (2 out of 3)– Improved backup protection
• Technology:– PMU signals– Advanced algorithms
• Gap:– More field experience needed– Acceptance by engineers PMU
PMU
Zone ofProtection
Controller
Dynamic Relay Settings• Needs:
– Reduce complexity of implementation, maintenance, testing, and verification of relay settings with multi-function IEDs
– Avoid that equipment protection operates incorrectly under stressed system conditions not set and designed for
• Benefits: Ease of applying and changing settings with IEDs– Automated review and update of relay settings as system
conditions change (e.g. load growth, new equipment installations)
– Dynamic setting adjustments under stressed system conditions (e.g. line overload, voltage and angular instability)
• Technology: – Enterprise level process and tools – WAMS high-resolution “system data” data, detect stressed
conditions and system changes– First level alarm => Second level automated adjustments
• Gap: Industry acceptance

Experience you can trust.June 5 – 7, 2006
Industry Projects and Experience
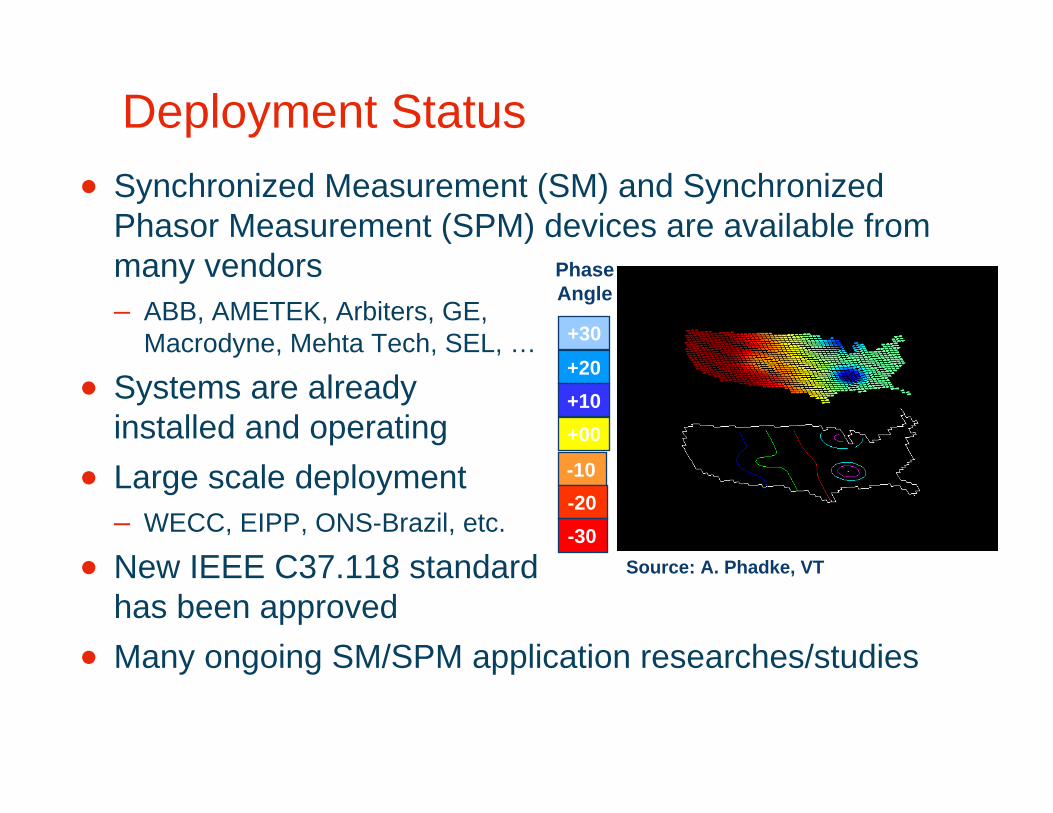
Deployment Status• Synchronized Measurement (SM) and Synchronized
Phasor Measurement (SPM) devices are available from many vendors– ABB, AMETEK, Arbiters, GE,
Macrodyne, Mehta Tech, SEL, …
• Systems are already installed and operating
• Large scale deployment – WECC, EIPP, ONS-Brazil, etc.
• New IEEE C37.118 standard has been approved
• Many ongoing SM/SPM application researches/studies
+30
PhaseAngle
+20+10+00
-10-20-30
Source: A. Phadke, VT
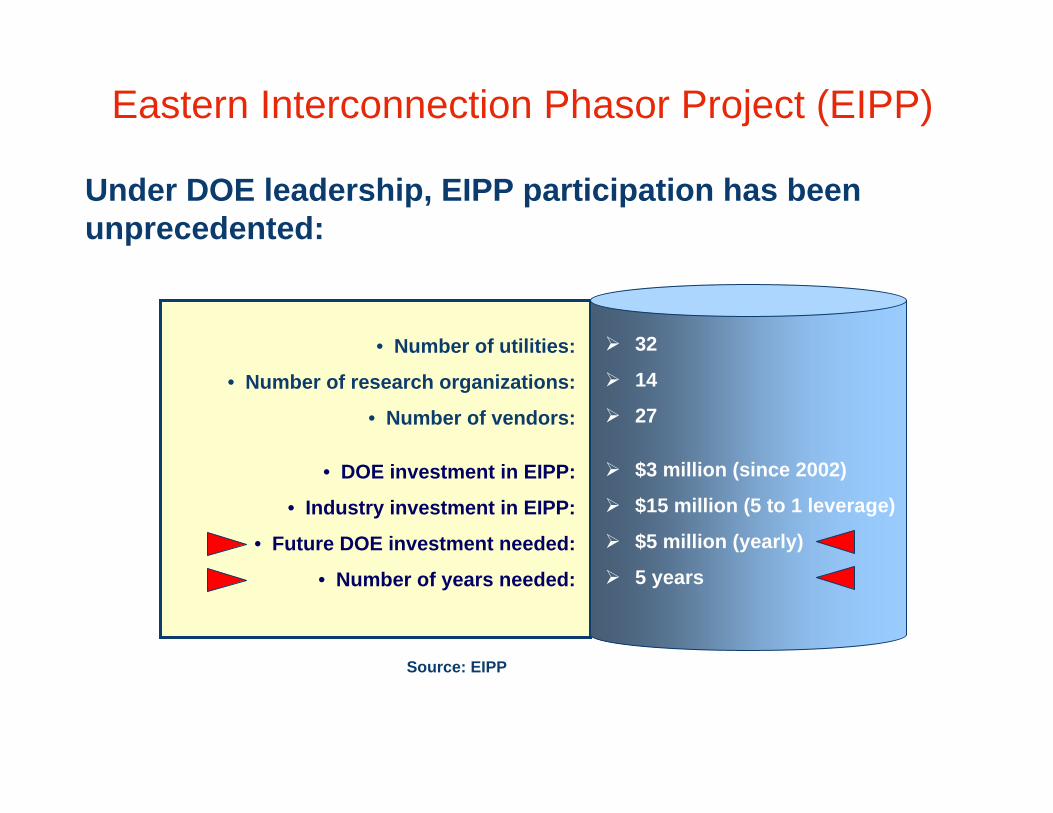
Eastern Interconnection Phasor Project (EIPP)
Under DOE leadership, EIPP participation has been unprecedented:
• Number of utilities:
• Number of research organizations:
• Number of vendors:
• DOE investment in EIPP:
• Industry investment in EIPP:
• Future DOE investment needed:
• Number of years needed:
32
14
27
$3 million (since 2002)
$15 million (5 to 1 leverage)
$5 million (yearly)
5 years
Source: EIPP
34
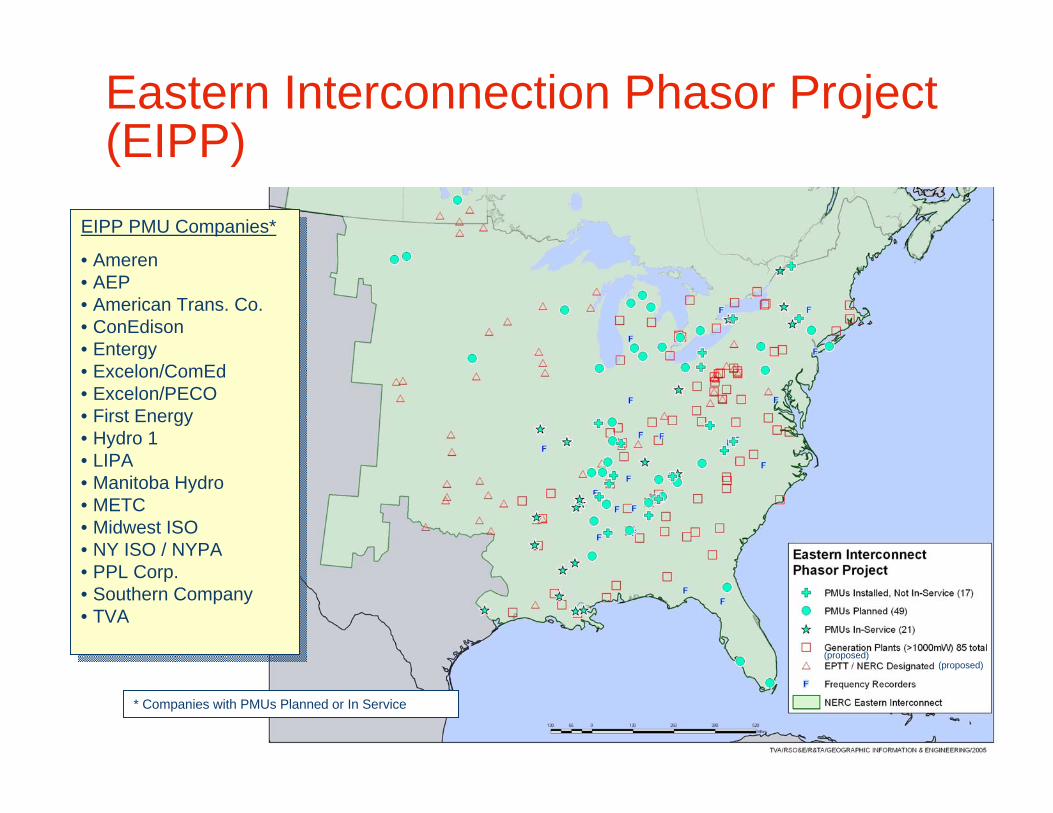
Eastern Interconnection Phasor Project (EIPP)
EIPP PMU Companies*
• Ameren• AEP• American Trans. Co.• ConEdison• Entergy• Excelon/ComEd• Excelon/PECO• First Energy• Hydro 1• LIPA• Manitoba Hydro• METC• Midwest ISO• NY ISO / NYPA• PPL Corp.• Southern Company• TVA
EIPP PMU Companies*
• Ameren• AEP• American Trans. Co.• ConEdison• Entergy• Excelon/ComEd• Excelon/PECO• First Energy• Hydro 1• LIPA• Manitoba Hydro• METC• Midwest ISO• NY ISO / NYPA• PPL Corp.• Southern Company• TVA
* Companies with PMUs Planned or In Service
(proposed)(proposed)
35
PMUs offer Wide-Area Visibility
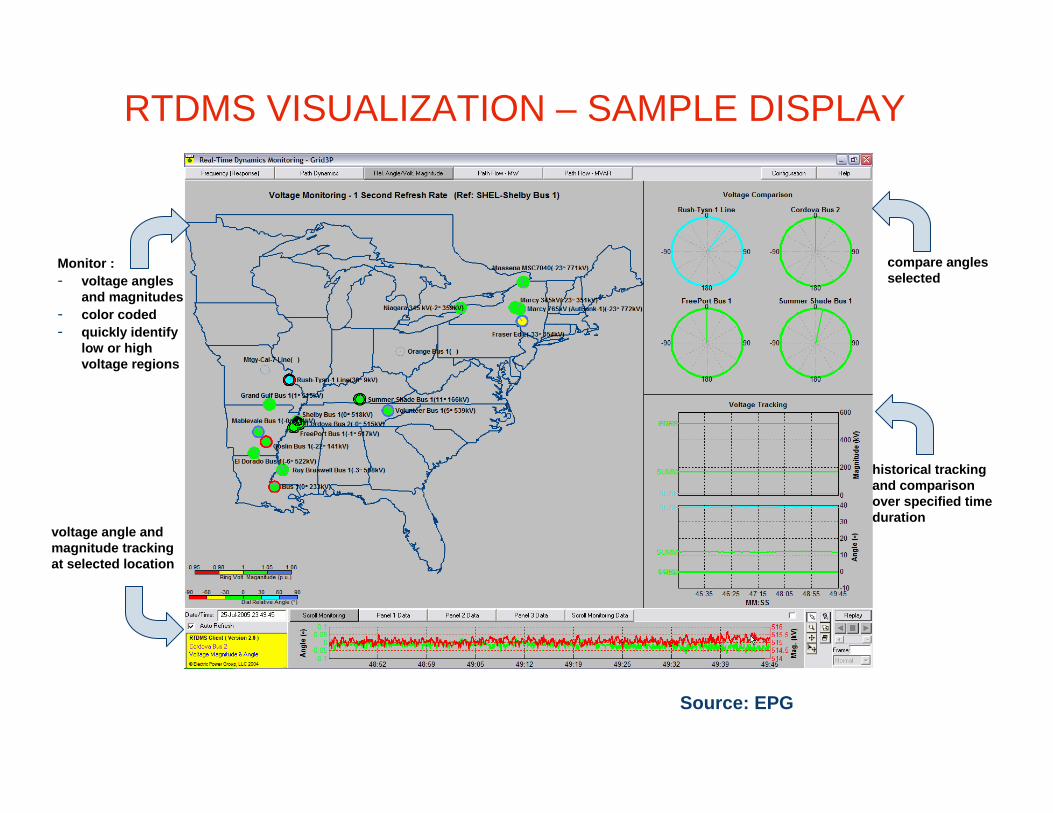
RTDMS VISUALIZATION – SAMPLE DISPLAY
Monitor : - voltage angles
and magnitudes- color coded- quickly identify
low or high voltage regions
voltage angle and magnitude tracking at selected location
compare angles selected
historical tracking and comparison over specified time duration
Source: EPG
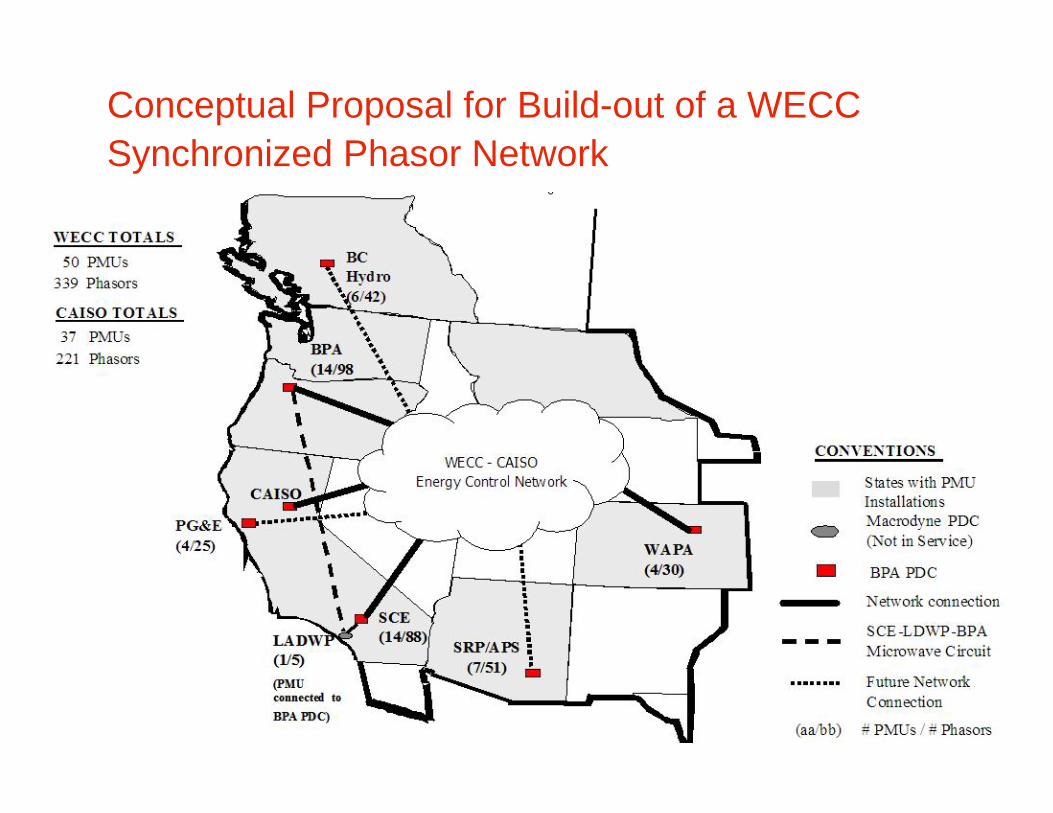
Conceptual Proposal for Build-out of a WECC Synchronized Phasor Network
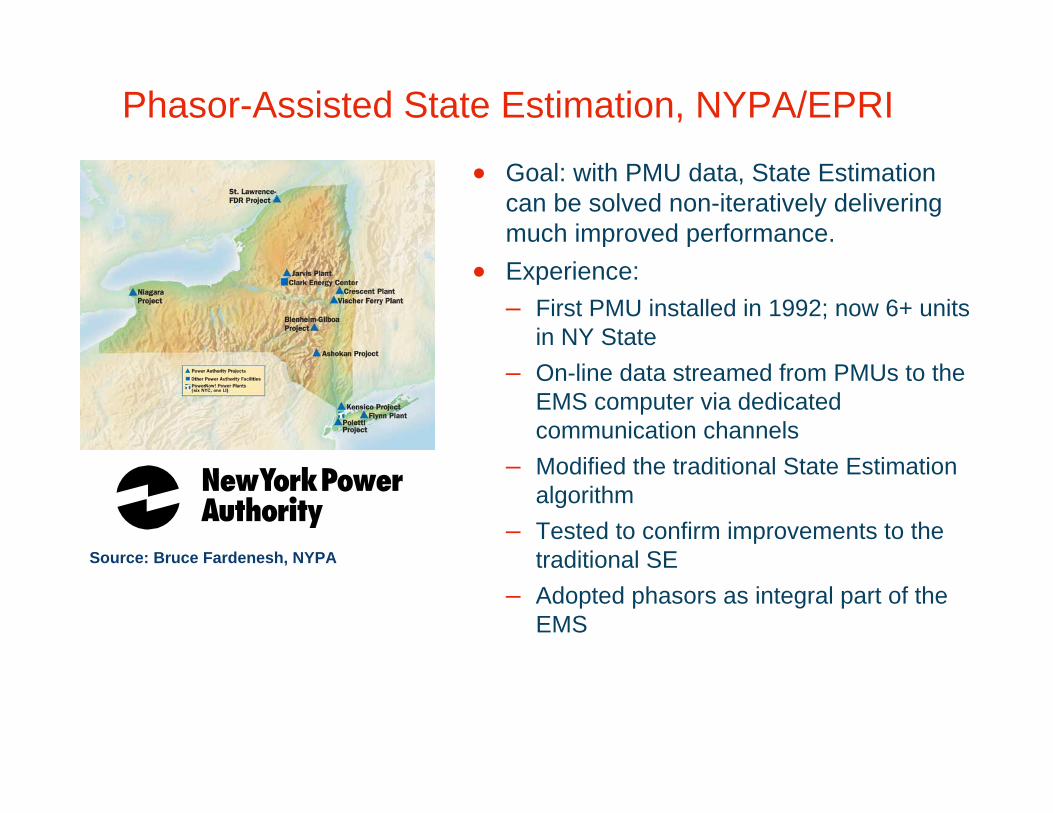
Phasor-Assisted State Estimation, NYPA/EPRI
• Goal: with PMU data, State Estimation can be solved non-iteratively delivering much improved performance.
• Experience:– First PMU installed in 1992; now 6+ units
in NY State– On-line data streamed from PMUs to the
EMS computer via dedicated communication channels
– Modified the traditional State Estimation algorithm
– Tested to confirm improvements to the traditional SE
– Adopted phasors as integral part of the EMS
Source: Bruce Fardenesh, NYPA
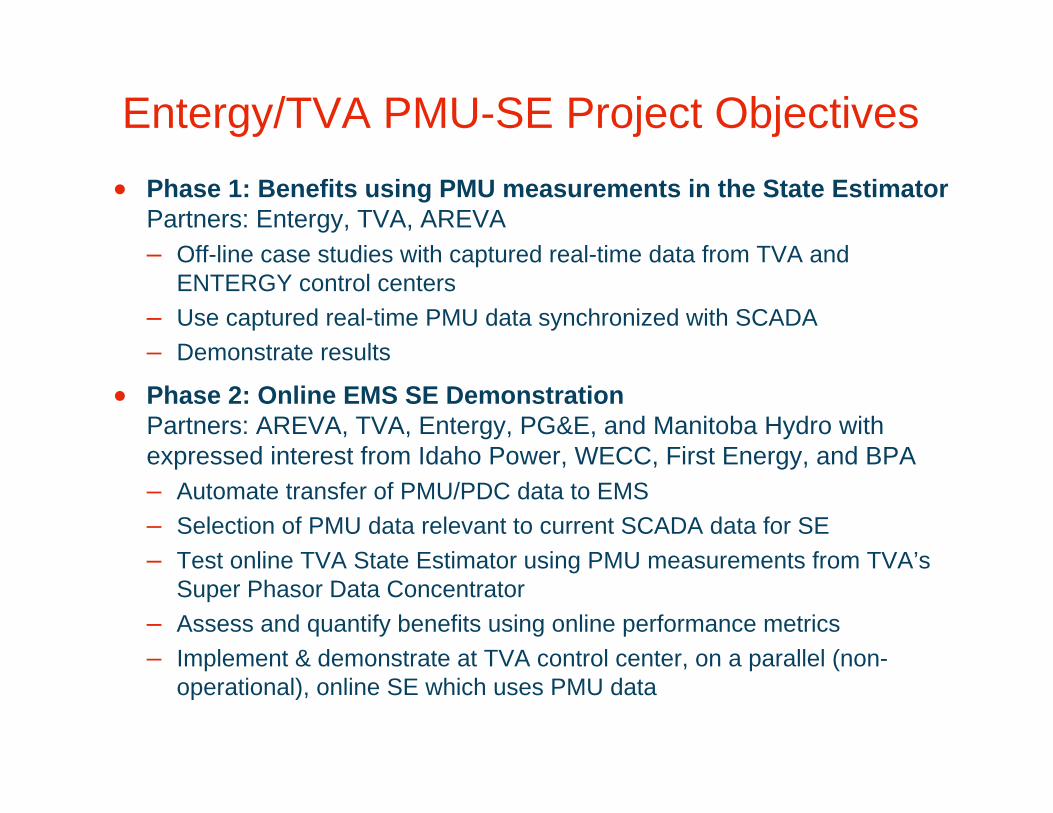
Entergy/TVA PMU-SE Project Objectives• Phase 1: Benefits using PMU measurements in the State Estimator
Partners: Entergy, TVA, AREVA– Off-line case studies with captured real-time data from TVA and
ENTERGY control centers– Use captured real-time PMU data synchronized with SCADA– Demonstrate results
• Phase 2: Online EMS SE DemonstrationPartners: AREVA, TVA, Entergy, PG&E, and Manitoba Hydro with expressed interest from Idaho Power, WECC, First Energy, and BPA– Automate transfer of PMU/PDC data to EMS – Selection of PMU data relevant to current SCADA data for SE– Test online TVA State Estimator using PMU measurements from TVA’s
Super Phasor Data Concentrator– Assess and quantify benefits using online performance metrics– Implement & demonstrate at TVA control center, on a parallel (non-
operational), online SE which uses PMU data
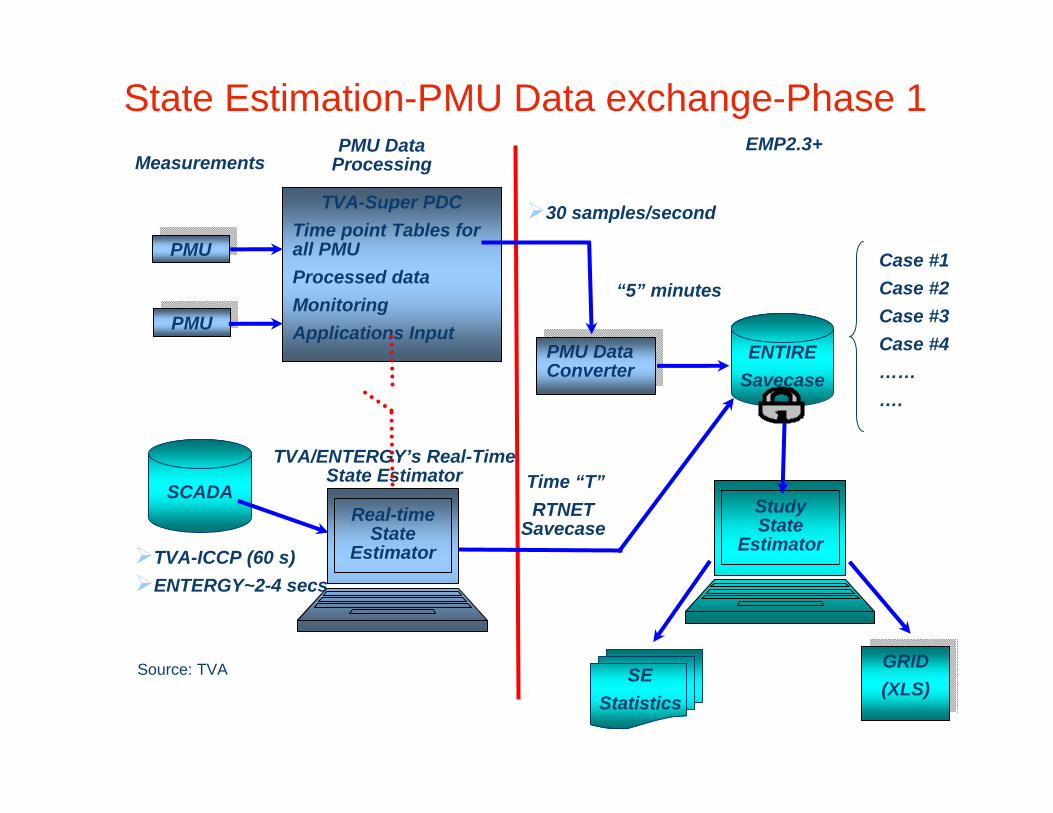
State Estimation-PMU Data exchange-Phase 1Measurements
EMP2.3+
PMUPMU
TVA-Super PDCTime point Tables for all PMU Processed dataMonitoringApplications Input
PMUPMUPMU Data ConverterPMU Data
Converter
PMU Data Processing
Time “T”RTNET
Savecase
TVA/ENTERGY’s Real-Time State Estimator
ENTIRESavecase
SEStatistics
Study State
EstimatorReal-time
State Estimator
GRID(XLS)
GRID(XLS)
“5” minutesCase #1Case #2Case #3Case #4……….
SCADA
TVA-ICCP (60 s)ENTERGY~2-4 secs
30 samples/second
Source: TVA
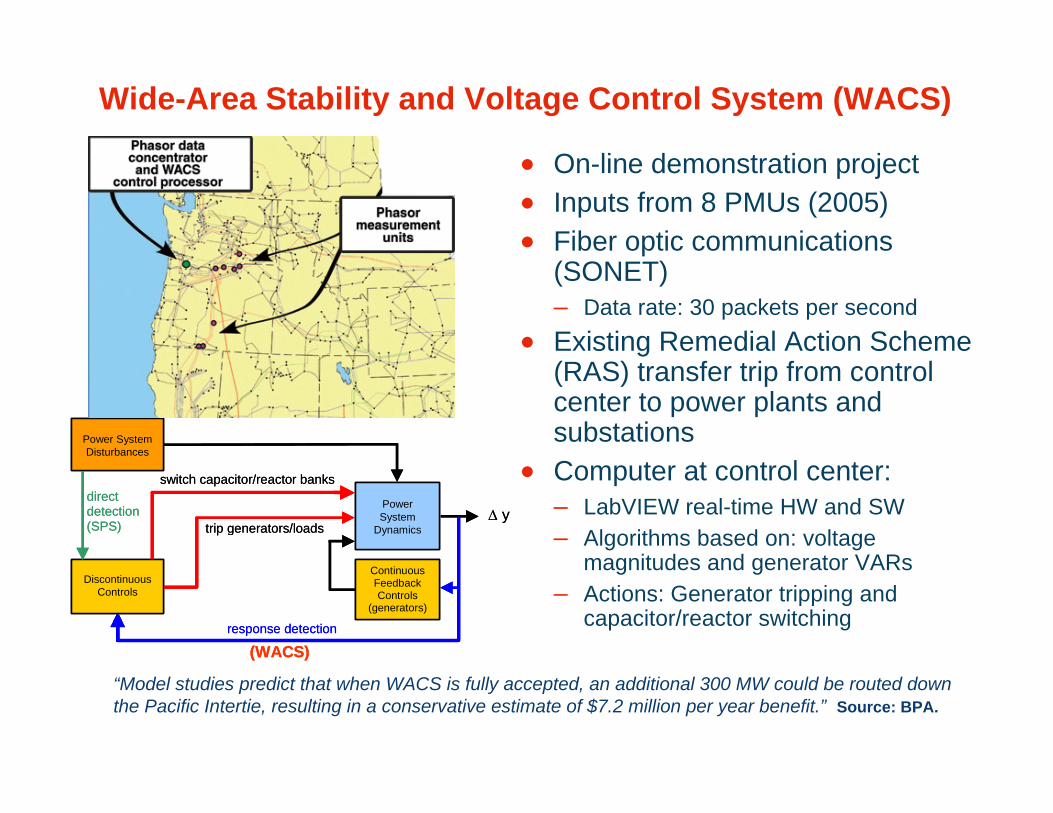
Wide-Area Stability and Voltage Control System (WACS)
• On-line demonstration project• Inputs from 8 PMUs (2005)• Fiber optic communications
(SONET)– Data rate: 30 packets per second
• Existing Remedial Action Scheme (RAS) transfer trip from control center to power plants and substations
• Computer at control center:– LabVIEW real-time HW and SW– Algorithms based on: voltage
magnitudes and generator VARs– Actions: Generator tripping and
capacitor/reactor switching
∆ y
response detection
switch capacitor/reactor banks direct detection (SPS) trip generators/loads
Power System Disturbances
Discontinuous Controls
Power System
Dynamics
ContinuousFeedback Controls
(generators)
(WACS)
∆ y
response detection
switch capacitor/reactor banks direct detection (SPS) trip generators/loads
Power System Disturbances
Discontinuous Controls
Power System
Dynamics
ContinuousFeedback Controls
(generators)
(WACS)
“Model studies predict that when WACS is fully accepted, an additional 300 MW could be routed down the Pacific Intertie, resulting in a conservative estimate of $7.2 million per year benefit.” Source: BPA.
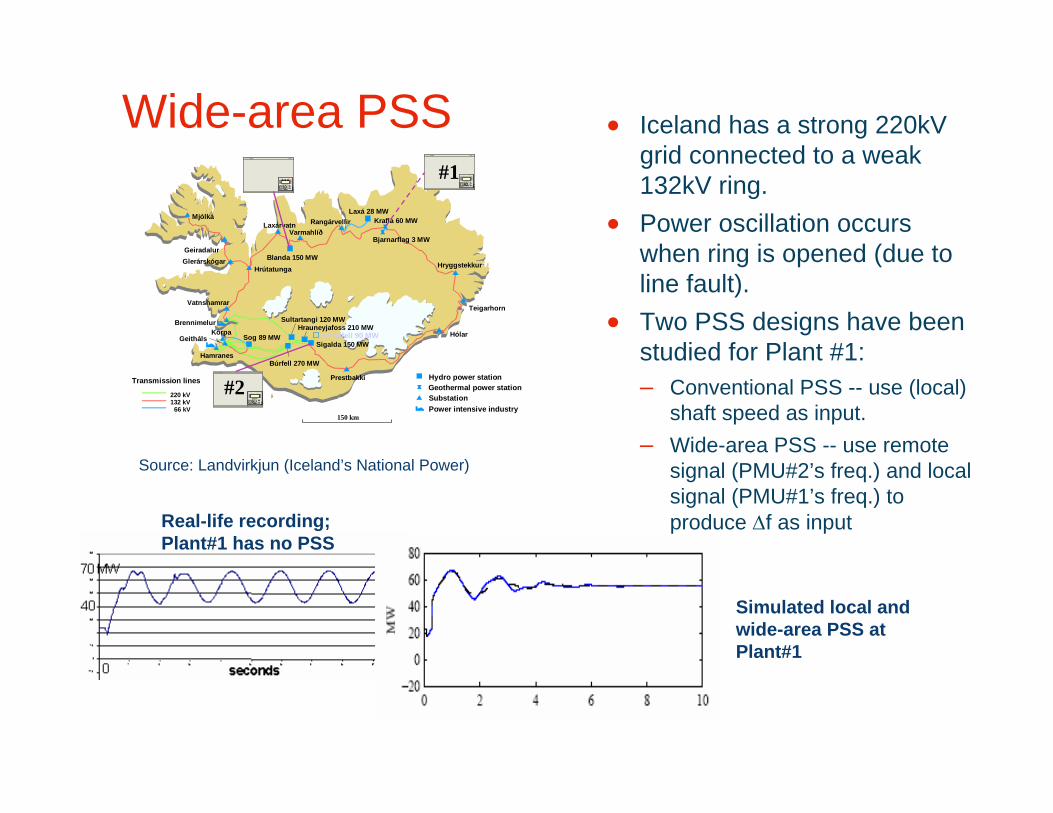
Wide-area PSS • Iceland has a strong 220kV grid connected to a weak 132kV ring.
• Power oscillation occurs when ring is opened (due to line fault).
• Two PSS designs have been studied for Plant #1:– Conventional PSS -- use (local)
shaft speed as input.– Wide-area PSS -- use remote
signal (PMU#2’s freq.) and local signal (PMU#1’s freq.) to produce ∆f as input
Hryggstekkur
Laxá 28 MW
Sog 89 MW
Hamranes
Blanda 150 MW
BrennimelurKorpa
Geitháls
Hrútatunga
VarmahlíðRangárvellir
Prestbakki
Hólar
Mjólká
GeiradalurGlerárskógar
Sigalda 150 MW
Búrfell 270 MW
Transmission lines
220 kV132 kV
66 kV
VatnshamrarTeigarhorn
Hydro power station
SubstationGeothermal power station
Power intensive industry
Vatnsfell 90 MW
Bjarnarflag 3 MW
Laxárvatn Krafla 60 MW
Sultartangi 120 MWHrauneyjafoss 210 MW
150 km
EC
EC
EC
#2
#1
Source: Landvirkjun (Iceland’s National Power)
Real-life recording; Plant#1 has no PSS
Simulated local and wide-area PSS at Plant#1
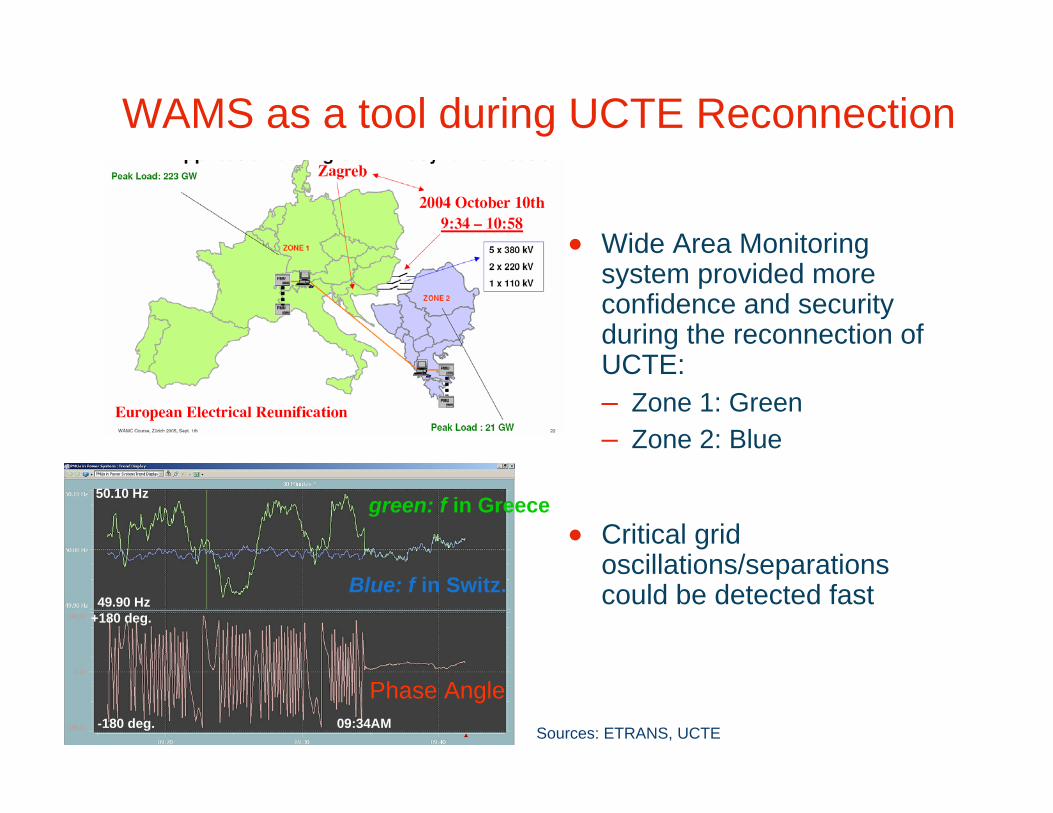
WAMS as a tool during UCTE Reconnection
• Wide Area Monitoring system provided more confidence and security during the reconnection of UCTE:– Zone 1: Green– Zone 2: Blue
• Critical grid oscillations/separations could be detected fast
green: f in Greece
Blue: f in Switz.
Phase Angle
49.90 Hz
50.10 Hz
-180 deg.
+180 deg.
09:34AMSources: ETRANS, UCTE
2,03
0 m
i.
1,800 mi.
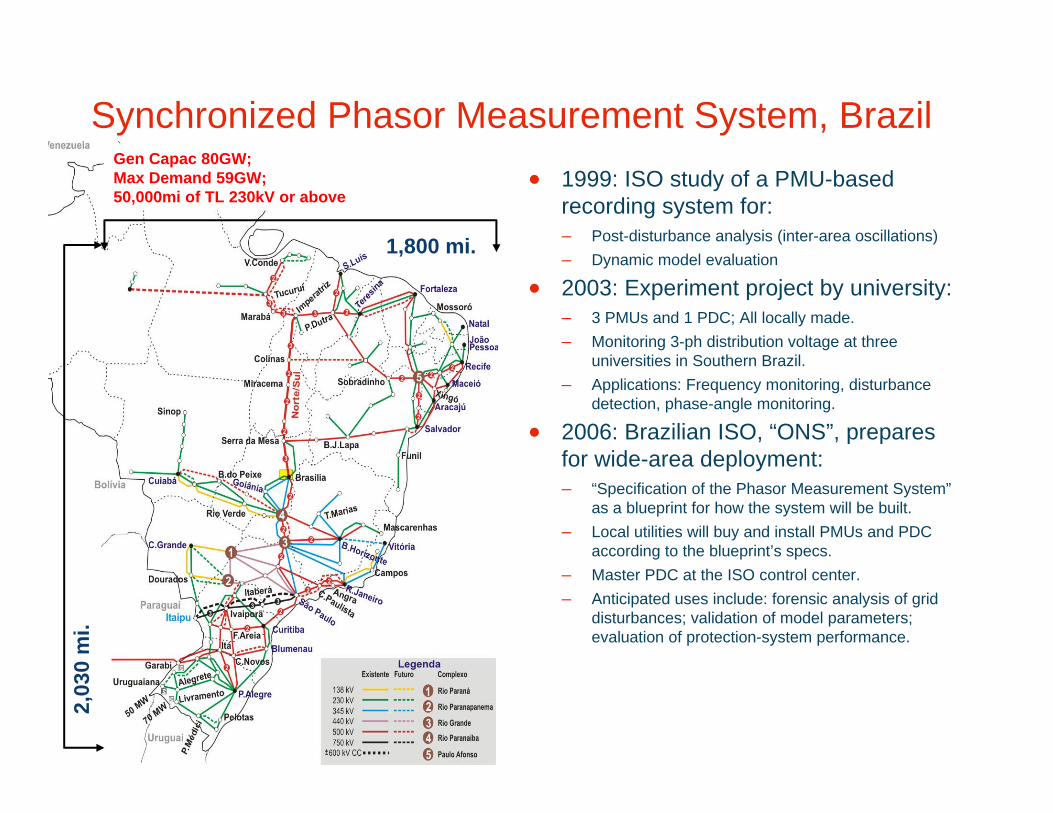
Synchronized Phasor Measurement System, Brazil• 1999: ISO study of a PMU-based
recording system for:– Post-disturbance analysis (inter-area oscillations)– Dynamic model evaluation
• 2003: Experiment project by university:– 3 PMUs and 1 PDC; All locally made.– Monitoring 3-ph distribution voltage at three
universities in Southern Brazil.– Applications: Frequency monitoring, disturbance
detection, phase-angle monitoring.
• 2006: Brazilian ISO, “ONS”, prepares for wide-area deployment: – “Specification of the Phasor Measurement System”
as a blueprint for how the system will be built.– Local utilities will buy and install PMUs and PDC
according to the blueprint’s specs.– Master PDC at the ISO control center.– Anticipated uses include: forensic analysis of grid
disturbances; validation of model parameters; evaluation of protection-system performance.
Gen Capac 80GW;Max Demand 59GW;50,000mi of TL 230kV or above
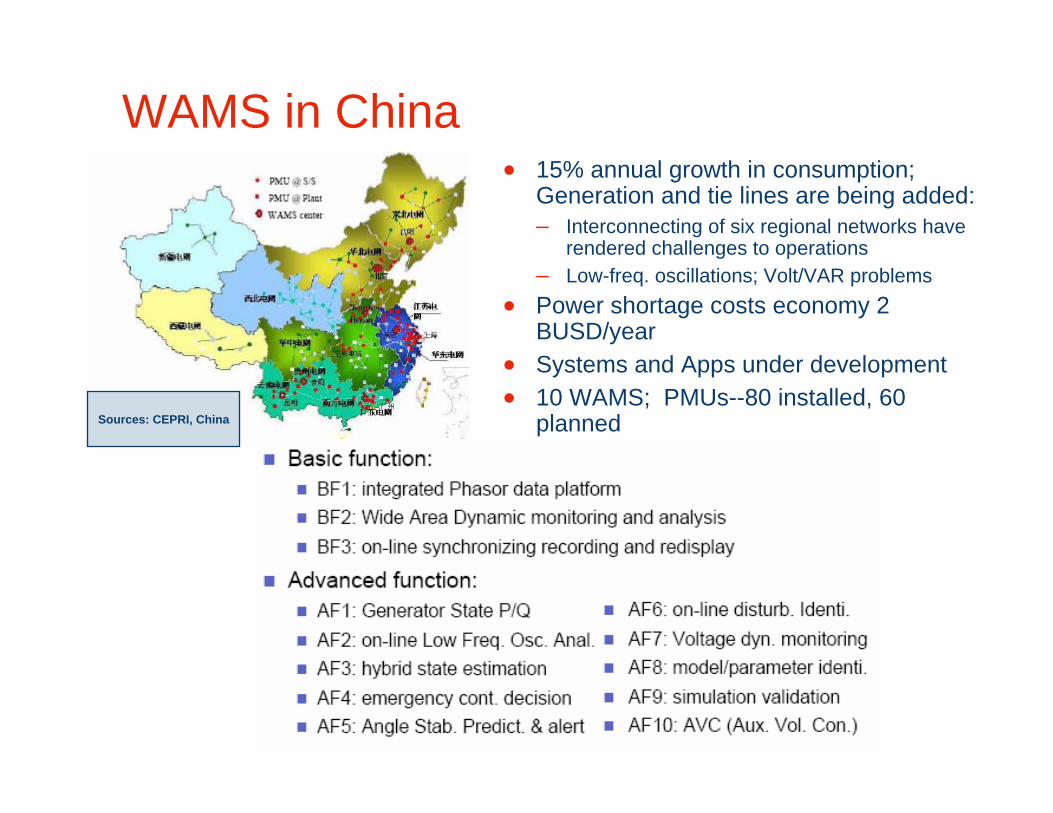
WAMS in China
Sources: CEPRI, China
• 15% annual growth in consumption; Generation and tie lines are being added:– Interconnecting of six regional networks have
rendered challenges to operations– Low-freq. oscillations; Volt/VAR problems
• Power shortage costs economy 2 BUSD/year
• Systems and Apps under development • 10 WAMS; PMUs--80 installed, 60
planned

Experience you can trust.June 5 – 7, 2006
System Architecture
Architecture Today• Most installations consist of one-PDC architecture
with a limited number of PMUs
• WECC and EIPP systems
– Multiple PDCs with a master data concentrator
• The master data concentrator
– Aggregate real-time PMU data and rebroadcast to other PDCs
– Provide online/archived data for non-real-time applications
– Custom developed
– Evolved from interconnecting single-PDC based systems of the participating utilities
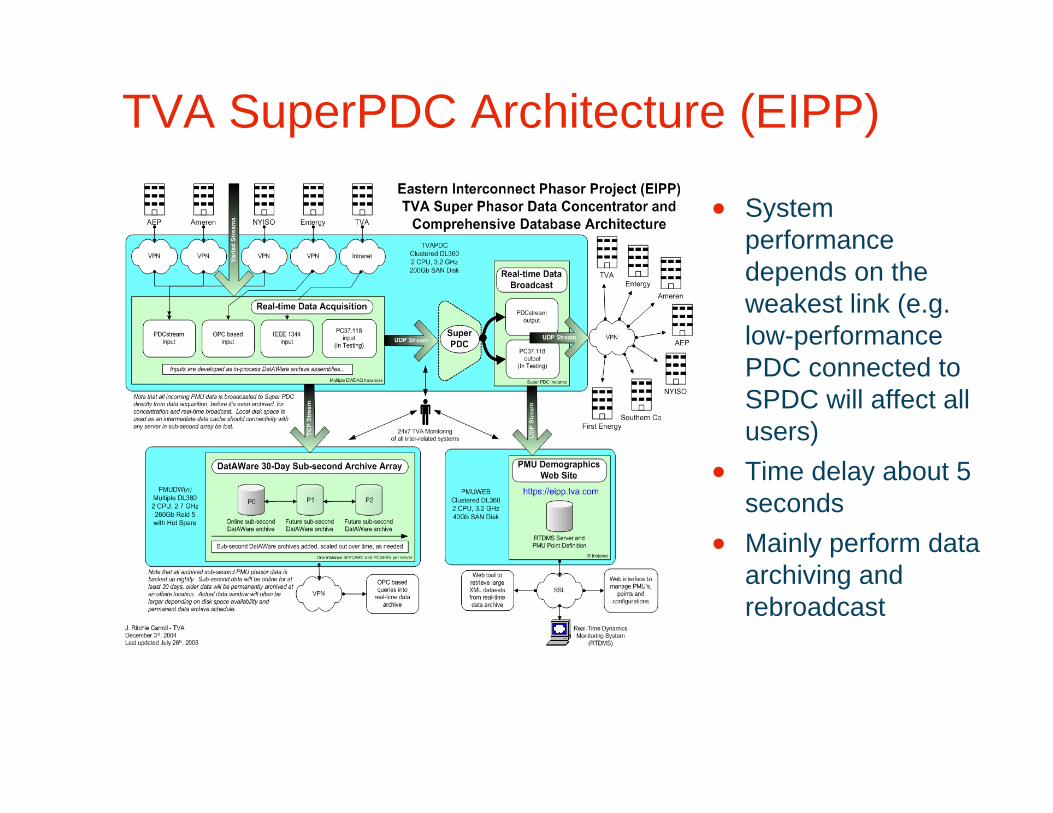
TVA SuperPDC Architecture (EIPP)
• System performance depends on the weakest link (e.g. low-performance PDC connected to SPDC will affect all users)
• Time delay about 5 seconds
• Mainly perform data archiving and rebroadcast
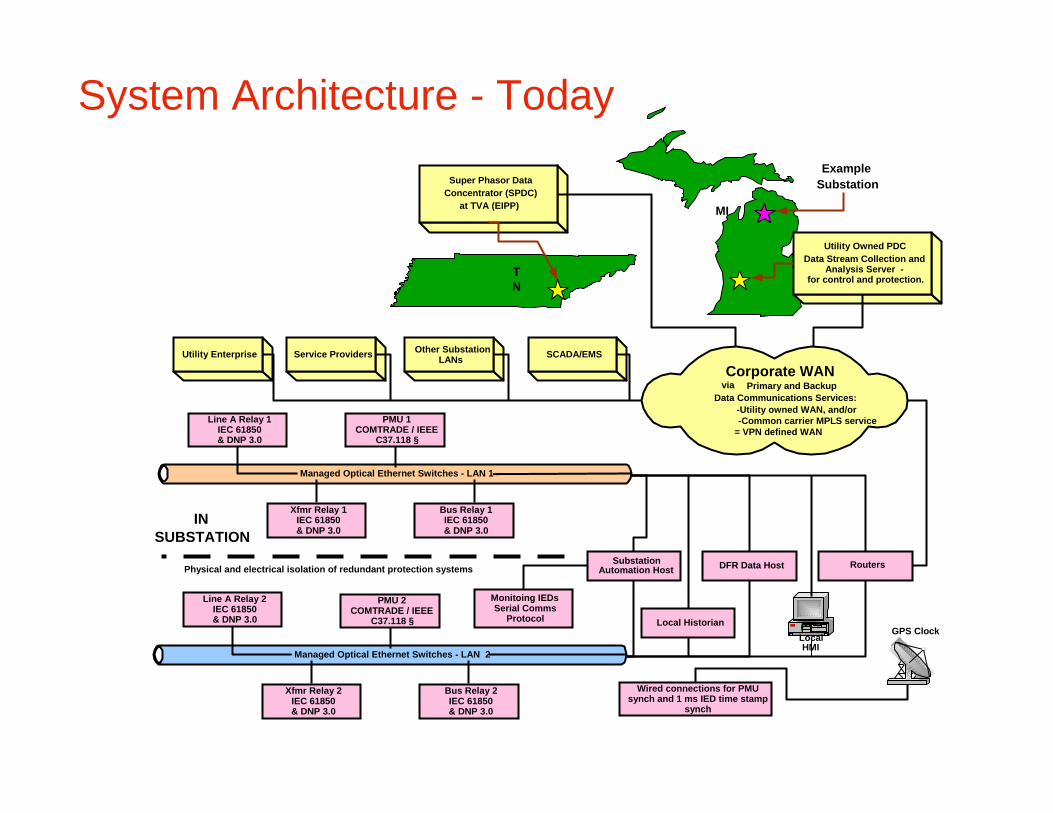
MI
TN
Managed Optical Ethernet Switches - LAN 1
Managed Optical Ethernet Switches - LAN 2
Line A Relay 2IEC 61850& DNP 3.0
LocalHMI
GPS Clock
RoutersPhysical and electrical isolation of redundant protection systems
Line A Relay 1IEC 61850& DNP 3.0
Xfmr Relay 2IEC 61850& DNP 3.0
Xfmr Relay 1IEC 61850& DNP 3.0
Bus Relay 2IEC 61850& DNP 3.0
Bus Relay 1IEC 61850& DNP 3.0
PMU 1COMTRADE / IEEE
C37.118 §
PMU 2COMTRADE / IEEE
C37.118 §
SubstationAutomation Host
Local Historian
DFR Data Host
SCADA/EMS
Corporate WANvia Primary and Backup
Data Communications Services:-Utility owned WAN, and/or-Common carrier MPLS service
= VPN defined WAN
Other SubstationLANsUtility Enterprise Service Providers
Monitoing IEDsSerial Comms
Protocol
Wired connections for PMUsynch and 1 ms IED time stamp
synch
Super Phasor DataConcentrator (SPDC)
at TVA (EIPP)
Utility Owned PDCData Stream Collection and
Analysis Server -for control and protection.
INSUBSTATION
ExampleSubstation
System Architecture - Today
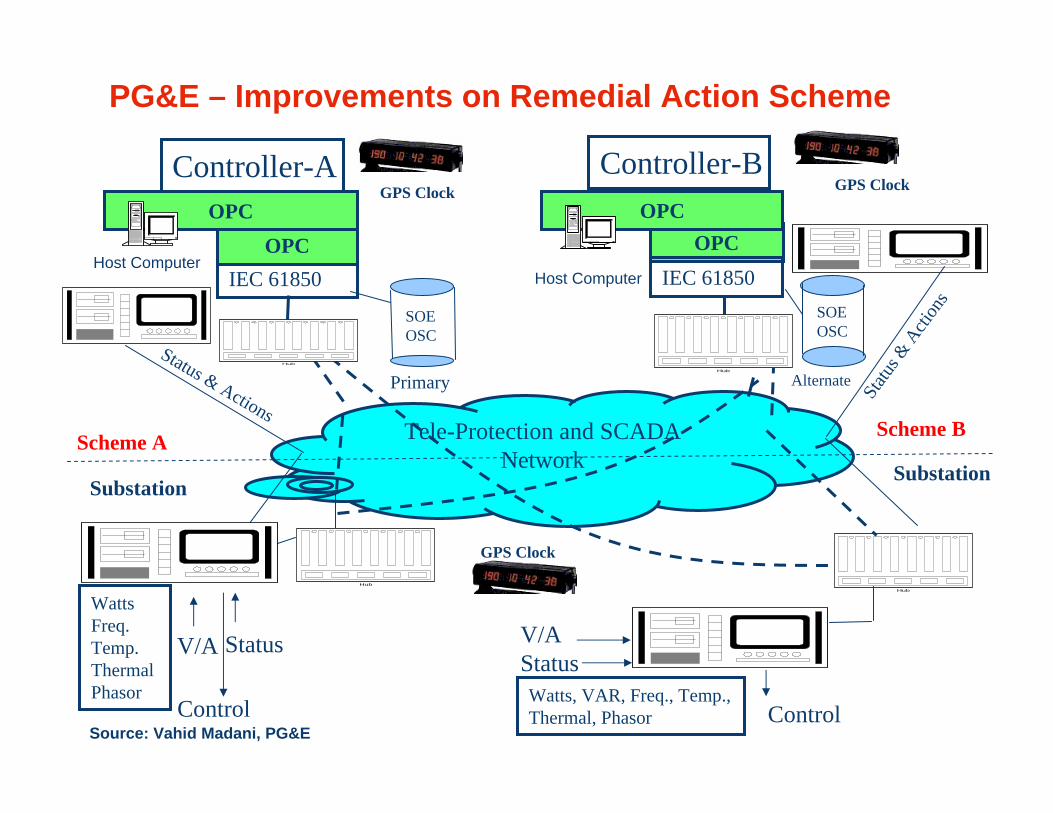
Tele-Protection and SCADANetwork
Controller-A
V/A Status
Control
IEC 61850OPC
OPC
Controller-B
OPCOPC
SOEOSC
IEC 61850SOEOSC
AlternatePrimary
Host ComputerHost Computer
Hub
Hub
Hub
Hub
WattsFreq.Temp.Thermal Phasor
GPS Clock
Statu
s & A
ction
s
Status & Actions
Watts, VAR, Freq., Temp., Thermal, Phasor
V/AStatus
Control
GPS Clock
SubstationScheme A Scheme B
PG&E – Improvements on Remedial Action Scheme
Substation
GPS Clock
Source: Vahid Madani, PG&E
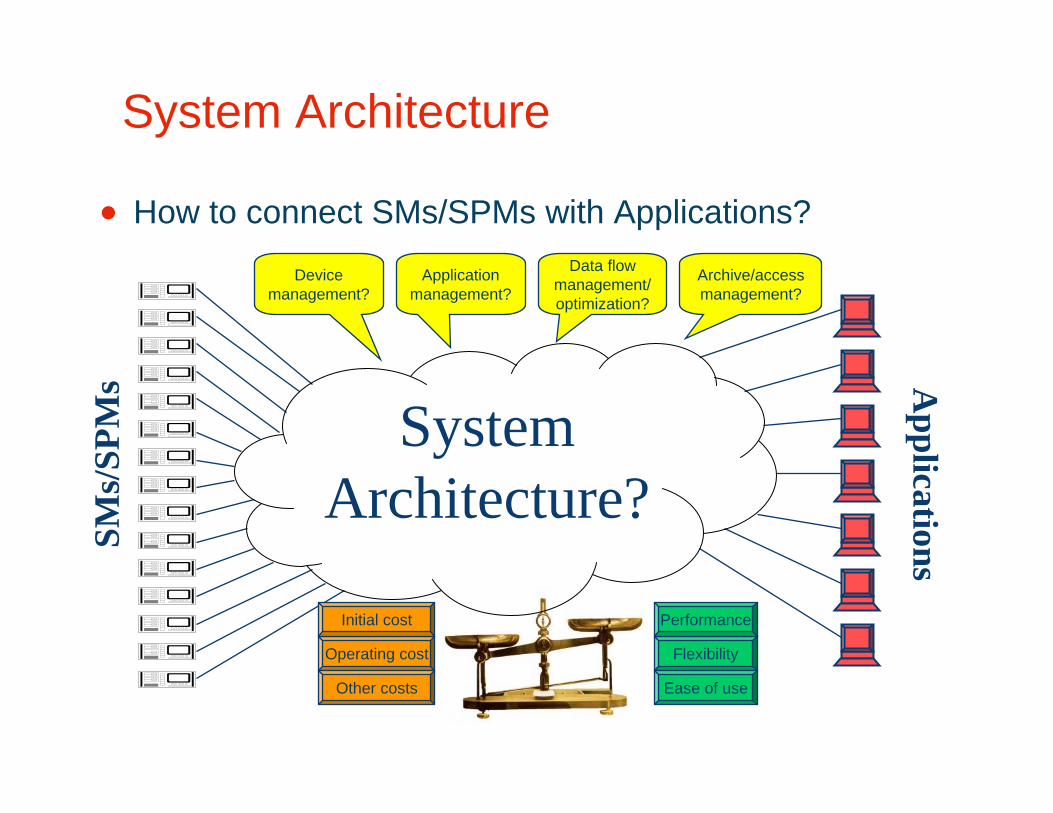
System Architecture
• How to connect SMs/SPMs with Applications?
SMs/
SPM
s Applications
Data flow management/ optimization?
Device management?
Application management?
Archive/access management?
Flexibility
Ease of use
Performance
System Architecture?
Operating cost
Other costs
Initial cost
PDC Status• Lack of mature off-the-shelf PDCs
– Custom developed PDCs– Vendor PDCs: Not fully productized
• Limitations unknown• Interoperability with other PMUs/PDCs
• Limits of a master PDC – max. number of PMU/PDC data streams that it can process?– Varies depending on types of PDC, and Data volume (# of
phasors/data and data rate) and Processing tasks• Pros/cons of using intermediate PDCs
– Data flow, latency, bandwidth, configuration, etc.

Need for New Architecture• Standardized system architecture design
– Meet the diverse requirements of different applications– Enable data sharing minimize overall cost– Use off-the-shelf products (e.g. process automation)– Be supported by available communication infrastructure
• Bandwidth, protocol, latency
– Can be easily integrated and configured• Highly scalable and flexible• Reliable and secure• Easy to install, operate, and maintain• Easy to interface with other systems

Experience you can trust.June 5 – 7, 2006
Challenges
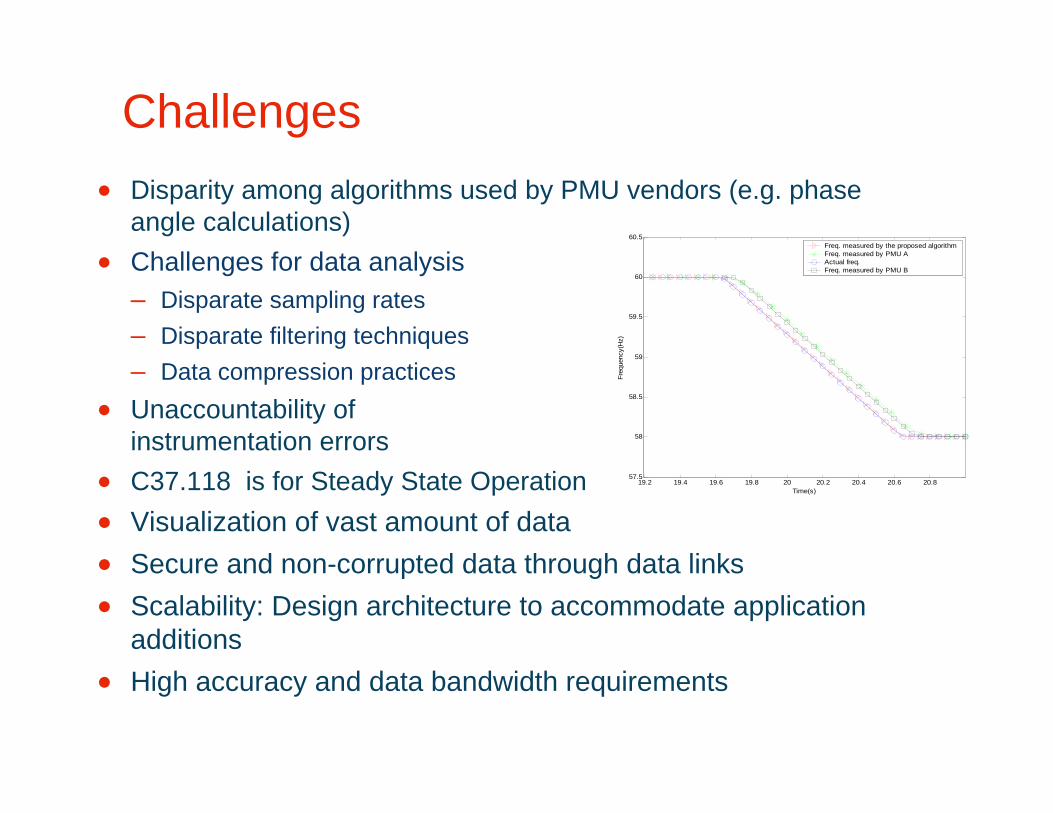
Challenges• Disparity among algorithms used by PMU vendors (e.g. phase
angle calculations) • Challenges for data analysis
– Disparate sampling rates– Disparate filtering techniques– Data compression practices
• Unaccountability of instrumentation errors
• C37.118 is for Steady State Operation• Visualization of vast amount of data• Secure and non-corrupted data through data links• Scalability: Design architecture to accommodate application
additions• High accuracy and data bandwidth requirements
19.2 19.4 19.6 19.8 20 20.2 20.4 20.6 20.857.5
58
58.5
59
59.5
60
60.5
Time(s)
Freq
uenc
y(H
z)
Freq. measured by the proposed algorithmFreq. measured by PMU AActual freq.Freq. measured by PMU B
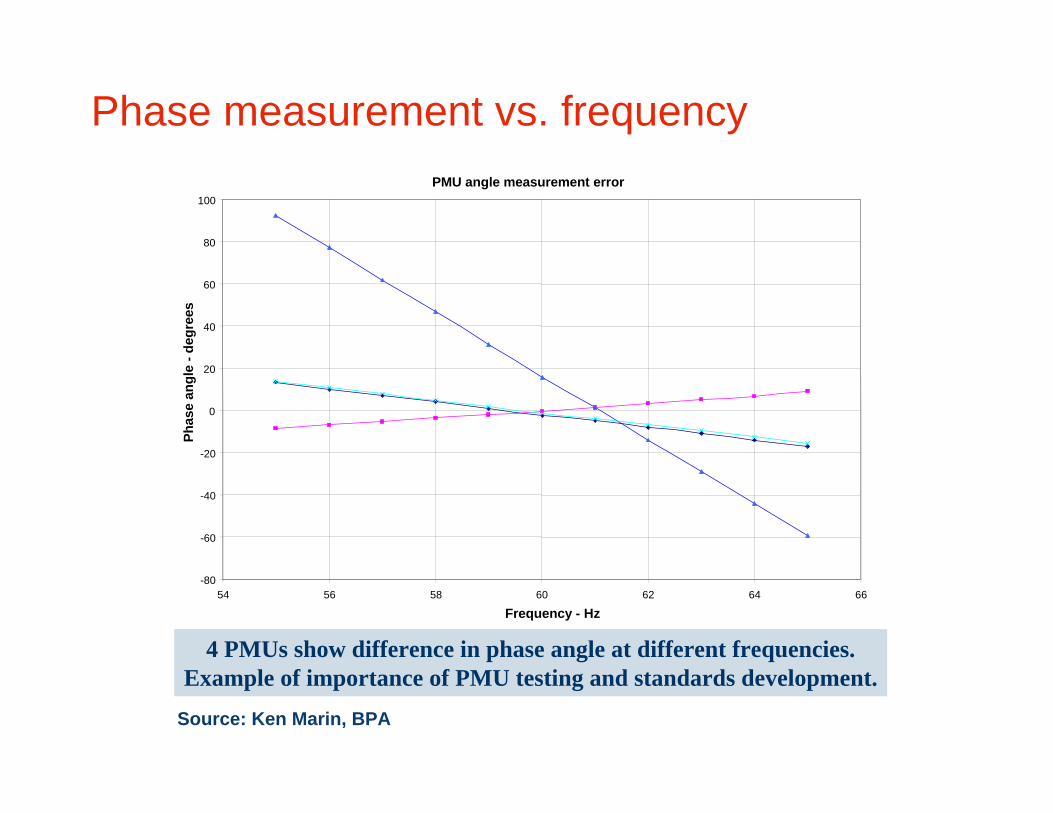
Phase measurement vs. frequency
4 PMUs show difference in phase angle at different frequencies.Example of importance of PMU testing and standards development.
PMU angle measurement error
-80
-60
-40
-20
0
20
40
60
80
100
54 56 58 60 62 64 66
Frequency - Hz
Phas
e an
gle
-deg
rees
Source: Ken Marin, BPA

Transducer Accuracy - ANSI
120.260.003100%
240.520.00610%Metering 0.3
240.520.006100%
481.040.01210%Metering 0.6
481.040.012100%
962.080.02410%Metering 1.2
Not testedNot tested0.1010 to 2000%Relaying
Max. PhaseError (µs)
Max. PhaseError (degrees)
Max. MagnitudeError pu
LoadCurrent
ANSI CTType
240.520.003Metering 0.3
481.040.006Metering 0.6
962.080.012Metering 1.2
Not testedNot tested0.1Relaying
Max. Phase Error (± µs)
Max. Phase Error(± degrees)
Max. Magnitude ±Error P.U.
ANSI PT TYPE
* T.K. Hamrita, B.S. Heck, and A. P. S. Meliopoulos; "On-Line Correction of Errors Introduced by Instrument Transformers in Transmission-Level Steady-State Waveform Measurements", IEEE Trans. on PWDR, Oct. 2000.
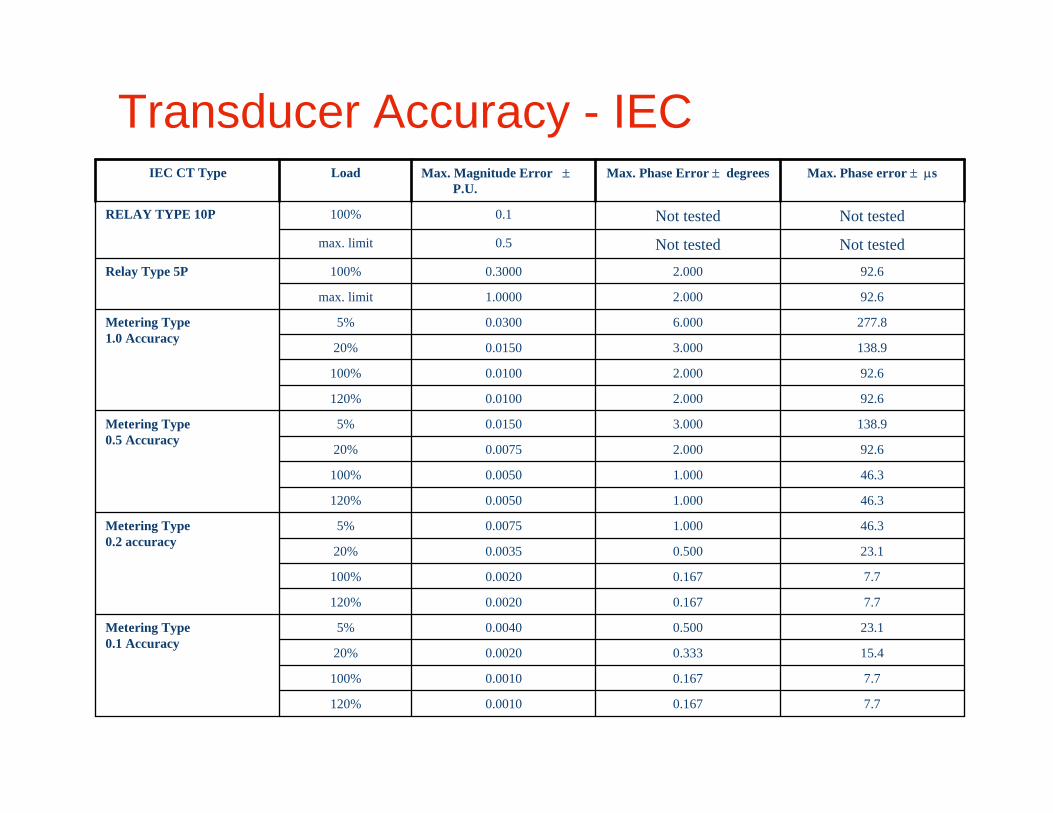
7.70.1670.0010120%
7.70.1670.0010100%
15.40.3330.002020%
23.10.5000.00405%Metering Type0.1 Accuracy
7.70.1670.0020120%
7.70.1670.0020100%
23.10.5000.003520%
46.31.0000.00755%Metering Type0.2 accuracy
46.31.0000.0050120%
46.31.0000.0050100%
92.62.0000.007520%
138.93.0000.01505%Metering Type0.5 Accuracy
92.62.0000.0100120%
92.62.0000.0100100%
138.93.0000.015020%
277.86.0000.03005%Metering Type1.0 Accuracy
92.62.0001.0000max. limit
92.62.0000.3000100%Relay Type 5P
Not testedNot tested0.5max. limit
Not testedNot tested0.1100%RELAY TYPE 10P
Max. Phase error ± µsMax. Phase Error ± degreesMax. Magnitude Error ±P.U.
LoadIEC CT Type
Transducer Accuracy - IEC
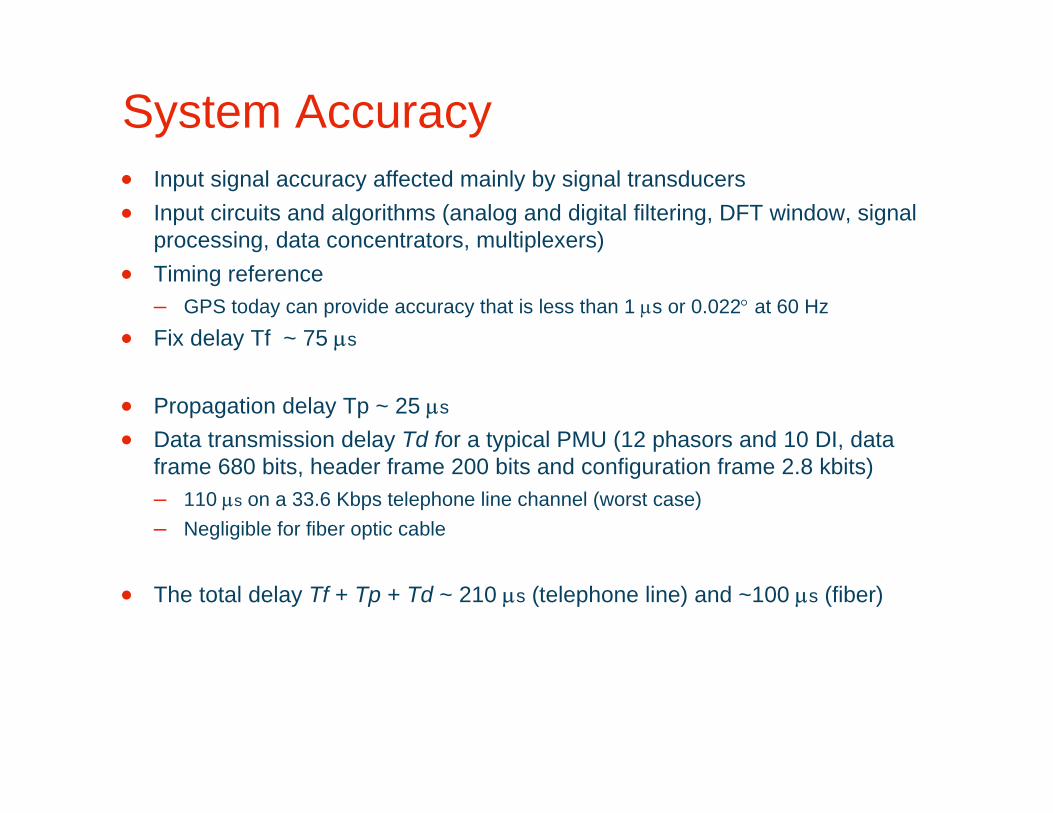
System Accuracy• Input signal accuracy affected mainly by signal transducers• Input circuits and algorithms (analog and digital filtering, DFT window, signal
processing, data concentrators, multiplexers)• Timing reference
– GPS today can provide accuracy that is less than 1 µs or 0.022° at 60 Hz• Fix delay Tf ~ 75 µs
• Propagation delay Tp ~ 25 µs
• Data transmission delay Td for a typical PMU (12 phasors and 10 DI, data frame 680 bits, header frame 200 bits and configuration frame 2.8 kbits)– 110 µs on a 33.6 Kbps telephone line channel (worst case)– Negligible for fiber optic cable
• The total delay Tf + Tp + Td ~ 210 µs (telephone line) and ~100 µs (fiber)

Experience you can trust.June 5 – 7, 2006
Standardization, Tests, and Certification- IEEE Std 1344-1995 (R2001)- IEEE Standard C37.118-2005- EIPP/PRTT activities
How to exchange PMU data?• PMU configuration information
– Data format definition– Static after setup
• Synchrophasor data– Real-time data stream
• Reporting rate
– Format• Fixed or floating point• Polar or rectangular
IEEE Std 1344-1995 (R2001)
• IEEE Standard for Synchrophasors for Power System– Approved December 1995 and reaffirmed 2001 (no change)
• Main achievement– Defined a consistent and accurate time-tagging method– Allowed the use of both synchronized and non-synchronized
sampling– Not locked at the nominal frequency but follows the frequency
of the signal (steady-state)– Defined angle convention independent of window size– Required the correction of internal phase angle delays
IEEE Std 1344-1995 (R2001)
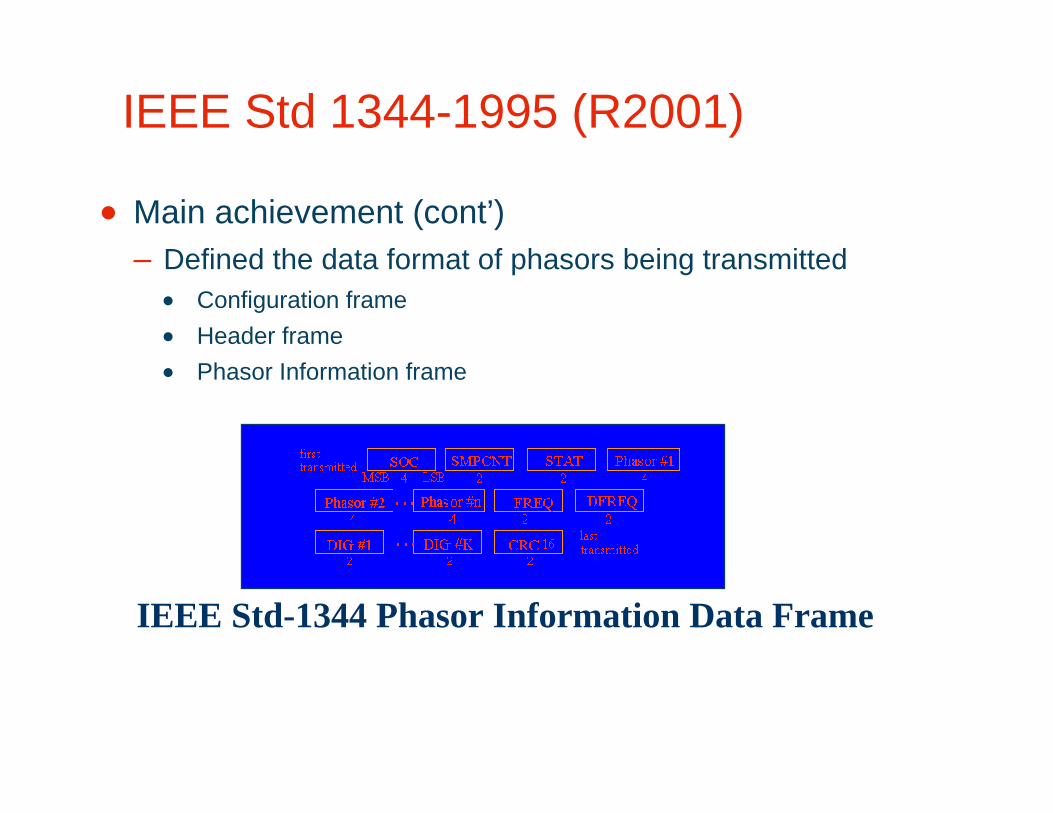
• Main achievement (cont’)– Defined the data format of phasors being transmitted
• Configuration frame• Header frame• Phasor Information frame
IEEE Std-1344 Phasor Information Data Frame
Limitations of 1344-1995 (R2001)
• Defined angle convention only at Zero-crossing– Phasor angle requirements set at 1 PPS mark but not inside
the 1 second window• Limited to steady-state conditions
– The standard accepts different responses for non-steady-state conditions
• Data format not fully compatible to network communications– COMTRADE style aimed for serial communication links
• Limited implementation by manufacturers
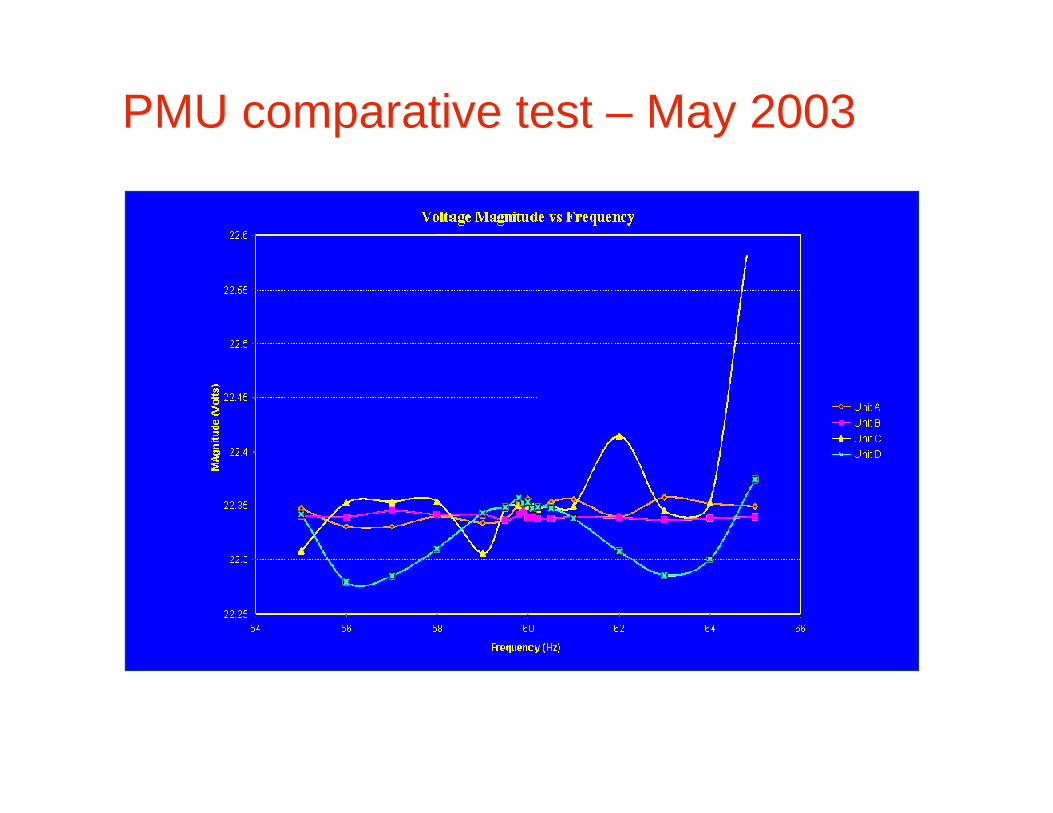
PMU comparative test – May 2003
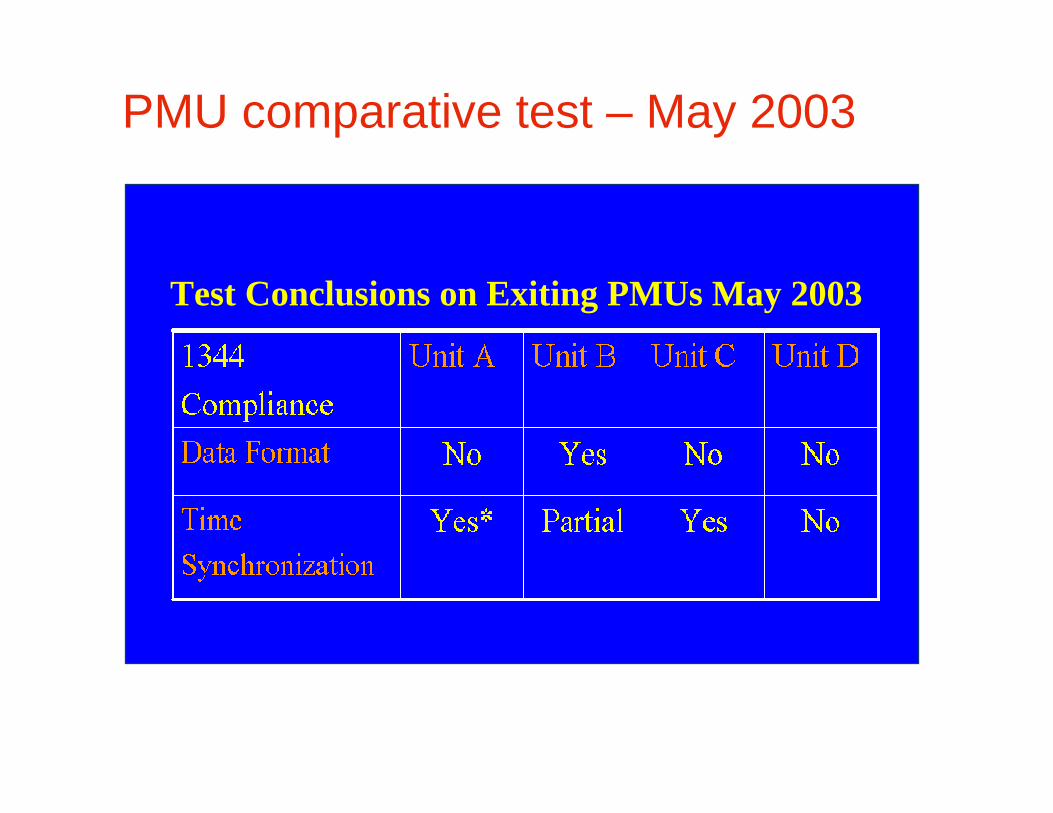
PMU comparative test – May 2003
Test Conclusions on Exiting PMUs May 2003
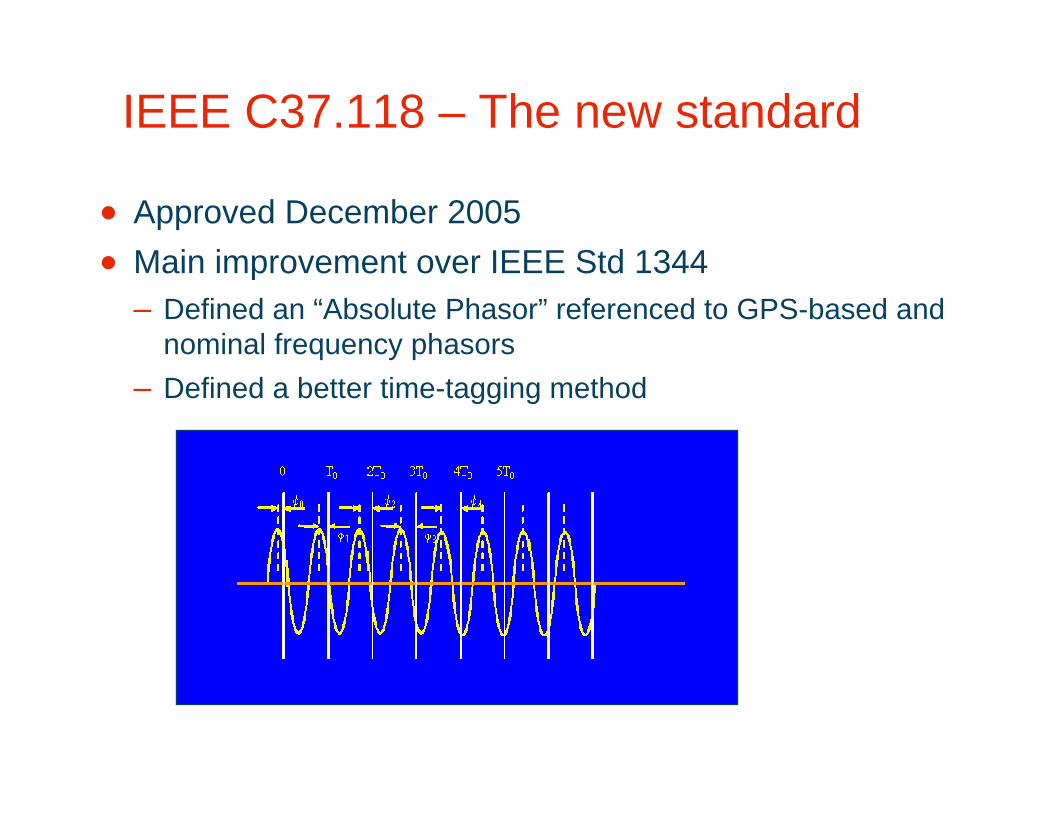
IEEE C37.118 – The new standard
• Approved December 2005• Main improvement over IEEE Std 1344
– Defined an “Absolute Phasor” referenced to GPS-based and nominal frequency phasors
– Defined a better time-tagging method
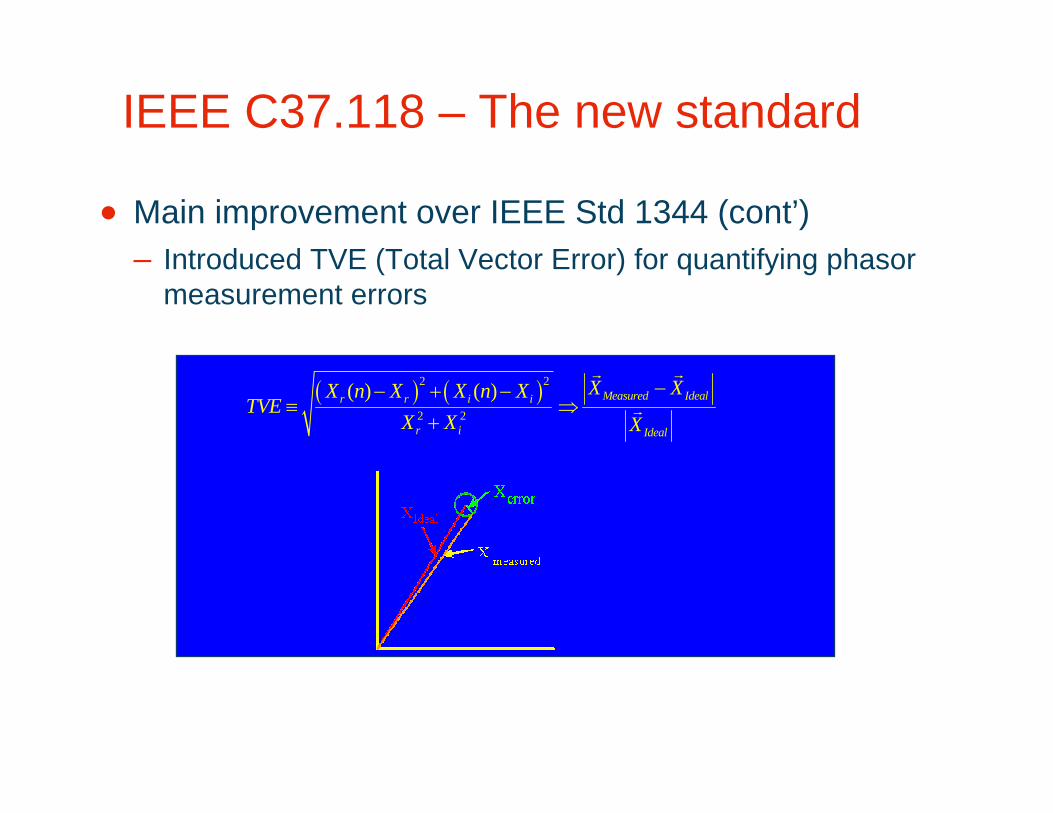
IEEE C37.118 – The new standard
• Main improvement over IEEE Std 1344 (cont’)– Introduced TVE (Total Vector Error) for quantifying phasor
measurement errors
( ) ( )2 2
2 2
( ) ( ) Measured Idealr r i i
r i Ideal
X XX n X X n XTVE
X X X
−− + −≡ ⇒
+
r r
r
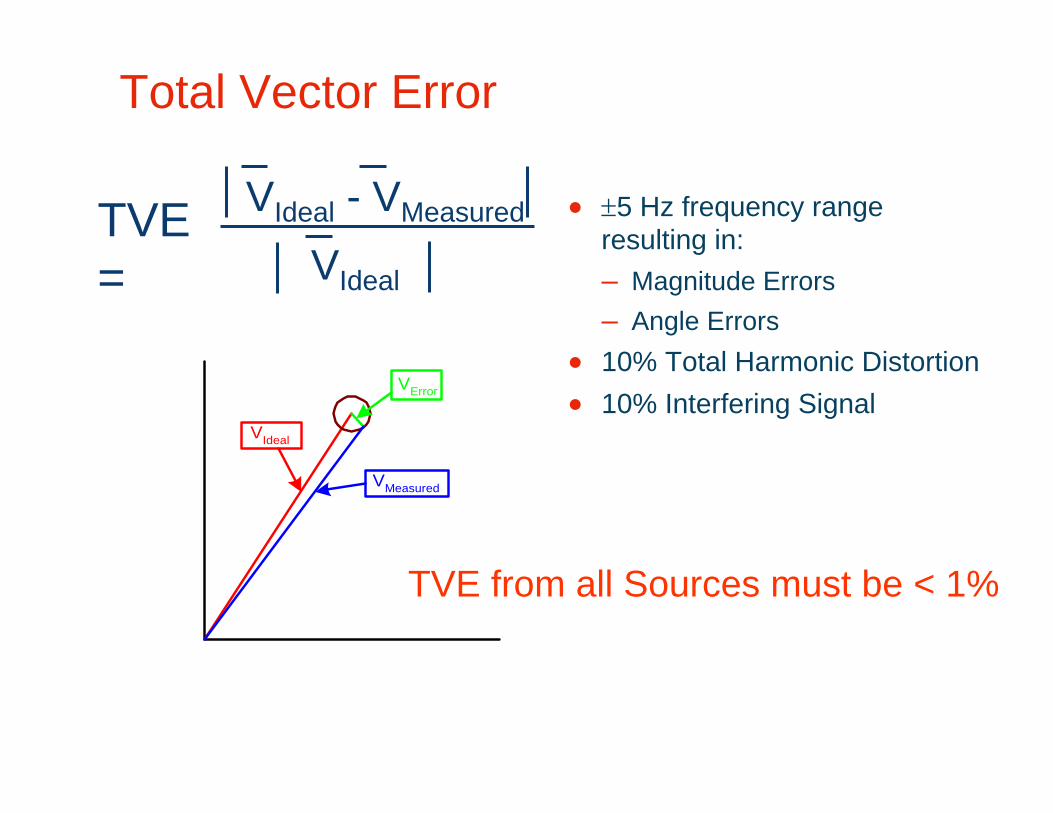
Total Vector Error
VIdeal
VMeasured
VError
TVE =
VIdeal - VMeasured
VIdeal
• ±5 Hz frequency range resulting in:– Magnitude Errors– Angle Errors
• 10% Total Harmonic Distortion• 10% Interfering Signal
TVE from all Sources must be < 1%
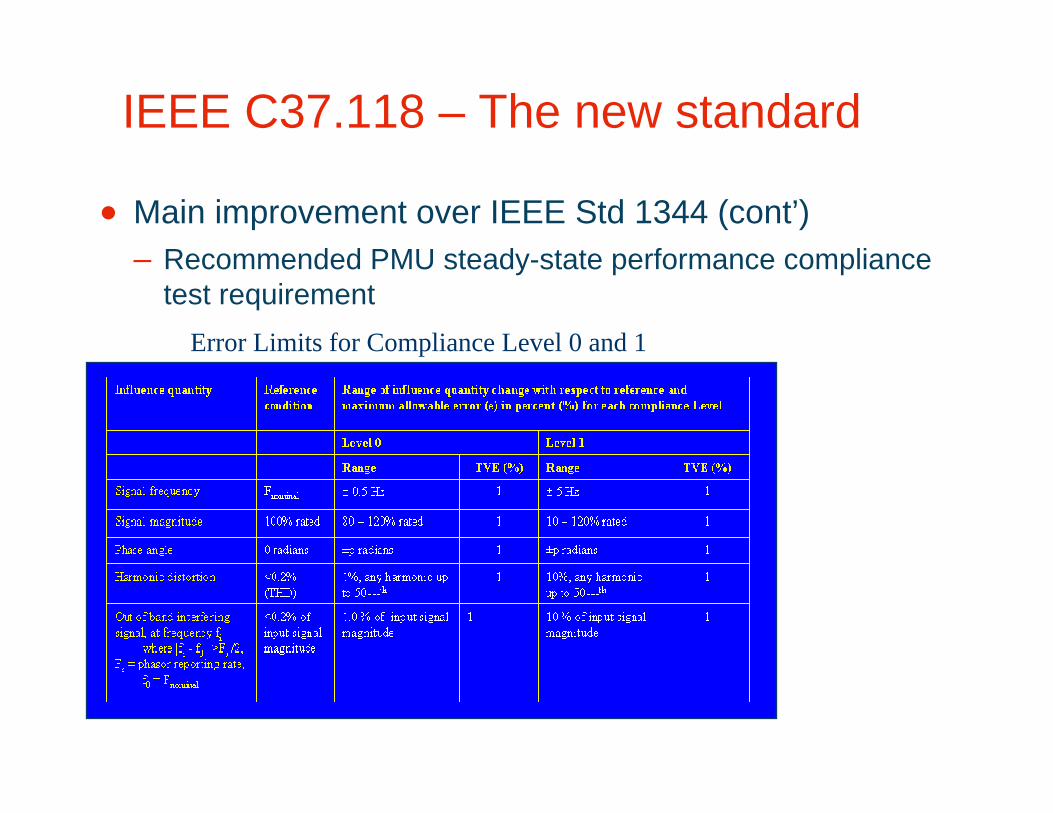
IEEE C37.118 – The new standard
• Main improvement over IEEE Std 1344 (cont’)– Recommended PMU steady-state performance compliance
test requirementError Limits for Compliance Level 0 and 1
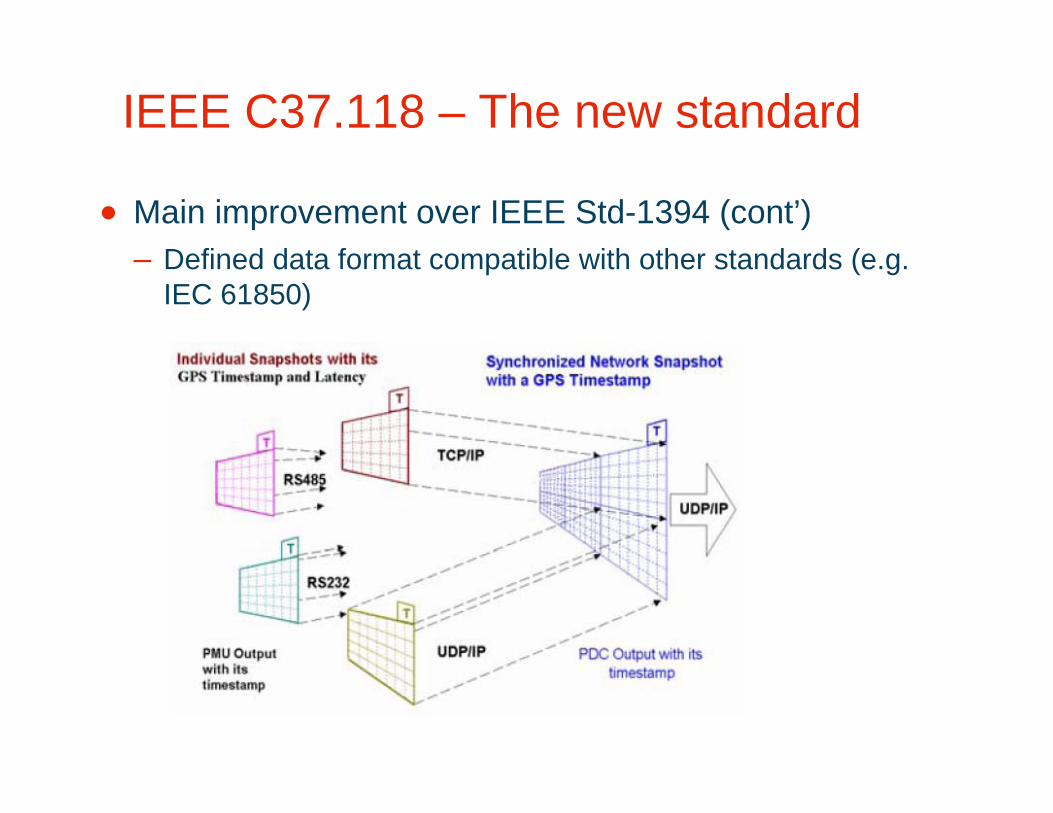
IEEE C37.118 – The new standard
• Main improvement over IEEE Std-1394 (cont’)– Defined data format compatible with other standards (e.g.
IEC 61850)
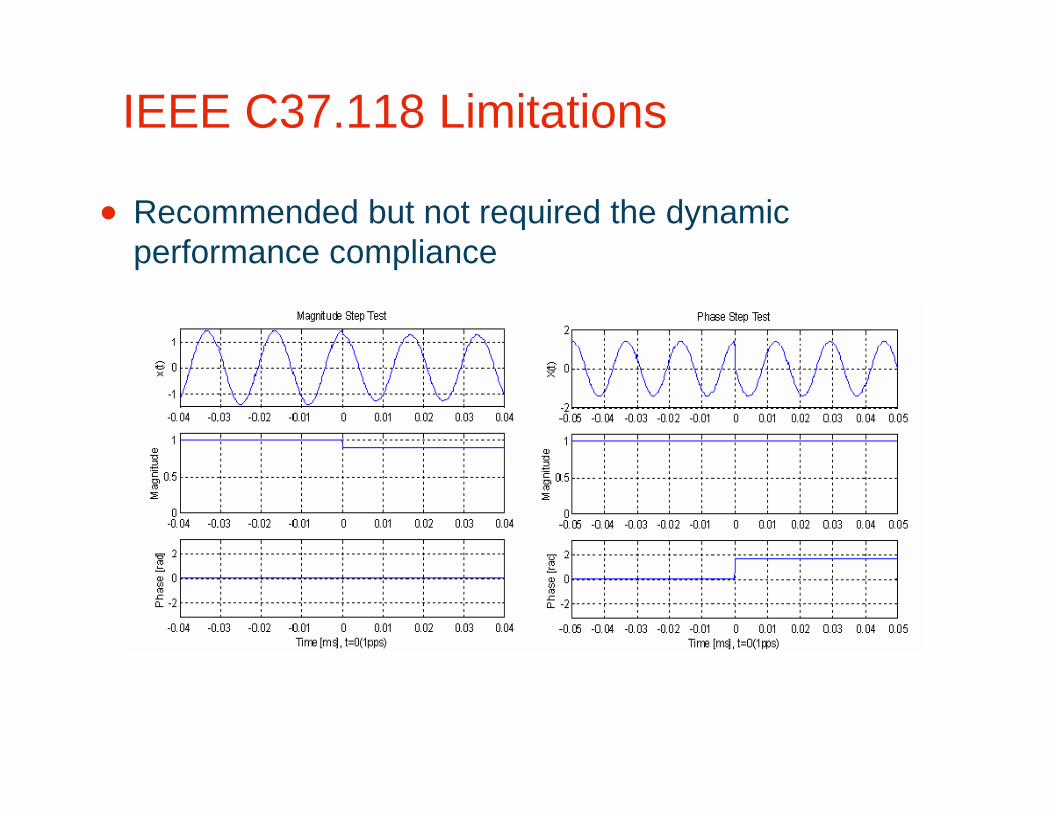
IEEE C37.118 Limitations
• Recommended but not required the dynamic performance compliance
IEEE C37.118 Limitations (cont’)
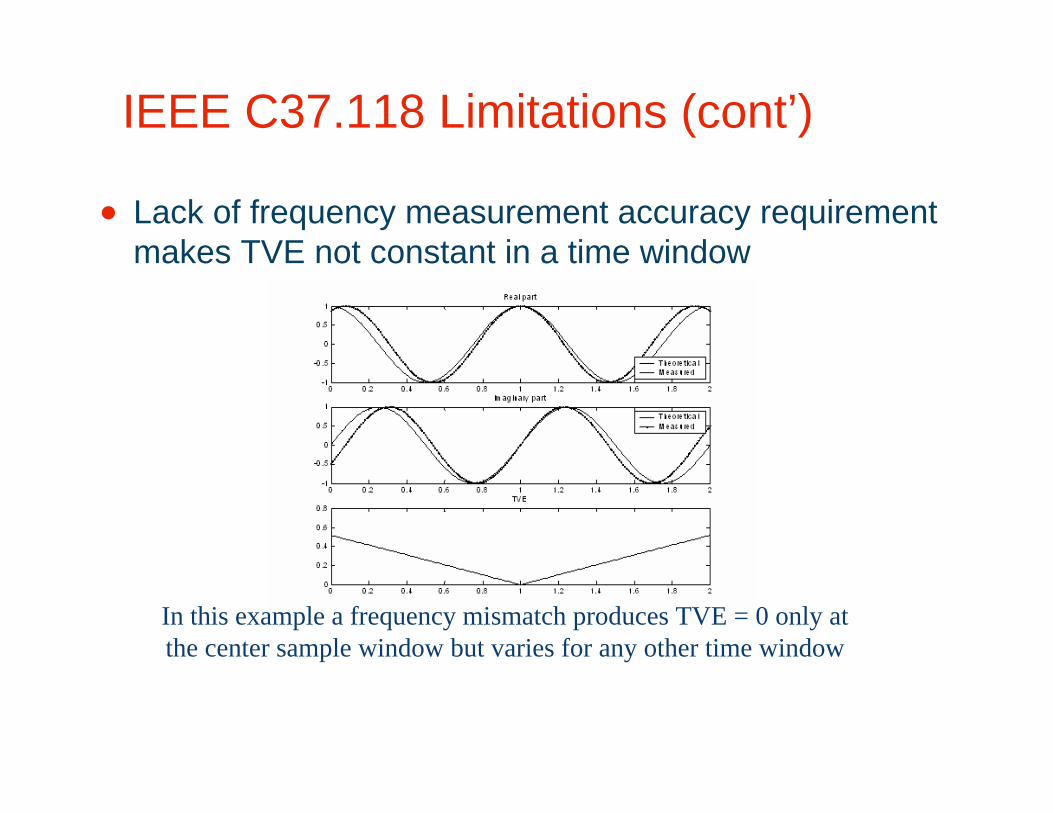
• Lack of frequency measurement accuracy requirement makes TVE not constant in a time window
In this example a frequency mismatch produces TVE = 0 only atthe center sample window but varies for any other time window
IEEE C37.118 Does Not
• Define a common phasor reference in a power system• Provide detailed test setup and test procedures for
steady-state performance compliance test• Address some practical application issues
– PMU field installation and commission– PMU connection to Phasor Data Concentrators
EIPP Performance Requirements Task Team (PRTT)
• Requirements and protocols for data collection, communications, and security through guidelines and standards
Eastern Interconnection Phase Angle Reference• Document: “Definition and Implementation of a System-Wide Phase Angle
Reference for Real-Time Visualization Applications” (approved). • Implementation of Virtual Bus Angle Reference at TVA SuperPDCPhasor Requirements for State Estimation• Document approved by PRTT• In the EIPP acceptance processPhase Inconsistency• Address phase inconsistency issue with corrective actions included.• Document posted
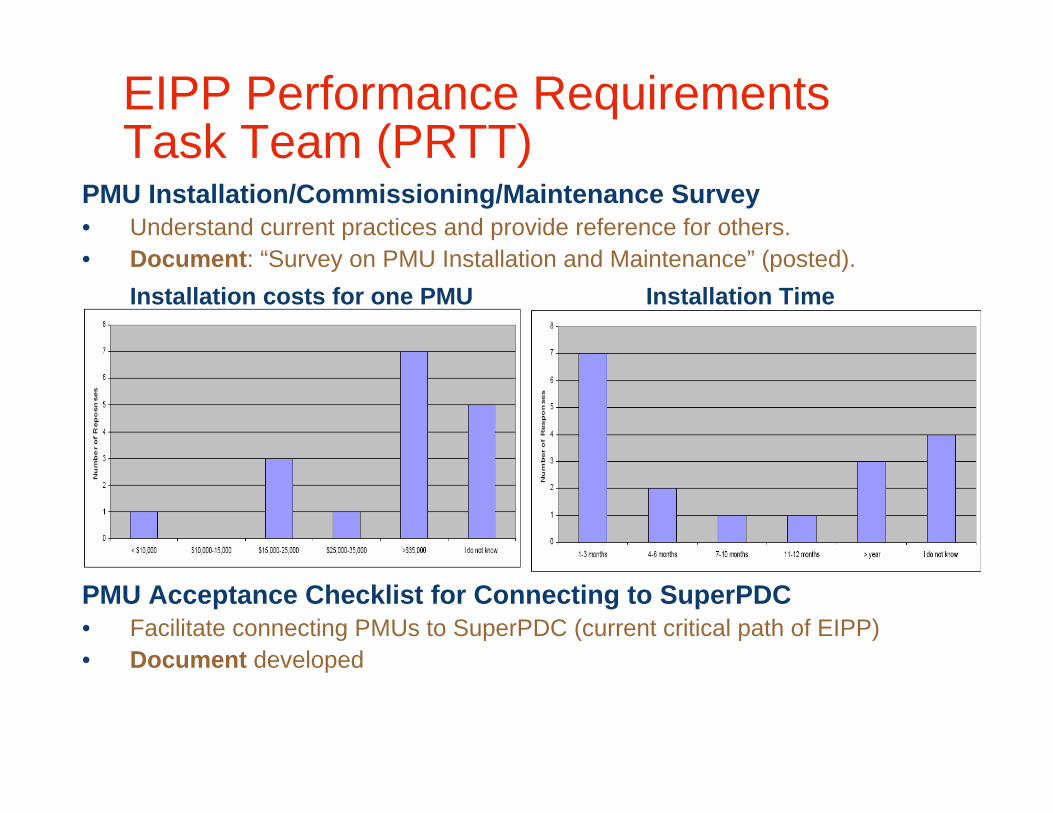
PMU Installation/Commissioning/Maintenance Survey• Understand current practices and provide reference for others.• Document: “Survey on PMU Installation and Maintenance” (posted).
Installation costs for one PMU Installation Time
PMU Acceptance Checklist for Connecting to SuperPDC• Facilitate connecting PMUs to SuperPDC (current critical path of EIPP)• Document developed
EIPP Performance Requirements Task Team (PRTT)
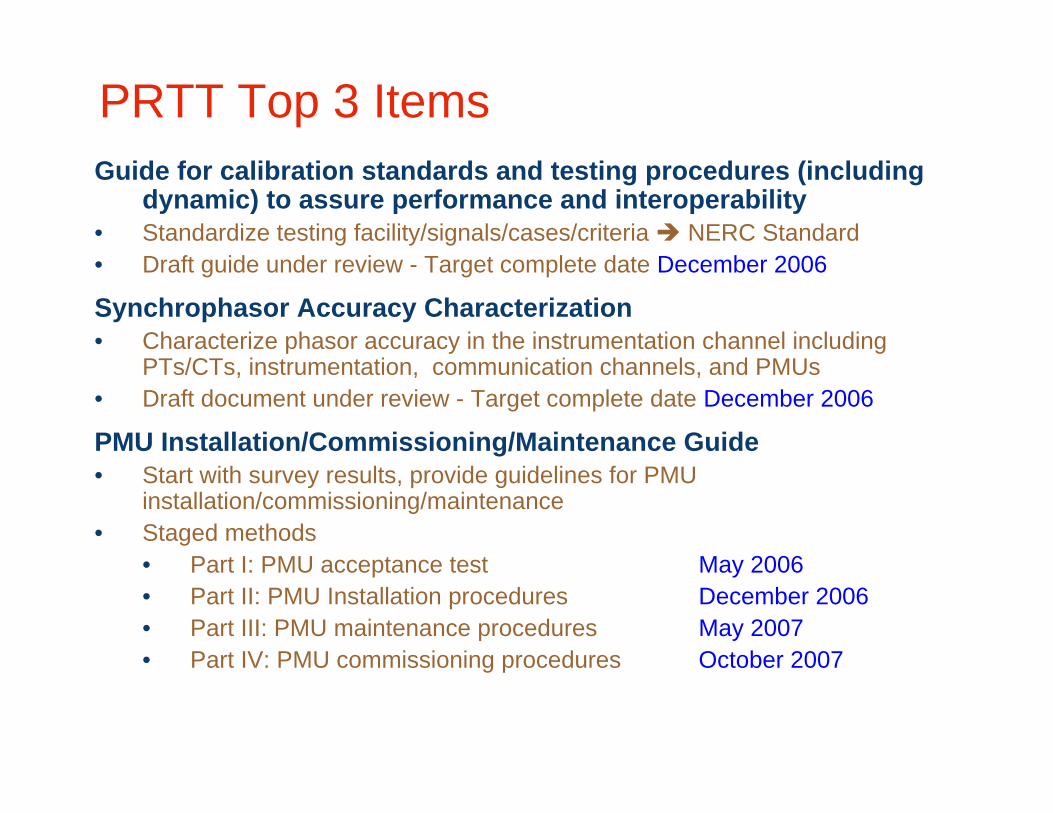
PRTT Top 3 ItemsGuide for calibration standards and testing procedures (including
dynamic) to assure performance and interoperability• Standardize testing facility/signals/cases/criteria NERC Standard• Draft guide under review - Target complete date December 2006
Synchrophasor Accuracy Characterization• Characterize phasor accuracy in the instrumentation channel including
PTs/CTs, instrumentation, communication channels, and PMUs • Draft document under review - Target complete date December 2006
PMU Installation/Commissioning/Maintenance Guide• Start with survey results, provide guidelines for PMU
installation/commissioning/maintenance • Staged methods
• Part I: PMU acceptance test May 2006• Part II: PMU Installation procedures December 2006• Part III: PMU maintenance procedures May 2007• Part IV: PMU commissioning procedures October 2007
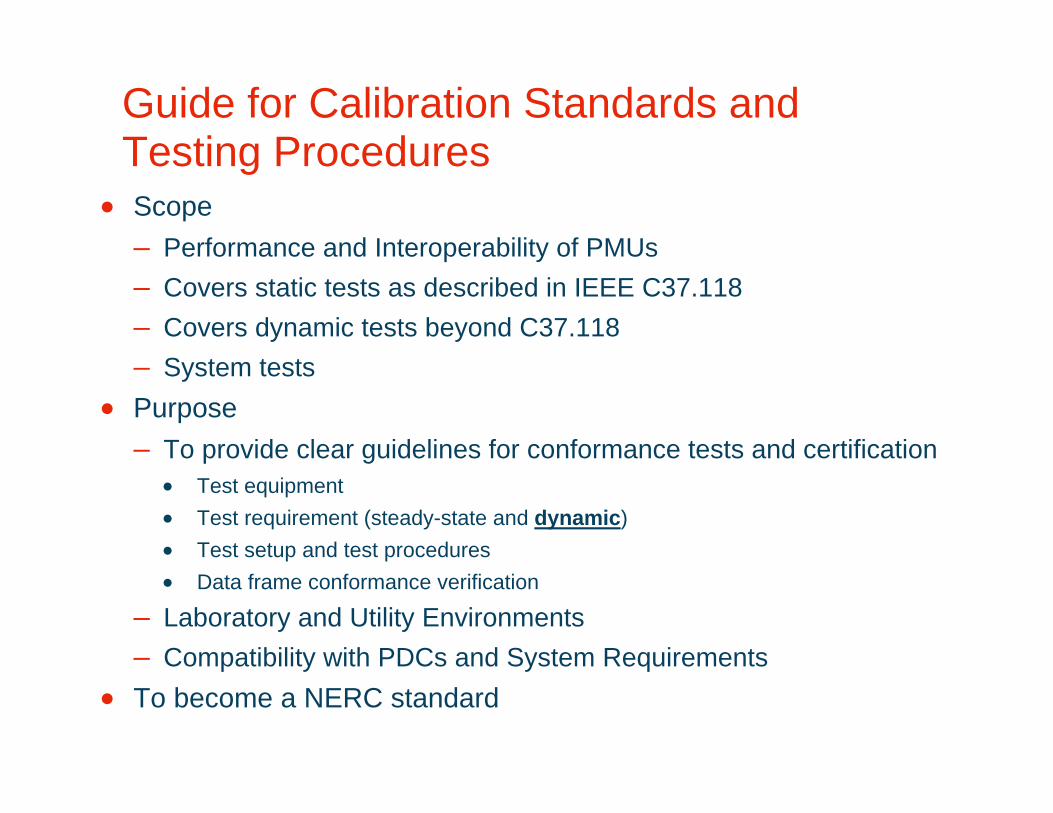
Guide for Calibration Standards and Testing Procedures
• Scope– Performance and Interoperability of PMUs– Covers static tests as described in IEEE C37.118– Covers dynamic tests beyond C37.118– System tests
• Purpose– To provide clear guidelines for conformance tests and certification
• Test equipment• Test requirement (steady-state and dynamic)• Test setup and test procedures• Data frame conformance verification
– Laboratory and Utility Environments– Compatibility with PDCs and System Requirements
• To become a NERC standard
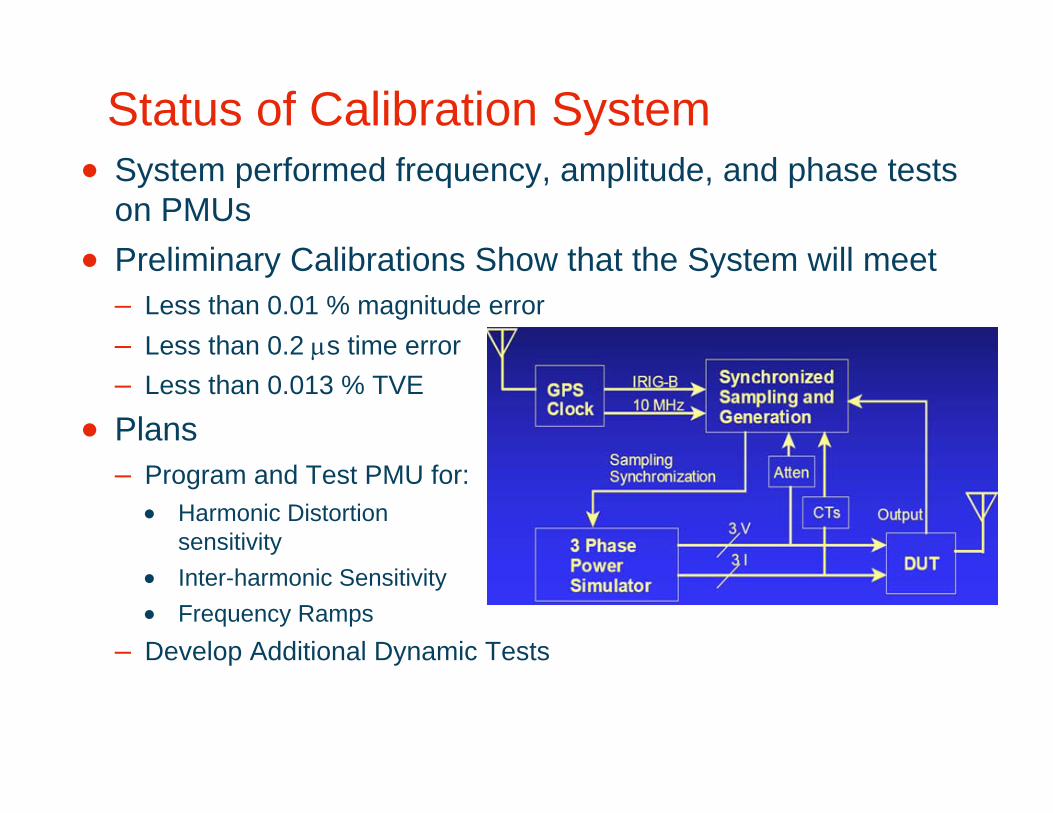
Status of Calibration System• System performed frequency, amplitude, and phase tests
on PMUs• Preliminary Calibrations Show that the System will meet
– Less than 0.01 % magnitude error– Less than 0.2 µs time error– Less than 0.013 % TVE
• Plans– Program and Test PMU for:
• Harmonic Distortionsensitivity
• Inter-harmonic Sensitivity• Frequency Ramps
– Develop Additional Dynamic Tests
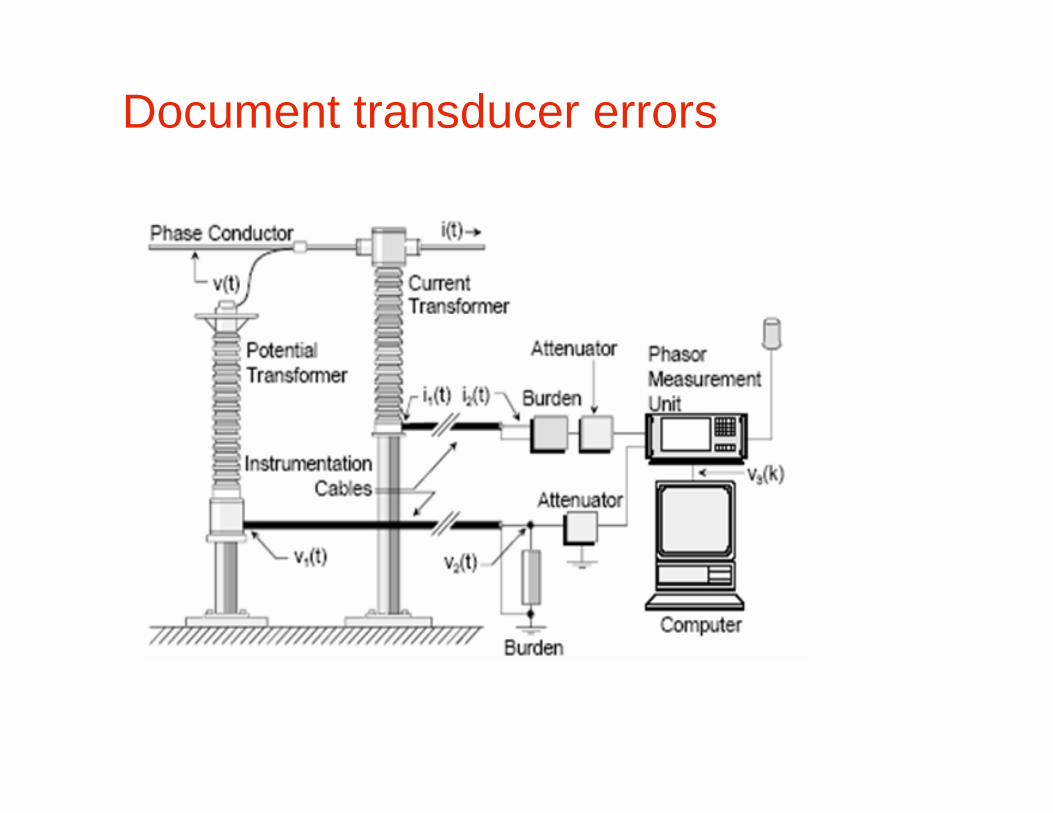
Document transducer errors
Summary
• IEEE C37.118 has provided a good foundation for Synchrophasor applications
• There are still some pressing issues that C37.118 did not address
• EIPP PRTT is currently working on these issues to fill in the gap
• Results of EIPP PRTT activities are critical for the successful applications of the Synchrophasors and PMUs
Conclusions and Next Steps• Advances in sensing, communication, computing, visualization, and
algorithmic techniques for Wide Area Monitoring, Protection, and Control Systems provide cost effective solutions to reduce costs, improve system performance, and minimize risks
• Need for WAMPAC application and deployment roadmap based on “business case” analysis to support utilities, regulators, and vendors
• Leverage benefits through integration of applications
• Early adopters lead the industry – Need for wider deployment
• Needs for education, training, and process and culture change
– Ownership within a utility and how to share benefits among groups
• System-wide implementation and common architecture
• Uniform requirements and protocols for data collection, communications, and security achieved through guidelines/standards
• Sharing experience and best practices (e.g. EIPP)

Experience you can trust.June 5 – 7, 2006
Thank you!
Any questions?