Embed Size (px)
Citation preview
CONTENTS
Objectives of Project
Abstract
Chapter – 1
1.1 Introduction1.2 Underlying motivation for synchronized measurements to be performed on a PMU1.3 Use of Synchrophasor(PMU)data1.4 Challenge faced in implementation of PMU
Chapter – 2 -
2.1 Block diagram of PMU
2.2 Performance measures for PMU
2.3 Synchro pahsor data collection
Chapter – 3 -
3.1 Equipment used in PMU
1

OBJECTIVES OF THE PROJECT
To design a PMU architecture comprises of 5 major blocks
i. Noise eliminationii. Phase estimation iii. Frequency estimationiv. Fundamental component estimationv. Phase shift estimation
2
Abstract:
In this project we are going to design architecture of PMU for measurement of voltage
and currents of 3 phase lines of substation. With the help of pmu we can continuously
monitor signal of various substation with synchronization of pmu with GPS.
The last decade has seen an intensified effort towards an improved, technologically advanced
electric grid. This effort is largely in part to the need for cleaner and renewable sources of
energy. Another motivator for this “smarter grid” is the need for a more reliable and
efficiently operated of the wide scale electric infrastructure. The impact of these changes can
expect to be seen at both the transmission and distribution level. At the transmission level
Phasor Measurement Units(PMU) also known as synchrophasor data has emerged as one of
the most enabling technologies for the smart grid movement. These devices measure and time
synchronize, the magnitude and phase angle of the electrical quantities over wide areas of an
electric grid. These measurements are then made available to utilities and system operators to
facilitate new and improved applications that foster enhanced grid reliability, security and
efficiency.
Synchrophasor data provides increased visibility into the phenomenon occurring within the
electric grid, as measurements are taken at rates up to 60 Hz. This is a significance
improvement compared to traditional Supervisory Control and Data Acquisition
systems(SCADA) which operate at a rate of once every 2 to 5 seconds. This increased data
rate therefore allows measurement of frequency estimation, voltage, current phasor
estimation, which is not possible in SCADA . These applications can vary from real-time
operation to offline applications for post-event analysis and planning. Some of the more well
known of these applications are state estimation, inter-area oscillation, and wide area
monitoring and control.
3

Chapter-1
1.1 INTRODUCTION
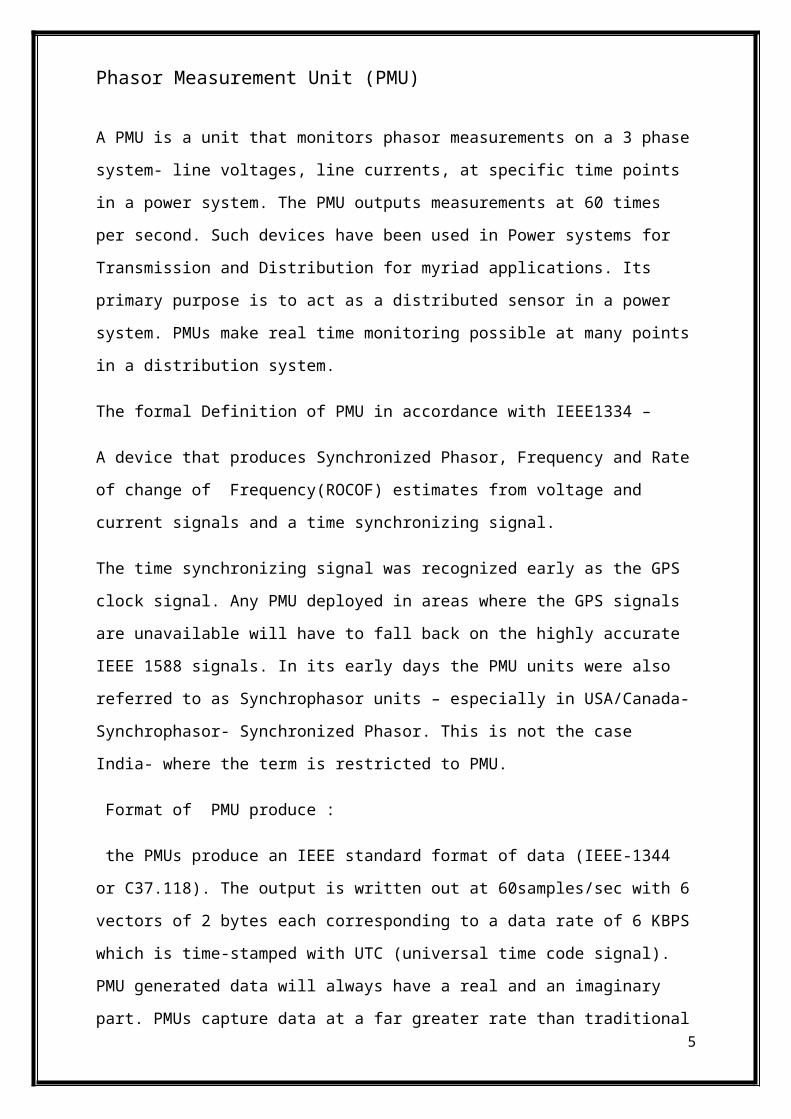
Phasor Measurement Unit (PMU)
A PMU is a unit that monitors phasor measurements on a 3 phase system- line voltages, line
currents, at specific time points in a power system. The PMU outputs measurements at 60
times per second. Such devices have been used in Power systems for Transmission and
Distribution for myriad applications. Its primary purpose is to act as a distributed sensor in a
power system. PMUs make real time monitoring possible at many points in a distribution
system.
The formal Definition of PMU in accordance with IEEE1334 –
A device that produces Synchronized Phasor, Frequency and Rate of change of
Frequency(ROCOF) estimates from voltage and current signals and a time synchronizing
signal.
The time synchronizing signal was recognized early as the GPS clock signal. Any PMU
deployed in areas where the GPS signals are unavailable will have to fall back on the highly
accurate IEEE 1588 signals. In its early days the PMU units were also referred to as
Synchrophasor units – especially in USA/Canada- Synchrophasor- Synchronized Phasor.
This is not the case India- where the term is restricted to PMU.
Format of PMU produce :
the PMUs produce an IEEE standard format of data (IEEE-1344 or C37.118). The output is
written out at 60samples/sec with 6 vectors of 2 bytes each corresponding to a data rate of 6
KBPS which is time-stamped with UTC (universal time code signal). PMU generated data
will always have a real and an imaginary part. PMUs capture data at a far greater rate than
traditional SCADA units and due to the synchronization mechanism applied the data
collected by PMUs is more realistic than using estimates such as Kalman filter estimates. The
control algorithms for stability and reactive power delivery which requires P(Real Power) ,
Q(Reactive Power) and V(Line Voltage) have more real-time data to available from multiple
PMUs work with.
4
Advantages of PMUs over traditional SCADA system:
SCADA outputs data every 2 seconds and does not include phase information.
Synchrophasor produces a 6 vector output 60 times / second and includes phase information.
A PMU picture of a grid is at far greater level of detail compared to a SCADA picture of a
grid hence it has been started that a useful analogy between PMU and SCADA is like a
MRI(PMU) versus and X-ray(SCADA) of the network
1.2 Underlying motivation for synchronized measurements to be performed on a PMU:
In practice the phasors measured by PMUs in widely different locations are best sampled at
the exact same instant even thought the PMUs are widely separated. Without an excellent
synchronization algorithm, the measurement vectors produced by an array of PMUs are less
reliable and not very useful. With a proper synchronization mechanism the simultaneous
measurements from multiple widely separated PMUs are used to detect perturbations in the
distribution system such as a frequency disturbance and the level of reactive power being
injected at a given point in the power grid. Synchronization is what make PMUs very useful
in power systems management and load dispatch.
Figure 1: Synchronization between widely separated PMUs
Measurements made in substation A will never be exactly synchronized with those made in
substation B unless they are taken deliberately at the same exact time instant – using a
common high resolution reference clock allows perfect synchronization between the two
measurements.
5

1.3 Use of Synchrophasor (PMU)Data
One of the greatest advantages of synchrophasor measurement is availability of time
synchronized data obtained from various grid stations spread across a wide geographical area
covering thousands of square kilometers. The synchrophasor data is being extensively used
for real time and post event analysis. This envisages the use of the synchrophasor data for
event detection and event analysis for the purpose of development of analytics and tools to
monitor the event. The whole chapter has been divided into various categories of analysis for
which the data was used. Various grid events have been analyzed using the synchrophasor
data along with other data like Station Disturbance recorder (DR), Event logger (EL),
SCADA Sequence of Event (SOE) etc.
the following categories:
1. Fault detection, classification and analysis
- Faults in Transmission Line, power station/grid substation- Tripping due to lack of protection co-ordination/Instrument error.- Faults involving high impedance- Faults cleared by back up protections
2. Low Frequency Oscillation
- Inter Area Oscillation- Inter & Intra Plant Oscillation
3. Detection of Coherent Group of Generators
4. Islanding Detection and their resynchronization with the grid
5. Dynamic Model Validation Using Synchrophasor data
6. Visualization of PSS testing.
7. Monitoring of Natural disasters.
These are the major categories of various types of events in the Indian grid which are
analyzed with the help of Synchrophasor data.
6

1.4 Challenge faced in implementation of PMU
Synchrophasor technology has many advantages, however implementing it on a large scale
also poses many challenges. In India, the project was first started on a obtain initial
experience of the technology and now it is being scaled up in the upcoming scheme known as
Unified Real Time Dynamic State Measurement Scheme (URTDSM Scheme). During the
execution of projects many challenges were faced, which include:
_ Selecting locations for PMU placements
_ Type of architecture required
_ Setting up of standards and compliances
_ Ensuring interoperability of PMUs
_ Availability and setting up of communication infrastructure
_ Developing tools for in-depth post facto analysis
_ Event Detection
_ Developing lucid visualizations for system operators
_ Integration of Synchrophasor technology with SCADA
_ Cyber Security Management & Compliance
7

Chapter – 2
2.1 BLOCK DIAGRAMS OF PMU ARCHITECTURE
Typically a PMU comprises of 6 blocks:
Current and potential transformers
Analog front end – signal conditioning , noise filtering
Analog to digital converters – 1 KSPS(Kilo samples per second) is sufficient
for most PMUs
A master clock reference – GPS or IEEE 1588
A synchronization mechanism, usually a Phase –Locked Loop(PLL) to
synchronize the ADC clock and microprocessor clock with a GPS reference
clock
A Embedded controller i.e Zybo board of sufficient processing power to
compute FFTs and perform real time frequency and phase shift computation.
This can involve fast Digital Signal Processor computations.
A wireless or wired interface to send the phasor data in packets to a PMU
aggregation unit or to a central control room. The final packetized data from a
PMU is sent to a control engine which prepares the data for sending over a
USB port, a Wi-Fi interface , a Wide Area network(WAN).
Detail block Diagram of a PMU with Frequency , Phase Estimation and filtering
8

Figure : Block diagram of a more detailed PMU implementation with estimators
Figure provides an alternative but far more sophisticated SW architecture. The difference
between Figure 4 and Figure 6 is the following.
CIC filter: the Cascaded Integrator Comb – CIC filter provides a high throughput low power
FIR filter replacement which will filter noise at the ADC output. CIC filters do not requires
any multiplication compared to a FIR or IIR filters and are widely used in digital radio
receivers.
Guard-filter: This is an additional harmonic filter which can filter out harmonics and filter out
and further unwanted spurs at ADC output.
PHASE ESTIMATOR: One way to estimate phase and frequency would be to apply a
Kalman filter to smoothen out the observations or an optimal Weinert-Desai type smoother.
Decimator: The rate at which the estimators work is still much higher than the rate required
the output of the PMU. A rate decimation module which comprises of a CIC filter with a
decimation stage
2.2 Performance measures for PMUs
The common performance measure for PMUs seems to be TVE- total vector error. TVE is a
measure between the instantaneous vector measurement and the actual error free value.
9

TVE(n )=√ (Xr (n )−X̂ r( n))2+(X i(n )−X̂ i (n))
2
(Xr (n))2+(X i(n ))2
Where,
X r(n) = Real part of the phasor measurement performed by a given PMU
X i(n) = Imaginary part of the phasor measurement performed by a given PMU
The TVE is a Euclidian distance measure of the value measured by a PMU with the actual
error free value.
The typical PMU (Level 1) must operate at less than 1% TVE when the frequency deviation
is +/-1 Hz with 10% harmonics.
The typical performance requirements of a synchrophasor (Level 1) include the ability to
operate at less than 1% TVE when the frequency deviation is +/-5 Hz with 10% harmonics
and additional 10% out of band signal distortion.
Frequency Disturbance detector using PMU
Figure 7 A frequency disturbance estimator
The PMU produces instantaneous frequency estimates, a frequency deviation can be measured as ,
∆ f=f k−2 f k+1+f k+2
2 τ
Where
f k ,2 f k+1 , f k +2 are the frequency estimates at instants k, k+1 and k+2
τ=¿ The time interval between two frequency estimates
10

When the estimate ∆ f exceeds a programmed threshold of say 0.5Hz the PMU will generate
a signal back to the control room. This signal captured a transient occurring in the system.
The PMUs can be used to capture transients including imbalances, circuit breaker tripping ,
voltage disturbances within the transmission grid.
Frequency Estimation
Frequency estimation is an essential part of what is performed by PMUs. The second the
phase estimation. The two estimations are interrelated. The frequency estimator usually
works using a demodulation as illustrated in Figure 6.
Demodulator for Frequency and phase shift determination
Demodulator utilizes a synthesized phasor rotating in the opposite direction to generate
frequency deviation and phase shifts in real time. The advantage is that no higher frequency
filters are necessary.
2.3 Snchrophasor Data Collection:
11
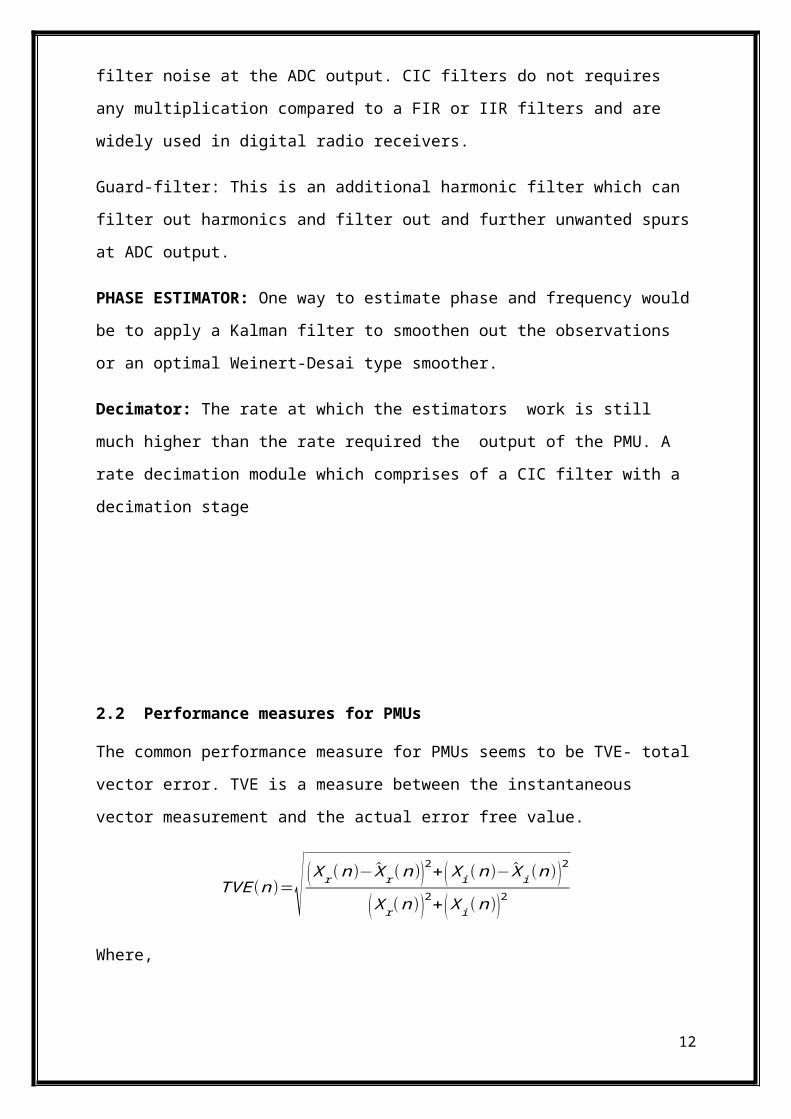
Figure 8: Phasor Measurement Unit Data Aggregation
The phasor estimate was originally provided by Phadke as a combination of values one being the Fourier coefficient itself multiplied by the factor P and the second the conjugate of the Fourier coefficient multiplied by Q, this is taken at then nomimal frequency . The True fourier coefficient X is related to the obtained FFT value through the following equation.
X̂=PX+Q X¿
Where, X=¿ computed Fourier Coefficient
X , X¿ = true Fourier coefficient and its complex conjugate
P=sinN (ω−ω0)Δt
2
Nsin(ω−ω0)Δt
2
ej(N−1)
N (ω−ω0 )Δ t2
(1)
Q=sinN (ω+ω0)Δt
2
Nsin(ω+ω0)Δt
2
e− j(N−1)
N (ω−ω0 )Δ t2
(2)
The true Fourier coefficients can be obtained from the observations as follows,
ℜ (X )= ℜ ( X̂ )[P+Q ]
(3)
ℑ ( X )= ℑ ( X̂ )[P+Q ]
(4)
12

TESTING OF THE PROPOSED ALGORITHM COMPARED TO QPS-DFT ALGORITHM
13

Chapter – 3
3.1 Equipment used in PMU
Global Positioning System (GSP)
The synchronized time is given by GPS uses the high accuracy clock from satellite
technology. The first GPS system was developed by United States, Department of Defense.
Without GPS providing the synchronized time, it is hard to monitor whole grid at the same
time.
The GPS satellites provide a very accurate time synchronization signal, available, via an
antenna input, throughout the power system. This means that that voltage and current
recordings from different substations can be directly displayed on the same time axis and in
the same phasor diagram. Fig shows how GPS works to organize the synchronization time.
Figure
14

15