Embed Size (px)
Citation preview

Tutorial: Homework Assignment Week 1Purposes:• Use Excel• Load and embed SPC Macro into Excel• Create Histograms from Data Sets• Create Histograms on your “Own”
QI Project Data
Excel 2010
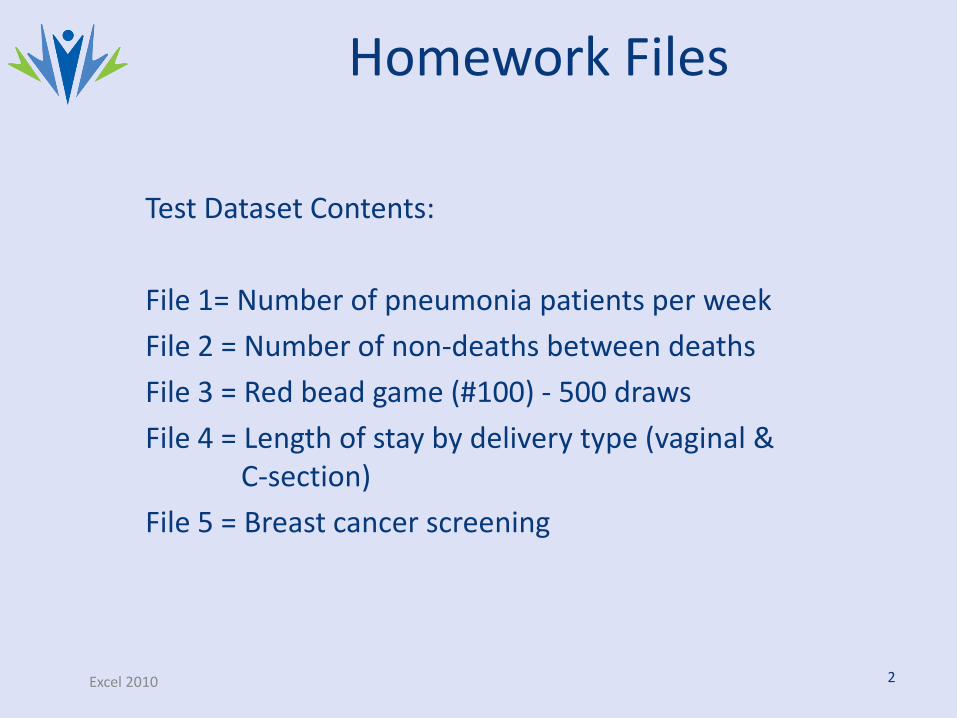
Test Dataset Contents:
File 1= Number of pneumonia patients per week
File 2 = Number of non-deaths between deaths
File 3 = Red bead game (#100) - 500 draws
File 4 = Length of stay by delivery type (vaginal & C-section)
File 5 = Breast cancer screening
Homework Files
2
Excel 2010
Access Macro and Data Sets
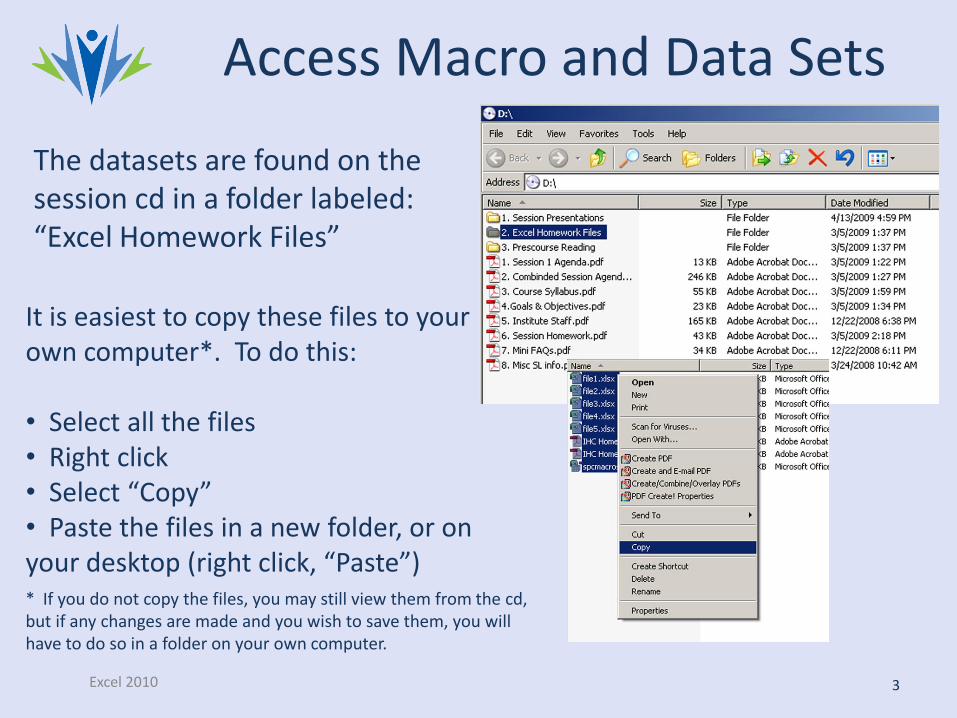
The datasets are found on the session cd in a folder labeled: “Excel Homework Files”
* If you do not copy the files, you may still view them from the cd, but if any changes are made and you wish to save them, you will have to do so in a folder on your own computer.
3
It is easiest to copy these files to your own computer*. To do this:
• Select all the files• Right click• Select “Copy”• Paste the files in a new folder, or on your desktop (right click, “Paste”)
Excel 2010
Load Macro into Excel
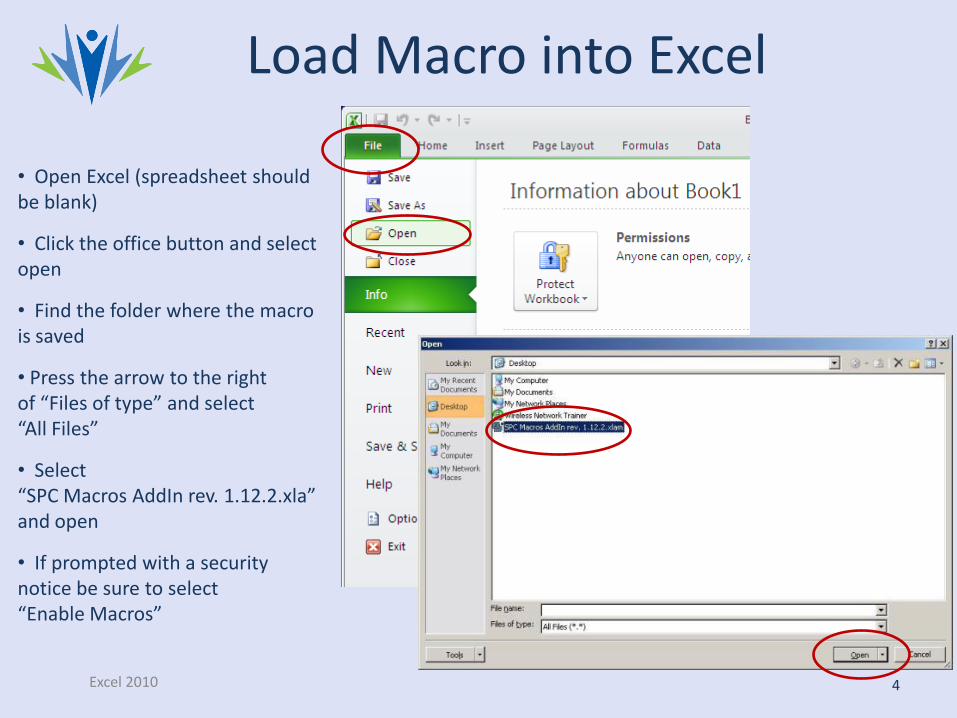
• Open Excel (spreadsheet should be blank)
• Click the office button and select open
• Find the folder where the macro is saved
• Press the arrow to the right of “Files of type” and select “All Files”
• Select “SPC Macros AddIn rev. 1.12.2.xla” and open
• If prompted with a security notice be sure to select “Enable Macros”
4
Excel 2010
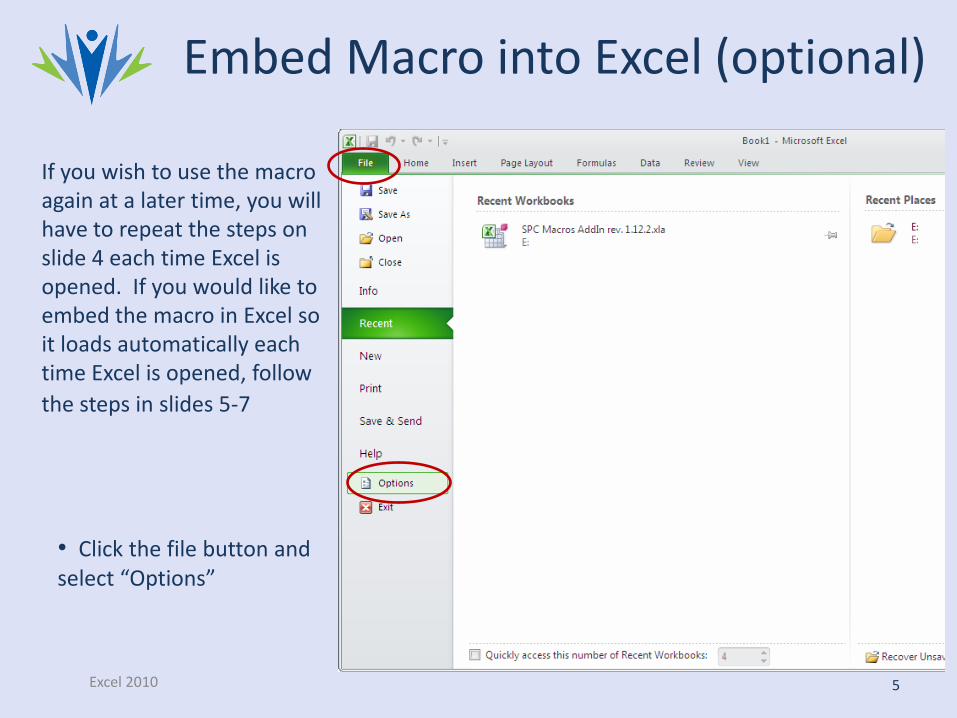
Embed Macro into Excel (optional)
If you wish to use the macro again at a later time, you will have to repeat the steps on slide 4 each time Excel is opened. If you would like to embed the macro in Excel so it loads automatically each time Excel is opened, follow
the steps in slides 5-7
5
• Click the file button and select “Options”
Excel 2010
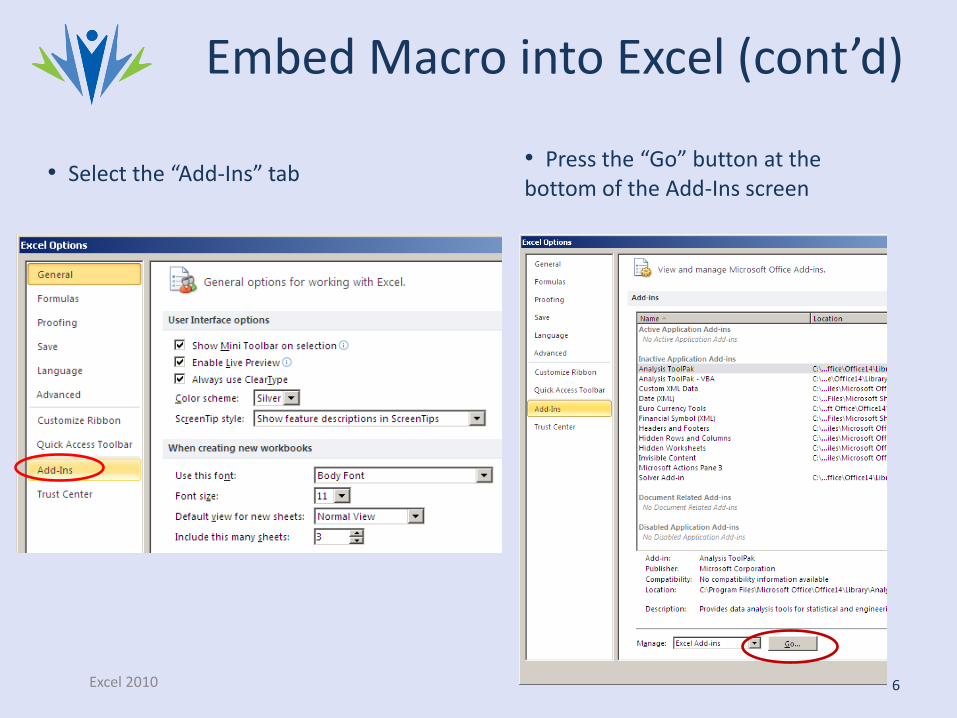
Embed Macro into Excel (cont’d)
6
• Select the “Add-Ins” tab• Press the “Go” button at the bottom of the Add-Ins screen
Excel 2010 7
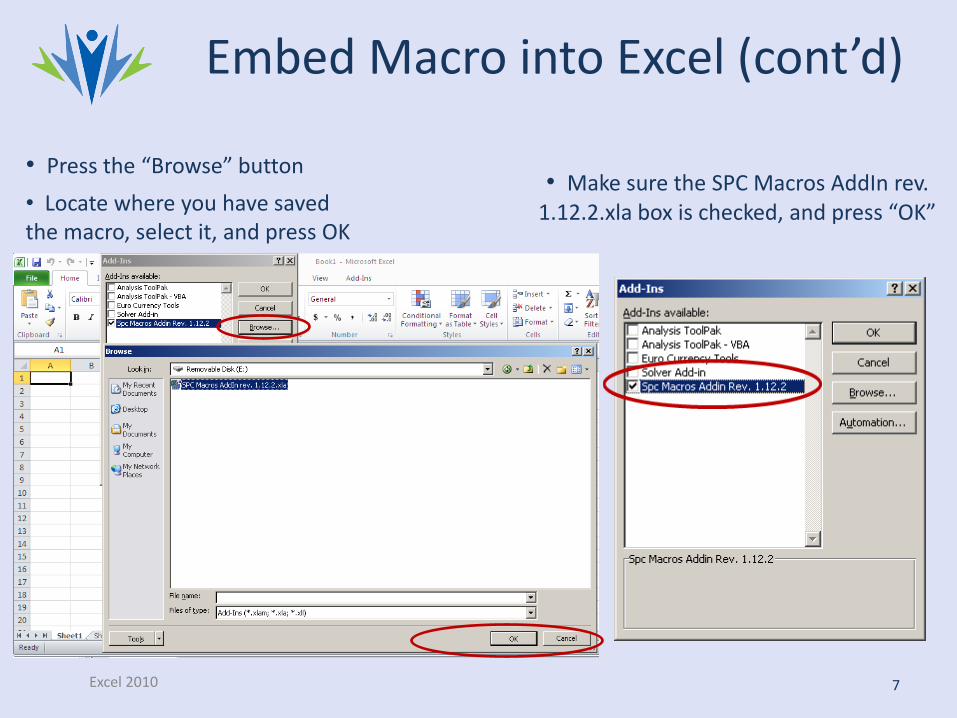
• Press the “Browse” button• Make sure the SPC Macros AddIn rev.
1.12.2.xla box is checked, and press “OK”• Locate where you have saved the macro, select it, and press OK
Embed Macro into Excel (cont’d)
Excel 2007
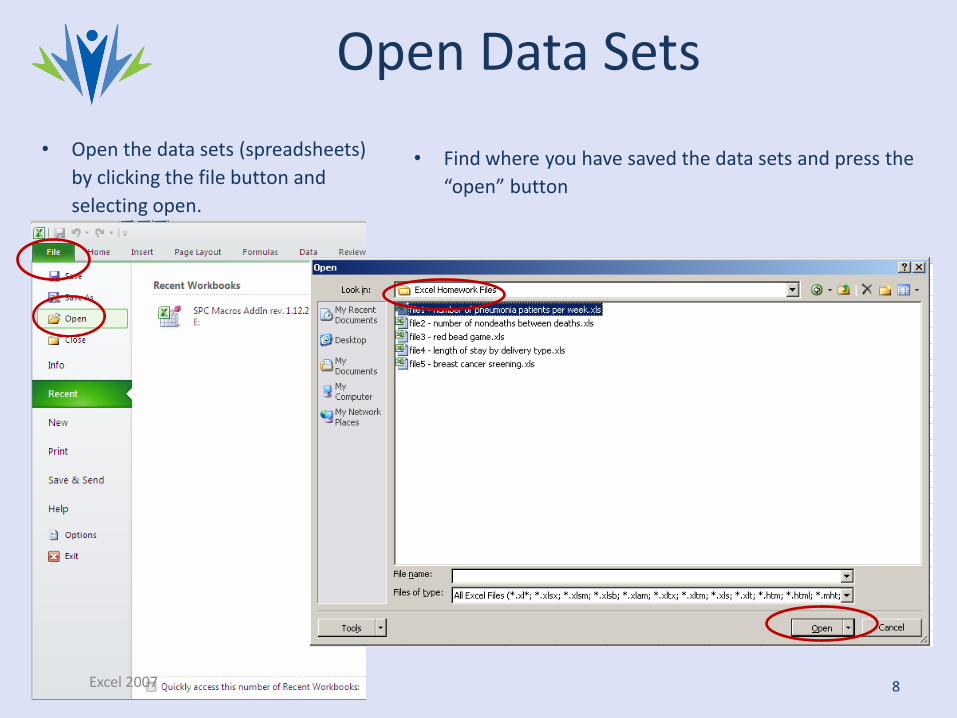
Open Data Sets
• Open the data sets (spreadsheets)
by clicking the file button and
selecting open.
8
• Find where you have saved the data sets and press the
“open” button
Excel 2010
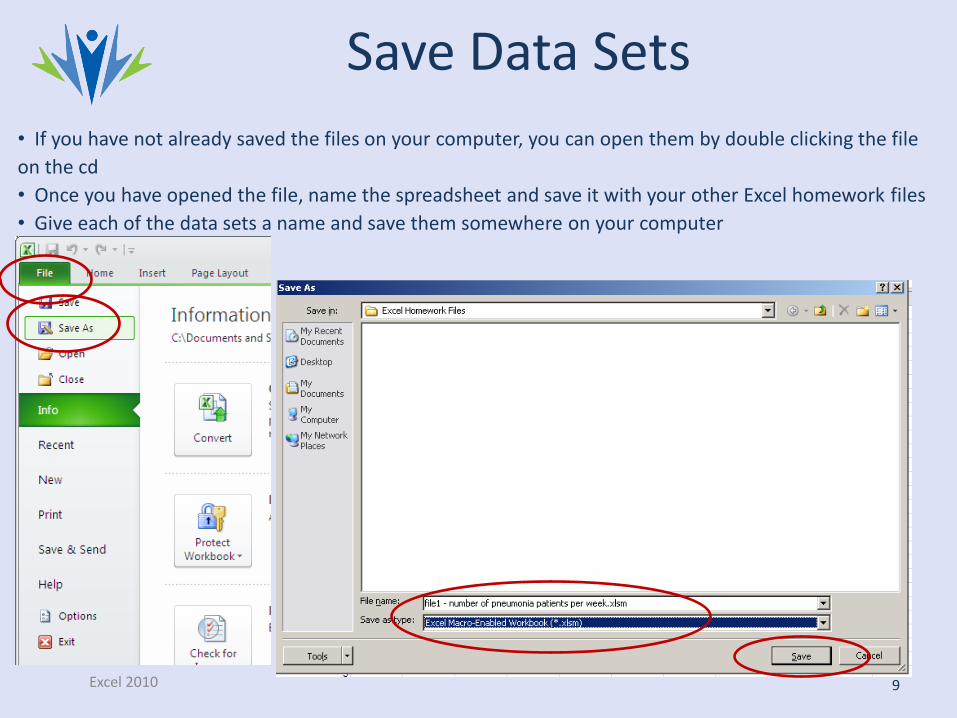
Save Data Sets
• If you have not already saved the files on your computer, you can open them by double clicking the file
on the cd
• Once you have opened the file, name the spreadsheet and save it with your other Excel homework files
• Give each of the data sets a name and save them somewhere on your computer
9
Excel 2010
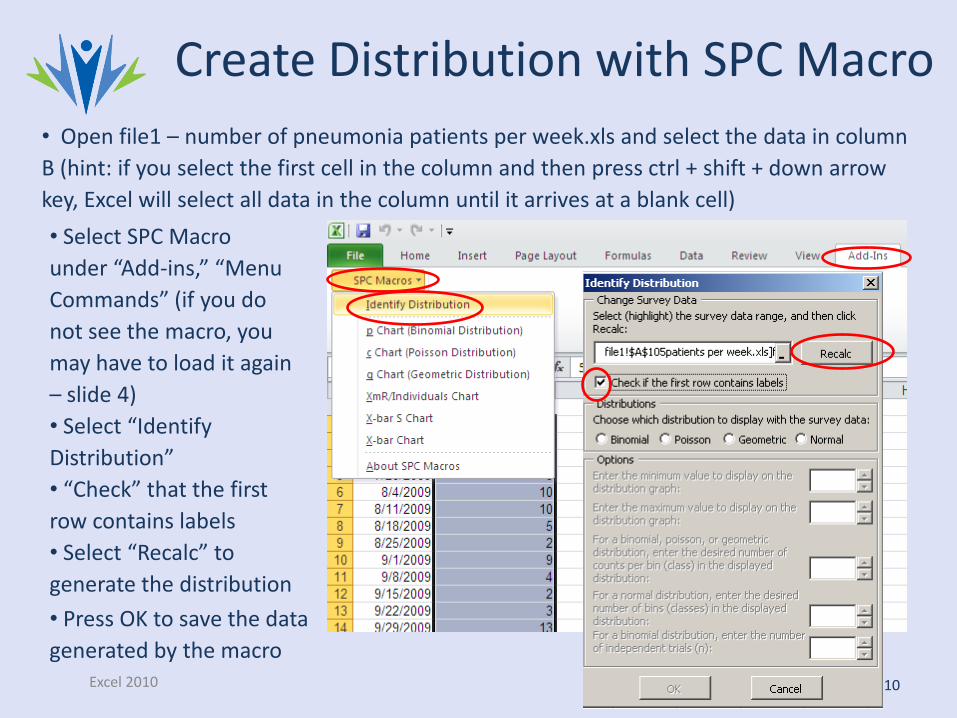
Create Distribution with SPC Macro
• Open file1 – number of pneumonia patients per week.xls and select the data in column
B (hint: if you select the first cell in the column and then press ctrl + shift + down arrow
key, Excel will select all data in the column until it arrives at a blank cell)
• Select SPC Macro
under “Add-ins,” “Menu
Commands” (if you do
not see the macro, you
may have to load it again
– slide 4)
• Select “Identify
Distribution”
• “Check” that the first
row contains labels
• Select “Recalc” to
generate the distribution
10
• Press OK to save the data
generated by the macro
Excel 2010
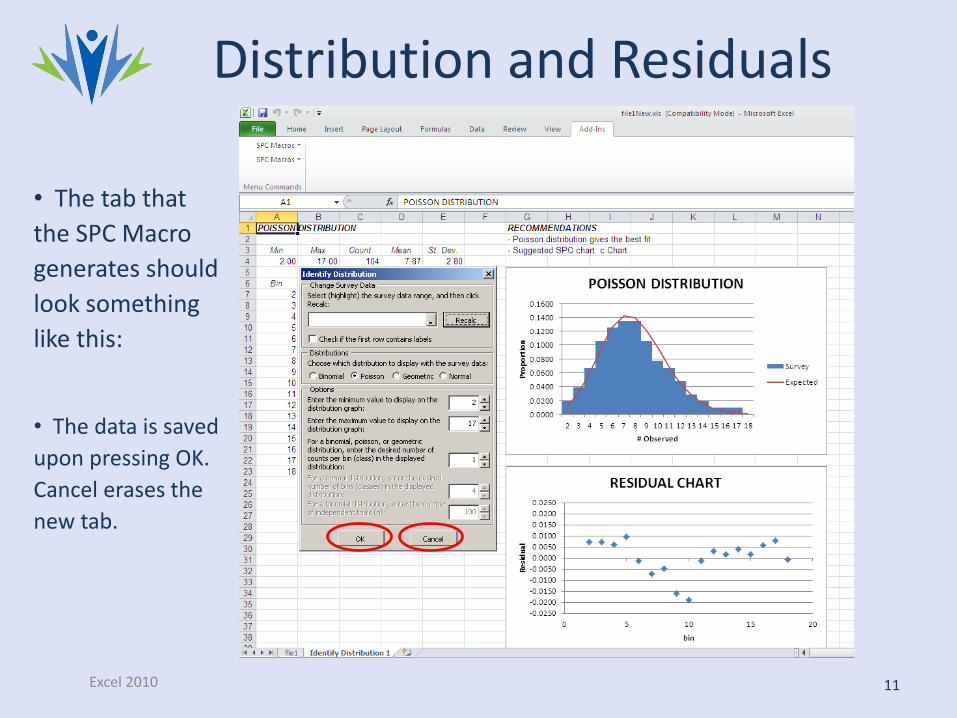
Distribution and Residuals
• The tab that
the SPC Macro
generates should
look something
like this:
• The data is saved
upon pressing OK.
Cancel erases the
new tab.
11
Excel 2010
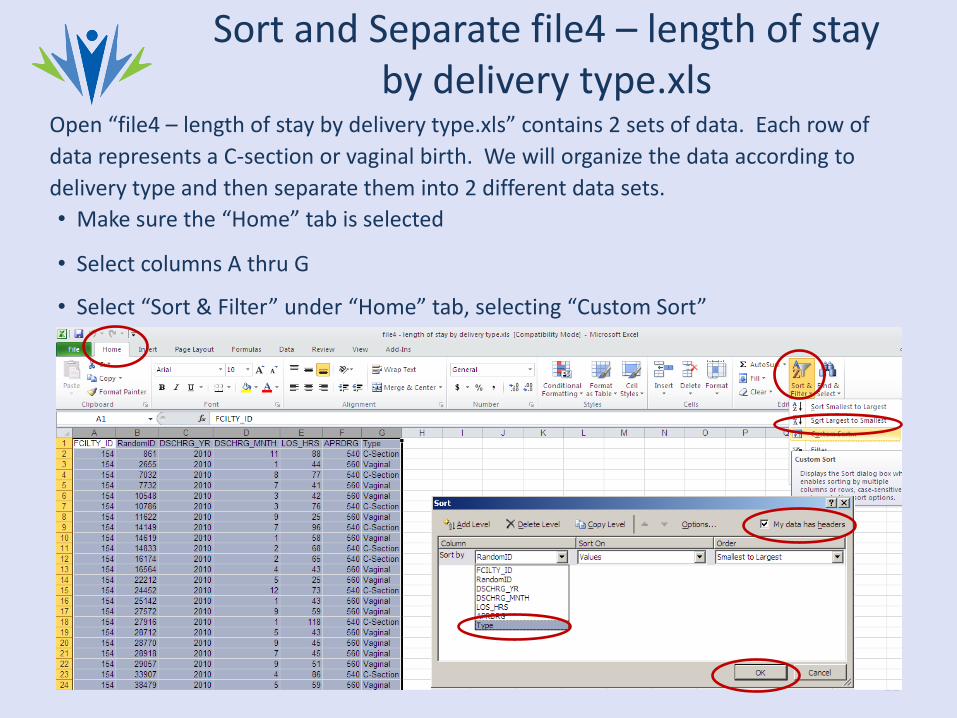
Sort and Separate file4 – length of stay by delivery type.xls
Open “file4 – length of stay by delivery type.xls” contains 2 sets of data. Each row of
data represents a C-section or vaginal birth. We will organize the data according to
delivery type and then separate them into 2 different data sets.
• Make sure the “Home” tab is selected
• Select columns A thru G
• Select “Sort & Filter” under “Home” tab, selecting “Custom Sort”
12
Excel 2010
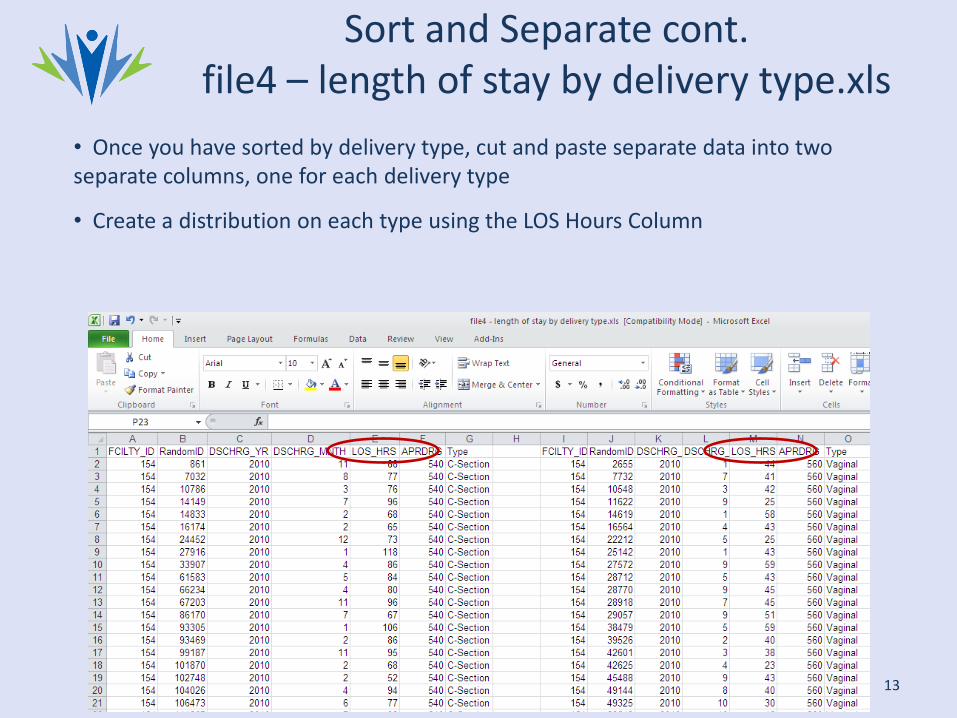
Sort and Separate cont.file4 – length of stay by delivery type.xls
• Once you have sorted by delivery type, cut and paste separate data into two separate columns, one for each delivery type
• Create a distribution on each type using the LOS Hours Column
13

Create Histograms and Distribution Using Your “Own” QI Project Data
1. Determine what data element(s) you would like to see todecide current status of your process
2. Spend time with data analyst to determine location andaccess to data
3. Create a dataset4. Create histograms from data sets5. Write brief statement on graph about data “findings”6. Bring graphs of “own” data to discuss in class