Embed Size (px)
Citation preview

Annual Report & Accounts for the year ended 30 September 2010TUI Travel PLCTUI Travel HouseCrawley Business QuarterFleming WayCrawleyWest SussexRH10 9QL
Telephone: 0044 (0)1293 645700
www.tuitravelplc.com
TUI Travel P
LC A
nnual Report & A
ccounts for the year ended 30 September 2010
We’re on a journey. Focused on delivery.
http://ara2010.tuitravelplc.com
Delivered by global3digital
Print managed by urban life support www.urbanlifesupport.co.uk
This document is printed on Chorus Silk, a paper containing 100% virgin fibre sourced from well-managed, sustainable, FSC certified forests. Printed by Park Communications on FSC® certified paper.
Park is an EMAS certified CarbonNeutral® Company and its Environmental Management System is certified to ISO 14001.
100% of the inks used are vegetable oil based, 95% of press chemicals are recycled for further use and, on average, 99% of any waste associated with this production will be recycled.
Photography supplied by TUI Travel businesses.
www.tuitravelplc.com
The investment caseReasons to invest in TUI Travel PLC (London Stock Exchange ticker code TT.)
Experienced management teamEach of our businesses is led by highly experienced management teams giving us real strength and depth of leadership. Our leaders have demonstrated excellent track records of building strong businesses and creating value.
Market-leading brandsWe have some of the most recognised and highly trusted brands in the industry, which reduces the cost of customer acquisition and means we are highly attractive to our accommodation providers and distribution partners.
Market-leading positionsWe are either the number one or number two tour operator in almost all of our mainstream source markets, including leadership positions in the UK, Germany, France, Belgium and the Netherlands.
Market consolidationConsolidation in some of our key markets has improved the structure of the industry, helping to remove excess supply from the market.
Economies of scaleWe buy over 150 million bednights per year, making us one of the largest distributors of accommodation globally. Our scale gives us a competitive advantage when negotiating with suppliers, allowing us to offer excellent value to our customers.
Turnaround potentialIn 2009, we identified £142m of turnaround opportunities as we took strategic actions to improve margins in a number of underperforming businesses. After delivering £53m of these in 2010, a further £89m of opportunities for margin improvement remains.
Exposure to higher growth specialist travelAlmost one third of our profits are generated by our portfolio of specialist businesses which enjoy high growth and margin characteristics, including specialist tour operators offering unique, experiential travel experiences and online accommodation providers.
Emerging marketsWe have established a significant presence in the fast-growing Russian and Ukrainian source markets, leaving us well positioned to take advantage of the potential in these markets. We have an existing presence in Brazil, China and India and are investigating the opportunities in these exciting markets.
www.tuitravelplc.com
Strategic overviewB
usiness performance
Governance
Financial statements
Shareholder information
TUI Travel PLC Annual Report & Accounts 2010 01G
roup at a glance
ifc Group at a glanceifc The investment case02 TUI Travel overview04 Our structure07 Financial highlights
08 Strategic overview08 Chairman’s statement09 Chief Executive’s statement10 Chief Executive’s interview12 Market overview14 Our strategy18 Key performance indicators20 Principal risks24 People27 Health and safety28 Sustainable development
32 Business performance32 Group performance33 Segmental performance40 Current trading
42 Governance42 Board of Directors44 Directors’ report47 Statement of Directors’ responsibilities48 Corporate Governance report53 Remuneration report63 Independent Auditors’ report
64 Financial statements64 Consolidated income statement65 Consolidated statement of
comprehensive income 66 Consolidated balance sheet67 Consolidated statement of changes in equity68 Consolidated statement of cash flows69 Notes to the consolidated financial statements136 Company balance sheet137 Notes to the Company’s financial statements
142 Shareholder information142 Shareholder profiles142 Contacts and advisers143 Shareholder discount144 Index
Contents
TUI Travel PLC is the world’s leading leisure travel company.
Find our 2010 Annual Report online at http://ara2010.tuitravelplc.com
The Annual Report contains forward-looking statements that are subject to risk factors associated with, amongst other things, the economic and business circumstances occurring from time to time in countries and Sectors in which the Group operates. It is believed that the expectations reflected in these statements are reasonable but they may be affected by a wide range of variables which could cause actual results to differ from those currently anticipated.
www.tuitravelplc.com
02 TUI Travel PLC Annual Report & Accounts 2010
Group at a glance
TUI Travel overview
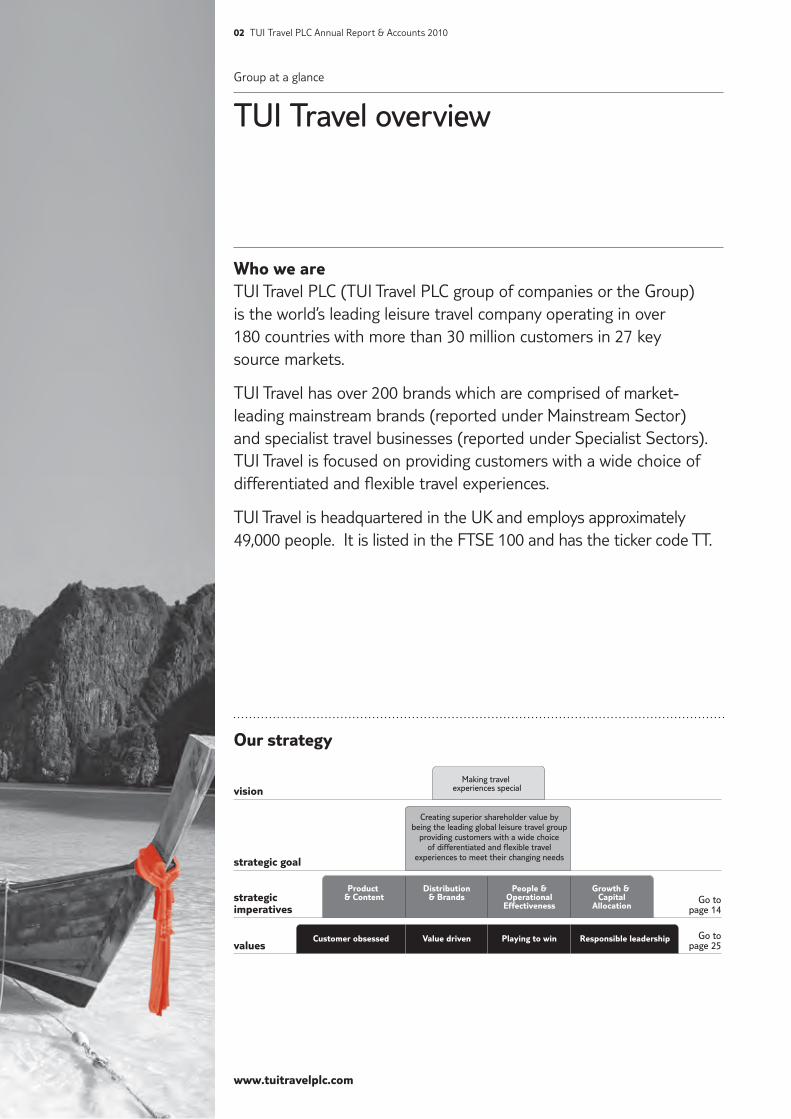
Who we areTUI Travel PLC (TUI Travel PLC group of companies or the Group) is the world’s leading leisure travel company operating in over 180 countries with more than 30 million customers in 27 key source markets.
TUI Travel has over 200 brands which are comprised of market-leading mainstream brands (reported under Mainstream Sector) and specialist travel businesses (reported under Specialist Sectors). TUI Travel is focused on providing customers with a wide choice of differentiated and flexible travel experiences.
TUI Travel is headquartered in the UK and employs approximately 49,000 people. It is listed in the FTSE 100 and has the ticker code TT.
Making travel experiences special
Creating superior shareholder value bybeing the leading global leisure travel group
providing customers with a wide choiceof differentiated and flexible travel
experiences to meet their changing needs
Product & Content
Distribution& Brands
People &Operational
Effectiveness
Growth & Capital
Allocation
Customer obsessed Value driven Playing to win Responsible leadership
vision
Go topage 14
Go topage 25
strategic goal
strategicimperatives
values
Our strategy
www.tuitravelplc.com
Group at a glance
Strategic overviewB
usiness performance
Governance
Financial statements
Shareholder information
TUI Travel PLC Annual Report & Accounts 2010 03
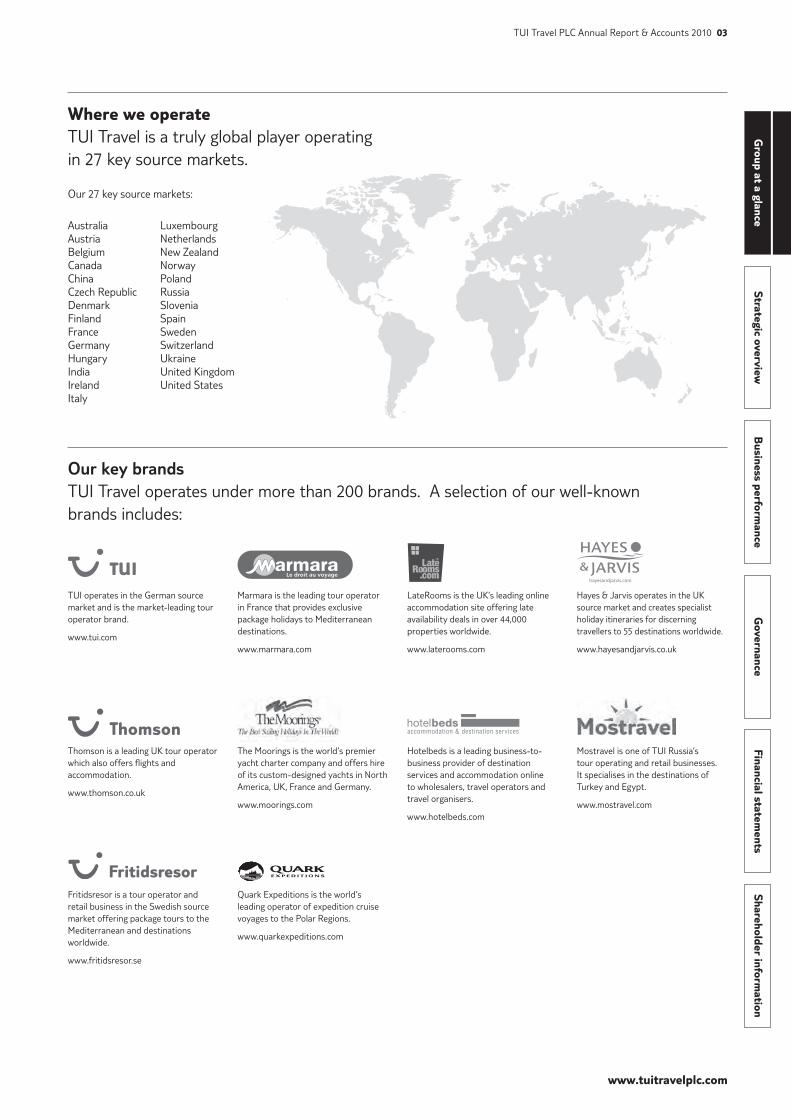
Where we operateTUI Travel is a truly global player operating in 27 key source markets.
Our 27 key source markets:
AustraliaAustriaBelgiumCanadaChinaCzech RepublicDenmarkFinlandFranceGermanyHungaryIndiaIrelandItaly
LuxembourgNetherlandsNew ZealandNorwayPolandRussiaSloveniaSpainSweden SwitzerlandUkraineUnited KingdomUnited States
Our key brandsTUI Travel operates under more than 200 brands. A selection of our well-known brands includes:
TUI operates in the German source market and is the market-leading tour operator brand.
www.tui.com
Thomson is a leading UK tour operator which also offers flights and accommodation.
www.thomson.co.uk
Fritidsresor is a tour operator and retail business in the Swedish source market offering package tours to the Mediterranean and destinations worldwide.
www.fritidsresor.se
Marmara is the leading tour operator in France that provides exclusive package holidays to Mediterranean destinations.
www.marmara.com
The Moorings is the world’s premier yacht charter company and offers hire of its custom-designed yachts in North America, UK, France and Germany.
www.moorings.com
Quark Expeditions is the world’s leading operator of expedition cruise voyages to the Polar Regions.
www.quarkexpeditions.com
LateRooms is the UK’s leading online accommodation site offering late availability deals in over 44,000 properties worldwide.
www.laterooms.com
Hotelbeds is a leading business-to-business provider of destination services and accommodation online to wholesalers, travel operators and travel organisers.
www.hotelbeds.com
Hayes & Jarvis operates in the UK source market and creates specialist holiday itineraries for discerning travellers to 55 destinations worldwide.
www.hayesandjarvis.co.uk
Mostravel is one of TUI Russia’s tour operating and retail businesses. It specialises in the destinations of Turkey and Egypt.
www.mostravel.com
www.tuitravelplc.com
04 TUI Travel PLC Annual Report & Accounts 2010
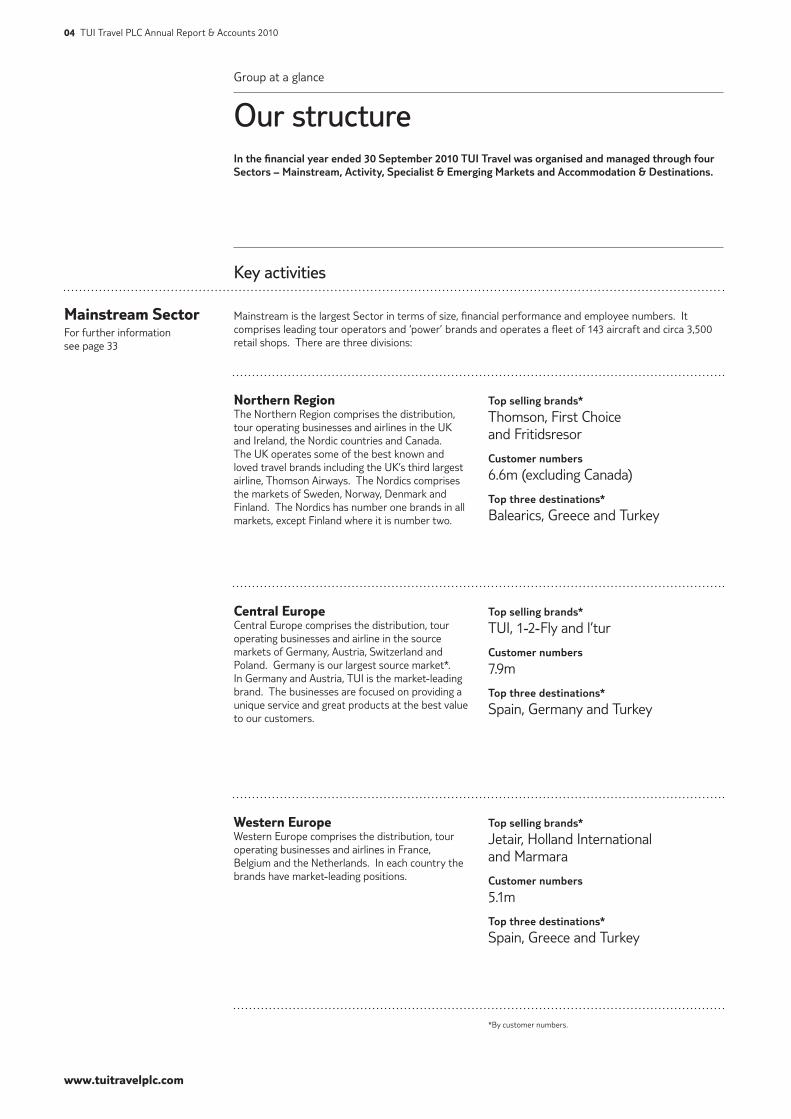
Mainstream is the largest Sector in terms of size, financial performance and employee numbers. It comprises leading tour operators and ‘power’ brands and operates a fleet of 143 aircraft and circa 3,500 retail shops. There are three divisions:
Group at a glance
Our structureIn the financial year ended 30 September 2010 TUI Travel was organised and managed through four Sectors – Mainstream, Activity, Specialist & Emerging Markets and Accommodation & Destinations.
Mainstream SectorFor further information see page 33
Key activities
Northern RegionThe Northern Region comprises the distribution, tour operating businesses and airlines in the UK and Ireland, the Nordic countries and Canada. The UK operates some of the best known and loved travel brands including the UK’s third largest airline, Thomson Airways. The Nordics comprises the markets of Sweden, Norway, Denmark and Finland. The Nordics has number one brands in all markets, except Finland where it is number two.
Top selling brands*
Thomson, First Choice and Fritidsresor
Customer numbers
6.6m (excluding Canada)
Top three destinations*
Balearics, Greece and Turkey
Central EuropeCentral Europe comprises the distribution, tour operating businesses and airline in the source markets of Germany, Austria, Switzerland and Poland. Germany is our largest source market*. In Germany and Austria, TUI is the market-leading brand. The businesses are focused on providing a unique service and great products at the best value to our customers.
Top selling brands*
TUI, 1-2-Fly and l’tur
Customer numbers
7.9m
Top three destinations*
Spain, Germany and Turkey
Western EuropeWestern Europe comprises the distribution, tour operating businesses and airlines in France, Belgium and the Netherlands. In each country the brands have market-leading positions.
Top selling brands*
Jetair, Holland International and Marmara
Customer numbers
5.1m
Top three destinations*
Spain, Greece and Turkey
*By customer numbers.
www.tuitravelplc.com
Group at a glance
Strategic overviewB
usiness performance
Governance
Financial statements
Shareholder information
TUI Travel PLC Annual Report & Accounts 2010 05
Key activities
Specialist & Emerging Markets SectorFor further information see page 39
The Specialist & Emerging Markets Sector is an international portfolio of travel businesses focusing on specific destinations, premium travel experiences or particular customer demographic segments often with differentiated and exclusive product. The Sector consists of 40 businesses operating from North America, Europe and, most recently, emerging markets such as Russia and Ukraine.
Top selling brands*
Mostravel, Turchese and Hayes & Jarvis
Customer numbers
0.8m (excluding Russia & Ukraine)
Top three destinations*
US, Egypt and Italy
Accommodation & Destinations SectorFor further information see page 37
The Accommodation & Destinations Sector (A&D) sells and provides a range of services in destination to tour operators, travel agents, corporate clients, and direct to the consumer worldwide. Services include hotel accommodation, transfers, excursions, round trips, organising meetings, incentives, conferences and events (MICE), cruise handling as well as integrated website solutions for our customers. A&D is structured along key business lines – Business to Business, Business to Consumer and Specialist.
Top selling brands*
World of TUI (umbrella brand for Group customers) including TUI España and TUI Hellas. Hotelbeds.com and LateRooms.com
Customer numbers/roomnights
29m (offline passengers 12.5m, room nights 16.8m)
Top three destinations*
Spain, UK and Portugal
*By customer numbers.
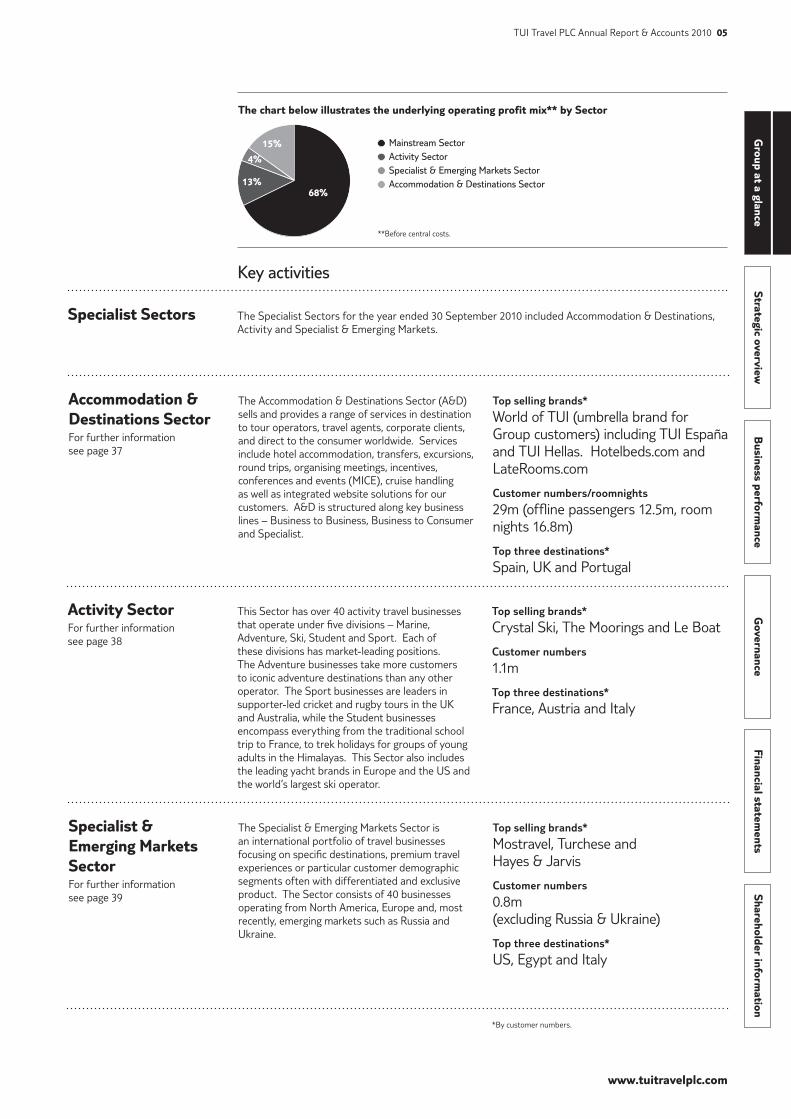
68%13%
4%
15% Mainstream SectorActivity SectorSpecialist & Emerging Markets SectorAccommodation & Destinations Sector
The chart below illustrates the underlying operating profit mix** by Sector
**Before central costs.
The Specialist Sectors for the year ended 30 September 2010 included Accommodation & Destinations, Activity and Specialist & Emerging Markets.
Specialist Sectors
This Sector has over 40 activity travel businesses that operate under five divisions – Marine, Adventure, Ski, Student and Sport. Each of these divisions has market-leading positions. The Adventure businesses take more customers to iconic adventure destinations than any other operator. The Sport businesses are leaders in supporter-led cricket and rugby tours in the UK and Australia, while the Student businesses encompass everything from the traditional school trip to France, to trek holidays for groups of young adults in the Himalayas. This Sector also includes the leading yacht brands in Europe and the US and the world’s largest ski operator.
Top selling brands*
Crystal Ski, The Moorings and Le Boat
Customer numbers
1.1m
Top three destinations*
France, Austria and Italy
Activity SectorFor further information see page 38

www.tuitravelplc.com
06 TUI Travel PLC Annual Report & Accounts 2010
Key activities
Accommodation & DestinationsThe A&D Sector is a leading player in the accommodation and destination services industry, competing in four key business lines:
Accommodation wholesaler – worldwide online hotel intermediary offering over 34,000 hotels, via the brands Hotelbeds, Bedsonline and Hotelopia.
Accommodation online travel agent – providing hotel rooms to the final customer through popular online brands LateRooms and AsiaRooms.
Destination services – providing services to customers when they arrive in-destination such as airport transfers, excursions or tour trips. These services are provided in 42 countries both to leisure travellers and to corporations. The brands include TUI España, TUI Hellas and Pacific World.
Cruise handling – offering turnaround services, excursions and port agency services to the main cruise lines on a global scale through the Intercruises brand.
Top selling brands*
World of TUI (umbrella brand for Group customers) including TUI España and TUI Hellas. Hotelbeds.com and LateRooms.com
Customer numbers/roomnights
29m (offline passengers 12.5m, room nights 16.8m)
Top three destinations*
Spain, UK and United States of America
Specialist & ActivityThis Sector is the world’s leading provider of specialist and experiential travel. It has over 100 specialist and activity brands delivering a range of unique customer experiences with the ethos of ‘if you can dream it, we can take you there.’ The Sector operates under six divisions – Adventure, Education, Marine, North American Specialist, Sport and Specialist Holiday Group.
Top selling brands*
Crystal, The Moorings and Hayes & Jarvis
Customer numbers
1.6m
Top three destinations*
France, Austria and Italy
Emerging MarketsEmerging Markets is a Sector in development at TUI Travel. It is a growing portfolio of travel businesses focusing on the specific source markets of Brazil, Russia and CIS, India and China. TUI Travel is the first international tour operator to build a presence in Russia and CIS. The TUI Russia & CIS brand was launched in March 2010. TUI Travel continues to investigate its optimal participation strategy for Brazil, India and China.
Russia & CIS division:
Top selling brands*
Mostravel, VKO Travel and Voyage Kiev
Customer numbers
0.5m
Top three destinations*
Turkey, Egypt and Greece
Group at a glance
Our structure (from 1 October 2010)TUI Travel PLC will continue to report in four Sectors. The Mainstream Sector remains unchanged. The remaining Sectors have been refined and renamed to reflect the strategic priorities of TUI Travel as it develops. These Sectors are now called Accommodation & Destinations, Specialist & Activity and Emerging Markets.
*By customer numbers.

www.tuitravelplc.com
Group at a glance
Strategic overviewB
usiness performance
Governance
Financial statements
Shareholder information
TUI Travel PLC Annual Report & Accounts 2010 07
Revenue
10 £13,525m -2%09 restated £13,851m
Underlying operating profit
10 £447m +11%09 restated £401m
Underlying profit before tax
10 £337m +4% 09 restated £324m
Underlying earnings per share
10 22.0p +10% 09 restated 20.0p
Dividend per share
10 11.0p +3% 09 10.7p
Underlying operating profit and underlying profit before tax are from continuing operations and exclude separately disclosed items, amortisation of acquisition related expenses, goodwill impairment and interest and taxation on the Group’s share of the results of joint ventures and associates. Underlying profit before tax also excludes separately disclosed financial expenses. Underlying earnings per share excludes the same items, net of related taxation.
The references to the financial results contained in pages 2 to 63 are unaudited pro forma results for the year, reported before the estimated financial impact of the closures of European airspace as a result of volcanic ash. See Note 1(B)(iii) on page 71 for basis of preparation of the pro forma financial information.
Group at a glance
Financial highlights
www.tuitravelplc.com
During the year we increased progress on the delivery of our synergy target of £200m and delivered £75m of incremental benefit in the full year. This has given us a total delivered benefit of £195m since the merger in September 2007. Progress on turning around some of our underperforming businesses in Mainstream is taking longer than originally anticipated but we remain confident that the drivers we have in place will deliver the targeted outcome. Overall growth in our Specialist Sectors remains strong and our joint venture in Russia and Ukraine has performed in line with our expectations.
ResultsThe Group has achieved an 11% increase in underlying operating profit of £447m (2009 restated: £401m) on revenue of £13,525m (2009 restated: £13,851m). Underlying profit before tax is up 4% to £337m (2009 restated: £324m). Underlying earnings per share increased 10% to 22.0p (2009 restated: 20.0p). The Group statutory loss before taxation was £36m (2009 restated: £94m).
DividendsThe Board is recommending a final dividend of 7.8p per share. On 11 May 2010, the Board recommended an interim dividend of 3.2p per share, thereby resulting in a full year dividend of 11.0p per share (2009: 10.7p). The Group has a progressive dividend policy and will look to maintain underlying dividend cover at just over two times.
BoardPost year end, on 21 October 2010, the Group announced that Paul Bowtell, Chief Financial Officer will leave the Board on 31 December 2010.
08 TUI Travel PLC Annual Report & Accounts 2010
Strategic overview
Chairman’s statementWe have delivered results in line with our expectations after experiencing another year of challenges. Not least, the closure of much of Northern Europe’s airspace in April when the Icelandic volcano, located below the Eyjafjallajoekull Glacier, erupted and created an enormous ash cloud in the atmosphere. This closure cost our Group £104m and affected some 400,000 of our customers. At a macro level, economic uncertainty and concern about how Governments are seeking to tackle deficits were also factors that we faced during the year.
On 30 November 2010, the appointment of Will Waggott as Chief Financial Officer of the Group was announced with immediate effect. Will is already a TUI Travel PLC Board member and was the Group’s Commercial Director.
Sustainable developmentFor TUI Travel, sustainability is an important business issue and opportunity. Our vision for sustainable development is to ‘make travel experiences special’ whilst minimising our environmental impact, respecting the culture and people in our destinations and offering real economic benefit to local communities. As a leading tour operator, our challenge is to prepare for a low-carbon society by further reducing our environmental impacts and as a business we are monitoring and preparing for regulatory proposals on climate change that could have a fiscal impact on our Group.
ColleaguesAs a Group we have circa 49,000 colleagues located across the world. Their hard work and dedication is much appreciated and, this year, our value of ‘customer obsessed’ was well and truly demonstrated by their actions throughout the closure of airspace in April. We received many communications from our customers about their outstanding efforts and, on behalf of the Board, I would like to thank them for their valued contribution to making our customers’ holiday experiences special.
Dr Michael FrenzelNon-Executive Chairman
Group at a glance
Strategic overviewB
usiness performance
Governance
Financial statements
Shareholder information
www.tuitravelplc.com
TUI Travel PLC Annual Report & Accounts 2010 09
new structure of the Group (see page 6) and succession planning.
We operate in a highly regulated industry and dialogue at both a national Government and European Commission level is an important aspect of our daily lives both at TUI Travel and as members of various industry and trade bodies. We believe that it is important that there is a level playing field across leisure travel companies, airlines and intermediaries and we work to ensure that our views are heard and understood not only in our source markets but also in the destinations we operate in. For more information see page 12.
This year we have made progress on delivering our strategic imperatives, albeit not as great as we would have wished. We know what we need to do to deliver long-term sustainable growth and have identified the levers with which to do that (see strategic imperatives page 14). Trading in the new financial year has started well but we believe that, given that it is so early in the year and economic uncertainty remains, it is prudent to be cautious about our outlook.
In a year when our 49,000 colleagues have dealt with so many external and internal challenges, I would like to thank them personally for all their efforts. We have an outstanding team that delivers day-in day-out and I am extremely proud of what they achieve and of all the businesses that make up TUI Travel.
Peter LongChief Executive
As the world’s leading leisure travel company, this financial year we have faced headwinds both within and outside of our control including volcanic ash, economic uncertainty (see page 10) and one instance of our own making.
We identified that, over a number of years, within TUI UK & Ireland, there was a failure to reconcile balances adequately in legacy systems in the retail and tour operator businesses. This has resulted in us having to write off £117m of irrecoverable balances. We are, therefore, restating our 2009 full year results with a reduction of underlying operating profit of £42m to £401m and a reduction in the underlying earnings per share of 3.8p from 23.8p to 20.0p. We have also reduced our opening reserves at 1 October 2008 by £70m from £2,596m to £2,526m. A full and detailed audit and business review has been undertaken and we are confident that we have now rectified the weaknesses.
Having experienced some exceptional external challenges, the Summer season traded out strongly across the Group. It was, however, not sufficient to recover the increased losses and costs from earlier in the year. We have experienced a later booking curve due, in principle, to the economic uncertainties that our customers have continued to face. This is one of the reasons why it is so important that we relentlessly focus on our strategic imperatives to ensure that we are able to deliver on our strategic goal.
As part of the focus during the year we made a number of changes to our Group Management Board (see page 24). These changes reflect the
View the CEO’s interview onlineWatch the CEO’s interview online at http://ara2010.tuitravelplc.com
Strategic overview
Chief Executive’s statement Following the success last year of launching our Annual Report & Accounts fully online we are doing the same this year with improvements to the functionality of the website and to the content. Reducing our environmental impact is important to us and the fact that more than 70% of our shareholders elect to receive the Annual Report & Accounts online proves that it is important for our stakeholders as well.
www.tuitravelplc.com
10 TUI Travel PLC Annual Report & Accounts 2010
This year has been a difficult one for TUI Travel. Could you sum it up for us?
We started the year off well in terms of trading despite the fact that there was some bad weather in January which disrupted our programme. That was nothing compared to what we then had to deal with during April when we had the closure of airspace and all of our 143 aeroplanes were grounded for over a week. Circa 400,000 guests were affected either by cancellations or having to be repatriated from their holidays. This was a huge level of disruption but I think what we demonstrated as an organisation was our absolute professionalism to repatriate all our customers whilst causing them the minimum amount of disruption. Our customers were extremely grateful and had high regard for the professionalism of our staff within our Company.
After the General Election we had further closure of airspace and that really did start to spook our customers because they were unsure as to whether they could be stranded when they were on holiday. This clearly had a negative effect and a number of our customers took the decision to delay their bookings and that had a very adverse impact on our business.
I think we then went on to have the perfect storm because of ash, the General Election, the emergency budget and the World Cup – all these elements caused disruption in terms of our customers’ normal booking patterns. After the World Cup we saw a resumption in terms of demand and, as we went through the high season, we had very strong sales which I think confirmed the importance customers place on their main summer holiday and that it’s a must-have, but when they book depends on the circumstances prevailing at the time. We were unable to recover the impact of this perfect storm during the months of May, June and particularly in early July.
As we went through our audit process we also uncovered some control issues within the Group in our UK business. We found that our tour operating and retail systems were not being properly reconciled and that there was an overstatement of revenue. This has now been fully investigated and controls have been put in place to ensure that this will not reoccur again. We have also undertaken a full review of financial controls across the Group and I am satisfied that this event has not occurred in any other part of our business.
We continue to see smaller tour operators and airlines across Europe going out of business. What does that say about the quality of the tour operating industry?
I think firstly it says that there has been weakness of demand and the smaller companies suffer more. Invariably the smaller companies that have failed have not had appropriate capital structures and, as a consequence, I think we will now be a major beneficiary as customers migrate away from the smaller companies to those larger international organisations which are well financed, have been trading for decades and have very strong reputations. I believe, therefore, that we can capitalise on this and there is an important message that we give to our customers – when you book with us you have peace of mind. We have the experience, we have the depth of management, the choice of holidays and most importantly, we have the financial strength to ensure that we will deliver you a great holiday.
You launched TUI Russia & CIS this year. How is that area of the business performing?
We’re very excited by the opportunity within Russia. There is a huge emerging middle class who like to travel and they like to go to sun and beach destinations. Obviously being geographically located in the Northern hemisphere where the weather, particularly in the Winter, is severe, it plays very much to our strengths in terms of selling and delivering sun and beach holidays to large volumes of customers in a very efficient way. We have partnered with a Russian partner – we think this is very important as we get to know and understand the different culture that we operate in and we’re very happy in terms of the partnership that we have.
We launched the TUI brand, bringing TUI as a consumer brand to Russia in March and that has been very well received within the Russian market. So we are excited by the opportunities but we are also realists and know that this is a market that is going to have very strong growth characteristics but it will be some time before we see the profitability that we enjoy within the European markets. Our investment to date has been modest so the risk profile is right but we’re there, we have the platform and the Russian market could grow to be one of our biggest markets within our Group.
Strategic overview | Chief Executive’s interview
An interview with Chief Executive, Peter Long
Group at a glance
Strategic overviewB
usiness performance
Governance
Financial statements
Shareholder information
www.tuitravelplc.com
TUI Travel PLC Annual Report & Accounts 2010 11
and First Choice, and that is where the bulk of the synergies have come from. In terms of growth opportunities, there are a number of areas, firstly continuing to improve the underperforming businesses such as Corsair. I am delighted that we have now agreed a new social plan with all our colleagues at Corsair to create a viable business going forward and we will implement that restructuring over the next 24 months.
We are also looking at further improvements within our German and UK businesses, particularly in the area of new systems which will improve the efficiency of our business. The other key aspect of our business is having more unique holiday experiences, those differentiated holidays. We will continue to introduce more concept hotels that will enable us to increase the number of customers going on holiday with us within our mainstream businesses. Equally, we also have good growth opportunities across all our specialist businesses where there is now a growing demand for different types of holidays, the non-sun and beach. That might be a sailing holiday, a walking holiday or a Polar expedition cruise. Customers are looking to do different things and we have this very broad portfolio of unique specialist holidays within the Group.
One of your values is responsible leadership. How do you put this into practice in the Group?
We’re very focused on sustainable tourism and we’re looking constantly at ways of reducing the level of carbon emissions as we transport and take our customers on holiday. One way we do this is by having one of the most modern aircraft fleets in the world. We continue to invest in new aircraft types and we’re very excited about the delivery of our new 787 Dreamliners which come into the fleet in 2012. They burn 20% less fuel than the 767 fleet we currently operate.
A very important part of our organisation, absolutely key, is our leadership and the senior management team that run and operate our businesses and motivate and manage our colleagues. We continually also look to develop talent within the organisation because one of the critical success factors within our business is ensuring we have the right management in the right place to continue to build and grow our businesses.
Peter LongChief Executive
You have changed the structure of the Group (from 1 October 2010). Why have you done that?
We’ve modified the structure. We’ve got our three regional geographies for our mainstream business – no change at all. I’ve taken the Specialist and Activity Sectors and merged them into one. The other part of the specialist business was Emerging Markets and that is now a Sector in its own right because we want to be focusing on the opportunities in Russia which I have already alluded to but we’re also looking at the other BRIC economies of India, China and Brazil. Our Accommodation & Destinations Sector remains unchanged.
Are you worried about the low-cost carriers becoming tour operators and how will you counter the threat of the online travel agents (OTAs)?
We continue to look at all our competition. One of the greatest strengths that we have as an organisation is the fact a large proportion of the holidays we offer are unique experiences that our customers can only book with us and that gives us a platform to set us aside from the rest of our competitors. With regard to the low-cost carriers, one of the areas implemented during Summer 2010 was a greater choice for our customers in terms of the duration of holidays. We’ve introduced 10 and 11 nights on top of our existing seven and 14-night offerings. They have proved to be very popular and we will continue to offer further different duration lengths in order to give our customers the greatest choice of holiday experiences.
With regard to online travel agents, I think we compete in two different ways within our mainstream businesses and, taking the UK as an example, 40% of our bookings are transacted online. We are also in the online travel agent space in the specialist area which is accommodation only and we have two very important businesses within the Group which are LateRooms and AsiaRooms and these businesses are extremely successful and growing very rapidly.
You have all but delivered the synergies identified at the time of merger. How are you going to grow the business going forward?
I am very pleased with the success of the integration of our two UK businesses, Thomson
View the CEO’s interview onlineWatch the CEO’s interview online at http://ara2010.tuitravelplc.com
www.tuitravelplc.com
12 TUI Travel PLC Annual Report & Accounts 2010
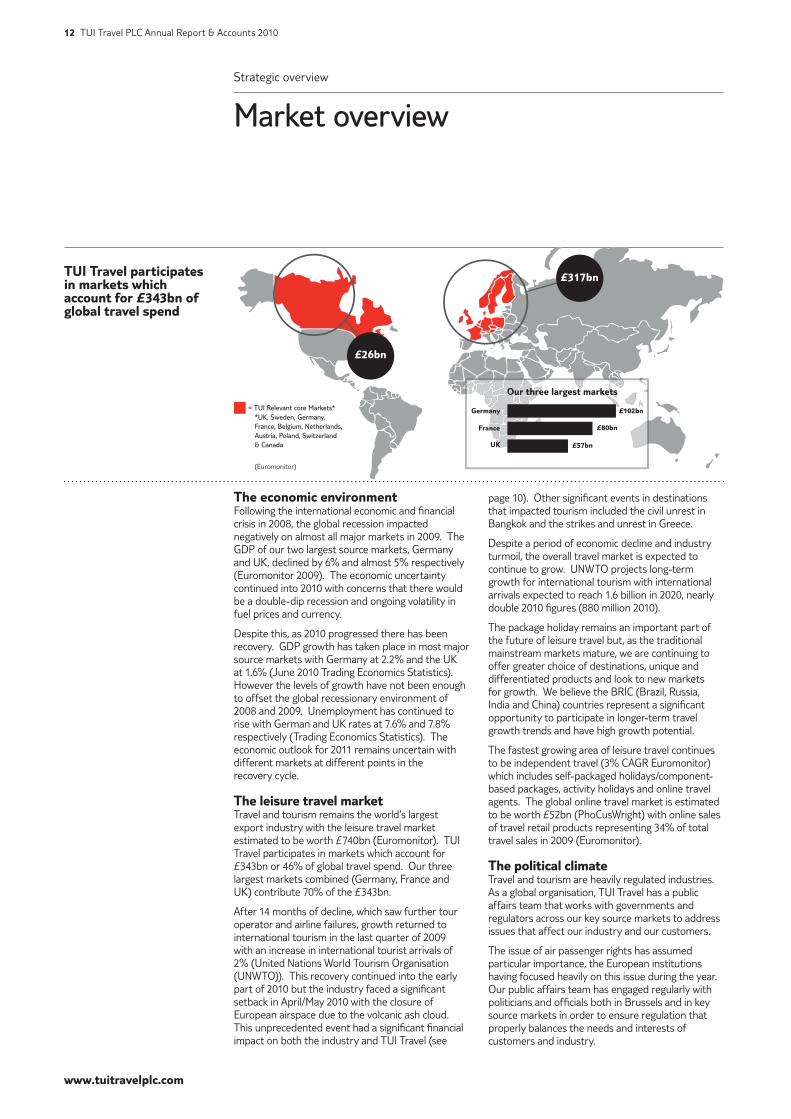
TUI Travel participates in markets which account for £343bn of global travel spend
page 10). Other significant events in destinations that impacted tourism included the civil unrest in Bangkok and the strikes and unrest in Greece.
Despite a period of economic decline and industry turmoil, the overall travel market is expected to continue to grow. UNWTO projects long-term growth for international tourism with international arrivals expected to reach 1.6 billion in 2020, nearly double 2010 figures (880 million 2010).
The package holiday remains an important part of the future of leisure travel but, as the traditional mainstream markets mature, we are continuing to offer greater choice of destinations, unique and differentiated products and look to new markets for growth. We believe the BRIC (Brazil, Russia, India and China) countries represent a significant opportunity to participate in longer-term travel growth trends and have high growth potential.
The fastest growing area of leisure travel continues to be independent travel (3% CAGR Euromonitor) which includes self-packaged holidays/component-based packages, activity holidays and online travel agents. The global online travel market is estimated to be worth £52bn (PhoCusWright) with online sales of travel retail products representing 34% of total travel sales in 2009 (Euromonitor).
The political climateTravel and tourism are heavily regulated industries. As a global organisation, TUI Travel has a public affairs team that works with governments and regulators across our key source markets to address issues that affect our industry and our customers.
The issue of air passenger rights has assumed particular importance, the European institutions having focused heavily on this issue during the year. Our public affairs team has engaged regularly with politicians and officials both in Brussels and in key source markets in order to ensure regulation that properly balances the needs and interests of customers and industry.
The economic environmentFollowing the international economic and financial crisis in 2008, the global recession impacted negatively on almost all major markets in 2009. The GDP of our two largest source markets, Germany and UK, declined by 6% and almost 5% respectively (Euromonitor 2009). The economic uncertainty continued into 2010 with concerns that there would be a double-dip recession and ongoing volatility in fuel prices and currency.
Despite this, as 2010 progressed there has been recovery. GDP growth has taken place in most major source markets with Germany at 2.2% and the UK at 1.6% (June 2010 Trading Economics Statistics). However the levels of growth have not been enough to offset the global recessionary environment of 2008 and 2009. Unemployment has continued to rise with German and UK rates at 7.6% and 7.8% respectively (Trading Economics Statistics). The economic outlook for 2011 remains uncertain with different markets at different points in the recovery cycle.
The leisure travel marketTravel and tourism remains the world’s largest export industry with the leisure travel market estimated to be worth £740bn (Euromonitor). TUI Travel participates in markets which account for £343bn or 46% of global travel spend. Our three largest markets combined (Germany, France and UK) contribute 70% of the £343bn.
After 14 months of decline, which saw further tour operator and airline failures, growth returned to international tourism in the last quarter of 2009 with an increase in international tourist arrivals of 2% (United Nations World Tourism Organisation (UNWTO)). This recovery continued into the early part of 2010 but the industry faced a significant setback in April/May 2010 with the closure of European airspace due to the volcanic ash cloud. This unprecedented event had a significant financial impact on both the industry and TUI Travel (see
Strategic overview
Market overview
£317bn
£26bn
Our three largest markets
France
UK
Germany
£80bn
£57bn
£102bn= TUI Relevant core Markets**UK, Sweden, Germany,France, Belgium, Netherlands,Austria, Poland, Switzerland& Canada
(Euromonitor)

Group at a glance
Strategic overviewB
usiness performance
Governance
Financial statements
Shareholder information
www.tuitravelplc.com
TUI Travel PLC Annual Report & Accounts 2010 13
All-inclusive packages and cruising proved particularly popular as consumers sought financial certainty of their total holiday spend.
The destinations of Morocco, Egypt and Turkey continued to grow strongly in popularity due to favourable currency rates. Departures to the Eurozone decreased but these destinations still attracted the largest percentage of mainstream package holidaymakers. Long-haul destinations, including Thailand and Goa, remained popular and particularly those destinations offering all-inclusive products.
With high internet penetration rates (UK, Nordics and Germany at 75%) consumers increasingly turned online to research and book their holiday. Social media and customer travel review sites gained in popularity and prominence and are a key influencer on the consumer’s decision making process.
Despite the tough conditions, there is evidence that consumers are feeling more positive about their holiday plans for next year and demand for holidays remains healthy. Increased flexibility in duration and ease of booking for consumers remain key factors in the holiday-making decision process. Recent consumer research, commissioned by TUI Travel across its major source markets, shows planned holiday spending has either slightly increased or remained stable compared to consumer sentiment in September 2009 (TUI consumer sentiment monitor October 2010).
Outlook, future trends and factorsTUI Travel has continued to prove resilient in these challenging times and maintains its market-leading position. TUI Travel has a 35% share of the European package holiday market and number one or two brand positions in its core mainstream markets.
In the BRIC economies, TUI Travel’s participation strategy is most developed in Russia and Ukraine where it is the first international tour operator to build a presence. TUI Travel continues to investigate its optimal participation strategy for Brazil, India and China.
In independent travel, TUI Travel has significant positions in a number of segments including online accommodation, marine, adventure, education, language travel, ski, sport and specialist holidays and plans to continue to grow this portfolio of businesses. TUI Travel has a strong online presence for package holidays, independent travel and online accommodation sites and continues to review growth opportunities in the online arena.
Given the continued economic uncertainty we remain cautious about 2011. That said, there is every reason to believe that the demand for international travel will continue to grow strongly in the long term.
The question of aviation taxation has also figured prominently in a number of jurisdictions and we have, together with trade associations and other industry partners, sought to press our case for a more equitable taxation regime that properly rewards and incentivises efficient use of aircraft.
Financial protection of air passengers continues to be an issue, particularly in the UK, and we have continued to lobby stakeholders to ensure a fair and affordable system of protection.
Finally, our work to influence the European Commission to extend the scope of the European Package Travel Directive in order to reflect the changes in the industry, since the inception of that regulation, has continued to gather pace.
The sustainability challengeTravel and tourism accounts for 11% of the world’s GDP and 12% of its exports.1 Around 50 of the world’s least developed countries rely largely on tourism for economic development. However, travel and tourism are responsible for around 5% of global carbon dioxide emissions2 and increasingly national and international carbon legislation is coming into force.
As a leading tour operator TUI Travel aspires to lead the travel and tourism sector and to lobby for sustainability to be embraced as a business issue on which the future health of the industry depends. As a tourism group we take our responsibilities very seriously and are working to ensure that sustainable development aligns with the Group’s key strategic imperatives. Our challenge is to understand how our industry can optimise its social, economic and environmental benefits for all concerned. TUI Travel’s goal in this respect is to make travel experiences special by providing holidays that cause minimal environmental impact, respect the culture and people of destinations and offer real economic benefit to local communities. See Sustainable Development on page 28.
Consumer sentimentThe global recession and uncertain economic environment have had an effect on consumer travel spending habits in 2009/10, however, for most consumers holidays continue to be of considerable importance and a planned annual expense.
Consumers are more discerning in their choice of holidays, looking for a greater variety of products and destinations, flexibility of duration and value for money. Consumers prioritised their main summer holiday abroad and waited much later to book their trips to assess both the weather at home and their personal finances.
The package holiday saw a resurgence, as consumers sought to de-risk their holidays and book with a company that provided financial protection.
1 United Nations World Tourism Organisation (UNWTO) Tourism Satellite Accounts (TSA).
2 United Nations World Tourism Organisation (UNWTO), United Nations Environment Programme (UNEP) and World Meteorological Organization (WMO) (October 2007) Climate Change and Tourism: Responding to Global Challenges. Madrid.
www.tuitravelplc.com
14 TUI Travel PLC Annual Report & Accounts 2010
Summary
• Different products to our competitors and unique in the marketplace
• High customer retention and repeat booking rates
• Earlier booking trends
• Product innovation
• Growth in the online accommodation market
Differentiated content continues to be a central pillar of our product and content strategy. We are developing a portfolio of exclusive products that no competitor can easily match or replicate and which is tailored to include additional services and facilities that customers want on their holiday. Every one of our businesses offer products that are tailored to meet the holiday needs and tastes of its customers.
In the Mainstream Sector, the level of differentiated product has again increased over the last year and currently represents 38% of total holidays. We have specific targets in each Sector to continue to increase this level of differentiation and are constantly reviewing and evolving product content. This year we have expanded our offering of Mainstream differentiated products. In the UK, Sensatori Tenerife was opened following the successful introduction of this five-star concept in Crete and Mexico over the last two years and the First Choice Holiday Villages’ portfolio was also expanded by two further Holiday Villages. In the Nordics three new family-focused Blue Villages were opened. In Germany we continue to experience strong demand for our new hotel brand Sensimar, a five-star spa concept for couples and Robinson clubs for families. In France, product differentiation continues with the launch of new Marmara Clubs in new destinations (e.g. Sardinia) and the roll-out of the new generation of Nouvelles Frontières hotel clubs.
The portfolio of differentiated content not only increases our competitive advantage by distinguishing us from the competition, it also drives higher margins, underpinning our plans to improve underlying operating margins. Differentiated products have an earlier booking profile which increases yields and removes pressure in the lates market, while customers also benefit from a more added-value, unique experience. Feedback shows that customers appreciate the quality and value of these products and higher satisfaction levels drive repeat bookings and customer retention.
There is also a huge demand from consumers for more experiential holidays. In the Specialist Sectors product innovation continues to meet this demand. We have created the world’s largest marine charter business and are developing a number of new yachts that are built exclusively for our marine businesses, including the new Sunsail 384 Catamarans. These new models create a leading and differentiated position in the fastest expanding section of the yacht charter market. There is also a strong focus in the Education division to develop new and differentiated products. The purchase of Condover Hall, an education campus in the UK, provides our JCA business, a specialist in residential school trips, with a flagship centre for residential activity holidays for schools and will be utilised across the wider Education division.
In the OTA market we are building on the success of LateRooms, our online accommodation business, by investing in increasing the product offering of our AsiaRooms brand. We have increased our own hotel inventory in the Asian region by 62% (7,800 hotels) and rebranded the website to capture the significant forecasted growth in this market.
Strategic overview | Our strategy
Strategic imperativesWe have a clear strategic goal to create superior shareholder value by being the world’s leading leisure travel group providing customers with the widest choice of differentiated and flexible travel experiences to meet their changing needs. To help achieve our goal, we are focused on four strategic imperatives – Product & Content, Distribution & Brands, People & Operational Effectiveness and Growth & Capital Allocation. We continually evaluate the delivery of these four strategic imperatives which link through to our key performance indicators. See KPIs on page 18.
Imperative 1: Product & Content
Group at a glance
Strategic overviewB
usiness performance
Governance
Financial statements
Shareholder information
www.tuitravelplc.com
TUI Travel PLC Annual Report & Accounts 2010 15
Summary
• Highly trusted brands that provide value and quality
• Broadening customer choice
• Building our customer relationships
• Increasing controlled distribution
Our highly trusted brands represent excellent value for money and drive customer loyalty and repeat bookings. The advantages of travelling with a leading tour operator were highlighted during the April 2010 volcanic ash crisis when we prioritised the needs of our customers and provided industry-leading levels of service and support. We have market-leading brands in the Mainstream Sector including TUI, Thomson, First Choice, Jetairfly, Fritidsresor, Holland International, Arke, Nouvelles Frontières and Marmara. In the Specialist Sectors we have well-known niche brands that have market-leading positions including Hayes & Jarvis, Sovereign, Citalia, The Moorings, Crystal Ski, LateRooms.com and Hotelbeds.com.
Our aim is to provide customers with a wide choice of holiday options that meet their preferences and a convenient range of booking options. By securing direct access to customers, we can manage and deliver the whole holiday experience from booking with an agent in our travel shops, online or via one of our call centres, to in-resort and after-sales service, whilst driving customer satisfaction and ultimately customer loyalty.
In each source market the distribution of products is tailored to reflect different customer preferences and market dynamics. Each source market has its own distribution strategy, which aims to reduce costs by building controlled distribution through the efficient operation of retail shops, the use of the internet as a research and booking tool and by the utilisation of call centres.
In the Mainstream businesses our leading brands drive bookings through controlled distribution capability which is made up of three main channels; a retail network of circa 3,500 shops, an online booking capability for all major brands and call centres. In the UK and Nordics for instance, where there is a high propensity to purchase online, we have invested heavily in web capability. In the Nordics we have ceased production of traditional brochures from Summer 2011 and are promoting online as the main distribution channel. In the UK, the trend towards online booking continues, supported by improvements to the functionality of the Thomson and First Choice websites and the success of the ‘MyThomson’ portal allowing customers to manage bookings online. In France, there is a higher propensity to purchase through more traditional travel agents and we are expanding our retail network both through owned and franchise agencies. We have also increased controlled distribution for the Nouvelles Frontières and Marmara brands by building their internet offering and selling our Marmara brand through our network of Nouvelles Frontières shops and Havas Voyages retail stores.
In the Specialist businesses, we are focusing on increasing the share of direct distribution to reduce distribution costs and to increase direct access to customers. Our Adventure division is making wider use of our existing retail network and is cross-selling product between brands. New websites have been developed for a number of brands including The Moorings, Quark Expeditions and TUI Ski to further improve the customer experience and to increase the level of controlled distribution.
The LateRooms brand has a strong leadership position in the UK OTA accommodation market (room night growth of 31% year-on-year) and we are starting to roll out our successful LateRooms model to Continental Europe and Australia.
Imperative 2: Distribution & Brands
www.tuitravelplc.com
16 TUI Travel PLC Annual Report & Accounts 2010
Summary
• Our colleagues are key to our success
• Development of sophisticated capacity and yield management systems
• Underlying operating profit margin up 40 basis points from 2.9% (2009 restated) to 3.3%
• Integration progressing well with a total synergies target of £200m
The skills and expertise of our colleagues are the key to our success. Across the Group we have a unique breadth and depth of experience with innovative entrepreneurs in our specialist businesses, skilled tour operators in Mainstream, functional experts at the centre and a highly experienced and respected international management team. Our aim is to motivate and engage our teams to deliver outstanding customer experiences and results for our businesses. Talent across the Group is reviewed regularly with a focus on retaining and developing individuals to drive the business forward (see page 24).
Our tour operators actively manage capacity through sophisticated capacity and yield management systems. The UK Mainstream business has a market-leading yield system to plan and manage capacity allowing us to analyse profitability for Thomson and First Choice by creating a detailed picture of profitable capacity by individual flight. This allows us to determine optimum seat capacity by each UK airport and to ensure that we maintain the most appropriate aircraft fleet size and type. This has enabled us to leverage the strength of both these brands by improving efficiency with fewer aircraft and less risk. Our other businesses are also beginning to implement this system; in the Activity Sector, the ski business has fully implemented the same yield management tool driving further improvements in margin.
We have made excellent progress in delivering cost synergies with £195m achieved to date and maintaining our target of £200m by 2011. In addition to the delivery of these cost synergies, the businesses are continually working to leverage their market-leading positions and scale to maximise their cost competitiveness and rationalise the cost base further through the continual improvement of business processes and systems. We are also further reviewing options to reduce the number of reservation and back office systems in the Mainstream businesses.
Strategic overview | Our strategy
Strategic imperatives continued
Imperative 3: People & Operational Effectiveness
Group at a glance
Strategic overviewB
usiness performance
Governance
Financial statements
Shareholder information
www.tuitravelplc.com
TUI Travel PLC Annual Report & Accounts 2010 17
Summary
• Acquired six niche high-growth businesses in Specialist Sectors
• Creating a leading position in Russia and CIS
• Underlying operating profit up 11% to £447m
• Increase in return on invested capital to 9.9%
We have identified a number of market segments where we can allocate capital to drive growth. These target market segments, primarily within our Specialist Sectors, are high-growth and high-margin and present excellent opportunities for us to create leading positions in fragmented markets. These segments offer significant potential for further growth and we are creating market-leading positions by a combination of the acquisition of complementary businesses and organic growth in our existing businesses. We have completed eight acquisitions this year, six in the Specialist Sectors, and will continue to make bolt-on acquisitions in targeted Specialist businesses.
Further organic long-term growth will be achieved through the continued introduction of some of our Specialist brands into new markets utilising our distribution strength, including our pan-European retail estate of circa 3,500 branches. For example, we have launched the best of our Marine, Adventure and Polar Cruising products into Germany, Russia and Ukraine. Following the successful launch of Le Boat within our German retail operation, we have positioned this customer offering in the Dutch and Belgian markets.
As the leading international leisure travel group we are well placed to benefit from the strong increase in demand for leisure travel in emerging markets to generate long-term growth for the Group. Our strategy within Russia and CIS has been the main area of focus and our growth plans are progressing well. We entered the Russia and Ukraine markets through the establishment of a joint venture with S-Group Capital Management and have subsequently completed three acquisitions. The acquisitions of VKO Group and Mostravel in Russia and Voyage Kiev in Ukraine have provided us with a strong entry point into this market. TUI Travel is the first international tour operator to build a presence in Russia and CIS and we successfully launched the
TUI brand into the market in March 2010. We have an existing presence in Brazil, China and India, through our inbound and destination management companies in the A&D Sector, and continue to build our understanding of these leisure travel markets. We are currently evaluating our optimal participation strategy for each market and discussing future collaboration opportunities with potential partners. It is our intention to further expand in these markets to create long-term sustainable growth for TUI Travel on a global scale.
We continue to believe that the Boeing 787 Dreamliner represents a fantastic opportunity to deliver long-term growth for the Group. Not only will it be able to fly greater distances, enabling us to offer a wider range of non-stop destinations to our customers than equivalent aircraft today, but it will do so with greater fuel efficiency and additional comfort. As one of the first airlines to take delivery of these aircraft we plan to use the customer and operational benefits to position the long-haul offering as a key differentiator in Europe allowing us to develop a pre-eminent position in the long-haul charter market.
We have an asset-right business model and typically only invest in assets such as yachts, inland waterway cruisers and expedition cruise ships that provide us with greater competitive advantage and enable us to earn premium margins. As a result of our asset-right business model, delivery against our strategic imperatives driving underlying margin enhancement and delivery of synergy benefits of £200m, we remain confident of delivering our medium-term margin targets. Despite tough economic conditions and industry turmoil, we have made significant progress in realising these key objectives improving operating margins by 40 basis points to 3.3% (2009 restated: 2.9%) and return on invested capital to 9.9% (2009 restated: 8.6%).
Imperative 4: Growth & Capital Allocation
www.tuitravelplc.com
18 TUI Travel PLC Annual Report & Accounts 2010
Strategic overview
Key Performance Indicators (KPIs)
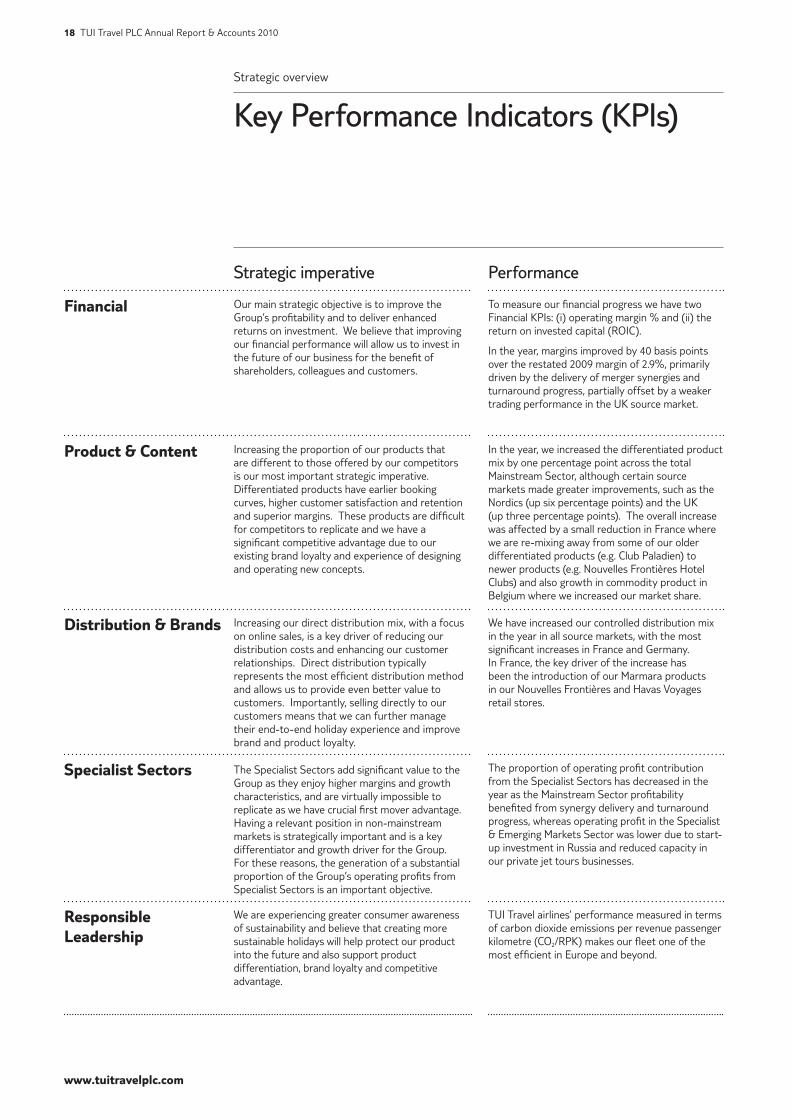
Our main strategic objective is to improve the Group’s profitability and to deliver enhanced returns on investment. We believe that improving our financial performance will allow us to invest in the future of our business for the benefit of shareholders, colleagues and customers.
To measure our financial progress we have two Financial KPIs: (i) operating margin % and (ii) the return on invested capital (ROIC).
In the year, margins improved by 40 basis points over the restated 2009 margin of 2.9%, primarily driven by the delivery of merger synergies and turnaround progress, partially offset by a weaker trading performance in the UK source market.
Increasing the proportion of our products that are different to those offered by our competitors is our most important strategic imperative. Differentiated products have earlier booking curves, higher customer satisfaction and retention and superior margins. These products are difficult for competitors to replicate and we have a significant competitive advantage due to our existing brand loyalty and experience of designing and operating new concepts.
In the year, we increased the differentiated product mix by one percentage point across the total Mainstream Sector, although certain source markets made greater improvements, such as the Nordics (up six percentage points) and the UK (up three percentage points). The overall increase was affected by a small reduction in France where we are re-mixing away from some of our older differentiated products (e.g. Club Paladien) to newer products (e.g. Nouvelles Frontières Hotel Clubs) and also growth in commodity product in Belgium where we increased our market share.
Increasing our direct distribution mix, with a focus on online sales, is a key driver of reducing our distribution costs and enhancing our customer relationships. Direct distribution typically represents the most efficient distribution method and allows us to provide even better value to customers. Importantly, selling directly to our customers means that we can further manage their end-to-end holiday experience and improve brand and product loyalty.
We have increased our controlled distribution mix in the year in all source markets, with the most significant increases in France and Germany. In France, the key driver of the increase has been the introduction of our Marmara products in our Nouvelles Frontières and Havas Voyages retail stores.
The Specialist Sectors add significant value to the Group as they enjoy higher margins and growth characteristics, and are virtually impossible to replicate as we have crucial first mover advantage. Having a relevant position in non-mainstream markets is strategically important and is a key differentiator and growth driver for the Group. For these reasons, the generation of a substantial proportion of the Group’s operating profits from Specialist Sectors is an important objective.
The proportion of operating profit contribution from the Specialist Sectors has decreased in the year as the Mainstream Sector profitability benefited from synergy delivery and turnaround progress, whereas operating profit in the Specialist & Emerging Markets Sector was lower due to start- up investment in Russia and reduced capacity in our private jet tours businesses.
We are experiencing greater consumer awareness of sustainability and believe that creating more sustainable holidays will help protect our product into the future and also support product differentiation, brand loyalty and competitive advantage.
TUI Travel airlines’ performance measured in terms of carbon dioxide emissions per revenue passenger kilometre (CO2/RPK) makes our fleet one of the most efficient in Europe and beyond.
Financial
Product & Content
Distribution & Brands
Specialist Sectors
Responsible Leadership
Strategic imperative Performance
Group at a glance
Strategic overviewB
usiness performance
Governance
Financial statements
Shareholder information
www.tuitravelplc.com
TUI Travel PLC Annual Report & Accounts 2010 19
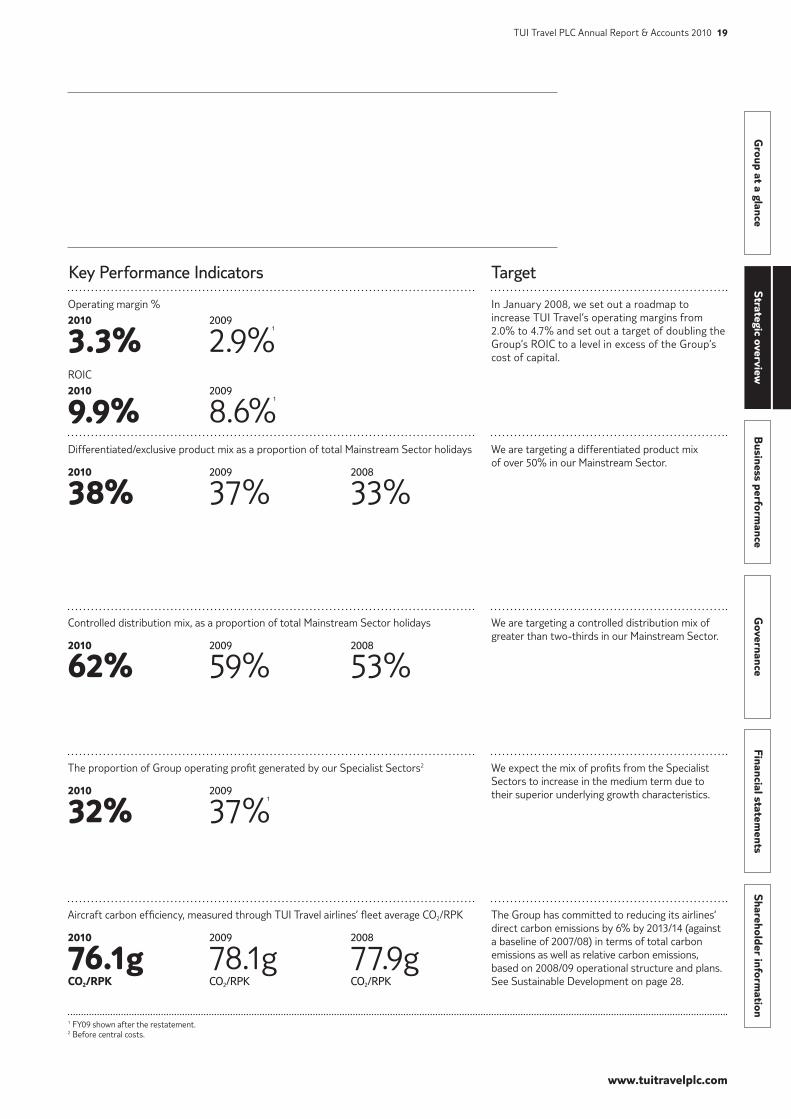
In January 2008, we set out a roadmap to increase TUI Travel’s operating margins from 2.0% to 4.7% and set out a target of doubling the Group’s ROIC to a level in excess of the Group’s cost of capital.
We are targeting a differentiated product mix of over 50% in our Mainstream Sector.
We are targeting a controlled distribution mix of greater than two-thirds in our Mainstream Sector.
We expect the mix of profits from the Specialist Sectors to increase in the medium term due to their superior underlying growth characteristics.
The Group has committed to reducing its airlines‘ direct carbon emissions by 6% by 2013/14 (against a baseline of 2007/08) in terms of total carbon emissions as well as relative carbon emissions, based on 2008/09 operational structure and plans. See Sustainable Development on page 28.
TargetKey Performance Indicators
Operating margin %2010 2009
3.3% 2.9%1
ROIC2010 2009
9.9% 8.6%1
Aircraft carbon efficiency, measured through TUI Travel airlines’ fleet average CO2/RPK
2010 2009 2008
76.1g 78.1g 77.9gCO2/RPK CO2/RPK CO2/RPK
Differentiated/exclusive product mix as a proportion of total Mainstream Sector holidays
2010 2009 2008
38% 37% 33%
Controlled distribution mix, as a proportion of total Mainstream Sector holidays
2010 2009 2008
62% 59% 53%
The proportion of Group operating profit generated by our Specialist Sectors2
2010 2009
32% 37%1
1 FY09 shown after the restatement.2 Before central costs.
www.tuitravelplc.com
20 TUI Travel PLC Annual Report & Accounts 2010
Managing unprecedented disruption
The volcanic ash cloud caused unprecedented disruption in April 2010 with circa 400,000 of our customers affected throughout Europe. During the crisis, we prioritised the needs of our customers, providing industry-leading levels of support and made enormous efforts to repatriate stranded customers by all methods at our disposal. We firmly believe that our efforts further highlighted the advantages of travelling with a leading tour operator and that these benefits have resonated strongly with customers throughout our source markets. The new approach to the imposition of airspace restrictions, now based on scientific observations and consultations with engine manufacturers, should mean that any future airspace closures are more tightly targeted and cause substantially less disruption.
The Group Risk Management Committee (GRMC), a sub-set of the GMB, is responsible for setting the ‘tone at the top’ and supports the continuous improvement that is needed for risk management to function effectively through ensuring management of risk is at the heart of our day-to-day operations and considered during the business planning and strategy setting processes. The GRMC is also responsible for identification of risks associated to the delivery our strategic imperatives from a Board perspective and ensuring that these ‘Top-Down’ risks are owned and appropriately mitigated across the Group or managed at Board level where required.
Recognising that implementing and embedding ERM is a journey, two years in, efforts are now focused on further enhancing risk management capabilities across the Group. Plans are in place to deliver improvements to existing processes by introducing new methods which will be supported by the implementation of a more sophisticated risk management solution. Another key development will be the formalisation of the Group Risk appetite which is seen as critical to managing risks to within the right levels and in enhancing overall business performance.
Finally, in preparation for the Bribery Act which comes into force in April 2011, we are currently developing a more comprehensive compliance framework which will be applied across the whole Group.
A summary of the principal risks faced by the Group, along with the associated mitigation strategies, are contained in the following table. However, this is not intended to be a complete list of all possible risks that could occur. The Group’s key financial risks are included in Note 25 of the accounts (see page 117).
Risk managementEffective and appropriate enterprise-wide risk management remains key to the delivery of our business objectives and strategic goals. Our established framework is designed to facilitate the early identification and evaluation of risks to ensure challenges are prioritised and managed accordingly. Clearly we have experienced some failures in internal control and procedures this year (see page 50). Whilst we have taken short-term actions to address the specific weaknesses we are reviewing the effectiveness of the risk management framework.
The framework strives to improve operational performance, reduce losses and protect and enhance shareholder value in the pursuit of the Groups’ strategic imperatives. It can only seek to provide reasonable comfort that potential significant exposures to the Group are identified and appropriate mitigation plans developed and implemented. Risks by nature are uncertainties or unforeseen events as evidenced this year by the volcanic ash cloud.
Responsibility for managing risk should clearly reside within the businesses themselves. All key areas of the business adopt the Group’s uniform enterprise-wide risk management (ERM) approach, which is closely linked to the strategic planning process. It is the responsibility of senior management teams and Sector Boards across the Group to review, challenge and agree the risk profile for their area of responsibility and to ensure resource is allocated effectively to manage risk and maximise opportunities. Group Risk Management consolidates all risks identified by the businesses to create the Group ‘Bottom-Up’ Risk Profile which is presented to the Audit Committee on a half-year basis. In addition to Group Risk Management, the Audit Committee is also responsible for monitoring and challenging the Group’s risk response strategies. For further information see page 50.
Strategic overview
Principal risks
Group at a glance
Strategic overviewB
usiness performance
Governance
Financial statements
Shareholder information
www.tuitravelplc.com
TUI Travel PLC Annual Report & Accounts 2010 21
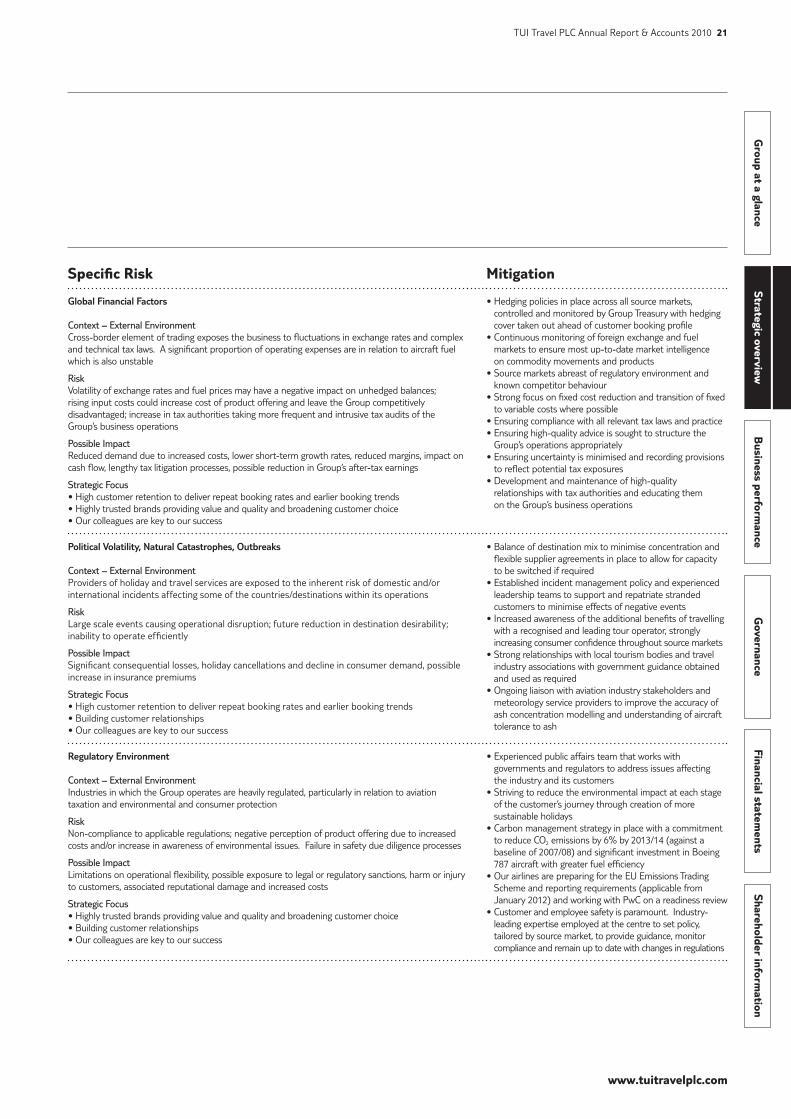
Specific Risk Mitigation
Global Financial Factors
Context – External EnvironmentCross-border element of trading exposes the business to fluctuations in exchange rates and complex and technical tax laws. A significant proportion of operating expenses are in relation to aircraft fuel which is also unstable
RiskVolatility of exchange rates and fuel prices may have a negative impact on unhedged balances; rising input costs could increase cost of product offering and leave the Group competitively disadvantaged; increase in tax authorities taking more frequent and intrusive tax audits of the Group’s business operations
Possible ImpactReduced demand due to increased costs, lower short-term growth rates, reduced margins, impact on cash flow, lengthy tax litigation processes, possible reduction in Group’s after-tax earnings
Strategic Focus• High customer retention to deliver repeat booking rates and earlier booking trends• Highly trusted brands providing value and quality and broadening customer choice• Our colleagues are key to our success
• Hedging policies in place across all source markets, controlled and monitored by Group Treasury with hedging cover taken out ahead of customer booking profile
• Continuous monitoring of foreign exchange and fuel markets to ensure most up-to-date market intelligence on commodity movements and products
• Source markets abreast of regulatory environment and known competitor behaviour
• Strong focus on fixed cost reduction and transition of fixed to variable costs where possible
• Ensuring compliance with all relevant tax laws and practice• Ensuring high-quality advice is sought to structure the
Group’s operations appropriately• Ensuring uncertainty is minimised and recording provisions
to reflect potential tax exposures• Development and maintenance of high-quality
relationships with tax authorities and educating them on the Group’s business operations
Political Volatility, Natural Catastrophes, Outbreaks
Context – External EnvironmentProviders of holiday and travel services are exposed to the inherent risk of domestic and/or international incidents affecting some of the countries/destinations within its operations
RiskLarge scale events causing operational disruption; future reduction in destination desirability; inability to operate efficiently
Possible ImpactSignificant consequential losses, holiday cancellations and decline in consumer demand, possible increase in insurance premiums
Strategic Focus• High customer retention to deliver repeat booking rates and earlier booking trends• Building customer relationships• Our colleagues are key to our success
• Balance of destination mix to minimise concentration and flexible supplier agreements in place to allow for capacity to be switched if required
• Established incident management policy and experienced leadership teams to support and repatriate stranded customers to minimise effects of negative events
• Increased awareness of the additional benefits of travelling with a recognised and leading tour operator, strongly increasing consumer confidence throughout source markets
• Strong relationships with local tourism bodies and travel industry associations with government guidance obtained and used as required
• Ongoing liaison with aviation industry stakeholders and meteorology service providers to improve the accuracy of ash concentration modelling and understanding of aircraft tolerance to ash
Regulatory Environment
Context – External Environment Industries in which the Group operates are heavily regulated, particularly in relation to aviation taxation and environmental and consumer protection
Risk Non-compliance to applicable regulations; negative perception of product offering due to increased costs and/or increase in awareness of environmental issues. Failure in safety due diligence processes
Possible Impact Limitations on operational flexibility, possible exposure to legal or regulatory sanctions, harm or injury to customers, associated reputational damage and increased costs
Strategic Focus• Highly trusted brands providing value and quality and broadening customer choice• Building customer relationships • Our colleagues are key to our success
• Experienced public affairs team that works with governments and regulators to address issues affecting the industry and its customers
• Striving to reduce the environmental impact at each stage of the customer’s journey through creation of more sustainable holidays
• Carbon management strategy in place with a commitment to reduce CO2 emissions by 6% by 2013/14 (against a baseline of 2007/08) and significant investment in Boeing 787 aircraft with greater fuel efficiency
• Our airlines are preparing for the EU Emissions Trading Scheme and reporting requirements (applicable from January 2012) and working with PwC on a readiness review
• Customer and employee safety is paramount. Industry- leading expertise employed at the centre to set policy, tailored by source market, to provide guidance, monitor compliance and remain up to date with changes in regulations
www.tuitravelplc.com
22 TUI Travel PLC Annual Report & Accounts 2010
Strategic overview
Specific Risk Mitigation
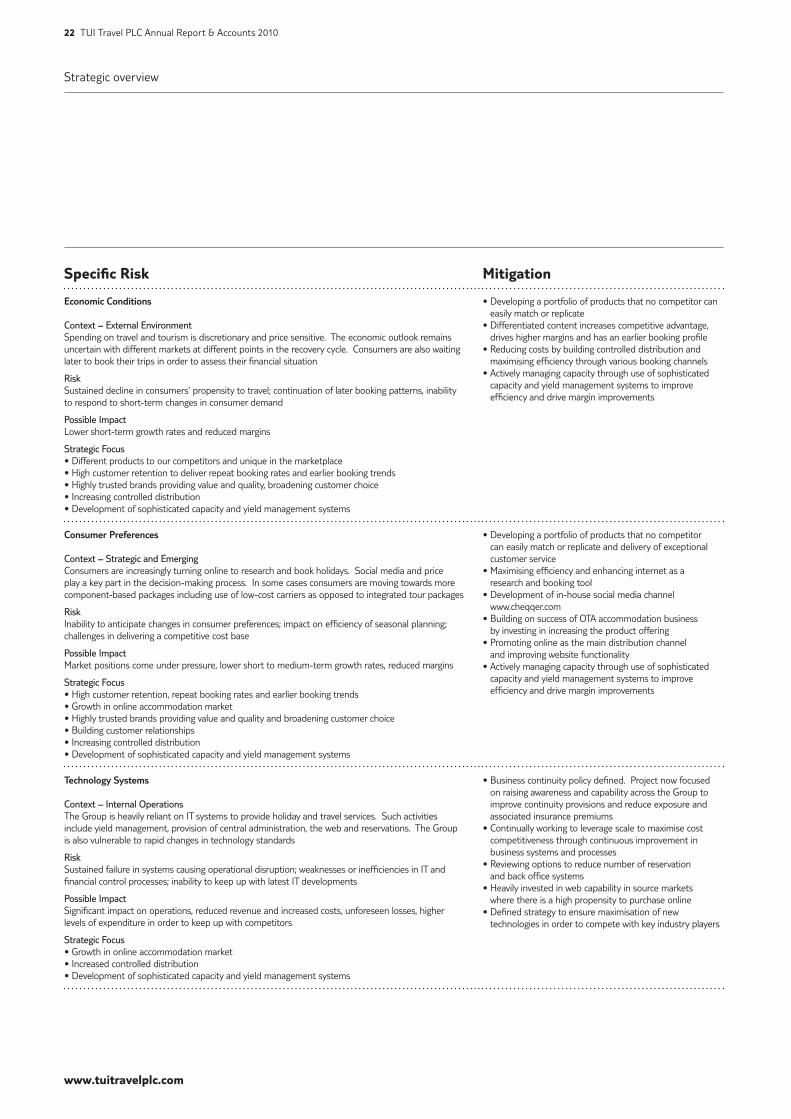
Economic Conditions
Context – External EnvironmentSpending on travel and tourism is discretionary and price sensitive. The economic outlook remains uncertain with different markets at different points in the recovery cycle. Consumers are also waiting later to book their trips in order to assess their financial situation
RiskSustained decline in consumers‘ propensity to travel; continuation of later booking patterns, inability to respond to short-term changes in consumer demand
Possible Impact Lower short-term growth rates and reduced margins
Strategic Focus• Different products to our competitors and unique in the marketplace• High customer retention to deliver repeat booking rates and earlier booking trends• Highly trusted brands providing value and quality, broadening customer choice• Increasing controlled distribution• Development of sophisticated capacity and yield management systems
• Developing a portfolio of products that no competitor can easily match or replicate
• Differentiated content increases competitive advantage, drives higher margins and has an earlier booking profile
• Reducing costs by building controlled distribution and maximising efficiency through various booking channels
• Actively managing capacity through use of sophisticated capacity and yield management systems to improve efficiency and drive margin improvements
Consumer Preferences
Context – Strategic and EmergingConsumers are increasingly turning online to research and book holidays. Social media and price play a key part in the decision-making process. In some cases consumers are moving towards more component-based packages including use of low-cost carriers as opposed to integrated tour packages
Risk Inability to anticipate changes in consumer preferences; impact on efficiency of seasonal planning; challenges in delivering a competitive cost base
Possible ImpactMarket positions come under pressure, lower short to medium-term growth rates, reduced margins
Strategic Focus• High customer retention, repeat booking rates and earlier booking trends• Growth in online accommodation market• Highly trusted brands providing value and quality and broadening customer choice• Building customer relationships• Increasing controlled distribution• Development of sophisticated capacity and yield management systems
• Developing a portfolio of products that no competitor can easily match or replicate and delivery of exceptional customer service
• Maximising efficiency and enhancing internet as a research and booking tool
• Development of in-house social media channel www.cheqqer.com
• Building on success of OTA accommodation business by investing in increasing the product offering
• Promoting online as the main distribution channel and improving website functionality
• Actively managing capacity through use of sophisticated capacity and yield management systems to improve efficiency and drive margin improvements
Technology Systems
Context – Internal OperationsThe Group is heavily reliant on IT systems to provide holiday and travel services. Such activities include yield management, provision of central administration, the web and reservations. The Group is also vulnerable to rapid changes in technology standards
Risk Sustained failure in systems causing operational disruption; weaknesses or inefficiencies in IT and financial control processes; inability to keep up with latest IT developments
Possible Impact Significant impact on operations, reduced revenue and increased costs, unforeseen losses, higher levels of expenditure in order to keep up with competitors
Strategic Focus• Growth in online accommodation market• Increased controlled distribution• Development of sophisticated capacity and yield management systems
• Business continuity policy defined. Project now focused on raising awareness and capability across the Group to improve continuity provisions and reduce exposure and associated insurance premiums
• Continually working to leverage scale to maximise cost competitiveness through continuous improvement in business systems and processes
• Reviewing options to reduce number of reservation and back office systems
• Heavily invested in web capability in source markets where there is a high propensity to purchase online
• Defined strategy to ensure maximisation of new technologies in order to compete with key industry players

Group at a glance
Strategic overviewB
usiness performance
Governance
Financial statements
Shareholder information
www.tuitravelplc.com
TUI Travel PLC Annual Report & Accounts 2010 23
Specific Risk Mitigation
Niche Businesses and Emerging Markets
Context – Strategic and EmergingThe Group continues to look into new markets as the traditional mainstream markets mature. Niche businesses and the BRIC countries represent a significant opportunity to participate in longer-term travel growth trends and have higher growth potential
Risk Inability to identify appropriate opportunities; failure of acquisitions to deliver expectations; limited experience in new markets; possible difficulty in integrating operations and systems
Possible Impact Potential lower long-term growth and reduced margins, impact on anticipated cash flows, significant diversion of management time
Strategic Focus• Our colleagues are key to our success• Acquire niche high-growth businesses in Specialist Sectors• Create a leading position in Russia and CIS• Increase return on invested capital
• Identified a number of market segments to allocate capital to drive high-growth and high-margin product offering
• Completed six successful acquisitions in 2009/10 and will continue to make bolt-on acquisitions during 2010/11
• Appointed highly skilled tour operator to manage Russia and Ukraine businesses with integration and growth plans progressing well
• Investments in Russia and CIS by way of a joint venture with a local partner
• Currently investigating optimal participation strategy for Brazil, China and India and discussing future collaboration opportunities with potential partners
• Consideration payable for businesses directly linked to post-acquisition performance
Supply Chain
Context – External EnvironmentThe Group is dependent on the provision of services by third parties, such as hotel operators, airline services and manufacturers and other third-party providers
Risk Over-reliance and possible failure of key suppliers; withdrawal of certain products or services; poor commercial terms; lack of efficiency and quality of contract performance; exposure to counterparty risk
Possible Impact Reduction in operational performance, inability to offer reliable products and services, deterioration in consumer confidence, consequential losses
Strategic Focus• Highly trusted brands providing value and quality and broadening customer choice• Building our customer relationships • Our colleagues are key to our success
• Spread of financial commitments across key value chain suppliers
• Well-established relationships with key suppliers with service levels monitored and managed accordingly
• Centralised purchasing functions for key procurement areas• Regular review of key service providers to assess financial
standing and levels of health and safety, quality and sustainability standards
• Process in place to monitor and minimise levels of pre-payments to hoteliers and other third-party service providers
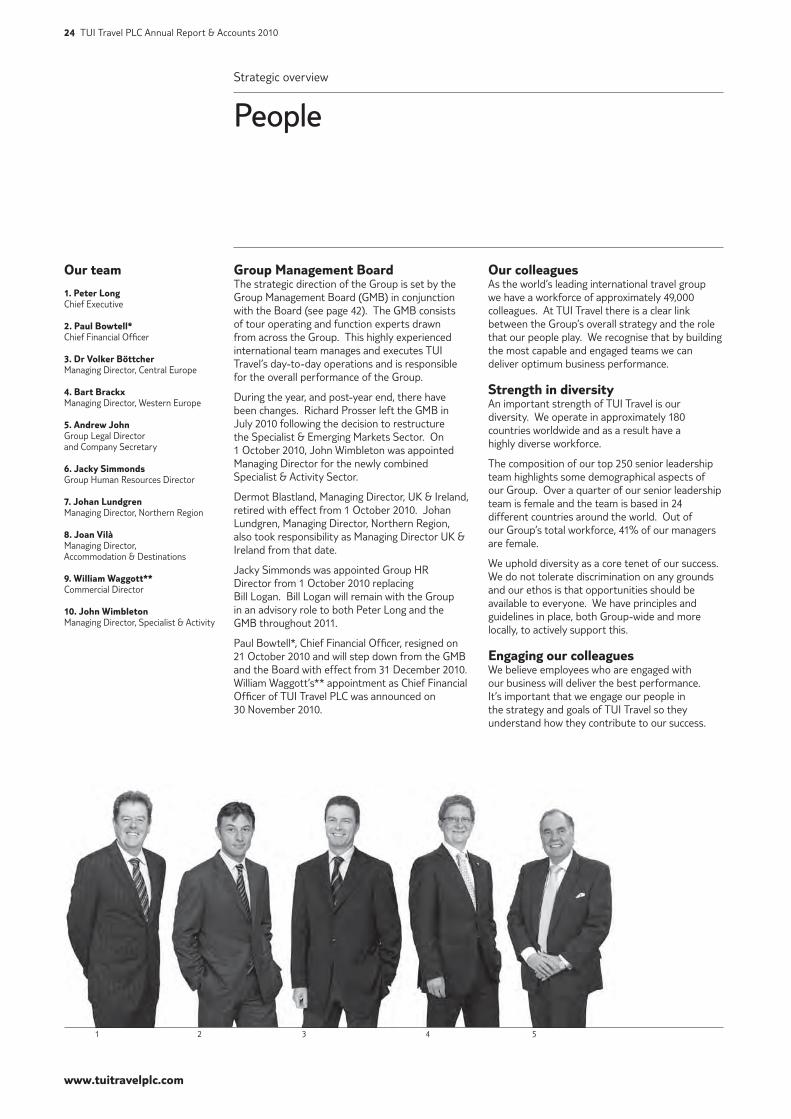
www.tuitravelplc.com
24 TUI Travel PLC Annual Report & Accounts 2010
Our colleaguesAs the world’s leading international travel group we have a workforce of approximately 49,000 colleagues. At TUI Travel there is a clear link between the Group’s overall strategy and the role that our people play. We recognise that by building the most capable and engaged teams we can deliver optimum business performance.
Strength in diversityAn important strength of TUI Travel is our diversity. We operate in approximately 180 countries worldwide and as a result have a highly diverse workforce.
The composition of our top 250 senior leadership team highlights some demographical aspects of our Group. Over a quarter of our senior leadership team is female and the team is based in 24 different countries around the world. Out of our Group’s total workforce, 41% of our managers are female.
We uphold diversity as a core tenet of our success. We do not tolerate discrimination on any grounds and our ethos is that opportunities should be available to everyone. We have principles and guidelines in place, both Group-wide and more locally, to actively support this.
Engaging our colleaguesWe believe employees who are engaged with our business will deliver the best performance. It’s important that we engage our people in the strategy and goals of TUI Travel so they understand how they contribute to our success.
Group Management BoardThe strategic direction of the Group is set by the Group Management Board (GMB) in conjunction with the Board (see page 42). The GMB consists of tour operating and function experts drawn from across the Group. This highly experienced international team manages and executes TUI Travel’s day-to-day operations and is responsible for the overall performance of the Group.
During the year, and post-year end, there have been changes. Richard Prosser left the GMB in July 2010 following the decision to restructure the Specialist & Emerging Markets Sector. On 1 October 2010, John Wimbleton was appointed Managing Director for the newly combined Specialist & Activity Sector.
Dermot Blastland, Managing Director, UK & Ireland, retired with effect from 1 October 2010. Johan Lundgren, Managing Director, Northern Region, also took responsibility as Managing Director UK & Ireland from that date.
Jacky Simmonds was appointed Group HR Director from 1 October 2010 replacing Bill Logan. Bill Logan will remain with the Group in an advisory role to both Peter Long and the GMB throughout 2011.
Paul Bowtell*, Chief Financial Officer, resigned on 21 October 2010 and will step down from the GMB and the Board with effect from 31 December 2010. William Waggott’s** appointment as Chief Financial Officer of TUI Travel PLC was announced on 30 November 2010.
Strategic overview
People
Our team
1. Peter LongChief Executive
2. Paul Bowtell*Chief Financial Officer
3. Dr Volker BöttcherManaging Director, Central Europe
4. Bart BrackxManaging Director, Western Europe
5. Andrew JohnGroup Legal Director and Company Secretary
6. Jacky SimmondsGroup Human Resources Director
7. Johan LundgrenManaging Director, Northern Region
8. Joan VilàManaging Director, Accommodation & Destinations
9. William Waggott**Commercial Director
10. John WimbletonManaging Director, Specialist & Activity
1 2 3 4 5
Group at a glance
Strategic overviewB
usiness performance
Governance
Financial statements
Shareholder information
www.tuitravelplc.com
TUI Travel PLC Annual Report & Accounts 2010 25
Involving our colleaguesIn the past year, a significant number of colleagues in the Group have taken part in one of our employee surveys. Our colleagues’ opinions have given us an insight into what we are doing well and highlighted areas of focus so that we can continue to improve. It is not just about listening, it is about acting too, which is why there is ongoing activity within our businesses to address the findings and involve our people when making improvements.
In the latter part of 2009 we conducted the second Leadership Voice survey, which comprised 827 respondents from our leadership population (leaders). We wanted to track progress since 2008 and set a new benchmark for an extended manager population. The overall results confirmed that we have some great strengths that are common across the Group.
Some of the results highlights included:
• 95% of our leaders feel personally motivated to help TUI Travel be successful
• 94% of our leaders feel well informed about the performance of our business
• 93% of our leaders are proud to work for TUI Travel
• 93% of our leaders feel their business looks for new opportunities to deliver profit
The results were particularly strong in the category focusing on profitability, commercial advantage and how we add value to customer experience, highlighting our commitment in this field and the success of our responsive and flexible
Measuring and monitoring this is a key way to identify how we can improve high performance. This is why we measure engagement levels and benchmark ourselves against organisations in the UK and globally as we want to understand how we perform against national, global and high-performance norms.
As an organisation operating in a large number of countries, with a large workforce and multiple brands, it is key that we can engage our colleagues so they deliver a great customer experience no matter where in the world they work.
At TUI Travel it is not just about what we do, it is about how we do it. In 2008 we developed the TUI Spirit with a number of colleagues across the Group to build our culture. These values underpin our strategy, give our people a common purpose and help us to achieve our vision of making travel experiences special.
Our values are:
• Customer obsessed
• Responsible leadership
• Value driven
• Playing to win
The values are supported by ‘Winning Behaviours’ that clearly illustrate what it looks like when we live our values at TUI Travel. We continuously look to ensure that what we do is aligned to our vision and values, both on a global and more local level, particularly by working with managers throughout our organisation.
6 7 8 9 10
Launching our values in Russia and CIS
In Spring 2010, when launching TUI Travel in Russia and Ukraine, it was pivotal that our values became part of everyday life as early as possible.
We ensured that leaders of our businesses could relate to our values and we tailored them to suit the Russian and Ukrainian local cultures. The values were also aligned to the brand values and adapted to: Reliable, Inspiring and Responsible. These values incorporate our Group-wide aspirations and are aligned with what we are delivering for customers in these new markets. The launch of the values included a series of face-to-face presentations, inclusion in Day-One activities and launch communication literature delivered in local languages.
Training for key customer-facing teams in the local retail networks and destinations was based around the values. The values are now an important part of everyday life in our businesses in Russia and Ukraine – helping us to make our customers and our teams smile as TUI Travel develops in this region.
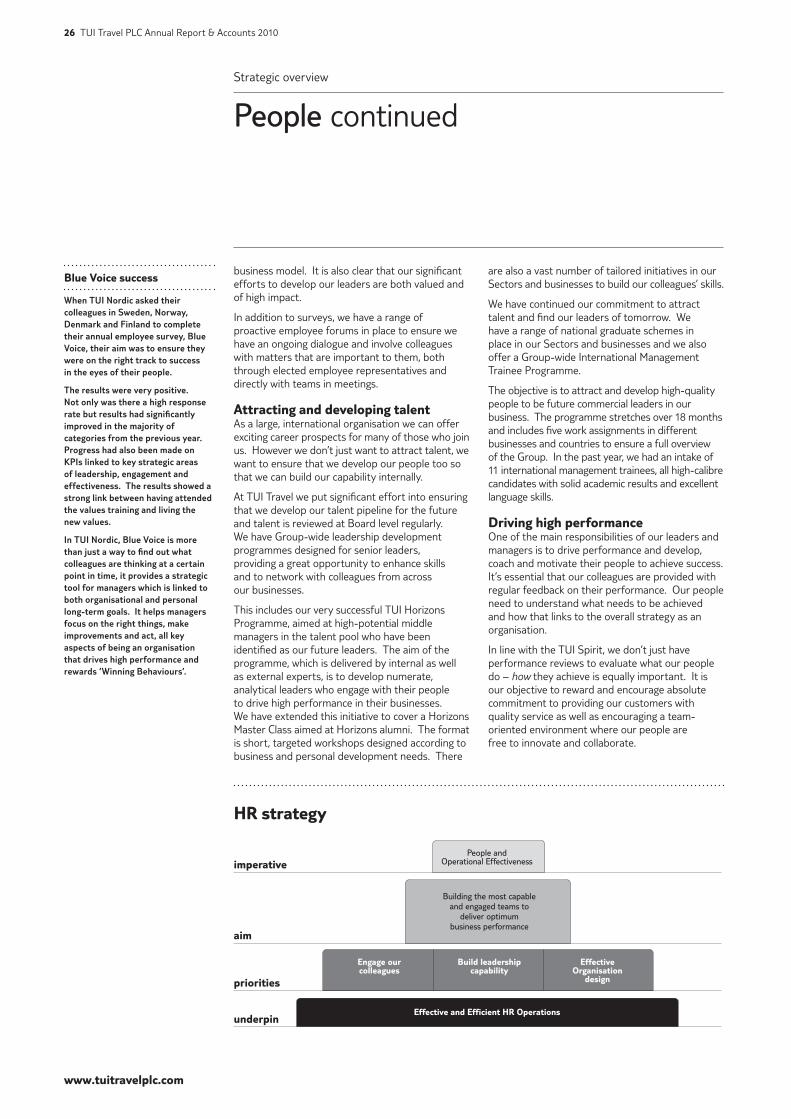
www.tuitravelplc.com
26 TUI Travel PLC Annual Report & Accounts 2010
Strategic overview
People continued
are also a vast number of tailored initiatives in our Sectors and businesses to build our colleagues’ skills.
We have continued our commitment to attract talent and find our leaders of tomorrow. We have a range of national graduate schemes in place in our Sectors and businesses and we also offer a Group-wide International Management Trainee Programme.
The objective is to attract and develop high-quality people to be future commercial leaders in our business. The programme stretches over 18 months and includes five work assignments in different businesses and countries to ensure a full overview of the Group. In the past year, we had an intake of 11 international management trainees, all high-calibre candidates with solid academic results and excellent language skills.
Driving high performanceOne of the main responsibilities of our leaders and managers is to drive performance and develop, coach and motivate their people to achieve success. It’s essential that our colleagues are provided with regular feedback on their performance. Our people need to understand what needs to be achieved and how that links to the overall strategy as an organisation.
In line with the TUI Spirit, we don’t just have performance reviews to evaluate what our people do – how they achieve is equally important. It is our objective to reward and encourage absolute commitment to providing our customers with quality service as well as encouraging a team-oriented environment where our people are free to innovate and collaborate.
business model. It is also clear that our significant efforts to develop our leaders are both valued and of high impact.
In addition to surveys, we have a range of proactive employee forums in place to ensure we have an ongoing dialogue and involve colleagues with matters that are important to them, both through elected employee representatives and directly with teams in meetings.
Attracting and developing talentAs a large, international organisation we can offer exciting career prospects for many of those who join us. However we don’t just want to attract talent, we want to ensure that we develop our people too so that we can build our capability internally.
At TUI Travel we put significant effort into ensuring that we develop our talent pipeline for the future and talent is reviewed at Board level regularly. We have Group-wide leadership development programmes designed for senior leaders, providing a great opportunity to enhance skills and to network with colleagues from across our businesses.
This includes our very successful TUI Horizons Programme, aimed at high-potential middle managers in the talent pool who have been identified as our future leaders. The aim of the programme, which is delivered by internal as well as external experts, is to develop numerate, analytical leaders who engage with their people to drive high performance in their businesses. We have extended this initiative to cover a Horizons Master Class aimed at Horizons alumni. The format is short, targeted workshops designed according to business and personal development needs. There
People andOperational Effectiveness
Building the most capableand engaged teams to
deliver optimumbusiness performance
Engage ourcolleagues
Build leadershipcapability
EffectiveOrganisation
design
Effective and Efficient HR Operations
imperative
aim
priorities
underpin
HR strategy
Blue Voice success
When TUI Nordic asked their colleagues in Sweden, Norway, Denmark and Finland to complete their annual employee survey, Blue Voice, their aim was to ensure they were on the right track to success in the eyes of their people.
The results were very positive. Not only was there a high response rate but results had significantly improved in the majority of categories from the previous year. Progress had also been made on KPIs linked to key strategic areas of leadership, engagement and effectiveness. The results showed a strong link between having attended the values training and living the new values.
In TUI Nordic, Blue Voice is more than just a way to find out what colleagues are thinking at a certain point in time, it provides a strategic tool for managers which is linked to both organisational and personal long-term goals. It helps managers focus on the right things, make improvements and act, all key aspects of being an organisation that drives high performance and rewards ‘Winning Behaviours’.
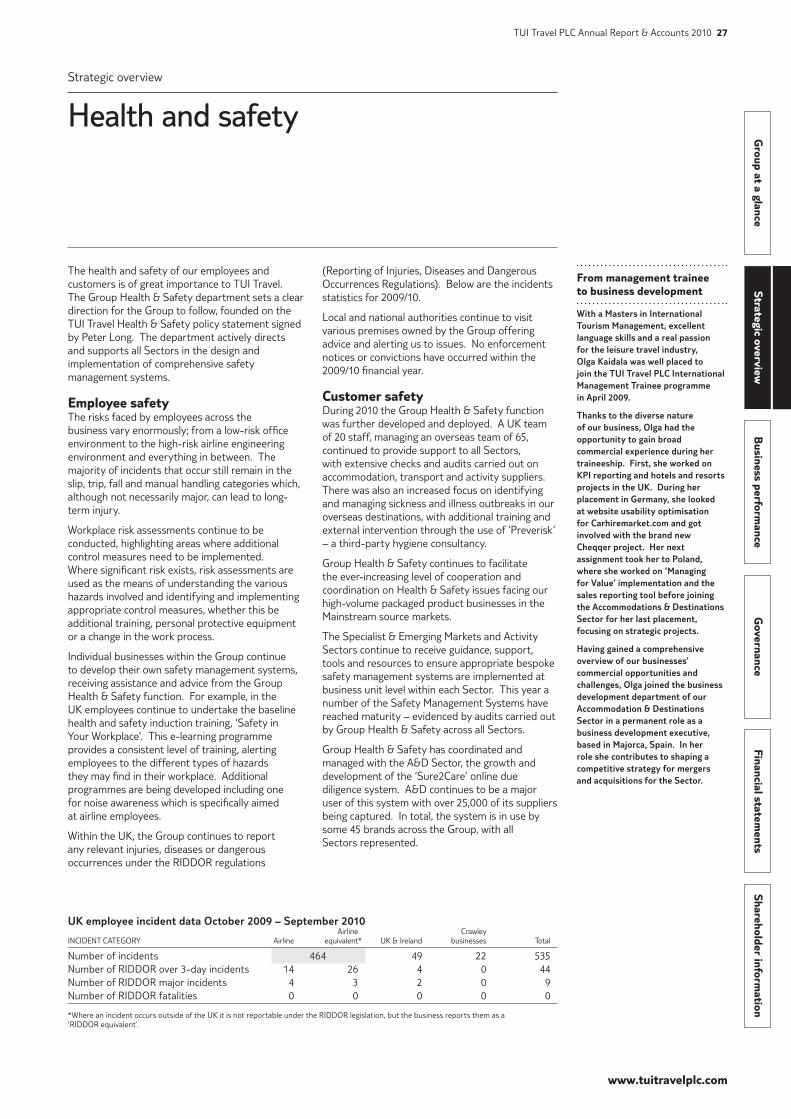
Group at a glance
Strategic overviewB
usiness performance
Governance
Financial statements
Shareholder information
www.tuitravelplc.com
TUI Travel PLC Annual Report & Accounts 2010 27
From management trainee to business development
With a Masters in International Tourism Management, excellent language skills and a real passion for the leisure travel industry, Olga Kaidala was well placed to join the TUI Travel PLC International Management Trainee programme in April 2009.
Thanks to the diverse nature of our business, Olga had the opportunity to gain broad commercial experience during her traineeship. First, she worked on KPI reporting and hotels and resorts projects in the UK. During her placement in Germany, she looked at website usability optimisation for Carhiremarket.com and got involved with the brand new Cheqqer project. Her next assignment took her to Poland, where she worked on ‘Managing for Value’ implementation and the sales reporting tool before joining the Accommodations & Destinations Sector for her last placement, focusing on strategic projects.
Having gained a comprehensive overview of our businesses’ commercial opportunities and challenges, Olga joined the business development department of our Accommodation & Destinations Sector in a permanent role as a business development executive, based in Majorca, Spain. In her role she contributes to shaping a competitive strategy for mergers and acquisitions for the Sector.
UK employee incident data October 2009 – September 2010 Airline Crawley INCIDENT CATEGORY Airline equivalent* UK & Ireland businesses Total
Number of incidents 464 49 22 535Number of RIDDOR over 3-day incidents 14 26 4 0 44Number of RIDDOR major incidents 4 3 2 0 9Number of RIDDOR fatalities 0 0 0 0 0
*Where an incident occurs outside of the UK it is not reportable under the RIDDOR legislation, but the business reports them as a ‘RIDDOR equivalent’.
(Reporting of Injuries, Diseases and Dangerous Occurrences Regulations). Below are the incidents statistics for 2009/10.
Local and national authorities continue to visit various premises owned by the Group offering advice and alerting us to issues. No enforcement notices or convictions have occurred within the 2009/10 financial year.
Customer safetyDuring 2010 the Group Health & Safety function was further developed and deployed. A UK team of 20 staff, managing an overseas team of 65, continued to provide support to all Sectors, with extensive checks and audits carried out on accommodation, transport and activity suppliers. There was also an increased focus on identifying and managing sickness and illness outbreaks in our overseas destinations, with additional training and external intervention through the use of ‘Preverisk’ – a third-party hygiene consultancy.
Group Health & Safety continues to facilitate the ever-increasing level of cooperation and coordination on Health & Safety issues facing our high-volume packaged product businesses in the Mainstream source markets.
The Specialist & Emerging Markets and Activity Sectors continue to receive guidance, support, tools and resources to ensure appropriate bespoke safety management systems are implemented at business unit level within each Sector. This year a number of the Safety Management Systems have reached maturity – evidenced by audits carried out by Group Health & Safety across all Sectors.
Group Health & Safety has coordinated and managed with the A&D Sector, the growth and development of the ‘Sure2Care’ online due diligence system. A&D continues to be a major user of this system with over 25,000 of its suppliers being captured. In total, the system is in use by some 45 brands across the Group, with all Sectors represented.
The health and safety of our employees and customers is of great importance to TUI Travel. The Group Health & Safety department sets a clear direction for the Group to follow, founded on the TUI Travel Health & Safety policy statement signed by Peter Long. The department actively directs and supports all Sectors in the design and implementation of comprehensive safety management systems.
Employee safety The risks faced by employees across the business vary enormously; from a low-risk office environment to the high-risk airline engineering environment and everything in between. The majority of incidents that occur still remain in the slip, trip, fall and manual handling categories which, although not necessarily major, can lead to long-term injury.
Workplace risk assessments continue to be conducted, highlighting areas where additional control measures need to be implemented. Where significant risk exists, risk assessments are used as the means of understanding the various hazards involved and identifying and implementing appropriate control measures, whether this be additional training, personal protective equipment or a change in the work process.
Individual businesses within the Group continue to develop their own safety management systems, receiving assistance and advice from the Group Health & Safety function. For example, in the UK employees continue to undertake the baseline health and safety induction training, ‘Safety in Your Workplace’. This e-learning programme provides a consistent level of training, alerting employees to the different types of hazards they may find in their workplace. Additional programmes are being developed including one for noise awareness which is specifically aimed at airline employees.
Within the UK, the Group continues to report any relevant injuries, diseases or dangerous occurrences under the RIDDOR regulations
Strategic overview
Health and safety
www.tuitravelplc.com
28 TUI Travel PLC Annual Report & Accounts 2010
Sustainability is regarded as a serious business issue across TUI Travel, with many brands making it an integral part of business processes, supplier operating standards and performance metrics. We have already experienced a range of business benefits, including cost efficiencies, quality improvements and the enhanced engagement of customers, colleagues and suppliers.
In 2009/10 we were pleased that our performance was recognised as follows:
• For the third consecutive year TUI Travel was featured in the Carbon Disclosure Leadership Index and was ranked 6th in the FTSE 350 for its approach to carbon disclosure www.cdproject.net
• TUI Travel continues to be listed on the FTSE4Good Index in recognition of its transparency and for meeting strict social, environmental and governance standards.
• TUI Travel was awarded the World’s Responsible Tourism Award in 2009 www.worldtravelawards.com
For further details on awards and our latest Sustainable Development Report, see www.tuitravelplc.com/sustainable development
Sustainable development strategyTUI Travel’s sustainable development strategy is based on consideration of the key issues affecting the Company, now and in the future. It is regularly reviewed in consultation with internal and external stakeholders. Our four strategic priorities for sustainable development align with TUI Travel’s strategic imperatives.
We encourage all TUI Travel businesses to develop their own strategies, aligning with Group and Sector priorities and the related targets, where appropriate.
Our sustainable development goal is to minimise our environmental impact, respect the culture and people in our destinations and offer real economic benefit to local communities.
Strategic overview
Sustainable development
A sustainable future
TUI Travel PLC works with Forum for the Future, a UK sustainable development NGO. We are a core partner in the Tourism 2023 project which sets out to help the UK outbound travel and tourism industry understand the challenges it faces and plans for a sustainable future.
Our four strategic prioritiesfor sustainable development are:
Carbon management
Goal: To reduce TUI Travel’s airlines’ direct carbon emissions by 6% by 2013/14 (against a baseline of 2007/08) in terms of total carbon emissions as well as relative carbon emissions, based on 2008/09 operational structure and plans.
Destinations
Supplier Management Goal: All suppliers in our destinations follow sustainability practices and have continuous improvement programmes in place.
Destination Projects Goal: TUI Travel, working with partners, will make measurable improve-ments to local livelihoods and environmental protection in destinations.
Our colleagues
Goal: TUI Travel colleagues are engaged and empowered to take action on sustainability for the future success of the Company.
Our customers
Goal: TUI Travel businesses deliver quality communications designed to raise customer interest and demand for sustainable holidays.
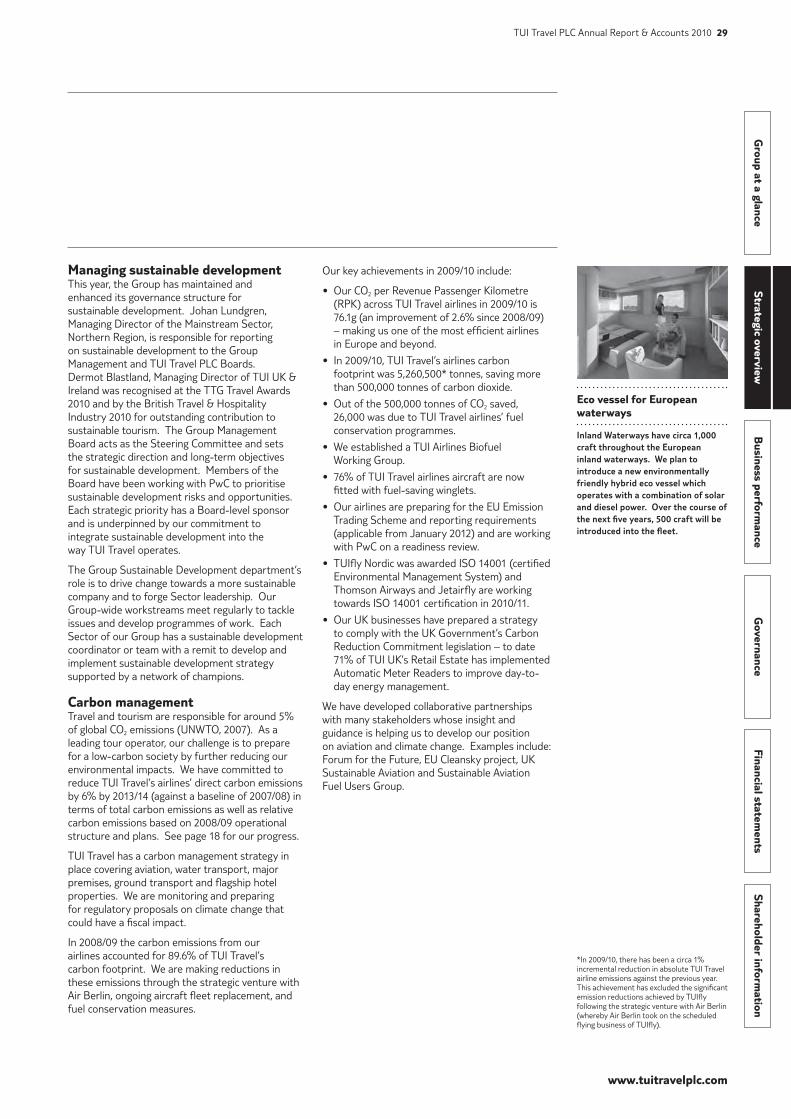
Group at a glance
Strategic overviewB
usiness performance
Governance
Financial statements
Shareholder information
www.tuitravelplc.com
TUI Travel PLC Annual Report & Accounts 2010 29
Our key achievements in 2009/10 include:
• Our CO2 per Revenue Passenger Kilometre (RPK) across TUI Travel airlines in 2009/10 is 76.1g (an improvement of 2.6% since 2008/09) – making us one of the most efficient airlines in Europe and beyond.
• In 2009/10, TUI Travel’s airlines carbon footprint was 5,260,500* tonnes, saving more than 500,000 tonnes of carbon dioxide.
• Out of the 500,000 tonnes of CO2 saved, 26,000 was due to TUI Travel airlines’ fuel conservation programmes.
• We established a TUI Airlines Biofuel Working Group.
• 76% of TUI Travel airlines aircraft are now fitted with fuel-saving winglets.
• Our airlines are preparing for the EU Emission Trading Scheme and reporting requirements (applicable from January 2012) and are working with PwC on a readiness review.
• TUIfly Nordic was awarded ISO 14001 (certified Environmental Management System) and Thomson Airways and Jetairfly are working towards ISO 14001 certification in 2010/11.
• Our UK businesses have prepared a strategy to comply with the UK Government’s Carbon Reduction Commitment legislation – to date 71% of TUI UK’s Retail Estate has implemented Automatic Meter Readers to improve day-to-day energy management.
We have developed collaborative partnerships with many stakeholders whose insight and guidance is helping us to develop our position on aviation and climate change. Examples include: Forum for the Future, EU Cleansky project, UK Sustainable Aviation and Sustainable Aviation Fuel Users Group.
Managing sustainable developmentThis year, the Group has maintained and enhanced its governance structure for sustainable development. Johan Lundgren, Managing Director of the Mainstream Sector, Northern Region, is responsible for reporting on sustainable development to the Group Management and TUI Travel PLC Boards. Dermot Blastland, Managing Director of TUI UK & Ireland was recognised at the TTG Travel Awards 2010 and by the British Travel & Hospitality Industry 2010 for outstanding contribution to sustainable tourism. The Group Management Board acts as the Steering Committee and sets the strategic direction and long-term objectives for sustainable development. Members of the Board have been working with PwC to prioritise sustainable development risks and opportunities. Each strategic priority has a Board-level sponsor and is underpinned by our commitment to integrate sustainable development into the way TUI Travel operates.
The Group Sustainable Development department’s role is to drive change towards a more sustainable company and to forge Sector leadership. Our Group-wide workstreams meet regularly to tackle issues and develop programmes of work. Each Sector of our Group has a sustainable development coordinator or team with a remit to develop and implement sustainable development strategy supported by a network of champions.
Carbon managementTravel and tourism are responsible for around 5% of global CO2 emissions (UNWTO, 2007). As a leading tour operator, our challenge is to prepare for a low-carbon society by further reducing our environmental impacts. We have committed to reduce TUI Travel’s airlines’ direct carbon emissions by 6% by 2013/14 (against a baseline of 2007/08) in terms of total carbon emissions as well as relative carbon emissions based on 2008/09 operational structure and plans. See page 18 for our progress.
TUI Travel has a carbon management strategy in place covering aviation, water transport, major premises, ground transport and flagship hotel properties. We are monitoring and preparing for regulatory proposals on climate change that could have a fiscal impact.
In 2008/09 the carbon emissions from our airlines accounted for 89.6% of TUI Travel’s carbon footprint. We are making reductions in these emissions through the strategic venture with Air Berlin, ongoing aircraft fleet replacement, and fuel conservation measures.
Eco vessel for European waterways
Inland Waterways have circa 1,000 craft throughout the European inland waterways. We plan to introduce a new environmentally friendly hybrid eco vessel which operates with a combination of solar and diesel power. Over the course of the next five years, 500 craft will be introduced into the fleet.
*In 2009/10, there has been a circa 1% incremental reduction in absolute TUI Travel airline emissions against the previous year. This achievement has excluded the significant emission reductions achieved by TUIfly following the strategic venture with Air Berlin (whereby Air Berlin took on the scheduled flying business of TUIfly).
www.tuitravelplc.com
30 TUI Travel PLC Annual Report & Accounts 2010
Strategic overview
Sustainable development continued
• Several businesses supported reforestation projects including TUI Central Europe (committed to planting 57,600 wild olive and pine trees in a nature reserve in Majorca) and Nouvelles Frontières (committed to planting 15,000 trees in Madagascar).
• TUI UK & Ireland worked with the Overseas Development Institute to better understand the socio-economic impact of an all-inclusive Holiday Village hotel in Turkey – we are putting what we have learnt into operation.
We are conscious of the pressures that tourism can place on local populations and resources and therefore work collaboratively with communities, local and national governments, NGOs and trade associations to support sustainable management of destinations and to shape our strategy in this area. Examples include: Dutch Association of Travel Agents and Tour Operators, Deutscher ReiseVerband, Association of British Travel Agents, The Tour Operators Initiative, Forum for the Future, The Overseas Development Institute, Born Free and The Travel Foundation.
Charitable givingIn the last year, our businesses supported many source market and destination charities. Our Group-wide charity policy and guidelines help businesses to ensure transparency, report annual monies collected and manage charity relationships (see page 44).
Our key achievements in 2009/10 include:
• Ongoing support for the Family Holiday Association (FHA) which is the TUI Travel PLC Board’s nominated charity providing holidays to disadvantaged children and their families.
• Thomson Sport was one of the official partners for Sports Relief 2010, a charity that helps vulnerable people both in the UK and overseas.
• Across the Group businesses supported the Haiti earthquake aid effort through colleague fundraising activities, corporate donations, cargo space and seats on TUI Travel aircraft and support for those colleagues who had lost family members. TUI Central Europe has launched a five-year project to support the reconstruction of homes and a school in Haiti.
Destinations We know that the leisure travel industry can have both positive and negative impacts on communities and the natural environment, depending on how these impacts are managed. We are committed to learning more about how our holidays can benefit local livelihoods and protect the environment – and putting this into practice. This is fundamental to preserving the quality of our product in years to come.
Supplier managementTUI Travel has an extensive supply chain operating across the globe (see page 44). These businesses are the gatekeepers to TUI Travel’s sustainability performance in our destinations. By focusing on sustainability our suppliers are able to achieve cost efficiency savings which ultimately give customers better value for money. Our challenge is to extend the reach of our influence to all suppliers and to monitor their progress.
Our key achievements in 2009/10 include:
• Environmental and social contractual minimum standards for accommodation suppliers and the Travelife Sustainability System have been adopted by our Mainstream tour operating businesses and some of the Activity and Specialist & Emerging Markets businesses – www.its4travel.com.
• Over 400 hotels achieved Travelife awards by the end of Summer 2010.
• 27% of TUI UK & Ireland’s customers stayed in Travelife-awarded hotels and they launched new build and operational environmental guidelines for flagship hotel properties.
• The source markets in Mainstream Central Europe organised a destination sustainability supplier conference in Turkey.
• 8 TUI Nordic Blue Village flagship properties in Europe and Turkey were ISO 14001 certified.
• We have implemented a Travelife animal attraction audit programme for major animal attraction excursion venues.
Destination projectsTUI Travel is involved in hundreds of projects designed to improve the livelihoods of local people in destinations and protect the environment.
Our key achievements in 2009/10 include:
• TUI Travel’s Mainstream businesses signed up to the Child Protection Code, committing the businesses to the six criteria of The Code www.thecode.org and TUI Nederland began a three-year child protection project in Brazil.
British Travel Awards
In 2010, Thomson Airways was awarded ‘Environmentally and Socially Responsible Airline’ for the fifth consecutive year and First Choice won the ‘Environmentally and Socially Responsible Large Tour Operator’ for the fourth consecutive year. Exodus won a silver award for the ‘Environmentally and Socially Responsible Small Tour Operator’ category.
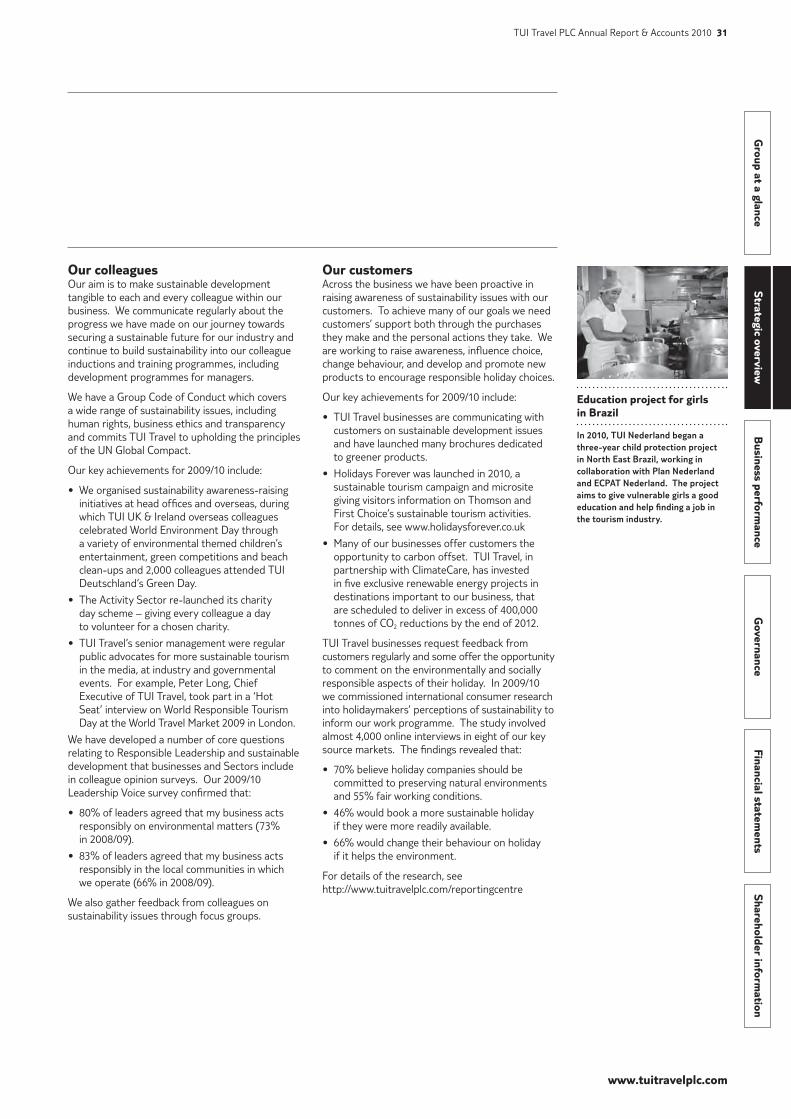
Group at a glance
Strategic overviewB
usiness performance
Governance
Financial statements
Shareholder information
www.tuitravelplc.com
TUI Travel PLC Annual Report & Accounts 2010 31
Our customers Across the business we have been proactive in raising awareness of sustainability issues with our customers. To achieve many of our goals we need customers’ support both through the purchases they make and the personal actions they take. We are working to raise awareness, influence choice, change behaviour, and develop and promote new products to encourage responsible holiday choices.
Our key achievements for 2009/10 include:
• TUI Travel businesses are communicating with customers on sustainable development issues and have launched many brochures dedicated to greener products.
• Holidays Forever was launched in 2010, a sustainable tourism campaign and microsite giving visitors information on Thomson and First Choice’s sustainable tourism activities. For details, see www.holidaysforever.co.uk
• Many of our businesses offer customers the opportunity to carbon offset. TUI Travel, in partnership with ClimateCare, has invested in five exclusive renewable energy projects in destinations important to our business, that are scheduled to deliver in excess of 400,000 tonnes of CO2 reductions by the end of 2012.
TUI Travel businesses request feedback from customers regularly and some offer the opportunity to comment on the environmentally and socially responsible aspects of their holiday. In 2009/10 we commissioned international consumer research into holidaymakers’ perceptions of sustainability to inform our work programme. The study involved almost 4,000 online interviews in eight of our key source markets. The findings revealed that:
• 70% believe holiday companies should be committed to preserving natural environments and 55% fair working conditions.
• 46% would book a more sustainable holiday if they were more readily available.
• 66% would change their behaviour on holiday if it helps the environment.
For details of the research, see http://www.tuitravelplc.com/reportingcentre
Our colleagues Our aim is to make sustainable development tangible to each and every colleague within our business. We communicate regularly about the progress we have made on our journey towards securing a sustainable future for our industry and continue to build sustainability into our colleague inductions and training programmes, including development programmes for managers.
We have a Group Code of Conduct which covers a wide range of sustainability issues, including human rights, business ethics and transparency and commits TUI Travel to upholding the principles of the UN Global Compact.
Our key achievements for 2009/10 include:
• We organised sustainability awareness-raising initiatives at head offices and overseas, during which TUI UK & Ireland overseas colleagues celebrated World Environment Day through a variety of environmental themed children’s entertainment, green competitions and beach clean-ups and 2,000 colleagues attended TUI Deutschland’s Green Day.
• The Activity Sector re-launched its charity day scheme – giving every colleague a day to volunteer for a chosen charity.
• TUI Travel’s senior management were regular public advocates for more sustainable tourism in the media, at industry and governmental events. For example, Peter Long, Chief Executive of TUI Travel, took part in a ‘Hot Seat’ interview on World Responsible Tourism Day at the World Travel Market 2009 in London.
We have developed a number of core questions relating to Responsible Leadership and sustainable development that businesses and Sectors include in colleague opinion surveys. Our 2009/10 Leadership Voice survey confirmed that:
• 80% of leaders agreed that my business acts responsibly on environmental matters (73% in 2008/09).
• 83% of leaders agreed that my business acts responsibly in the local communities in which we operate (66% in 2008/09).
We also gather feedback from colleagues on sustainability issues through focus groups.
Education project for girls in Brazil
In 2010, TUI Nederland began a three-year child protection project in North East Brazil, working in collaboration with Plan Nederland and ECPAT Nederland. The project aims to give vulnerable girls a good education and help finding a job in the tourism industry.
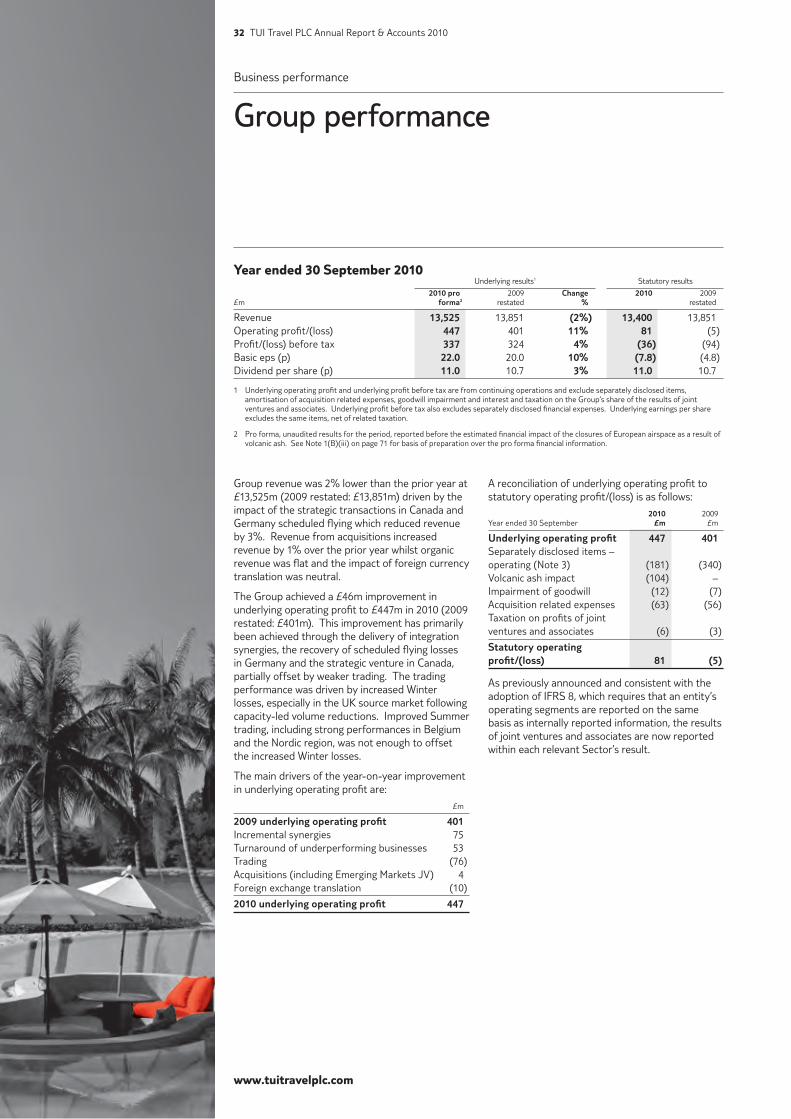
www.tuitravelplc.com
32 TUI Travel PLC Annual Report & Accounts 2010
Business performance
Group performance
Group revenue was 2% lower than the prior year at £13,525m (2009 restated: £13,851m) driven by the impact of the strategic transactions in Canada and Germany scheduled flying which reduced revenue by 3%. Revenue from acquisitions increased revenue by 1% over the prior year whilst organic revenue was flat and the impact of foreign currency translation was neutral.
The Group achieved a £46m improvement in underlying operating profit to £447m in 2010 (2009 restated: £401m). This improvement has primarily been achieved through the delivery of integration synergies, the recovery of scheduled flying losses in Germany and the strategic venture in Canada, partially offset by weaker trading. The trading performance was driven by increased Winter losses, especially in the UK source market following capacity-led volume reductions. Improved Summer trading, including strong performances in Belgium and the Nordic region, was not enough to offset the increased Winter losses.
The main drivers of the year-on-year improvement in underlying operating profit are: £m
2009 underlying operating profit 401Incremental synergies 75Turnaround of underperforming businesses 53Trading (76)Acquisitions (including Emerging Markets JV) 4Foreign exchange translation (10)
2010 underlying operating profit 447
Year ended 30 September 2010 Underlying results1 Statutory results
2010 pro 2009 Change 2010 2009£m forma2 restated % restated
Revenue 13,525 13,851 (2%) 13,400 13,851 Operating profit/(loss) 447 401 11% 81 (5)Profit/(loss) before tax 337 324 4% (36) (94)Basic eps (p) 22.0 20.0 10% (7.8) (4.8)Dividend per share (p) 11.0 10.7 3% 11.0 10.7
1 Underlying operating profit and underlying profit before tax are from continuing operations and exclude separately disclosed items, amortisation of acquisition related expenses, goodwill impairment and interest and taxation on the Group’s share of the results of joint ventures and associates. Underlying profit before tax also excludes separately disclosed financial expenses. Underlying earnings per share excludes the same items, net of related taxation.
2 Pro forma, unaudited results for the period, reported before the estimated financial impact of the closures of European airspace as a result of volcanic ash. See Note 1(B)(iii) on page 71 for basis of preparation over the pro forma financial information.
A reconciliation of underlying operating profit to statutory operating profit/(loss) is as follows: 2010 2009Year ended 30 September £m £m
Underlying operating profit 447 401 Separately disclosed items – operating (Note 3) (181) (340)Volcanic ash impact (104) – Impairment of goodwill (12) (7)Acquisition reIated expenses (63) (56)Taxation on profits of joint ventures and associates (6) (3)
Statutory operating profit/(loss) 81 (5)
As previously announced and consistent with the adoption of IFRS 8, which requires that an entity’s operating segments are reported on the same basis as internally reported information, the results of joint ventures and associates are now reported within each relevant Sector’s result.
Group at a glance
Strategic overviewB
usiness performance
Governance
Financial statements
Shareholder information
www.tuitravelplc.com
TUI Travel PLC Annual Report & Accounts 2010 33
Northern Region 2010 2009 Change %
Customers (’000)1 UK & Ireland 5,399 5,687 (5%)Nordic 1,224 1,177 4%
Total 6,623 6,864 (4%)
Revenue (£m)UK & Ireland 3,392 3,2452 5%Nordic 904 797 13%Canada1 52 168 (69%)
Total 4,348 4,210 3%
Underlying operating profit/(loss) (£m)UK & Ireland 127 1422 (11%)Nordic 60 48 25%Canada (5) (24) 79%
Total 182 166 10%
Underlying operating margin % UK & Ireland 3.7% 4.4%2 (70bps)Nordic 6.6% 6.0% 60bpsCanada n/a n/a n/a
Total 4.2% 3.9% 30bps
1 From 14 January 2010, our Canadian operations have been accounted for under the equity method and Canadian customer numbers have been excluded.
2 Restated.
UK & IrelandThe UK & Ireland businesses delivered an underlying operating profit of £127m (2009 restated: £142m).
Summer trading was not strong enough to offset increased losses in the Winter season. Winter losses increased largely due to planned capacity reductions which, whilst ensuring that supply and demand were in balance, removed holidays from the programme that had previously made a positive contribution.
The Summer trading performance was affected by a slowdown in bookings following a downturn in consumer confidence in the early Summer. Consumer booking trends were affected by the recurrence of airspace closures caused by the volcanic ash, the emergency budget and subsequent austerity measures, and the better than average UK weather, combined with the expected quiet trading period during the World Cup. The slowdown resulted in more stock left to sell in the lates period than expected and although this period traded well, margins were inevitably affected by this shift to later booking patterns.
Sector revenue
10 £11.7bn
09 £12.0bn
Northern RegionThe Northern region achieved a 10% improvement in underlying operating profit to £182m in 2010 (2009: £166m). The improvement was largely driven by incremental merger synergies of £62m and an improved result in Canada following the strategic venture with Sunwing, partially offset by trading in the UK.
Underlying operating profit bridge UK & Northern £m Ireland Nordics Canada Region
2009 (excl. JVs & Associates) 142 46 (24) 164 2009 JVs & Associates – 2 – 2
2009 (incl. JVs & Associates) 142 48 (24) 166 Synergies 62 – – 62 Turnaround 2 – 19 21 Trading (79) 7 – (72)Acquisitions – 2 – 2 FX translation – 3 – 3
2010 (incl. JVs & Associates) 127 60 (5) 182
Business performance
Segmental performance
Mainstream Sector
Sustainable holidays
In 2010, TUI UK rolled out a Sustainable Development Contract Addendum to main hotel suppliers, making it compulsory for them to subscribe to and be audited by the Travelife Sustainability System. Hotels achieving a Travelife award are featured in First Choice and Thomson’s online ‘Greener Holidays’ brochures, making it easier for customers to identify a more sustainable break. www.its4travel.com
www.tuitravelplc.com
34 TUI Travel PLC Annual Report & Accounts 2010
Business performance
Segmental performance continued
As a part of the Nordic business’ focus on sustainability, TUIfly Nordic became the first charter airline globally to achieve ISO 14001 certification. Furthermore, during 2010 all Mediterranean Blue Villages achieved this certification.
The business has also invested in multimedia content to improve online product presentation and this has further promoted the web as the main distribution channel. Web sales increased to 57% (2009: 52%). From Summer 2011, traditional holiday brochures will no longer be produced, emphasising the online culture within the business. Total controlled distribution was flat at 85% as we reduced the number of owned stores.
CanadaCanada reported an underlying operating loss of £5m (2009: loss of £24m). This represents a significant turnaround in our participation in Canada, and results from the completion of the strategic venture with Sunwing in January 2010. The transaction has strengthened our position in the Canadian market, providing the Group with a 49% stake in the second largest tourism business. On an annualised basis, assuming the strategic venture was effective for the full financial year, Canada would have delivered a profit of £2m in 2010.
We have identified opportunities to realise significant synergies in the venture, primarily though network planning benefits and actions to remove duplicated resources, such as migration to a single reservation system, integration of certain back office functions and consolidation of office premises. We estimate that our share of the synergy benefits is worth at least £8m per annum, resulting in a target of £10m for our share of the venture’s profits.
The expansion of unique products continued in 2010, helping to mitigate margin pressure in commodity products, with the differentiated product mix increasing by three percentage points to 42%. This included the opening of Sensatori Tenerife in May and the expansion of the First Choice Holiday Village portfolio with new units in Lanzarote and Rhodes.
Controlled distribution increased by three percentage points to 81% in 2010, driven by the online channel. This was supported by improvements in functionality to the Thomson and the First Choice websites and the success of personalised portals such as ‘MyThomson’, which allows customers to manage their bookings online.
Our business in Ireland delivered £2m of turnaround progress. A rationalisation in capacity resulted in an improved trading performance, helped by the high-profile failure of a competitor. Furthermore, cost savings were achieved through back-office restructuring and optimisation of the distribution network, which included the introduction of a virtual call centre and a reduction in the number of retail shops.
Nordic regionThe Nordic region, consisting of our operations in Sweden, Norway, Denmark and Finland, achieved an improved underlying operating profit of £60m (2009: £48m).
The profit improvement was largely driven by a sharp improvement in customer demand coupled with successful capacity planning. The business is highly flexible as in-house flying accounts for only circa 60% of all packages sold, allowing capacity to be adjusted to meet market demand. After reducing capacity in Summer 2009 and Winter 2009/10 in response to lower demand, the business was able to add capacity when demand improved for Summer 2010.
Demand for TUI Nordics holidays outstripped that for competitors’ products as a result of multi-year investment in product and service differentiation which has contributed to strong improvements in customer satisfaction scores and repeat bookings. The range of unique products was further increased in 2010 with the opening of a Blue Village Exotic Aquamarine in Hurghada, the eco-friendly Blue Village Atlantica Caldera Creta Paradise and Blue Village Bellavista in Bulgaria.
Increasing differentiated products
During the year, TUI Nordic opened three additional Blue Village family concepts in Hurghada, Crete and Bulgaria. In the UK, Thomson launched Thomson Couples, an adult-only experience designed to offer child-free holidays. Substantial work has been done in order to develop differentiated concepts that can work in several source markets. The UK concepts – Thomson Couples, Splash (hotels with waterparks) and Holiday Villages (activity-focused family hotels) – were introduced in the Nordic market.
Group at a glance
Strategic overviewB
usiness performance
Governance
Financial statements
Shareholder information
www.tuitravelplc.com
TUI Travel PLC Annual Report & Accounts 2010 35
GermanyUnderlying operating profit was £81m, an improvement of £11m (2009: £70m). Underlying operating margins also improved by 40bps to 2.1% (2009: 1.7%). This improvement was driven by the £20m benefit of exiting from scheduled flying operations. This transaction was also the primary driver behind the 21% reduction in customers in the year.
Trading in the tour operator deteriorated by £6m versus the prior year. This was largely as a result of weak trading in Q3 2010, with lower load factors in June, lost sales following the volcanic ash disruption, price pressure on commodity product and by a shift in mix towards lower margin holidays (such as overland tours). Summer 2010 bookings improved significantly in the last quarter of 2010 with volumes up 14% in Q4 2010 over the prior year, however the increased lates mix also led to a reduction in profitability. The result was also affected by foreign exchange translation losses of £3m.
Germany improved its controlled distribution by two percentage points to 51%. During 2010 the online brand 1-2-FLY.com was launched, offering dynamically packaged flight and hotel content.
AustriaAustria reported underlying operating profits of £9m (2009: £8m) and an improvement of 80bps in underlying operating margin to 2.8% (2009: 2.0%). Underlying margins improved by £1m over the prior year, due to growth in demand for differentiated hotel content, such as Magic Life, Pegasos and the Blue Collection, and an increase in online volumes. Controlled distribution increased by 10 percentage points to 31%.
Switzerland Switzerland reported underlying operating profits of £4m and an underlying operating margin of 2.2%, a significant improvement over 2009’s breakeven result. This was primarily as a result of margin improvement, driven by fewer holidays sold in the lates market versus prior year.
PolandPoland reported an underlying operating loss of £2m in 2010 (2009: loss of £7m). Customer demand for the Summer 2010 programme was strong, with volumes up 24% over prior year in H2 10.
Central Europe The Central Europe division reported an underlying operating profit of £92m in 2010, an improvement of £21m over the prior year (2009: £71m). This improvement is principally due to the elimination of scheduled flying losses (£20m).
Underlying operating profit/(loss) bridge Switzer- Central£m Germany Austria land Poland Europe
2009 (excl. JVs & Ass.) 65 8 – (7) 662009 JVs & Ass. 5 – – – 5
2009 (incl. JVs & Ass.) 70 8 – (7) 71Turnaround 20 – – 5 25Trading (6) 1 4 – (1)Synergies – 1 – – 1FX Translation (3) (1) – – (4)
2010 (incl. JVs & Ass.) 81 9 4 (2) 92
Central Europe 2010 2009 Change %
Customers (’000)Germany 6,938 8,775 (21%)Austria 558 565 (1%)Switzerland 286 286 FlatPoland 116 104 12%
Total 7,898 9,730 (19%)
Revenue (£m)Germany 3,800 4,144 (8%)Austria 324 405 (20%)Switzerland 183 185 (1%)Poland 68 62 10%
Total 4,375 4,796 (9%)
Underlying operating profit/(loss) (£m)Germany 81 70 16%Austria 9 8 13%Switzerland 4 – n/a Poland (2) (7) 71%
Total 92 71 30%
Underlying operating margin %Germany 2.1% 1.7% 40bpsAustria 2.8% 2.0% 80bpsSwitzerland 2.2% – 220bpsPoland (2.9%) (11.3%) 840bps
Total 2.1% 1.5% 60bps
TUI Environmental Conference
In June 2010, TUI Deutschland hosted an Environmental Conference for accommodation suppliers in Antalya, Turkey. Almost 100 hoteliers attended the event, learning about best practice environmental initiatives from TUI Deutschland’s ‘Umwelt (Environmental) Champion’ hotels. In 2011 a sustainability conference for hoteliers in the Canary Islands will be organised.
Growth in river cruises
Following the continuously growing river cruise market and the success with the first river cruise ship ‘Maxima’, TUI launched its second ship ‘Sonata’ in August 2010. With a completely new product line, featuring modern design, diversified programme and excellent service and quality, the TUI river cruise fleet will address the increasingly younger river cruise customers.
www.tuitravelplc.com
36 TUI Travel PLC Annual Report & Accounts 2010
FranceUnderlying operating profit bridge Nouvelles£m Frontières Corsair Marmara France
2009 (13) (24) 18 (19)Turnaround 6 – – 6 Trading – 1 1 2 Synergies 2 – 1 3 FX Translation (2) (1) (1) (4)
2010 (7) (24) 19 (12)
France reported an underlying operating loss of £12m in 2010 (2009: loss of £19m). The £7m improvement was mainly due to continued turnaround in Nouvelles Frontières.
Nouvelles Frontières benefited from reduced costs following the restructuring implemented last year and from the successful introduction of the new Nouvelles Frontières Hotel Clubs concept and the extended flight programme out of regional airports in France. Online sales also increased by five percentage points to 17% of total bookings.
Marmara increased its market share across all of its destinations in the year and also successfully added new medium and long-haul destinations. Controlled distribution increased by three percentage points to 41%.
Collaboration between the two tour operators in France delivered incremental synergies of £3m in the year.
Corsair reported a flat underlying operating result. The scheduled flying market in France continues to be highly competitive and management is executing plans to make Corsair a viable airline in the future.
NetherlandsNetherlands reported an underlying operating profit of £7m (2009: £7m). Underlying operating margins improved in 2010 by £1m, driven by a three percentage increase in controlled distribution to 60% (2009: 57%). This was mainly due to strong online growth due to improved websites for Arke.nl and ArkeFly.nl. However, foreign exchange translation adversely affected the result by £1m.
BelgiumBelgium achieved a strong improvement in underlying operating profits to £56m (2009: £45m). Customer volumes increased by 4% over the prior year, driven by the launch of new destinations and growth in the offering from regional airports. Margins also improved as a result of a five percentage point increase in controlled distribution to 55%, driven by the online channel.
Western EuropeWestern Europe reported underlying operating profits of £51m in 2010, an improvement of £18m over the prior year (2009: £33m). The improvement was largely driven by strong trading in Belgium and turnaround in Nouvelles Frontières.
Underlying operating profit/(loss) bridge Western £m France Netherlands Belgium Europe
2009 (19) 7 45 33 Trading 2 – 13 15 Turnaround 6 1 – 7 Synergies 3 – – 3 FX Translation (4) (1) (2) (7)
2010 (12) 7 56 51
Western Europe 2010 2009 Change %
Customers (’000)France 2,031 1,959 4%Netherlands 1,211 1,274 (5%)Belgium 1,861 1,790 4%
Total 5,103 5,023 2%
Revenue (£m)France 1,244 1,228 1%Netherlands 668 700 (5%)Belgium 754 724 4%
Total 2,666 2,652 1%
Underlying operating (loss)/profit (£m) France (12) (19) 37%Netherlands 7 7 FlatBelgium 56 45 24%
Total 51 33 55%
Underlying operating margin %France (1.0%) (1.5%) 50bpsNetherlands 1.0% 1.0% FlatBelgium 7.4% 6.2% 120bps
Total 1.9% 1.2% 70bps
Business performance
Segmental performance continued
Launch of differentiated products and new destinations
Nouvelles Frontières and Marmara have been working closely together to develop two destinations with differentiated products for the French market. They collectively launched Marbella as a new medium-haul destination, each with their own club while sharing flight capacity. On long-haul, Marmara launched Mauritius as a new destination, capitalising on access to Nouvelles Frontières hotels and flight capacity with the in-house carrier Corsairfly.
Group at a glance
Strategic overviewB
usiness performance
Governance
Financial statements
Shareholder information
www.tuitravelplc.com
TUI Travel PLC Annual Report & Accounts 2010 37
Within the flat underlying trading result, the B2B and B2C online businesses have benefited from strong volume growth and improved conversion rates. Profitability was offset, however, by start-up investment in new markets within the online businesses and the impact of reduced tour operator volumes in the incoming business and reduced activity in our Asian Meetings, Incentives, Conferences and Entertainment business which suffered from reduced corporate spending in the early part of the year.
Sector revenue
10 £760m
09 £719m
Accommodation & Destinations SectorThe A&D Sector reported underlying operating profits of £71m in 2010 (2009: £67m). The underlying trading result was unchanged, with the increase driven by incremental merger synergies of £4m and a £1m contribution from the annualisation of prior year acquisitions, partially offset by foreign exchange translation losses of £1m.
Accommodation & Destinations change %
Customers B2B roomnights 23%B2C roomnights 17%Incoming passenger volumes (4%)
2010 2009 Change %
Revenue (£m) 551 552 FlatUnderlying operating profit (£m) 71 67 6%Underlying operating margin % 12.9% 12.1% 80bps
Investment in AsiaRooms
One of the key achievements during this year has been the investment made in the AsiaRooms brand. We have increased our own hotel inventory in the region by 62% (7,800 hotels), rebranded the website and implemented a commissionable model with our hotel partners. We believe we are now in a position to capture the tremendous growth expected in the Asian online travel market space in the coming years.
Accommodation & Destinations Sector
Giving back
Businesses across this Sector support many charities. For example, this year the Sector supported a charity local to its head office in Mallorca. Over €10,000 was donated to the Allen Graham Charity 4 Kidz which supports children in need on the island.
www.tuitravelplc.com
38 TUI Travel PLC Annual Report & Accounts 2010
The Adventure businesses reported underlying operating profits of £9m (2009: £13m). The annualisation of acquisitions made in the prior year contributed £3m of profit in 2010. However, underlying trading worsened by £7m despite higher earnings at small group adventure operator Exodus, mainly due to weak demand in Australian Adventure and Polar Cruising. Our Australian businesses had a challenging time: Peregrine Adventures saw lower demand for higher priced long-haul travel; Adventure Tours Australia felt the effect of the strong Australian dollar which rendered outback experiences less affordable to their backpacker clients, although good progress has been made in extracting cost synergies following the combination of a number of similar businesses acquired in the last three years. Polar expedition specialist Quark had a difficult year, with clients reluctant to commit to their higher priced, iconic cruises in the uncertain economic climate.
The Ski, Student and Sports divisions increased underlying operating profits by £9m to £36m (2009: £27m). The divisions delivered strong trading growth of £3m, driven by growth in the Student businesses and a good year for the Sports division due to the Football World Cup, Vancouver Olympics and England’s cricket tour to South Africa. Businesses acquired during the year, plus the annualisation of acquisitions made in the prior year, contributed £4m of incremental profit. In the Student division, the integration of new acquisitions (Hampstead School of English and the Manchester Academy of English) with our existing business, EAC Language Centres, has created a strong brand presence in the English language teaching industry. In the Ski division, Crystal, the UK’s largest ski operator, experienced strong customer demand for its new Crystal Ski+ product which includes ski hire and lift pass in the package at highly competitive rates. The business also delivered incremental synergies of £2m, through the integration of the former TUI and First Choice ski businesses.
Sector revenue
10 £868m
09 £816m
The Activity Sector delivered underlying operating profits of £61m in 2010 (2009: £59m), driven by £7m of profits from acquisitions and £2m of incremental synergies, offset by £6m due to weaker trading and a £1m loss from foreign exchange translation.
Activity 2010 2009 Change %
Revenue (£m) Marine 134 131 2%Adventure 286 240 19%Ski, Student and Sport 448 445 1%
Total 868 816 6%
Underlying operating profit (£m)Marine 16 19 (16%)Adventure 9 13 (31%)Ski, Student and Sport 36 27 33%
Total 61 59 3%
Underlying operating margin %
Total 7.0% 7.2% (20bps)
The Marine division reported underlying profits of £16m, a decrease of £3m versus the prior year (2009: £19m), primarily due to weak demand for the Winter 2009/10 programme.
Business performance
Segmental performance continued
Thomson Sport wins Arsenal contract
Thomson Sport secured a three-year commercial partnership as Arsenal’s official UK travel agency partner which includes business travel (team travel supplier), official supporters’ travel, supplier marketing rights and access to over 250,000 Arsenal supporters to sell packages and holidays.
Volunteering day
In 2010, the Activity Sector re-launched its ‘Charity Day’ scheme – giving over 4,900 colleagues the opportunity to volunteer for a day at a chosen charity. This opportunity was used to clean up local environments, work with sick children and raise money for key projects within the Sector.
Activity Sector
Group at a glance
Strategic overviewB
usiness performance
Governance
Financial statements
Shareholder information
www.tuitravelplc.com
TUI Travel PLC Annual Report & Accounts 2010 39
USThe US division reported underlying operating profits of £8m (2009: £15m). The reduction in profits was due to the circa 70% reduction in the number of tours operated by our US private jet tours business in Winter 2009/10, as the key booking period for this season was during the peak of the recession in the fourth quarter of 2008. Following a strong recovery in demand, we have increased the number of tours for the Winter 2010/11 season and the business is performing well.
Emerging MarketsThis division reported underlying operating losses of £6m (2009 profit: £1m), due to our continued investment in market and product development in the businesses we acquired in Russia and the CIS. In 2010 the TUI brand was introduced into these markets, with the rebranding of the retail network, the launch of a TUI website and the co-branding of brochures. The division now has 480,000 customers and a retail estate of over 150 travel agencies. The Russian and Ukrainian markets remain attractive, with the annual package market estimated to be between 8.5 million and 10 million customers.
Strong macroeconomic conditions, positive consumer behaviour and a growing appetite for travel make the markets of Brazil, India and China particularly interesting. The Group already has a presence in these markets, however we are currently evaluating our participation strategy across all three markets.
Sector revenue
10 £717m
09 £825m
The Specialist & Emerging Markets Sector reported underlying operating profits of £19m in 2010 (2009: £32m). The decrease was driven by start-up losses of £6m in Emerging Markets, and capacity cuts in our private jet tours business in the US, partly offset by better trading in the UK division.
Specialist & Emerging Markets 2010 2009 Change %
Customers (’000)Europe 536 530 1%US 267 290 (8%)
Total 803 820 (2%)
Revenue (£m)Europe 547 584 (6%)US 170 241 (29%)
Total 717 825 (13%)
Underlying operating profit/(loss) (£m)Europe 17 16 6%US 8 15 (47%)Emerging Markets (6) 1 n/a
Total 19 32 (41%)
Underlying operating margin %
Total 2.6% 3.9% (130bps)
EuropeUnderlying operating profit was £17m (2009: £16m). This was mainly as a result of margin improvement in some of the UK businesses, such as Hayes & Jarvis, Sovereign and Citalia, who were able to change the mix of holidays sold to a higher proportion of premium holidays in 2010.
Staycation versus vacation
Hayes & Jarvis launched a ‘Staycation/Vacation’ advertising and marketing campaign to challenge the publicity in the press that this was the summer for holidaying in the UK. Hayes & Jarvis focused on sourcing very strong air and land offers from key suppliers, particularly for their four and five-star products. These were promoted in a slightly tongue-in-cheek fashion, comparing great value long-haul, luxury holidays in some of the more exotic destinations to a sample of British holiday resorts.
Specialist & Emerging Markets Sector
Sustainable development challenge
Managing Directors in the Sector responded to a challenge to showcase how they had taken personal action or worked with their teams to bring the value of ‘Responsible Leadership’ to life. UK Specialist long-haul brands donated over £34,000 for ‘Just a Drop’, a charity which works to deliver water to those who need it most.
www.tuitravelplc.com
40 TUI Travel PLC Annual Report & Accounts 2010
In the UK, as previously reported, capacity for the season is 5% higher due to a change in the fleet mix in Canada from B757s to smaller B737s which results in a higher number of B757s in the UK. Trading remains positive, with booking increases in line with the capacity change and higher average selling prices. Load factor is currently 47%. In November and December, two of Thomson Cruises’ five ships are in extended dry dock for routine maintenance and the resulting reduction in contribution will partially offset improved trading in the tour operator in that period.
In the Nordic region, cumulative bookings are now up 31% versus the prior year and the load factor is 81%, up eight percentage points. Demand for our market-leading portfolio of differentiated products, coupled with the successful use of an additional long-haul aircraft from our airline in France, is driving these strong booking volumes. Our product offering has been enhanced for Winter 2010/11 and Summer 2011 through co-operation with the UK business to bring the Splash, Holiday Village and Sensatori concepts to the Nordic region.
In Germany, booking volumes remain ahead of capacity with volumes up 9% versus the prior year. Due to the late timing of Easter and in response to demand we are commencing certain Summer destinations earlier than usual and as these departure dates are reported as part of the Winter season, reported ‘Winter’ capacity is up 6%. Adjusting for this effect, underlying Winter capacity is flat. Our load factor in Germany is currently 57%.
In the Western Europe source markets, the strong booking activity experienced towards the latter part of the Summer season has continued into Winter. In France, demand for our differentiated Nouvelles Frontières Hotel Clubs and Club Marmara products is a key driver of volume growth.
In the Specialist & Activity Sector, all divisions have experienced higher sales to date versus the prior year. Our private jet tours businesses, TCS and Starquest, have seen a strong rebound in booking activity as the number of tours has increased following the reduction in 2009/10. There has also been good growth in our market-leading ski brand, Crystal.
In A&D, the strong booking volumes for online accommodation experienced in 2010 has continued with booking volumes, transaction values and margins all higher than the prior year.
Winter 2010/11We have continued to see positive recent trading trends across most source markets. In line with our product strategy, we have expanded our portfolio of differentiated product and unique holiday experiences and this is driving booking activity. Bookings since Cumulative previous CumulativeYear-on-year customer bookings at trading bookingsbooking variation % 17 Oct statement at 21 Nov
UK 6 2 5Nordic region 32 27 31Germany 10 9 9France 13 (6) 8Belgium 15 7 12Netherlands 12 18 14
Business performance
Current trading
Current trading1 Winter 2010/11 Risk only
Total Total TotalYear-on-year variation % ASP2 Sales2 Customers2 Capacity3 Left to sell3
MainstreamUK 11 16 5 5 3Nordic Flat 31 31 18 (18)
Northern Region 7 21 14
Germany 2 11 9 6 FlatAustria 7 6 Flat Switzerland (2) (4) (1) Poland (12) (2) 11
Central Europe 1 10 8
France 3 11 8 Belgium (2) 11 12 Netherlands 6 20 14
Western Europe 2 13 11
Specialist & Activity NA 4 NA Accommodation & Destinations4 7 33 25
1 These statistics are up to 21 November 2010.
2 These statistics relate to all customers whether risk or non-risk.
3 These statistics include all risk capacity programmes.
4 These statistics refer to B2B Online businesses only and sales refer to total transaction value (TTV).
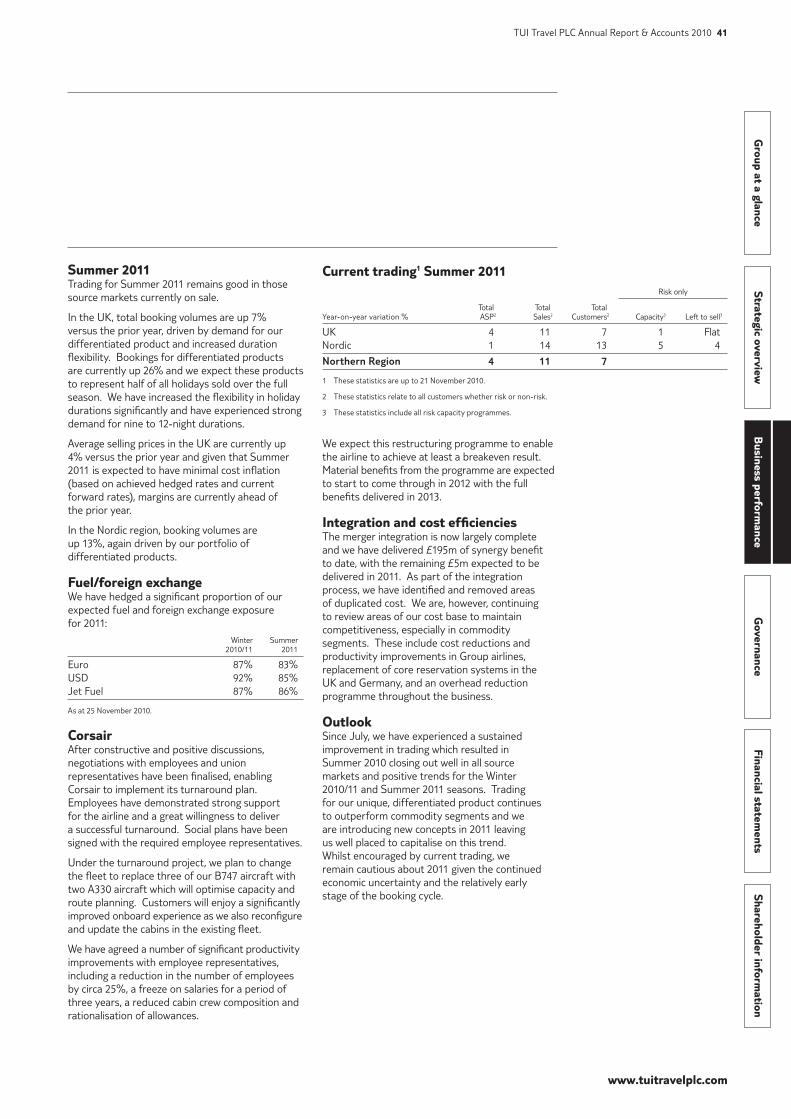
Group at a glance
Strategic overviewB
usiness performance
Governance
Financial statements
Shareholder information
www.tuitravelplc.com
TUI Travel PLC Annual Report & Accounts 2010 41
We expect this restructuring programme to enable the airline to achieve at least a breakeven result. Material benefits from the programme are expected to start to come through in 2012 with the full benefits delivered in 2013.
Integration and cost efficienciesThe merger integration is now largely complete and we have delivered £195m of synergy benefit to date, with the remaining £5m expected to be delivered in 2011. As part of the integration process, we have identified and removed areas of duplicated cost. We are, however, continuing to review areas of our cost base to maintain competitiveness, especially in commodity segments. These include cost reductions and productivity improvements in Group airlines, replacement of core reservation systems in the UK and Germany, and an overhead reduction programme throughout the business.
OutlookSince July, we have experienced a sustained improvement in trading which resulted in Summer 2010 closing out well in all source markets and positive trends for the Winter 2010/11 and Summer 2011 seasons. Trading for our unique, differentiated product continues to outperform commodity segments and we are introducing new concepts in 2011 leaving us well placed to capitalise on this trend. Whilst encouraged by current trading, we remain cautious about 2011 given the continued economic uncertainty and the relatively early stage of the booking cycle.
Summer 2011Trading for Summer 2011 remains good in those source markets currently on sale.
In the UK, total booking volumes are up 7% versus the prior year, driven by demand for our differentiated product and increased duration flexibility. Bookings for differentiated products are currently up 26% and we expect these products to represent half of all holidays sold over the full season. We have increased the flexibility in holiday durations significantly and have experienced strong demand for nine to 12-night durations.
Average selling prices in the UK are currently up 4% versus the prior year and given that Summer 2011 is expected to have minimal cost inflation (based on achieved hedged rates and current forward rates), margins are currently ahead of the prior year.
In the Nordic region, booking volumes are up 13%, again driven by our portfolio of differentiated products.
Fuel/foreign exchangeWe have hedged a significant proportion of our expected fuel and foreign exchange exposure for 2011: Winter Summer 2010/11 2011
Euro 87% 83%USD 92% 85%Jet Fuel 87% 86%
As at 25 November 2010.
Corsair After constructive and positive discussions, negotiations with employees and union representatives have been finalised, enabling Corsair to implement its turnaround plan. Employees have demonstrated strong support for the airline and a great willingness to deliver a successful turnaround. Social plans have been signed with the required employee representatives.
Under the turnaround project, we plan to change the fleet to replace three of our B747 aircraft with two A330 aircraft which will optimise capacity and route planning. Customers will enjoy a significantly improved onboard experience as we also reconfigure and update the cabins in the existing fleet.
We have agreed a number of significant productivity improvements with employee representatives, including a reduction in the number of employees by circa 25%, a freeze on salaries for a period of three years, a reduced cabin crew composition and rationalisation of allowances.
Current trading1 Summer 2011 Risk only
Total Total TotalYear-on-year variation % ASP2 Sales2 Customers2 Capacity3 Left to sell3
UK 4 11 7 1 FlatNordic 1 14 13 5 4
Northern Region 4 11 7
1 These statistics are up to 21 November 2010.
2 These statistics relate to all customers whether risk or non-risk.
3 These statistics include all risk capacity programmes.
42 TUI Travel PLC Annual Report & Accounts 2010
Governance
Board of Directors
1 2 3
4 5 6
7 8 9
10 11 12
13 14 15
16 17
www.tuitravelplc.com
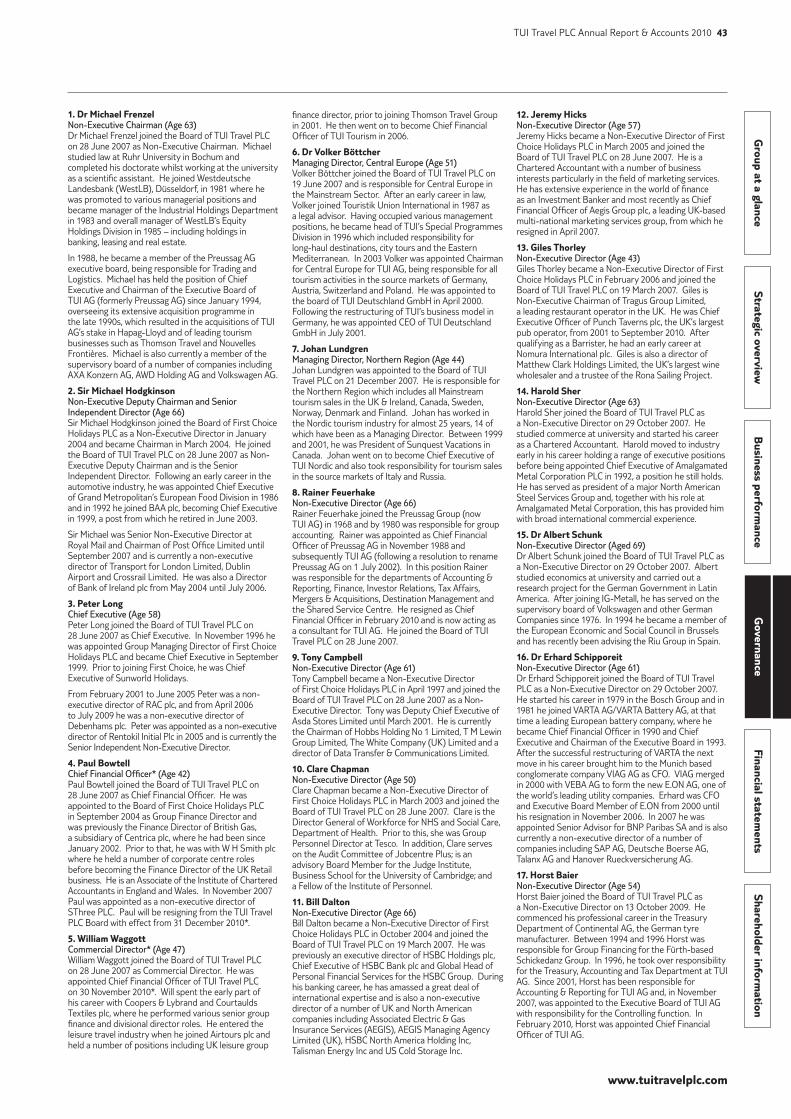
Group at a glance
Strategic overviewB
usiness performance
Governance
Financial statements
Shareholder information
www.tuitravelplc.com
TUI Travel PLC Annual Report & Accounts 2010 43
finance director, prior to joining Thomson Travel Group in 2001. He then went on to become Chief Financial Officer of TUI Tourism in 2006.
6. Dr Volker BöttcherManaging Director, Central Europe (Age 51)Volker Böttcher joined the Board of TUI Travel PLC on 19 June 2007 and is responsible for Central Europe in the Mainstream Sector. After an early career in law, Volker joined Touristik Union International in 1987 as a legal advisor. Having occupied various management positions, he became head of TUI’s Special Programmes Division in 1996 which included responsibility for long-haul destinations, city tours and the Eastern Mediterranean. In 2003 Volker was appointed Chairman for Central Europe for TUI AG, being responsible for all tourism activities in the source markets of Germany, Austria, Switzerland and Poland. He was appointed to the board of TUI Deutschland GmbH in April 2000. Following the restructuring of TUI’s business model in Germany, he was appointed CEO of TUI Deutschland GmbH in July 2001.
7. Johan LundgrenManaging Director, Northern Region (Age 44)Johan Lundgren was appointed to the Board of TUI Travel PLC on 21 December 2007. He is responsible for the Northern Region which includes all Mainstream tourism sales in the UK & Ireland, Canada, Sweden, Norway, Denmark and Finland. Johan has worked in the Nordic tourism industry for almost 25 years, 14 of which have been as a Managing Director. Between 1999 and 2001, he was President of Sunquest Vacations in Canada. Johan went on to become Chief Executive of TUI Nordic and also took responsibility for tourism sales in the source markets of Italy and Russia.
8. Rainer FeuerhakeNon-Executive Director (Age 66)Rainer Feuerhake joined the Preussag Group (now TUI AG) in 1968 and by 1980 was responsible for group accounting. Rainer was appointed as Chief Financial Officer of Preussag AG in November 1988 and subsequently TUI AG (following a resolution to rename Preussag AG on 1 July 2002). In this position Rainer was responsible for the departments of Accounting & Reporting, Finance, Investor Relations, Tax Affairs, Mergers & Acquisitions, Destination Management and the Shared Service Centre. He resigned as Chief Financial Officer in February 2010 and is now acting as a consultant for TUI AG. He joined the Board of TUI Travel PLC on 28 June 2007.
9. Tony CampbellNon-Executive Director (Age 61)Tony Campbell became a Non-Executive Director of First Choice Holidays PLC in April 1997 and joined the Board of TUI Travel PLC on 28 June 2007 as a Non-Executive Director. Tony was Deputy Chief Executive of Asda Stores Limited until March 2001. He is currently the Chairman of Hobbs Holding No 1 Limited, T M Lewin Group Limited, The White Company (UK) Limited and a director of Data Transfer & Communications Limited.
10. Clare ChapmanNon-Executive Director (Age 50)Clare Chapman became a Non-Executive Director of First Choice Holidays PLC in March 2003 and joined the Board of TUI Travel PLC on 28 June 2007. Clare is the Director General of Workforce for NHS and Social Care, Department of Health. Prior to this, she was Group Personnel Director at Tesco. In addition, Clare serves on the Audit Committee of Jobcentre Plus; is an advisory Board Member for the Judge Institute, Business School for the University of Cambridge; and a Fellow of the Institute of Personnel.
11. Bill DaltonNon-Executive Director (Age 66)Bill Dalton became a Non-Executive Director of First Choice Holidays PLC in October 2004 and joined the Board of TUI Travel PLC on 19 March 2007. He was previously an executive director of HSBC Holdings plc, Chief Executive of HSBC Bank plc and Global Head of Personal Financial Services for the HSBC Group. During his banking career, he has amassed a great deal of international expertise and is also a non-executive director of a number of UK and North American companies including Associated Electric & Gas Insurance Services (AEGIS), AEGIS Managing Agency Limited (UK), HSBC North America Holding Inc, Talisman Energy Inc and US Cold Storage Inc.
12. Jeremy HicksNon-Executive Director (Age 57)Jeremy Hicks became a Non-Executive Director of First Choice Holidays PLC in March 2005 and joined the Board of TUI Travel PLC on 28 June 2007. He is a Chartered Accountant with a number of business interests particularly in the field of marketing services. He has extensive experience in the world of finance as an Investment Banker and most recently as Chief Financial Officer of Aegis Group plc, a leading UK-based multi-national marketing services group, from which he resigned in April 2007.
13. Giles ThorleyNon-Executive Director (Age 43)Giles Thorley became a Non-Executive Director of First Choice Holidays PLC in February 2006 and joined the Board of TUI Travel PLC on 19 March 2007. Giles is Non-Executive Chairman of Tragus Group Limited, a leading restaurant operator in the UK. He was Chief Executive Officer of Punch Taverns plc, the UK’s largest pub operator, from 2001 to September 2010. After qualifying as a Barrister, he had an early career at Nomura International plc. Giles is also a director of Matthew Clark Holdings Limited, the UK’s largest wine wholesaler and a trustee of the Rona Sailing Project.
14. Harold SherNon-Executive Director (Age 63)Harold Sher joined the Board of TUI Travel PLC as a Non-Executive Director on 29 October 2007. He studied commerce at university and started his career as a Chartered Accountant. Harold moved to industry early in his career holding a range of executive positions before being appointed Chief Executive of Amalgamated Metal Corporation PLC in 1992, a position he still holds. He has served as president of a major North American Steel Services Group and, together with his role at Amalgamated Metal Corporation, this has provided him with broad international commercial experience.
15. Dr Albert SchunkNon-Executive Director (Aged 69)Dr Albert Schunk joined the Board of TUI Travel PLC as a Non-Executive Director on 29 October 2007. Albert studied economics at university and carried out a research project for the German Government in Latin America. After joining IG-Metall, he has served on the supervisory board of Volkswagen and other German Companies since 1976. In 1994 he became a member of the European Economic and Social Council in Brussels and has recently been advising the Riu Group in Spain.
16. Dr Erhard SchipporeitNon-Executive Director (Age 61)Dr Erhard Schipporeit joined the Board of TUI Travel PLC as a Non-Executive Director on 29 October 2007. He started his career in 1979 in the Bosch Group and in 1981 he joined VARTA AG/VARTA Battery AG, at that time a leading European battery company, where he became Chief Financial Officer in 1990 and Chief Executive and Chairman of the Executive Board in 1993. After the successful restructuring of VARTA the next move in his career brought him to the Munich based conglomerate company VIAG AG as CFO. VIAG merged in 2000 with VEBA AG to form the new E.ON AG, one of the world’s leading utility companies. Erhard was CFO and Executive Board Member of E.ON from 2000 until his resignation in November 2006. In 2007 he was appointed Senior Advisor for BNP Paribas SA and is also currently a non-executive director of a number of companies including SAP AG, Deutsche Boerse AG, Talanx AG and Hanover Rueckversicherung AG.
17. Horst Baier Non-Executive Director (Age 54)Horst Baier joined the Board of TUI Travel PLC as a Non-Executive Director on 13 October 2009. He commenced his professional career in the Treasury Department of Continental AG, the German tyre manufacturer. Between 1994 and 1996 Horst was responsible for Group Financing for the Fürth-based Schickedanz Group. In 1996, he took over responsibility for the Treasury, Accounting and Tax Department at TUI AG. Since 2001, Horst has been responsible for Accounting & Reporting for TUI AG and, in November 2007, was appointed to the Executive Board of TUI AG with responsibility for the Controlling function. In February 2010, Horst was appointed Chief Financial Officer of TUI AG.
1. Dr Michael FrenzelNon-Executive Chairman (Age 63)Dr Michael Frenzel joined the Board of TUI Travel PLC on 28 June 2007 as Non-Executive Chairman. Michael studied law at Ruhr University in Bochum and completed his doctorate whilst working at the university as a scientific assistant. He joined Westdeutsche Landesbank (WestLB), Düsseldorf, in 1981 where he was promoted to various managerial positions and became manager of the Industrial Holdings Department in 1983 and overall manager of WestLB’s Equity Holdings Division in 1985 – including holdings in banking, leasing and real estate.
In 1988, he became a member of the Preussag AG executive board, being responsible for Trading and Logistics. Michael has held the position of Chief Executive and Chairman of the Executive Board of TUI AG (formerly Preussag AG) since January 1994, overseeing its extensive acquisition programme in the late 1990s, which resulted in the acquisitions of TUI AG’s stake in Hapag-Lloyd and of leading tourism businesses such as Thomson Travel and Nouvelles Frontières. Michael is also currently a member of the supervisory board of a number of companies including AXA Konzern AG, AWD Holding AG and Volkswagen AG.
2. Sir Michael Hodgkinson Non-Executive Deputy Chairman and Senior Independent Director (Age 66) Sir Michael Hodgkinson joined the Board of First Choice Holidays PLC as a Non-Executive Director in January 2004 and became Chairman in March 2004. He joined the Board of TUI Travel PLC on 28 June 2007 as Non-Executive Deputy Chairman and is the Senior Independent Director. Following an early career in the automotive industry, he was appointed Chief Executive of Grand Metropolitan’s European Food Division in 1986 and in 1992 he joined BAA plc, becoming Chief Executive in 1999, a post from which he retired in June 2003.
Sir Michael was Senior Non-Executive Director at Royal Mail and Chairman of Post Office Limited until September 2007 and is currently a non-executive director of Transport for London Limited, Dublin Airport and Crossrail Limited. He was also a Director of Bank of Ireland plc from May 2004 until July 2006.
3. Peter LongChief Executive (Age 58)Peter Long joined the Board of TUI Travel PLC on 28 June 2007 as Chief Executive. In November 1996 he was appointed Group Managing Director of First Choice Holidays PLC and became Chief Executive in September 1999. Prior to joining First Choice, he was Chief Executive of Sunworld Holidays.
From February 2001 to June 2005 Peter was a non-executive director of RAC plc, and from April 2006 to July 2009 he was a non-executive director of Debenhams plc. Peter was appointed as a non-executive director of Rentokil Initial Plc in 2005 and is currently the Senior Independent Non-Executive Director.
4. Paul BowtellChief Financial Officer* (Age 42)Paul Bowtell joined the Board of TUI Travel PLC on 28 June 2007 as Chief Financial Officer. He was appointed to the Board of First Choice Holidays PLC in September 2004 as Group Finance Director and was previously the Finance Director of British Gas, a subsidiary of Centrica plc, where he had been since January 2002. Prior to that, he was with W H Smith plc where he held a number of corporate centre roles before becoming the Finance Director of the UK Retail business. He is an Associate of the Institute of Chartered Accountants in England and Wales. In November 2007 Paul was appointed as a non-executive director of SThree PLC. Paul will be resigning from the TUI Travel PLC Board with effect from 31 December 2010*.
5. William WaggottCommercial Director* (Age 47)William Waggott joined the Board of TUI Travel PLC on 28 June 2007 as Commercial Director. He was appointed Chief Financial Officer of TUI Travel PLC on 30 November 2010*. Will spent the early part of his career with Coopers & Lybrand and Courtaulds Textiles plc, where he performed various senior group finance and divisional director roles. He entered the leisure travel industry when he joined Airtours plc and held a number of positions including UK leisure group
www.tuitravelplc.com
44 TUI Travel PLC Annual Report & Accounts 2010
The Company had no trade creditors at 30 September 2010 (2009: £nil) and consequently creditor days have not been presented. Where the Company is the recipient of goods or services, payment of suppliers is conducted by one of the Group companies in accordance with the policy set out above.
Charitable giving and political donationsWe have developed a Group-wide charity policy and guidelines to ensure transparency in our charitable activities and to enable us to report annually on TUI Travel’s charitable giving. During the year, the Group made charitable donations of £475,277 (2009: £290,799). For further details see page 30. The Group made no political contributions during the year (2009: £nil).
Directors’ and Officers’ InsuranceThe Company has purchased, and maintained throughout the year, Directors’ and Officers’ Liability insurance and the level of cover is regularly reviewed.
Significant agreements – change of controlThe Companies Act 2006 requires us to disclose any significant agreements that take effect, alter or terminate on a change of control of the Company.
Relationship Agreement with TUI AGThe Relationship Agreement between TUI AG and TUI Travel, dated 29 June 2007, includes the principle that TUI Travel will operate independently of TUI AG and records the understanding between TUI AG and TUI Travel regarding the relationship between them and the governance of TUI Travel. The Relationship Agreement will remain in force until either the shares in TUI Travel are no longer admitted to trading on the London Stock Exchange, or TUI AG has less than 10% of the rights to vote at general meetings. In addition, in the event that another party acquires control of TUI AG during the term of the Relationship Agreement, TUI AG will lose certain rights under the Relationship Agreement including its rights in respect of the composition of the Board.
The Relationship Agreement contains restrictions on the acquisition by TUI AG of additional shares in TUI Travel which result in the increase of its shareholding to more than 55% of the voting rights on a fully-diluted basis (save where TUI AG makes a general offer to acquire all TUI Travel shares in issue). A number of bonds are held on TUI AG’s behalf and, if converted at the conversion price set on the launch date, would give rise to 52,309,463 new shares. On a fully-diluted basis (if shares held by all bondholders were converted), TUI AG had a holding of 50.37% as at 30 September 2010. As a percentage of shares in issue, TUI AG’s holding as at 30 September 2010 was 54.92%.
TUI AG has anti-dilution rights in respect of further issues of shares in TUI Travel other than on a pre-emptive basis. TUI Travel has also agreed that certain matters will require the prior approval of 80% of the Directors present at the meeting of the Board at which such matter is considered, including material changes to the business of any Group company, acquisitions and disposals of a value which exceeds £10m, the entry into, variation or redemption prior to their due date of any borrowing facilities and the approval of the annual budget.
£770m bank revolving credit facility agreementAn agreement dated 29 June 2007 between a number of relationship banks and the Company relating to a £770m bank revolving credit facility currently provided to the Company, contains terms which give the lending banks the right to cancel all commitments to the
The Directors submit their report to the members of TUI Travel PLC (the Company) for the year ended 30 September 2010.
Principal activityThe principal activity of the TUI Travel PLC group of companies (the Group) is that of an international leisure travel business. It provides a broad and diverse range of leisure travel experiences to more than 30 million customers in 27 key source markets. For further information see TUI Travel overview page 2.
Annual General MeetingThe Annual General Meeting (AGM) will be held on Thursday 3 February 2011 at 10.30am at the offices of Herbert Smith, Exchange House, Primrose Street, London EC2A 2HS. An explanation of the business to be transacted at the AGM has been circulated to shareholders and can be found on the website www.tuitravelplc.com.
Business performanceA description of the Business performance for the year ended 30 September 2010, prepared in accordance with the Companies Act 2006, is set out on pages 32 to 41 and forms part of the Directors’ report.
Results and dividendsThe Group loss before taxation for the year ended 30 September 2010 was £36m (2009 restated: £94m). The Directors recommend a final dividend of 7.8p per ordinary share (2009: 7.7p), payable on 1 March 2011 to holders on the register at the close of business on 4 February 2011. When taken with the interim dividend of 3.2p per ordinary share paid on 1 October 2010 (2009: 3.0p), this gives a total dividend of 11.0p (2009: 10.7p) relating to the year ended 30 September 2010.
The results for the year ended 30 September 2009 have been restated, see Note 1 of the financial statements.
Corporate Governance reportThe Corporate Governance report for the year ended 30 September 2010, prepared in accordance with rule 7.2 of the FSA’s Disclosure and Transparency Rules, is set out on pages 48 to 52 and forms part of the Directors’ report.
SuppliersTUI Travel benefits from both its scale and application of ‘best in class’ purchasing. Our principal suppliers are hotel owners and operators and aircraft suppliers. Amongst others, our key strategic relationships are with hotel chains such as RIU, Fiesta, Atlantica and aircraft providers such as Boeing. Each source market has local and overseas teams to engage in effective procurement strategies to deliver optimum benefits to TUI Travel. Co-operative working is fundamental to our relationships with key suppliers to ensure that the highest standards in terms of health and safety and quality are maintained. Suppliers falling below these expectations will be removed from our programmes.
The operating units within the Group are responsible for agreeing the terms and conditions under which business transactions with their suppliers are conducted. Due to the nature of the Group’s operations, and in common with the industry as a whole, payments are often made in advance for the provision of goods and services. The Group does not follow any code or statement on payment practice but it is Group policy that payments to suppliers, whether in advance or after the provision of the goods or services, are made on the basis of the terms that have been agreed with them.
Governance
Directors’ report

Group at a glance
Strategic overviewB
usiness performance
Governance
Financial statements
Shareholder information
www.tuitravelplc.com
TUI Travel PLC Annual Report & Accounts 2010 45
amount, together with accrued and unpaid interest up to the date of redemption, if a change of control occurs. For the purpose of the convertible bonds a change of control occurs if:
• Following a takeover offer to acquire all or a majority of the shares in the Company being declared unconditional in all respects or becoming effective, the offeror and/or its associates have or will have more than 50% of the voting rights in the Company; or
• The Free Float of the Company is less than 30% of the issued ordinary shares for at least five consecutive dealing days (where the Free Float is (a) all outstanding ordinary shares of the Company less those held by or on behalf of TUI AG, its associates and any persons acting in concert with it and (b) the ordinary shares underlying the outstanding secured exchangeable bonds due 2013 issued by Nero Finance Limited on 16 January 2008).
TUI AG subscribed, at the issue price, for 50% of the convertible bond offering to prevent the potential dilution of its majority shareholding.
£100m bank revolving credit facility agreementAn agreement dated 21 April 2010 between a number of relationship banks and the Company relating to a £100m bank revolving credit facility currently provided to the Company, contains terms which give the lending banks the right to cancel all commitments to the Company and to declare all outstanding credits and accrued interest immediately due and payable if a change of control occurs. For the purpose of this agreement a change of control occurs if:
• Any person or group of persons acting in concert gains control of the Company; or
• TUI AG and any persons acting in concert with it acquires or acquire 75% or more of the voting shares in the Company.
£50m bank revolving credit facility agreementAn agreement dated 27 April 2010 between a relationship bank and the Company relating to a £50m bank revolving credit facility currently provided to the Company, contains terms which give the lending bank the right to cancel all commitments to the Company and to declare all outstanding credits and accrued interest immediately due and payable if a change of control occurs. For the purpose of this agreement a change of control occurs if:
• Any person or group of persons acting in concert gains control of the Company; or
• TUI AG and any persons acting in concert with it acquires or acquire 60% or more of the voting shares in the Company.
£50m bonding and letter of credit facility agreementAn agreement dated 27 September 2010 between a relationship bank and the Company relating to a £50m bonding and letter of credit facility currently provided to the Company, contains terms which give the lending bank the right to cancel all commitments to the Company and to declare all outstanding bonds or letters of credit together with accrued issuance fees immediately due and payable if a change of control occurs. For the purpose of this agreement a change of control occurs if:
• Any person or group of persons acting in concert gains control of the Company; or
• TUI AG and any persons acting in concert with it acquires or acquire 75% or more of the voting shares in the Company.
No other agreements which take effect, alter or terminate upon a change of control of the Company following a takeover bid are considered to be significant in terms of their potential impact on the business of the Group as a whole.
Company and to declare all outstanding credits and accrued interest immediately due and payable if a change of control occurs. For the purpose of this agreement a change of control occurs if:
• Any person or group of persons acting in concert gains control of the Company; or
• TUI AG and any persons acting in concert with it acquires or acquire 75% or more of the voting shares in the Company.
£140m bank revolving credit facility agreementAn agreement dated 29 September 2009 between a number of relationship banks and the Company relating to a £140m bank revolving credit facility currently provided to the Company, contains terms which give the lending banks the right to cancel all commitments to the Company and to declare all outstanding credits and accrued interest immediately due and payable if a change of control occurs. For the purpose of this agreement a change of control occurs if:
• Any person or group of persons acting in concert gains control of the Company; or
• TUI AG and any persons acting in concert with it acquires or acquire 75% or more of the voting shares in the Company.
£40m bonding and letter of credit facility agreementAn agreement dated 29 September 2009 between a relationship bank and the Company relating to a £40m bonding and letter of credit facility currently provided to the Company, contains terms which give the lending bank the right to cancel all commitments to the Company and to declare all outstanding bonds or letters of credit together with accrued issuance fees immediately due and payable if a change of control occurs. For the purpose of this agreement a change of control occurs if:
• Any person or group of persons acting in concert gains control of the Company; or
• TUI AG and any persons acting in concert with it acquires or acquire 60% or more of the voting shares in the Company.
£350m 6.0% Convertible BondsIn September 2009, the Company issued £350m of 6.0% Convertible Bonds with a conversion price set at 349.30p per share. The settlement took place on 5 October 2009. The convertible bonds contain terms which give the bondholders the right to redeem the bonds at their principal amount, together with accrued and unpaid interest up to the date of redemption, if a change of control occurs. For the purpose of the convertible bonds a change of control occurs if:
• Following a takeover offer to acquire all or a majority of the shares in the Company being declared unconditional in all respects or becoming effective, the offeror and/or its associates have or will have more than 50% of the voting rights in the Company; or
• The Free Float of the Company is less than 30% of the issued ordinary shares for at least five consecutive dealing days (where the Free Float is (a) all outstanding ordinary shares of the Company less those held by or on behalf of TUI AG, its associates and any persons acting in concert with it and (b) the ordinary shares underlying the outstanding secured exchangeable bonds due 2013 issued by Nero Finance Limited on 16 January 2008).
£400m 4.90% Convertible BondsIn April 2010, the Company issued £400m of 4.90% Convertible Bonds with a conversion price set at 382.34p per share. The settlement took place on 27 April 2010. The convertible bonds contain terms which give the bondholders the right to redeem the bonds at their principal
www.tuitravelplc.com
46 TUI Travel PLC Annual Report & Accounts 2010
Governance
Directors’ report continued
Other informationOther information relevant to the Directors’ report can be found in the following sections of the Annual Report:Information Location in Annual Report
Our people Page 24Social responsibility Page 26Sustainable development Page 28Charitable and political donations Page 30Future developments Page 41Board and Committee Membership Page 48Financial risk management Pages 20 and 48Post balance sheet events after30 September 2010 Financial statements – Note 34Share capital – authorised and issued Financial statements – Note 23Substantial shareholdings Page 142
The Directors’ report was approved by a duly authorised Committee of the Board of Directors on 1 December 2010 and signed on its behalf by Andrew John, the Company Secretary.
By Order of the Board
Andrew JohnCompany Secretary 1 December 2010 Company Number: 6072876
Going concern After making appropriate enquiries, the Directors have reasonable expectation that the Company and Group have adequate resources to continue operations for the foreseeable future. For this reason, they continue to adopt the going concern basis in preparing the financial statements.
A further summary of funding and liquidity is included in Note 1 to the consolidated financial statements.
Contractual arrangementsThe Group has contractual arrangements with numerous third parties in support of its business activities (see pages 30 and 44).
AuditorsThe auditors for the year ended 30 September 2010 were KPMG Audit Plc.
Statement of the Directors as to disclosure of information to auditorsThe Directors confirm that, so far as they are each aware, there is no relevant audit information of which the Company’s auditors are unaware; and each Director has taken all the steps that he or she ought to have taken as a Director to make himself or herself aware of any relevant audit information and to establish that the Company’s auditors are aware of that information.

Group at a glance
Strategic overviewB
usiness performance
Governance
Financial statements
Shareholder information
www.tuitravelplc.com
TUI Travel PLC Annual Report & Accounts 2010 47
Statement of Directors’ responsibilities in respect of the Annual Report and the Financial Statements
Directors’ responsibility statementEach of the Directors, the names of whom are set out on page 43 of this Annual Report, confirms that to the best of his or her knowledge:
• the financial statements, prepared in accordance with the applicable set of accounting standards, give a true and fair view of the assets, liabilities, financial position and the profit or loss of the Company and the undertakings included in the consolidation taken as a whole; and
• the Directors’ report includes a review of the development and performance of the business and the position of the issuer and the undertakings included in the consolidation taken as a whole, together with a description of the principal risks and uncertainties that they face.
The Statement of Directors’ responsibilities was approved by a duly authorised Committee of the Board of Directors on 1 December 2010 and signed on its behalf by Paul Bowtell, Chief Financial Officer.
Paul BowtellChief Financial Officer 1 December 2010
The Directors are responsible for preparing the Annual Report and the Group and parent company financial statements in accordance with applicable law and regulations.
Company law requires the Directors to prepare Group and parent company financial statements for each financial year. Under that law they are required to prepare the Group financial statements in accordance with International Financial Reporting Standards (IFRS) as adopted by the EU and applicable law and have elected to prepare the parent company financial statements in accordance with UK Accounting Standards and applicable law (UK Generally Accepted Accounting Practice).
Under company law the Directors must not approve the financial statements unless they are satisfied that they give a true and fair view of the state of affairs of the Group and parent company and of their profit or loss for that period. In preparing each of the Group and parent company financial statements, the Directors are required to:
• Select suitable accounting policies and then apply them consistently.
• Make judgements and estimates that are reasonable and prudent.
• For the Group financial statements, state whether they have been prepared in accordance with IFRSs as adopted by the EU.
• For the parent company financial statements, state whether applicable UK Accounting Standards have been followed, subject to any material departures disclosed and explained in the parent company financial statements.
• Prepare the financial statements on the going concern basis unless it is inappropriate to presume that the Group and the parent company will continue in business.
The Directors are responsible for keeping adequate accounting records that are sufficient to show and explain the parent company’s transactions and disclose with reasonable accuracy at any time the financial position of the parent company and enable them to ensure that its financial statements comply with the Companies Act 2006. They have general responsibility for taking such steps as are reasonably open to them to safeguard the assets of the Group and to prevent and detect fraud and other irregularities.
Under applicable law and regulations, the Directors are also responsible for preparing a Directors’ Report, Directors’ Remuneration Report and Corporate Governance Statement that complies with that law and those regulations.
The Directors are responsible for the maintenance and integrity of the corporate and financial information included on the Company’s website. Legislation in the UK governing the preparation and dissemination of financial statements may differ from legislation in other jurisdictions.

www.tuitravelplc.com
48 TUI Travel PLC Annual Report & Accounts 2010
Board procedures/responsibilitiesThe Board meets regularly, including away days, to review the strategy of the Group. The schedule of matters specifically reserved to it for decision include: determining the strategy and control of the Group; amendments to the structure and capital of the Group; approval of financial reporting and controls; oversight of the Group’s internal controls; approval of capital and revenue expenditure of a significant size; acquisitions, disposals and share dealings; Board membership and appointments; approval of remuneration of Directors and certain senior management; corporate governance matters; and approval of Group policies and risk management strategies.
The division of responsibilities between the Chairman and Chief Executive is clearly established, has been agreed by the Board and is reviewed by the Company Secretary on a regular basis.
All Directors have access to the advice and services of the Company Secretary and all Directors can take independent professional advice, if necessary, at the Company’s expense. No such advice was sought by any Director during the year.
The Company Secretary is responsible for ensuring Board procedures are followed including the formal minuting of any unresolved concerns that any Director may have in connection with the operation of the Company. During the year, there were no such unresolved issues.
The Terms of Reference for the Board and its Committees are available for inspection on the Group’s website and will be available at the AGM.
Directors’ conflicts of interests Under the Companies Act 2006, the Directors have a statutory duty to avoid a situation where they have, or could have, a direct or indirect interest that conflicts, or possibly may conflict, with the interests of the Company. Directors of public companies may authorise conflicts and potential conflicts where appropriate, if the articles of association contain a provision to this effect.
The Company’s articles of association permit the Board to authorise actual or potential conflicts of interest. The Company has established formal procedures for the disclosure and review of any conflicts, or potential conflicts, of interest which the Directors may have and for the authorisation of such conflict matters by the Board. In deciding whether to authorise a conflict or potential conflict the Directors must have regard to their general duties under the Companies Act 2006. The authorisation of any conflict matter, and the terms of authorisation, may be reviewed at any time and will be reviewed formally by the Board on an annual basis. The Board believes that the procedures established to deal with conflicts of interest are operating effectively.
Board effectiveness and individual performance of Directors A revised process for the assessment of the performance of the Board and of individual Directors was implemented in May 2010. The Board’s effectiveness was assessed by means of a detailed questionnaire which was designed by the Company Secretary and completed by each Director. The questionnaire covered 34 areas including the Role of the Board, Strategy, Composition, Conduct of Business, Management Succession, Corporate Governance and Risk Management.
The results were presented to the Board in July 2010 where specific areas such as strategy, Board skills and experience, distribution of Board papers and background information, exposure to the Board of the Company’s senior management and environmental issues were debated.
The Board The Company is controlled through its Board of Directors – the Directors at the date of this report are:Director’s name Title
Horst Baier Non-Executive DirectorDr Volker Böttcher Managing Director, Central EuropePaul Bowtell* Chief Financial OfficerTony Campbell Non-Executive DirectorClare Chapman Non-Executive DirectorBill Dalton Non-Executive DirectorRainer Feuerhake Non-Executive DirectorDr Michael Frenzel Non-Executive ChairmanJeremy Hicks Non-Executive DirectorSir Michael Hodgkinson Non-Executive Deputy Chairman
& Senior Independent DirectorPeter Long Chief ExecutiveJohan Lundgren Managing Director, Northern RegionDr Erhard Schipporeit Non-Executive DirectorDr Albert Schunk Non-Executive DirectorHarold Sher Non-Executive DirectorGiles Thorley Non-Executive DirectorWilliam Waggott** Commercial Director
All Directors detailed above served throughout the year with the exception of Horst Baier who was appointed on 13 October 2009.
Paul Bowtell* will resign from the Board on 31 December 2010. William Waggott**, Group Commercial Director, was appointed Chief Financial Officer with effect from 30 November 2010.
As at 30 September 2010, the Board comprised five Executive Directors and 12 Non-Executive Directors (including the Chairman). On 13 October 2009 Horst Baier was appointed as a Non-Executive Director. Biographical details of all the Directors are set out on page 43.
In accordance with the new UK Corporate Governance Code guidelines, with effect from this Annual General Meeting (AGM), all Directors will be subject to annual re-election by shareholders. To enable shareholders to make an informed decision, the 2011 Notice of the AGM includes biographical details and a statement as to why the Company believes the Directors should be re-elected. The Chairman intends to confirm at the AGM that the performance of each individual continues to be effective and demonstrates commitment to the role.
The Board recommends to shareholders the re-appointment of all Directors retiring at the meeting on the basis that they are all effective Directors of the Company and demonstrate the appropriate level of commitment in their respective roles.
The terms of the Directors’ service contracts are disclosed in the Remuneration Report commencing on page 53. Directors’ interests in the shares of the Company are disclosed on page 62.
Directors’ service contracts and the letters of appointment of the Non-Executive Directors are available for inspection at the Company’s registered office and will be available at the AGM which is scheduled to take place on Thursday 3 February 2011.
Following the appointment of any new Director, the Chairman, in conjunction with the Company Secretary, ensures that a full, formal and tailored induction to the Company is provided. The Company Secretary is available to answer any questions which may arise. All Directors have been given a detailed induction and training manual.
Governance
Corporate Governance report
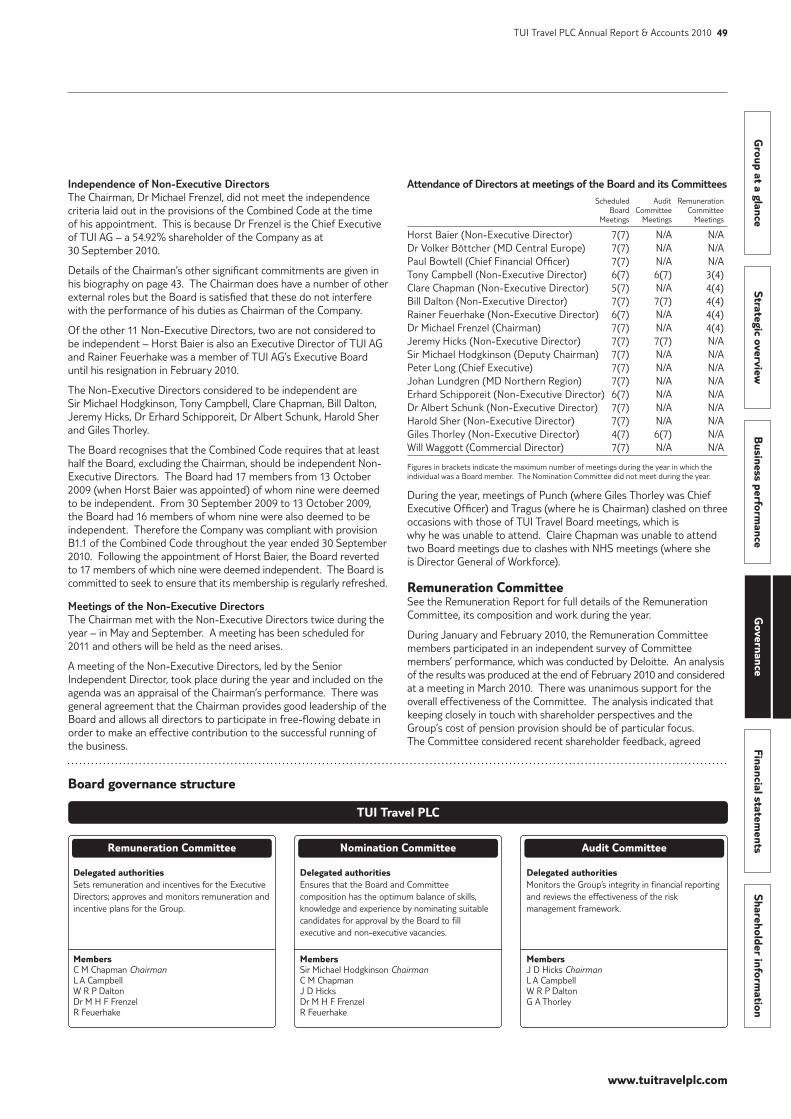
Group at a glance
Strategic overviewB
usiness performance
Governance
Financial statements
Shareholder information
www.tuitravelplc.com
TUI Travel PLC Annual Report & Accounts 2010 49
Independence of Non-Executive DirectorsThe Chairman, Dr Michael Frenzel, did not meet the independence criteria laid out in the provisions of the Combined Code at the time of his appointment. This is because Dr Frenzel is the Chief Executive of TUI AG – a 54.92% shareholder of the Company as at 30 September 2010.
Details of the Chairman’s other significant commitments are given in his biography on page 43. The Chairman does have a number of other external roles but the Board is satisfied that these do not interfere with the performance of his duties as Chairman of the Company.
Of the other 11 Non-Executive Directors, two are not considered to be independent – Horst Baier is also an Executive Director of TUI AG and Rainer Feuerhake was a member of TUI AG’s Executive Board until his resignation in February 2010.
The Non-Executive Directors considered to be independent are Sir Michael Hodgkinson, Tony Campbell, Clare Chapman, Bill Dalton, Jeremy Hicks, Dr Erhard Schipporeit, Dr Albert Schunk, Harold Sher and Giles Thorley.
The Board recognises that the Combined Code requires that at least half the Board, excluding the Chairman, should be independent Non-Executive Directors. The Board had 17 members from 13 October 2009 (when Horst Baier was appointed) of whom nine were deemed to be independent. From 30 September 2009 to 13 October 2009, the Board had 16 members of whom nine were also deemed to be independent. Therefore the Company was compliant with provision B1.1 of the Combined Code throughout the year ended 30 September 2010. Following the appointment of Horst Baier, the Board reverted to 17 members of which nine were deemed independent. The Board is committed to seek to ensure that its membership is regularly refreshed.
Meetings of the Non-Executive DirectorsThe Chairman met with the Non-Executive Directors twice during the year – in May and September. A meeting has been scheduled for 2011 and others will be held as the need arises.
A meeting of the Non-Executive Directors, led by the Senior Independent Director, took place during the year and included on the agenda was an appraisal of the Chairman’s performance. There was general agreement that the Chairman provides good leadership of the Board and allows all directors to participate in free-flowing debate in order to make an effective contribution to the successful running of the business.
TUI Travel PLC
Nomination CommitteeRemuneration Committee Audit Committee
Delegated authoritiesSets remuneration and incentives for the Executive Directors; approves and monitors remuneration and incentive plans for the Group.
MembersC M Chapman ChairmanL A CampbellW R P DaltonDr M H F FrenzelR Feuerhake
Delegated authoritiesEnsures that the Board and Committee composition has the optimum balance of skills, knowledge and experience by nominating suitable candidates for approval by the Board to fill executive and non-executive vacancies.
MembersSir Michael Hodgkinson ChairmanC M ChapmanJ D Hicks Dr M H F FrenzelR Feuerhake
Delegated authoritiesMonitors the Group’s integrity in financial reporting and reviews the effectiveness of the risk management framework.
MembersJ D Hicks ChairmanL A Campbell W R P DaltonG A Thorley
Board governance structure
Attendance of Directors at meetings of the Board and its Committees Scheduled Audit Remuneration Board Committee Committee Meetings Meetings Meetings
Horst Baier (Non-Executive Director) 7(7) N/A N/ADr Volker Böttcher (MD Central Europe) 7(7) N/A N/APaul Bowtell (Chief Financial Officer) 7(7) N/A N/ATony Campbell (Non-Executive Director) 6(7) 6(7) 3(4)Clare Chapman (Non-Executive Director) 5(7) N/A 4(4)Bill Dalton (Non-Executive Director) 7(7) 7(7) 4(4)Rainer Feuerhake (Non-Executive Director) 6(7) N/A 4(4)Dr Michael Frenzel (Chairman) 7(7) N/A 4(4) Jeremy Hicks (Non-Executive Director) 7(7) 7(7) N/ASir Michael Hodgkinson (Deputy Chairman) 7(7) N/A N/APeter Long (Chief Executive) 7(7) N/A N/AJohan Lundgren (MD Northern Region) 7(7) N/A N/AErhard Schipporeit (Non-Executive Director) 6(7) N/A N/ADr Albert Schunk (Non-Executive Director) 7(7) N/A N/AHarold Sher (Non-Executive Director) 7(7) N/A N/AGiles Thorley (Non-Executive Director) 4(7) 6(7) N/AWill Waggott (Commercial Director) 7(7) N/A N/A
Figures in brackets indicate the maximum number of meetings during the year in which the individual was a Board member. The Nomination Committee did not meet during the year.
During the year, meetings of Punch (where Giles Thorley was Chief Executive Officer) and Tragus (where he is Chairman) clashed on three occasions with those of TUI Travel Board meetings, which is why he was unable to attend. Claire Chapman was unable to attend two Board meetings due to clashes with NHS meetings (where she is Director General of Workforce).
Remuneration CommitteeSee the Remuneration Report for full details of the Remuneration Committee, its composition and work during the year.
During January and February 2010, the Remuneration Committee members participated in an independent survey of Committee members’ performance, which was conducted by Deloitte. An analysis of the results was produced at the end of February 2010 and considered at a meeting in March 2010. There was unanimous support for the overall effectiveness of the Committee. The analysis indicated that keeping closely in touch with shareholder perspectives and the Group’s cost of pension provision should be of particular focus. The Committee considered recent shareholder feedback, agreed
www.tuitravelplc.com
50 TUI Travel PLC Annual Report & Accounts 2010
Governance
Corporate Governance report continued
that the Committee Chairman should meet with key shareholders to discuss points raised and in May the Committee further considered the feedback from those meetings. A new full performance evaluation process is scheduled to commence in January 2011.
Nomination Committee The Committee comprises five Non-Executive Directors and is chaired by Sir Michael Hodgkinson (the Senior Independent Director).
In relation to the appointment of Horst Baier, who was appointed on 13 October 2009, a description of the role and required capabilities was prepared prior to the appointment. A meeting of the Committee – chaired by Sir Michael Hodgkinson (Non-Executive Deputy Chairman) – considered Horst’s suitability for the role, his other significant commitments and the existing skills and knowledge of the Board as a whole. As a significant percentage of the Group’s turnover is generated in Germany, it was believed that additional expertise and experience in the differences between German and UK accounting practices was required. It was felt that Horst’s experience in the leisure travel industry as an executive director of TUI AG, and his previous experience over a long career involving work of a financial nature, would assist the Board and enable him to make an excellent contribution to its deliberations. For this reason, it was not deemed appropriate for an external search consultancy or open advertising to be used for this appointment as the Board was of the view that no other candidate would be able to match the specific knowledge and expertise Horst brings to this role.
At the meeting held in October 2009 the current membership and effectiveness of the Committee was also discussed and it was agreed that the composition of the Committee remained appropriate and effective. The effectiveness of the Committee was assessed again in May 2010 by means of a newly-designed assessment questionnaire. The only significant points raised were in respect of the receipt of more timely and clear supporting materials and allowing more time for consideration of succession planning – this latter point was the subject of a full meeting in May 2010.
At that meeting, the Committee’s main focus was on the Company’s management capability and succession planning policies. In the context of the decentralised nature of the organisation, the Company’s policy to actively seek and identify emerging talent and those individuals who can make a significant difference to organisational performance was discussed and the various Leadership Skills Programmes were reviewed. The importance of identifying business critical roles, development programmes and a replacement pipeline for senior roles were also discussed.
Audit Committee All members of the Committee are considered to be independent. In accordance with the Combined Code, the Board is satisfied that Jeremy Hicks has ‘recent and relevant financial experience’.
The Chief Financial Officer, the Director of Group Audit Services and the external auditors are normally invited to meetings and other Directors, including the Chief Executive and the Non-Executive Directors, may also attend. The Chairman of the Committee also meets with the external auditors without management present.
The Committee’s duties, which were discharged during the year, include:
• Monitoring the integrity of the financial statements of the Company and formal announcements relating to the Company’s financial performance and reviewing the significant financial reporting judgements contained in them.
• Reviewing the Company’s internal financial controls and the Company’s internal control and risk management systems.
• Monitoring the effectiveness of the Company’s Group Audit Services’ function through meetings with the Director of Group Audit Services, the agreement in advance of annual work plans and the review of the results of the work undertaken.
• The consideration of the appointment, re-appointment and removal of the external auditors and the approval of their remuneration and terms of their engagement.
• A policy for the engagement of the external auditors to supply non-audit services was approved in 2007 and remains in force. The Audit Committee has concluded that, in some cases, the provision of non-audit services by the incumbent auditors, which does not impact on their independence in providing their primary statutory audit role, is appropriate and this has been communicated to the Board. Auditor independence and objectivity are safeguarded by the Audit Committee monitoring and approving, where appropriate, the nature of the work and the level of fees paid for non-audit services as a proportion of the total audit fees paid.
Audit Committee effectiveness reviewAn assessment of the effectiveness was conducted during the year by a questionnaire sent by the Company Secretary to members of the Audit Committee and relevant executives. The questionnaire contained 23 questions which related to the Audit Committee and, of these, only two received below-average scores – one relating to the Group’s internal financial control systems and the other with its risk management processes. Results from the questionnaires were presented to the Board in July 2010.
Internal control and riskThe Board has overall responsibility for the Group’s system of internal control and for reviewing its effectiveness, while the role of management is to implement Board policies on risk and control. The systems of internal control and risk management have been developed to ensure compliance with the Combined Code (UK Corporate Governance Code as appropriate) and Turnbull Guidance on internal control and risk management.
The Board has delegated the day-to-day management of the Company to the Chief Executive and, through him, to the other Executive Directors and the GMB. The system of internal control is designed to manage and mitigate rather than eliminate the risk of failure to achieve business objectives. In pursuing these objectives, internal controls – which include financial, operational and compliance controls – and risk management can only provide reasonable, and not absolute, assurance against material misstatement or loss. The Board has reviewed the effectiveness of internal controls during the year.
Clearly there has been a breakdown in internal controls in the UK Mainstream business which gave rise to the irrecoverable balance write-offs (see page 70). The Audit Committee commissioned a full and thorough controls and compliance review across the organisation, chaired by Jeremy Hicks (Head of the Audit Committee) and supported by KPMG and PwC. This programme of work consisted of several focused workstreams, one of which was dedicated to the UK Mainstream control environment. This included the full and thorough review of the two reservation systems which gave rise to the issues and the reconciliation of these, and an ongoing review of back-office finance processes. A heavy focus was on reviewing existing controls in place and providing recommendations on where these could be improved upon. The other workstreams considered the whole organisation, consisting of an extensive balance sheet
Group at a glance
Strategic overviewB
usiness performance
Governance
Financial statements
Shareholder information
www.tuitravelplc.com
TUI Travel PLC Annual Report & Accounts 2010 51
review programme and other control reviews looking at intercompany policies and general periodic finance control processes. As a result of this piece of work, new policies and procedures on key areas of financial control have been developed in conjunction with senior finance teams across the organisation and have now been put in place. These will be continually developed and improved upon throughout the next financial year.
The Board confirms that there is an ongoing process for identifying, evaluating and managing the significant risks faced by the Group; that this has been in place for the year under review and up to the date of approval of the Annual Report and Accounts; that this process is regularly reviewed by the Board; and that the process accords with the Turnbull Guidance. The key elements of the control framework and review processes in place across the Group are as follows:
• The Board sets corporate strategy and business objectives. The GMB and Sector management integrate these objectives into their operational and financial business plans. Where areas for improvement in the system of internal control are identified, the Board considers the recommendations made by the GMB and the Audit Committee.
• The GMB meets regularly together with other senior executives to consider Group operational and financial performance and business development. The Chief Executive reports to the Board on behalf of the GMB on significant changes in the business and the external environment. The Chief Financial Officer provides the Board with financial information which includes key performance and risk indicators.
• Group Risk Management has designed a framework for risk management for TUI Travel in line with Turnbull Guidance, integrated with the short and long-term business planning processes. See Enterprise-wide Risk Management.
• The Audit Committee, with assistance from certain related management committees, oversees key risks, such as financial risk, health and safety, corporate and social responsibility and the environment, where such risks apply across all Sectors. The Board believes that, in order to be effective, risk management processes must be driven down to each operating unit. Accordingly, each Sector Board now addresses risk management as a standing agenda item and is responsible for ensuring that the risks facing that Sector’s businesses are identified and that related action plans are implemented. Sectors formally report their risk profile on a quarterly basis.
• The Group Audit Services function independently reviews the risk identification procedures and control processes, implemented by management and reports its findings at each Audit Committee meeting, or more frequently if appropriate.
• The Audit Committee reviews the proposed work plans of the Group Audit Services function; reports issued by Group Audit Services; progress made on addressing findings arising from these reports; as well as reports on systems and controls from the external auditors covering material weaknesses. The Chairman of the Audit Committee reports to the Board on the outcome of the Audit Committee meetings held and the Board receives the minutes of all such meetings.
• The Treasury position of the Group, including cash, foreign exchange and fuel hedging exposure, is managed centrally in accordance with policies appropriate for each Sector and is the responsibility of the Chief Financial Officer and Group Treasurer. Reports and forecasts are submitted monthly to the GMB and at each meeting of the TUI Travel PLC Board. Weekly meetings on liquidity and fuel hedging take place and are attended by the
Chief Executive, Chief Financial Officer, Group Treasurer and other senior managers as deemed necessary.
• Financial forecasts, providing predicted results with sensitivity analysis, are prepared routinely throughout the year for review by the GMB and the Board. These forecasts also include details of the Group’s ongoing compliance with its regulatory and banking requirements. The Group has established investment appraisal and authorisation procedures and its capital expenditure is reviewed against budgets which have been approved by the Board.
Processes are in place to ensure appropriate action is taken where necessary to remedy any deficiencies identified through the Group’s internal control and risk management processes.
Group Risk Management Committee (GRMC)The GRMC comprises of members of the Group Management Board (GMB) (excluding the Chief Executive), the Director of Group Audit Services and the Group Treasurer. Membership is reviewed annually by the GMB. The GRMC’s core responsibilities are to assist the Board by assessing and reporting to the GMB on the effectiveness of the Company’s internal control systems in managing risks and in fulfilling its responsibilities by providing an oversight of the framework for managing risks throughout the Group.
Enterprise-wide Risk Management (ERM)The objective of the framework strives to improve operational performance, reduce losses and to protect and enhance shareholder value in the pursuit of the Group’s strategic imperatives. The Group considers four types of risk when identifying potential events that could affect the delivery of business objectives and strategic goals. Risks are considered in the context of longer-term strategic and emerging threats; medium challenges associated with business change programmes; shorter-term risks triggered by the changing external environment; and shorter-term risks in relation to internal operations.
Key features of the Group’s system of risk management are:
• Established risk management policy.
• Ongoing process for risk identification, evaluation and prioritisation that could impact on business objectives or strategic goals.
• Management processes to mitigate risks within justifiable and tolerable levels.
• Visibility of existing controls along with any further action plans to treat the risk appropriately.
• Quarterly review and update of reporting units’ risk profiles.
• Half-yearly review of Group risk profile, reported to the Audit Committee for review and challenge.
• Regular consideration of any internal and external factors which could impact the Group position.
• Compliance process and adequacy of the controls reviewed by Group Audit Services.
In addition, there is regular reporting to the Board through the Audit Committee on key activities undertaken by Group Risk Management and the status of the risk management process.
Whistleblowing processThere are policies and procedures for the reporting by employees and the resolution of suspected fraudulent activities. It is the policy of the Group to employ staff and management of high integrity, to train them appropriately and to require compliance with all relevant laws, regulations and internal policies.
www.tuitravelplc.com
52 TUI Travel PLC Annual Report & Accounts 2010
For all employees on a UK contract, we have been operating a confidential employee hotline for several years, using a third party to ensure confidentiality and anonymity where this is required. Employees can make confidential reports about any issues they would like to raise which they feel they cannot report to their manager.
The operator of our hotline reports calls to nominated recipients in our Group Audit Services Department who review these and investigate them as appropriate.
In the financial year a total of 35 calls were made to the hotline, the majority of which resulted in internal investigations.
Within its regular report to the Audit Committee, Group Audit Services provides a summary of any confidential reports received and actions taken. A monthly report is also produced which includes a summary of all calls received highlighting any issues raised.
Communication with shareholdersThe Chief Executive, Chief Financial Officer and members of the Investor Relations team hold regular meetings with major shareholders to review the Group’s performance and prospects. The views of shareholders are communicated to all members of the Board following such meetings. During the course of these meetings the issue of governance is discussed. Presentations to major shareholders are made at least twice yearly, after the announcement of the interim and preliminary results, details of which, together with the Group’s financial reports and other announcements, can be accessed via the Group’s website www.tuitravelplc.com.
The Chairman of the Remuneration Committee, Clare Chapman, met with four major shareholders in December 2009 and had two additional meetings in April 2010 with major shareholders concerning the remuneration policy. Feedback from shareholders obtained during these meetings was shared with the Remuneration Committee and given due consideration.
The Combined Code recommends that the Senior Independent Director meets with a range of major shareholders to gain an understanding of their views. In practice and, as a result of the extensive investor feedback provided by the Chief Executive and the Chief Financial Officer, the Senior Independent Director and other Non-Executive Directors believe that they are kept fully up-to-date and would be made aware should there be any issues. They therefore considered that it was not necessary to arrange meetings with major shareholders for this purpose during the year. During the year, no shareholders requested any meetings with the Senior Independent Director or any other Non-Executive Directors. However, should a request for a meeting be made, they would make themselves available if it was appropriate to do so.
There is an opportunity for shareholders to question the Chairman and other Directors (including the Chairmen of the Audit, Remuneration and Nomination Committees) at the Annual General Meeting (AGM). The AGM also provides a forum for the Non-Executive Directors to discuss the views of shareholders with them directly.
In respect of general meetings of the Company:
• The Company prepares separate resolutions on each substantially separate issue and does not combine resolutions together inappropriately.
• Proxy appointment forms provide shareholders with the option to vote for, against or to withhold their vote. The proxy form makes it clear that a ‘vote withheld’ is not a vote in law and will not be counted.
• All postal proxy votes are returned to Equiniti (the Company’s Registrar) who is responsible to for ensuring votes are properly received and counted.
• Proxy counts are displayed at the close of the AGM and the results posted on the Company’s website www.tuitravelplc.com following the closure of the meeting.
• The Annual Report and Accounts is laid before shareholders at the AGM.
Combined Code ProvisionsFor the reasons disclosed within this Annual Report, during the year the Company did not fully comply with the following provisions:
• Code Provision A2.2. The Chairman should on appointment meet the independence criteria set out in Code A3.1 (see page 49).
• Code Provision B2.1. The Remuneration Committee should all be independent Non-Executive Directors (see page 49).
• Code Provision D1.1. The Senior Independent Director should attend sufficient meetings with a range of major shareholders to listen to their views in order to help develop a balanced understanding of the issues and concerns of major shareholders (see above).
The new UK Corporate Governance Code provisions apply to accounting periods beginning on or after 29 June 2010. Although the Company’s reporting period began on 1 October 2009, we have taken the decision to substantially comply with the new provisions in line with best practice and to explain when we have not. For the reasons disclosed within this Annual Report during the year the Company did not fully comply with the following additional provisions of the new code:
• Code Provision C1.2. The Directors should include in the Annual Report an explanation of the basis on which the Company generates or preserves value over the longer term (the business model) and the strategy for delivering the objectives of the Company. Information on the Company’s business model is given on pages 2 to 41 and a more detailed business model will be provided in the year ended September 2011 in accordance with UK Corporate Governance Code provisions.
Andrew JohnCompany Secretary 1 December 2010
Governance
Corporate Governance report continued
Group at a glance
Strategic overviewB
usiness performance
Governance
Financial statements
Shareholder information
www.tuitravelplc.com
TUI Travel PLC Annual Report & Accounts 2010 53
Remuneration report
Bill Logan has direct access to the Chairman of the Committee and, together with David House, they advised the Committee on all aspects of the Group’s reward policies and structures during the year. Peter Long attends meetings of the Committee to make recommendations relating to the performance and remuneration of his direct reports and Andrew John (Company Secretary) acts as Secretary to the Committee. Peter Long, Paul Bowtell, Bill Logan and Andrew John are not in attendance when their own remuneration is considered.
Deloitte, an external consultancy organisation, provided independent advice on all aspects of senior management remuneration. Deloitte also provides salary benchmarking information and tax services to the Group from time to time and verification of the relative performance conditions attached to the Performance Share Plan and Deferred Annual Bonus Scheme.
Herbert Smith advised on various legal issues relating to the Company’s share schemes and also provides other legal services to the Group.
Policy on remuneration of Non-Executive DirectorsNon-Executive Directors, including the Chairman, do not have service contracts and do not participate in the Group’s pension scheme, annual bonus scheme or long-term incentive schemes. Non-Executive Directors have second-term letters of appointment which can be terminated by either party serving three months’ notice (with the exception of Horst Baier whose initial appointment letter has not yet expired and, in common with all initial-term letters, provides for six months’ notice). In accordance with the requirements of the UK Corporate Governance Code all directors will be subject to re-election at the Annual General Meeting to be held on 3 February 2011.
Non-Executive Directors are paid a fee which is approved by the Board on the recommendation of the Executive Directors, having taken account of the fees paid in other companies of a similar complexity and the skills and experience of the individuals. The base fee for the Non-Executive Directors is £55,000 but the Chairman and Deputy Chairman (who is also the Senior Independent Director) are paid higher fees to reflect their additional responsibilities. The Chairman receives a fee of £300,000 and the Deputy Chairman receives a fee of £200,000. The Chairman of the Audit Committee and the Chairman of the Remuneration Committee receive an additional fee of £15,000 and £10,000 respectively.
Policy on remuneration of Executive Directors and senior executivesThe Committee aims to ensure that remuneration packages are offered which:
• Structure the reward of senior management to align their interests with those of the shareholders over the long-term;
• Reinforce the high-performance culture throughout the Group;
• Set the total remuneration package at an appropriate level to reflect the competitive market in which the Group operates; and
• Link a substantial proportion of the total remuneration package to the achievement of demanding financial performance targets.
The Remuneration Committee (the Committee) formulates and applies the Company policy around the reward of Executive Directors. It operates within the spirit of TUI Travel’s core values and looks to cultivate responsible leadership in its internal and external social environment. Consequently the Committee closely considers the Company’s sustained performance in building both shareholder value and a secure future for all its stakeholders.
This report has been prepared by the Committee and has been approved by the Board. It complies with Schedule 8 of the Large and Medium Sized Companies and Groups (Accounts and Reports) Regulations 2008. This report will be put to shareholders for approval at the Annual General Meeting to be held on Thursday 3 February 2011.
Remuneration CommitteeDuring the year, the Committee comprised the following Non-Executive Directors:
Clare Chapman – ChairmanTony CampbellBill DaltonDr Michael FrenzelRainer Feuerhake
Three of the members of the Committee are independent Non-Executive Directors. Dr Michael Frenzel and Rainer Feuerhake are not considered by the Company to be independent. Dr Frenzel is a member of the Executive Board of TUI AG and Rainer Feuerhake was a member of TUI AG’s Executive Board until his resignation in February 2010. TUI AG is a 54.92% shareholder of TUI Travel PLC as at 30 September 2010 and their appointments are pursuant to the Relationship Agreement between TUI AG and the Company.
No member of the Committee has any personal financial interest, other than as a shareholder (as disclosed in the interests in shares table on page 62), in the matters to be decided by the Committee. The three independent members of the Committee have no conflicts of interest arising from Committee members’ cross-directorships and none of the members of the Committee participate in any bonus schemes, pension plans, share awards or any employee share schemes in respect of the Company. Members of the Committee have no day-to-day involvement in the running of the Company.
The Committee had six working sessions during the year (which included four formal meetings). Tony Campbell was unable to attend on one occasion due to prior commitments.
The Committee advises the Board on overall remuneration policy. The Committee also determines, on behalf of the Board, and with the benefit of advice from external consultants and members of the Human Resources Department, the remuneration of the Executive Directors and other members of the Group Management Board. The activities of the Committee are governed by its Terms of Reference, which have been approved by the Board and can be found on the TUI Travel website at www.tuitravelplc.com
Material advice or services were provided to the Committee during the year by:
Deloitte LLP (Deloitte) Herbert Smith LLP (Herbert Smith) Peter Long – Chief Executive Paul Bowtell – Chief Financial Officer Bill Logan – Group Human Resources Director David House – Group Reward Director
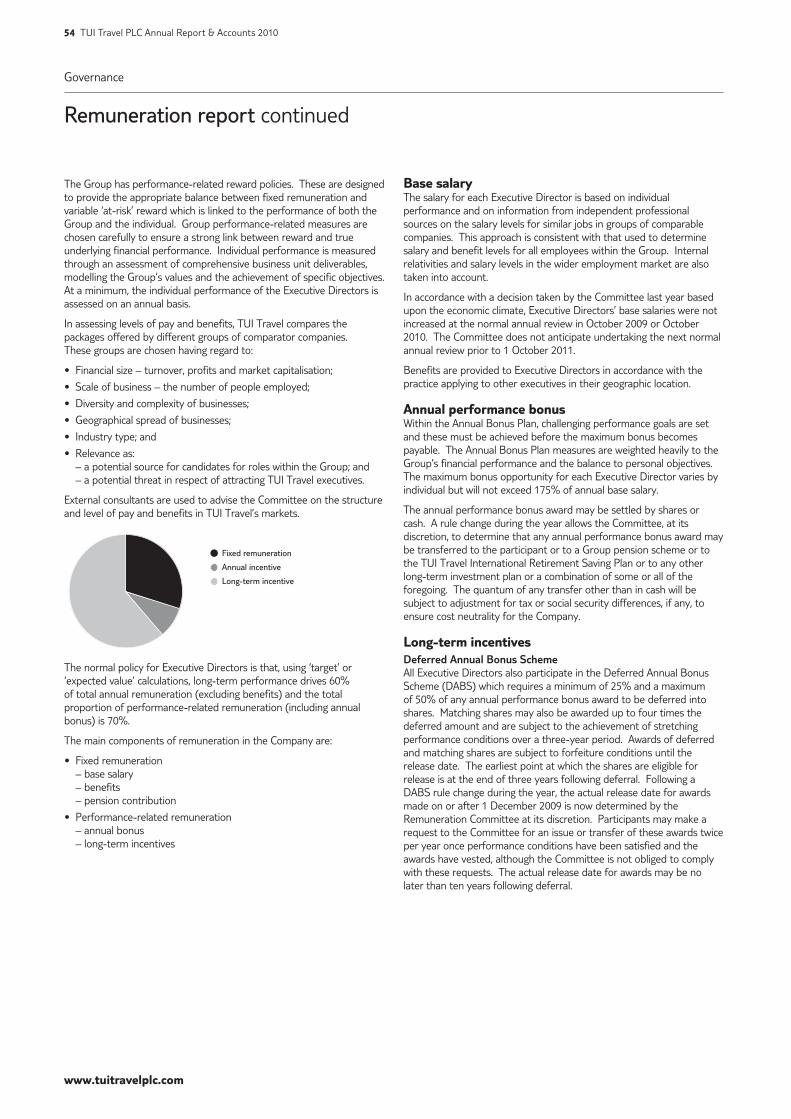
www.tuitravelplc.com
54 TUI Travel PLC Annual Report & Accounts 2010
Governance
Remuneration report continued
The Group has performance-related reward policies. These are designed to provide the appropriate balance between fixed remuneration and variable ‘at-risk’ reward which is linked to the performance of both the Group and the individual. Group performance-related measures are chosen carefully to ensure a strong link between reward and true underlying financial performance. Individual performance is measured through an assessment of comprehensive business unit deliverables, modelling the Group’s values and the achievement of specific objectives. At a minimum, the individual performance of the Executive Directors is assessed on an annual basis.
In assessing levels of pay and benefits, TUI Travel compares the packages offered by different groups of comparator companies. These groups are chosen having regard to:
• Financial size – turnover, profits and market capitalisation;
• Scale of business – the number of people employed;
• Diversity and complexity of businesses;
• Geographical spread of businesses;
• Industry type; and
• Relevance as: – a potential source for candidates for roles within the Group; and – a potential threat in respect of attracting TUI Travel executives.
External consultants are used to advise the Committee on the structure and level of pay and benefits in TUI Travel’s markets.
Fixed remuneration
Annual incentive
Long-term incentive
The normal policy for Executive Directors is that, using ‘target’ or ‘expected value’ calculations, long-term performance drives 60% of total annual remuneration (excluding benefits) and the total proportion of performance-related remuneration (including annual bonus) is 70%.
The main components of remuneration in the Company are:
• Fixed remuneration – base salary – benefits – pension contribution
• Performance-related remuneration – annual bonus – long-term incentives
Base salaryThe salary for each Executive Director is based on individual performance and on information from independent professional sources on the salary levels for similar jobs in groups of comparable companies. This approach is consistent with that used to determine salary and benefit levels for all employees within the Group. Internal relativities and salary levels in the wider employment market are also taken into account.
In accordance with a decision taken by the Committee last year based upon the economic climate, Executive Directors’ base salaries were not increased at the normal annual review in October 2009 or October 2010. The Committee does not anticipate undertaking the next normal annual review prior to 1 October 2011.
Benefits are provided to Executive Directors in accordance with the practice applying to other executives in their geographic location.
Annual performance bonusWithin the Annual Bonus Plan, challenging performance goals are set and these must be achieved before the maximum bonus becomes payable. The Annual Bonus Plan measures are weighted heavily to the Group’s financial performance and the balance to personal objectives. The maximum bonus opportunity for each Executive Director varies by individual but will not exceed 175% of annual base salary.
The annual performance bonus award may be settled by shares or cash. A rule change during the year allows the Committee, at its discretion, to determine that any annual performance bonus award may be transferred to the participant or to a Group pension scheme or to the TUI Travel International Retirement Saving Plan or to any other long-term investment plan or a combination of some or all of the foregoing. The quantum of any transfer other than in cash will be subject to adjustment for tax or social security differences, if any, to ensure cost neutrality for the Company.
Long-term incentivesDeferred Annual Bonus SchemeAll Executive Directors also participate in the Deferred Annual Bonus Scheme (DABS) which requires a minimum of 25% and a maximum of 50% of any annual performance bonus award to be deferred into shares. Matching shares may also be awarded up to four times the deferred amount and are subject to the achievement of stretching performance conditions over a three-year period. Awards of deferred and matching shares are subject to forfeiture conditions until the release date. The earliest point at which the shares are eligible for release is at the end of three years following deferral. Following a DABS rule change during the year, the actual release date for awards made on or after 1 December 2009 is now determined by the Remuneration Committee at its discretion. Participants may make a request to the Committee for an issue or transfer of these awards twice per year once performance conditions have been satisfied and the awards have vested, although the Committee is not obliged to comply with these requests. The actual release date for awards may be no later than ten years following deferral.
Group at a glance
Strategic overviewB
usiness performance
Governance
Financial statements
Shareholder information
www.tuitravelplc.com
TUI Travel PLC Annual Report & Accounts 2010 55
For awards of matching shares made during the year, no shares will vest unless the annual average of the ratio of the Group’s return on invested capital (ROIC) to the weighted average cost of capital (WACC) meets or exceeds one over the three-year period. A hurdle of ROIC, being at least equal to WACC, is used to ensure that the relevant long-term incentive awards pay out only when shareholder value is being created over the performance periods. If the ROIC/WACC hurdle is met, shares will only vest to the extent to which two further performance conditions are satisfied over the three-year period as follows:
• Up to three-quarters of the matching shares will vest based on growth in the Group’s earnings per share (EPS), before amortisation of merger intangibles, goodwill impairment and separately disclosed items, in relation to the growth in the UK Retail Price Index (RPI) as shown in the table below:
Average annual EPS growth in excess of RPI growth Proportion of matching shares vesting
Below 4% 0%Between 4% and 13% On a straightline basis
between 10% and 100%13% or above 100%
• Up to one-quarter of the matching shares will vest based on the Group’s ranking of total shareholder return (TSR) performance relative to companies ranked 30th to 100th by market capitalisation as at the date of the award as shown in the table below:
TSR Ranking Proportion of matching shares vesting
Below median 0%Between median and upper quartile On a straightline basis
between 15% and 100%At or above upper quartile 100%
Matching share awards lapse if the performance conditions are not met.
Performance Share PlanThe Performance Share Plan (PSP) allows Executive Directors and eligible participants to receive share awards, subject to the satisfaction of performance conditions set by the Committee, which are normally measured over a three-year period. Once vested, PSP shares are subject to forfeiture conditions until the release date. The earliest point at which the shares are eligible for release is the third anniversary of the award date. Following a PSP rule change during the year, for awards made on or after 1 December 2009, the actual release date is determined by the Remuneration Committee at its discretion. Participants may make a request to the Committee for an issue or transfer of these awards twice per year once performance conditions have been satisfied and the awards have vested, although the Committee is not obliged to comply with these requests. The actual release date for awards may be no later than 10 years following deferral. Awards are normally made annually and, except in exceptional circumstances, will not exceed two times annual salary for Executive Directors.
For awards made during the year, no shares will vest unless the annual average of the ratio of the Group’s ROIC to the WACC meets or exceeds one over the three-year period.
If the ROIC/WACC hurdle is met, shares will only vest to the extent to which two further performance conditions are satisfied over the three-year period as follows:
• Up to half of the shares will vest based on growth in the Group’s EPS, before amortisation of merger intangibles, goodwill impairment and separately disclosed items, in relation to the growth in the UK RPI as shown in the table below:
Average annual EPS growth in excess of RPI growth Proportion of shares vesting
Below 4% 0%Between 4% and 13% On a straightline basis
between 10% and 100%13% or above 100%
• Up to half of the matching shares will vest based on the Group’s ranking of total shareholder return (TSR) performance relative to companies ranked 30th to 100th by market capitalisation as at the date of the award as shown in the table below:
TSR Ranking Proportion of shares vesting
Below median 0%Between median and upper quartile On a straightline basis
between 15% and 100%At or above upper quartile 100%
Awards under the Performance Share Plan lapse if the performance conditions are not met.
The Committee considers that EPS and TSR are the key performance conditions that are most relevant to the Group. EPS is a key indicator of the Group’s underlying financial performance whilst TSR is a relative measure of shareholder value creation. A hurdle of ROIC, being at least equal to WACC, is used to ensure that the relevant long-term incentive awards pay out only when shareholder value is being created over the performance periods.
A further rule change during the year allows the Committee at its discretion to determine that any DABS or PSP award made on or after 1 December 2009 may be settled on the release date by a transfer of shares or cash to the participant or to a Group pension scheme or to the TUI Travel International Retirement Saving Plan or to any other long-term investment plan or a combination of some or all of the foregoing. The quantum of any transfer other than in shares will be equal to the market value of each vested share as at the release date subject to adjustment for tax or social security differences, if any, to ensure cost neutrality for the Company.
All-employee share schemesExecutive Directors based in the UK are eligible to participate in the HMRC-approved Share Incentive Plan which is an all-employee share scheme enabling staff to acquire shares in the Company on preferential terms. To further encourage employee shareholding in the Company, the Share Incentive Plan provides a matching share for every four shares bought by a participant under the plan. Matching shares are not subject to performance conditions.
Shareholding guidelinesThe Executive Directors will be expected to build, within five years of their appointment, and then maintain, a shareholding equal in value to 1.5 times their basic salary or two times in the case of the Chief Executive.
No new shares were issued during the year and therefore the Company has remained within its headroom limits for the issue of new shares under share incentive schemes. All share incentive awards made, and all future share incentive awards, will normally be settled with shares purchased in the market.
Policy on pensionsEach of the UK-based Executive Directors and senior executives participates in a defined contribution retirement or long-term investment scheme.
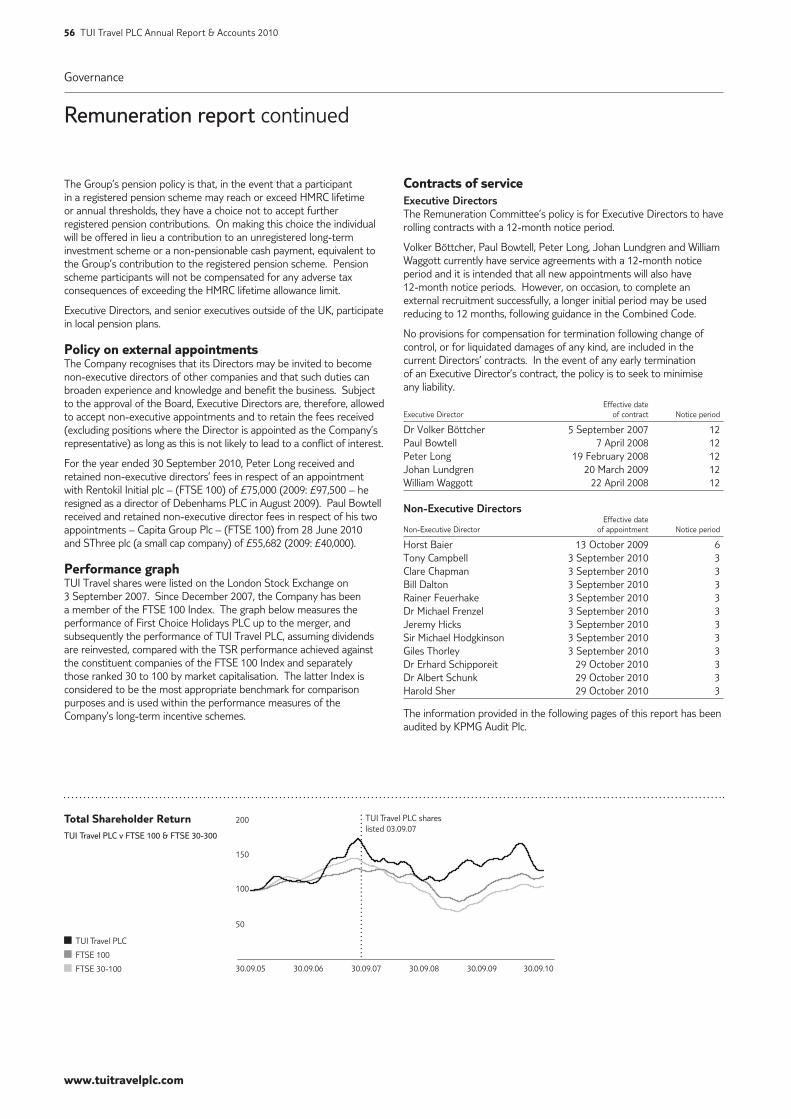
www.tuitravelplc.com
56 TUI Travel PLC Annual Report & Accounts 2010
Governance
Remuneration report continued
The Group’s pension policy is that, in the event that a participant in a registered pension scheme may reach or exceed HMRC lifetime or annual thresholds, they have a choice not to accept further registered pension contributions. On making this choice the individual will be offered in lieu a contribution to an unregistered long-term investment scheme or a non-pensionable cash payment, equivalent to the Group’s contribution to the registered pension scheme. Pension scheme participants will not be compensated for any adverse tax consequences of exceeding the HMRC lifetime allowance limit.
Executive Directors, and senior executives outside of the UK, participate in local pension plans.
Policy on external appointmentsThe Company recognises that its Directors may be invited to become non-executive directors of other companies and that such duties can broaden experience and knowledge and benefit the business. Subject to the approval of the Board, Executive Directors are, therefore, allowed to accept non-executive appointments and to retain the fees received (excluding positions where the Director is appointed as the Company’s representative) as long as this is not likely to lead to a conflict of interest.
For the year ended 30 September 2010, Peter Long received and retained non-executive directors’ fees in respect of an appointment with Rentokil Initial plc – (FTSE 100) of £75,000 (2009: £97,500 – he resigned as a director of Debenhams PLC in August 2009). Paul Bowtell received and retained non-executive director fees in respect of his two appointments – Capita Group Plc – (FTSE 100) from 28 June 2010 and SThree plc (a small cap company) of £55,682 (2009: £40,000).
Performance graphTUI Travel shares were listed on the London Stock Exchange on 3 September 2007. Since December 2007, the Company has been a member of the FTSE 100 Index. The graph below measures the performance of First Choice Holidays PLC up to the merger, and subsequently the performance of TUI Travel PLC, assuming dividends are reinvested, compared with the TSR performance achieved against the constituent companies of the FTSE 100 Index and separately those ranked 30 to 100 by market capitalisation. The latter Index is considered to be the most appropriate benchmark for comparison purposes and is used within the performance measures of the Company’s long-term incentive schemes.
Contracts of serviceExecutive DirectorsThe Remuneration Committee’s policy is for Executive Directors to have rolling contracts with a 12-month notice period.
Volker Böttcher, Paul Bowtell, Peter Long, Johan Lundgren and William Waggott currently have service agreements with a 12-month notice period and it is intended that all new appointments will also have 12-month notice periods. However, on occasion, to complete an external recruitment successfully, a longer initial period may be used reducing to 12 months, following guidance in the Combined Code.
No provisions for compensation for termination following change of control, or for liquidated damages of any kind, are included in the current Directors’ contracts. In the event of any early termination of an Executive Director’s contract, the policy is to seek to minimise any liability.
Effective date Executive Director of contract Notice period
Dr Volker Böttcher 5 September 2007 12Paul Bowtell 7 April 2008 12Peter Long 19 February 2008 12Johan Lundgren 20 March 2009 12William Waggott 22 April 2008 12
Non-Executive Directors Effective date Non-Executive Director of appointment Notice period
Horst Baier 13 October 2009 6Tony Campbell 3 September 2010 3Clare Chapman 3 September 2010 3Bill Dalton 3 September 2010 3Rainer Feuerhake 3 September 2010 3Dr Michael Frenzel 3 September 2010 3Jeremy Hicks 3 September 2010 3Sir Michael Hodgkinson 3 September 2010 3Giles Thorley 3 September 2010 3Dr Erhard Schipporeit 29 October 2010 3Dr Albert Schunk 29 October 2010 3Harold Sher 29 October 2010 3
The information provided in the following pages of this report has been audited by KPMG Audit Plc.
TUI Travel PLC
FTSE 100
FTSE 30-100
Total Shareholder ReturnTUI Travel PLC v FTSE 100 & FTSE 30-300
200
150
100
50
TUI Travel PLC shareslisted 03.09.07
30.09.05 30.09.06 30.09.07 30.09.08 30.09.09 30.09.10

Group at a glance
Strategic overviewB
usiness performance
Governance
Financial statements
Shareholder information
www.tuitravelplc.com
TUI Travel PLC Annual Report & Accounts 2010 57
Directors’ remuneration Total remuneration Performance payments excluding pensions Value For the year For the year Creation ended ended Basic salaries Annual Synergy 30 September 30 September and fees Bonus1 Plan2 Benefits3 2010 2009 £000 £000 £000 £000 £000 £000
Executive DirectorsDr Volker Böttcher4 474 – 336 17 827 891 Paul Bowtell 490 – 506 16 1,012 1,053 Peter Long 850 – 1,200 16 2,066 2,122 Johan Lundgren 605 – 618 183 1,406 1,437 William Waggott5 460 – 639 16 1,115 881 Non-Executive Directors Horst Baier 55 – – 55 – Tony Campbell 55 – – 55 55 Clare Chapman 65 – – 65 65 Bill Dalton 55 – – 55 55 Rainer Feuerhake 55 – – 55 55 Dr Michael Frenzel (Chairman) 300 – – 300 300 Jeremy Hicks 70 – – 70 70 Sir Michael Hodgkinson (Deputy Chairman) 200 – – 200 200 Dr Erhard Schipporeit 55 – – 55 55 Dr Albert Schunk 55 – – 55 55 Harold Sher 55 – – 55 55 Giles Thorley 55 – – 55 55
Total 3,954 – 3,299 248 7,501 7,404
1 ‘Annual Bonus’ figures include bonus awards in cash in respect of participation in the Annual Bonus Plan but exclude bonus awards in deferred shares, details of which are set out on page 58. In respect of their participation in the Annual Bonus Plan, the Executive Directors did not receive a cash bonus for the year. Notwithstanding the fact that the underlying EBIT and cash-flow measures were met in full, the Remuneration Committee decided that, in the context of an appropriate claw-back of prior year bonus due to the profit restatement and substantial one-off costs during the year, a cash bonus would not be payable.
2 ‘Value Creation Synergy Plan’ figures relate to the third and final award from this one-off three-year scheme which in accordance with the scheme design was due to be settled in cash. Further details of this scheme are set out on page 61. Synergy performance at the end of the third year was £195m compared to the target level of £100m and the maximum level of £150m. Further details about synergy performance are set out on page 61. The final cash award was therefore made at the maximum level for Messrs Böttcher, Bowtell, Long, Lundgren and Waggott.
3 ‘Benefits’ incorporate all tax assessable benefits arising from the individual’s employment. For Messrs Bowtell, Long and Waggott, this relates in the main to the provision of a fully expensed company car or car allowance and private healthcare cover, and for Mr Böttcher the provision of a fully expensed company car or car allowance. In addition to the provision of a fully expensed company car or car allowance and private healthcare cover, Mr Lundgren received housing and education benefits as part of the ongoing support relating to his relocation to the UK from Sweden on 1 August 2009.
4 In calculating remuneration for Mr Böttcher, payments made during the year in EUR have been converted at 1.15 to 1 GBP, being the average exchange rate for the period 1 October 2009 to 30 September 2010.
5 On 1 January 2010 Mr Waggott’s salary increased from £430,000 to £470,000 however his pension contribution reduced from 50% of base salary to 33% of base salary at the same time. This change was as a result of him taking Executive responsibility for the Accommodation & Destinations Sector and restructuring his overall package in favour of variable performance related pay.
www.tuitravelplc.com
58 TUI Travel PLC Annual Report & Accounts 2010
Directors’ pensionsDuring the year a contribution equal to 50% and 33% of base salary has been made into the TUI Travel International Retirement Saving Plan for the benefit of Peter Long and Johan Lundgren respectively. A contribution equal to 25% of base salary has been made into defined contribution pension scheme for the benefit of Paul Bowtell.
For the period 1 October 2009 to 31 December 2009 a contribution equal to 50% of base salary pro rata and for the period 1 January 2010 to 30 September 2010 a contribution of 33% of base salary pro rata has been made into a defined contribution scheme for the benefit of William Waggott.
In addition, William Waggott has deferred pension entitlements under the Defined Benefit section of the TUI Pension Scheme (UK). He ceased to be an active member of the Defined Benefit section on 3 September 2007 and, therefore, no increase in accrued benefit has occurred during the year.
The normal retirement date for the UK-based Executive Directors and senior executives is 65.
In the event of death in service, the Executive Directors’ and senior executives’ pension arrangements provide lump sums for the purchase of dependants’ pensions of the greater of eight times salary or the value of the pension fund in addition to which a lump sum of four times salary is payable. Following the changes to the tax rules from April 2006, any dependant’s pension may be paid as an additional lump sum subject to HMRC limits.
Dr Volker Böttcher participates in separate pension arrangements in Germany at a cost of 25% of base salary.
Pension contributions for Directors Pension contributions or allowance for the year ended 30 September 2010 Executive Director £000
Dr Volker Böttcher 118Paul Bowtell 123Peter Long 425Johan Lundgren 200William Waggott 170
Total 1,036
Total pension contributions or allowances for the year ended 30 September 2010 were £1.036m. In calculating this total, payments made in EUR have been converted at 1.15 to 1 GBP, being the average exchange rate for the year ended 30 September 2010.
Long-term incentivesDeferred Annual Bonus Scheme (DABS)Messrs Böttcher, Bowtell, Long, Lundgren and Waggott participated in the DABS during the year ended 30 September 2010 and, with the exception of Mr Bowtell, are expected to receive an award on 2 December 2010 as follows:
Estimated value of award Director £000
Dr Volker Böttcher 284Peter Long 744Johan Lundgren 363William Waggott 282
Awards made under the DABS, and which remain outstanding at 30 September 2010, are given in the table on page 59.
Governance
Remuneration report continued

Group at a glance
Strategic overviewB
usiness performance
Governance
Financial statements
Shareholder information
www.tuitravelplc.com
TUI Travel PLC Annual Report & Accounts 2010 59
Deferred Annual Bonus Scheme (DABS) Maximum DABS shares DABS shares DABS shares value awarded vested released Maximum based on DABS shares during the Market price during the Market price Planned/ during the Market price DABS shares share price held at year ended per share year ended per share Market value Actual year ended per share Market value held at of 214.4p atDirectors 1/10/2009 30/09/2010 Award date at award 30/09/2010 at vesting at vesting vesting date 30/09/2010 at release at release Release date 30/09/2010 30/09/2010
Dr Volker Böttcher 60,4322 19.12.07 270.40p 19.12.10 60,432 129,566 241,7293 19.12.07 270.40p 19.12.10 241,729 518,267 104,8094 28.11.08 205.25p 28.11.11 104,809 224,710 419,2365 28.11.08 205.25p 28.11.11 419,236 898,842 101,8196 02.12.09 243.30p 02.12.12 101,819 218,300 407,2767 02.12.09 243.30p 02.12.12 407,276 873,200
Total 826,206 509,095 1,335,301 2,862,885
Paul Bowtell 156,9231 13.02.07 260.00p 147,311 262.10p 386,102 15.02.10 147,311 262.10p 386,102 15.02.10 – – 67,5992 19.12.07 270.40p 67,599 243.30p 164,468 02.12.09 27,716 243.30p 67,433 02.12.09 39,8838 85,509 270,3943 19.12.07 270.40p 19.12.10 270,394 579,725 134,4704 28.11.08 205.25p 134,470 243.30p 327,166 02.12.09 55,133 243.30p 134,139 02.12.09 79,3378 170,099 537,8805 28.11.08 205.25p 28.11.11 537,880 1,153,215 120,8386 02.12.09 243.30p 120,838 243.30p 293,999 02.12.09 49,544 243.30p 120,541 02.12.09 71,2948 152,854 483,3527 02.12.09 243.30p 02.12.12 483,352 1,036,307
Total 1,167,266 604,190 279,704 708,215 1,482,140 3,177,709
Peter Long 326,1551 13.02.07 260.00p 306,178 262.10p 802,493 15.02.10 306,178 262.10p 802,493 15.02.10 – – 138,2882 19.12.07 270.40p 138,288 243.30p 336,455 02.12.09 56,699 243.30p 137,949 02.12.09 81,5898 174,927 553,1503 19.12.07 270.40p 19.12.10 553,150 1,185,954 292,3264 28.11.08 205.25p 292,326 243.30p 711,229 02.12.09 119,854 243.30p 291,605 02.12.09 172,4728 369,780 1,169,3045 28.11.08 205.25p 28.11.11 1,169,304 2,506,988 262,0226 02.12.09 243.30p 262,022 243.30p 637,500 02.12.09 107,430 243.30p 261,377 02.12.09 154,5928 331,445 1,048,0887 02.12.09 243.30p 02.12.12 1,048,088 2,247,101
Total 2,479,223 1,310,110 590,161 1,493,424 3,179,195 6,816,195
Johan Lundgren 67,4312 19.12.07 270.40p 67,431 243.30p 164,060 02.12.09 27,647 243.30p 67,265 02.12.09 39,7848 85,297 269,7233 19.12.07 270.40p 19.12.10 269,723 578,286 135,4464 28.11.08 205.25p 135,446 243.30p 329,540 02.12.09 55,533 243.30p 135,112 02.12.09 79,9138 171,333 541,7845 28.11.08 205.25p 28.11.11 541,784 1,161,585 105,8636 02.12.09 243.30p 105,863 243.30p 257,565 02.12.09 43,404 243.30p 105,602 02.12.09 62,4598 133,912 423,4527 02.12.09 243.30p 02.12.12 423,452 907,881
Total 1,014,384 529,315 126,584 307,979 1,417,115 3,038,294
William Waggott 73,5582 19.12.07 270.40p 73,558 243.30p 178,967 02.12.09 30,159 243.30p 73,377 02.12.09 43,3998 93,047 294,2303 19.12.07 270.40p 19.12.10 294,230 630,829 97,4424 28.11.08 205.25p 97,442 243.30p 237,076 02.12.09 39,952 243.30p 97,203 02.12.09 57,4908 123,259 389,7685 28.11.08 205.25p 28.11.11 389,768 835,663 88,3686 02.12.09 243.30p 88,368 243.30p 214,999 02.12.09 36,231 243.30p 88,150 02.12.09 52,1378 111,782 353,4727 02.12.09 243.30p 02.12.12 353,472 757,844
Total 854,998 441,840 106,342 258,730 1,190,496 2,552,424
Grand Total 6,342,077 3,394,550 1,102,791 2,768,348 8,604,247 18,447,507
1 This ‘roll-over’ award is based on a) performance to 30 September 2009 where the performance measure relates to EPS growth in excess of the rate of inflation and b) performance to the 3rd anniversary of the award date where the performance measure relates to the Company’s TSR ranking against the constituent companies of the FTSE Mid-250 index (excluding Investment Trusts) as calculated at the Award date. A performance hurdle of the ROIC being in excess of the WACC must also be achieved for any of the award to be released. The number of shares released is graded according to a) EPS growth, with 7.5% of the award being released for 4% per annum in excess of inflation and 75% of the award released for 13% per annum in excess of inflation and b) ranking of the Company against the comparator group, with 2.5% of the award being released for median and 25% of the award being released for upper quartile. The ROIC/WACC hurdle was achieved, EPS growth was greater than 13% per annum in excess of inflation and the Company TSR ranking was 69th percentile therefore 93.875% of the award was released on 15 February 2010.
2 This award is the deferred element of the Annual Bonus entitlement for Financial Year 2006/07 and is subject only to continued employment to the release date.
3 This matching award is based on a) performance to 30 September 2010 where the performance measure relates to (EPS) growth in excess of the rate of inflation and b) performance to the 3rd anniversary of the award date where the performance measure relates to the Company’s TSR ranking against the constituent companies of the FTSE 100 index ranked 30 to 100 by market capitalisation as calculated at the award date. A performance hurdle of the return on ROIC being in excess of the WACC must also be achieved for any of the award to be released. The number of shares released is graded according to a) EPS growth, with 7.5% of the award being released for 12% in excess of inflation and 75% of the award released for 39% in excess of inflation and b) ranking of the Company against the comparator group, with 3.75% of the award being released for median and 25% of the award being released for upper quartile.
4 This award is the deferred element of the Annual Bonus entitlement for Financial Year 2007/08 and is subject only to continued employment to the release date.
5 This matching award is based on a) performance to 30 September 2011 where the performance measure relates to EPS growth in excess of the rate of inflation and b) performance to the 3rd anniversary of the award date where the performance measure relates to the Company’s TSR ranking against the constituent companies of the FTSE 100 index ranked 30 to 100 by market capitalisation as calculated at the award date. A performance hurdle of the ROIC being in excess of the WACC must also be achieved for any of the award to be released. The number of shares released is graded according to a) EPS growth, with 7.5% of the award being released for 12% in excess of inflation and 75% of the award released for 39% in excess of inflation and b) ranking of the Company against the comparator group, with 3.75% of the award being released for median and 25% of the award being released for upper quartile.
6 This award is the deferred element of the Annual Bonus entitlement for Financial Year 2008/09 and is subject only to continued employment to the release date.
7 This matching award is based on performance to 30 September 2012 where the performance measure relates to a) EPS growth in excess of the rate of inflation and b) the Company’s TSR ranking against the constituent companies of the FTSE 100 index ranked 30 to 100 by market capitalisation as calculated at the award date. A performance hurdle of the ROIC being in excess of the WACC must also be achieved for any of the award to be released. The number of shares released is graded according to a) EPS growth, with 7.5% of the award being released for 12% in excess of inflation and 75% of the award released for 39% in excess of inflation and b) ranking of the Company against the comparator group, with 3.75% of the award being released for median and 25% of the award being released for upper quartile.
8 During the year the Director and the Company agreed to enter into a joint election pursuant to section 431(1) of the Income Tax (Earnings and Pensions) Act 2003 in respect of this award. Consequently, the Remuneration Committee agreed to vest these awards early and release sufficient shares to satisfy the tax liability arising from the joint election. The remaining shares, which are vested, are held as restricted shares and will not be released before the third anniversary of the original award date. These restricted shares are subject to claw-back conditions in accordance with the scheme rules.
www.tuitravelplc.com
60 TUI Travel PLC Annual Report & Accounts 2010
Governance
Remuneration report continued
Performance Share Plan (PSP)Awards made under the PSP, and which remain outstanding at 30 September 2010 are: Maximum Maximum PSP shares PSP shares PSP shares value Maximum vested vested released Maximum based on PSP shares during the Market price during the Market price Planned/ during the Market price PSP shares share price held at year ended per share year ended per share Market value Actual year ended per share Market value held at of 214.4p atDirectors 1/10/2009 30/09/2010 Award date at award 30/09/2010 at vesting at vesting £ vesting date 30/09/2010 at release at release Release date 30/09/2010 30/09/2010
Dr Volker Böttcher 78,8881 03.09.07 285.50p 78,888 262.10p 206,765 15.02.10 78,888 262.10p 206,765 15.02.10 – – 129,2092 13.09.07 273.00p – 02.12.10 129,209 277,024 221,8293 28.11.08 205.25p – 28.11.11 221,829 475,601 203,6393 02.12.09 243.30p 02.12.12 203,639 436,602
Total 429,926 203,639 78,888 206,765 554,677 1,189,227
Paul Bowtell 74,0391 – 13.02.07 260.00p 74,039 262.10p 194,056 15.02.10 74,039 262.10p 194,056 15.02.10 – – 202,1982 – 13.09.07 273.00p – 02.12.10 202,198 433,513 286,4793 28.11.08 205.25p – 28.11.11 286,479 614,211 241,6764 02.12.09 243.30p 02.12.12 241,676 518,153
Total 562,716 241,676 74,039 194,056 730,353 1,565,877
Peter Long 173,0781 – 13.02.07 260.00p 173,078 262.10p 453,637 15.02.10 173,078 262.10p 453,637 15.02.10 – – 586,0812 – 13.09.07 273.00p – 02.12.10 586,081 1,256,558 828,2583 28.11.08 205.25p – 28.11.11 828,258 1,775,785 698,7254 02.12.09 243.30p 02.12.12 698,725 1,498,066
Total 1,587,417 698,725 173,078 453,637 2,113,064 4,530,409
Johan Lundgren 130,3481 – 03.09.07 285.50p 130,348 262.10p 341,642 15.02.10 130,348 262.10p 341,642 15.02.10 – – 104,7732 – 13.09.07 273.00p – 02.12.10 104,773 224,633 192,3072 19.12.07 270.40p – 19.12.10 192,307 412,306 287,1063 28.11.08 205.25p – 28.11.11 287,106 615,555 248,6644 02.12.09 243.30p 02.12.12 248,664 533,136
Total 714,534 248,664 130,348 341,642 832,850 1,785,630
William Waggott 244,6851 – 03.09.07 285.50p 244,685 262.10p 641,319 15.02.10 244,685 262.10p 641,319 15.02.10 – – 146,5202 – 13.09.07 273.00p – 02.12.10 146,520 314,139 209,5003 28.11.08 205.25p – 28.11.11 209,500 449,168 176,7364 02.12.09 243.30p 02.12.12 176,736 378,922
Total 600,705 176,736 244,685 641,319 532,756 1,142,229
Grand Total 3,895,298 1,569,440 701,038 1,837,419 4,763,700 10,213,372
1 This ‘roll-over’ award is based on performance from 1 November 2006 to 30 September 2009 where the performance measure relates to EPS growth in excess of the rate of inflation and a performance hurdle of the ROIC being in excess of the WACC. The number of shares released is graded according to EPS growth, with 10% of the award being released for 4% per annum in excess of inflation and the entire award released for 13% per annum in excess of inflation. The ROIC/WACC hurdle was achieved and EPS growth was greater than 13% per annum in excess of inflation therefore the entire award was released on 15 February 2010.
2 This award is based on a) performance to 30 September 2010 where the performance measure relates to EPS growth in excess of the rate of inflation and b) performance to the 3rd anniversary of the award date where the performance measure relates to the Company’s TSR ranking against the constituent companies of the FTSE 100 index ranked 30 to 100 by market capitalisation as calculated at the award date. A performance hurdle of the ROIC being in excess of the weighted average cost of capital (WACC) must also be achieved for any of the award to be released. The number of shares released is graded according to a) EPS growth, with 5% of the award being released for 12% in excess of inflation and 50% of the award released for 39% in excess of inflation and b) ranking of the Company against the comparator group, with 7.5% of the award being released for median and 50% of the award being released for upper quartile.
3 This award is based on a) performance to 30 September 2011 where the performance measure relates to EPS growth in excess of the rate of inflation and b) performance to the 3rd anniversary of the award date where the performance measure relates to the Company’s TSR ranking against the constituent companies of the FTSE 100 index ranked 30 to 100 by market capitalisation as calculated at the award date. A performance hurdle of the ROIC being in excess of the WACC must also be achieved for any of the award to be released. The number of shares released is graded according to a) EPS growth, with 5% of the award being released for 12% in excess of inflation and 50% of the award released for 39% in excess of inflation and b) ranking of the Company against the comparator group, with 7.5% of the award being released for median and 50% of the award being released for upper quartile.
4 This award is based on performance to 30 September 2012 where the performance measure relates to a) EPS growth in excess of the rate of inflation and b) the Company’s TSR ranking against the constituent companies of the FTSE 100 index ranked 30 to 100 by market capitalisation as calculated at the award date. A performance hurdle of the ROIC being in excess of the WACC must also be achieved for any of the award to be released. The number of shares released is graded according to a) EPS growth, with 5% of the award being released for 12% in excess of inflation and 50% of the award released for 39% in excess of inflation and b) ranking of the Company against the comparator group, with 7.5% of the award being released for median and 50% of the award being released for upper quartile.
Group at a glance
Strategic overviewB
usiness performance
Governance
Financial statements
Shareholder information
www.tuitravelplc.com
TUI Travel PLC Annual Report & Accounts 2010 61
Value Creation Synergy Plan (VCSP)The Value Creation Synergy Plan (VCSP), was a one-off three-year plan and Executive Directors received an award which was to be satisfied by a combination of cash and shares provided that stretching performance targets were satisfied. The performance targets, set by the Committee, were based on the achievement of the synergistic objectives of the merger of First Choice Holidays PLC (now First Choice Holidays Limited) and the Tourism Division of TUI AG.
The awards, being a combination of cash and shares, related to performance over three years, as shown below:
Tranche 1 (2007/2008): 50% cash and 50% shares; Tranche 2 (2008/2009): 50% cash and 50% shares; and Tranche 3 (2009/2010): 100% cash.
Cash entitlements were paid immediately following confirmation of annual performance achievement, shares were deferred until the end of the three-year period. The release of the deferred shares elements was subject to an additional overall three-year performance target.
The overall three-year performance target was set at £100m of synergistic value (below which no vesting would occur) with a vesting scale up to a ‘stretch’ level of £150m. In addition, the Committee set annual profit margin targets below which no payment or vesting would occur.
At target and stretch annual performance, the proportion vesting under each annual tranche was 50% and 100% respectively. In the event of the overall three-year performance target not being achieved, any net amounts previously paid in relation to the cash elements of Tranches 1 and 2 must be repaid to the Company.
The overall synergy value achievement over the three-year period is £195m as described in detail on page 41 of this report.
Value Creation Synergy Plan (VCSP)Awards made under the VCSP, and which remain outstanding at 30 September 2010, are given in the table below. Maximum VCSP shares VCSP shares VCSP shares value awarded vested released Maximum based on VCSP shares during the Market price during the Market price Planned/ during the Market price VCSP shares share price held at year ended per share year ended per share Value at Actual year ended per share Market value held at of 214.4p atDirectors 1/10/2009 30/09/2010 Award date at award 30/09/2010 at vesting vesting £ vesting date 30/09/2010 at release at release Release date 30/09/2010 30/09/2010
Dr Volker Böttcher 78,6061 28.11.08 205.25p 02.12.10 78,606 168,531 72,1612 02.12.09 243.30p 02.12.10 72,161 154,713
Total 78,606 72,161 150,767 323,244
Paul Bowtell 123,2641 28.11.08 205.25p 123,264 243.30p 299,901 02.12.09 50,539 243.30p 122,961 72,7253 155,922 103,986 02.12.09 243.30p 103,986 243.30p 252,998 02.12.09 42,635 243.30p 103,731 61,3513 131,537
Total 123,264 103,986 93,174 226,692 134,076 287,459
Peter Long 292,3261 28.11.08 205.25p 292,326 243.30p 711,229 02.12.09 119,854 243.30p 291,605 172,4723 369,780 246,609 02.12.09 243.30p 246,609 243.30p 600,000 02.12.09 101,110 243.30p 246,001 145,4993 311,950
Total 292,326 246,609 220,964 537,606 317,971 681,730
Johan Lundgren 148,9901 28.11.08 205.25p 148,990 243.30p 362,493 02.12.09 61,086 243.30p 148,622 87,9043 188,466 127,030 02.12.09 243.30p 127,030 243.30p 309,064 02.12.09 52,083 243.30p 126,718 74,9473 160,686
Total 148,990 127,030 113,169 275,340 162,851 349,152
William Waggott 107,1861 28.11.08 205.25p 107,186 243.30p 260,784 02.12.09 43,947 243.30p 106,923 63,2393 135,584 90,4232 02.12.09 243.30p 90,423 243.30p 219,999 02.12.09 37,074 243.30p 90,201 53,3493 114,380
Total 107,186 90,423 81,021 197,124 116,588 249,964
Grand Total 750,372 640,209 508,328 1,236,762 882,253 1,891,549
1 This award is the deferred element of Tranche 1 of the VCSP for Financial Year 2007/08. A profit margin performance hurdle must also be achieved for any of the award to vest. The vesting of shares is graded according to synergistic value achieved with none of the award vesting for synergistic value below £100m and all of the award vesting for £150m synergistic value or more. The profit margin hurdle was exceeded and the synergy performance was £195m therefore all of the shares vested. Further details regarding the synergy performance achieved are set out on page 41.
2 This award is the deferred element of Tranche 2 of the VCSP for Financial Year 2008/09. A profit margin performance hurdle must also be achieved for any of the award to vest. The vesting of shares is graded according to synergistic value achieved with none of the award vesting for synergistic value below £100m and all of the award vesting for £150m synergistic value or more. The profit margin hurdle was exceeded and the synergy performance was £195m therefore all of the shares vested. Further details regarding the synergy performance achieved are set out on page 41.
3 During the year the Director and the Company agreed to enter into a joint election pursuant to section 431(1) of the Income Tax (Earnings and Pensions) Act 2003 in respect of this award. Consequently, the Remuneration Committee agreed to vest these awards early and release sufficient shares to satisfy the tax liability arising from the joint election. The remaining shares, which are vested, are held as restricted shares and will not be released before the third anniversary of the original award date. These restricted shares are subject to claw-back conditions in accordance with the scheme rules.

www.tuitravelplc.com
62 TUI Travel PLC Annual Report & Accounts 2010
Directors’ interests in ordinary shares of the CompanyAs at 30 September 2010, the Directors’ interests in ordinary shares of the Company were:
Ordinary shares of 10p each Director’s name Title as at 30 September 2010
Horst Baier Non-Executive Director –Dr Volker Böttcher Managing Director, Central Europe 75,814Paul Bowtell* Chief Financial Officer 880,504Tony Campbell Non-Executive Director 44,863Clare Chapman Non-Executive Director 10,000Bill Dalton Non-Executive Director 10,000Rainer Feuerhake Non-Executive Director –Dr Michael Frenzel Non-Executive Chairman –Jeremy Hicks Non-Executive Director –Sir Michael Hodgkinson Non-Executive Deputy Chairman and Senior Independent Director 20,000Peter Long* Chief Executive 3,154,859Johan Lundgren Managing Director, Northern Region 430,000Dr Erhard Schipporeit Non-Executive Director –Dr Albert Schunk Non-Executive Director –Harold Sher Non-Executive Director –Giles Thorley Non-Executive Director 25,000William Waggott* Commercial Director 389,237
*Includes shares purchased under the Share Incentive Plan.
The Company’s Register of Directors’ Interests, which is open to inspection at the Registered Office, contains full details of Directors’ shareholdings and will be available for inspection before and during the Annual General Meeting to be held on Thursday 3 February 2011.
During the year, the price of the Company’s ordinary shares ranged between 190.0p and 308.4p and the mid-closing price on 30 September 2010 was 214.4p.
On 1 October 2010, Tony Campbell was allocated 651 additional shares in respect of the Dividend Reinvestment Plan.
The Remuneration report was approved by a duly authorised Committee of the Board of Directors on 1 December 2010 and signed on its behalf by:
Clare ChapmanChairman of the Remuneration Committee1 December 2010
Governance
Remuneration report continued
Group at a glance
Strategic overviewB
usiness performance
Governance
Financial statements
Shareholder information
www.tuitravelplc.com
TUI Travel PLC Annual Report & Accounts 2010 63
Opinion on other matters prescribed by the Companies Act 2006In our opinion:
• the part of the Directors’ Remuneration Report to be audited has been properly prepared in accordance with the Companies Act 2006; and
• the information given in the Directors’ Report for the financial year for which the financial statements are prepared is consistent with the financial statements.
Matters on which we are required to report by exceptionWe have nothing to report in respect of the following:
Under the Companies Act 2006 we are required to report to you if, in our opinion:
• adequate accounting records have not been kept by the parent company, or returns adequate for our audit have not been received from branches not visited by us; or
• the parent company financial statements and the part of the Directors’ Remuneration Report to be audited are not in agreement with the accounting records and returns; or
• certain disclosures of Directors’ remuneration specified by law are not made; or
• we have not received all the information and explanations we require for our audit.
Under the Listing Rules we are required to review:
• the Directors’ statement, set out on page 46, in relation to going concern; and
• the part of the Corporate Governance Statement relating to the Company’s compliance with the nine provisions of the June 2008 Combined Code specified for our review.
Oliver Tant (Senior Statutory Auditor) for and on behalf of
KPMG Audit Plc, Statutory Auditor Chartered Accountants 15 Canada Square London E14 5GL 1 December 2010
We have audited the financial statements of TUI Travel PLC for the year ended 30 September 2010 set out on pages 64 to 141. We have not audited the pro forma information on page 64. The financial reporting framework that has been applied in the preparation of the Group financial statements is applicable law and International Financial Reporting Standards (IFRSs) as adopted by the EU. The financial reporting framework that has been applied in the preparation of the parent company financial statements is applicable law and UK Accounting Standards (UK Generally Accepted Accounting Practice).
This report is made solely to the Company’s members, as a body, in accordance with Chapter 3 of Part 16 of the Companies Act 2006. Our audit work has been undertaken so that we might state to the Company’s members those matters we are required to state to them in an auditors’ report and for no other purpose. To the fullest extent permitted by law, we do not accept or assume responsibility to anyone other than the Company and the Company’s members, as a body, for our audit work, for this report, or for the opinions we have formed.
Respective responsibilities of Directors and AuditorsAs explained more fully in the Directors’ Responsibilities Statement set out on page 47, the Directors are responsible for the preparation of the financial statements and for being satisfied that they give a true and fair view. Our responsibility is to audit the financial statements in accordance with applicable law and International Standards on Auditing (UK and Ireland). Those standards require us to comply with the Auditing Practices Board’s (APB’s) Ethical Standards for Auditors.
Scope of the audit of the financial statementsA description of the scope of an audit of financial statements is provided on the APB’s website at www.frc.org.uk/apb/scope/UKP.
Opinion on financial statementsIn our opinion:
• the financial statements give a true and fair view of the state of the Group’s and of the parent company’s affairs as at 30 September 2010 and of the Group’s loss for the year then ended;
• the Group financial statements have been properly prepared in accordance with IFRSs as adopted by the EU;
• the parent company financial statements have been properly prepared in accordance with UK Generally Accepted Accounting Practice;
• the financial statements have been prepared in accordance with the requirements of the Companies Act 2006; and, as regards the Group financial statements, Article 4 of the IAS Regulation.
Independent Auditors’ report to the members of TUI Travel PLC
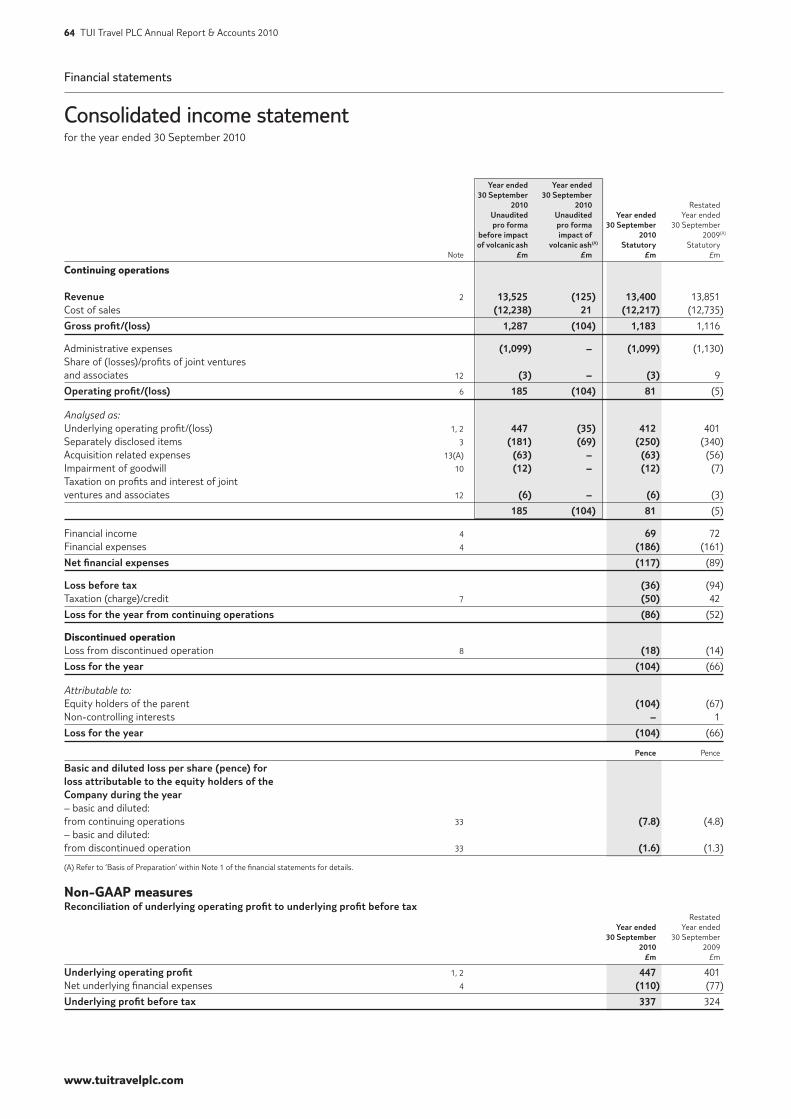
www.tuitravelplc.com
64 TUI Travel PLC Annual Report & Accounts 2010
Financial statements
Consolidated income statementfor the year ended 30 September 2010
Yearended Yearended 30September 30September 2010 2010 Restated Unaudited Unaudited Yearended Year ended proforma proforma 30September 30 September beforeimpact impactof 2010 2009(A) ofvolcanicash volcanicash(A) Statutory Statutory Note £m £m £m £m
Continuing operationsRevenue 2 13,525 (125) 13,400 13,851 Cost of sales (12,238) 21 (12,217) (12,735)
Grossprofit/(loss) 1,287 (104) 1,183 1,116
Administrative expenses (1,099) – (1,099) (1,130)Share of (losses)/profits of joint ventures and associates 12 (3) – (3) 9
Operatingprofit/(loss) 6 185 (104) 81 (5)
Analysed as:Underlying operating profit/(loss) 1, 2 447 (35) 412 401 Separately disclosed items 3 (181) (69) (250) (340)Acquisition related expenses 13(A) (63) – (63) (56)Impairment of goodwill 10 (12) – (12) (7)Taxation on profits and interest of joint ventures and associates 12 (6) – (6) (3)
185 (104) 81 (5)
Financial income 4 69 72 Financial expenses 4 (186) (161)
Netfinancialexpenses (117) (89)
Lossbeforetax (36) (94)Taxation (charge)/credit 7 (50) 42
Lossfortheyearfromcontinuingoperations (86) (52)
Discontinued operationLoss from discontinued operation 8 (18) (14)
Lossfortheyear (104) (66)
Attributable to:Equity holders of the parent (104) (67)Non-controlling interests – 1
Lossfortheyear (104) (66)
Pence Pence
Basicanddilutedlosspershare(pence)forlossattributabletotheequityholdersoftheCompanyduringtheyear– basic and diluted: from continuing operations 33 (7.8) (4.8)– basic and diluted: from discontinued operation 33 (1.6) (1.3)
(A) Refer to ‘Basis of Preparation’ within Note 1 of the financial statements for details.
Non-GAAP measuresReconciliationofunderlyingoperatingprofittounderlyingprofitbeforetax Restated Yearended Year ended 30September 30 September 2010 2009 £m £m
Underlyingoperatingprofit 1, 2 447 401 Net underlying financial expenses 4 (110) (77)
Underlyingprofitbeforetax 337 324
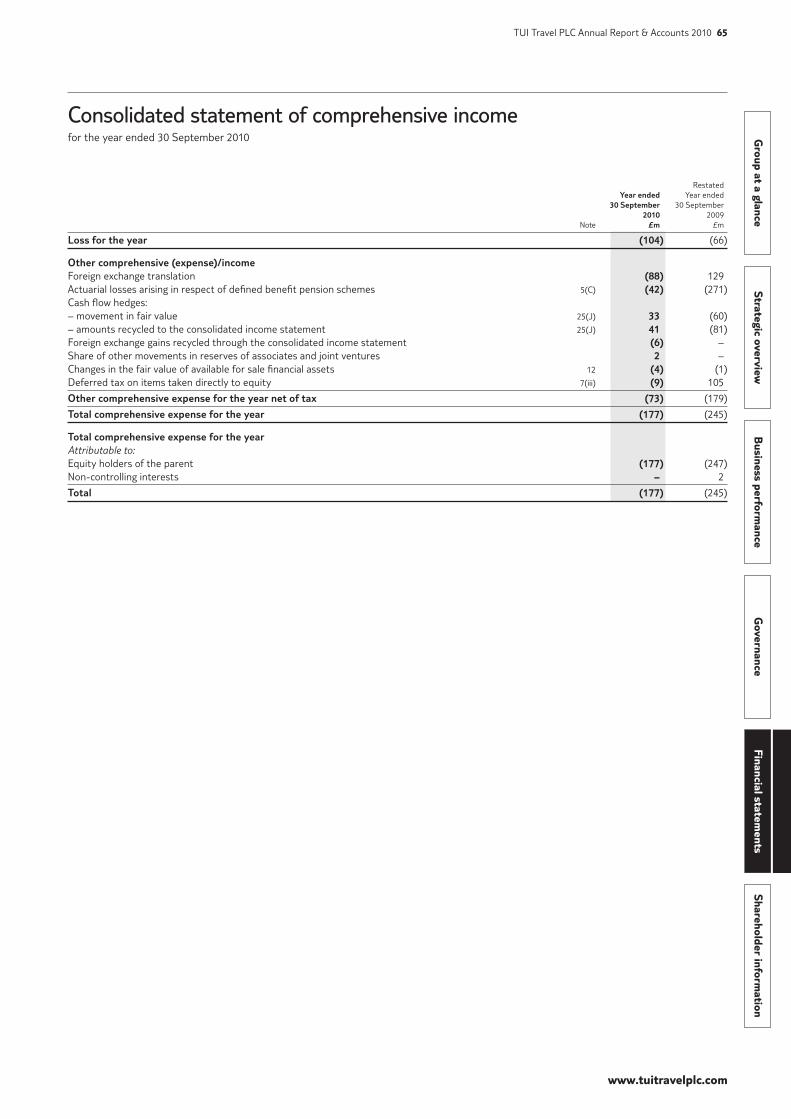
www.tuitravelplc.com
Group at a glance
Strategic overviewB
usiness performance
Governance
Financial statements
Shareholder information
TUI Travel PLC Annual Report & Accounts 2010 65
Restated Yearended Year ended 30September 30 September 2010 2009 Note £m £m
Lossfortheyear (104) (66)
Othercomprehensive(expense)/incomeForeign exchange translation (88) 129 Actuarial losses arising in respect of defined benefit pension schemes 5(C) (42) (271)Cash flow hedges:– movement in fair value 25(J) 33 (60)– amounts recycled to the consolidated income statement 25(J) 41 (81)Foreign exchange gains recycled through the consolidated income statement (6) – Share of other movements in reserves of associates and joint ventures 2 –Changes in the fair value of available for sale financial assets 12 (4) (1)Deferred tax on items taken directly to equity 7(iii) (9) 105
Othercomprehensiveexpensefortheyearnetoftax (73) (179)
Totalcomprehensiveexpensefortheyear (177) (245)
TotalcomprehensiveexpensefortheyearAttributable to:Equity holders of the parent (177) (247)Non-controlling interests – 2
Total (177) (245)
Consolidated statement of comprehensive incomefor the year ended 30 September 2010
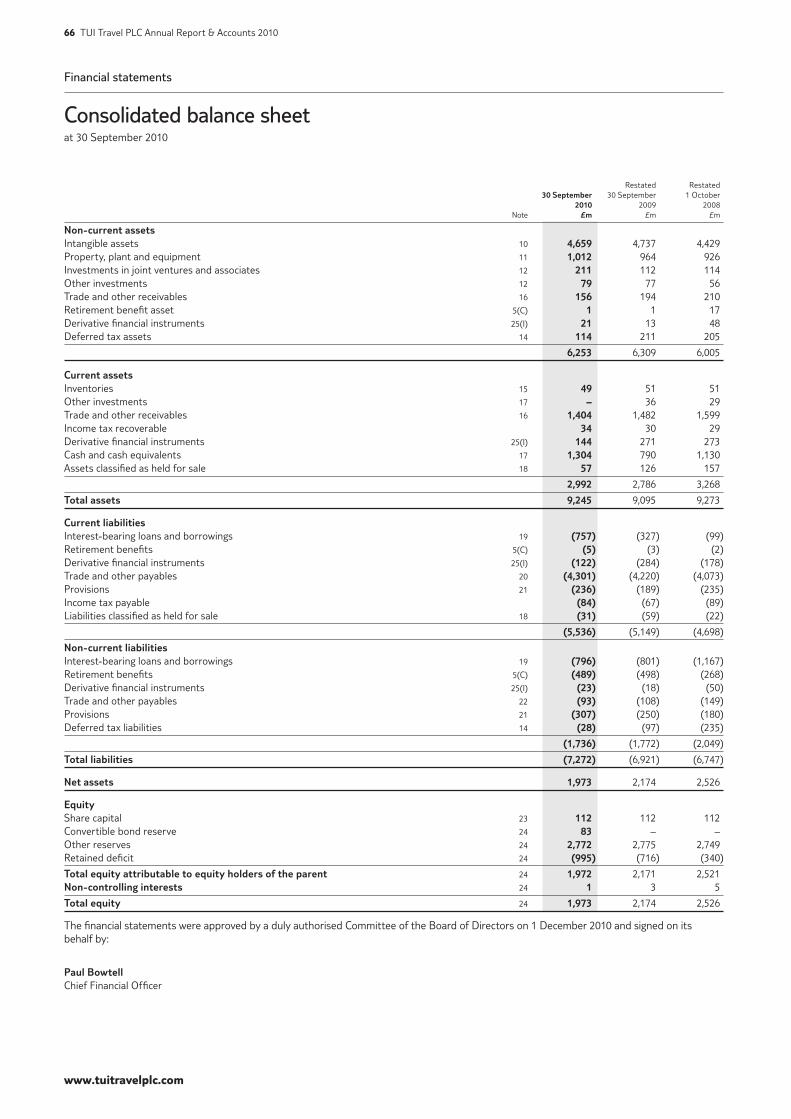
www.tuitravelplc.com
66 TUI Travel PLC Annual Report & Accounts 2010
Restated Restated 30September 30 September 1 October 2010 2009 2008 Note £m £m £m
Non-currentassetsIntangible assets 10 4,659 4,737 4,429 Property, plant and equipment 11 1,012 964 926 Investments in joint ventures and associates 12 211 112 114 Other investments 12 79 77 56 Trade and other receivables 16 156 194 210 Retirement benefit asset 5(C) 1 1 17 Derivative financial instruments 25(I) 21 13 48 Deferred tax assets 14 114 211 205
6,253 6,309 6,005
CurrentassetsInventories 15 49 51 51 Other investments 17 – 36 29 Trade and other receivables 16 1,404 1,482 1,599 Income tax recoverable 34 30 29 Derivative financial instruments 25(I) 144 271 273 Cash and cash equivalents 17 1,304 790 1,130 Assets classified as held for sale 18 57 126 157
2,992 2,786 3,268
Totalassets 9,245 9,095 9,273
Currentliabilities Interest-bearing loans and borrowings 19 (757) (327) (99)Retirement benefits 5(C) (5) (3) (2)Derivative financial instruments 25(I) (122) (284) (178)Trade and other payables 20 (4,301) (4,220) (4,073)Provisions 21 (236) (189) (235)Income tax payable (84) (67) (89)Liabilities classified as held for sale 18 (31) (59) (22)
(5,536) (5,149) (4,698)
Non-currentliabilitiesInterest-bearing loans and borrowings 19 (796) (801) (1,167)Retirement benefits 5(C) (489) (498) (268)Derivative financial instruments 25(I) (23) (18) (50)Trade and other payables 22 (93) (108) (149)Provisions 21 (307) (250) (180)Deferred tax liabilities 14 (28) (97) (235)
(1,736) (1,772) (2,049)
Totalliabilities (7,272) (6,921) (6,747)
Netassets 1,973 2,174 2,526
EquityShare capital 23 112 112 112 Convertible bond reserve 24 83 – – Other reserves 24 2,772 2,775 2,749 Retained deficit 24 (995) (716) (340)
Totalequityattributabletoequityholdersoftheparent 24 1,972 2,171 2,521 Non-controllinginterests 24 1 3 5
Totalequity 24 1,973 2,174 2,526
The financial statements were approved by a duly authorised Committee of the Board of Directors on 1 December 2010 and signed on its behalf by:
PaulBowtellChief Financial Officer
Financial statements
Consolidated balance sheetat 30 September 2010
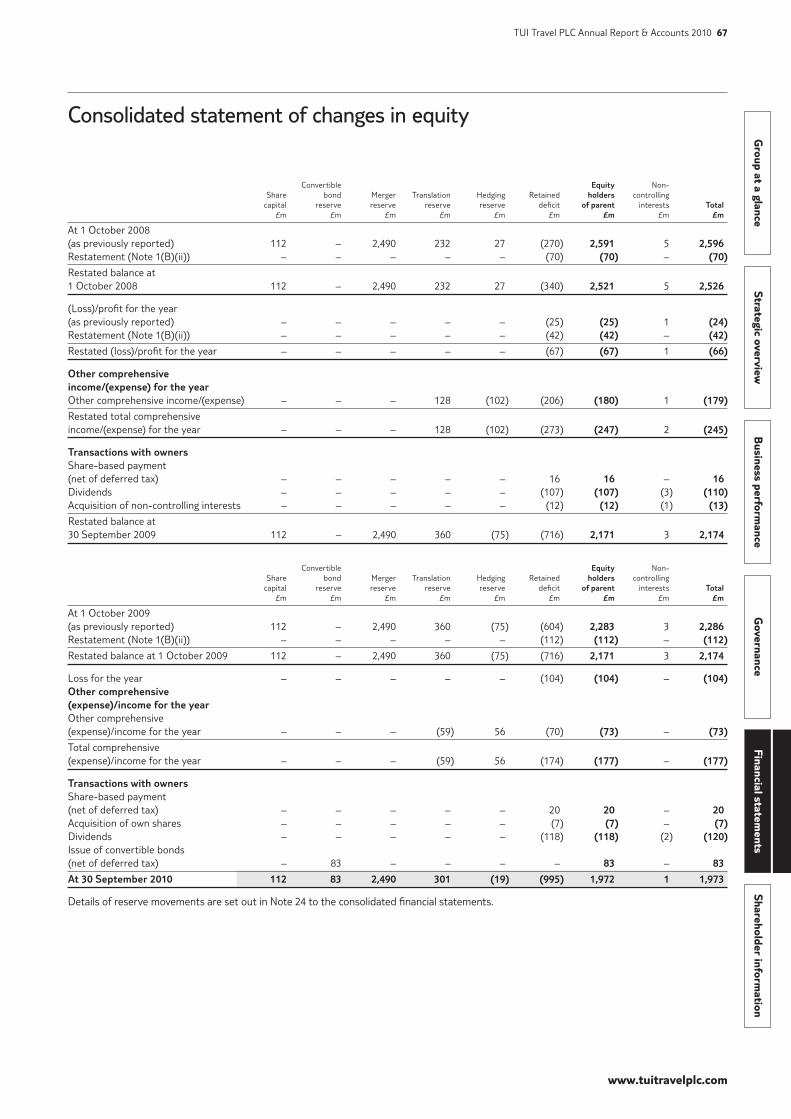
www.tuitravelplc.com
Group at a glance
Strategic overviewB
usiness performance
Governance
Financial statements
Shareholder information
TUI Travel PLC Annual Report & Accounts 2010 67
Consolidated statement of changes in equity
Convertible Equity Non- Share bond Merger Translation Hedging Retained holders controlling capital reserve reserve reserve reserve deficit ofparent interests Total £m £m £m £m £m £m £m £m £m
At 1 October 2008 (as previously reported) 112 – 2,490 232 27 (270) 2,591 5 2,596 Restatement (Note 1(B)(ii)) – – – – – (70) (70) – (70)
Restated balance at1 October 2008 112 – 2,490 232 27 (340) 2,521 5 2,526
(Loss)/profit for the year (as previously reported) – – – – – (25) (25) 1 (24)Restatement (Note 1(B)(ii)) – – – – – (42) (42) – (42)
Restated (loss)/profit for the year – – – – – (67) (67) 1 (66)
Othercomprehensiveincome/(expense)fortheyearOther comprehensive income/(expense) – – – 128 (102) (206) (180) 1 (179)
Restated total comprehensive income/(expense) for the year – – – 128 (102) (273) (247) 2 (245)
TransactionswithownersShare-based payment (net of deferred tax) – – – – – 16 16 – 16Dividends – – – – – (107) (107) (3) (110)Acquisition of non-controlling interests – – – – – (12) (12) (1) (13)
Restated balance at 30 September 2009 112 – 2,490 360 (75) (716) 2,171 3 2,174
Convertible Equity Non- Share bond Merger Translation Hedging Retained holders controlling capital reserve reserve reserve reserve deficit ofparent interests Total £m £m £m £m £m £m £m £m £m
At 1 October 2009 (as previously reported) 112 – 2,490 360 (75) (604) 2,283 3 2,286Restatement (Note 1(B)(ii)) – – – – – (112) (112) – (112)
Restated balance at 1 October 2009 112 – 2,490 360 (75) (716) 2,171 3 2,174
Loss for the year – – – – – (104) (104) – (104)Othercomprehensive(expense)/incomefortheyearOther comprehensive (expense)/income for the year – – – (59) 56 (70) (73) – (73)
Total comprehensive (expense)/income for the year – – – (59) 56 (174) (177) – (177)
TransactionswithownersShare-based payment (net of deferred tax) – – – – – 20 20 – 20Acquisition of own shares – – – – – (7) (7) – (7)Dividends – – – – – (118) (118) (2) (120)Issue of convertible bonds(net of deferred tax) – 83 – – – – 83 – 83
At30September2010 112 83 2,490 301 (19) (995) 1,972 1 1,973
Details of reserve movements are set out in Note 24 to the consolidated financial statements.
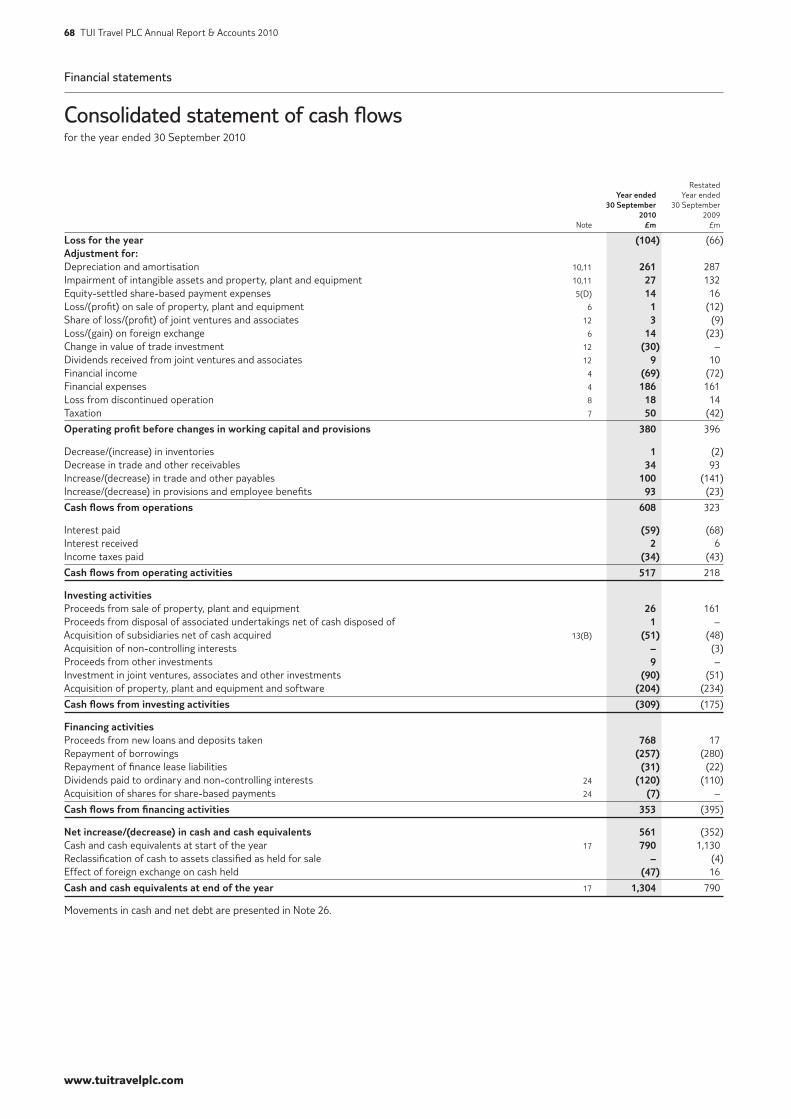
www.tuitravelplc.com
68 TUI Travel PLC Annual Report & Accounts 2010
Restated Yearended Year ended 30September 30 September 2010 2009 Note £m £m
Lossfortheyear (104) (66)Adjustmentfor:Depreciation and amortisation 10,11 261 287 Impairment of intangible assets and property, plant and equipment 10,11 27 132 Equity-settled share-based payment expenses 5(D) 14 16 Loss/(profit) on sale of property, plant and equipment 6 1 (12)Share of loss/(profit) of joint ventures and associates 12 3 (9)Loss/(gain) on foreign exchange 6 14 (23)Change in value of trade investment 12 (30) – Dividends received from joint ventures and associates 12 9 10 Financial income 4 (69) (72)Financial expenses 4 186 161 Loss from discontinued operation 8 18 14 Taxation 7 50 (42)
Operatingprofitbeforechangesinworkingcapitalandprovisions 380 396
Decrease/(increase) in inventories 1 (2)Decrease in trade and other receivables 34 93 Increase/(decrease) in trade and other payables 100 (141)Increase/(decrease) in provisions and employee benefits 93 (23)
Cashflowsfromoperations 608 323
Interest paid (59) (68)Interest received 2 6 Income taxes paid (34) (43)
Cashflowsfromoperatingactivities 517 218
InvestingactivitiesProceeds from sale of property, plant and equipment 26 161 Proceeds from disposal of associated undertakings net of cash disposed of 1 – Acquisition of subsidiaries net of cash acquired 13(B) (51) (48)Acquisition of non-controlling interests – (3)Proceeds from other investments 9 – Investment in joint ventures, associates and other investments (90) (51)Acquisition of property, plant and equipment and software (204) (234)
Cashflowsfrominvestingactivities (309) (175)
FinancingactivitiesProceeds from new loans and deposits taken 768 17 Repayment of borrowings (257) (280)Repayment of finance lease liabilities (31) (22)Dividends paid to ordinary and non-controlling interests 24 (120) (110)Acquisition of shares for share-based payments 24 (7) –
Cashflowsfromfinancingactivities 353 (395)
Netincrease/(decrease)incashandcashequivalents 561 (352)Cash and cash equivalents at start of the year 17 790 1,130 Reclassification of cash to assets classified as held for sale – (4)Effect of foreign exchange on cash held (47) 16
Cashandcashequivalentsatendoftheyear 17 1,304 790
Movements in cash and net debt are presented in Note 26.
Financial statements
Consolidated statement of cash flowsfor the year ended 30 September 2010
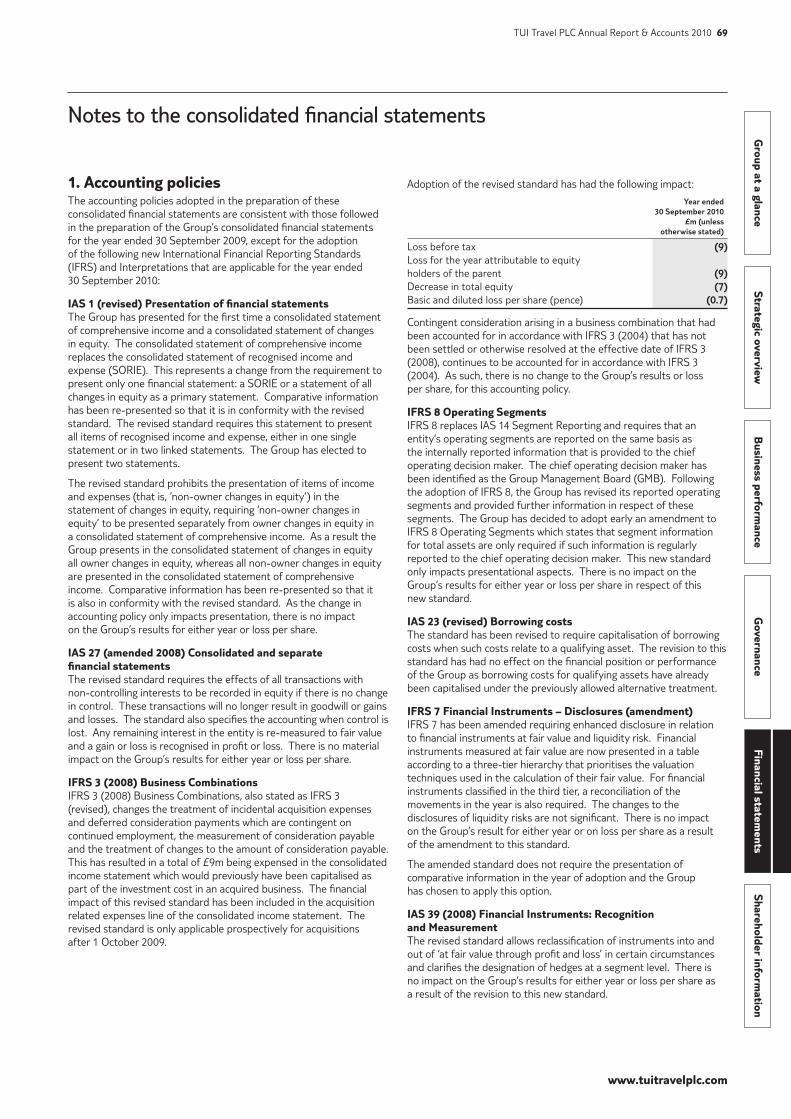
www.tuitravelplc.com
Group at a glance
Strategic overviewB
usiness performance
Governance
Financial statements
Shareholder information
TUI Travel PLC Annual Report & Accounts 2010 69
Notes to the consolidated financial statements
1. Accounting policiesThe accounting policies adopted in the preparation of these consolidated financial statements are consistent with those followed in the preparation of the Group’s consolidated financial statements for the year ended 30 September 2009, except for the adoption of the following new International Financial Reporting Standards (IFRS) and Interpretations that are applicable for the year ended 30 September 2010:
IAS 1 (revised) Presentation of financial statementsThe Group has presented for the first time a consolidated statement of comprehensive income and a consolidated statement of changes in equity. The consolidated statement of comprehensive income replaces the consolidated statement of recognised income and expense (SORIE). This represents a change from the requirement to present only one financial statement: a SORIE or a statement of all changes in equity as a primary statement. Comparative information has been re-presented so that it is in conformity with the revised standard. The revised standard requires this statement to present all items of recognised income and expense, either in one single statement or in two linked statements. The Group has elected to present two statements.
The revised standard prohibits the presentation of items of income and expenses (that is, ‘non-owner changes in equity’) in the statement of changes in equity, requiring ‘non-owner changes in equity’ to be presented separately from owner changes in equity in a consolidated statement of comprehensive income. As a result the Group presents in the consolidated statement of changes in equity all owner changes in equity, whereas all non-owner changes in equity are presented in the consolidated statement of comprehensive income. Comparative information has been re-presented so that it is also in conformity with the revised standard. As the change in accounting policy only impacts presentation, there is no impact on the Group’s results for either year or loss per share.
IAS 27 (amended 2008) Consolidated and separate financial statementsThe revised standard requires the effects of all transactions with non-controlling interests to be recorded in equity if there is no change in control. These transactions will no longer result in goodwill or gains and losses. The standard also specifies the accounting when control is lost. Any remaining interest in the entity is re-measured to fair value and a gain or loss is recognised in profit or loss. There is no material impact on the Group’s results for either year or loss per share.
IFRS 3 (2008) Business CombinationsIFRS 3 (2008) Business Combinations, also stated as IFRS 3 (revised), changes the treatment of incidental acquisition expenses and deferred consideration payments which are contingent on continued employment, the measurement of consideration payable and the treatment of changes to the amount of consideration payable. This has resulted in a total of £9m being expensed in the consolidated income statement which would previously have been capitalised as part of the investment cost in an acquired business. The financial impact of this revised standard has been included in the acquisition related expenses line of the consolidated income statement. The revised standard is only applicable prospectively for acquisitions after 1 October 2009.
Adoption of the revised standard has had the following impact:
Yearended 30September2010 £m(unless otherwisestated)
Loss before tax (9)Loss for the year attributable to equity holders of the parent (9)Decrease in total equity (7)Basic and diluted loss per share (pence) (0.7)
Contingent consideration arising in a business combination that had been accounted for in accordance with IFRS 3 (2004) that has not been settled or otherwise resolved at the effective date of IFRS 3 (2008), continues to be accounted for in accordance with IFRS 3 (2004). As such, there is no change to the Group’s results or loss per share, for this accounting policy.
IFRS 8 Operating SegmentsIFRS 8 replaces IAS 14 Segment Reporting and requires that an entity’s operating segments are reported on the same basis as the internally reported information that is provided to the chief operating decision maker. The chief operating decision maker has been identified as the Group Management Board (GMB). Following the adoption of IFRS 8, the Group has revised its reported operating segments and provided further information in respect of these segments. The Group has decided to adopt early an amendment to IFRS 8 Operating Segments which states that segment information for total assets are only required if such information is regularly reported to the chief operating decision maker. This new standard only impacts presentational aspects. There is no impact on the Group’s results for either year or loss per share in respect of this new standard.
IAS 23 (revised) Borrowing costs The standard has been revised to require capitalisation of borrowing costs when such costs relate to a qualifying asset. The revision to this standard has had no effect on the financial position or performance of the Group as borrowing costs for qualifying assets have already been capitalised under the previously allowed alternative treatment.
IFRS 7 Financial Instruments – Disclosures (amendment) IFRS 7 has been amended requiring enhanced disclosure in relation to financial instruments at fair value and liquidity risk. Financial instruments measured at fair value are now presented in a table according to a three-tier hierarchy that prioritises the valuation techniques used in the calculation of their fair value. For financial instruments classified in the third tier, a reconciliation of the movements in the year is also required. The changes to the disclosures of liquidity risks are not significant. There is no impact on the Group’s result for either year or on loss per share as a result of the amendment to this standard.
The amended standard does not require the presentation of comparative information in the year of adoption and the Group has chosen to apply this option.
IAS 39 (2008) Financial Instruments: Recognition and MeasurementThe revised standard allows reclassification of instruments into and out of ‘at fair value through profit and loss’ in certain circumstances and clarifies the designation of hedges at a segment level. There is no impact on the Group’s results for either year or loss per share as a result of the revision to this new standard.
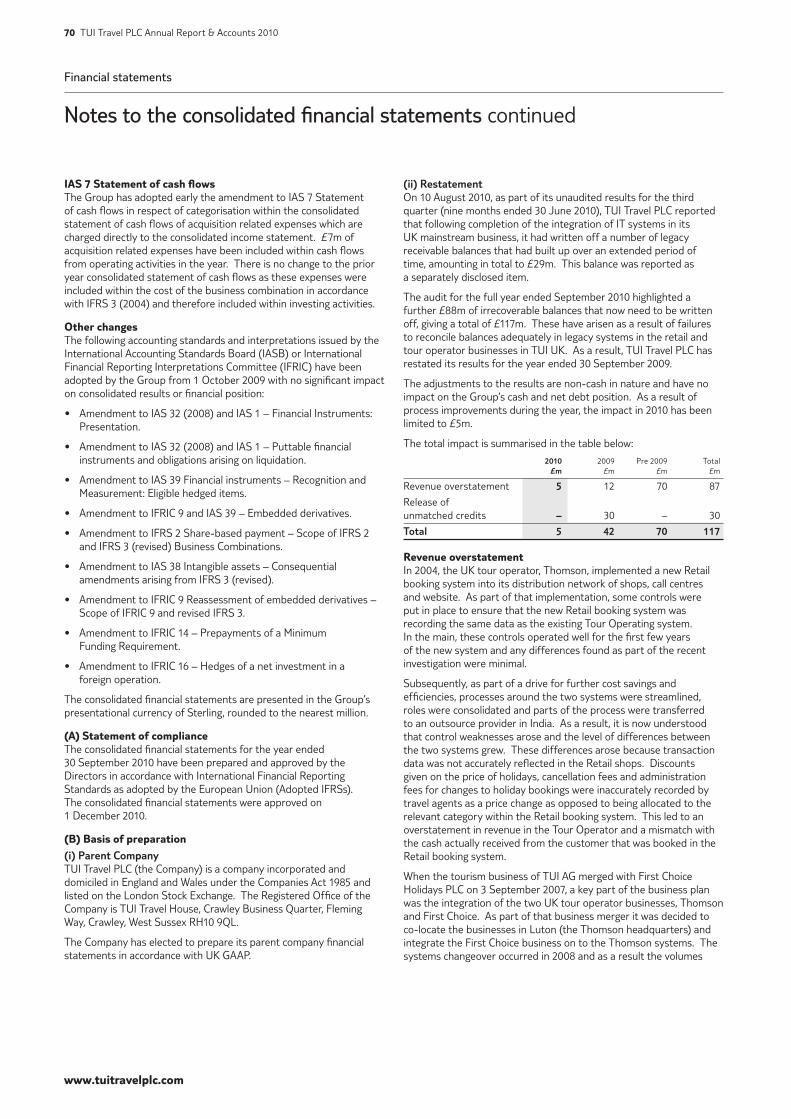
www.tuitravelplc.com
70 TUI Travel PLC Annual Report & Accounts 2010
(ii)RestatementOn 10 August 2010, as part of its unaudited results for the third quarter (nine months ended 30 June 2010), TUI Travel PLC reported that following completion of the integration of IT systems in its UK mainstream business, it had written off a number of legacy receivable balances that had built up over an extended period of time, amounting in total to £29m. This balance was reported as a separately disclosed item.
The audit for the full year ended September 2010 highlighted a further £88m of irrecoverable balances that now need to be written off, giving a total of £117m. These have arisen as a result of failures to reconcile balances adequately in legacy systems in the retail and tour operator businesses in TUI UK. As a result, TUI Travel PLC has restated its results for the year ended 30 September 2009.
The adjustments to the results are non-cash in nature and have no impact on the Group’s cash and net debt position. As a result of process improvements during the year, the impact in 2010 has been limited to £5m.
The total impact is summarised in the table below:
2010 2009 Pre 2009 Total £m £m £m £m
Revenue overstatement 5 12 70 87
Release of unmatched credits – 30 – 30
Total 5 42 70 117
Revenue overstatementIn 2004, the UK tour operator, Thomson, implemented a new Retail booking system into its distribution network of shops, call centres and website. As part of that implementation, some controls were put in place to ensure that the new Retail booking system was recording the same data as the existing Tour Operating system. In the main, these controls operated well for the first few years of the new system and any differences found as part of the recent investigation were minimal.
Subsequently, as part of a drive for further cost savings and efficiencies, processes around the two systems were streamlined, roles were consolidated and parts of the process were transferred to an outsource provider in India. As a result, it is now understood that control weaknesses arose and the level of differences between the two systems grew. These differences arose because transaction data was not accurately reflected in the Retail shops. Discounts given on the price of holidays, cancellation fees and administration fees for changes to holiday bookings were inaccurately recorded by travel agents as a price change as opposed to being allocated to the relevant category within the Retail booking system. This led to an overstatement in revenue in the Tour Operator and a mismatch with the cash actually received from the customer that was booked in the Retail booking system.
When the tourism business of TUI AG merged with First Choice Holidays PLC on 3 September 2007, a key part of the business plan was the integration of the two UK tour operator businesses, Thomson and First Choice. As part of that business merger it was decided to co-locate the businesses in Luton (the Thomson headquarters) and integrate the First Choice business on to the Thomson systems. The systems changeover occurred in 2008 and as a result the volumes
IAS 7 Statement of cash flows The Group has adopted early the amendment to IAS 7 Statement of cash flows in respect of categorisation within the consolidated statement of cash flows of acquisition related expenses which are charged directly to the consolidated income statement. £7m of acquisition related expenses have been included within cash flows from operating activities in the year. There is no change to the prior year consolidated statement of cash flows as these expenses were included within the cost of the business combination in accordance with IFRS 3 (2004) and therefore included within investing activities.
Other changesThe following accounting standards and interpretations issued by the International Accounting Standards Board (IASB) or International Financial Reporting Interpretations Committee (IFRIC) have been adopted by the Group from 1 October 2009 with no significant impact on consolidated results or financial position:
• Amendment to IAS 32 (2008) and IAS 1 – Financial Instruments: Presentation.
• Amendment to IAS 32 (2008) and IAS 1 – Puttable financial instruments and obligations arising on liquidation.
• Amendment to IAS 39 Financial instruments – Recognition and Measurement: Eligible hedged items.
• Amendment to IFRIC 9 and IAS 39 – Embedded derivatives.
• Amendment to IFRS 2 Share-based payment – Scope of IFRS 2 and IFRS 3 (revised) Business Combinations.
• Amendment to IAS 38 Intangible assets – Consequential amendments arising from IFRS 3 (revised).
• Amendment to IFRIC 9 Reassessment of embedded derivatives – Scope of IFRIC 9 and revised IFRS 3.
• Amendment to IFRIC 14 – Prepayments of a Minimum Funding Requirement.
• Amendment to IFRIC 16 – Hedges of a net investment in a foreign operation.
The consolidated financial statements are presented in the Group’s presentational currency of Sterling, rounded to the nearest million.
(A) Statement of complianceThe consolidated financial statements for the year ended 30 September 2010 have been prepared and approved by the Directors in accordance with International Financial Reporting Standards as adopted by the European Union (Adopted IFRSs). The consolidated financial statements were approved on 1 December 2010.
(B) Basis of preparation(i)ParentCompanyTUI Travel PLC (the Company) is a company incorporated and domiciled in England and Wales under the Companies Act 1985 and listed on the London Stock Exchange. The Registered Office of the Company is TUI Travel House, Crawley Business Quarter, Fleming Way, Crawley, West Sussex RH10 9QL.
The Company has elected to prepare its parent company financial statements in accordance with UK GAAP.
Financial statements
Notes to the consolidated financial statements continued
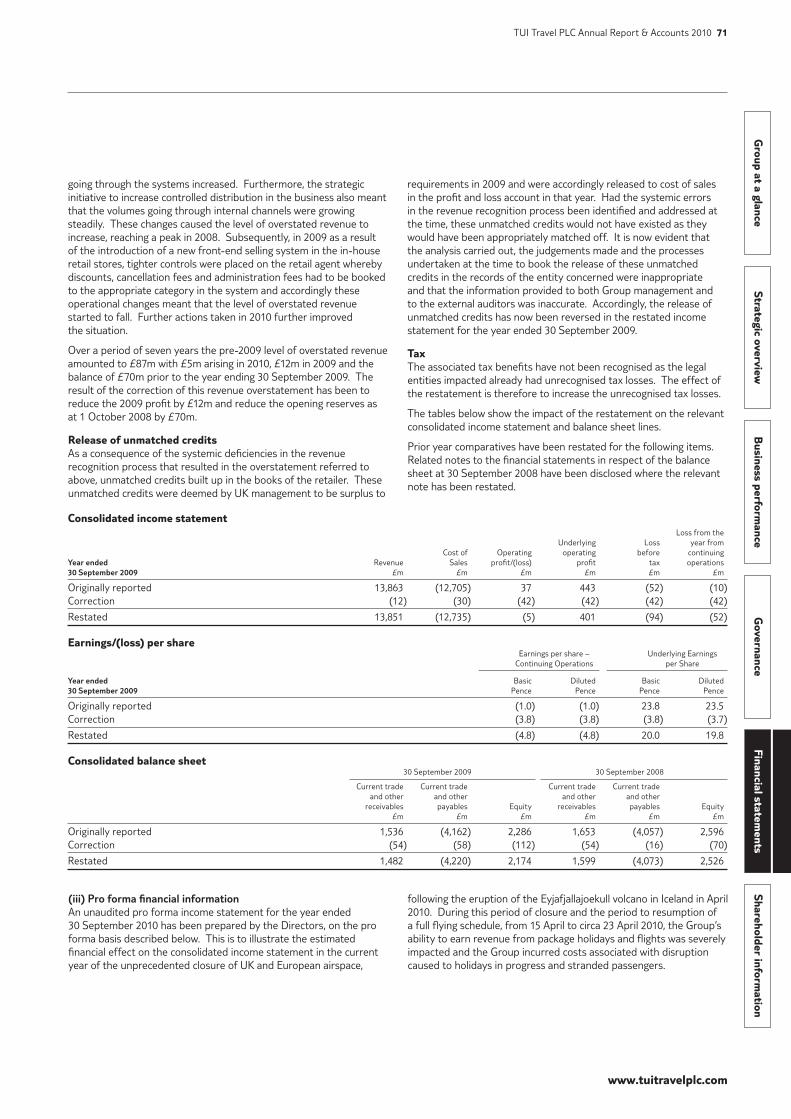
www.tuitravelplc.com
Group at a glance
Strategic overviewB
usiness performance
Governance
Financial statements
Shareholder information
TUI Travel PLC Annual Report & Accounts 2010 71
Consolidated income statement Loss from the Underlying Loss year from Cost of Operating operating before continuingYearended Revenue Sales profit/(loss) profit tax operations30September2009 £m £m £m £m £m £m
Originally reported 13,863 (12,705) 37 443 (52) (10) Correction (12) (30) (42) (42) (42) (42)
Restated 13,851 (12,735) (5) 401 (94) (52)
Earnings/(loss) per share Earnings per share – Underlying Earnings Continuing Operations per Share
Yearended Basic Diluted Basic Diluted30September2009 Pence Pence Pence Pence
Originally reported (1.0) (1.0) 23.8 23.5Correction (3.8) (3.8) (3.8) (3.7)
Restated (4.8) (4.8) 20.0 19.8
Consolidated balance sheet 30 September 2009 30 September 2008 Current trade Current trade Current trade Current trade and other and other and other and other receivables payables Equity receivables payables Equity £m £m £m £m £m £m
Originally reported 1,536 (4,162) 2,286 1,653 (4,057) 2,596Correction (54) (58) (112) (54) (16) (70)
Restated 1,482 (4,220) 2,174 1,599 (4,073) 2,526
going through the systems increased. Furthermore, the strategic initiative to increase controlled distribution in the business also meant that the volumes going through internal channels were growing steadily. These changes caused the level of overstated revenue to increase, reaching a peak in 2008. Subsequently, in 2009 as a result of the introduction of a new front-end selling system in the in-house retail stores, tighter controls were placed on the retail agent whereby discounts, cancellation fees and administration fees had to be booked to the appropriate category in the system and accordingly these operational changes meant that the level of overstated revenue started to fall. Further actions taken in 2010 further improved the situation.
Over a period of seven years the pre-2009 level of overstated revenue amounted to £87m with £5m arising in 2010, £12m in 2009 and the balance of £70m prior to the year ending 30 September 2009. The result of the correction of this revenue overstatement has been to reduce the 2009 profit by £12m and reduce the opening reserves as at 1 October 2008 by £70m.
Release of unmatched creditsAs a consequence of the systemic deficiencies in the revenue recognition process that resulted in the overstatement referred to above, unmatched credits built up in the books of the retailer. These unmatched credits were deemed by UK management to be surplus to
requirements in 2009 and were accordingly released to cost of sales in the profit and loss account in that year. Had the systemic errors in the revenue recognition process been identified and addressed at the time, these unmatched credits would not have existed as they would have been appropriately matched off. It is now evident that the analysis carried out, the judgements made and the processes undertaken at the time to book the release of these unmatched credits in the records of the entity concerned were inappropriate and that the information provided to both Group management and to the external auditors was inaccurate. Accordingly, the release of unmatched credits has now been reversed in the restated income statement for the year ended 30 September 2009.
Tax The associated tax benefits have not been recognised as the legal entities impacted already had unrecognised tax losses. The effect of the restatement is therefore to increase the unrecognised tax losses.
The tables below show the impact of the restatement on the relevant consolidated income statement and balance sheet lines.
Prior year comparatives have been restated for the following items. Related notes to the financial statements in respect of the balance sheet at 30 September 2008 have been disclosed where the relevant note has been restated.
(iii)ProformafinancialinformationAn unaudited pro forma income statement for the year ended 30 September 2010 has been prepared by the Directors, on the pro forma basis described below. This is to illustrate the estimated financial effect on the consolidated income statement in the current year of the unprecedented closure of UK and European airspace,
following the eruption of the Eyjafjallajoekull volcano in Iceland in April 2010. During this period of closure and the period to resumption of a full flying schedule, from 15 April to circa 23 April 2010, the Group‘s ability to earn revenue from package holidays and flights was severely impacted and the Group incurred costs associated with disruption caused to holidays in progress and stranded passengers.
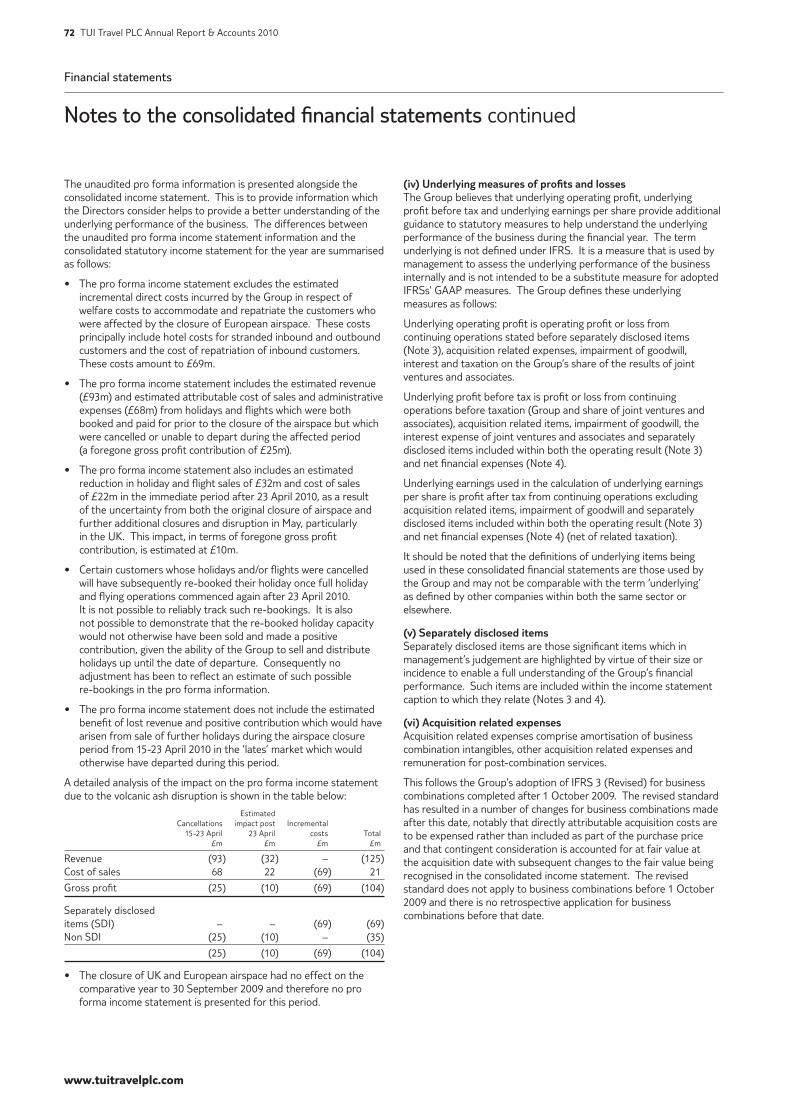
www.tuitravelplc.com
72 TUI Travel PLC Annual Report & Accounts 2010
(iv)UnderlyingmeasuresofprofitsandlossesThe Group believes that underlying operating profit, underlying profit before tax and underlying earnings per share provide additional guidance to statutory measures to help understand the underlying performance of the business during the financial year. The term underlying is not defined under IFRS. It is a measure that is used by management to assess the underlying performance of the business internally and is not intended to be a substitute measure for adopted IFRSs’ GAAP measures. The Group defines these underlying measures as follows:
Underlying operating profit is operating profit or loss from continuing operations stated before separately disclosed items (Note 3), acquisition related expenses, impairment of goodwill, interest and taxation on the Group’s share of the results of joint ventures and associates.
Underlying profit before tax is profit or loss from continuing operations before taxation (Group and share of joint ventures and associates), acquisition related items, impairment of goodwill, the interest expense of joint ventures and associates and separately disclosed items included within both the operating result (Note 3) and net financial expenses (Note 4).
Underlying earnings used in the calculation of underlying earnings per share is profit after tax from continuing operations excluding acquisition related items, impairment of goodwill and separately disclosed items included within both the operating result (Note 3) and net financial expenses (Note 4) (net of related taxation).
It should be noted that the definitions of underlying items being used in these consolidated financial statements are those used by the Group and may not be comparable with the term ‘underlying’ as defined by other companies within both the same sector or elsewhere.
(v)SeparatelydiscloseditemsSeparately disclosed items are those significant items which in management’s judgement are highlighted by virtue of their size or incidence to enable a full understanding of the Group’s financial performance. Such items are included within the income statement caption to which they relate (Notes 3 and 4).
(vi)AcquisitionrelatedexpensesAcquisition related expenses comprise amortisation of business combination intangibles, other acquisition related expenses and remuneration for post-combination services.
This follows the Group’s adoption of IFRS 3 (Revised) for business combinations completed after 1 October 2009. The revised standard has resulted in a number of changes for business combinations made after this date, notably that directly attributable acquisition costs are to be expensed rather than included as part of the purchase price and that contingent consideration is accounted for at fair value at the acquisition date with subsequent changes to the fair value being recognised in the consolidated income statement. The revised standard does not apply to business combinations before 1 October 2009 and there is no retrospective application for business combinations before that date.
The unaudited pro forma information is presented alongside the consolidated income statement. This is to provide information which the Directors consider helps to provide a better understanding of the underlying performance of the business. The differences between the unaudited pro forma income statement information and the consolidated statutory income statement for the year are summarised as follows:
• The pro forma income statement excludes the estimated incremental direct costs incurred by the Group in respect of welfare costs to accommodate and repatriate the customers who were affected by the closure of European airspace. These costs principally include hotel costs for stranded inbound and outbound customers and the cost of repatriation of inbound customers. These costs amount to £69m.
• The pro forma income statement includes the estimated revenue (£93m) and estimated attributable cost of sales and administrative expenses (£68m) from holidays and flights which were both booked and paid for prior to the closure of the airspace but which were cancelled or unable to depart during the affected period (a foregone gross profit contribution of £25m).
• The pro forma income statement also includes an estimated reduction in holiday and flight sales of £32m and cost of sales of £22m in the immediate period after 23 April 2010, as a result of the uncertainty from both the original closure of airspace and further additional closures and disruption in May, particularly in the UK. This impact, in terms of foregone gross profit contribution, is estimated at £10m.
• Certain customers whose holidays and/or flights were cancelled will have subsequently re-booked their holiday once full holiday and flying operations commenced again after 23 April 2010. It is not possible to reliably track such re-bookings. It is also not possible to demonstrate that the re-booked holiday capacity would not otherwise have been sold and made a positive contribution, given the ability of the Group to sell and distribute holidays up until the date of departure. Consequently no adjustment has been to reflect an estimate of such possible re-bookings in the pro forma information.
• The pro forma income statement does not include the estimated benefit of lost revenue and positive contribution which would have arisen from sale of further holidays during the airspace closure period from 15-23 April 2010 in the ‘lates’ market which would otherwise have departed during this period.
A detailed analysis of the impact on the pro forma income statement due to the volcanic ash disruption is shown in the table below:
Estimated Cancellations impact post Incremental 15-23 April 23 April costs Total £m £m £m £m
Revenue (93) (32) – (125)Cost of sales 68 22 (69) 21
Gross profit (25) (10) (69) (104)
Separately disclosed items (SDI) – – (69) (69)Non SDI (25) (10) – (35)
(25) (10) (69) (104)
• The closure of UK and European airspace had no effect on the comparative year to 30 September 2009 and therefore no pro forma income statement is presented for this period.
Financial statements
Notes to the consolidated financial statements continued
www.tuitravelplc.com
Group at a glance
Strategic overviewB
usiness performance
Governance
Financial statements
Shareholder information
TUI Travel PLC Annual Report & Accounts 2010 73
(i)SubsidiariesSubsidiaries are entities controlled by the Group. Control exists when the Group has the power, directly or indirectly, to govern the financial and operating policies of an entity so as to obtain benefits from its activities. In assessing control, potential voting rights that are currently exercisable or convertible are taken into account. The financial statements of subsidiaries are included in the consolidated financial information from the date that control commences until the date that control ceases.
(ii)JointventuresandassociatesJoint ventures are jointly controlled entities whose activities the Group has the power to jointly control, established by contractual agreement. Associates are those entities in which the Group has the ability to exercise significant influence, but not control, over the financial and operating policies. The consolidated financial statements include the Group’s share of the total recognised income and expense and changes in equity of joint ventures and associates on an equity accounted basis, from the date that joint control or significant influence respectively commences until the date that it ceases. Associates and joint ventures are recorded at cost as adjusted for post-acquisition changes in the Group’s share of net assets of the entity including goodwill net of accumulated impairment loss. When the Group’s share of losses exceeds the carrying amount of the joint venture or associate, the carrying amount is reduced to £nil and recognition of further losses is discontinued except to the extent that the Group has incurred legal or constructive obligations or made payments on behalf of the joint venture or associate.
(iii)TransactionseliminatedonconsolidationIntra-group balances and any unrealised gains or income and expenses arising from intra-group transactions, are eliminated in preparing the consolidated financial statements. Unrealised gains arising from transactions with associates and jointly controlled entities are eliminated to the extent of the Group’s interest in the entity. Unrealised losses are eliminated in the same way as unrealised gains, but only to the extent that there is no evidence of impairment.
(iv)AcquisitioninstagesWhere a Group gains control of a subsidiary undertaking through a step acquisition, the existing interest owned is remeasured at fair value with the difference between fair value and book value being recognised in the income statement. The accounting impact of changes in share ownership which do not affect control is accounted for through reserves.
(v)Contingentacquisitionconsideration(forbusinesscombinationsfrom1October2009)Contingent consideration is accounted for at fair value at the acquisition date with subsequent changes in the fair value being recognised in the income statement. Contingent consideration dependent upon continuing service of an employee is charged to the income statement over the related service period.
Contingentacquisitionconsideration(forbusinesscombinationsupuntil30September2009)Contingent consideration is recognised when the payment amount becomes probable and the amounts can be reliably measured. The purchase price is subsequently adjusted against goodwill or negative goodwill as the estimate of the amount payable is revised.
(vii)BusinessandPerformanceReviewThe Group’s business activities, together with factors likely to affect its future development, performance and position are set out in the Business Performance section. In addition, Note 25 sets out the Group’s objectives, policies and processes for managing its capital, financial risks, financial instruments and hedging activities as well as its exposures to credit and liquidity risk.
(viii)FundingandliquidityThe Board remains satisfied with the Group’s funding and liquidity position. The main sources of debt funding are:
1. the shareholder loan from TUI AG, which is €669m and is being repaid as follows: 1 December 2010: €509m and 30 April 2011: €160m;
2. a total of £1,060m syndicated bank revolving credit facilities which mature in June 2012;
3. £40m of bonding and letter of credit facilities which mature in September 2011 and a further £50m which mature in June 2012;
4. a £350m convertible bond (due 2014) issued on 1 October 2009 and settled on 5 October 2009; and
5. a £400m convertible bond (due 2017) issued on 22 April 2010 and settled on 27 April 2010.
In addition to the above facilities a further £30m bonding and letter of credit facility which matures in June 2012 was signed on 15 October 2010.
The ratio of Earnings Before Interest, Taxation, Depreciation, Amortisation and operating lease Rentals (EBITDAR) to fixed charges (being the aggregate amount of interest and any other finance charges in respect of borrowings and including all payments under operating leases) and the ratio of net debt to Earnings Before Interest, Taxation, Depreciation and Amortisation (EBITDA), which the Board believes to be the most useful measures of cash generation and gearing, as well as being the main basis for the Group’s credit facility covenants, are currently well within the covenant limits. Forecasts reviewed by the Board, including forecasts adjusted for significantly worse economic conditions, show continued compliance with these covenants. For both covenants, earnings are calculated on an underlying basis as described in Note 1(B)(iv).
On the basis of its forecasts, both base case and adjusted as described above, and available facilities, the Board has concluded that the going concern basis of preparation continues to be appropriate. In particular the Board believe that the funding already in place is sufficient to repay the Shareholder loan which will become payable as described above.
(C) Basis of consolidationThe consolidated financial statements are prepared on the historical cost basis other than derivative financial instruments, financial instruments held for trading, financial instruments classified as available for sale and liabilities for cash-settled share-based payments, which are stated at their fair value. Non-current assets and disposal groups held for sale are stated at the lower of their carrying amount and fair value less costs to sell.
The Group financial statements consolidate those of the Company and its subsidiaries (together referred to as the Group) and equity account the Group’s interest in joint ventures and associates. The parent company financial statements present information about the Company as a separate entity and not about the Group.
www.tuitravelplc.com
74 TUI Travel PLC Annual Report & Accounts 2010
Foreign exchange gains and losses arising from a monetary item receivable from or payable to a foreign operation, the settlement of which is neither planned nor likely in the foreseeable future, are considered to form part of a net investment in a foreign operation and are recognised directly in equity in the translation reserve.
(iii)NetinvestmentinforeignoperationsThe Group applies hedge accounting to foreign currency differences arising between the functional currency of the foreign operation and the parent entity’s functional currency (Sterling) regardless of whether the net investment is held directly or through an intermediate parent.
Foreign currency differences arising on the retranslation of a financial liability designated as a hedge of a net investment in a foreign operation are recognised in the consolidated statement of comprehensive income to the extent that the hedge is effective and are presented within equity in the translation reserve. To the extent that the hedge is ineffective, such differences are recognised in profit or loss. When the hedged part of a net investment is disposed of the relevant amount in the translation reserve is transferred to profit or loss as part of the profit or loss on disposal.
(E) Financial instruments(i)FinancialassetsFinancial assets are either classified as loans and receivables, available for sale financial assets, or financial assets at fair value through profit or loss. Financial assets include cash and cash equivalents, trade receivables, other receivables, loans, trade and other investments and derivative financial instruments. The Group determines the classification of its financial assets at initial recognition. Financial assets are recognised initially at fair value, normally being the transaction price plus, in the case of financial assets not at fair value through profit or loss, directly attributable transaction costs. The subsequent measurement of financial assets depends on their classification, as follows:
Loans and receivablesLoans and receivables are non-derivative financial assets with fixed or determinable payments that are not quoted in an active market. Such assets are carried at amortised cost using the effective interest method if the time value of money is significant. Gains and losses are recognised in income when the loans and receivables are derecognised or impaired, as well as through the amortisation process. This category of financial assets includes trade and other receivables.
Available for sale financial assetsAvailable for sale financial assets are those non-derivative financial assets that are not classified as loans and receivables or financial assets at fair value through profit or loss. After initial recognition, available for sale financial assets are measured at fair value, with gains or losses recognised as a separate component of equity until the investment is derecognised or until the investment is determined to be impaired, at which time the cumulative gain or loss previously reported in equity is included in the consolidated income statement. Note 1(Y)(iv) describes the basis on which fair value is determined.
Financial assets at fair value through profit or lossFinancial assets at fair value through profit or loss are measured at fair value after initial recognition. The gain or loss is included in the consolidated income statement. Note 1(Y)(iv) describes the basis on which fair value is determined.
The term contingent consideration has been used throughout these financial statements to describe the part of the overall consideration paid to the former shareholders of businesses acquired on or after 1 October 2009 that is contingent upon the future results of those acquired businesses, including where the payment is contingent on those former shareholders undertaking employment with the Group for a predetermined period after the relevant business combination. IFRS 3 (revised) requires that these amounts are charged to the consolidated income statement as a post-acquisition employment cost over the term of the relevant post-combination employment period. The Group includes the relevant income statement charge within acquisition related expenses (Note 13). The Directors believe the commercial nature of these payments means that this term remains the most appropriate to describe these payments, notwithstanding the accounting treatment required by IFRS 3 (revised).
(vi)Non-currentassetsheldforsaleThe Group classifies non-current assets as held for sale if their carrying amount will be recovered principally through a sale transaction rather than through continuing use. To be classified as held for sale, the assets must be available for immediate sale in their present condition, subject only to terms that are usual and customary for the sale of such assets, and their sale must be highly probable. Sale is considered to be highly probable when management are committed to a plan to sell the assets and an active programme to locate a buyer and complete the plan has been initiated, at a price that is reasonable in relation to their current fair value, and there is an expectation that the sale will be completed within one year from the date of classification. Non-current assets classified as held for sale are carried on the Group’s balance sheet at the lower of their carrying amount and fair value less costs to sell.
(D) Foreign currency(i)ForeigncurrencytransactionsTransactions in foreign currencies are translated at the foreign exchange rate ruling at the date of the transaction. Monetary assets and liabilities denominated in foreign currencies at the balance sheet date are translated to Sterling at the foreign exchange rate ruling at that date. Foreign exchange differences arising on translation are recognised in the income statement (except for differences arising on the retranslation of a financial liability designated as a hedge of the net investment in a foreign operation, or qualifying cash flow hedges, which are recognised directly in equity). Non-monetary assets and liabilities that are measured in terms of historical cost in a foreign currency are translated using the exchange rate at the date of the transaction. Non-monetary assets and liabilities denominated in foreign currencies that are stated at fair value are translated to Sterling at foreign exchange rates ruling at the dates the fair values were determined.
(ii)ForeignoperationsThe assets and liabilities of foreign operations, including goodwill and fair value adjustments arising on consolidation, are translated to Sterling at the foreign exchange rates ruling at the balance sheet date.
The revenues and expenses of overseas operations are translated at rates approximating to the foreign exchange rates ruling at the dates of the transactions. Foreign exchange differences arising on retranslation have been recognised directly in equity in the translation reserve, a designated foreign exchange reserve, since 1 January 2007.
Financial statements
Notes to the consolidated financial statements continued
www.tuitravelplc.com
Group at a glance
Strategic overviewB
usiness performance
Governance
Financial statements
Shareholder information
TUI Travel PLC Annual Report & Accounts 2010 75
Issue costs are apportioned between the liability and equity components of a convertible bond based on the allocation of proceeds to the liability and equity components when the instruments are first recognised.
DerivativesDerivatives are accounted for in accordance with the policy in Note 1(E)(iii).
DerecognitionThe Group derecognises a financial liability when the contractual obligations to pay the contractual cash flows on the financial liability are discharged, cancelled or expire.
(iii)DerivativefinancialinstrumentsThe Group uses derivative financial instruments to hedge its exposure to foreign exchange, interest rate and fuel price risks arising from operational, financing and investment activities. In accordance with its treasury policy, the Group does not hold or issue derivative financial instruments for trading purposes. However, derivatives that do not qualify for hedge accounting are accounted for as trading instruments.
Derivative financial instruments are initially recognised at fair value on the date a derivative contract is entered into and are subsequently remeasured at fair value. The method of recognising the resulting gain or loss depends on whether the derivative is designated as a hedging instrument and if so the nature of the item being hedged. The gain or loss on remeasurement to fair value on derivatives not designated as a hedging instrument is recognised immediately in the income statement. Where derivatives qualify for hedge accounting, see Accounting Policy Note 1(F).
(iv)SharecapitalOrdinary shares are classified as equity. Incremental costs directly attributable to the issue of ordinary shares and share awards are recognised as a deduction from equity, net of any tax effects.
(F) Hedge accountingThe Group designates certain derivatives as either hedges of a particular risk associated with a recognised asset or liability or a highly probable forecast transaction (cash flow hedge) or a hedge of the fair value of recognised assets or liabilities or a firm commitment (fair value hedge).
On initial designation of the hedge, the Group formally documents the relationship between the hedging instrument(s) and hedged item(s), including the risk management objectives and strategy in undertaking the hedge transaction, together with the methods that will be used to assess the effectiveness of the hedging relationship. The Group makes an assessment, both at the inception of the hedge relationship as well as on an ongoing basis, whether the hedging instruments are expected to be ’highly effective’ in offsetting the changes in the fair value or cash flows of the respective hedged items during the period for which the hedge is designated and whether the actual results of each hedge are within a range of 80-125%. For a cash flow hedge of a forecast transaction, the transaction should be highly probable to occur and should present an exposure to variations in cash flows that could ultimately affect reported net income.
Cash and cash equivalentsCash and cash equivalents comprise cash balances and call deposits which are readily convertible to known amounts of cash and which are subject to insignificant risk of changes in value and have an original maturity of three months or less. Bank overdrafts that are repayable on demand and form an integral part of the Group’s cash management are included as a component of cash and cash equivalents for the purpose only of the consolidated statement of cash flows.
DerivativesDerivatives are accounted for in accordance with the policy in Note 1(E)(iii).
DerecognitionThe Group derecognises a financial asset when the contractual rights to the cash flows from the asset expire, or it transfers the rights to receive the contractual cash flows on the financial asset in a transaction in which substantially all the risks and rewards of ownership of the financial asset are transferred. Any interest in transferred financial assets that is created or retained by the Group is recognised as a separate asset or liability.
(ii)FinancialliabilitiesFinancial liabilities are either classified as financial liabilities measured at amortised cost, or financial liabilities at fair value through profit or loss. Financial liabilities include trade and other payables, accruals, finance debt and derivative financial instruments. The Group determines the classification of its financial liabilities at initial recognition. Financial liabilities are recognised initially at fair value, normally being the transaction price plus, in the case of financial liabilities not at fair value through profit or loss, directly attributable transaction costs. The subsequent measurement of financial liabilities depends on their classification, as follows:
Financial liabilities measured at amortised costAll financial liabilities are initially recognised at fair value. For interest-bearing loans and borrowings this is the fair value of the proceeds received net of issue costs associated with the borrowing. After initial recognition, financial liabilities other than those at fair value through profit or loss are subsequently measured at amortised cost using the effective interest method. Amortised cost is calculated by taking into account any issue costs and any discount or premium on settlement. Gains and losses arising on the repurchase, settlement or cancellation of liabilities are recognised respectively in interest and other revenues and finance costs. This category of financial liabilities includes trade and other payables.
Convertible bondsConvertible bonds are separated into three components: liability, issuer call option and equity at inception. Each component is recognised separately.
The initial fair value of the liability component of the convertible bond is determined using the market interest rate for an equivalent non-convertible bond and is subsequently recorded at an amortised cost basis using the effective interest method until extinguished on conversion or maturity of the bonds. The issuer call option is fair valued using a valuation model and is measured at each balance sheet date with changes in fair value recognised in the income statement. The remainder of the proceeds are recognised in shareholders’ equity in retained earnings.
www.tuitravelplc.com
76 TUI Travel PLC Annual Report & Accounts 2010
(G) RevenueRevenue represents the aggregate amount earned from inclusive tours, scheduled and charter flying, provision of incoming agency destination services, travel agency commission received and other services supplied to customers in the ordinary course of business. Revenue excludes intra-group transactions and is stated after the deduction of trade discounts and sales taxes. Revenue is reported gross of fixed charges which are a liability of the tour operator or airline. These include Air Passenger Duty and other per passenger charges and levies, including the ATOL Protection Contribution in the UK.
(i)RevenuerecognitionRevenue is recognised in the consolidated income statement when the significant risks and rewards of ownership have been transferred to the buyer. Travel agency commissions and other revenues received from the sale of third-party product are recognised when they are earned, typically on receipt of final payment. Revenue in respect of inhouse product is all recognised on the date of departure. Revenue from individual travel modules directly booked by the customer with airlines, hotels and incoming agencies is recognised when the customer departs or uses the respective service.
No revenue is recognised if there are significant uncertainties regarding recovery of the consideration due or associated costs.
(ii)Clientmoniesreceivedinadvance(deferredincome)Client monies received at the balance sheet date relating to holidays commencing and flights departing after the year end are deferred and included within trade and other payables.
(iii)ValuationofrevenueWhere the Group acts as principal, revenue is stated at the contractual value of goods and services provided.
Where the Group acts as agent and collects amounts on behalf of the principal provider of goods or services, revenue is stated at the value of the commissions earned and not the total transaction sales value.
Where the Group acts as intermediary between the service provider and the end customer, revenue is presented on a net basis as the difference between the sales price to the customer and the cost of the services purchased. Businesses are identified as intermediaries dependent on a number of criteria, principally including: the control exercised over the provision of service, inventory risk, and customer credit risk.
(iv)AircraftleaseincomeOperating lease rental incomes are recognised in operating income as earned, on a straightline basis over the lease term.
(H) Expenses(i)OperatingleasepaymentsPayments made under operating leases are recognised in the consolidated income statement on a straightline basis over the term of the lease. Lease incentives received are recognised in the consolidated income statement as an integral part of the total lease expense over the term of the lease.
Derivatives are recognised initially at fair value; attributable transaction costs are recognised in profit or loss as incurred. Subsequent to initial recognition, derivatives are measured at fair value, and changes therein are accounted for as described below:
(i)CashflowhedgesWhere a derivative financial instrument is designated as a hedge of the variability in cash flows arising from a recognised asset or liability, or a highly probable forecast transaction, the effective part of any fair value gain or loss on the derivative financial instrument is recognised directly in the hedging reserve. Any ineffective portion of the hedge is recognised immediately within the consolidated income statement.
When the forecast transaction subsequently results in the recognition of a non-financial asset or non-financial liability, the associated cumulative gain or loss is removed from the hedging reserve and is included in the initial cost or other carrying amount of the non-financial asset or liability. If a hedge of a forecast transaction subsequently results in the recognition of a financial asset or a financial liability, the associated gains and losses that were recognised directly in equity are reclassified into the consolidated income statement in the same period or periods during which the asset acquired or liability assumed affects profit or loss.
For cash flow hedges, other than those covered by the preceding two paragraphs, the associated cumulative gain or loss is removed from equity and recognised in the consolidated income statement in the same period or periods during which the hedged forecast transaction affects the consolidated income statement.
Prospective hedge testing is performed at the inception of the hedge relationship and subsequently at each balance sheet date, through comparison of the critical terms of the hedged forecast transaction and the hedging instrument. Critical terms are the maturity, amount and currency of the cash flows relating to the hedging instrument and the forecast hedged transaction. Retrospective hedge testing is performed at each reporting date principally using a dollar offset analysis, comparing the cumulative changes in the fair values of the forecast hedged transaction and the hedging instrument.
When a hedging instrument no longer meets the criteria for hedge accounting, expires or is sold, terminated or exercised, or the entity revokes designation of the hedge relationship, hedge accounting is discontinued prospectively. If the hedged forecast transaction is still expected to occur, the cumulative gain or loss at that point remains in equity and is recognised in accordance with the above policy when the transaction occurs. If the hedged transaction is no longer expected to take place, the cumulative unrealised gain or loss recognised in equity is recognised in the consolidated income statement immediately.
(ii)FairvaluehedgesWhere a derivative financial instrument is designated as a hedge of the variability in fair value of a recognised asset or liability or an unrecognised firm commitment, all changes in the fair value of the derivative are recognised immediately in the income statement. The carrying value of the hedged item is adjusted by the change in fair value that is attributable to the risk being hedged (even if it is normally carried at cost or amortised cost) and any fair value gains or losses on remeasurement of the hedged risk are recognised immediately in the income statement (even if those gains would normally be recognised directly in equity).
Financial statements
Notes to the consolidated financial statements continued
www.tuitravelplc.com
Group at a glance
Strategic overviewB
usiness performance
Governance
Financial statements
Shareholder information
TUI Travel PLC Annual Report & Accounts 2010 77
The fair value of the awards is measured using option valuation models, taking into account the terms and conditions upon which the awards were made. The amount recognised as an expense is adjusted to reflect the actual number of share awards that vest except where forfeiture is due only to market-based performance conditions not meeting the threshold for vesting.
For cash-settled transactions, the resulting liability for the Group is charged to expenses at its fair value as at the date of the performance of the service by the beneficiary. Until payment of this liability, the fair value of the liability is remeasured at every reporting date and all changes in the fair value are carried with an effect on results.
(iv)OwnsharesheldbytheEmployeeBenefitTrustsTransactions of the Group-sponsored Employee Benefit Trusts (the Trusts) are included in the Group’s consolidated financial statements. In particular, the Trust’s purchase of shares in the Company is debited directly in equity to retained earnings/(deficit).
(v)Short-termbenefitsShort-term employee benefits are measured on an undiscounted basis and are expensed as the related service is provided.
(J) Financial income and expensesFinancial income comprises interest income on funds invested (including available for sale financial assets), dividend income, gains on the disposal of available for sale financial assets and changes in the fair value of financial assets or liabilities at fair value through profit or loss. Interest income is recognised as it accrues in profit or loss, using the effective interest method. Dividend income is recognised in profit or loss on the date that the Group’s right to receive payment is established which, in the case of quoted securities, is the ex-dividend date. Foreign currency gains and losses are reported on a net basis.
Financial expenses comprise interest expense on borrowings, unwinding of the discount on provisions, changes in the fair value of financial assets or liabilities at fair value through profit or loss and impairment losses recognised on financial assets. All borrowing costs are recognised in profit or loss using the effective interest method. Foreign currency gains and losses are reported on a net basis.
(K) TaxationIncome tax comprises current and deferred tax. Income tax is recognised in the consolidated income statement except to the extent that it relates to items recognised directly in equity, in which case it is recognised in equity.
(i)CurrenttaxCurrent tax is the expected tax payable on the taxable income for the period, using tax rates enacted or substantively enacted at the balance sheet date, and any adjustment to tax payable in respect of previous periods.
(ii)FinanceleasepaymentsMinimum lease payments are apportioned between the finance charge and the reduction of the outstanding liability. The finance charge is allocated to each period during the lease term so as to produce a constant periodic rate of interest on the remaining balance of the liability.
(iii)MarketingandotherdirectsalescostsMarketing, advertising and other promotional costs, including those related to the production of brochures, are expensed when the benefit of the goods or services is made available to the Group. In particular, brochure costs are expensed when the Group has access to the related advertising or promotional material.
(I) Employee benefits(i)DefinedcontributionplansObligations for contributions to defined contribution pension plans are recognised as an expense in the consolidated income statement as incurred.
(ii)DefinedbenefitplansThe Group’s net obligation in respect of defined benefit pension plans is calculated separately for each plan by estimating the amount of future benefit that employees have earned in return for their service in current and prior periods. That benefit is discounted to determine its present value and any unrecognised past service costs and the fair value of any plan assets is deducted in calculating the overall liability. The liability discount rate is the yield at the balance sheet date on AA credit-rated bonds denominated in the currency of, and having the same maturity dates approximating to, the terms of the Group’s obligations. The calculation is performed by a qualified actuary using the projected unit credit method.
Where the calculation results in a benefit to the Group, the asset recognised is limited to the present value of any future refunds from the plan or reductions in future contributions to the plan which are under the control of the Group.
When the benefits of a plan are improved, the portion of the increased benefit relating to past services by employees is recognised as an expense in the consolidated income statement on a straightline basis over the average period until the benefits become vested. To the extent that the benefits vest immediately, the expense is recognised immediately in the consolidated income statement.
All actuarial gains and losses are recognised in the period they occur directly in equity through the consolidated statement of comprehensive income. Either monthly or annual contributions are made to funded schemes.
(iii)Share-basedpaymenttransactionsThe Group’s share award programmes allow certain Group employees to acquire shares of the Company; these shares are awarded by the Company. For equity-settled transactions, the fair value of services is measured by the fair value of the shares at the time awarded and is recognised as an employee expense with a corresponding increase in equity. The fair value is spread over the period during which the employee becomes entitled to the awards.
www.tuitravelplc.com
78 TUI Travel PLC Annual Report & Accounts 2010
Financial statements
Notes to the consolidated financial statements continued
Certain assets/liabilities are excluded from the measurement basis of IFRS 5 including: deferred tax assets (IAS 12 Income Taxes), assets arising from employee benefits (IAS 19 Employee Benefits) and financial assets within the scope of IAS 39 Financial Instruments: Recognition and Measurement.
(O) InvestmentsUnless designated at fair value through profit and loss, trade investments are classified as available for sale assets and are included under non-current assets. They are recorded at fair value with movements in value taken to equity. Any impairment to value is recorded in the income statement.
Short-term investments in debt and equity securities which are held for trading are classified as current assets and are stated at fair value, with any resultant gain or loss recognised in the income statement.
(P) Intangible assets(i)GoodwillAll business combinations are accounted for by applying the purchase method.
Goodwill represents amounts arising on acquisition of subsidiaries, joint ventures and associates. Goodwill represents the difference between the fair value of consideration paid or payable and the net fair value of the identifiable assets, liabilities and contingent liabilities acquired. Identifiable intangibles, such as brands and customer relationships, are those which can be sold separately or which arise from contractual or legal rights regardless of whether those rights are separable, and the fair value can be reliably measured. Identifiable intangibles are those which can be sold separately or which arise from legal rights regardless of whether those rights are separable. Goodwill is stated at cost less any accumulated impairment losses. Goodwill is allocated to those cash generating units expected to benefit from the business combination and is not amortised but tested annually for impairment. Impairment testing is based on assets grouped at the lowest level at which goodwill is monitored for internal management purposes. In respect of joint ventures and associates, the carrying amount of goodwill is included in the carrying amount of the investment in the joint venture or associate.
Fair value adjustments are made in respect of acquisitions. If at the balance sheet date, the amounts of fair values of the acquiree’s identifiable assets and liabilities can only be established provisionally, then these values are used. Any adjustments to these values are taken as adjustments to goodwill and must be recorded within 12 months of the acquisition. Negative goodwill arising on an acquisition is recognised in the income statement upon acquisition.
(ii)ComputersoftwareandotherintangibleassetsComputer software consists of all software that is not an integral part of the related computer hardware and is stated at cost less accumulated amortisation and impairment losses.
(ii)DeferredtaxDeferred tax is provided or recognised using the balance sheet liability method, providing for temporary differences between the carrying amounts of assets and liabilities for financial reporting purposes and the amounts used for taxation purposes. The following temporary differences are not provided for: the initial recognition of goodwill not deductible for tax purposes, the initial recognition of assets or liabilities in a transaction that is not a business combination and differences relating to investments in subsidiaries to the extent that they will probably not reverse in the foreseeable future. The amount of deferred tax asset recognised is based on the expected manner of realisation or settlement of the carrying amount of assets and liabilities, using the tax rate at which the asset or liability is expected to reverse in future periods, based on tax laws enacted or substantively enacted at the balance sheet date.
A deferred tax asset is recognised only to the extent that it is probable that future taxable profits will be available against which the asset can be utilised. Deferred tax assets are reduced to the extent that it is no longer probable that the related tax benefit will be realised.
(L) DividendsDividend distribution to the Company’s shareholders is recognised as a liability in the Group’s financial statements in the period in which the dividends are appropriately authorised and approved for payment and are no longer at the discretion of the Company. Unpaid dividends that do not meet these criteria are disclosed in the notes to the financial statements.
(M) Earnings per shareThe Group presents basic and diluted earnings per share (EPS) data for its ordinary shares. Basic EPS is calculated by dividing the profit or loss attributable to ordinary shareholders of the Company by the weighted average number of ordinary shares outstanding during the period. Diluted EPS is determined by adjusting the weighted average number of ordinary shares outstanding for the effects of all dilutive potential ordinary shares. EPS measures for both continuing and discontinued operations have been presented in accordance with IAS 33. The Group also presents a basic and diluted underlying EPS measure based on underlying earnings as defined in Note 1(B)(iv) above. Further details of the EPS calculation are presented in Note 33.
(N) Non-current assets held for sale IFRS 5 requires that a non-current asset or a disposal group containing a non-current asset is classified as held for sale if its carrying amount will be recovered principally through sale rather than through continuing use, it is available for immediate sale and sale is highly probable within one year.
On initial classification as held for sale, non-current assets and disposal groups are measured at the lower of previous carrying amount and fair value less costs to sell with any adjustments taken to profit or loss. The same applies to gains and losses on subsequent remeasurement.
Any impairment loss on a disposal group is allocated first to goodwill and then to remaining applicable assets on a pro rata basis (except no loss is allocated to inventories, financial assets, deferred tax assets or employee benefit assets, which continue to be measured in accordance with the Group’s accounting policies).
www.tuitravelplc.com
Group at a glance
Strategic overviewB
usiness performance
Governance
Financial statements
Shareholder information
TUI Travel PLC Annual Report & Accounts 2010 79
Assets under construction and advance payments, including capitalised borrowing costs, for future aircraft are not depreciated. Upon the delivery of the aircraft, the advance payments are re-categorised to aircraft assets and depreciation is commenced.
(iv)BorrowingcostsIn respect of borrowing costs relating to qualifying assets, the Group capitalises borrowing costs directly attributable to the acquisition, construction or production of a qualifying asset as part of the cost of that asset.
The Group has capitalised borrowing costs with respect to pre-delivery payments relating to aircraft.
(v)SaleandleasebacktransactionsWhen a sale and leaseback results in a finance lease, any gain on the sale is deferred and recognised as income over the lease term. Any loss on the sale is immediately recognised as an impairment loss when the sale occurs.
If the leaseback is classified as an operating lease, then any gain is recognised immediately if the sale and leaseback terms are demonstrably at fair value. Otherwise, the sale and leaseback are accounted for as follows:
• If the sale price is below fair value, then the gain or loss is recognised immediately, other than to the extent that a loss is compensated for by future rentals at a below-market price, then the loss is deferred and amortised over the period that the asset is expected to be used.
• If the sale price is above fair value, then any gain is deferred and amortised over the useful life of the asset.
• If the fair value of the asset is less than the carrying amount of the asset at the date of the transaction, then that difference is recognised immediately as a loss on the sale.
(R) Impairments(i)FinancialassetsA financial asset is assessed at each reporting date to determine whether there is any objective evidence that it is impaired. A financial asset is considered to be impaired if objective evidence indicates that one or more events have had a negative effect on the estimated future cash flows of that asset.
An impairment loss in respect of a financial asset is calculated as the difference between its carrying amount and its recoverable amount. An impairment loss in respect of an available for sale financial asset is calculated by reference to its fair value. The recoverable amount of the Group’s receivables which are carried at amortised cost is calculated as the present value of estimated future cash flows, discounted at the original effective interest rate (i.e. the effective interest rate computed at initial recognition of these financial assets). Receivables with a short duration are not discounted.
Individually significant financial assets are tested for impairment on an individual basis. The remaining financial assets are assessed collectively in groups that share similar credit risk characteristics.
All impairment losses are recognised in profit or loss. Any cumulative loss in respect of an available for sale financial asset previously recognised in equity is transferred to profit or loss. An impairment loss is reversed if the reversal can be related objectively to an event occurring after the impairment loss was recognised. For financial assets measured at amortised cost and available for sale financial assets that are debt securities, the reversal is recognised in profit or loss. For available for sale financial assets that are equity securities, the reversal is recognised directly in equity.
(iii)AmortisationAmortisation is charged to the consolidated income statement on a straightline basis over the estimated useful economic life of each type of intangible asset as follows:
Computer software 3-10 yearsBrands 15-20 yearsOrder book at date of acquisition Over the period until
travel occursCustomer relationships Over the period during which
value will be obtained by the Group (up to 15 years)
Licences Over the term of licence
Software in development is not amortised. Upon completion of development and bringing the software into use, the costs are re-categorised into computer software and amortisation commences.
(Q) Property, plant and equipment(i)OwnedassetsItems of property, plant and equipment are stated at cost less accumulated depreciation and impairment losses.
Where significant parts of an item of property, plant and equipment have different useful lives, they are accounted for as separate items of property, plant and equipment.
(ii)LeasedassetsLeases in which the Group assumes substantially all the risks and rewards of ownership are classified as finance leases. Leased assets acquired by way of a finance lease are stated at an amount equal to the lower of their fair value and the present value of the minimum lease payments at the inception of the lease, less accumulated depreciation and impairment losses. Lease payments are accounted for as set out in Note 1(H) above.
(iii)DepreciationDepreciation is charged to the consolidated income statement on a straightline basis over the estimated useful economic lives of each part of an item of property, plant and equipment. Freehold land is not depreciated. The useful economic lives are as follows:
Freehold properties Up to 50 yearsShort leasehold improvements Lease period or useful economic
life if shorterOwned aircraft Up to 18 yearsFinance leased aircraft and equipment Lease period or useful economic
life if shorterAircraft spares 12 yearsCruise ships 20 yearsYachts 5-15 yearsMotor boats 15-24 yearsComputer equipment including retail computer equipment 3-5 yearsRetail fixtures and fittings 8 yearsOther assets 4 years
The cost of major overhauls of owned airframes and engines is capitalised and depreciated over the period until the next scheduled major overhaul.
The depreciation methods, useful economic lives and residual values are reassessed annually. Revisions to useful economic lives and residual values are accounted for prospectively from the date of change.
www.tuitravelplc.com
80 TUI Travel PLC Annual Report & Accounts 2010
Financial statements
Notes to the consolidated financial statements continued
over a fleet. The unwinding of discounted values is charged to the consolidated income statement as a financial expense.
The cost of major overhauls of owned airframes and engines is capitalised and depreciated over the period until the next scheduled major overhaul.
(ii)RestructuringprovisionA provision for restructuring is recognised when the Group has approved a detailed and formal restructuring plan, and the restructuring either has commenced or has been announced publicly. Future operating costs are not provided for.
(iii)OnerouscontractsA provision for onerous contracts is recognised when the expected benefits to be derived by the Group from the contract are lower than the unavoidable cost of meeting its obligations under the contract. The provision is measured at the present value of the lower of the expected cost of terminating the contract and the expected net cost of continuing with the contract. Before a provision is established, the Group recognises any impairment loss on the assets associated with that contract.
(U) Non-controlling interestsIn the consolidated balance sheet, the share of net assets attributable to non-controlling interests is disclosed as a separate component of equity after share capital and reserves, although it is neither a financial liability nor an equity instrument. The consolidated income statement discloses the amount of the result for the year attributable to non-controlling interests.
Where the Group has a written put option in respect of a non-controlling interest and has an unavoidable obligation to purchase the shareholding, the non-controlling interest is recorded as a financial liability at fair value, rather than being reported as a separate component of equity. No result is attributable to non-controlling interests and instead changes to the fair value of the financial liability are recorded at each period end in the income statement within financial income or financial expenses.
On purchase or sale of a non-controlling interest held in a Group subsidiary, the Group recognises increases or decreases in its interest directly in equity.
(V) Related partiesFor the purpose of these consolidated financial statements, parties are considered to be related to the Group if the Group has the ability, directly or indirectly, to control the party or exercise significant influence over the party making financial and operating decisions, or vice versa, or where the Group and the party are subject to common control or common significant influence. Related parties may be individuals or other entities.
(W) Segment reportingAn operating segment is a component of an entity that:
a) engages in business activities from which it may earn revenues and incur expenses (including revenues and expenses relating to transactions with other components of the same entity);
b) whose operating results are regularly reviewed by the GMB to make decisions about resources to be allocated to the segment and assess its performance; and
c) for which discrete financial information is available.
As described in Note 2, all underlying operating items are allocated to the segment’s underlying profit except central costs and net financial expenses.
(ii)Non-financialassetsThe carrying amount of the Group’s non-financial assets, other than inventory and deferred tax assets, are reviewed at each balance sheet date to determine whether there is any indication of impairment. If such an indication exists, the asset’s recoverable amount is estimated. For goodwill, the recoverable amount is estimated at each balance sheet date.
An impairment loss is recognised whenever the carrying amount of an asset or its cash generating unit exceeds its recoverable amount. The recoverable amount of an asset or cash generating unit is the greater of its value in use and fair value less costs to sell. In assessing value in use, the estimated future cash flows are discounted to their present value using a pre-tax discount rate that reflects current market assessments of the time value of money and the risks specific to the asset. A cash generating unit is the smallest identifiable group of assets that generates cash inflows that are largely independent of the cash inflows from other assets or groups of assets.
Impairment losses are recognised in profit or loss. Impairment losses recognised in respect of cash generating units are allocated first to reduce the carrying amount of goodwill allocated to the cash generating unit and then to reduce the carrying amount of other assets in the unit on a pro rata basis.
An impairment loss in respect of goodwill is not reversed. In respect of other assets, impairment losses recognised in prior periods are assessed at each reporting date for any indications that the loss has decreased or no longer exists. An impairment loss is reversed if there has been a change in the estimates used to determine the recoverable amount. An impairment loss is reversed only to the extent that the asset’s carrying amount does not exceed the carrying amount that would have been determined, net of depreciation or amortisation, if no impairment loss had been recognised.
(S) InventoriesInventories are measured at the lower of cost or net realisable value. Net realisable value is the estimated selling price less the estimated costs incurred until the sale and the estimated variable costs required to sell. All inventories are written down individually where the net realisable value of inventories is lower than their carrying amounts. The measurement method applied to similar inventory items is the weighted average cost formula.
(T) ProvisionsA provision is recognised in the consolidated balance sheet when the Group has a legal or constructive obligation as a result of a past event, it is probable that an outflow of economic benefits will be required to settle the obligation and the outflow of economic benefits can be reliably estimated. If the effect is material, provisions are determined by discounting the expected future cash flows at a pre-tax rate that reflects current market assessments of the time value of money and the risks specific to the liability.
(i)MaintenanceprovisionforleasedaircraftTo reflect the legal obligations placed upon the Group under the terms of certain operating leases, provision is made for the maintenance, overhaul and repair costs of operating leased airframes, engines and certain other components. The provision is based on the present value of total anticipated external costs over the useful economic life of the asset calculated by reference to costs experienced and published manufacturers’ data. The charge to the consolidated income statement is calculated by reference to the number of hours and cycles flown and by reference to the length of the full overhaul cycle. Costs incurred are charged against the provision. Neither the timing nor the value of the expenditure can be precisely determined but they can be averaged over time and
www.tuitravelplc.com
Group at a glance
Strategic overviewB
usiness performance
Governance
Financial statements
Shareholder information
TUI Travel PLC Annual Report & Accounts 2010 81
(v)TradeandotherreceivablesTrade receivables are recognised at their fair value and subsequently recorded at amortised cost using the effective interest method as reduced by allowances for estimated irrecoverable amounts. An allowance for irrecoverable amounts is established when there is objective evidence that the Group will not be able to collect all amounts due according to the original terms of the receivables. The amount of allowance is the difference between the asset’s carrying amount and the present value of estimated future cash flows.
(vi)TradepayablesTrade payables are recognised at their fair value and subsequently recorded at amortised cost using the effective interest method.
(vii)DerivativesThe fair value of foreign currency contracts, fuel forward contracts and option contracts is their forward market price at the balance sheet date, based on external valuations or internal valuations using market data.
(viii)Non-derivativefinancialliabilitiesFair value, which is determined for disclosure purposes, is calculated based on the present value of future principal and interest cash flows, discounted at the market rate of interest at the reporting date. For finance leases the market rate of interest is determined by reference to similar lease agreements.
(ix)Share-basedpaymentsThe fair value of the shares awarded is measured using option valuation models, taking into account the terms and conditions upon which the awards were made. The valuation basis is identical whether the awards will be settled in cash or shares.
(Z) New Standards and interpretations not yet adoptedThe following standards which are applicable to the Group have been endorsed by the European Union and are effective for the year ending 30 September 2011. They are not expected to have a significant impact on the Group’s financial statements in future years:
IAS 1 Presentation of Financial Statements has been amended to state that the classification of the liability component of a convertible instrument as current or non-current is not affected by terms that, at the option of the holder, result in settlement of the liability through issue of equity instruments.
IAS 7 Statement of cash flows has been amended to state explicitly that only expenditure that results initially in the recognition of an asset may be classified as a cash flow from investing activities.
Paragraph 14 of IAS 17 Leases has been deleted such that a lease of land with an indefinite economic life need not be classified as an operating lease. A land lease with a lease term of several decades or longer may be classified as a finance lease, even if at the end of the lease term title does not pass to the lessee. When a lease includes both land and buildings, classification of each element of the lease will take account of the fact that land normally has an indefinite economic life.
The appendix of IAS 18 Revenue has been amended to specify that an entity acts as principal when exposed to significant risks and rewards associated with sale of goods or rendering of services. Further indicators have been added to the appendix to assist in assessing whether an entity is principal or agent.
The Group has decided to adopt early an amendment to IFRS 8 Operating Segments which states that segment information for total assets is only required if such information is regularly reported to the chief operating decision-maker.
(X) Use of estimatesThe preparation of financial statements requires management to make judgements, estimates and assumptions that affect the application of accounting policies and the reported amounts of assets, liabilities, income and expenses. Actual results may differ from these estimates.
Estimates and underlying assumptions are reviewed on an ongoing basis. Revisions to accounting estimates are recognised in the period in which the estimates are revised and in any future periods affected. Details of critical judgements, significant estimates and assumptions are disclosed in the relevant notes to the consolidated financial statements. The key accounting estimates and judgements are described in Note 31.
(Y) Determination of fair valuesA number of the Group’s accounting policies and disclosures require the determination of fair value, for both financial and non-financial assets and liabilities. Fair values have been determined for measurement and/or disclosure purposes based on the following methods. When applicable, further information about the assumptions made in determining fair values is disclosed in the notes specific to that asset or liability.
(i)Property,plantandequipmentThe fair value of property, plant and equipment recognised as a result of a business combination is based on market values. The market value of property is the estimated amount for which a property could be exchanged on the date of valuation between a willing buyer and a willing seller in an arm’s length transaction after proper marketing wherein the parties had each acted knowledgeably, prudently and without compulsion. The market value of items of plant, equipment, fixtures and fittings is based on the quoted market prices for similar items.
(ii)IntangibleassetsThe fair value of intangible assets recognised as a result of a business combination, including brands, customer relationships and the customer order book at the date of acquisition, is valued by reference to external market values or income-based methods. Income-based methods estimate the future economic benefits to be derived from ownership of the asset by identifying, quantifying and separating cash flows attributable to the asset and capitalising their present value.
(iii)InventoriesThe fair value of inventories acquired in a business combination is determined based on the estimated selling price in the ordinary course of business, less the estimated costs of completion and sale, and a reasonable profit margin based on the effort required to complete and sell the inventories.
(iv)InvestmentsinequityanddebtsecuritiesThe fair value of financial assets at fair value through profit or loss and available for sale financial assets is determined by reference to their quoted closing bid price at the reporting date, where available. If there is no market price available the fair value is calculated based on other valuation techniques, including assessments of future cash flows, estimated selling price and other available information. The fair value of held to maturity investments is determined on initial recognition and thereafter for disclosure purposes only.
www.tuitravelplc.com
82 TUI Travel PLC Annual Report & Accounts 2010
between Central Europe, Northern Region and Western Europe), Specialist and Emerging Markets, Activity and Accommodation & Destinations Sectors. Under IFRS 8, the results of Germany, the UK & Ireland and Canada are shown separately from Central Europe and Northern Region respectively as these meet the threshold of being individual reportable segments. The French airline, Corsair, has been separately disclosed from the rest of Western Europe as it is the only scheduled airline consolidated within the Group and therefore has a different business model to the rest of the Group’s integrated tour operators. A more detailed explanation of each segment is included in the Business performance section of the Annual Report & Accounts. Comparative information has also been restated to reflect these new segments.
Certain Group operating segments have been aggregated into reportable segments where their activities are considered to be sufficiently similar in nature under the aggregation criteria of IFRS 8. The results of Nordics form the rest of Northern Region; Switzerland, Austria and Poland form the rest of Central Europe; and Belgium, the Netherlands and the French tour operating businesses form the rest of Western Europe.
Central costs comprise finance, human resources, legal, facility costs and some information technology costs that do not relate to each business segment (and hence they are not allocated) and are classified within all other segments.
Information regarding the results of each reportable segment is provided below. Segmental performance is evaluated based on underlying operating profit and is measured consistently with underlying operating profit or loss in the consolidated financial statements and as defined in Note 1(B)(iv). The GMB reviews revenues and underlying operating profit before the impact of the volcano. Consequently, the segmental results are shown on a pre-volcano basis as defined in Note 1(B)(iii) and reconciled back to the statutory result. The Group-wide disclosures reflect the statutory revenues and non-current assets figures.
Inter-segment sales and transfers reflect arm’s length prices as if sold or transferred to third parties. Financial income and expenses are not allocated to the reportable segments as this activity is managed by the Group’s treasury function which manages the overall net debt position of the Group.
No one customer exceeds 10% of entity revenues in any segment. Impairment losses arising in the period relate to Specialist segments which are further detailed in Note 10. All impairment losses have been recognised in the consolidated income statement.
Segment assets comprise capital expenditure (as this is the only measure of assets reported to the GMB) and represent the amounts purchased in the year. Capital expenditure is measured within the Group as non-business combination-related additions of intangibles and property, plant and equipment.
Note that with effect from 1 October 2010, the Group has reorganised its business Sectors. The Mainstream Sector remains unchanged in terms of operating segments. The remaining Sectors have been refined and renamed to reflect the strategic priorities of TUI Travel as it develops. The three remaining Sectors are now called Accommodation & Destinations, Specialist & Activity and Emerging Markets. Segmental information will be presented using this new structure throughout the forthcoming financial year ending 30 September 2011.
Amendment to IAS 32 Classification of rights issues requires that rights, options or warrants to acquire a fixed number of the entity’s own equity instruments for a fixed amount of currency are equity instruments if the entity offers the rights, options or warrants pro rata to all of its existing owners of the same class of its own non-derivative equity instruments.
IAS 36 Impairment of Assets has been amended to state that the largest unit to which goodwill is allocated is operating segment level as defined in IFRS 8 before applying aggregation criteria of IFRS 8.12.
IAS 38 Intangible Assets – Measuring the fair value of an intangible asset acquired in a business combination has been amended to clarify the description of valuation techniques commonly used to measure fair value of intangible assets acquired in a business combination for which no active market exists.
IAS 39 Financial Instruments: Recognition and Measurement has been amended so that:
i) where the exercise price of an embedded prepayment option reimburses the lender for an amount up to the approximate present value of the lost interest for the remaining term of the host contract, then the embedded prepayment option is closely related to the host contract and the embedded derivative is not separated.
ii) the scope exemption in paragraph 2(g) is now restricted to forward contracts between buyer and seller to buy or sell an acquiree at a future date (i.e. contract that will result in a business combination at a future date).
iii) gains or losses on a hedged instrument should be reclassified from equity to profit or loss during the period that the hedged forecast cash flows affect profit or loss.
IFRIC 17 Distribution of non-cash assets to owners provides guidance on accounting for arrangements whereby an entity distributes non-cash assets to shareholders either as a distribution of reserves or as dividends.
IFRIC 18 Transfer of Assets from Customers deals with the accounting for contributed property, plant and equipment by the entity receiving the contribution.
IFRIC 19 – Extinguishing financial liabilities with equity instruments deals with how entities should measure equity instruments issued in a debt for equity swap.
The Group continues to monitor the potential impact of other new standards and interpretations which may be endorsed by the European Union and require adoption by the Group in future accounting periods.
2. Segmental informationThe Group has adopted IFRS 8 Operating Segments for the first time in the year. IFRS 8 requires segment information to be presented on the same basis as that used for internal management reporting. Segmental information is reported by the Group’s business sectors to the GMB. The GMB consists of tour operating and functional experts drawn from across the Group that executes TUI Travel PLC’s day-to-day operations and allocates resources to, and assesses the performance, of the operating segments. Consequently, the GMB is considered to be the chief operating decision maker.
The Group presents segment information in respect of its business segments. On the adoption of IFRS 8, the Group has determined new segments in line with the requirements of this standard. The Group’s operating segments were previously defined as Mainstream (split
Financial statements
Notes to the consolidated financial statements continued

www.tuitravelplc.com
Group at a glance
Strategic overviewB
usiness performance
Governance
Financial statements
Shareholder information
TUI Travel PLC Annual Report & Accounts 2010 83
Yearended30September2010 Underlying operating Group’sshare profit/(loss) ofunderlying Underlying beforejoint operating operating Totalrevenue Totalexternal venturesand profit/(loss) profit/(loss) beforeimpact Inter- revenuebefore associatesand ofjoint beforeimpact ofvolcanic segmental impactof impactof venturesand ofvolcanic ash revenue volcanicash volcanicash associates ashSector £m £m £m £m £m £m
UK 3,453 (61) 3,392 127 – 127Canada 52 – 52 (5) – (5)Rest of Northern Region 967 (63) 904 58 2 60
TotalNorthernRegion 4,472 (124) 4,348 180 2 182Germany 3,829 (29) 3,800 76 5 81Rest of Central Europe 627 (52) 575 11 – 11
TotalCentralEurope 4,456 (81) 4,375 87 5 92French airline 399 (56) 343 (24) – (24)Rest of Western Europe 2,336 (13) 2,323 75 – 75
TotalWesternEurope 2,735 (69) 2,666 51 – 51
TotalMainstream 11,663 (274) 11,389 318 7 325
Specialist & Emerging Markets 717 – 717 25 (6) 19Activity 868 – 868 61 – 61Accommodation & Destinations 760 (209) 551 61 10 71All other segments – – – (29) – (29)
TotalGroup 14,008 (483) 13,525 436 11 447
Year ended 30 September 2009 Underlying operating Group’s share profit/(loss) of underlying Inter- before joint profit of joint Underlying segmental Total external ventures and ventures and operating Total revenue revenue revenue associates associates profit/(loss)Sector £m £m £m £m £m £m
UK (restated*) 3,332 (87) 3,245 142 – 142 Canada 168 – 168 (24) – (24)Rest of Northern Region 878 (81) 797 46 2 48
Total Northern Region (restated*) 4,378 (168) 4,210 164 2 166 Germany 4,183 (39) 4,144 65 5 70 Rest of Central Europe 654 (2) 652 1 – 1
Total Central Europe 4,837 (41) 4,796 66 5 71 French airline 432 (75) 357 (24) – (24)Rest of Western Europe 2,310 (15) 2,295 57 – 57
Total Western Europe 2,742 (90) 2,652 33 – 33
Total Mainstream (restated*) 11,957 (299) 11,658 263 7 270
Specialist & Emerging Markets 825 – 825 31 1 32 Activity 816 – 816 59 – 59 Accommodation & Destinations 719 (167) 552 60 7 67 All other segments – – – (27) – (27)
Total Group (restated*) 14,317 (466) 13,851 386 15 401
*Please refer to Basis of Preparation within Note 1 of the financial statements for details.
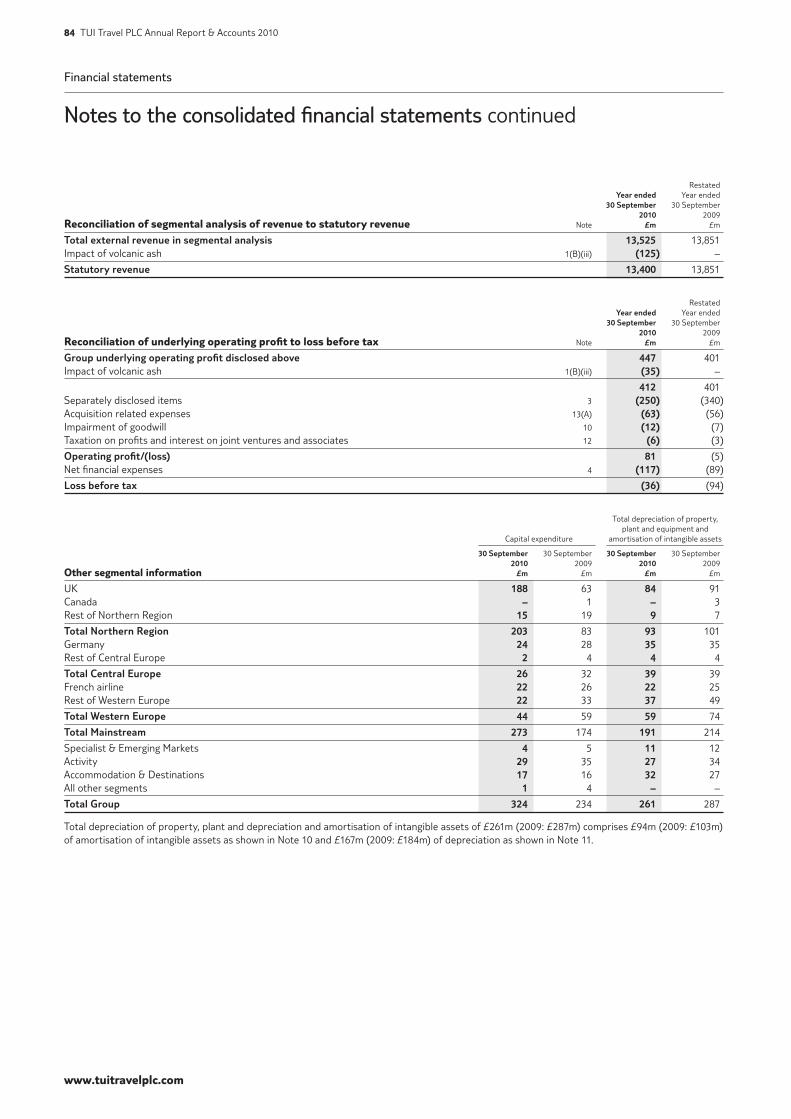
Financial statements
Notes to the consolidated financial statements continued
www.tuitravelplc.com
84 TUI Travel PLC Annual Report & Accounts 2010
Restated Yearended Year ended 30September 30 September 2010 2009 Reconciliation of segmental analysis of revenue to statutory revenue Note £m £m
Totalexternalrevenueinsegmentalanalysis 13,525 13,851 Impact of volcanic ash 1(B)(iii) (125) –
Statutoryrevenue 13,400 13,851
Restated Yearended Year ended 30September 30 September 2010 2009 Reconciliation of underlying operating profit to loss before tax Note £m £m
Groupunderlyingoperatingprofitdisclosedabove 447 401 Impact of volcanic ash 1(B)(iii) (35) –
412 401 Separately disclosed items 3 (250) (340)Acquisition related expenses 13(A) (63) (56)Impairment of goodwill 10 (12) (7)Taxation on profits and interest on joint ventures and associates 12 (6) (3)
Operatingprofit/(loss) 81 (5)Net financial expenses 4 (117) (89)
Lossbeforetax (36) (94)
Total depreciation of property, plant and equipment and Capital expenditure amortisation of intangible assets 30September 30 September 30September 30 September 2010 2009 2010 2009Other segmental information £m £m £m £m
UK 188 63 84 91Canada – 1 – 3Rest of Northern Region 15 19 9 7
TotalNorthernRegion 203 83 93 101Germany 24 28 35 35Rest of Central Europe 2 4 4 4
TotalCentralEurope 26 32 39 39French airline 22 26 22 25Rest of Western Europe 22 33 37 49
TotalWesternEurope 44 59 59 74
TotalMainstream 273 174 191 214
Specialist & Emerging Markets 4 5 11 12Activity 29 35 27 34Accommodation & Destinations 17 16 32 27All other segments 1 4 – –
TotalGroup 324 234 261 287
Total depreciation of property, plant and depreciation and amortisation of intangible assets of £261m (2009: £287m) comprises £94m (2009: £103m) of amortisation of intangible assets as shown in Note 10 and £167m (2009: £184m) of depreciation as shown in Note 11.

www.tuitravelplc.com
Group at a glance
Strategic overviewB
usiness performance
Governance
Financial statements
Shareholder information
TUI Travel PLC Annual Report & Accounts 2010 85
Yearended Year ended 30September 30 September 2010 2009 Reconciliation of capital expenditure to amounts included in the financial statements Note £m £m
Total Group capital expenditure as shown above 324 234Analysed as:Additions to intangible assets 43 82Additions to property, plant and equipment 281 152
324 234
ReconciliationtothenotestothefinancialstatementsAdditions to intangible assets in segmental analysis 43 82Additions to goodwill 1 3
Intangibleassets:totaladditions 10 44 85
Additions to property, plant and equipment in segmental analysis 281 152
Property,plantandequipment:totaladditions 11 281 152
Group-wide disclosuresThe UK is the Group’s parent company’s country of domicile. Revenues from external customers and non-current assets are split geographically as follows: UK Germany France Other Europe Rest of the World Total Restated Restated 2010 2009 2010 2009 2010 2009 2010 2009 2010 2009 2010 2009 £m £m £m £m £m £m £m £m £m £m £m £m
Revenue from external customers 4,134 4,150 3,704 3,753 1,313 1,337 3,524 3,831 725 780 13,400 13,851 Non-current assets 2,685 2,598 639 643 735 779 856 955 756 726 5,671 5,701
United Kingdom revenue arises where the source of the supply is the United Kingdom. In addition to the United Kingdom, revenue relating to an individual country is separately disclosed when it represents 10% or more of total revenue. ‘Other Europe’ is defined as Continental Europe and Eire excluding UK, Germany and France. Non-current assets for the table above includes intangible assets and property, plant and equipment and excludes all financial instruments, deferred tax assets and post-employment benefit assets.
3. Separately disclosed items Yearended Year ended 30September 30 September 2010 2009 £m £m
Merger related integration costs 116 144 Aircraft and other assets 7 124 Restructuring and other separately disclosed items 58 72
Totalprevolcanicash 181 340 Incremental costs caused by volcanic ash disruption 69 –
Total 250 340
Separately disclosed financial expenses 7 12
The 2009 comparative numbers have been reallocated to ensure that they are in alignment with the revised criteria used to differentiate between the different types of separately disclosed items.
Separately disclosed items within the operating profit/(loss) are included within the consolidated income statement as follows:
Yearended Year ended 30September 30 September 2010 2009 £m £m
Cost of sales 133 209 Administrative expenses 117 131
Total 250 340
Financial statements
Notes to the consolidated financial statements continued
www.tuitravelplc.com
86 TUI Travel PLC Annual Report & Accounts 2010
Merger related integration costsThese relate primarily to the costs of integration of the UK businesses. The majority of costs (£48m) arise from the integration of First Choice and Thomson in the UK, and, in particular, from the formation of one airline and an integrated retail estate. A combined Mainstream UK head office has been established in Luton.
The UK business has also now completed the creation of a single management information (MI) suite. The improved MI and forecast capability which it has given the business has now led to the closing out of certain foreign currency positions based on the improved visibility of past and future requirements, resulting in a £20m charge in the current year.
Costs also arose from the ongoing merger of former TUI businesses based in Continental Europe with their First Choice counterparts (£4m). In the Accommodation & Destinations Sector separate First Choice and TUI Tourism incoming agencies have been combined in a number of key destinations, notably Spain, the Dominican Republic, Greece and Turkey (total £16m).
Costs include amounts paid or provided for redundancy and integration remuneration costs (including the cost of the Value Creation Share Plan and rolled over First Choice share awards (Note 5(D))), property closures and onerous lease obligations, as well as professional fees relating to the integration project.
Aircraft and other assetsIncluded in the year ended 30 September 2010 is a £47m credit which relates to a combination of aircraft order cancellation credits and compensation for delays to the delivery of aircraft. Principal charges include £15m for the impairment of the cruise ship, the ‘Island Escape’ (Note 11); £12m to provide for costs relating to the Corsair fleet renewal as part of the restructuring of that business; and £7m to record an onerous lease provision on an unused property.
In the year ended 30 September 2009 there was a £124m impairment charge principally in respect of asset write-downs of Boeing 747s operated by Corsair (Note 11).
Restructuring and other separately disclosed itemsCosts incurred in the year ended 30 September 2010 include restructuring programmes which are not related to the business combination of First Choice and the Tourism businesses of TUI AG. The principal items are £43m to significantly restructure Corsair, the scheduled French airline; £22m for the restructuring of hotel operations in Turkey and £13m to restructure the tour operator, retail network and hotel operations of Nouvelles Frontières in France. Also included is a £30m credit arising from the revaluation of the investment in The Airline Group (Note 12), and a £13m gain recognised on the disposal of the Canadian Mainstream operation which was contributed when creating the strategic venture (Note 18). This gain was more than offset by our share of post-deal restructuring costs and related Skyservice write-offs.
The main costs incurred in the year ended 30 September 2009 were £40m in relation to transaction costs and associated restructuring in the German source market, due to the transaction to sell TUIfly’s city charter business to Air Berlin PLC, £16m due to the closure of the Sunsail Clubs in Turkey and the Caribbean, and £13m for restructuring of the French tour operator, Nouvelles Frontières.
Impact of volcanic ashIncluded in separately disclosed items are the incremental direct costs incurred by the Group in respect of welfare costs to look after the customers who were affected by the closure of European airspace. These costs principally include hotel costs for stranded inbound and outbound customers, and the cost of repatriation of inbound customers. These costs amount to £69m and are shown in the ‘Pro forma impact of volcanic ash’ column on the face of the consolidated income statement.
Separately disclosed financial expensesThe separately disclosed financial expenses in the year ended 30 September 2010 relate to non debt items, principally a £3m interest charge on a tax penalty imposed by the Turkish authorities relating to financial years up to and including 2008.
The separately disclosed financial expenses for the year ended 30 September 2009 relate to non debt items including the revaluation of a put option written by the Group in respect of a non-controlling interest shareholder of L’TUR Tourismus AG (L’TUR).

www.tuitravelplc.com
Group at a glance
Strategic overviewB
usiness performance
Governance
Financial statements
Shareholder information
TUI Travel PLC Annual Report & Accounts 2010 87
4. Net financial expenses Yearended Year ended 30September 30 September 2010 2009 £m £m
FinancialincomeBank interest receivable 3 6 Interest on pension scheme assets 66 64 Other financial income – 2
Total 69 72
FinancialexpensesBank interest payable on loans and overdrafts (10) (11)Finance charges on convertible bond (44) – Interest on pension scheme liabilities (84) (81)Interest payable in respect of loans from parent (15) (42)Finance lease charges (11) (10)Unwinding of discount on provisions (11) (5)Other financial expenses (11) (12)
Total (186) (161)
Netfinancialexpenses (117) (89)
Yearended Year ended 30September 30 September 2010 2009 £m £m
Net financial expenses (as above) (117) (89)Less separately disclosed financial expenses (Note 3) 7 12
Netunderlyingfinancialexpenses (110) (77)
5. Employees Yearended Year ended 30September 30 September 2010 2009 (A) Average number of employees Number Number
BySectorMainstream Sector 35,375 35,130 Specialist & Emerging Markets Sector 1,522 1,474 Activity Sector 4,492 4,792 Accommodation & Destinations Sector 6,941 7,673 Corporate 394 394
Total 48,724 49,463
The 2009 comparative numbers have been reallocated to ensure that they are in alignment with a revised method of allocating headcount to the various Sectors. There is no change to the total number of employees.
Yearended Year ended 30September 30 September 2010 2009 (B) Staff costs £m £m
Wages and salaries 1,385 1,293 Social security costs 248 234 Pension costs 61 47 Share-based payments (Note 5(D)) 15 17
Total 1,709 1,591
Included within wages and salaries are £96m (2009: £65m) of wages and salaries and £8m (2009: £5m) of social security costs in relation to redundancy and integration costs. These related staff costs are included within separately disclosed items (Note 3).
(C) Pension costsThe Group operates pension schemes for employees eligible and wishing to participate in the schemes. These comprise both defined contribution and defined benefit schemes. Pension obligations vary reflecting the different legal and market conditions in each country of operation. Defined contribution schemes are funded by the payment of contributions to private and state-run organisations, whilst defined benefit schemes comprise both funded and unfunded schemes. The assets of all the funded defined benefit schemes are held separately from the assets of the Group.
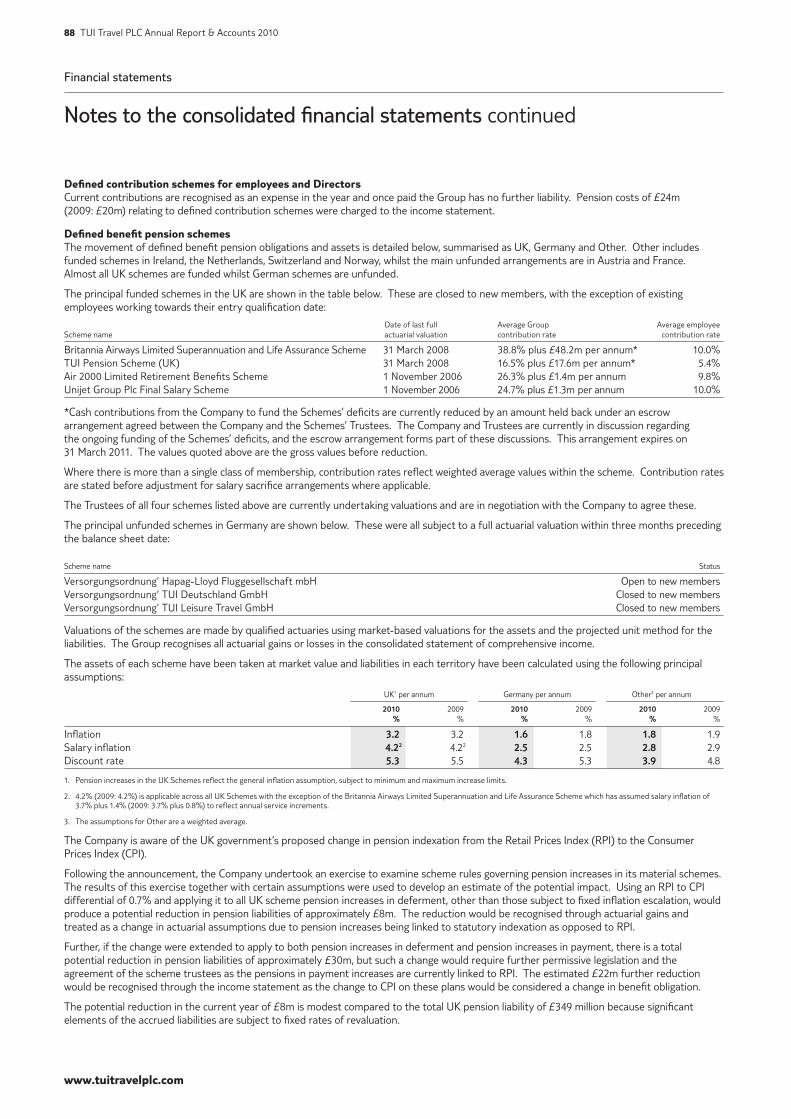
Financial statements
Notes to the consolidated financial statements continued
www.tuitravelplc.com
88 TUI Travel PLC Annual Report & Accounts 2010
Defined contribution schemes for employees and Directors Current contributions are recognised as an expense in the year and once paid the Group has no further liability. Pension costs of £24m (2009: £20m) relating to defined contribution schemes were charged to the income statement.
Defined benefit pension schemes The movement of defined benefit pension obligations and assets is detailed below, summarised as UK, Germany and Other. Other includes funded schemes in Ireland, the Netherlands, Switzerland and Norway, whilst the main unfunded arrangements are in Austria and France. Almost all UK schemes are funded whilst German schemes are unfunded.
The principal funded schemes in the UK are shown in the table below. These are closed to new members, with the exception of existing employees working towards their entry qualification date:
Date of last full Average Group Average employeeScheme name actuarial valuation contribution rate contribution rate
Britannia Airways Limited Superannuation and Life Assurance Scheme 31 March 2008 38.8% plus £48.2m per annum* 10.0%TUI Pension Scheme (UK) 31 March 2008 16.5% plus £17.6m per annum* 5.4%Air 2000 Limited Retirement Benefits Scheme 1 November 2006 26.3% plus £1.4m per annum 9.8%Unijet Group Plc Final Salary Scheme 1 November 2006 24.7% plus £1.3m per annum 10.0%
*Cash contributions from the Company to fund the Schemes’ deficits are currently reduced by an amount held back under an escrow arrangement agreed between the Company and the Schemes’ Trustees. The Company and Trustees are currently in discussion regarding the ongoing funding of the Schemes’ deficits, and the escrow arrangement forms part of these discussions. This arrangement expires on 31 March 2011. The values quoted above are the gross values before reduction.
Where there is more than a single class of membership, contribution rates reflect weighted average values within the scheme. Contribution rates are stated before adjustment for salary sacrifice arrangements where applicable.
The Trustees of all four schemes listed above are currently undertaking valuations and are in negotiation with the Company to agree these.
The principal unfunded schemes in Germany are shown below. These were all subject to a full actuarial valuation within three months preceding the balance sheet date:
Scheme name Status
Versorgungsordnung’ Hapag-Lloyd Fluggesellschaft mbH Open to new membersVersorgungsordnung’ TUI Deutschland GmbH Closed to new membersVersorgungsordnung’ TUI Leisure Travel GmbH Closed to new members
Valuations of the schemes are made by qualified actuaries using market-based valuations for the assets and the projected unit method for the liabilities. The Group recognises all actuarial gains or losses in the consolidated statement of comprehensive income.
The assets of each scheme have been taken at market value and liabilities in each territory have been calculated using the following principal assumptions:
UK1 per annum Germany per annum Other3 per annum 2010 2009 2010 2009 2010 2009 % % % % % %
Inflation 3.2 3.2 1.6 1.8 1.8 1.9Salary inflation 4.22 4.22 2.5 2.5 2.8 2.9Discount rate 5.3 5.5 4.3 5.3 3.9 4.8
1. Pension increases in the UK Schemes reflect the general inflation assumption, subject to minimum and maximum increase limits.
2. 4.2% (2009: 4.2%) is applicable across all UK Schemes with the exception of the Britannia Airways Limited Superannuation and Life Assurance Scheme which has assumed salary inflation of 3.7% plus 1.4% (2009: 3.7% plus 0.8%) to reflect annual service increments.
3. The assumptions for Other are a weighted average.
The Company is aware of the UK government’s proposed change in pension indexation from the Retail Prices Index (RPI) to the Consumer Prices Index (CPI).
Following the announcement, the Company undertook an exercise to examine scheme rules governing pension increases in its material schemes. The results of this exercise together with certain assumptions were used to develop an estimate of the potential impact. Using an RPI to CPI differential of 0.7% and applying it to all UK scheme pension increases in deferment, other than those subject to fixed inflation escalation, would produce a potential reduction in pension liabilities of approximately £8m. The reduction would be recognised through actuarial gains and treated as a change in actuarial assumptions due to pension increases being linked to statutory indexation as opposed to RPI.
Further, if the change were extended to apply to both pension increases in deferment and pension increases in payment, there is a total potential reduction in pension liabilities of approximately £30m, but such a change would require further permissive legislation and the agreement of the scheme trustees as the pensions in payment increases are currently linked to RPI. The estimated £22m further reduction would be recognised through the income statement as the change to CPI on these plans would be considered a change in benefit obligation.
The potential reduction in the current year of £8m is modest compared to the total UK pension liability of £349 million because significant elements of the accrued liabilities are subject to fixed rates of revaluation.

www.tuitravelplc.com
Group at a glance
Strategic overviewB
usiness performance
Governance
Financial statements
Shareholder information
TUI Travel PLC Annual Report & Accounts 2010 89
Whilst in Management’s view the potential adjustment to the pension liability is not material, no adjustment has been recognised due to the significant uncertainty relating to key variables and assumptions on this issue.
The mortality assumptions underlying the value of the accrued liabilities for each territory are set out in the tables below. The mortality assumptions are based on relevant standard mortality tables in each territory:
2010 2009 UKlifeexpectancy(weightedaverage) Years Years
MalesLife expectancy in years for a pensioner retiring aged 65, on the balance sheet date 23.0 22.9 Life expectancy in years for a pensioner retiring aged 65, 20 years after the balance sheet date 24.3 24.2 FemalesLife expectancy in years for a pensioner retiring aged 65, on the balance sheet date 25.4 25.2 Life expectancy in years for a pensioner retiring aged 65, 20 years after the balance sheet date 26.5 26.4
2010 2009 Germanylifeexpectancy Years Years
MalesLife expectancy in years for a pensioner retiring aged 65, on the balance sheet date 18.3 18.2 Life expectancy in years for a pensioner retiring aged 65, 20 years after the balance sheet date 21.4 20.9 Females Life expectancy in years for a pensioner retiring aged 65, on the balance sheet date 22.0 22.3 Life expectancy in years for a pensioner retiring aged 65, 20 years after the balance sheet date 25.0 24.9
2010 2009 Otherlifeexpectancy(weightedaverage) Years Years
MalesLife expectancy in years for a pensioner retiring aged 65, on the balance sheet date 20.5 18.8 Life expectancy in years for a pensioner retiring aged 65, 20 years after the balance sheet date 21.9 20.2 FemalesLife expectancy in years for a pensioner retiring aged 65, on the balance sheet date 22.9 21.8 Life expectancy in years for a pensioner retiring aged 65, 20 years after the balance sheet date 23.6 22.5
The fair value of assets of the schemes in each territory are set out below:
UK Germany Other Total 2010 2009 2010 2009 2010 2009 2010 2009 £m £m £m £m £m £m £m £m
Equities 523 457 – – 47 46 570 503 Government debt 242 210 – – 37 37 279 247 Corporate bonds 177 129 – – 21 21 198 150 Property 12 15 – – 1 1 13 16 Cash and cash equivalents 20 45 – – 1 1 21 46 Other 99 86 – – 35 31 134 117
Total 1,073 942 – – 142 137 1,215 1,079
The expected rates of return on each category of assets in each territory are as follows:
UK Germany Other 2010 2009 2010 2009 2010 2009 % % % % % %
Equities 7.8 7.8 N/A N/A 8.0 8.0 Government debt 3.8 4.1 N/A N/A 4.2 4.2 Corporate bonds 5.3 5.5 N/A N/A 4.3 3.8 Property 6.5 6.0 N/A N/A 6.4 5.8 Cash and cash equivalents 0.5 0.5 N/A N/A 2.6 0.5 Other 7.4 7.4 N/A N/A 2.5 2.5
Overall expected rate of return 6.3 6.2 N/A N/A 5.0 5.1
The overall expected rate of return is calculated by weighting the individual rates in accordance with the anticipated balance in the schemes’ investment portfolio. The fair values of the schemes’ assets are not intended to be realised in the short-term and may be subject to significant change before they are realised.
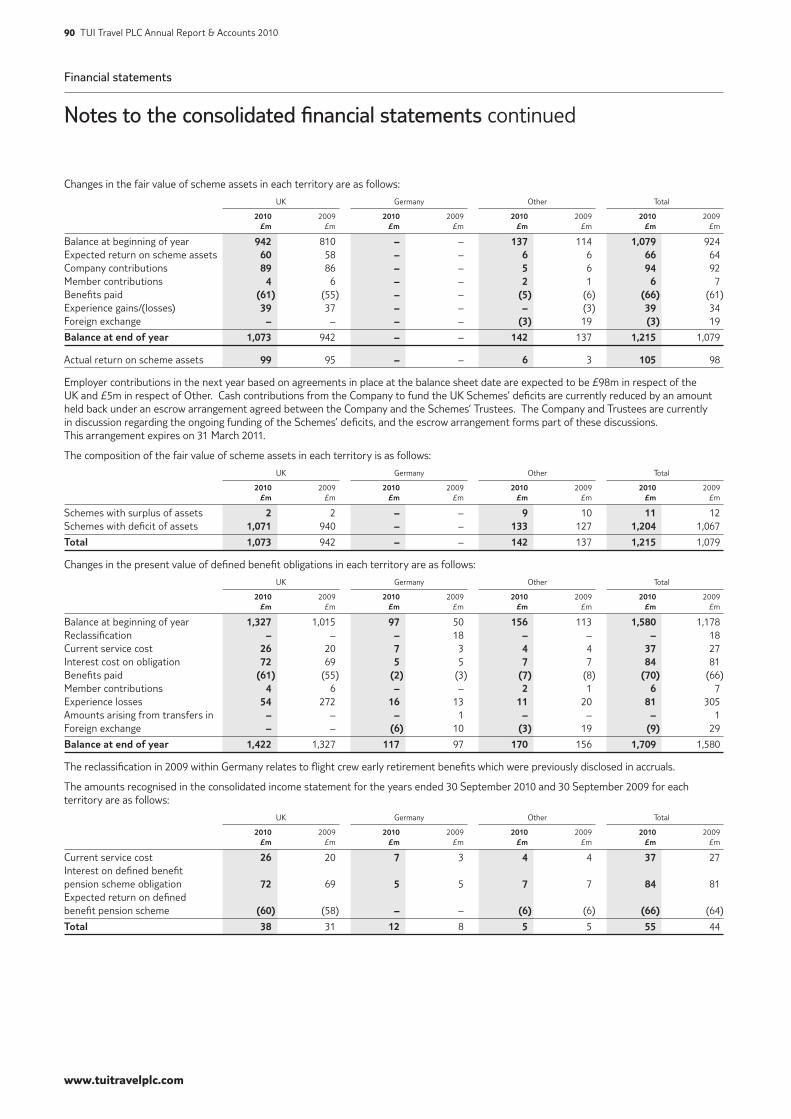
Financial statements
Notes to the consolidated financial statements continued
www.tuitravelplc.com
90 TUI Travel PLC Annual Report & Accounts 2010
Changes in the fair value of scheme assets in each territory are as follows:
UK Germany Other Total 2010 2009 2010 2009 2010 2009 2010 2009 £m £m £m £m £m £m £m £m
Balance at beginning of year 942 810 – – 137 114 1,079 924 Expected return on scheme assets 60 58 – – 6 6 66 64 Company contributions 89 86 – – 5 6 94 92 Member contributions 4 6 – – 2 1 6 7 Benefits paid (61) (55) – – (5) (6) (66) (61)Experience gains/(losses) 39 37 – – – (3) 39 34 Foreign exchange – – – – (3) 19 (3) 19
Balanceatendofyear 1,073 942 – – 142 137 1,215 1,079
Actual return on scheme assets 99 95 – – 6 3 105 98
Employer contributions in the next year based on agreements in place at the balance sheet date are expected to be £98m in respect of the UK and £5m in respect of Other. Cash contributions from the Company to fund the UK Schemes’ deficits are currently reduced by an amount held back under an escrow arrangement agreed between the Company and the Schemes’ Trustees. The Company and Trustees are currently in discussion regarding the ongoing funding of the Schemes’ deficits, and the escrow arrangement forms part of these discussions. This arrangement expires on 31 March 2011.
The composition of the fair value of scheme assets in each territory is as follows:
UK Germany Other Total 2010 2009 2010 2009 2010 2009 2010 2009 £m £m £m £m £m £m £m £m
Schemes with surplus of assets 2 2 – – 9 10 11 12 Schemes with deficit of assets 1,071 940 – – 133 127 1,204 1,067
Total 1,073 942 – – 142 137 1,215 1,079
Changes in the present value of defined benefit obligations in each territory are as follows:
UK Germany Other Total 2010 2009 2010 2009 2010 2009 2010 2009 £m £m £m £m £m £m £m £m
Balance at beginning of year 1,327 1,015 97 50 156 113 1,580 1,178 Reclassification – – – 18 – – – 18 Current service cost 26 20 7 3 4 4 37 27 Interest cost on obligation 72 69 5 5 7 7 84 81 Benefits paid (61) (55) (2) (3) (7) (8) (70) (66)Member contributions 4 6 – – 2 1 6 7 Experience losses 54 272 16 13 11 20 81 305 Amounts arising from transfers in – – – 1 – – – 1 Foreign exchange – – (6) 10 (3) 19 (9) 29
Balanceatendofyear 1,422 1,327 117 97 170 156 1,709 1,580
The reclassification in 2009 within Germany relates to flight crew early retirement benefits which were previously disclosed in accruals.
The amounts recognised in the consolidated income statement for the years ended 30 September 2010 and 30 September 2009 for each territory are as follows:
UK Germany Other Total 2010 2009 2010 2009 2010 2009 2010 2009 £m £m £m £m £m £m £m £m
Current service cost 26 20 7 3 4 4 37 27 Interest on defined benefit pension scheme obligation 72 69 5 5 7 7 84 81 Expected return on defined benefit pension scheme (60) (58) – – (6) (6) (66) (64)
Total 38 31 12 8 5 5 55 44
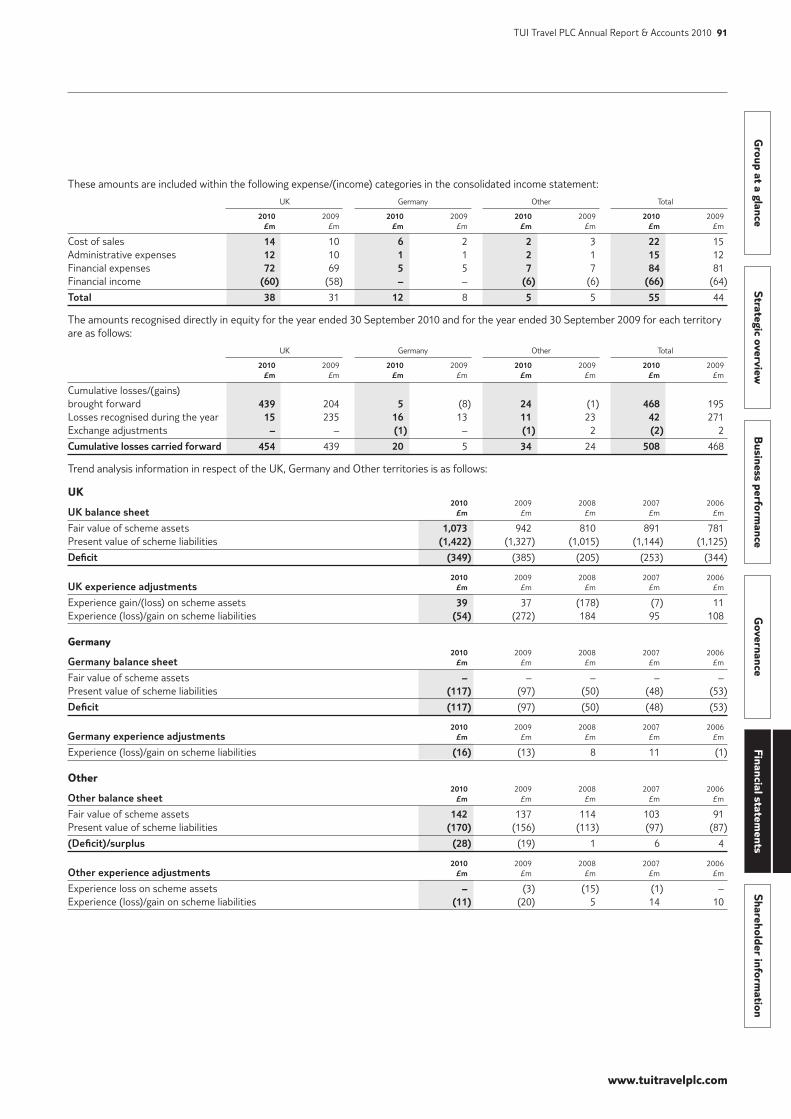
www.tuitravelplc.com
Group at a glance
Strategic overviewB
usiness performance
Governance
Financial statements
Shareholder information
TUI Travel PLC Annual Report & Accounts 2010 91
These amounts are included within the following expense/(income) categories in the consolidated income statement:
UK Germany Other Total 2010 2009 2010 2009 2010 2009 2010 2009 £m £m £m £m £m £m £m £m
Cost of sales 14 10 6 2 2 3 22 15 Administrative expenses 12 10 1 1 2 1 15 12 Financial expenses 72 69 5 5 7 7 84 81 Financial income (60) (58) – – (6) (6) (66) (64)
Total 38 31 12 8 5 5 55 44
The amounts recognised directly in equity for the year ended 30 September 2010 and for the year ended 30 September 2009 for each territory are as follows:
UK Germany Other Total 2010 2009 2010 2009 2010 2009 2010 2009 £m £m £m £m £m £m £m £m
Cumulative losses/(gains) brought forward 439 204 5 (8) 24 (1) 468 195 Losses recognised during the year 15 235 16 13 11 23 42 271 Exchange adjustments – – (1) – (1) 2 (2) 2
Cumulativelossescarriedforward 454 439 20 5 34 24 508 468
Trend analysis information in respect of the UK, Germany and Other territories is as follows:
UK 2010 2009 2008 2007 2006 UKbalancesheet £m £m £m £m £m
Fair value of scheme assets 1,073 942 810 891 781Present value of scheme liabilities (1,422) (1,327) (1,015) (1,144) (1,125)
Deficit (349) (385) (205) (253) (344)
2010 2009 2008 2007 2006 UKexperienceadjustments £m £m £m £m £m
Experience gain/(loss) on scheme assets 39 37 (178) (7) 11 Experience (loss)/gain on scheme liabilities (54) (272) 184 95 108
Germany 2010 2009 2008 2007 2006 Germanybalancesheet £m £m £m £m £m
Fair value of scheme assets – – – – – Present value of scheme liabilities (117) (97) (50) (48) (53)
Deficit (117) (97) (50) (48) (53)
2010 2009 2008 2007 2006 Germanyexperienceadjustments £m £m £m £m £m
Experience (loss)/gain on scheme liabilities (16) (13) 8 11 (1)
Other 2010 2009 2008 2007 2006 Otherbalancesheet £m £m £m £m £m
Fair value of scheme assets 142 137 114 103 91 Present value of scheme liabilities (170) (156) (113) (97) (87)
(Deficit)/surplus (28) (19) 1 6 4
2010 2009 2008 2007 2006 Otherexperienceadjustments £m £m £m £m £m
Experience loss on scheme assets – (3) (15) (1) – Experience (loss)/gain on scheme liabilities (11) (20) 5 14 10
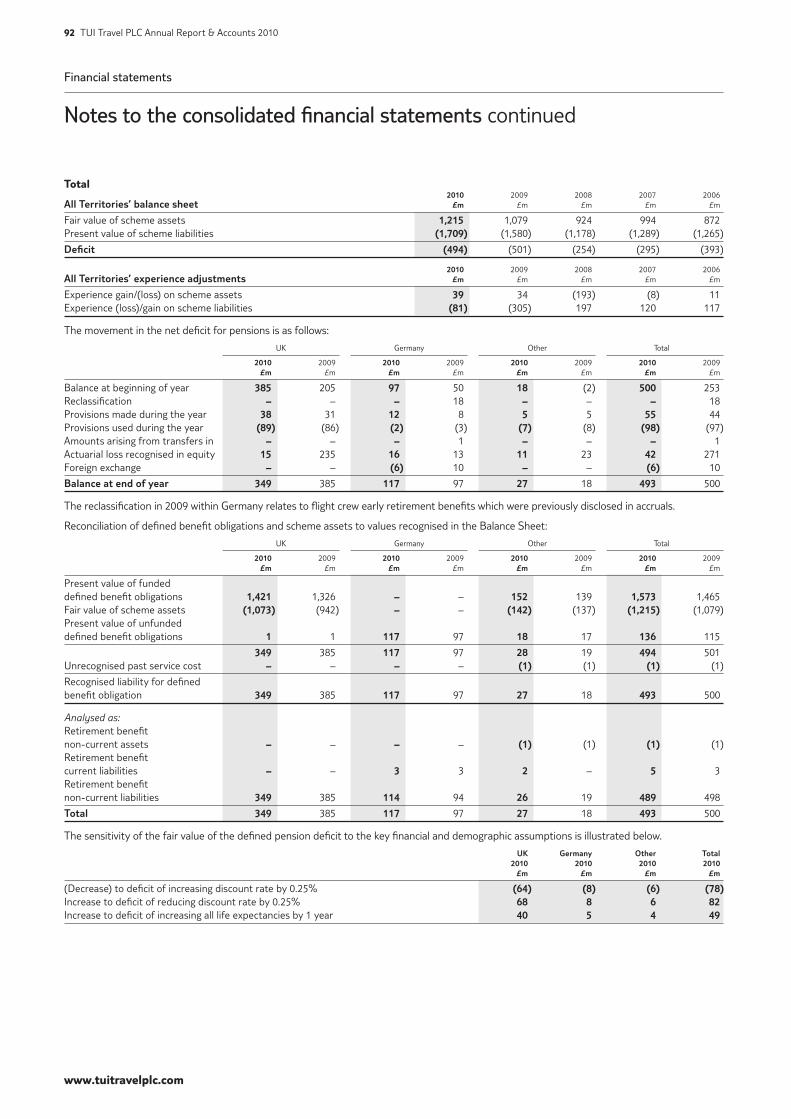
Financial statements
Notes to the consolidated financial statements continued
www.tuitravelplc.com
92 TUI Travel PLC Annual Report & Accounts 2010
Total 2010 2009 2008 2007 2006 AllTerritories’balancesheet £m £m £m £m £m
Fair value of scheme assets 1,215 1,079 924 994 872 Present value of scheme liabilities (1,709) (1,580) (1,178) (1,289) (1,265)
Deficit (494) (501) (254) (295) (393)
2010 2009 2008 2007 2006 AllTerritories’experienceadjustments £m £m £m £m £m
Experience gain/(loss) on scheme assets 39 34 (193) (8) 11 Experience (loss)/gain on scheme liabilities (81) (305) 197 120 117
The movement in the net deficit for pensions is as follows:
UK Germany Other Total 2010 2009 2010 2009 2010 2009 2010 2009 £m £m £m £m £m £m £m £m
Balance at beginning of year 385 205 97 50 18 (2) 500 253 Reclassification – – – 18 – – – 18 Provisions made during the year 38 31 12 8 5 5 55 44 Provisions used during the year (89) (86) (2) (3) (7) (8) (98) (97)Amounts arising from transfers in – – – 1 – – – 1 Actuarial loss recognised in equity 15 235 16 13 11 23 42 271 Foreign exchange – – (6) 10 – – (6) 10
Balanceatendofyear 349 385 117 97 27 18 493 500
The reclassification in 2009 within Germany relates to flight crew early retirement benefits which were previously disclosed in accruals.
Reconciliation of defined benefit obligations and scheme assets to values recognised in the Balance Sheet:
UK Germany Other Total 2010 2009 2010 2009 2010 2009 2010 2009 £m £m £m £m £m £m £m £m
Present value of funded defined benefit obligations 1,421 1,326 – – 152 139 1,573 1,465 Fair value of scheme assets (1,073) (942) – – (142) (137) (1,215) (1,079)Present value of unfunded defined benefit obligations 1 1 117 97 18 17 136 115
349 385 117 97 28 19 494 501 Unrecognised past service cost – – – – (1) (1) (1) (1)
Recognised liability for defined benefit obligation 349 385 117 97 27 18 493 500
Analysed as:Retirement benefit non-current assets – – – – (1) (1) (1) (1)Retirement benefit current liabilities – – 3 3 2 – 5 3 Retirement benefit non-current liabilities 349 385 114 94 26 19 489 498
Total 349 385 117 97 27 18 493 500
The sensitivity of the fair value of the defined pension deficit to the key financial and demographic assumptions is illustrated below.
UK Germany Other Total 2010 2010 2010 2010 £m £m £m £m
(Decrease) to deficit of increasing discount rate by 0.25% (64) (8) (6) (78)Increase to deficit of reducing discount rate by 0.25% 68 8 6 82Increase to deficit of increasing all life expectancies by 1 year 40 5 4 49
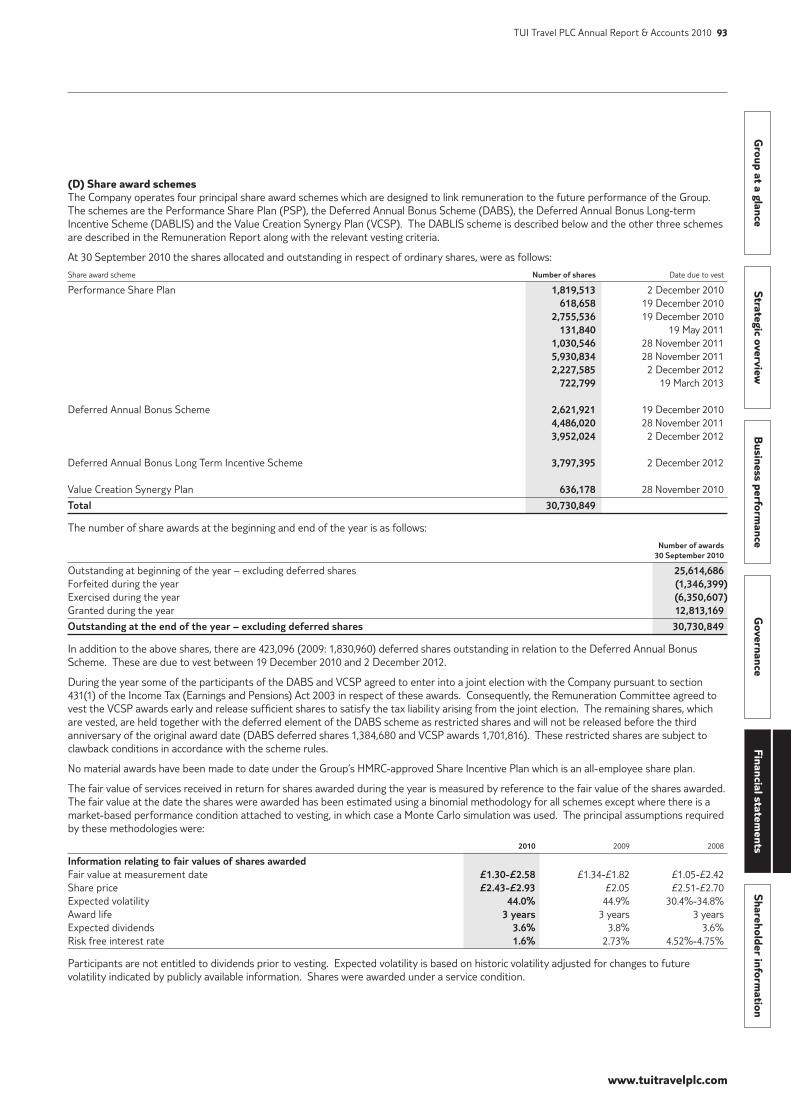
www.tuitravelplc.com
Group at a glance
Strategic overviewB
usiness performance
Governance
Financial statements
Shareholder information
TUI Travel PLC Annual Report & Accounts 2010 93
(D) Share award schemesThe Company operates four principal share award schemes which are designed to link remuneration to the future performance of the Group. The schemes are the Performance Share Plan (PSP), the Deferred Annual Bonus Scheme (DABS), the Deferred Annual Bonus Long-term Incentive Scheme (DABLIS) and the Value Creation Synergy Plan (VCSP). The DABLIS scheme is described below and the other three schemes are described in the Remuneration Report along with the relevant vesting criteria.
At 30 September 2010 the shares allocated and outstanding in respect of ordinary shares, were as follows:
Share award scheme Numberofshares Date due to vest
Performance Share Plan 1,819,513 2 December 2010 618,658 19 December 2010 2,755,536 19 December 2010 131,840 19 May 2011 1,030,546 28 November 2011 5,930,834 28 November 2011 2,227,585 2 December 2012 722,799 19 March 2013
Deferred Annual Bonus Scheme 2,621,921 19 December 2010 4,486,020 28 November 2011 3,952,024 2 December 2012
Deferred Annual Bonus Long Term Incentive Scheme 3,797,395 2 December 2012
Value Creation Synergy Plan 636,178 28 November 2010
Total 30,730,849
The number of share awards at the beginning and end of the year is as follows:
Numberofawards 30September2010
Outstanding at beginning of the year – excluding deferred shares 25,614,686 Forfeited during the year (1,346,399)Exercised during the year (6,350,607)Granted during the year 12,813,169
Outstandingattheendoftheyear–excludingdeferredshares 30,730,849
In addition to the above shares, there are 423,096 (2009: 1,830,960) deferred shares outstanding in relation to the Deferred Annual Bonus Scheme. These are due to vest between 19 December 2010 and 2 December 2012.
During the year some of the participants of the DABS and VCSP agreed to enter into a joint election with the Company pursuant to section 431(1) of the Income Tax (Earnings and Pensions) Act 2003 in respect of these awards. Consequently, the Remuneration Committee agreed to vest the VCSP awards early and release sufficient shares to satisfy the tax liability arising from the joint election. The remaining shares, which are vested, are held together with the deferred element of the DABS scheme as restricted shares and will not be released before the third anniversary of the original award date (DABS deferred shares 1,384,680 and VCSP awards 1,701,816). These restricted shares are subject to clawback conditions in accordance with the scheme rules.
No material awards have been made to date under the Group’s HMRC-approved Share Incentive Plan which is an all-employee share plan.
The fair value of services received in return for shares awarded during the year is measured by reference to the fair value of the shares awarded. The fair value at the date the shares were awarded has been estimated using a binomial methodology for all schemes except where there is a market-based performance condition attached to vesting, in which case a Monte Carlo simulation was used. The principal assumptions required by these methodologies were:
2010 2009 2008
InformationrelatingtofairvaluesofsharesawardedFair value at measurement date £1.30-£2.58 £1.34-£1.82 £1.05-£2.42 Share price £2.43-£2.93 £2.05 £2.51-£2.70 Expected volatility 44.0% 44.9% 30.4%-34.8% Award life 3years 3 years 3 years Expected dividends 3.6% 3.8% 3.6% Risk free interest rate 1.6% 2.73% 4.52%-4.75%
Participants are not entitled to dividends prior to vesting. Expected volatility is based on historic volatility adjusted for changes to future volatility indicated by publicly available information. Shares were awarded under a service condition.
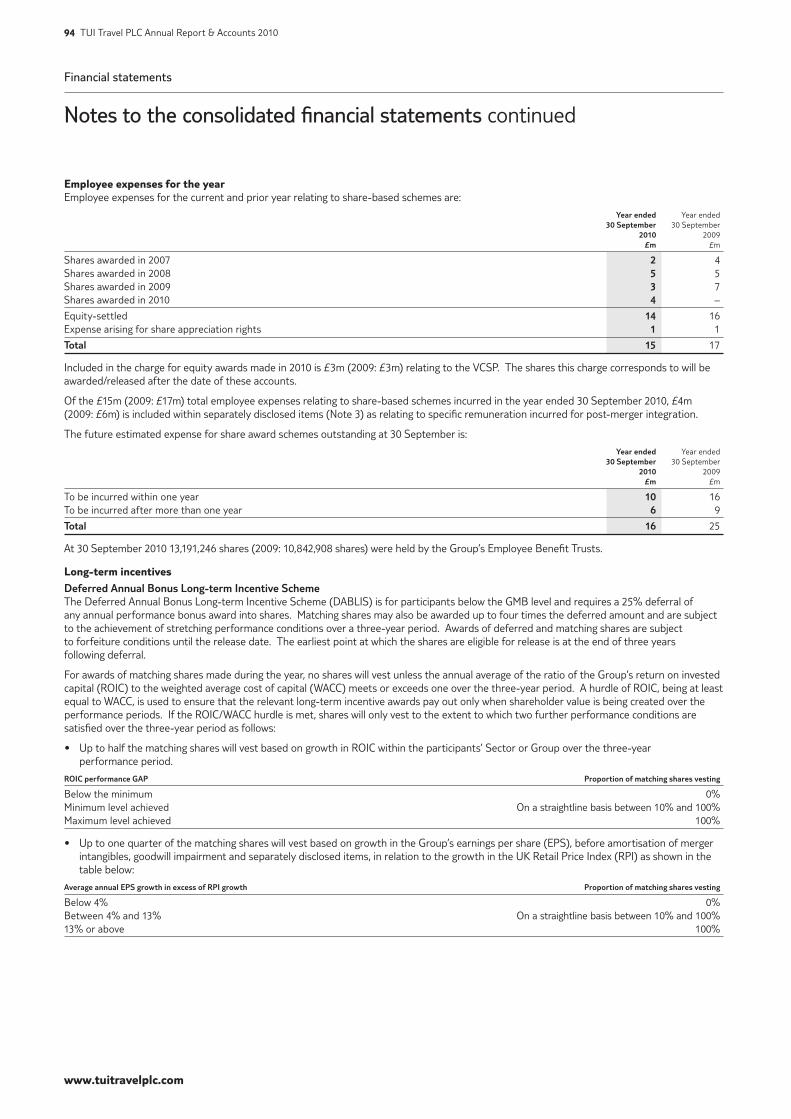
Financial statements
Notes to the consolidated financial statements continued
www.tuitravelplc.com
94 TUI Travel PLC Annual Report & Accounts 2010
Employee expenses for the yearEmployee expenses for the current and prior year relating to share-based schemes are:
Yearended Year ended 30September 30 September 2010 2009 £m £m
Shares awarded in 2007 2 4 Shares awarded in 2008 5 5 Shares awarded in 2009 3 7 Shares awarded in 2010 4 –
Equity-settled 14 16 Expense arising for share appreciation rights 1 1
Total 15 17
Included in the charge for equity awards made in 2010 is £3m (2009: £3m) relating to the VCSP. The shares this charge corresponds to will be awarded/released after the date of these accounts.
Of the £15m (2009: £17m) total employee expenses relating to share-based schemes incurred in the year ended 30 September 2010, £4m (2009: £6m) is included within separately disclosed items (Note 3) as relating to specific remuneration incurred for post-merger integration.
The future estimated expense for share award schemes outstanding at 30 September is:
Yearended Year ended 30September 30 September 2010 2009 £m £m
To be incurred within one year 10 16 To be incurred after more than one year 6 9
Total 16 25
At 30 September 2010 13,191,246 shares (2009: 10,842,908 shares) were held by the Group’s Employee Benefit Trusts.
Long-term incentivesDeferredAnnualBonusLong-termIncentiveSchemeThe Deferred Annual Bonus Long-term Incentive Scheme (DABLIS) is for participants below the GMB level and requires a 25% deferral of any annual performance bonus award into shares. Matching shares may also be awarded up to four times the deferred amount and are subject to the achievement of stretching performance conditions over a three-year period. Awards of deferred and matching shares are subject to forfeiture conditions until the release date. The earliest point at which the shares are eligible for release is at the end of three years following deferral.
For awards of matching shares made during the year, no shares will vest unless the annual average of the ratio of the Group’s return on invested capital (ROIC) to the weighted average cost of capital (WACC) meets or exceeds one over the three-year period. A hurdle of ROIC, being at least equal to WACC, is used to ensure that the relevant long-term incentive awards pay out only when shareholder value is being created over the performance periods. If the ROIC/WACC hurdle is met, shares will only vest to the extent to which two further performance conditions are satisfied over the three-year period as follows:
• Up to half the matching shares will vest based on growth in ROIC within the participants’ Sector or Group over the three-year performance period.
ROICperformanceGAP Proportionofmatchingsharesvesting
Below the minimum 0%Minimum level achieved On a straightline basis between 10% and 100% Maximum level achieved 100%
• Up to one quarter of the matching shares will vest based on growth in the Group’s earnings per share (EPS), before amortisation of merger intangibles, goodwill impairment and separately disclosed items, in relation to the growth in the UK Retail Price Index (RPI) as shown in the table below:
AverageannualEPSgrowthinexcessofRPIgrowth Proportionofmatchingsharesvesting
Below 4% 0%Between 4% and 13% On a straightline basis between 10% and 100% 13% or above 100%
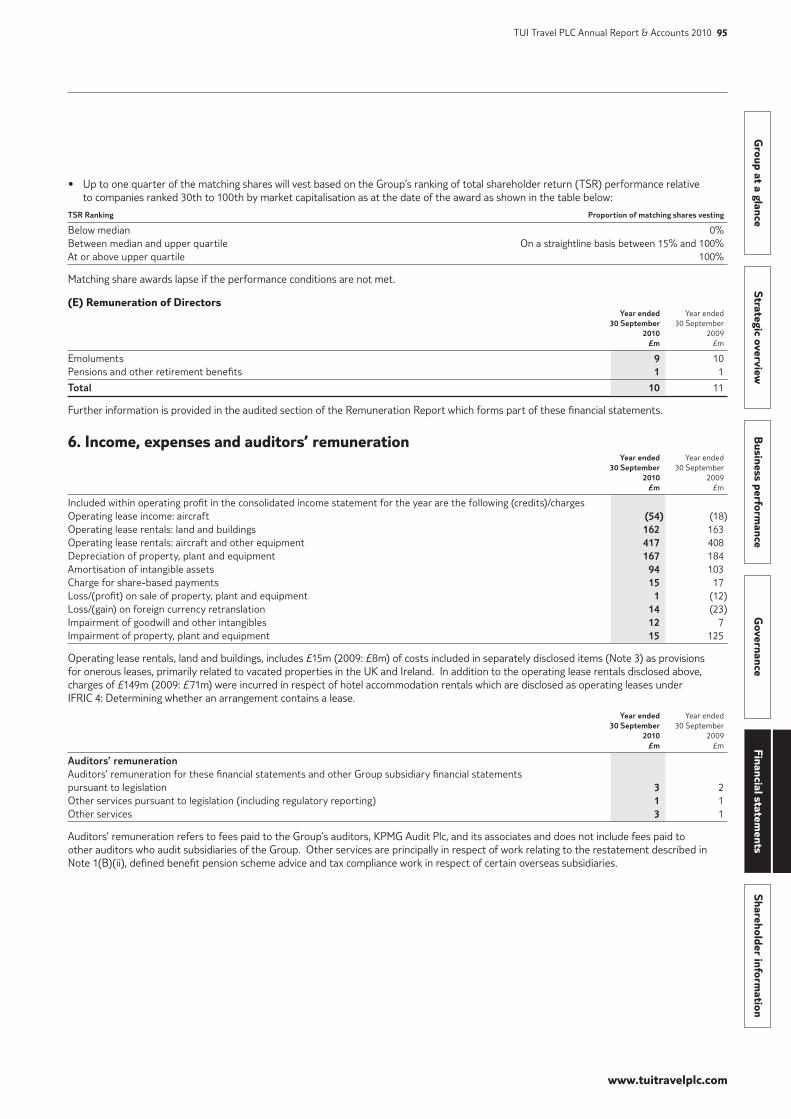
www.tuitravelplc.com
Group at a glance
Strategic overviewB
usiness performance
Governance
Financial statements
Shareholder information
TUI Travel PLC Annual Report & Accounts 2010 95
• Up to one quarter of the matching shares will vest based on the Group’s ranking of total shareholder return (TSR) performance relative to companies ranked 30th to 100th by market capitalisation as at the date of the award as shown in the table below:
TSRRanking Proportionofmatchingsharesvesting
Below median 0%Between median and upper quartile On a straightline basis between 15% and 100% At or above upper quartile 100%
Matching share awards lapse if the performance conditions are not met.
(E) Remuneration of Directors Yearended Year ended 30September 30 September 2010 2009 £m £m
Emoluments 9 10 Pensions and other retirement benefits 1 1
Total 10 11
Further information is provided in the audited section of the Remuneration Report which forms part of these financial statements.
6. Income, expenses and auditors’ remuneration Yearended Year ended 30September 30 September 2010 2009 £m £m
Included within operating profit in the consolidated income statement for the year are the following (credits)/chargesOperating lease income: aircraft (54) (18)Operating lease rentals: land and buildings 162 163 Operating lease rentals: aircraft and other equipment 417 408 Depreciation of property, plant and equipment 167 184 Amortisation of intangible assets 94 103 Charge for share-based payments 15 17 Loss/(profit) on sale of property, plant and equipment 1 (12)Loss/(gain) on foreign currency retranslation 14 (23) Impairment of goodwill and other intangibles 12 7 Impairment of property, plant and equipment 15 125
Operating lease rentals, land and buildings, includes £15m (2009: £8m) of costs included in separately disclosed items (Note 3) as provisions for onerous leases, primarily related to vacated properties in the UK and Ireland. In addition to the operating lease rentals disclosed above, charges of £149m (2009: £71m) were incurred in respect of hotel accommodation rentals which are disclosed as operating leases under IFRIC 4: Determining whether an arrangement contains a lease.
Yearended Year ended 30September 30 September 2010 2009 £m £m
Auditors’remunerationAuditors’ remuneration for these financial statements and other Group subsidiary financial statements pursuant to legislation 3 2 Other services pursuant to legislation (including regulatory reporting) 1 1 Other services 3 1
Auditors’ remuneration refers to fees paid to the Group’s auditors, KPMG Audit Plc, and its associates and does not include fees paid to other auditors who audit subsidiaries of the Group. Other services are principally in respect of work relating to the restatement described in Note 1(B)(ii), defined benefit pension scheme advice and tax compliance work in respect of certain overseas subsidiaries.
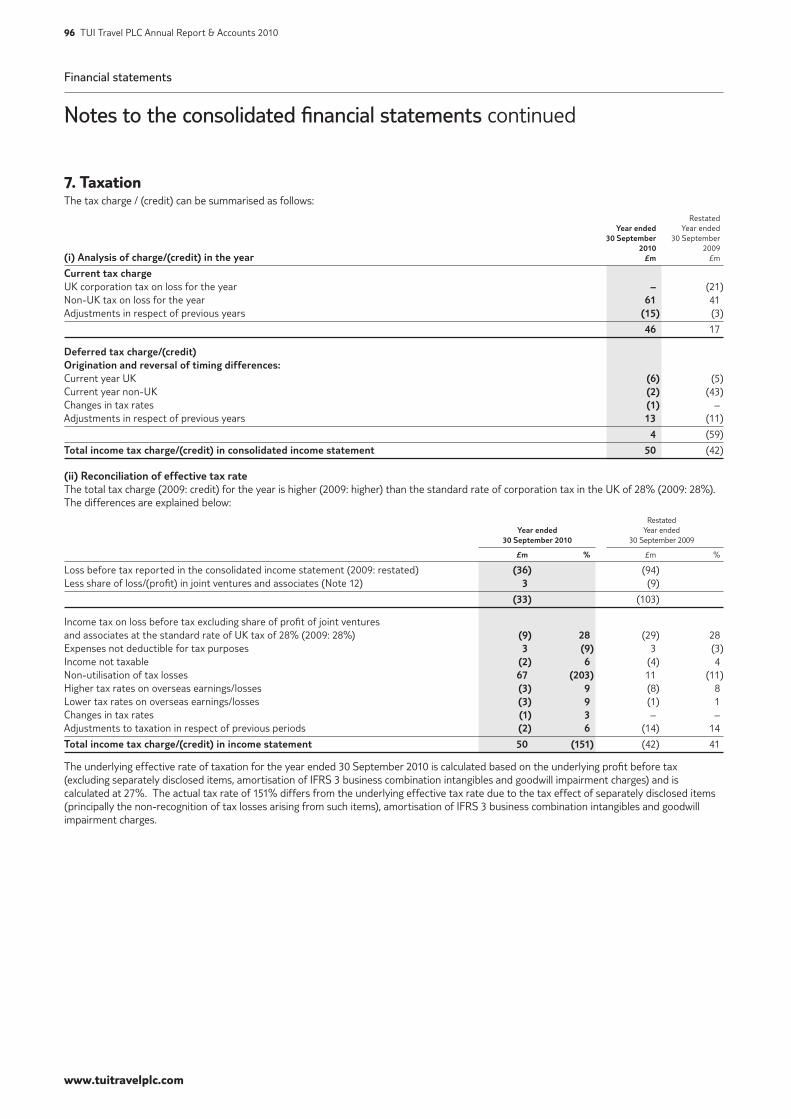
Financial statements
Notes to the consolidated financial statements continued
www.tuitravelplc.com
96 TUI Travel PLC Annual Report & Accounts 2010
7. TaxationThe tax charge / (credit) can be summarised as follows:
Restated Yearended Year ended 30September 30 September 2010 2009 (i)Analysisofcharge/(credit)intheyear £m £m
CurrenttaxchargeUK corporation tax on loss for the year – (21)Non-UK tax on loss for the year 61 41 Adjustments in respect of previous years (15) (3)
46 17
Deferredtaxcharge/(credit)Originationandreversaloftimingdifferences:Current year UK (6) (5)Current year non-UK (2) (43)Changes in tax rates (1) – Adjustments in respect of previous years 13 (11)
4 (59)
Totalincometaxcharge/(credit)inconsolidatedincomestatement 50 (42)
(ii)ReconciliationofeffectivetaxrateThe total tax charge (2009: credit) for the year is higher (2009: higher) than the standard rate of corporation tax in the UK of 28% (2009: 28%). The differences are explained below:
Restated Yearended Year ended 30September2010 30 September 2009 £m % £m %
Loss before tax reported in the consolidated income statement (2009: restated) (36) (94) Less share of loss/(profit) in joint ventures and associates (Note 12) 3 (9)
(33) (103)
Income tax on loss before tax excluding share of profit of joint ventures and associates at the standard rate of UK tax of 28% (2009: 28%) (9) 28 (29) 28 Expenses not deductible for tax purposes 3 (9) 3 (3)Income not taxable (2) 6 (4) 4 Non-utilisation of tax losses 67 (203) 11 (11)Higher tax rates on overseas earnings/losses (3) 9 (8) 8 Lower tax rates on overseas earnings/losses (3) 9 (1) 1 Changes in tax rates (1) 3 – – Adjustments to taxation in respect of previous periods (2) 6 (14) 14
Totalincometaxcharge/(credit)inincomestatement 50 (151) (42) 41
The underlying effective rate of taxation for the year ended 30 September 2010 is calculated based on the underlying profit before tax (excluding separately disclosed items, amortisation of IFRS 3 business combination intangibles and goodwill impairment charges) and is calculated at 27%. The actual tax rate of 151% differs from the underlying effective tax rate due to the tax effect of separately disclosed items (principally the non-recognition of tax losses arising from such items), amortisation of IFRS 3 business combination intangibles and goodwill impairment charges.
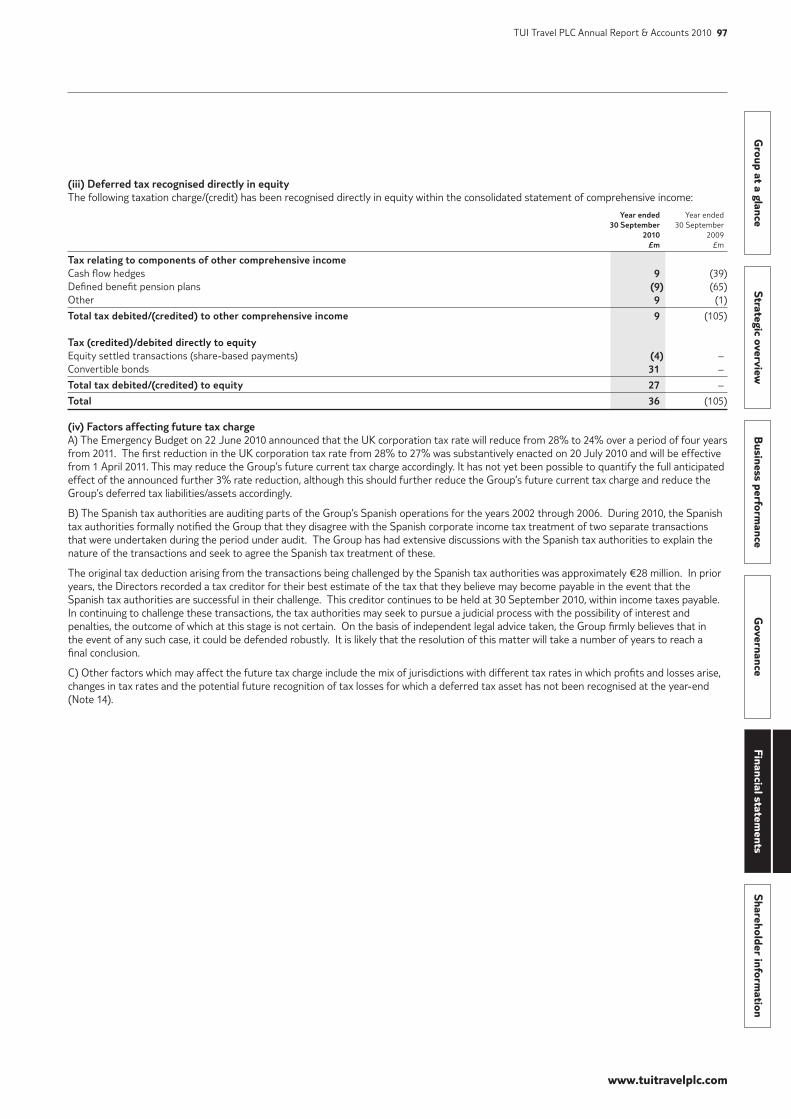
www.tuitravelplc.com
Group at a glance
Strategic overviewB
usiness performance
Governance
Financial statements
Shareholder information
TUI Travel PLC Annual Report & Accounts 2010 97
(iii)DeferredtaxrecogniseddirectlyinequityThe following taxation charge/(credit) has been recognised directly in equity within the consolidated statement of comprehensive income:
Yearended Year ended 30September 30 September 2010 2009 £m £m
TaxrelatingtocomponentsofothercomprehensiveincomeCash flow hedges 9 (39)Defined benefit pension plans (9) (65)Other 9 (1)
Totaltaxdebited/(credited)toothercomprehensiveincome 9 (105)
Tax(credited)/debiteddirectlytoequityEquity settled transactions (share-based payments) (4) – Convertible bonds 31 –
Totaltaxdebited/(credited)toequity 27 –
Total 36 (105)
(iv)FactorsaffectingfuturetaxchargeA) The Emergency Budget on 22 June 2010 announced that the UK corporation tax rate will reduce from 28% to 24% over a period of four years from 2011. The first reduction in the UK corporation tax rate from 28% to 27% was substantively enacted on 20 July 2010 and will be effective from 1 April 2011. This may reduce the Group’s future current tax charge accordingly. It has not yet been possible to quantify the full anticipated effect of the announced further 3% rate reduction, although this should further reduce the Group’s future current tax charge and reduce the Group’s deferred tax liabilities/assets accordingly.
B) The Spanish tax authorities are auditing parts of the Group’s Spanish operations for the years 2002 through 2006. During 2010, the Spanish tax authorities formally notified the Group that they disagree with the Spanish corporate income tax treatment of two separate transactions that were undertaken during the period under audit. The Group has had extensive discussions with the Spanish tax authorities to explain the nature of the transactions and seek to agree the Spanish tax treatment of these.
The original tax deduction arising from the transactions being challenged by the Spanish tax authorities was approximately €28 million. In prior years, the Directors recorded a tax creditor for their best estimate of the tax that they believe may become payable in the event that the Spanish tax authorities are successful in their challenge. This creditor continues to be held at 30 September 2010, within income taxes payable. In continuing to challenge these transactions, the tax authorities may seek to pursue a judicial process with the possibility of interest and penalties, the outcome of which at this stage is not certain. On the basis of independent legal advice taken, the Group firmly believes that in the event of any such case, it could be defended robustly. It is likely that the resolution of this matter will take a number of years to reach a final conclusion.
C) Other factors which may affect the future tax charge include the mix of jurisdictions with different tax rates in which profits and losses arise, changes in tax rates and the potential future recognition of tax losses for which a deferred tax asset has not been recognised at the year-end (Note 14).
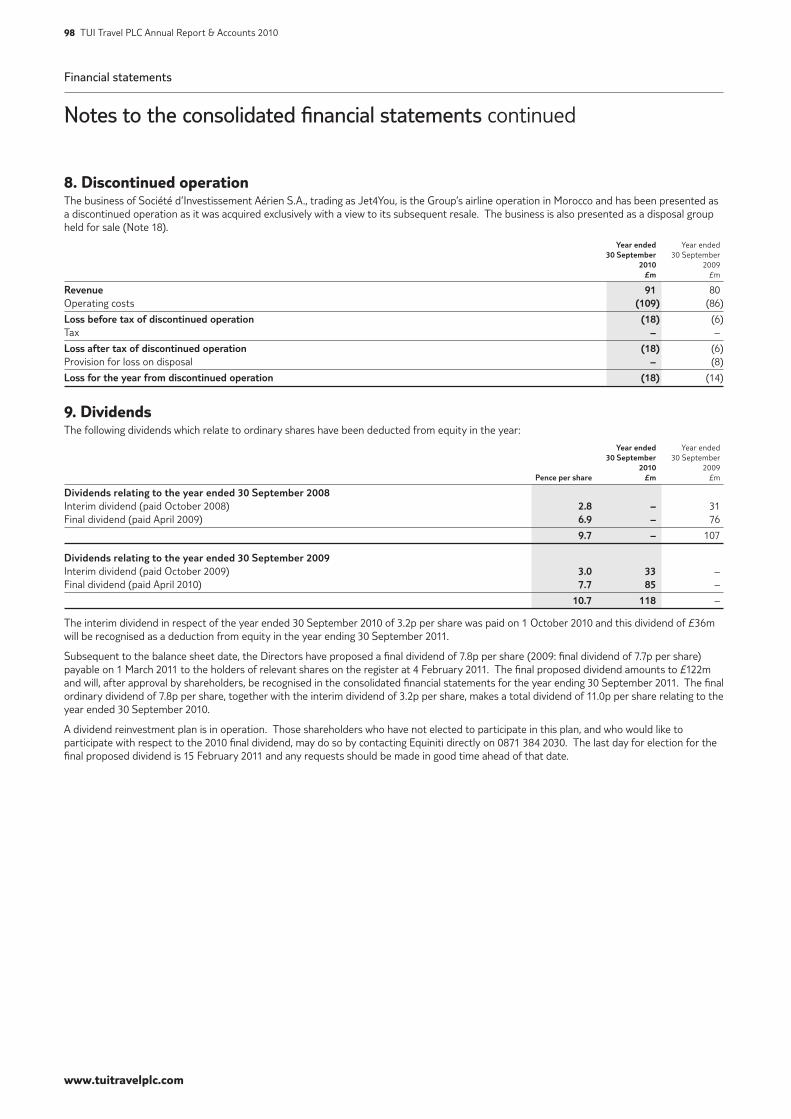
Financial statements
Notes to the consolidated financial statements continued
www.tuitravelplc.com
98 TUI Travel PLC Annual Report & Accounts 2010
8. Discontinued operationThe business of Société d’Investissement Aérien S.A., trading as Jet4You, is the Group’s airline operation in Morocco and has been presented as a discontinued operation as it was acquired exclusively with a view to its subsequent resale. The business is also presented as a disposal group held for sale (Note 18).
Yearended Year ended 30September 30 September 2010 2009 £m £m
Revenue 91 80 Operating costs (109) (86)
Lossbeforetaxofdiscontinuedoperation (18) (6)Tax – –
Lossaftertaxofdiscontinuedoperation (18) (6)Provision for loss on disposal – (8)
Lossfortheyearfromdiscontinuedoperation (18) (14)
9. DividendsThe following dividends which relate to ordinary shares have been deducted from equity in the year:
Yearended Year ended 30September 30 September 2010 2009 Pencepershare £m £m
Dividendsrelatingtotheyearended30September2008Interim dividend (paid October 2008) 2.8 – 31 Final dividend (paid April 2009) 6.9 – 76
9.7 – 107
Dividendsrelatingtotheyearended30September2009Interim dividend (paid October 2009) 3.0 33 – Final dividend (paid April 2010) 7.7 85 –
10.7 118 –
The interim dividend in respect of the year ended 30 September 2010 of 3.2p per share was paid on 1 October 2010 and this dividend of £36m will be recognised as a deduction from equity in the year ending 30 September 2011.
Subsequent to the balance sheet date, the Directors have proposed a final dividend of 7.8p per share (2009: final dividend of 7.7p per share) payable on 1 March 2011 to the holders of relevant shares on the register at 4 February 2011. The final proposed dividend amounts to £122m and will, after approval by shareholders, be recognised in the consolidated financial statements for the year ending 30 September 2011. The final ordinary dividend of 7.8p per share, together with the interim dividend of 3.2p per share, makes a total dividend of 11.0p per share relating to the year ended 30 September 2010.
A dividend reinvestment plan is in operation. Those shareholders who have not elected to participate in this plan, and who would like to participate with respect to the 2010 final dividend, may do so by contacting Equiniti directly on 0871 384 2030. The last day for election for the final proposed dividend is 15 February 2011 and any requests should be made in good time ahead of that date.
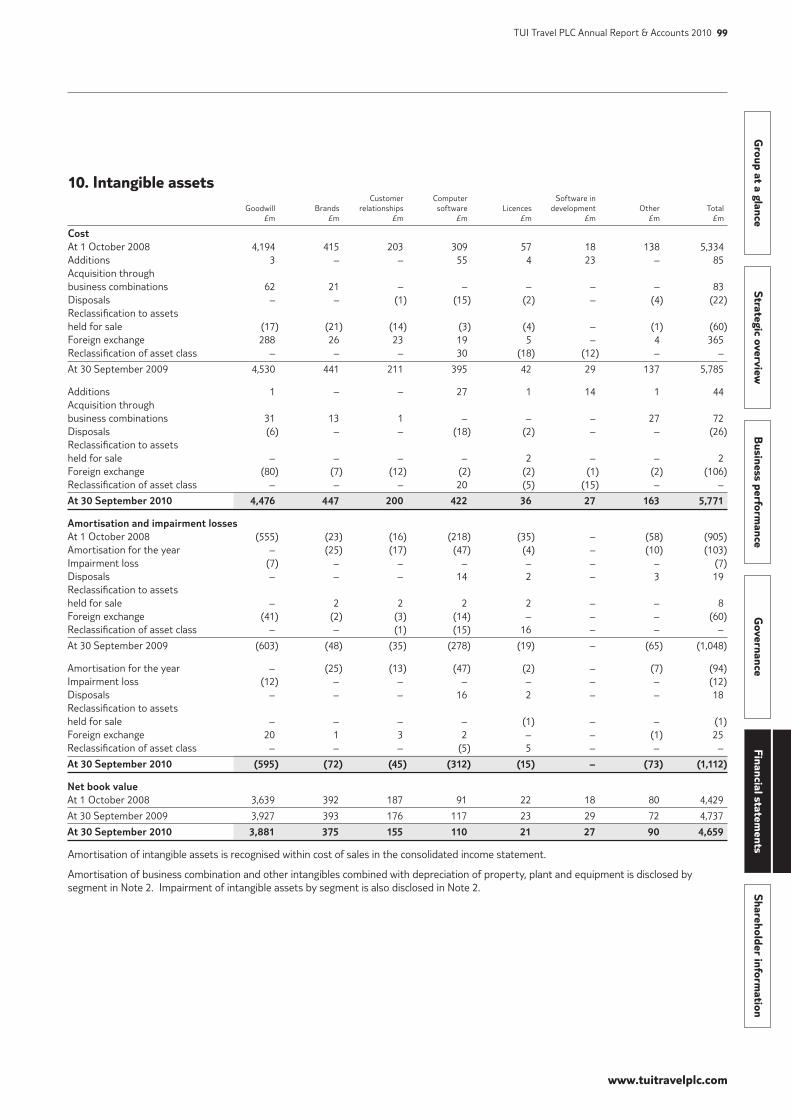
www.tuitravelplc.com
Group at a glance
Strategic overviewB
usiness performance
Governance
Financial statements
Shareholder information
TUI Travel PLC Annual Report & Accounts 2010 99
10. Intangible assets Customer Computer Software in Goodwill Brands relationships software Licences development Other Total £m £m £m £m £m £m £m £m
CostAt 1 October 2008 4,194 415 203 309 57 18 138 5,334 Additions 3 – – 55 4 23 – 85 Acquisition through business combinations 62 21 – – – – – 83 Disposals – – (1) (15) (2) – (4) (22)Reclassification to assets held for sale (17) (21) (14) (3) (4) – (1) (60)Foreign exchange 288 26 23 19 5 – 4 365 Reclassification of asset class – – – 30 (18) (12) – –
At 30 September 2009 4,530 441 211 395 42 29 137 5,785
Additions 1 – – 27 1 14 1 44 Acquisition through business combinations 31 13 1 – – – 27 72 Disposals (6) – – (18) (2) – – (26)Reclassification to assets held for sale – – – – 2 – – 2 Foreign exchange (80) (7) (12) (2) (2) (1) (2) (106)Reclassification of asset class – – – 20 (5) (15) – –
At30September2010 4,476 447 200 422 36 27 163 5,771
AmortisationandimpairmentlossesAt 1 October 2008 (555) (23) (16) (218) (35) – (58) (905)Amortisation for the year – (25) (17) (47) (4) – (10) (103)Impairment loss (7) – – – – – – (7)Disposals – – – 14 2 – 3 19 Reclassification to assets held for sale – 2 2 2 2 – – 8 Foreign exchange (41) (2) (3) (14) – – – (60)Reclassification of asset class – – (1) (15) 16 – – –
At 30 September 2009 (603) (48) (35) (278) (19) – (65) (1,048)
Amortisation for the year – (25) (13) (47) (2) – (7) (94)Impairment loss (12) – – – – – – (12)Disposals – – – 16 2 – – 18 Reclassification to assets held for sale – – – – (1) – – (1)Foreign exchange 20 1 3 2 – – (1) 25 Reclassification of asset class – – – (5) 5 – – –
At30September2010 (595) (72) (45) (312) (15) – (73) (1,112)
Netbookvalue At 1 October 2008 3,639 392 187 91 22 18 80 4,429
At 30 September 2009 3,927 393 176 117 23 29 72 4,737
At30September2010 3,881 375 155 110 21 27 90 4,659
Amortisation of intangible assets is recognised within cost of sales in the consolidated income statement.
Amortisation of business combination and other intangibles combined with depreciation of property, plant and equipment is disclosed by segment in Note 2. Impairment of intangible assets by segment is also disclosed in Note 2.
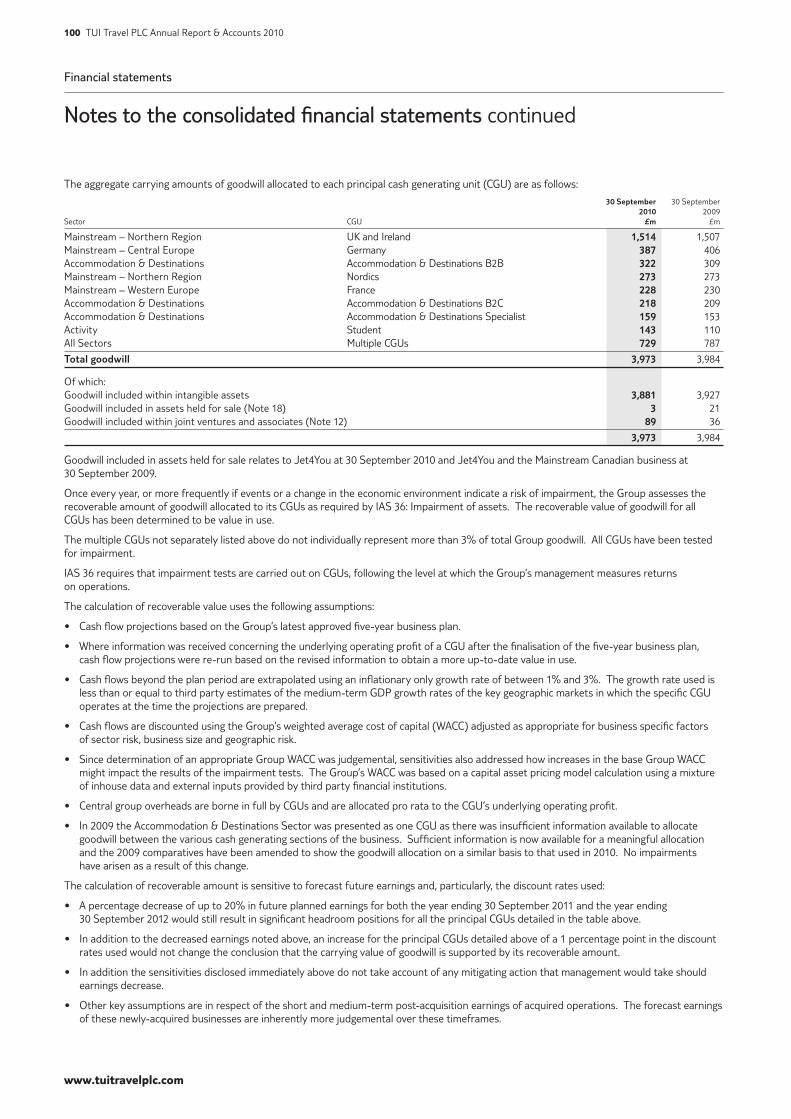
Financial statements
Notes to the consolidated financial statements continued
www.tuitravelplc.com
100 TUI Travel PLC Annual Report & Accounts 2010
The aggregate carrying amounts of goodwill allocated to each principal cash generating unit (CGU) are as follows:
30September 30 September 2010 2009 Sector CGU £m £m
Mainstream – Northern Region UK and Ireland 1,514 1,507 Mainstream – Central Europe Germany 387 406 Accommodation & Destinations Accommodation & Destinations B2B 322 309 Mainstream – Northern Region Nordics 273 273 Mainstream – Western Europe France 228 230 Accommodation & Destinations Accommodation & Destinations B2C 218 209 Accommodation & Destinations Accommodation & Destinations Specialist 159 153 Activity Student 143 110 All Sectors Multiple CGUs 729 787
Totalgoodwill 3,973 3,984
Of which: Goodwill included within intangible assets 3,881 3,927 Goodwill included in assets held for sale (Note 18) 3 21 Goodwill included within joint ventures and associates (Note 12) 89 36
3,973 3,984
Goodwill included in assets held for sale relates to Jet4You at 30 September 2010 and Jet4You and the Mainstream Canadian business at 30 September 2009.
Once every year, or more frequently if events or a change in the economic environment indicate a risk of impairment, the Group assesses the recoverable amount of goodwill allocated to its CGUs as required by IAS 36: Impairment of assets. The recoverable value of goodwill for all CGUs has been determined to be value in use.
The multiple CGUs not separately listed above do not individually represent more than 3% of total Group goodwill. All CGUs have been tested for impairment.
IAS 36 requires that impairment tests are carried out on CGUs, following the level at which the Group’s management measures returns on operations.
The calculation of recoverable value uses the following assumptions:
• Cash flow projections based on the Group’s latest approved five-year business plan.
• Where information was received concerning the underlying operating profit of a CGU after the finalisation of the five-year business plan, cash flow projections were re-run based on the revised information to obtain a more up-to-date value in use.
• Cash flows beyond the plan period are extrapolated using an inflationary only growth rate of between 1% and 3%. The growth rate used is less than or equal to third party estimates of the medium-term GDP growth rates of the key geographic markets in which the specific CGU operates at the time the projections are prepared.
• Cash flows are discounted using the Group’s weighted average cost of capital (WACC) adjusted as appropriate for business specific factors of sector risk, business size and geographic risk.
• Since determination of an appropriate Group WACC was judgemental, sensitivities also addressed how increases in the base Group WACC might impact the results of the impairment tests. The Group’s WACC was based on a capital asset pricing model calculation using a mixture of inhouse data and external inputs provided by third party financial institutions.
• Central group overheads are borne in full by CGUs and are allocated pro rata to the CGU’s underlying operating profit.
• In 2009 the Accommodation & Destinations Sector was presented as one CGU as there was insufficient information available to allocate goodwill between the various cash generating sections of the business. Sufficient information is now available for a meaningful allocation and the 2009 comparatives have been amended to show the goodwill allocation on a similar basis to that used in 2010. No impairments have arisen as a result of this change.
The calculation of recoverable amount is sensitive to forecast future earnings and, particularly, the discount rates used:
• A percentage decrease of up to 20% in future planned earnings for both the year ending 30 September 2011 and the year ending 30 September 2012 would still result in significant headroom positions for all the principal CGUs detailed in the table above.
• In addition to the decreased earnings noted above, an increase for the principal CGUs detailed above of a 1 percentage point in the discount rates used would not change the conclusion that the carrying value of goodwill is supported by its recoverable amount.
• In addition the sensitivities disclosed immediately above do not take account of any mitigating action that management would take should earnings decrease.
• Other key assumptions are in respect of the short and medium-term post-acquisition earnings of acquired operations. The forecast earnings of these newly-acquired businesses are inherently more judgemental over these timeframes.
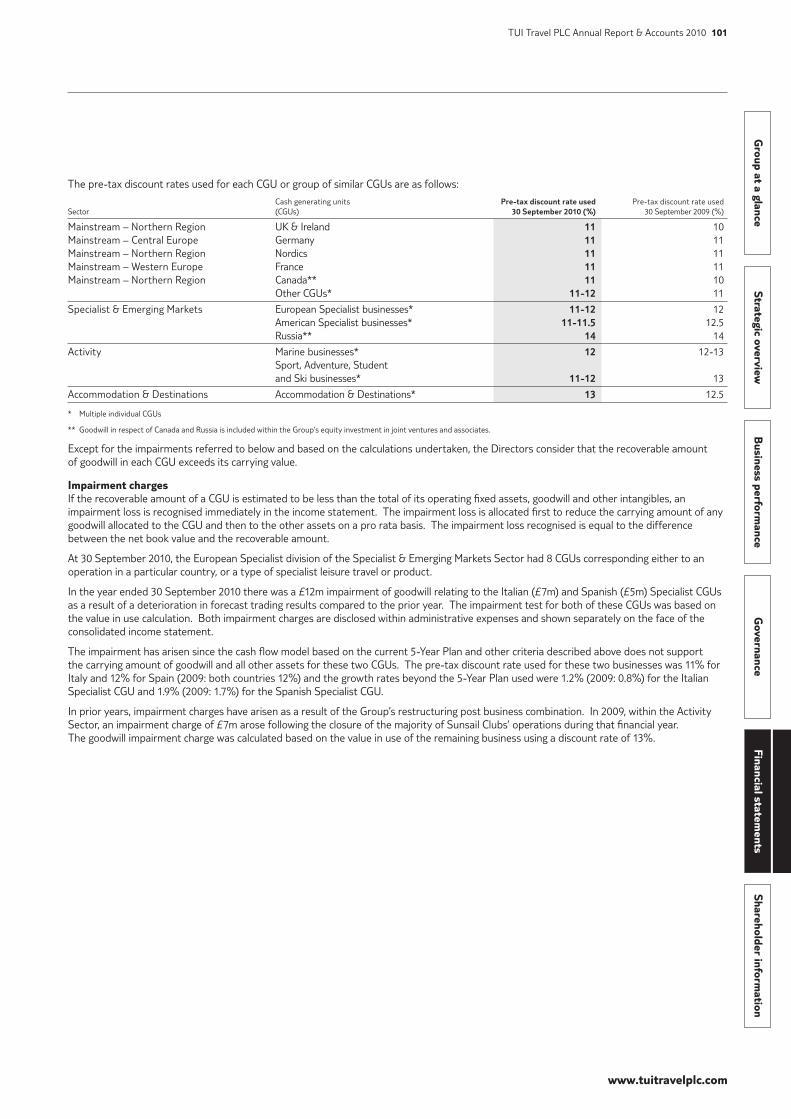
www.tuitravelplc.com
Group at a glance
Strategic overviewB
usiness performance
Governance
Financial statements
Shareholder information
TUI Travel PLC Annual Report & Accounts 2010 101
The pre-tax discount rates used for each CGU or group of similar CGUs are as follows:
Cash generating units Pre-taxdiscountrateused Pre-tax discount rate usedSector (CGUs) 30September2010(%) 30 September 2009 (%)
Mainstream – Northern Region UK & Ireland 11 10Mainstream – Central Europe Germany 11 11Mainstream – Northern Region Nordics 11 11Mainstream – Western Europe France 11 11Mainstream – Northern Region Canada** 11 10 Other CGUs* 11-12 11
Specialist & Emerging Markets European Specialist businesses* 11-12 12 American Specialist businesses* 11-11.5 12.5 Russia** 14 14
Activity Marine businesses* 12 12-13 Sport, Adventure, Student and Ski businesses* 11-12 13
Accommodation & Destinations Accommodation & Destinations* 13 12.5
* Multiple individual CGUs
** Goodwill in respect of Canada and Russia is included within the Group’s equity investment in joint ventures and associates.
Except for the impairments referred to below and based on the calculations undertaken, the Directors consider that the recoverable amount of goodwill in each CGU exceeds its carrying value.
Impairment chargesIf the recoverable amount of a CGU is estimated to be less than the total of its operating fixed assets, goodwill and other intangibles, an impairment loss is recognised immediately in the income statement. The impairment loss is allocated first to reduce the carrying amount of any goodwill allocated to the CGU and then to the other assets on a pro rata basis. The impairment loss recognised is equal to the difference between the net book value and the recoverable amount.
At 30 September 2010, the European Specialist division of the Specialist & Emerging Markets Sector had 8 CGUs corresponding either to an operation in a particular country, or a type of specialist leisure travel or product.
In the year ended 30 September 2010 there was a £12m impairment of goodwill relating to the Italian (£7m) and Spanish (£5m) Specialist CGUs as a result of a deterioration in forecast trading results compared to the prior year. The impairment test for both of these CGUs was based on the value in use calculation. Both impairment charges are disclosed within administrative expenses and shown separately on the face of the consolidated income statement.
The impairment has arisen since the cash flow model based on the current 5-Year Plan and other criteria described above does not support the carrying amount of goodwill and all other assets for these two CGUs. The pre-tax discount rate used for these two businesses was 11% for Italy and 12% for Spain (2009: both countries 12%) and the growth rates beyond the 5-Year Plan used were 1.2% (2009: 0.8%) for the Italian Specialist CGU and 1.9% (2009: 1.7%) for the Spanish Specialist CGU.
In prior years, impairment charges have arisen as a result of the Group’s restructuring post business combination. In 2009, within the Activity Sector, an impairment charge of £7m arose following the closure of the majority of Sunsail Clubs’ operations during that financial year. The goodwill impairment charge was calculated based on the value in use of the remaining business using a discount rate of 13%.
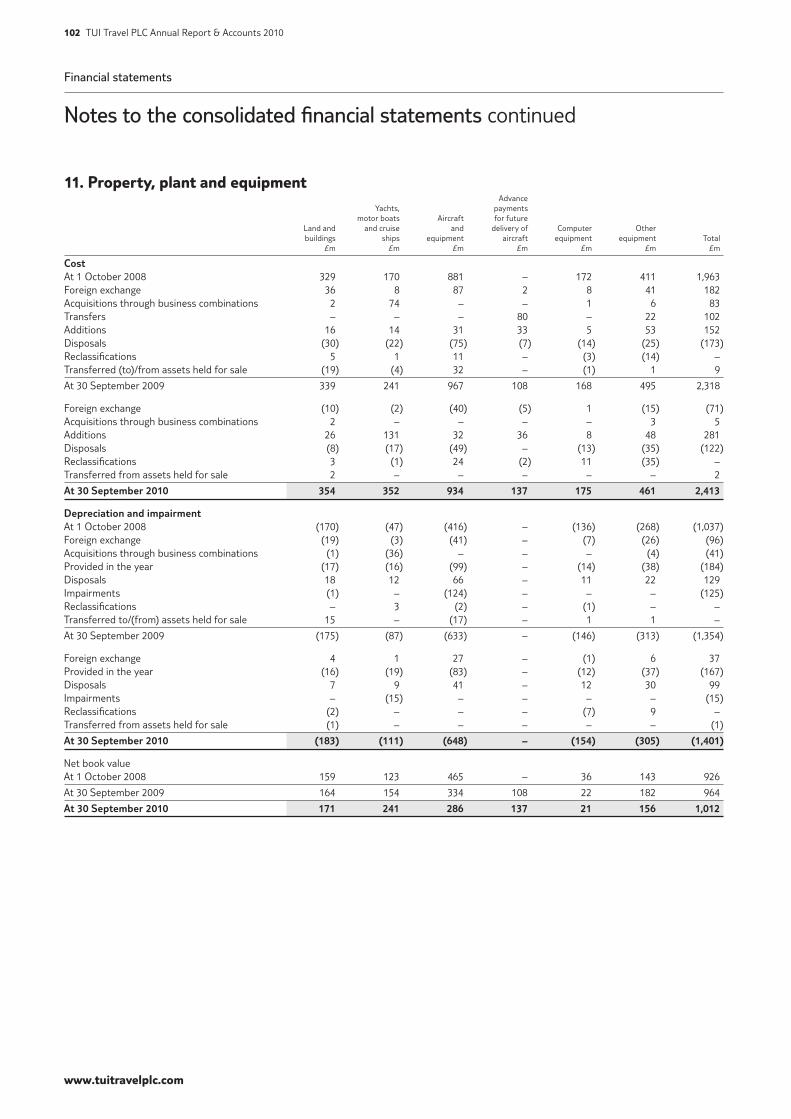
Financial statements
Notes to the consolidated financial statements continued
www.tuitravelplc.com
102 TUI Travel PLC Annual Report & Accounts 2010
11. Property, plant and equipment Advance Yachts, payments motor boats Aircraft for future Land and and cruise and delivery of Computer Other buildings ships equipment aircraft equipment equipment Total £m £m £m £m £m £m £m
CostAt 1 October 2008 329 170 881 – 172 411 1,963 Foreign exchange 36 8 87 2 8 41 182 Acquisitions through business combinations 2 74 – – 1 6 83 Transfers – – – 80 – 22 102 Additions 16 14 31 33 5 53 152 Disposals (30) (22) (75) (7) (14) (25) (173)Reclassifications 5 1 11 – (3) (14) – Transferred (to)/from assets held for sale (19) (4) 32 – (1) 1 9
At 30 September 2009 339 241 967 108 168 495 2,318
Foreign exchange (10) (2) (40) (5) 1 (15) (71)Acquisitions through business combinations 2 – – – – 3 5 Additions 26 131 32 36 8 48 281 Disposals (8) (17) (49) – (13) (35) (122)Reclassifications 3 (1) 24 (2) 11 (35) – Transferred from assets held for sale 2 – – – – – 2
At30September2010 354 352 934 137 175 461 2,413
Depreciationandimpairment At 1 October 2008 (170) (47) (416) – (136) (268) (1,037)Foreign exchange (19) (3) (41) – (7) (26) (96)Acquisitions through business combinations (1) (36) – – – (4) (41)Provided in the year (17) (16) (99) – (14) (38) (184)Disposals 18 12 66 – 11 22 129 Impairments (1) – (124) – – – (125)Reclassifications – 3 (2) – (1) – – Transferred to/(from) assets held for sale 15 – (17) – 1 1 –
At 30 September 2009 (175) (87) (633) – (146) (313) (1,354)
Foreign exchange 4 1 27 – (1) 6 37 Provided in the year (16) (19) (83) – (12) (37) (167)Disposals 7 9 41 – 12 30 99 Impairments – (15) – – – – (15)Reclassifications (2) – – – (7) 9 – Transferred from assets held for sale (1) – – – – – (1)
At30September2010 (183) (111) (648) – (154) (305) (1,401)
Net book valueAt 1 October 2008 159 123 465 – 36 143 926
At 30 September 2009 164 154 334 108 22 182 964
At30September2010 171 241 286 137 21 156 1,012
www.tuitravelplc.com
Group at a glance
Strategic overviewB
usiness performance
Governance
Financial statements
Shareholder information
TUI Travel PLC Annual Report & Accounts 2010 103
Impairment chargesThe impairment charge in the year ended 30 September 2010 for £15m relates to one owned ship within the UK operating segment, the ‘Island Escape’.
An expanded class survey on the condition of the ship conducted in 2010 revealed that the ship will require a more extensive dry dock than originally expected as steelwork corrosion and other conditions of class will need to be rectified before certification is renewed. As a result of increased rectification costs, the Directors have reconsidered the strategy for this ship and now consider that the recoverable amount will be based upon net disposal proceeds. The recoverable amount of the asset, using fair value less costs to sell basis of valuation, is derived from obtaining an independent market valuation from an external international shipping consultancy, using open market value. The carrying value has been impaired to the extent that it is below recoverable value.
The 2009 charge was for Aircraft, £124m (within the French airline operating segment) and Land and buildings, £1m, (Activity Sector operating segment). The impairment charges are disclosed within cost of sales and as a separately disclosed item (Note 3).
Advance payments for future delivery of aircraftInterest of £5m (2009: £2m) has been capitalised during the year in relation to the advance payments for future delivery of aircraft at a rate of 5.4% (2009: 6.0%). Advance payments for future delivery of aircraft were disclosed as prepayments in the year ended 30 September 2008 but were transferred to property, plant and equipment in the prior year. There were £80m of advance payments for future delivery of aircraft at 30 September 2008, £73m within non-current prepayments and £7m within current prepayments. The changes were undertaken to align the Group’s presentation with its parent company.
Other equipment – advance payments for maintenance of owned aircraftAdvance payments for maintenance of owned aircraft were disclosed as prepayments at 30 September 2008 but were transferred to property plant and equipment under construction within other equipment in the prior year. There were £22m of advance payments for aircraft maintenance at 30 September 2008, all within non-current prepayments.
Other disclosuresOther property, plant and equipment with a combined net book value as at 30 September 2010 of £156m (2009: £182m) includes £103m (2009: £103m) of fixtures and fittings, £24m (2009: £47m) of property, plant, and equipment under construction and £28m (2009: £30m) of motor vehicles.
Land and buildings comprise freehold and long leasehold properties with net book values of £118m (2009: £108m) and short leasehold properties with a net book value of £53m (2009: £56m) respectively.
The net book value of assets held under finance leases and hire purchase contracts at 30 September 2010 was £201m (2009: £152m). This includes £109m (2009: £3m) of ships, yachts and motorboats, £79m (2009: £144m) of aircraft, £7m (2009: £nil) of land and buildings and £6m (2009: £5m) of other assets, mainly vehicles.
The net book value of property, plant and equipment with restrictions on title, being pledged as security for bank loans, amounted to £27m (2009: £29m).
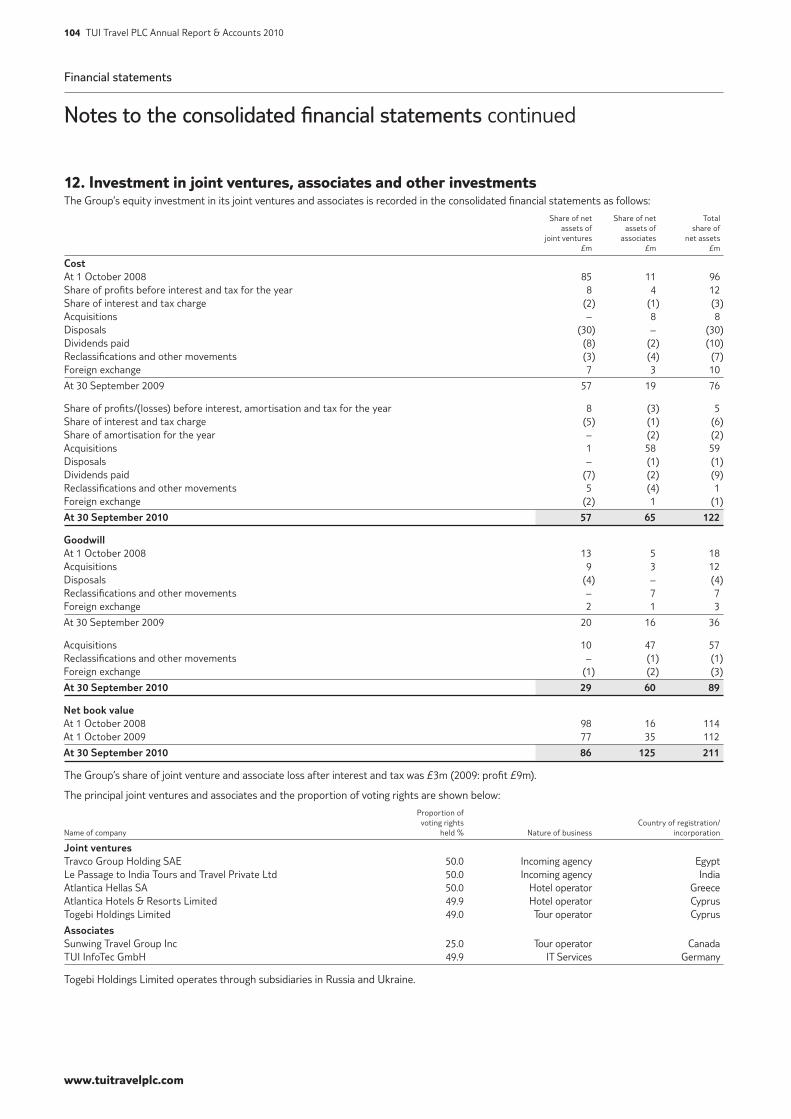
Financial statements
Notes to the consolidated financial statements continued
www.tuitravelplc.com
104 TUI Travel PLC Annual Report & Accounts 2010
12. Investment in joint ventures, associates and other investmentsThe Group’s equity investment in its joint ventures and associates is recorded in the consolidated financial statements as follows:
Share of net Share of net Total assets of assets of share of joint ventures associates net assets £m £m £m
CostAt 1 October 2008 85 11 96 Share of profits before interest and tax for the year 8 4 12 Share of interest and tax charge (2) (1) (3)Acquisitions – 8 8 Disposals (30) – (30)Dividends paid (8) (2) (10)Reclassifications and other movements (3) (4) (7)Foreign exchange 7 3 10
At 30 September 2009 57 19 76
Share of profits/(losses) before interest, amortisation and tax for the year 8 (3) 5 Share of interest and tax charge (5) (1) (6)Share of amortisation for the year – (2) (2)Acquisitions 1 58 59 Disposals – (1) (1)Dividends paid (7) (2) (9)Reclassifications and other movements 5 (4) 1 Foreign exchange (2) 1 (1)
At30September2010 57 65 122
GoodwillAt 1 October 2008 13 5 18 Acquisitions 9 3 12 Disposals (4) – (4)Reclassifications and other movements – 7 7 Foreign exchange 2 1 3
At 30 September 2009 20 16 36
Acquisitions 10 47 57 Reclassifications and other movements – (1) (1)Foreign exchange (1) (2) (3)
At30September2010 29 60 89
NetbookvalueAt 1 October 2008 98 16 114 At 1 October 2009 77 35 112
At30September2010 86 125 211
The Group’s share of joint venture and associate loss after interest and tax was £3m (2009: profit £9m).
The principal joint ventures and associates and the proportion of voting rights are shown below:
Proportion of voting rights Country of registration/Name of company held % Nature of business incorporation
JointventuresTravco Group Holding SAE 50.0 Incoming agency Egypt Le Passage to India Tours and Travel Private Ltd 50.0 Incoming agency India Atlantica Hellas SA 50.0 Hotel operator Greece Atlantica Hotels & Resorts Limited 49.9 Hotel operator Cyprus Togebi Holdings Limited 49.0 Tour operator Cyprus
AssociatesSunwing Travel Group Inc 25.0 Tour operator Canada TUI InfoTec GmbH 49.9 IT Services Germany
Togebi Holdings Limited operates through subsidiaries in Russia and Ukraine.
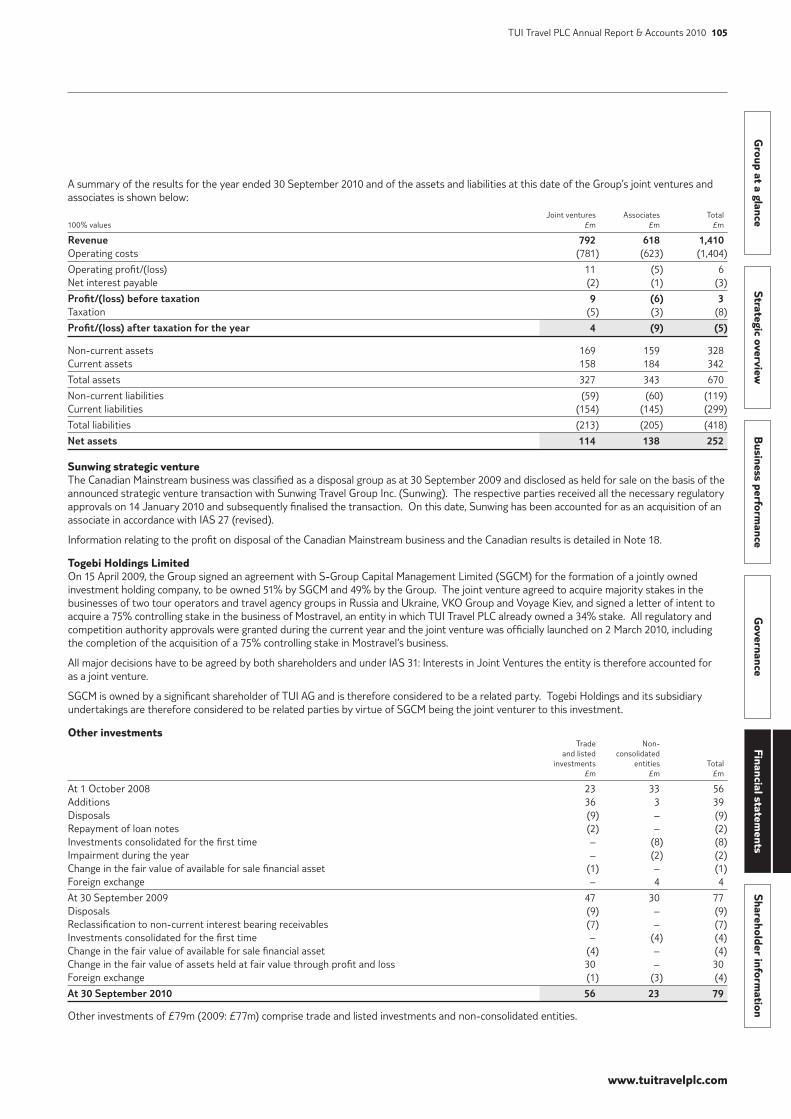
www.tuitravelplc.com
Group at a glance
Strategic overviewB
usiness performance
Governance
Financial statements
Shareholder information
TUI Travel PLC Annual Report & Accounts 2010 105
A summary of the results for the year ended 30 September 2010 and of the assets and liabilities at this date of the Group’s joint ventures and associates is shown below:
Joint ventures Associates Total 100% values £m £m £m
Revenue 792 618 1,410 Operating costs (781) (623) (1,404)
Operating profit/(loss) 11 (5) 6 Net interest payable (2) (1) (3)
Profit/(loss)beforetaxation 9 (6) 3 Taxation (5) (3) (8)
Profit/(loss)aftertaxationfortheyear 4 (9) (5)
Non-current assets 169 159 328 Current assets 158 184 342
Total assets 327 343 670
Non-current liabilities (59) (60) (119)Current liabilities (154) (145) (299)
Total liabilities (213) (205) (418)
Netassets 114 138 252
Sunwing strategic ventureThe Canadian Mainstream business was classified as a disposal group as at 30 September 2009 and disclosed as held for sale on the basis of the announced strategic venture transaction with Sunwing Travel Group Inc. (Sunwing). The respective parties received all the necessary regulatory approvals on 14 January 2010 and subsequently finalised the transaction. On this date, Sunwing has been accounted for as an acquisition of an associate in accordance with IAS 27 (revised).
Information relating to the profit on disposal of the Canadian Mainstream business and the Canadian results is detailed in Note 18.
Togebi Holdings LimitedOn 15 April 2009, the Group signed an agreement with S-Group Capital Management Limited (SGCM) for the formation of a jointly owned investment holding company, to be owned 51% by SGCM and 49% by the Group. The joint venture agreed to acquire majority stakes in the businesses of two tour operators and travel agency groups in Russia and Ukraine, VKO Group and Voyage Kiev, and signed a letter of intent to acquire a 75% controlling stake in the business of Mostravel, an entity in which TUI Travel PLC already owned a 34% stake. All regulatory and competition authority approvals were granted during the current year and the joint venture was officially launched on 2 March 2010, including the completion of the acquisition of a 75% controlling stake in Mostravel’s business.
All major decisions have to be agreed by both shareholders and under IAS 31: Interests in Joint Ventures the entity is therefore accounted for as a joint venture.
SGCM is owned by a significant shareholder of TUI AG and is therefore considered to be a related party. Togebi Holdings and its subsidiary undertakings are therefore considered to be related parties by virtue of SGCM being the joint venturer to this investment.
Other investments Trade Non- and listed consolidated investments entities Total £m £m £m
At 1 October 2008 23 33 56 Additions 36 3 39 Disposals (9) – (9)Repayment of loan notes (2) – (2)Investments consolidated for the first time – (8) (8)Impairment during the year – (2) (2)Change in the fair value of available for sale financial asset (1) – (1)Foreign exchange – 4 4
At 30 September 2009 47 30 77 Disposals (9) – (9)Reclassification to non-current interest bearing receivables (7) – (7)Investments consolidated for the first time – (4) (4)Change in the fair value of available for sale financial asset (4) – (4)Change in the fair value of assets held at fair value through profit and loss 30 – 30 Foreign exchange (1) (3) (4)
At30September2010 56 23 79
Other investments of £79m (2009: £77m) comprise trade and listed investments and non-consolidated entities.
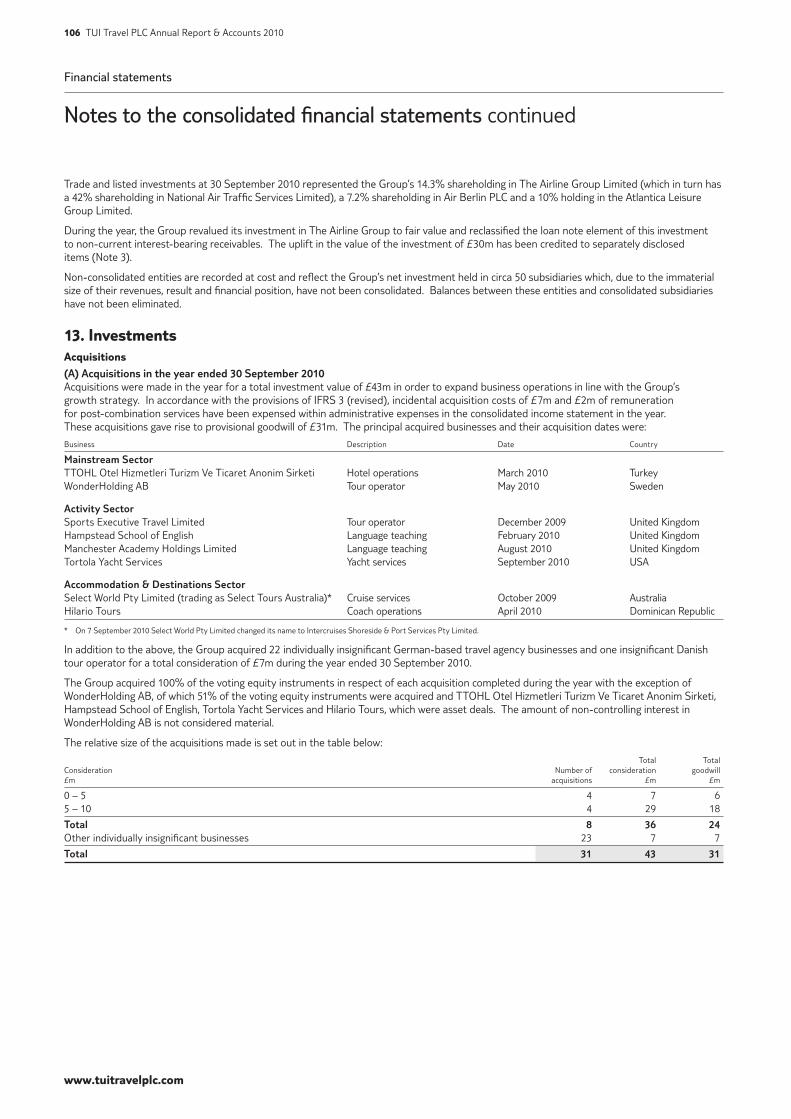
Financial statements
Notes to the consolidated financial statements continued
www.tuitravelplc.com
106 TUI Travel PLC Annual Report & Accounts 2010
Trade and listed investments at 30 September 2010 represented the Group’s 14.3% shareholding in The Airline Group Limited (which in turn has a 42% shareholding in National Air Traffic Services Limited), a 7.2% shareholding in Air Berlin PLC and a 10% holding in the Atlantica Leisure Group Limited.
During the year, the Group revalued its investment in The Airline Group to fair value and reclassified the loan note element of this investment to non-current interest-bearing receivables. The uplift in the value of the investment of £30m has been credited to separately disclosed items (Note 3).
Non-consolidated entities are recorded at cost and reflect the Group’s net investment held in circa 50 subsidiaries which, due to the immaterial size of their revenues, result and financial position, have not been consolidated. Balances between these entities and consolidated subsidiaries have not been eliminated.
13. InvestmentsAcquisitions(A)Acquisitionsintheyearended30September2010Acquisitions were made in the year for a total investment value of £43m in order to expand business operations in line with the Group’s growth strategy. In accordance with the provisions of IFRS 3 (revised), incidental acquisition costs of £7m and £2m of remuneration for post-combination services have been expensed within administrative expenses in the consolidated income statement in the year. These acquisitions gave rise to provisional goodwill of £31m. The principal acquired businesses and their acquisition dates were:
Business Description Date Country
MainstreamSectorTTOHL Otel Hizmetleri Turizm Ve Ticaret Anonim Sirketi Hotel operations March 2010 TurkeyWonderHolding AB Tour operator May 2010 Sweden
ActivitySectorSports Executive Travel Limited Tour operator December 2009 United KingdomHampstead School of English Language teaching February 2010 United KingdomManchester Academy Holdings Limited Language teaching August 2010 United KingdomTortola Yacht Services Yacht services September 2010 USA
Accommodation&DestinationsSectorSelect World Pty Limited (trading as Select Tours Australia)* Cruise services October 2009 AustraliaHilario Tours Coach operations April 2010 Dominican Republic
* On 7 September 2010 Select World Pty Limited changed its name to Intercruises Shoreside & Port Services Pty Limited.
In addition to the above, the Group acquired 22 individually insignificant German-based travel agency businesses and one insignificant Danish tour operator for a total consideration of £7m during the year ended 30 September 2010.
The Group acquired 100% of the voting equity instruments in respect of each acquisition completed during the year with the exception of WonderHolding AB, of which 51% of the voting equity instruments were acquired and TTOHL Otel Hizmetleri Turizm Ve Ticaret Anonim Sirketi, Hampstead School of English, Tortola Yacht Services and Hilario Tours, which were asset deals. The amount of non-controlling interest in WonderHolding AB is not considered material.
The relative size of the acquisitions made is set out in the table below:
Total TotalConsideration Number of consideration goodwill £m acquisitions £m £m
0 – 5 4 7 65 – 10 4 29 18
Total 8 36 24Other individually insignificant businesses 23 7 7
Total 31 43 31
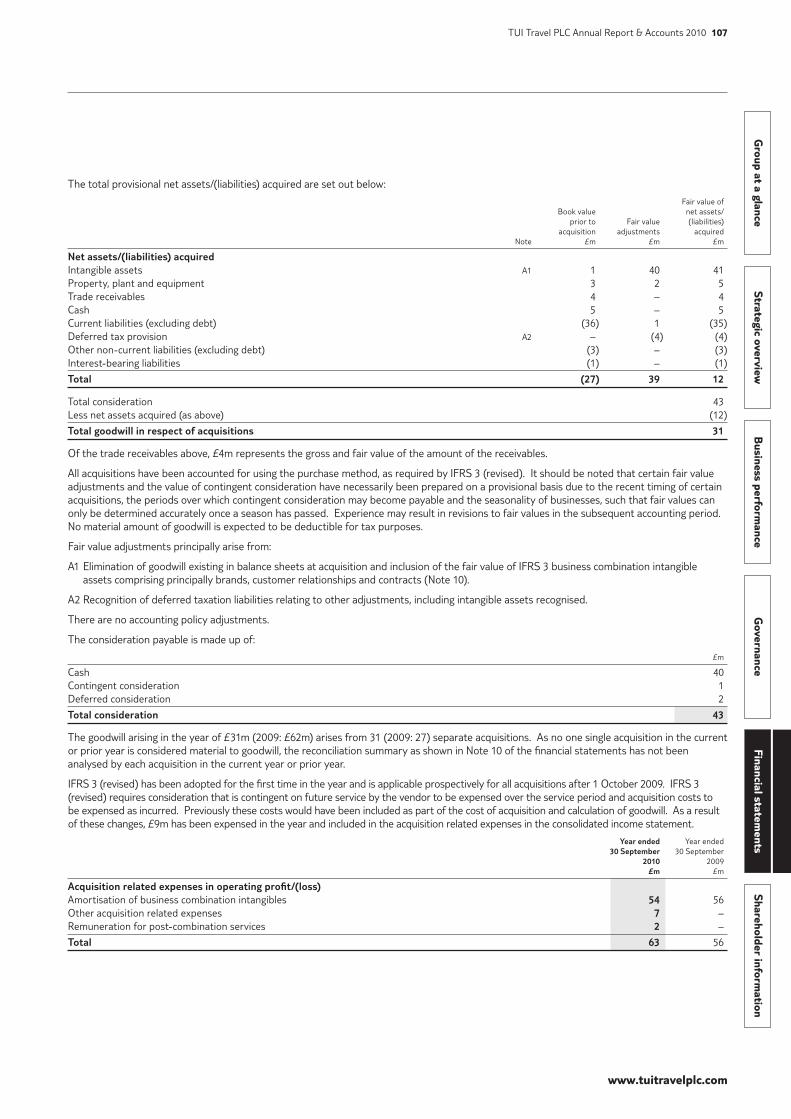
www.tuitravelplc.com
Group at a glance
Strategic overviewB
usiness performance
Governance
Financial statements
Shareholder information
TUI Travel PLC Annual Report & Accounts 2010 107
The total provisional net assets/(liabilities) acquired are set out below:
Fair value of Book value net assets/ prior to Fair value (liabilities) acquisition adjustments acquired Note £m £m £m
Netassets/(liabilities)acquiredIntangible assets A1 1 40 41 Property, plant and equipment 3 2 5 Trade receivables 4 – 4 Cash 5 – 5 Current liabilities (excluding debt) (36) 1 (35) Deferred tax provision A2 – (4) (4) Other non-current liabilities (excluding debt) (3) – (3) Interest-bearing liabilities (1) – (1)
Total (27) 39 12
Total consideration 43 Less net assets acquired (as above) (12)
Totalgoodwillinrespectofacquisitions 31
Of the trade receivables above, £4m represents the gross and fair value of the amount of the receivables.
All acquisitions have been accounted for using the purchase method, as required by IFRS 3 (revised). It should be noted that certain fair value adjustments and the value of contingent consideration have necessarily been prepared on a provisional basis due to the recent timing of certain acquisitions, the periods over which contingent consideration may become payable and the seasonality of businesses, such that fair values can only be determined accurately once a season has passed. Experience may result in revisions to fair values in the subsequent accounting period. No material amount of goodwill is expected to be deductible for tax purposes.
Fair value adjustments principally arise from:
A1 Elimination of goodwill existing in balance sheets at acquisition and inclusion of the fair value of IFRS 3 business combination intangible assets comprising principally brands, customer relationships and contracts (Note 10).
A2 Recognition of deferred taxation liabilities relating to other adjustments, including intangible assets recognised.
There are no accounting policy adjustments.
The consideration payable is made up of:
£m
Cash 40Contingent consideration 1Deferred consideration 2
Totalconsideration 43
The goodwill arising in the year of £31m (2009: £62m) arises from 31 (2009: 27) separate acquisitions. As no one single acquisition in the current or prior year is considered material to goodwill, the reconciliation summary as shown in Note 10 of the financial statements has not been analysed by each acquisition in the current year or prior year.
IFRS 3 (revised) has been adopted for the first time in the year and is applicable prospectively for all acquisitions after 1 October 2009. IFRS 3 (revised) requires consideration that is contingent on future service by the vendor to be expensed over the service period and acquisition costs to be expensed as incurred. Previously these costs would have been included as part of the cost of acquisition and calculation of goodwill. As a result of these changes, £9m has been expensed in the year and included in the acquisition related expenses in the consolidated income statement.
Yearended Year ended 30September 30 September 2010 2009 £m £m
Acquisitionrelatedexpensesinoperatingprofit/(loss)Amortisation of business combination intangibles 54 56Other acquisition related expenses 7 –Remuneration for post-combination services 2 –
Total 63 56
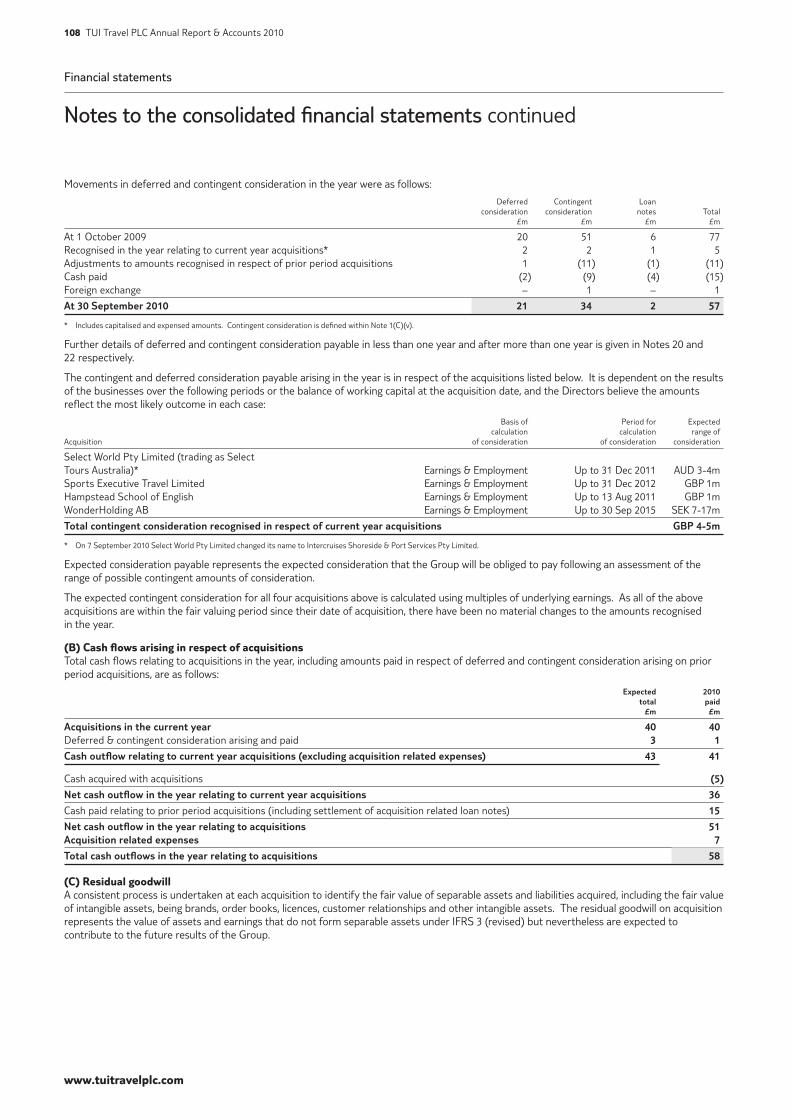
Financial statements
Notes to the consolidated financial statements continued
www.tuitravelplc.com
108 TUI Travel PLC Annual Report & Accounts 2010
Movements in deferred and contingent consideration in the year were as follows:
Deferred Contingent Loan consideration consideration notes Total £m £m £m £m
At 1 October 2009 20 51 6 77 Recognised in the year relating to current year acquisitions* 2 2 1 5 Adjustments to amounts recognised in respect of prior period acquisitions 1 (11) (1) (11)Cash paid (2) (9) (4) (15)Foreign exchange – 1 – 1
At30September2010 21 34 2 57
* Includes capitalised and expensed amounts. Contingent consideration is defined within Note 1(C)(v).
Further details of deferred and contingent consideration payable in less than one year and after more than one year is given in Notes 20 and 22 respectively.
The contingent and deferred consideration payable arising in the year is in respect of the acquisitions listed below. It is dependent on the results of the businesses over the following periods or the balance of working capital at the acquisition date, and the Directors believe the amounts reflect the most likely outcome in each case:
Basis of Period for Expected calculation calculation range ofAcquisition of consideration of consideration consideration
Select World Pty Limited (trading as Select Tours Australia)* Earnings & Employment Up to 31 Dec 2011 AUD 3-4mSports Executive Travel Limited Earnings & Employment Up to 31 Dec 2012 GBP 1mHampstead School of English Earnings & Employment Up to 13 Aug 2011 GBP 1mWonderHolding AB Earnings & Employment Up to 30 Sep 2015 SEK 7-17m
Totalcontingentconsiderationrecognisedinrespectofcurrentyearacquisitions GBP4-5m
* On 7 September 2010 Select World Pty Limited changed its name to Intercruises Shoreside & Port Services Pty Limited.
Expected consideration payable represents the expected consideration that the Group will be obliged to pay following an assessment of the range of possible contingent amounts of consideration.
The expected contingent consideration for all four acquisitions above is calculated using multiples of underlying earnings. As all of the above acquisitions are within the fair valuing period since their date of acquisition, there have been no material changes to the amounts recognised in the year.
(B) Cash flows arising in respect of acquisitionsTotal cash flows relating to acquisitions in the year, including amounts paid in respect of deferred and contingent consideration arising on prior period acquisitions, are as follows:
Expected 2010 total paid £m £m
Acquisitionsinthecurrentyear 40 40 Deferred & contingent consideration arising and paid 3 1
Cashoutflowrelatingtocurrentyearacquisitions(excludingacquisitionrelatedexpenses) 43 41
Cash acquired with acquisitions (5)
Netcashoutflowintheyearrelatingtocurrentyearacquisitions 36
Cash paid relating to prior period acquisitions (including settlement of acquisition related loan notes) 15
Netcashoutflowintheyearrelatingtoacquisitions 51Acquisitionrelatedexpenses 7
Totalcashoutflowsintheyearrelatingtoacquisitions 58
(C) Residual goodwillA consistent process is undertaken at each acquisition to identify the fair value of separable assets and liabilities acquired, including the fair value of intangible assets, being brands, order books, licences, customer relationships and other intangible assets. The residual goodwill on acquisition represents the value of assets and earnings that do not form separable assets under IFRS 3 (revised) but nevertheless are expected to contribute to the future results of the Group.
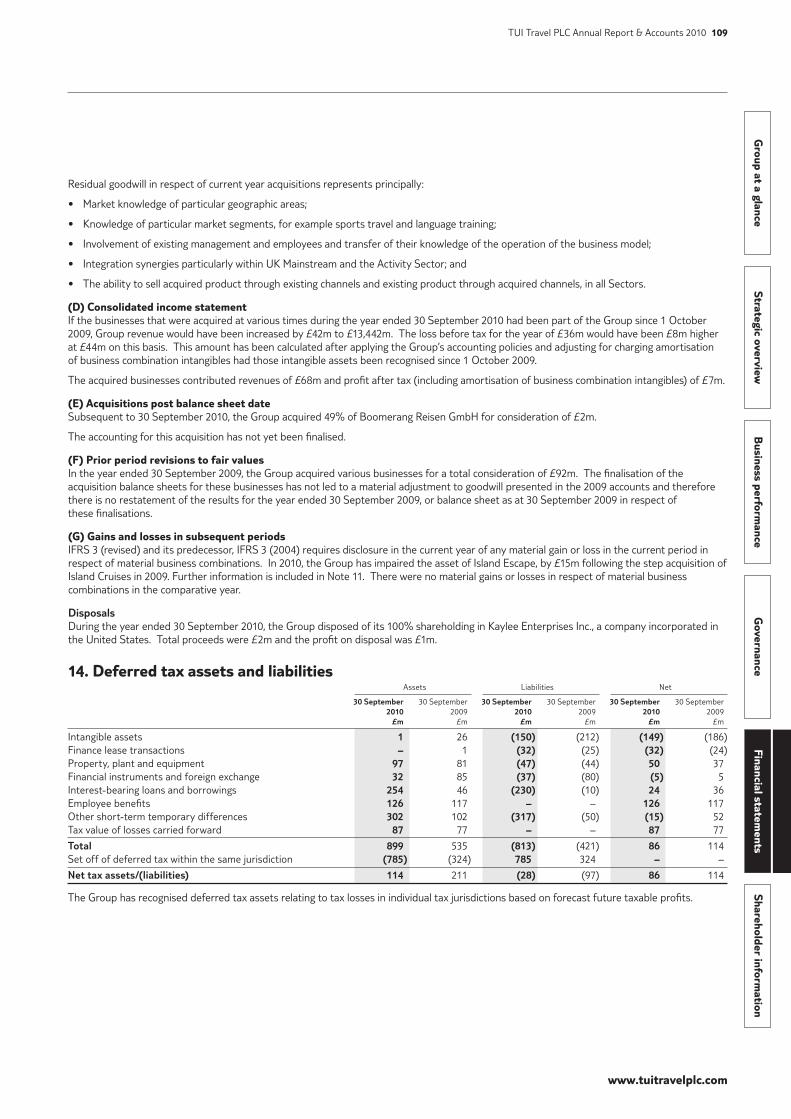
www.tuitravelplc.com
Group at a glance
Strategic overviewB
usiness performance
Governance
Financial statements
Shareholder information
TUI Travel PLC Annual Report & Accounts 2010 109
Residual goodwill in respect of current year acquisitions represents principally:
• Market knowledge of particular geographic areas;
• Knowledge of particular market segments, for example sports travel and language training;
• Involvement of existing management and employees and transfer of their knowledge of the operation of the business model;
• Integration synergies particularly within UK Mainstream and the Activity Sector; and
• The ability to sell acquired product through existing channels and existing product through acquired channels, in all Sectors.
(D) Consolidated income statementIf the businesses that were acquired at various times during the year ended 30 September 2010 had been part of the Group since 1 October 2009, Group revenue would have been increased by £42m to £13,442m. The loss before tax for the year of £36m would have been £8m higher at £44m on this basis. This amount has been calculated after applying the Group’s accounting policies and adjusting for charging amortisation of business combination intangibles had those intangible assets been recognised since 1 October 2009.
The acquired businesses contributed revenues of £68m and profit after tax (including amortisation of business combination intangibles) of £7m.
(E) Acquisitions post balance sheet dateSubsequent to 30 September 2010, the Group acquired 49% of Boomerang Reisen GmbH for consideration of £2m.
The accounting for this acquisition has not yet been finalised.
(F) Prior period revisions to fair valuesIn the year ended 30 September 2009, the Group acquired various businesses for a total consideration of £92m. The finalisation of the acquisition balance sheets for these businesses has not led to a material adjustment to goodwill presented in the 2009 accounts and therefore there is no restatement of the results for the year ended 30 September 2009, or balance sheet as at 30 September 2009 in respect of these finalisations.
(G) Gains and losses in subsequent periodsIFRS 3 (revised) and its predecessor, IFRS 3 (2004) requires disclosure in the current year of any material gain or loss in the current period in respect of material business combinations. In 2010, the Group has impaired the asset of Island Escape, by £15m following the step acquisition of Island Cruises in 2009. Further information is included in Note 11. There were no material gains or losses in respect of material business combinations in the comparative year.
DisposalsDuring the year ended 30 September 2010, the Group disposed of its 100% shareholding in Kaylee Enterprises Inc., a company incorporated in the United States. Total proceeds were £2m and the profit on disposal was £1m.
14. Deferred tax assets and liabilities Assets Liabilities Net 30September 30 September 30September 30 September 30September 30 September 2010 2009 2010 2009 2010 2009 £m £m £m £m £m £m
Intangible assets 1 26 (150) (212) (149) (186)Finance lease transactions – 1 (32) (25) (32) (24)Property, plant and equipment 97 81 (47) (44) 50 37 Financial instruments and foreign exchange 32 85 (37) (80) (5) 5 Interest-bearing loans and borrowings 254 46 (230) (10) 24 36 Employee benefits 126 117 – – 126 117 Other short-term temporary differences 302 102 (317) (50) (15) 52 Tax value of losses carried forward 87 77 – – 87 77
Total 899 535 (813) (421) 86 114 Set off of deferred tax within the same jurisdiction (785) (324) 785 324 – –
Nettaxassets/(liabilities) 114 211 (28) (97) 86 114
The Group has recognised deferred tax assets relating to tax losses in individual tax jurisdictions based on forecast future taxable profits.
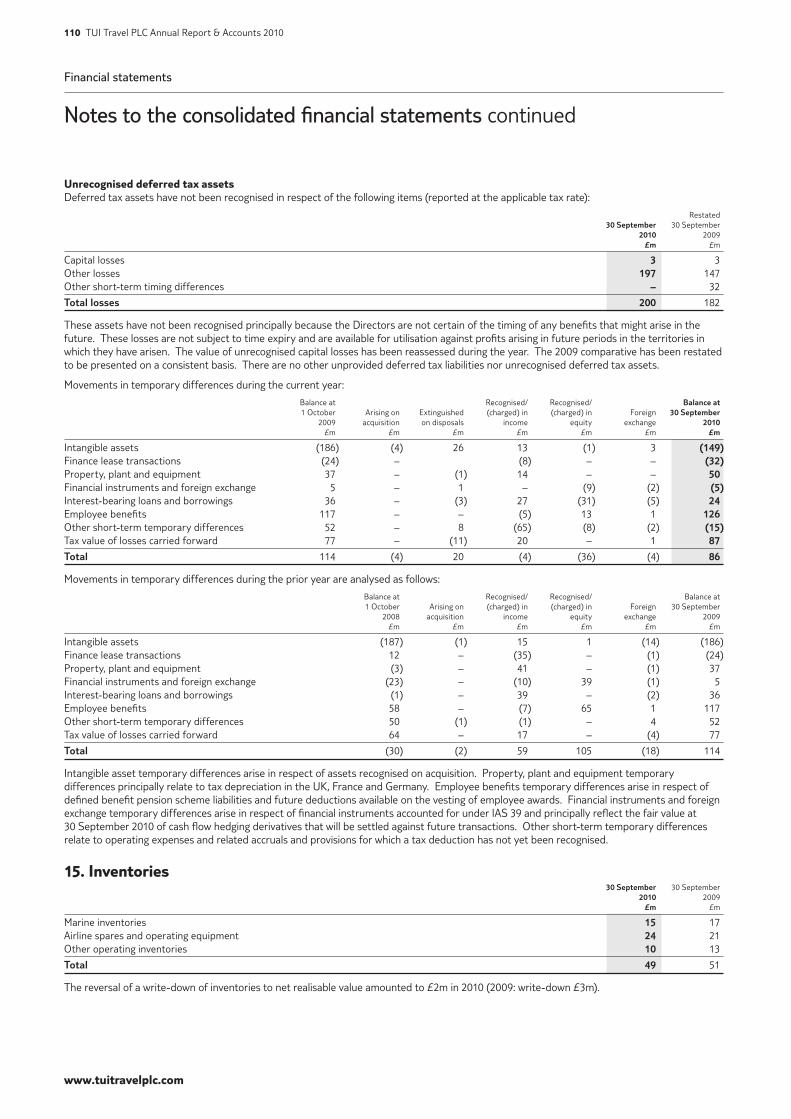
Financial statements
Notes to the consolidated financial statements continued
www.tuitravelplc.com
110 TUI Travel PLC Annual Report & Accounts 2010
Unrecognised deferred tax assetsDeferred tax assets have not been recognised in respect of the following items (reported at the applicable tax rate):
Restated 30September 30 September 2010 2009 £m £m
Capital losses 3 3 Other losses 197 147 Other short-term timing differences – 32
Totallosses 200 182
These assets have not been recognised principally because the Directors are not certain of the timing of any benefits that might arise in the future. These losses are not subject to time expiry and are available for utilisation against profits arising in future periods in the territories in which they have arisen. The value of unrecognised capital losses has been reassessed during the year. The 2009 comparative has been restated to be presented on a consistent basis. There are no other unprovided deferred tax liabilities nor unrecognised deferred tax assets.
Movements in temporary differences during the current year:
Balance at Recognised/ Recognised/ Balanceat 1 October Arising on Extinguished (charged) in (charged) in Foreign 30September 2009 acquisition on disposals income equity exchange 2010 £m £m £m £m £m £m £m
Intangible assets (186) (4) 26 13 (1) 3 (149)Finance lease transactions (24) – (8) – – (32)Property, plant and equipment 37 – (1) 14 – – 50Financial instruments and foreign exchange 5 – 1 – (9) (2) (5)Interest-bearing loans and borrowings 36 – (3) 27 (31) (5) 24Employee benefits 117 – – (5) 13 1 126Other short-term temporary differences 52 – 8 (65) (8) (2) (15)Tax value of losses carried forward 77 – (11) 20 – 1 87
Total 114 (4) 20 (4) (36) (4) 86
Movements in temporary differences during the prior year are analysed as follows:
Balance at Recognised/ Recognised/ Balance at 1 October Arising on (charged) in (charged) in Foreign 30 September 2008 acquisition income equity exchange 2009 £m £m £m £m £m £m
Intangible assets (187) (1) 15 1 (14) (186)Finance lease transactions 12 – (35) – (1) (24)Property, plant and equipment (3) – 41 – (1) 37 Financial instruments and foreign exchange (23) – (10) 39 (1) 5 Interest-bearing loans and borrowings (1) – 39 – (2) 36 Employee benefits 58 – (7) 65 1 117 Other short-term temporary differences 50 (1) (1) – 4 52 Tax value of losses carried forward 64 – 17 – (4) 77
Total (30) (2) 59 105 (18) 114
Intangible asset temporary differences arise in respect of assets recognised on acquisition. Property, plant and equipment temporary differences principally relate to tax depreciation in the UK, France and Germany. Employee benefits temporary differences arise in respect of defined benefit pension scheme liabilities and future deductions available on the vesting of employee awards. Financial instruments and foreign exchange temporary differences arise in respect of financial instruments accounted for under IAS 39 and principally reflect the fair value at 30 September 2010 of cash flow hedging derivatives that will be settled against future transactions. Other short-term temporary differences relate to operating expenses and related accruals and provisions for which a tax deduction has not yet been recognised.
15. Inventories 30September 30 September 2010 2009 £m £m
Marine inventories 15 17 Airline spares and operating equipment 24 21 Other operating inventories 10 13
Total 49 51
The reversal of a write-down of inventories to net realisable value amounted to £2m in 2010 (2009: write-down £3m).
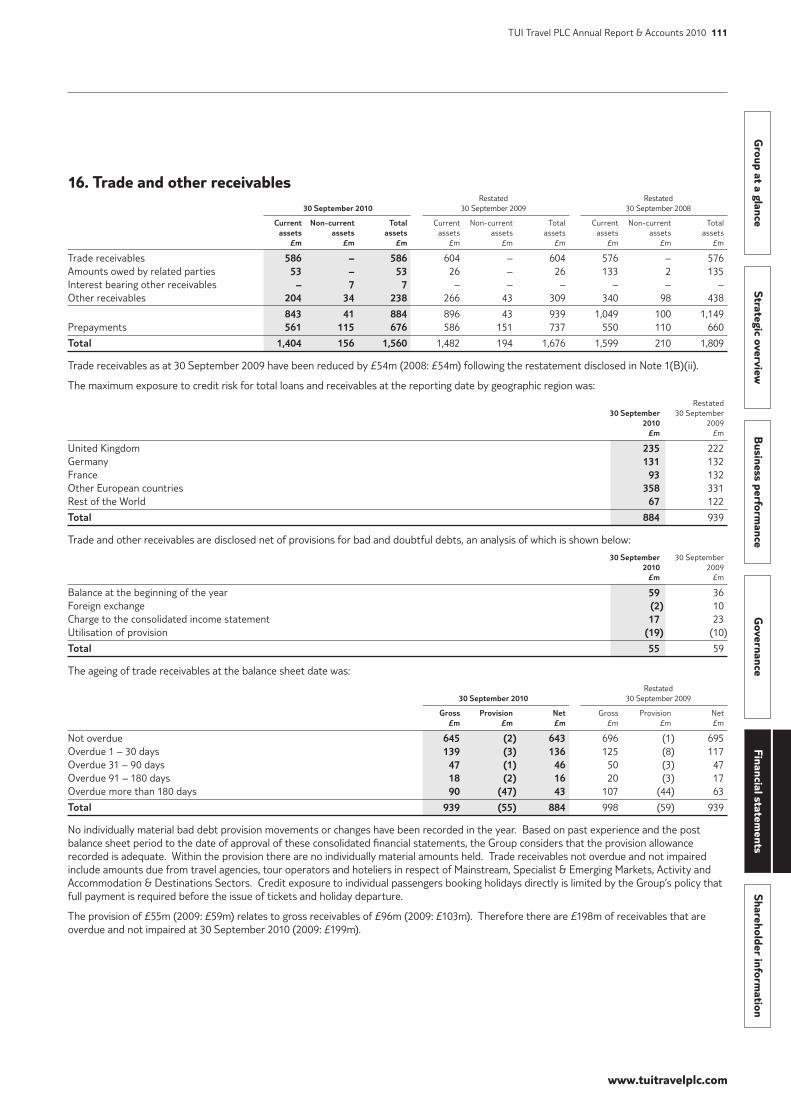
www.tuitravelplc.com
Group at a glance
Strategic overviewB
usiness performance
Governance
Financial statements
Shareholder information
TUI Travel PLC Annual Report & Accounts 2010 111
16. Trade and other receivables Restated Restated 30September2010 30 September 2009 30 September 2008 Current Non-current Total Current Non-current Total Current Non-current Total assets assets assets assets assets assets assets assets assets £m £m £m £m £m £m £m £m £m
Trade receivables 586 – 586 604 – 604 576 – 576 Amounts owed by related parties 53 – 53 26 – 26 133 2 135 Interest bearing other receivables – 7 7 – – – – – – Other receivables 204 34 238 266 43 309 340 98 438
843 41 884 896 43 939 1,049 100 1,149 Prepayments 561 115 676 586 151 737 550 110 660
Total 1,404 156 1,560 1,482 194 1,676 1,599 210 1,809
Trade receivables as at 30 September 2009 have been reduced by £54m (2008: £54m) following the restatement disclosed in Note 1(B)(ii).
The maximum exposure to credit risk for total loans and receivables at the reporting date by geographic region was:
Restated 30September 30 September 2010 2009 £m £m
United Kingdom 235 222 Germany 131 132 France 93 132 Other European countries 358 331 Rest of the World 67 122
Total 884 939
Trade and other receivables are disclosed net of provisions for bad and doubtful debts, an analysis of which is shown below:
30September 30 September 2010 2009 £m £m
Balance at the beginning of the year 59 36 Foreign exchange (2) 10 Charge to the consolidated income statement 17 23 Utilisation of provision (19) (10)
Total 55 59
The ageing of trade receivables at the balance sheet date was:
Restated 30September2010 30 September 2009 Gross Provision Net Gross Provision Net £m £m £m £m £m £m
Not overdue 645 (2) 643 696 (1) 695 Overdue 1 – 30 days 139 (3) 136 125 (8) 117 Overdue 31 – 90 days 47 (1) 46 50 (3) 47 Overdue 91 – 180 days 18 (2) 16 20 (3) 17 Overdue more than 180 days 90 (47) 43 107 (44) 63
Total 939 (55) 884 998 (59) 939
No individually material bad debt provision movements or changes have been recorded in the year. Based on past experience and the post balance sheet period to the date of approval of these consolidated financial statements, the Group considers that the provision allowance recorded is adequate. Within the provision there are no individually material amounts held. Trade receivables not overdue and not impaired include amounts due from travel agencies, tour operators and hoteliers in respect of Mainstream, Specialist & Emerging Markets, Activity and Accommodation & Destinations Sectors. Credit exposure to individual passengers booking holidays directly is limited by the Group’s policy that full payment is required before the issue of tickets and holiday departure.
The provision of £55m (2009: £59m) relates to gross receivables of £96m (2009: £103m). Therefore there are £198m of receivables that are overdue and not impaired at 30 September 2010 (2009: £199m).
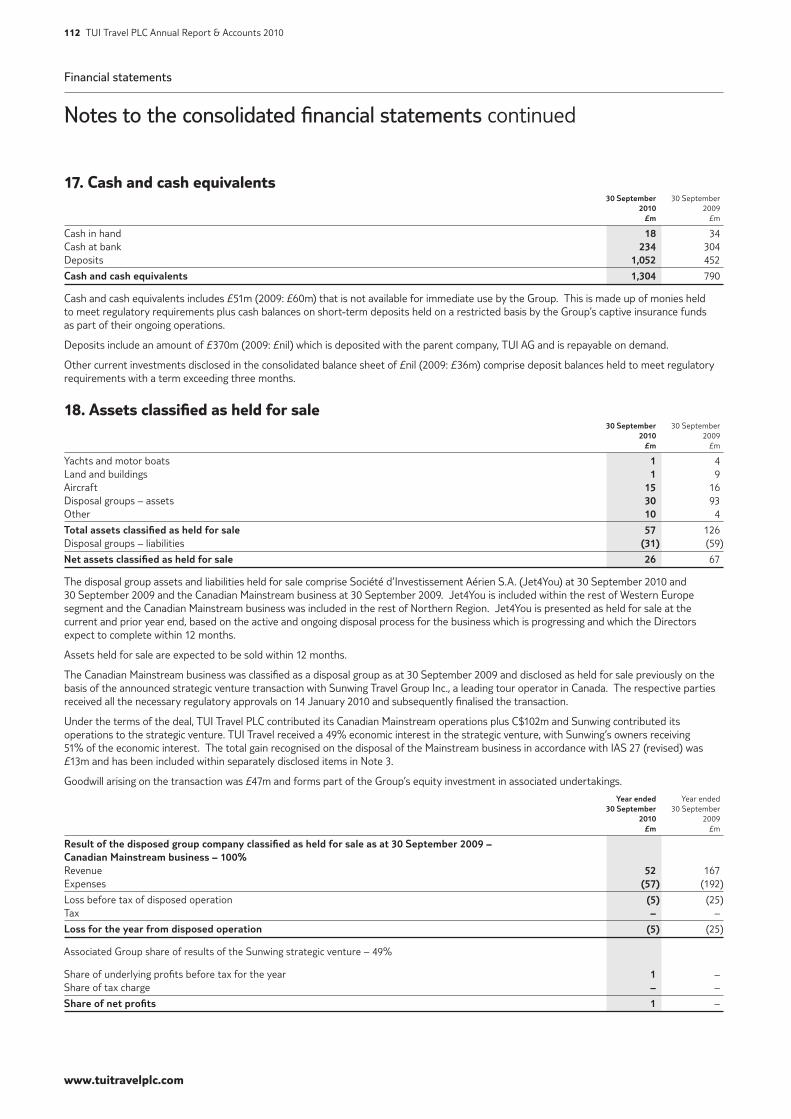
Financial statements
Notes to the consolidated financial statements continued
www.tuitravelplc.com
112 TUI Travel PLC Annual Report & Accounts 2010
17. Cash and cash equivalents 30September 30 September 2010 2009 £m £m
Cash in hand 18 34 Cash at bank 234 304 Deposits 1,052 452
Cashandcashequivalents 1,304 790
Cash and cash equivalents includes £51m (2009: £60m) that is not available for immediate use by the Group. This is made up of monies held to meet regulatory requirements plus cash balances on short-term deposits held on a restricted basis by the Group’s captive insurance funds as part of their ongoing operations.
Deposits include an amount of £370m (2009: £nil) which is deposited with the parent company, TUI AG and is repayable on demand.
Other current investments disclosed in the consolidated balance sheet of £nil (2009: £36m) comprise deposit balances held to meet regulatory requirements with a term exceeding three months.
18. Assets classified as held for sale 30September 30 September 2010 2009 £m £m
Yachts and motor boats 1 4 Land and buildings 1 9 Aircraft 15 16 Disposal groups – assets 30 93 Other 10 4
Totalassetsclassifiedasheldforsale 57 126 Disposal groups – liabilities (31) (59)
Netassetsclassifiedasheldforsale 26 67
The disposal group assets and liabilities held for sale comprise Société d’Investissement Aérien S.A. (Jet4You) at 30 September 2010 and 30 September 2009 and the Canadian Mainstream business at 30 September 2009. Jet4You is included within the rest of Western Europe segment and the Canadian Mainstream business was included in the rest of Northern Region. Jet4You is presented as held for sale at the current and prior year end, based on the active and ongoing disposal process for the business which is progressing and which the Directors expect to complete within 12 months.
Assets held for sale are expected to be sold within 12 months.
The Canadian Mainstream business was classified as a disposal group as at 30 September 2009 and disclosed as held for sale previously on the basis of the announced strategic venture transaction with Sunwing Travel Group Inc., a leading tour operator in Canada. The respective parties received all the necessary regulatory approvals on 14 January 2010 and subsequently finalised the transaction.
Under the terms of the deal, TUI Travel PLC contributed its Canadian Mainstream operations plus C$102m and Sunwing contributed its operations to the strategic venture. TUI Travel received a 49% economic interest in the strategic venture, with Sunwing’s owners receiving 51% of the economic interest. The total gain recognised on the disposal of the Mainstream business in accordance with IAS 27 (revised) was £13m and has been included within separately disclosed items in Note 3.
Goodwill arising on the transaction was £47m and forms part of the Group’s equity investment in associated undertakings.
Yearended Year ended 30September 30 September 2010 2009 £m £m
Resultofthedisposedgroupcompanyclassifiedasheldforsaleasat30September2009–CanadianMainstreambusiness–100%Revenue 52 167 Expenses (57) (192)
Loss before tax of disposed operation (5) (25)Tax – –
Lossfortheyearfromdisposedoperation (5) (25)
Associated Group share of results of the Sunwing strategic venture – 49%
Share of underlying profits before tax for the year 1 – Share of tax charge – –
Shareofnetprofits 1 –
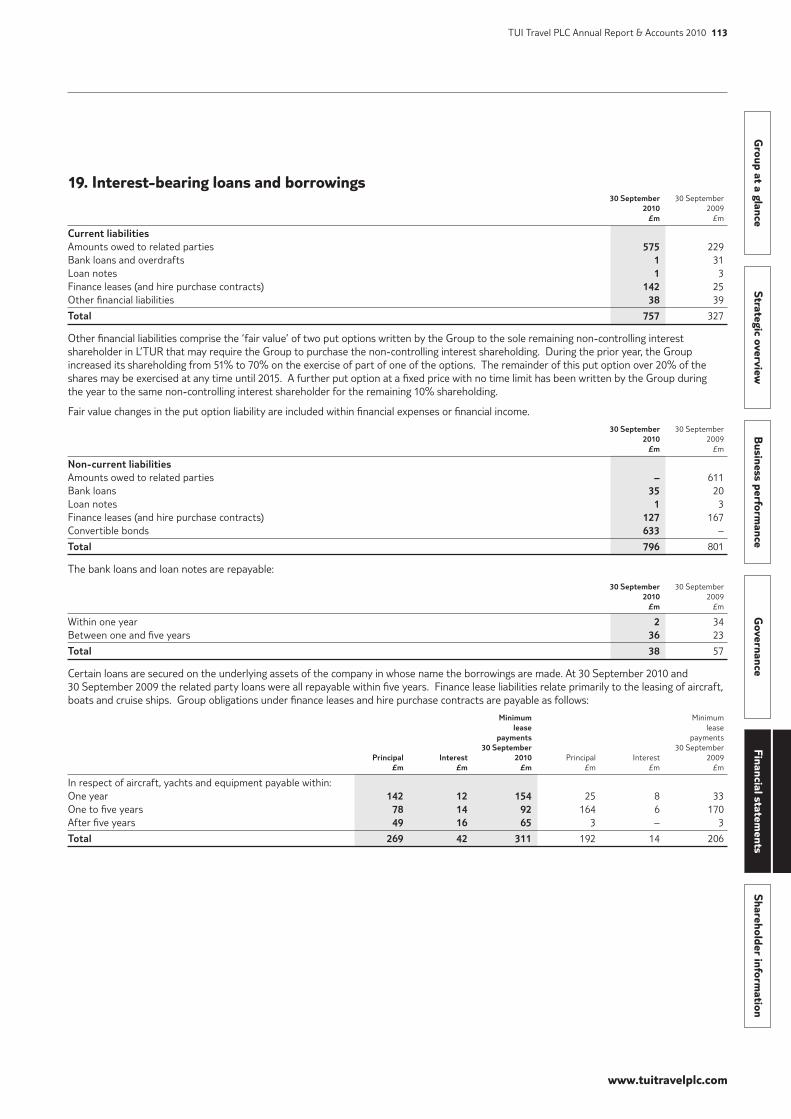
www.tuitravelplc.com
Group at a glance
Strategic overviewB
usiness performance
Governance
Financial statements
Shareholder information
TUI Travel PLC Annual Report & Accounts 2010 113
19. Interest-bearing loans and borrowings 30September 30 September 2010 2009 £m £m
CurrentliabilitiesAmounts owed to related parties 575 229 Bank loans and overdrafts 1 31 Loan notes 1 3 Finance leases (and hire purchase contracts) 142 25 Other financial liabilities 38 39
Total 757 327
Other financial liabilities comprise the ‘fair value’ of two put options written by the Group to the sole remaining non-controlling interest shareholder in L’TUR that may require the Group to purchase the non-controlling interest shareholding. During the prior year, the Group increased its shareholding from 51% to 70% on the exercise of part of one of the options. The remainder of this put option over 20% of the shares may be exercised at any time until 2015. A further put option at a fixed price with no time limit has been written by the Group during the year to the same non-controlling interest shareholder for the remaining 10% shareholding.
Fair value changes in the put option liability are included within financial expenses or financial income.
30September 30 September 2010 2009 £m £m
Non-currentliabilitiesAmounts owed to related parties – 611 Bank loans 35 20 Loan notes 1 3 Finance leases (and hire purchase contracts) 127 167 Convertible bonds 633 –
Total 796 801
The bank loans and loan notes are repayable:
30September 30 September 2010 2009 £m £m
Within one year 2 34 Between one and five years 36 23
Total 38 57
Certain loans are secured on the underlying assets of the company in whose name the borrowings are made. At 30 September 2010 and 30 September 2009 the related party loans were all repayable within five years. Finance lease liabilities relate primarily to the leasing of aircraft, boats and cruise ships. Group obligations under finance leases and hire purchase contracts are payable as follows:
Minimum Minimum lease lease payments payments 30September 30 September Principal Interest 2010 Principal Interest 2009 £m £m £m £m £m £m
In respect of aircraft, yachts and equipment payable within:One year 142 12 154 25 8 33 One to five years 78 14 92 164 6 170 After five years 49 16 65 3 – 3
Total 269 42 311 192 14 206
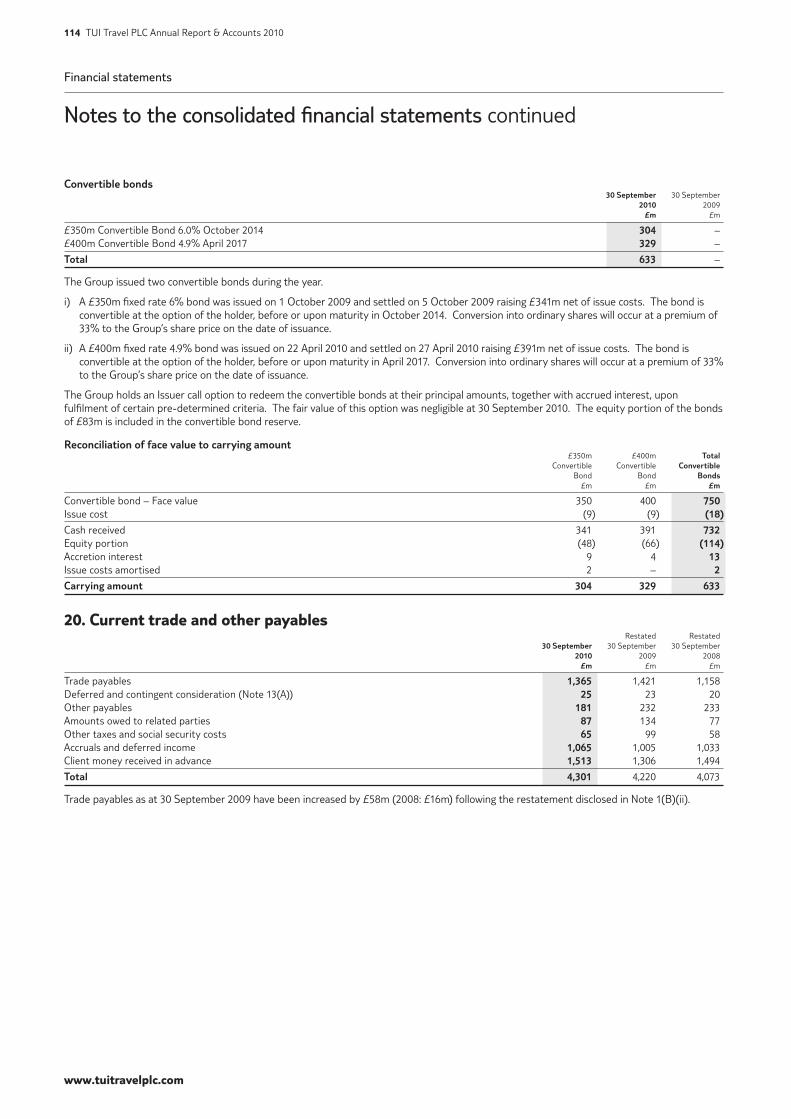
Financial statements
Notes to the consolidated financial statements continued
www.tuitravelplc.com
114 TUI Travel PLC Annual Report & Accounts 2010
Convertiblebonds 30September 30 September 2010 2009 £m £m
£350m Convertible Bond 6.0% October 2014 304 –£400m Convertible Bond 4.9% April 2017 329 –
Total 633 –
The Group issued two convertible bonds during the year.
i) A £350m fixed rate 6% bond was issued on 1 October 2009 and settled on 5 October 2009 raising £341m net of issue costs. The bond is convertible at the option of the holder, before or upon maturity in October 2014. Conversion into ordinary shares will occur at a premium of 33% to the Group’s share price on the date of issuance.
ii) A £400m fixed rate 4.9% bond was issued on 22 April 2010 and settled on 27 April 2010 raising £391m net of issue costs. The bond is convertible at the option of the holder, before or upon maturity in April 2017. Conversion into ordinary shares will occur at a premium of 33% to the Group’s share price on the date of issuance.
The Group holds an Issuer call option to redeem the convertible bonds at their principal amounts, together with accrued interest, upon fulfilment of certain pre-determined criteria. The fair value of this option was negligible at 30 September 2010. The equity portion of the bonds of £83m is included in the convertible bond reserve.
Reconciliationoffacevaluetocarryingamount £350m £400m Total Convertible Convertible Convertible Bond Bond Bonds £m £m £m
Convertible bond – Face value 350 400 750 Issue cost (9) (9) (18)
Cash received 341 391 732Equity portion (48) (66) (114)Accretion interest 9 4 13Issue costs amortised 2 – 2
Carryingamount 304 329 633
20. Current trade and other payables Restated Restated 30September 30 September 30 September 2010 2009 2008 £m £m £m
Trade payables 1,365 1,421 1,158 Deferred and contingent consideration (Note 13(A)) 25 23 20 Other payables 181 232 233 Amounts owed to related parties 87 134 77 Other taxes and social security costs 65 99 58 Accruals and deferred income 1,065 1,005 1,033 Client money received in advance 1,513 1,306 1,494
Total 4,301 4,220 4,073
Trade payables as at 30 September 2009 have been increased by £58m (2008: £16m) following the restatement disclosed in Note 1(B)(ii).
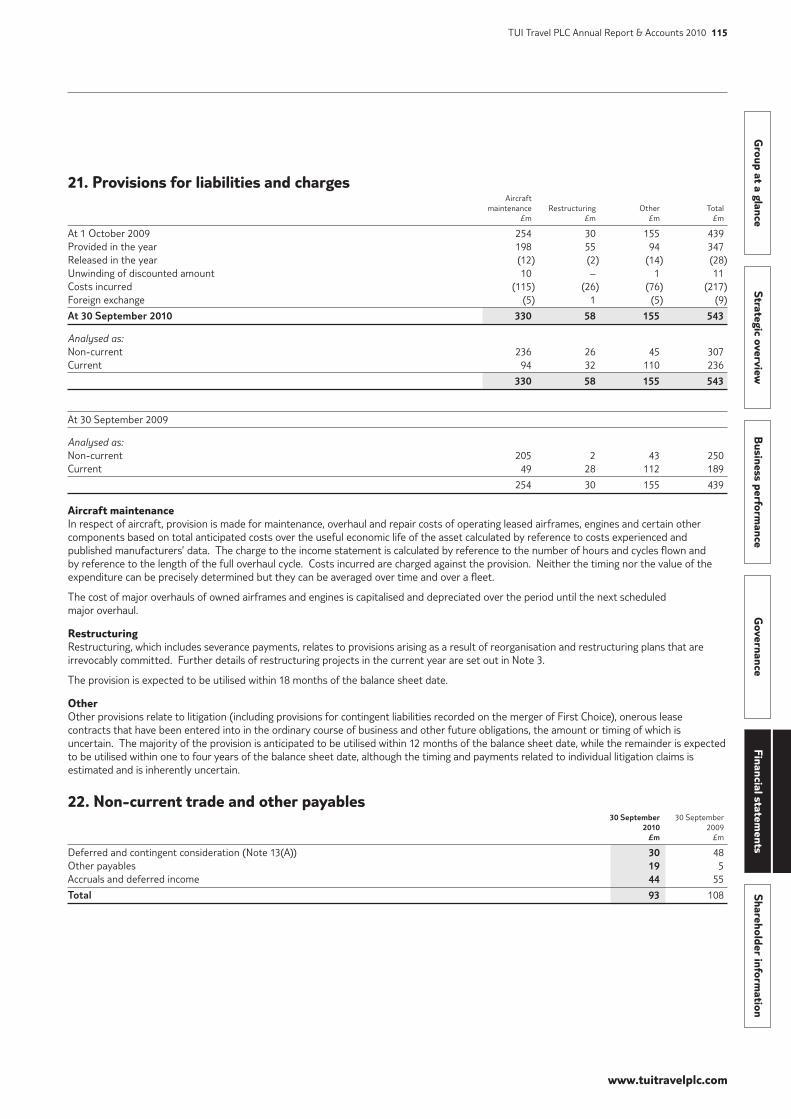
www.tuitravelplc.com
Group at a glance
Strategic overviewB
usiness performance
Governance
Financial statements
Shareholder information
TUI Travel PLC Annual Report & Accounts 2010 115
21. Provisions for liabilities and charges Aircraft maintenance Restructuring Other Total £m £m £m £m
At 1 October 2009 254 30 155 439 Provided in the year 198 55 94 347 Released in the year (12) (2) (14) (28)Unwinding of discounted amount 10 – 1 11 Costs incurred (115) (26) (76) (217)Foreign exchange (5) 1 (5) (9)
At 30 September 2010 330 58 155 543
Analysed as: Non-current 236 26 45 307 Current 94 32 110 236
330 58 155 543
At 30 September 2009
Analysed as: Non-current 205 2 43 250 Current 49 28 112 189
254 30 155 439
Aircraft maintenanceIn respect of aircraft, provision is made for maintenance, overhaul and repair costs of operating leased airframes, engines and certain other components based on total anticipated costs over the useful economic life of the asset calculated by reference to costs experienced and published manufacturers’ data. The charge to the income statement is calculated by reference to the number of hours and cycles flown and by reference to the length of the full overhaul cycle. Costs incurred are charged against the provision. Neither the timing nor the value of the expenditure can be precisely determined but they can be averaged over time and over a fleet.
The cost of major overhauls of owned airframes and engines is capitalised and depreciated over the period until the next scheduled major overhaul.
RestructuringRestructuring, which includes severance payments, relates to provisions arising as a result of reorganisation and restructuring plans that are irrevocably committed. Further details of restructuring projects in the current year are set out in Note 3.
The provision is expected to be utilised within 18 months of the balance sheet date.
OtherOther provisions relate to litigation (including provisions for contingent liabilities recorded on the merger of First Choice), onerous lease contracts that have been entered into in the ordinary course of business and other future obligations, the amount or timing of which is uncertain. The majority of the provision is anticipated to be utilised within 12 months of the balance sheet date, while the remainder is expected to be utilised within one to four years of the balance sheet date, although the timing and payments related to individual litigation claims is estimated and is inherently uncertain.
22. Non-current trade and other payables 30 September 30 September 2010 2009 £m £m
Deferred and contingent consideration (Note 13(A)) 30 48 Other payables 19 5 Accruals and deferred income 44 55
Total 93 108
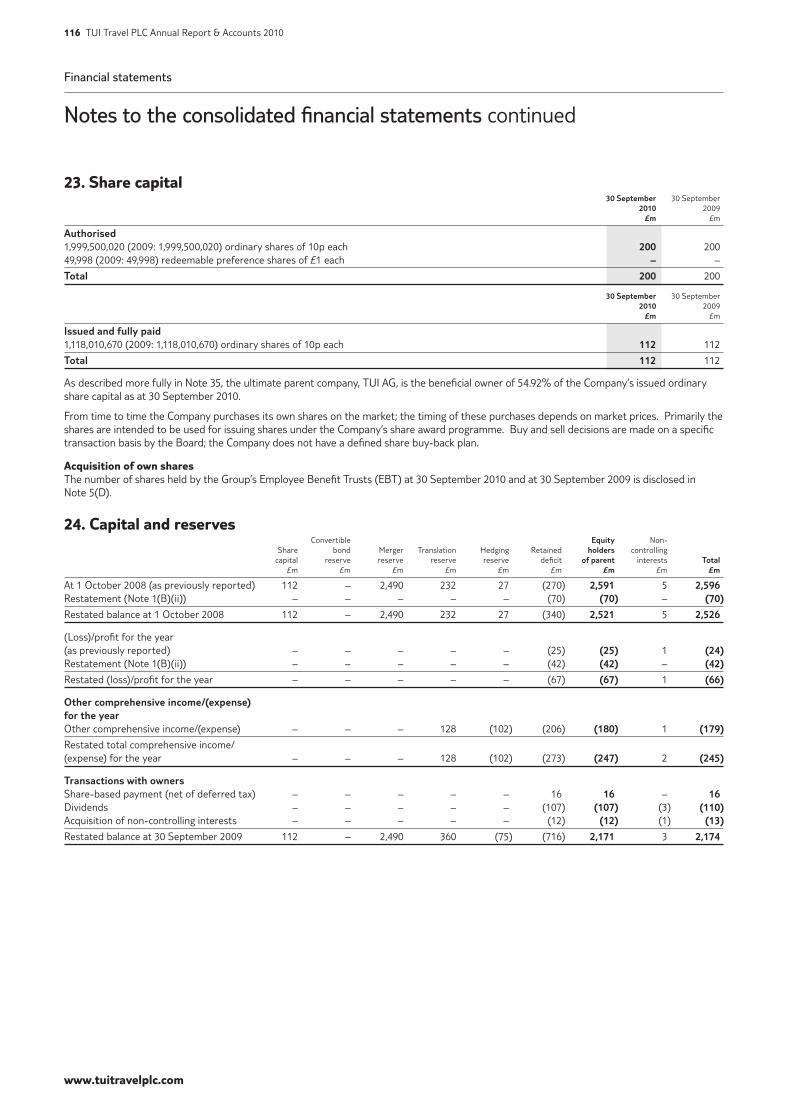
Financial statements
Notes to the consolidated financial statements continued
www.tuitravelplc.com
116 TUI Travel PLC Annual Report & Accounts 2010
23. Share capital 30 September 30 September 2010 2009 £m £m
Authorised 1,999,500,020 (2009: 1,999,500,020) ordinary shares of 10p each 200 200 49,998 (2009: 49,998) redeemable preference shares of £1 each – –
Total 200 200
30 September 30 September 2010 2009 £m £m
Issued and fully paid 1,118,010,670 (2009: 1,118,010,670) ordinary shares of 10p each 112 112
Total 112 112
As described more fully in Note 35, the ultimate parent company, TUI AG, is the beneficial owner of 54.92% of the Company’s issued ordinary share capital as at 30 September 2010.
From time to time the Company purchases its own shares on the market; the timing of these purchases depends on market prices. Primarily the shares are intended to be used for issuing shares under the Company’s share award programme. Buy and sell decisions are made on a specific transaction basis by the Board; the Company does not have a defined share buy-back plan.
Acquisition of own sharesThe number of shares held by the Group’s Employee Benefit Trusts (EBT) at 30 September 2010 and at 30 September 2009 is disclosed in Note 5(D).
24. Capital and reserves Convertible Equity Non- Share bond Merger Translation Hedging Retained holders controlling capital reserve reserve reserve reserve deficit of parent interests Total £m £m £m £m £m £m £m £m £m
At 1 October 2008 (as previously reported) 112 – 2,490 232 27 (270) 2,591 5 2,596 Restatement (Note 1(B)(ii)) – – – – – (70) (70) – (70)
Restated balance at 1 October 2008 112 – 2,490 232 27 (340) 2,521 5 2,526
(Loss)/profit for the year (as previously reported) – – – – – (25) (25) 1 (24)Restatement (Note 1(B)(ii)) – – – – – (42) (42) – (42)
Restated (loss)/profit for the year – – – – – (67) (67) 1 (66)
Other comprehensive income/(expense) for the year Other comprehensive income/(expense) – – – 128 (102) (206) (180) 1 (179)
Restated total comprehensive income/ (expense) for the year – – – 128 (102) (273) (247) 2 (245)
Transactions with owners Share-based payment (net of deferred tax) – – – – – 16 16 – 16 Dividends – – – – – (107) (107) (3) (110)Acquisition of non-controlling interests – – – – – (12) (12) (1) (13)
Restated balance at 30 September 2009 112 – 2,490 360 (75) (716) 2,171 3 2,174
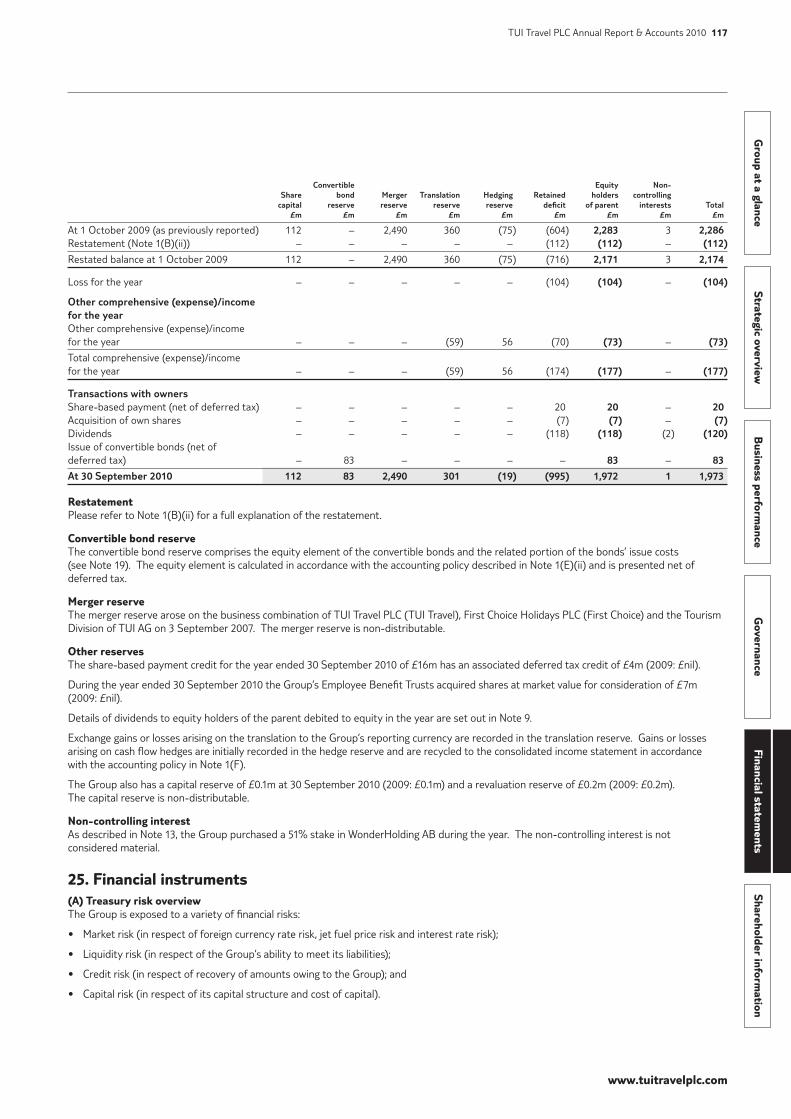
www.tuitravelplc.com
Group at a glance
Strategic overviewB
usiness performance
Governance
Financial statements
Shareholder information
TUI Travel PLC Annual Report & Accounts 2010 117
Convertible Equity Non- Share bond Merger Translation Hedging Retained holders controlling capital reserve reserve reserve reserve deficit of parent interests Total £m £m £m £m £m £m £m £m £m
At 1 October 2009 (as previously reported) 112 – 2,490 360 (75) (604) 2,283 3 2,286 Restatement (Note 1(B)(ii)) – – – – – (112) (112) – (112)
Restated balance at 1 October 2009 112 – 2,490 360 (75) (716) 2,171 3 2,174
Loss for the year – – – – – (104) (104) – (104)
Other comprehensive (expense)/income for the year Other comprehensive (expense)/income for the year – – – (59) 56 (70) (73) – (73)
Total comprehensive (expense)/income for the year – – – (59) 56 (174) (177) – (177)
Transactions with owners Share-based payment (net of deferred tax) – – – – – 20 20 – 20 Acquisition of own shares – – – – – (7) (7) – (7)Dividends – – – – – (118) (118) (2) (120)Issue of convertible bonds (net of deferred tax) – 83 – – – – 83 – 83
At 30 September 2010 112 83 2,490 301 (19) (995) 1,972 1 1,973
RestatementPlease refer to Note 1(B)(ii) for a full explanation of the restatement.
Convertible bond reserveThe convertible bond reserve comprises the equity element of the convertible bonds and the related portion of the bonds’ issue costs (see Note 19). The equity element is calculated in accordance with the accounting policy described in Note 1(E)(ii) and is presented net of deferred tax.
Merger reserveThe merger reserve arose on the business combination of TUI Travel PLC (TUI Travel), First Choice Holidays PLC (First Choice) and the Tourism Division of TUI AG on 3 September 2007. The merger reserve is non-distributable.
Other reservesThe share-based payment credit for the year ended 30 September 2010 of £16m has an associated deferred tax credit of £4m (2009: £nil).
During the year ended 30 September 2010 the Group’s Employee Benefit Trusts acquired shares at market value for consideration of £7m (2009: £nil).
Details of dividends to equity holders of the parent debited to equity in the year are set out in Note 9.
Exchange gains or losses arising on the translation to the Group’s reporting currency are recorded in the translation reserve. Gains or losses arising on cash flow hedges are initially recorded in the hedge reserve and are recycled to the consolidated income statement in accordance with the accounting policy in Note 1(F).
The Group also has a capital reserve of £0.1m at 30 September 2010 (2009: £0.1m) and a revaluation reserve of £0.2m (2009: £0.2m). The capital reserve is non-distributable.
Non-controlling interestAs described in Note 13, the Group purchased a 51% stake in WonderHolding AB during the year. The non-controlling interest is not considered material.
25. Financial instruments(A) Treasury risk overviewThe Group is exposed to a variety of financial risks:
• Market risk (in respect of foreign currency rate risk, jet fuel price risk and interest rate risk);
• Liquidity risk (in respect of the Group’s ability to meet its liabilities);
• Credit risk (in respect of recovery of amounts owing to the Group); and
• Capital risk (in respect of its capital structure and cost of capital).
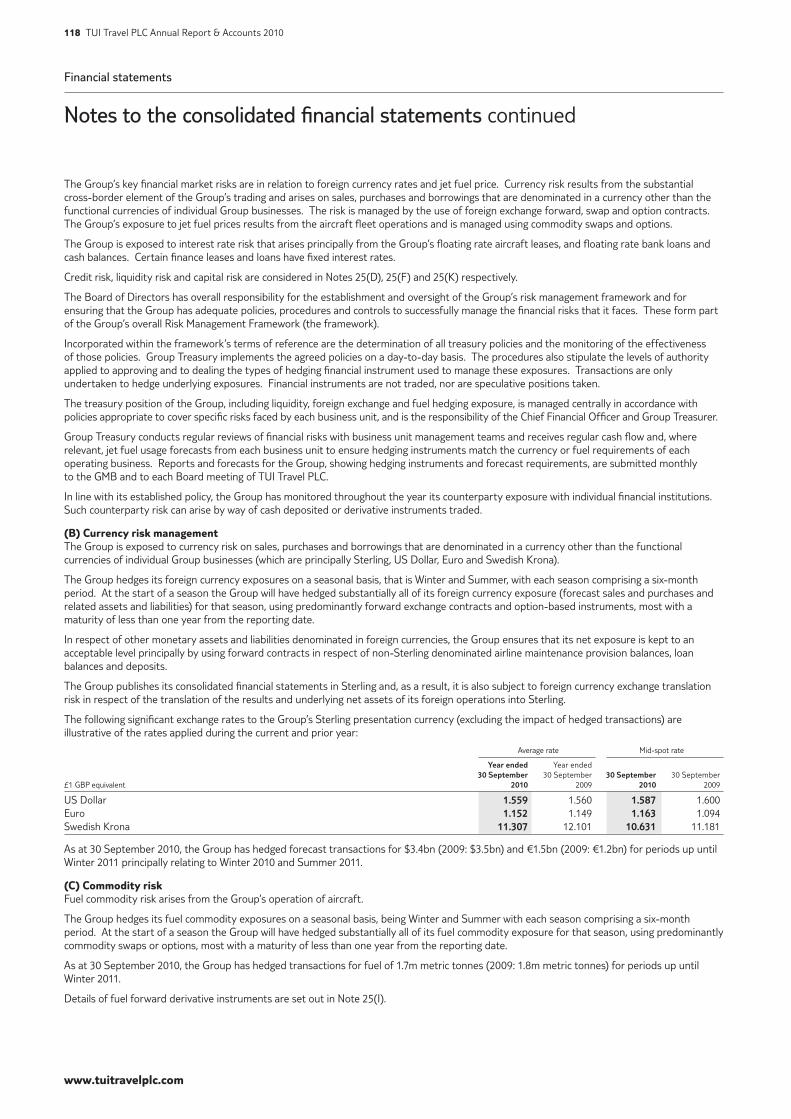
Financial statements
Notes to the consolidated financial statements continued
www.tuitravelplc.com
118 TUI Travel PLC Annual Report & Accounts 2010
The Group’s key financial market risks are in relation to foreign currency rates and jet fuel price. Currency risk results from the substantial cross-border element of the Group’s trading and arises on sales, purchases and borrowings that are denominated in a currency other than the functional currencies of individual Group businesses. The risk is managed by the use of foreign exchange forward, swap and option contracts. The Group’s exposure to jet fuel prices results from the aircraft fleet operations and is managed using commodity swaps and options.
The Group is exposed to interest rate risk that arises principally from the Group’s floating rate aircraft leases, and floating rate bank loans and cash balances. Certain finance leases and loans have fixed interest rates.
Credit risk, liquidity risk and capital risk are considered in Notes 25(D), 25(F) and 25(K) respectively.
The Board of Directors has overall responsibility for the establishment and oversight of the Group’s risk management framework and for ensuring that the Group has adequate policies, procedures and controls to successfully manage the financial risks that it faces. These form part of the Group’s overall Risk Management Framework (the framework).
Incorporated within the framework’s terms of reference are the determination of all treasury policies and the monitoring of the effectiveness of those policies. Group Treasury implements the agreed policies on a day-to-day basis. The procedures also stipulate the levels of authority applied to approving and to dealing the types of hedging financial instrument used to manage these exposures. Transactions are only undertaken to hedge underlying exposures. Financial instruments are not traded, nor are speculative positions taken.
The treasury position of the Group, including liquidity, foreign exchange and fuel hedging exposure, is managed centrally in accordance with policies appropriate to cover specific risks faced by each business unit, and is the responsibility of the Chief Financial Officer and Group Treasurer.
Group Treasury conducts regular reviews of financial risks with business unit management teams and receives regular cash flow and, where relevant, jet fuel usage forecasts from each business unit to ensure hedging instruments match the currency or fuel requirements of each operating business. Reports and forecasts for the Group, showing hedging instruments and forecast requirements, are submitted monthly to the GMB and to each Board meeting of TUI Travel PLC.
In line with its established policy, the Group has monitored throughout the year its counterparty exposure with individual financial institutions. Such counterparty risk can arise by way of cash deposited or derivative instruments traded.
(B) Currency risk managementThe Group is exposed to currency risk on sales, purchases and borrowings that are denominated in a currency other than the functional currencies of individual Group businesses (which are principally Sterling, US Dollar, Euro and Swedish Krona).
The Group hedges its foreign currency exposures on a seasonal basis, that is Winter and Summer, with each season comprising a six-month period. At the start of a season the Group will have hedged substantially all of its foreign currency exposure (forecast sales and purchases and related assets and liabilities) for that season, using predominantly forward exchange contracts and option-based instruments, most with a maturity of less than one year from the reporting date.
In respect of other monetary assets and liabilities denominated in foreign currencies, the Group ensures that its net exposure is kept to an acceptable level principally by using forward contracts in respect of non-Sterling denominated airline maintenance provision balances, loan balances and deposits.
The Group publishes its consolidated financial statements in Sterling and, as a result, it is also subject to foreign currency exchange translation risk in respect of the translation of the results and underlying net assets of its foreign operations into Sterling.
The following significant exchange rates to the Group’s Sterling presentation currency (excluding the impact of hedged transactions) are illustrative of the rates applied during the current and prior year:
Average rate Mid-spot rate Year ended Year ended 30 September 30 September 30 September 30 September £1 GBP equivalent 2010 2009 2010 2009
US Dollar 1.559 1.560 1.587 1.600 Euro 1.152 1.149 1.163 1.094 Swedish Krona 11.307 12.101 10.631 11.181
As at 30 September 2010, the Group has hedged forecast transactions for $3.4bn (2009: $3.5bn) and €1.5bn (2009: €1.2bn) for periods up until Winter 2011 principally relating to Winter 2010 and Summer 2011.
(C) Commodity riskFuel commodity risk arises from the Group’s operation of aircraft.
The Group hedges its fuel commodity exposures on a seasonal basis, being Winter and Summer with each season comprising a six-month period. At the start of a season the Group will have hedged substantially all of its fuel commodity exposure for that season, using predominantly commodity swaps or options, most with a maturity of less than one year from the reporting date.
As at 30 September 2010, the Group has hedged transactions for fuel of 1.7m metric tonnes (2009: 1.8m metric tonnes) for periods up until Winter 2011.
Details of fuel forward derivative instruments are set out in Note 25(I).
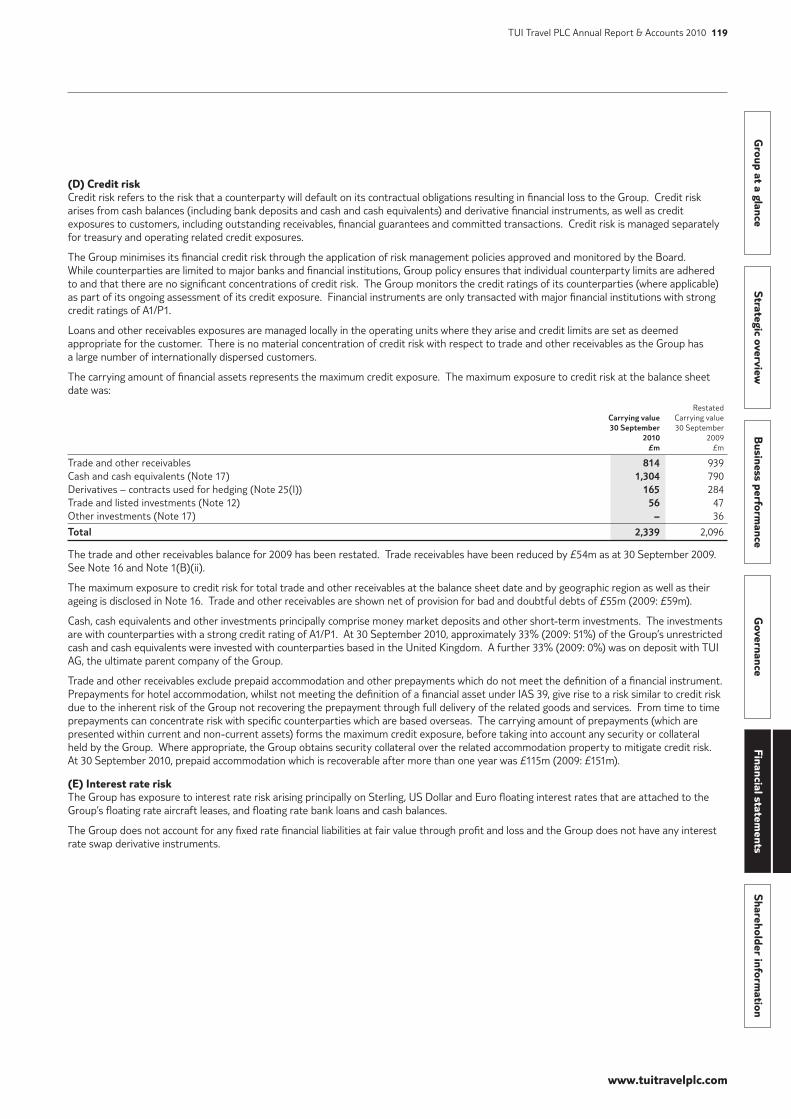
www.tuitravelplc.com
Group at a glance
Strategic overviewB
usiness performance
Governance
Financial statements
Shareholder information
TUI Travel PLC Annual Report & Accounts 2010 119
(D) Credit riskCredit risk refers to the risk that a counterparty will default on its contractual obligations resulting in financial loss to the Group. Credit risk arises from cash balances (including bank deposits and cash and cash equivalents) and derivative financial instruments, as well as credit exposures to customers, including outstanding receivables, financial guarantees and committed transactions. Credit risk is managed separately for treasury and operating related credit exposures.
The Group minimises its financial credit risk through the application of risk management policies approved and monitored by the Board. While counterparties are limited to major banks and financial institutions, Group policy ensures that individual counterparty limits are adhered to and that there are no significant concentrations of credit risk. The Group monitors the credit ratings of its counterparties (where applicable) as part of its ongoing assessment of its credit exposure. Financial instruments are only transacted with major financial institutions with strong credit ratings of A1/P1.
Loans and other receivables exposures are managed locally in the operating units where they arise and credit limits are set as deemed appropriate for the customer. There is no material concentration of credit risk with respect to trade and other receivables as the Group has a large number of internationally dispersed customers.
The carrying amount of financial assets represents the maximum credit exposure. The maximum exposure to credit risk at the balance sheet date was:
Restated Carrying value Carrying value 30 September 30 September 2010 2009 £m £m
Trade and other receivables 814 939 Cash and cash equivalents (Note 17) 1,304 790 Derivatives – contracts used for hedging (Note 25(I)) 165 284 Trade and listed investments (Note 12) 56 47 Other investments (Note 17) – 36
Total 2,339 2,096
The trade and other receivables balance for 2009 has been restated. Trade receivables have been reduced by £54m as at 30 September 2009. See Note 16 and Note 1(B)(ii).
The maximum exposure to credit risk for total trade and other receivables at the balance sheet date and by geographic region as well as their ageing is disclosed in Note 16. Trade and other receivables are shown net of provision for bad and doubtful debts of £55m (2009: £59m).
Cash, cash equivalents and other investments principally comprise money market deposits and other short-term investments. The investments are with counterparties with a strong credit rating of A1/P1. At 30 September 2010, approximately 33% (2009: 51%) of the Group’s unrestricted cash and cash equivalents were invested with counterparties based in the United Kingdom. A further 33% (2009: 0%) was on deposit with TUI AG, the ultimate parent company of the Group.
Trade and other receivables exclude prepaid accommodation and other prepayments which do not meet the definition of a financial instrument. Prepayments for hotel accommodation, whilst not meeting the definition of a financial asset under IAS 39, give rise to a risk similar to credit risk due to the inherent risk of the Group not recovering the prepayment through full delivery of the related goods and services. From time to time prepayments can concentrate risk with specific counterparties which are based overseas. The carrying amount of prepayments (which are presented within current and non-current assets) forms the maximum credit exposure, before taking into account any security or collateral held by the Group. Where appropriate, the Group obtains security collateral over the related accommodation property to mitigate credit risk. At 30 September 2010, prepaid accommodation which is recoverable after more than one year was £115m (2009: £151m).
(E) Interest rate risk The Group has exposure to interest rate risk arising principally on Sterling, US Dollar and Euro floating interest rates that are attached to the Group’s floating rate aircraft leases, and floating rate bank loans and cash balances.
The Group does not account for any fixed rate financial liabilities at fair value through profit and loss and the Group does not have any interest rate swap derivative instruments.
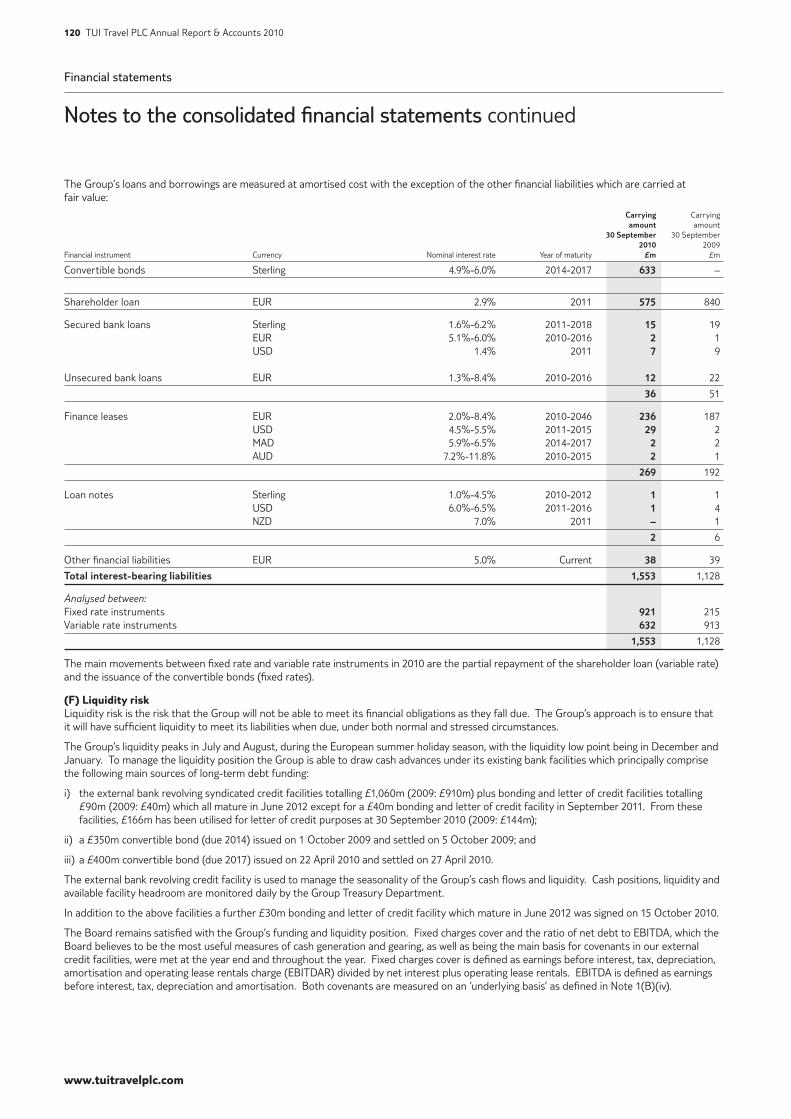
Financial statements
Notes to the consolidated financial statements continued
www.tuitravelplc.com
120 TUI Travel PLC Annual Report & Accounts 2010
The Group’s loans and borrowings are measured at amortised cost with the exception of the other financial liabilities which are carried at fair value:
Carrying Carrying amount amount 30 September 30 September 2010 2009Financial instrument Currency Nominal interest rate Year of maturity £m £m
Convertible bonds Sterling 4.9%-6.0% 2014-2017 633 –
Shareholder loan EUR 2.9% 2011 575 840
Secured bank loans Sterling 1.6%-6.2% 2011-2018 15 19 EUR 5.1%-6.0% 2010-2016 2 1 USD 1.4% 2011 7 9
Unsecured bank loans EUR 1.3%-8.4% 2010-2016 12 22
36 51
Finance leases EUR 2.0%-8.4% 2010-2046 236 187 USD 4.5%-5.5% 2011-2015 29 2 MAD 5.9%-6.5% 2014-2017 2 2 AUD 7.2%-11.8% 2010-2015 2 1
269 192
Loan notes Sterling 1.0%-4.5% 2010-2012 1 1 USD 6.0%-6.5% 2011-2016 1 4 NZD 7.0% 2011 – 1
2 6
Other financial liabilities EUR 5.0% Current 38 39
Total interest-bearing liabilities 1,553 1,128
Analysed between:Fixed rate instruments 921 215 Variable rate instruments 632 913
1,553 1,128
The main movements between fixed rate and variable rate instruments in 2010 are the partial repayment of the shareholder loan (variable rate) and the issuance of the convertible bonds (fixed rates).
(F) Liquidity risk Liquidity risk is the risk that the Group will not be able to meet its financial obligations as they fall due. The Group’s approach is to ensure that it will have sufficient liquidity to meet its liabilities when due, under both normal and stressed circumstances.
The Group’s liquidity peaks in July and August, during the European summer holiday season, with the liquidity low point being in December and January. To manage the liquidity position the Group is able to draw cash advances under its existing bank facilities which principally comprise the following main sources of long-term debt funding:
i) the external bank revolving syndicated credit facilities totalling £1,060m (2009: £910m) plus bonding and letter of credit facilities totalling £90m (2009: £40m) which all mature in June 2012 except for a £40m bonding and letter of credit facility in September 2011. From these facilities, £166m has been utilised for letter of credit purposes at 30 September 2010 (2009: £144m);
ii) a £350m convertible bond (due 2014) issued on 1 October 2009 and settled on 5 October 2009; and
iii) a £400m convertible bond (due 2017) issued on 22 April 2010 and settled on 27 April 2010.
The external bank revolving credit facility is used to manage the seasonality of the Group’s cash flows and liquidity. Cash positions, liquidity and available facility headroom are monitored daily by the Group Treasury Department.
In addition to the above facilities a further £30m bonding and letter of credit facility which mature in June 2012 was signed on 15 October 2010.
The Board remains satisfied with the Group’s funding and liquidity position. Fixed charges cover and the ratio of net debt to EBITDA, which the Board believes to be the most useful measures of cash generation and gearing, as well as being the main basis for covenants in our external credit facilities, were met at the year end and throughout the year. Fixed charges cover is defined as earnings before interest, tax, depreciation, amortisation and operating lease rentals charge (EBITDAR) divided by net interest plus operating lease rentals. EBITDA is defined as earnings before interest, tax, depreciation and amortisation. Both covenants are measured on an ‘underlying basis’ as defined in Note 1(B)(iv).

www.tuitravelplc.com
Group at a glance
Strategic overviewB
usiness performance
Governance
Financial statements
Shareholder information
TUI Travel PLC Annual Report & Accounts 2010 121
In respect of the delivery of new aircraft, the Group’s established strategy is to refinance new aircraft in advance of their delivery dates and therefore the Group does not forecast to use internal cash resources for new aircraft purchases. Details of aircraft purchase commitments at the year end are given in Note 28.
The following are the undiscounted contractual cash flows of financial liabilities, including interest payments calculated using interest rates in force at each balance sheet date:
Carrying Contractual Within Between Between More than amount cash flows 1 year 1 and 2 years 2 and 5 years 5 years30 September 2010 £m £m £m £m £m £m
Non-derivative financial liabilitiesConvertible bonds 633 982 41 41 461 439 Shareholder loan 575 580 580 – – – Secured bank loans 24 26 10 2 14 – Unsecured bank loans 12 13 9 2 2 – Finance leases 269 311 154 21 71 65Loan notes 2 3 2 1 – – Other financial liabilities 38 38 38 – – – Trade and other payables 2,678 2,678 2,630 48 – – Derivative financial liabilitiesContracts used for hedging 145 146 119 27 – –
Total 4,376 4,777 3,583 142 548 504
Carrying Contractual Within Between Between More than amount cash flows 1 year 1 and 2 years 2 and 5 years 5 years30 September 2009 (restated) £m £m £m £m £m £m
Non-derivative financial liabilitiesShareholder loan 840 865 249 616 – – Secured bank loans 29 31 6 10 15 – Unsecured bank loans 22 27 15 3 6 3 Finance leases 192 206 33 147 23 3Loan notes 6 7 5 1 1 –Other financial liabilities 39 39 39 – – –Trade and other payables 2,889 2,889 2,858 31 – – Derivative financial liabilitiesContracts used for hedging 302 348 307 38 3 –
Total 4,319 4,412 3,512 846 48 6
Trade payables as at 30 September 2009 have been increased by £58m following the restatement disclosed in Note 1(B)(ii).
The actual repayment of revolving credit facilities will vary. The timing reflected in the tables is based on the first date that the Group can be required to settle the liability.
Trade and other payables exclude customers’ monies received in advance, deferred income, contingent consideration and other non-contractual payables.
At 30 September 2010 the Group had available undrawn committed borrowing facilities of £984m (2009: £806m), comprising letters of credit, guarantees and revolving, floating rate credit facilities for cash borrowings. Any non-compliance with covenants underlying the Group’s financing arrangements could, if not waived, constitute an event of default with respect to any such arrangements. The Group was in full compliance with its financial covenants throughout each of the periods presented.
Undrawn facilities throughout all years presented are analysed as follows:
30 September 30 September 2010 2009 £m £m
Expiring:Within one year 1 40 In more than one year but less than five years 983 766
Total 984 806
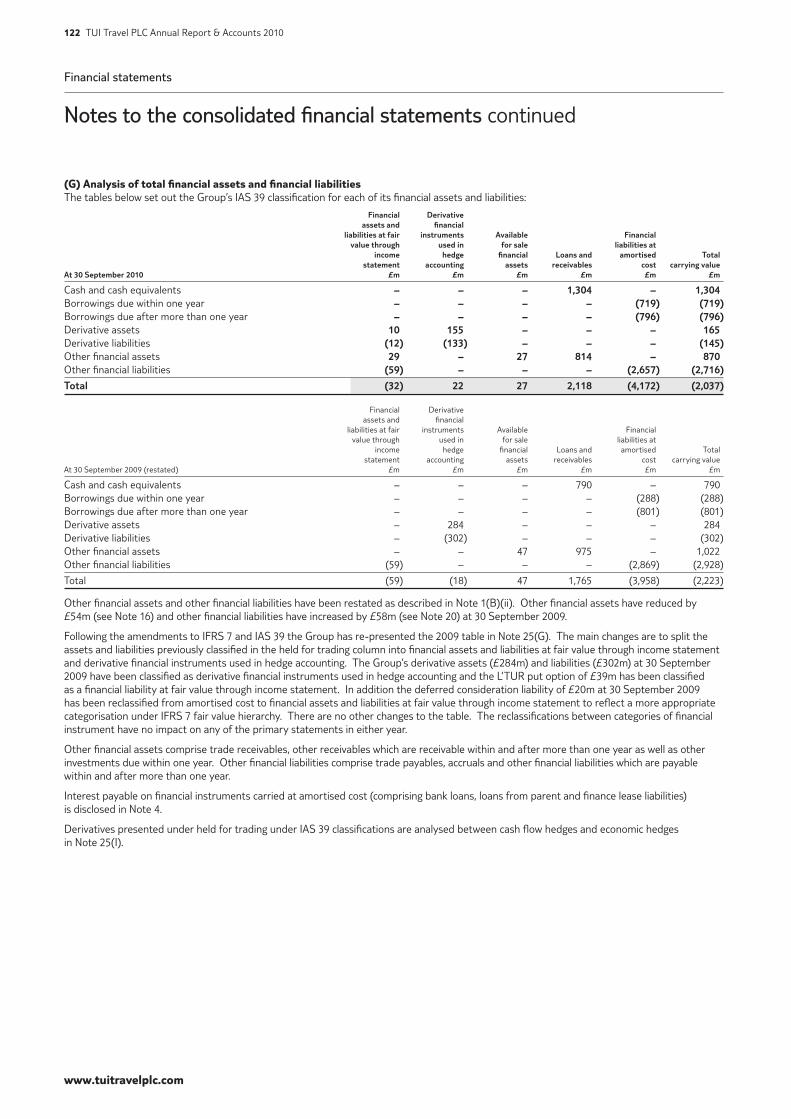
Financial statements
Notes to the consolidated financial statements continued
www.tuitravelplc.com
122 TUI Travel PLC Annual Report & Accounts 2010
(G) Analysis of total financial assets and financial liabilitiesThe tables below set out the Group’s IAS 39 classification for each of its financial assets and liabilities:
Financial Derivative assets and financial liabilities at fair instruments Available Financial value through used in for sale liabilities at income hedge financial Loans and amortised Total statement accounting assets receivables cost carrying valueAt 30 September 2010 £m £m £m £m £m £m
Cash and cash equivalents – – – 1,304 – 1,304 Borrowings due within one year – – – – (719) (719)Borrowings due after more than one year – – – – (796) (796)Derivative assets 10 155 – – – 165 Derivative liabilities (12) (133) – – – (145)Other financial assets 29 – 27 814 – 870 Other financial liabilities (59) – – – (2,657) (2,716)
Total (32) 22 27 2,118 (4,172) (2,037)
Financial Derivative assets and financial liabilities at fair instruments Available Financial value through used in for sale liabilities at income hedge financial Loans and amortised Total statement accounting assets receivables cost carrying valueAt 30 September 2009 (restated) £m £m £m £m £m £m
Cash and cash equivalents – – – 790 – 790 Borrowings due within one year – – – – (288) (288)Borrowings due after more than one year – – – – (801) (801)Derivative assets – 284 – – – 284 Derivative liabilities – (302) – – – (302)Other financial assets – – 47 975 – 1,022 Other financial liabilities (59) – – – (2,869) (2,928)
Total (59) (18) 47 1,765 (3,958) (2,223)
Other financial assets and other financial liabilities have been restated as described in Note 1(B)(ii). Other financial assets have reduced by £54m (see Note 16) and other financial liabilities have increased by £58m (see Note 20) at 30 September 2009.
Following the amendments to IFRS 7 and IAS 39 the Group has re-presented the 2009 table in Note 25(G). The main changes are to split the assets and liabilities previously classified in the held for trading column into financial assets and liabilities at fair value through income statement and derivative financial instruments used in hedge accounting. The Group’s derivative assets (£284m) and liabilities (£302m) at 30 September 2009 have been classified as derivative financial instruments used in hedge accounting and the L’TUR put option of £39m has been classified as a financial liability at fair value through income statement. In addition the deferred consideration liability of £20m at 30 September 2009 has been reclassified from amortised cost to financial assets and liabilities at fair value through income statement to reflect a more appropriate categorisation under IFRS 7 fair value hierarchy. There are no other changes to the table. The reclassifications between categories of financial instrument have no impact on any of the primary statements in either year.
Other financial assets comprise trade receivables, other receivables which are receivable within and after more than one year as well as other investments due within one year. Other financial liabilities comprise trade payables, accruals and other financial liabilities which are payable within and after more than one year.
Interest payable on financial instruments carried at amortised cost (comprising bank loans, loans from parent and finance lease liabilities) is disclosed in Note 4.
Derivatives presented under held for trading under IAS 39 classifications are analysed between cash flow hedges and economic hedges in Note 25(I).
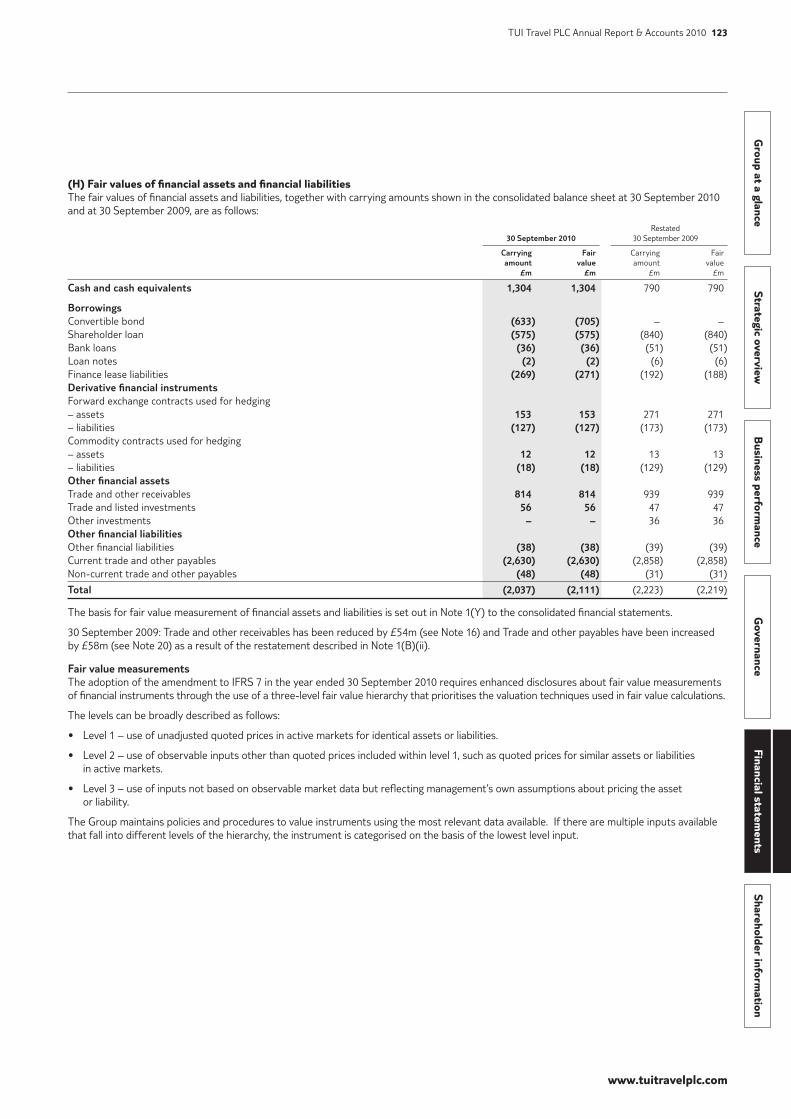
www.tuitravelplc.com
Group at a glance
Strategic overviewB
usiness performance
Governance
Financial statements
Shareholder information
TUI Travel PLC Annual Report & Accounts 2010 123
(H) Fair values of financial assets and financial liabilities The fair values of financial assets and liabilities, together with carrying amounts shown in the consolidated balance sheet at 30 September 2010 and at 30 September 2009, are as follows:
Restated 30 September 2010 30 September 2009 Carrying Fair Carrying Fair amount value amount value £m £m £m £m
Cash and cash equivalents 1,304 1,304 790 790
BorrowingsConvertible bond (633) (705) – – Shareholder loan (575) (575) (840) (840)Bank loans (36) (36) (51) (51)Loan notes (2) (2) (6) (6)Finance lease liabilities (269) (271) (192) (188)Derivative financial instrumentsForward exchange contracts used for hedging– assets 153 153 271 271 – liabilities (127) (127) (173) (173)Commodity contracts used for hedging– assets 12 12 13 13 – liabilities (18) (18) (129) (129)Other financial assetsTrade and other receivables 814 814 939 939 Trade and listed investments 56 56 47 47 Other investments – – 36 36 Other financial liabilitiesOther financial liabilities (38) (38) (39) (39)Current trade and other payables (2,630) (2,630) (2,858) (2,858)Non-current trade and other payables (48) (48) (31) (31)
Total (2,037) (2,111) (2,223) (2,219)
The basis for fair value measurement of financial assets and liabilities is set out in Note 1(Y) to the consolidated financial statements.
30 September 2009: Trade and other receivables has been reduced by £54m (see Note 16) and Trade and other payables have been increased by £58m (see Note 20) as a result of the restatement described in Note 1(B)(ii).
Fair value measurementsThe adoption of the amendment to IFRS 7 in the year ended 30 September 2010 requires enhanced disclosures about fair value measurements of financial instruments through the use of a three-level fair value hierarchy that prioritises the valuation techniques used in fair value calculations.
The levels can be broadly described as follows:
• Level 1 – use of unadjusted quoted prices in active markets for identical assets or liabilities.
• Level 2 – use of observable inputs other than quoted prices included within level 1, such as quoted prices for similar assets or liabilities in active markets.
• Level 3 – use of inputs not based on observable market data but reflecting management’s own assumptions about pricing the asset or liability.
The Group maintains policies and procedures to value instruments using the most relevant data available. If there are multiple inputs available that fall into different levels of the hierarchy, the instrument is categorised on the basis of the lowest level input.
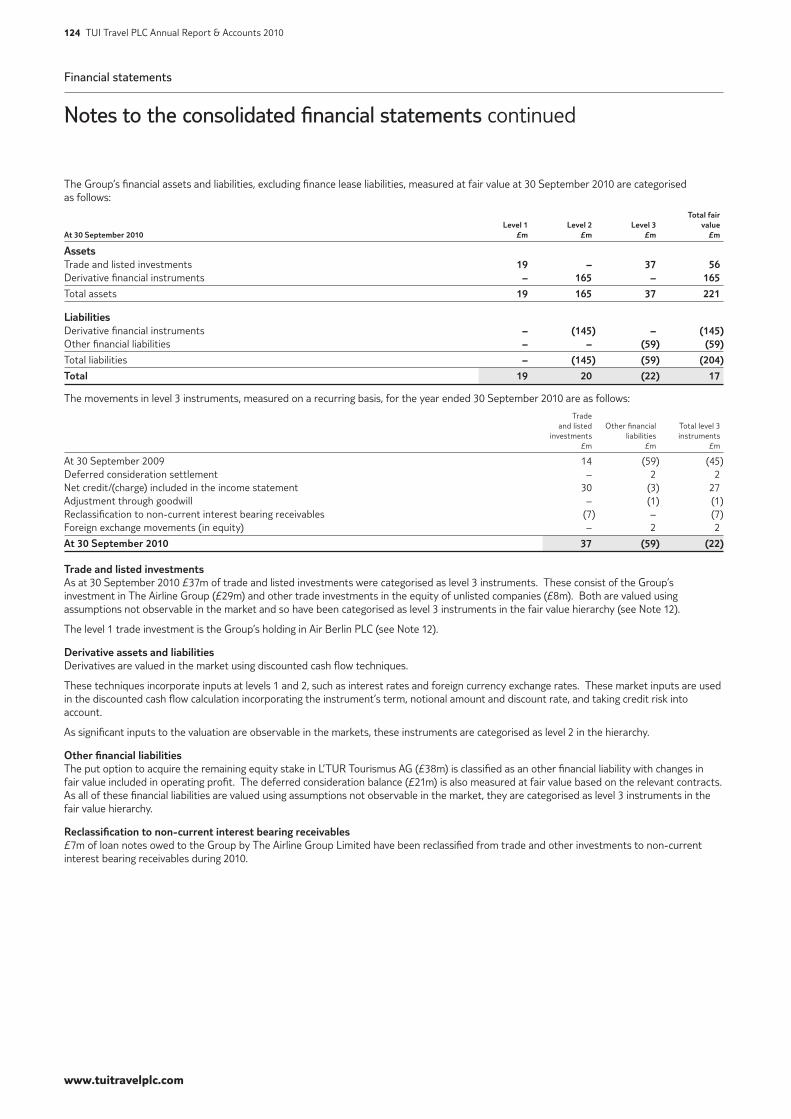
Financial statements
Notes to the consolidated financial statements continued
www.tuitravelplc.com
124 TUI Travel PLC Annual Report & Accounts 2010
The Group’s financial assets and liabilities, excluding finance lease liabilities, measured at fair value at 30 September 2010 are categorised as follows:
Total fair Level 1 Level 2 Level 3 value At 30 September 2010 £m £m £m £m
AssetsTrade and listed investments 19 – 37 56 Derivative financial instruments – 165 – 165
Total assets 19 165 37 221
LiabilitiesDerivative financial instruments – (145) – (145)Other financial liabilities – – (59) (59)
Total liabilities – (145) (59) (204)
Total 19 20 (22) 17
The movements in level 3 instruments, measured on a recurring basis, for the year ended 30 September 2010 are as follows:
Trade and listed Other financial Total level 3 investments liabilities instruments £m £m £m
At 30 September 2009 14 (59) (45)Deferred consideration settlement – 2 2 Net credit/(charge) included in the income statement 30 (3) 27 Adjustment through goodwill – (1) (1)Reclassification to non-current interest bearing receivables (7) – (7)Foreign exchange movements (in equity) – 2 2
At 30 September 2010 37 (59) (22)
Trade and listed investmentsAs at 30 September 2010 £37m of trade and listed investments were categorised as level 3 instruments. These consist of the Group’s investment in The Airline Group (£29m) and other trade investments in the equity of unlisted companies (£8m). Both are valued using assumptions not observable in the market and so have been categorised as level 3 instruments in the fair value hierarchy (see Note 12).
The level 1 trade investment is the Group’s holding in Air Berlin PLC (see Note 12).
Derivative assets and liabilitiesDerivatives are valued in the market using discounted cash flow techniques.
These techniques incorporate inputs at levels 1 and 2, such as interest rates and foreign currency exchange rates. These market inputs are used in the discounted cash flow calculation incorporating the instrument’s term, notional amount and discount rate, and taking credit risk into account.
As significant inputs to the valuation are observable in the markets, these instruments are categorised as level 2 in the hierarchy.
Other financial liabilitiesThe put option to acquire the remaining equity stake in L’TUR Tourismus AG (£38m) is classified as an other financial liability with changes in fair value included in operating profit. The deferred consideration balance (£21m) is also measured at fair value based on the relevant contracts. As all of these financial liabilities are valued using assumptions not observable in the market, they are categorised as level 3 instruments in the fair value hierarchy.
Reclassification to non-current interest bearing receivables£7m of loan notes owed to the Group by The Airline Group Limited have been reclassified from trade and other investments to non-current interest bearing receivables during 2010.
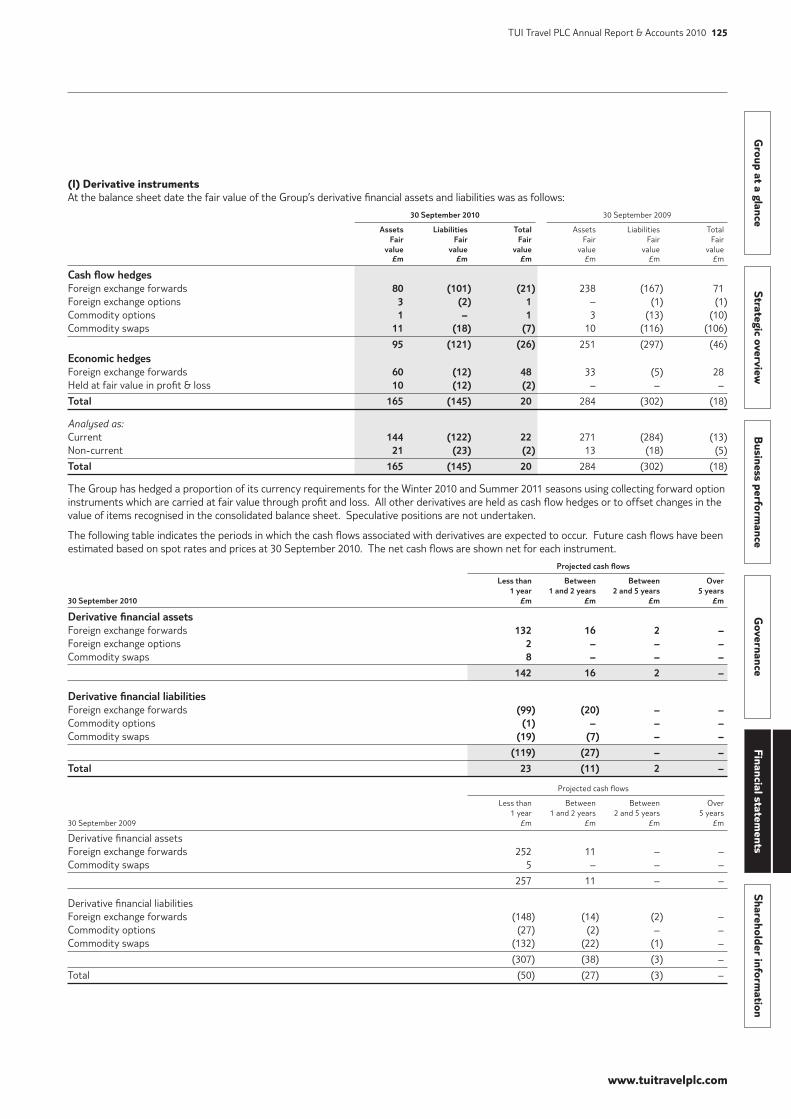
www.tuitravelplc.com
Group at a glance
Strategic overviewB
usiness performance
Governance
Financial statements
Shareholder information
TUI Travel PLC Annual Report & Accounts 2010 125
(I) Derivative instrumentsAt the balance sheet date the fair value of the Group’s derivative financial assets and liabilities was as follows:
30 September 2010 30 September 2009 Assets Liabilities Total Assets Liabilities Total Fair Fair Fair Fair Fair Fair value value value value value value £m £m £m £m £m £m
Cash flow hedgesForeign exchange forwards 80 (101) (21) 238 (167) 71 Foreign exchange options 3 (2) 1 – (1) (1)Commodity options 1 – 1 3 (13) (10)Commodity swaps 11 (18) (7) 10 (116) (106)
95 (121) (26) 251 (297) (46)Economic hedges Foreign exchange forwards 60 (12) 48 33 (5) 28 Held at fair value in profit & loss 10 (12) (2) – – –
Total 165 (145) 20 284 (302) (18)
Analysed as:Current 144 (122) 22 271 (284) (13)Non-current 21 (23) (2) 13 (18) (5)
Total 165 (145) 20 284 (302) (18)
The Group has hedged a proportion of its currency requirements for the Winter 2010 and Summer 2011 seasons using collecting forward option instruments which are carried at fair value through profit and loss. All other derivatives are held as cash flow hedges or to offset changes in the value of items recognised in the consolidated balance sheet. Speculative positions are not undertaken.
The following table indicates the periods in which the cash flows associated with derivatives are expected to occur. Future cash flows have been estimated based on spot rates and prices at 30 September 2010. The net cash flows are shown net for each instrument.
Projected cash flows Less than Between Between Over 1 year 1 and 2 years 2 and 5 years 5 years 30 September 2010 £m £m £m £m
Derivative financial assetsForeign exchange forwards 132 16 2 – Foreign exchange options 2 – – – Commodity swaps 8 – – –
142 16 2 –
Derivative financial liabilitiesForeign exchange forwards (99) (20) – – Commodity options (1) – – – Commodity swaps (19) (7) – –
(119) (27) – –
Total 23 (11) 2 –
Projected cash flows Less than Between Between Over 1 year 1 and 2 years 2 and 5 years 5 years 30 September 2009 £m £m £m £m
Derivative financial assetsForeign exchange forwards 252 11 – – Commodity swaps 5 – – –
257 11 – –
Derivative financial liabilitiesForeign exchange forwards (148) (14) (2) – Commodity options (27) (2) – – Commodity swaps (132) (22) (1) –
(307) (38) (3) –
Total (50) (27) (3) –
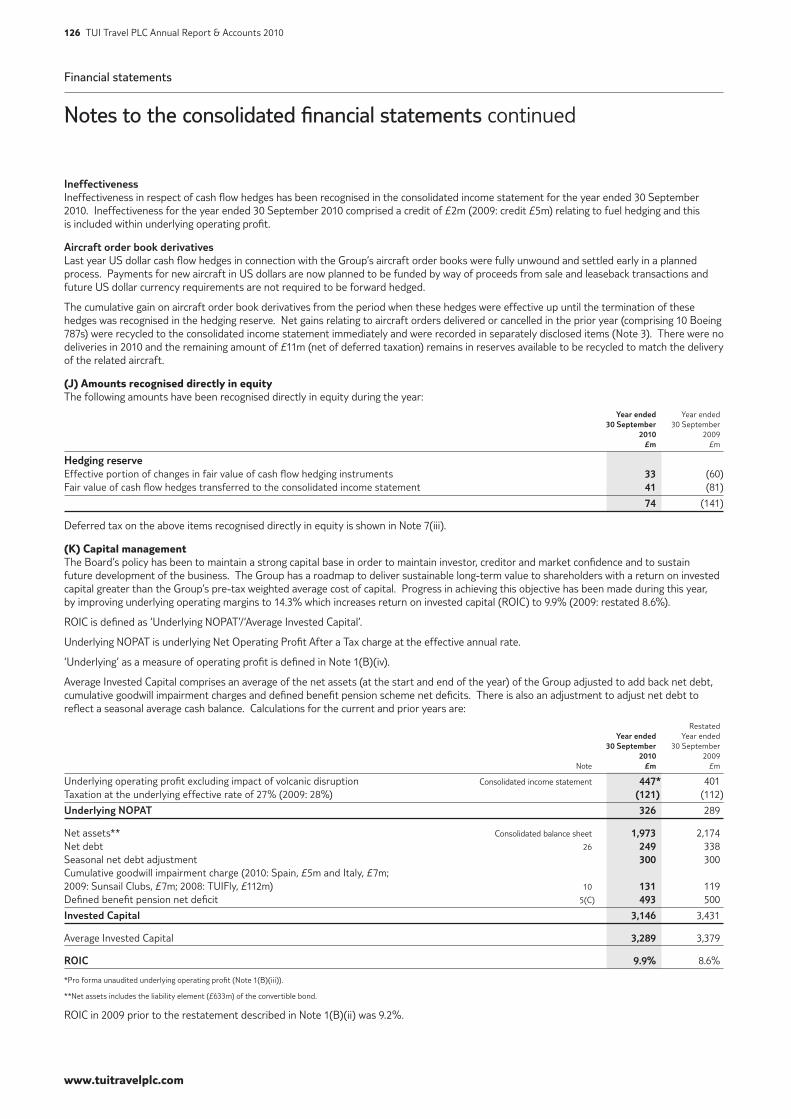
Financial statements
Notes to the consolidated financial statements continued
www.tuitravelplc.com
126 TUI Travel PLC Annual Report & Accounts 2010
Ineffectiveness Ineffectiveness in respect of cash flow hedges has been recognised in the consolidated income statement for the year ended 30 September 2010. Ineffectiveness for the year ended 30 September 2010 comprised a credit of £2m (2009: credit £5m) relating to fuel hedging and this is included within underlying operating profit.
Aircraft order book derivativesLast year US dollar cash flow hedges in connection with the Group’s aircraft order books were fully unwound and settled early in a planned process. Payments for new aircraft in US dollars are now planned to be funded by way of proceeds from sale and leaseback transactions and future US dollar currency requirements are not required to be forward hedged.
The cumulative gain on aircraft order book derivatives from the period when these hedges were effective up until the termination of these hedges was recognised in the hedging reserve. Net gains relating to aircraft orders delivered or cancelled in the prior year (comprising 10 Boeing 787s) were recycled to the consolidated income statement immediately and were recorded in separately disclosed items (Note 3). There were no deliveries in 2010 and the remaining amount of £11m (net of deferred taxation) remains in reserves available to be recycled to match the delivery of the related aircraft.
(J) Amounts recognised directly in equityThe following amounts have been recognised directly in equity during the year:
Year ended Year ended 30 September 30 September 2010 2009 £m £m
Hedging reserveEffective portion of changes in fair value of cash flow hedging instruments 33 (60)Fair value of cash flow hedges transferred to the consolidated income statement 41 (81)
74 (141)
Deferred tax on the above items recognised directly in equity is shown in Note 7(iii).
(K) Capital managementThe Board’s policy has been to maintain a strong capital base in order to maintain investor, creditor and market confidence and to sustain future development of the business. The Group has a roadmap to deliver sustainable long-term value to shareholders with a return on invested capital greater than the Group’s pre-tax weighted average cost of capital. Progress in achieving this objective has been made during this year, by improving underlying operating margins to 14.3% which increases return on invested capital (ROIC) to 9.9% (2009: restated 8.6%).
ROIC is defined as ‘Underlying NOPAT’/‘Average Invested Capital’.
Underlying NOPAT is underlying Net Operating Profit After a Tax charge at the effective annual rate.
‘Underlying’ as a measure of operating profit is defined in Note 1(B)(iv).
Average Invested Capital comprises an average of the net assets (at the start and end of the year) of the Group adjusted to add back net debt, cumulative goodwill impairment charges and defined benefit pension scheme net deficits. There is also an adjustment to adjust net debt to reflect a seasonal average cash balance. Calculations for the current and prior years are:
Restated Year ended Year ended 30 September 30 September 2010 2009 Note £m £m
Underlying operating profit excluding impact of volcanic disruption Consolidated income statement 447* 401 Taxation at the underlying effective rate of 27% (2009: 28%) (121) (112)
Underlying NOPAT 326 289
Net assets** Consolidated balance sheet 1,973 2,174 Net debt 26 249 338 Seasonal net debt adjustment 300 300 Cumulative goodwill impairment charge (2010: Spain, £5m and Italy, £7m; 2009: Sunsail Clubs, £7m; 2008: TUIFly, £112m) 10 131 119 Defined benefit pension net deficit 5(C) 493 500
Invested Capital 3,146 3,431
Average Invested Capital 3,289 3,379
ROIC 9.9% 8.6%
*Pro forma unaudited underlying operating profit (Note 1(B)(iii)).
**Net assets includes the liability element (£633m) of the convertible bond.
ROIC in 2009 prior to the restatement described in Note 1(B)(ii) was 9.2%.
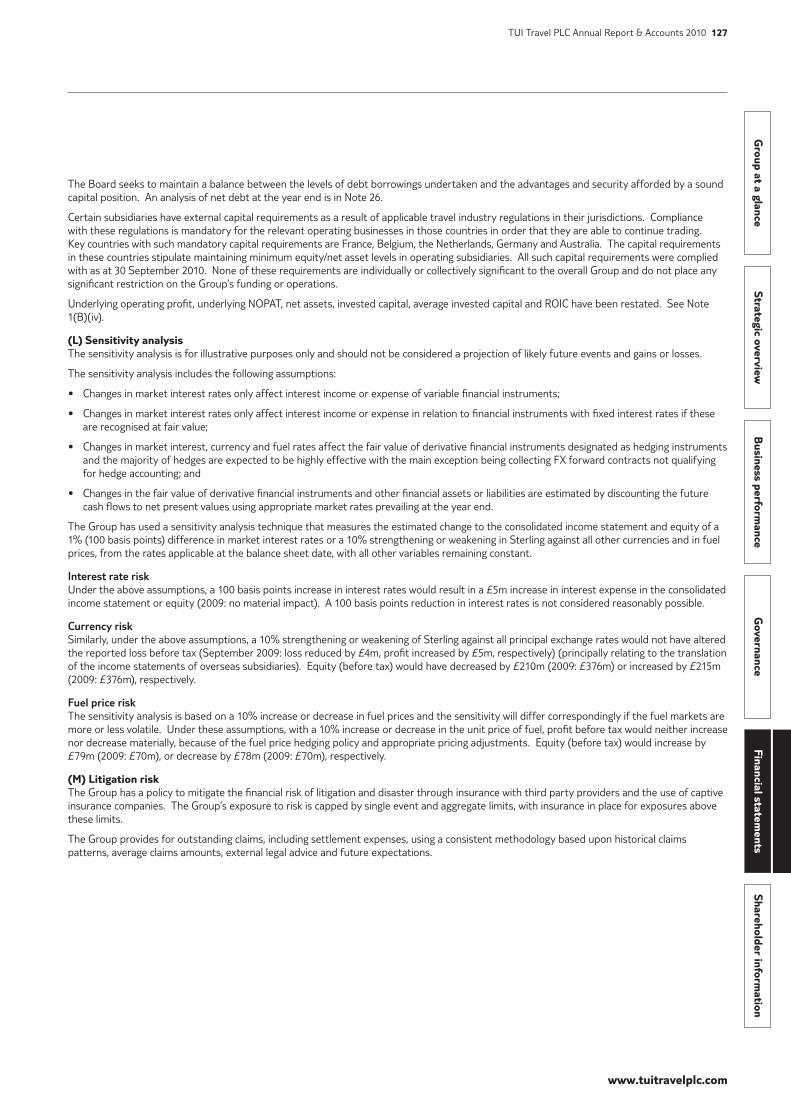
www.tuitravelplc.com
Group at a glance
Strategic overviewB
usiness performance
Governance
Financial statements
Shareholder information
TUI Travel PLC Annual Report & Accounts 2010 127
The Board seeks to maintain a balance between the levels of debt borrowings undertaken and the advantages and security afforded by a sound capital position. An analysis of net debt at the year end is in Note 26.
Certain subsidiaries have external capital requirements as a result of applicable travel industry regulations in their jurisdictions. Compliance with these regulations is mandatory for the relevant operating businesses in those countries in order that they are able to continue trading. Key countries with such mandatory capital requirements are France, Belgium, the Netherlands, Germany and Australia. The capital requirements in these countries stipulate maintaining minimum equity/net asset levels in operating subsidiaries. All such capital requirements were complied with as at 30 September 2010. None of these requirements are individually or collectively significant to the overall Group and do not place any significant restriction on the Group’s funding or operations.
Underlying operating profit, underlying NOPAT, net assets, invested capital, average invested capital and ROIC have been restated. See Note 1(B)(iv).
(L) Sensitivity analysisThe sensitivity analysis is for illustrative purposes only and should not be considered a projection of likely future events and gains or losses.
The sensitivity analysis includes the following assumptions:
• Changes in market interest rates only affect interest income or expense of variable financial instruments;
• Changes in market interest rates only affect interest income or expense in relation to financial instruments with fixed interest rates if these are recognised at fair value;
• Changes in market interest, currency and fuel rates affect the fair value of derivative financial instruments designated as hedging instruments and the majority of hedges are expected to be highly effective with the main exception being collecting FX forward contracts not qualifying for hedge accounting; and
• Changes in the fair value of derivative financial instruments and other financial assets or liabilities are estimated by discounting the future cash flows to net present values using appropriate market rates prevailing at the year end.
The Group has used a sensitivity analysis technique that measures the estimated change to the consolidated income statement and equity of a 1% (100 basis points) difference in market interest rates or a 10% strengthening or weakening in Sterling against all other currencies and in fuel prices, from the rates applicable at the balance sheet date, with all other variables remaining constant.
Interest rate riskUnder the above assumptions, a 100 basis points increase in interest rates would result in a £5m increase in interest expense in the consolidated income statement or equity (2009: no material impact). A 100 basis points reduction in interest rates is not considered reasonably possible.
Currency riskSimilarly, under the above assumptions, a 10% strengthening or weakening of Sterling against all principal exchange rates would not have altered the reported loss before tax (September 2009: loss reduced by £4m, profit increased by £5m, respectively) (principally relating to the translation of the income statements of overseas subsidiaries). Equity (before tax) would have decreased by £210m (2009: £376m) or increased by £215m (2009: £376m), respectively.
Fuel price riskThe sensitivity analysis is based on a 10% increase or decrease in fuel prices and the sensitivity will differ correspondingly if the fuel markets are more or less volatile. Under these assumptions, with a 10% increase or decrease in the unit price of fuel, profit before tax would neither increase nor decrease materially, because of the fuel price hedging policy and appropriate pricing adjustments. Equity (before tax) would increase by £79m (2009: £70m), or decrease by £78m (2009: £70m), respectively.
(M) Litigation riskThe Group has a policy to mitigate the financial risk of litigation and disaster through insurance with third party providers and the use of captive insurance companies. The Group’s exposure to risk is capped by single event and aggregate limits, with insurance in place for exposures above these limits.
The Group provides for outstanding claims, including settlement expenses, using a consistent methodology based upon historical claims patterns, average claims amounts, external legal advice and future expectations.
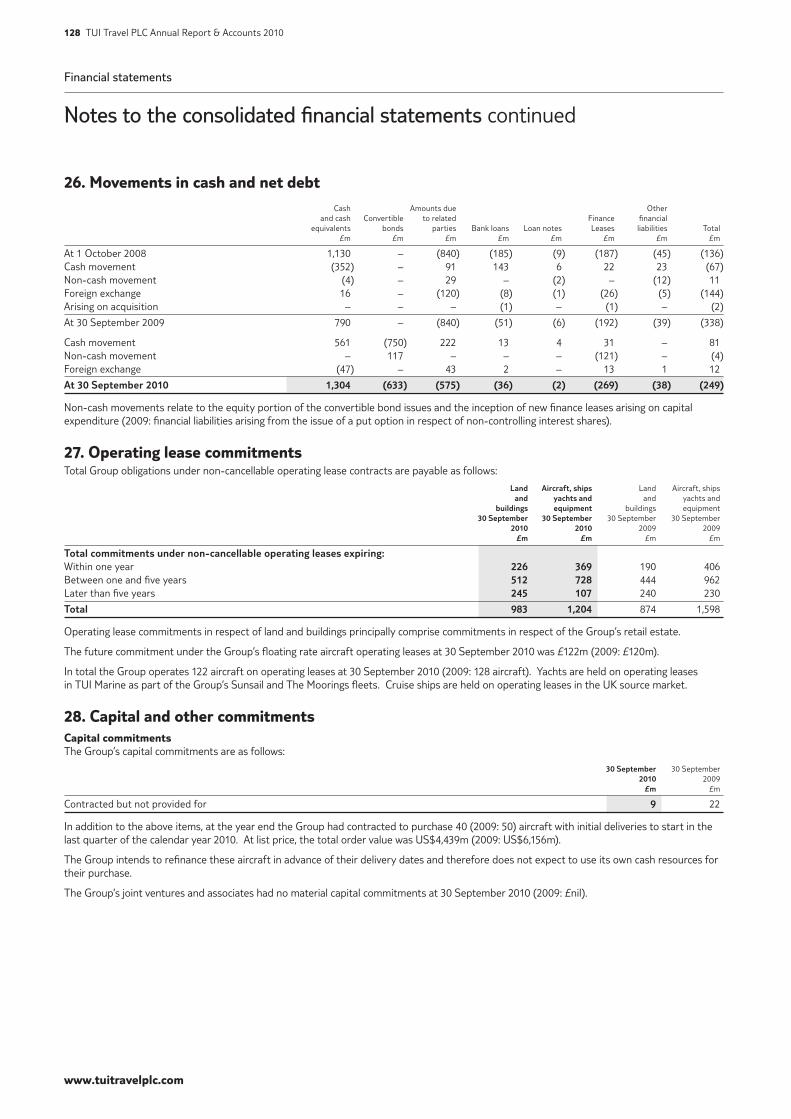
Financial statements
Notes to the consolidated financial statements continued
www.tuitravelplc.com
128 TUI Travel PLC Annual Report & Accounts 2010
26. Movements in cash and net debt Cash Amounts due Other and cash Convertible to related Finance financial equivalents bonds parties Bank loans Loan notes Leases liabilities Total £m £m £m £m £m £m £m £m
At 1 October 2008 1,130 – (840) (185) (9) (187) (45) (136)Cash movement (352) – 91 143 6 22 23 (67)Non-cash movement (4) – 29 – (2) – (12) 11 Foreign exchange 16 – (120) (8) (1) (26) (5) (144)Arising on acquisition – – – (1) – (1) – (2)
At 30 September 2009 790 – (840) (51) (6) (192) (39) (338)
Cash movement 561 (750) 222 13 4 31 – 81 Non-cash movement – 117 – – – (121) – (4)Foreign exchange (47) – 43 2 – 13 1 12
At 30 September 2010 1,304 (633) (575) (36) (2) (269) (38) (249)
Non-cash movements relate to the equity portion of the convertible bond issues and the inception of new finance leases arising on capital expenditure (2009: financial liabilities arising from the issue of a put option in respect of non-controlling interest shares).
27. Operating lease commitmentsTotal Group obligations under non-cancellable operating lease contracts are payable as follows:
Land Aircraft, ships Land Aircraft, ships and yachts and and yachts and buildings equipment buildings equipment 30 September 30 September 30 September 30 September 2010 2010 2009 2009 £m £m £m £m
Total commitments under non-cancellable operating leases expiring:Within one year 226 369 190 406 Between one and five years 512 728 444 962 Later than five years 245 107 240 230
Total 983 1,204 874 1,598
Operating lease commitments in respect of land and buildings principally comprise commitments in respect of the Group’s retail estate.
The future commitment under the Group’s floating rate aircraft operating leases at 30 September 2010 was £122m (2009: £120m).
In total the Group operates 122 aircraft on operating leases at 30 September 2010 (2009: 128 aircraft). Yachts are held on operating leases in TUI Marine as part of the Group’s Sunsail and The Moorings fleets. Cruise ships are held on operating leases in the UK source market.
28. Capital and other commitmentsCapital commitmentsThe Group’s capital commitments are as follows:
30 September 30 September 2010 2009 £m £m
Contracted but not provided for 9 22
In addition to the above items, at the year end the Group had contracted to purchase 40 (2009: 50) aircraft with initial deliveries to start in the last quarter of the calendar year 2010. At list price, the total order value was US$4,439m (2009: US$6,156m).
The Group intends to refinance these aircraft in advance of their delivery dates and therefore does not expect to use its own cash resources for their purchase.
The Group’s joint ventures and associates had no material capital commitments at 30 September 2010 (2009: £nil).
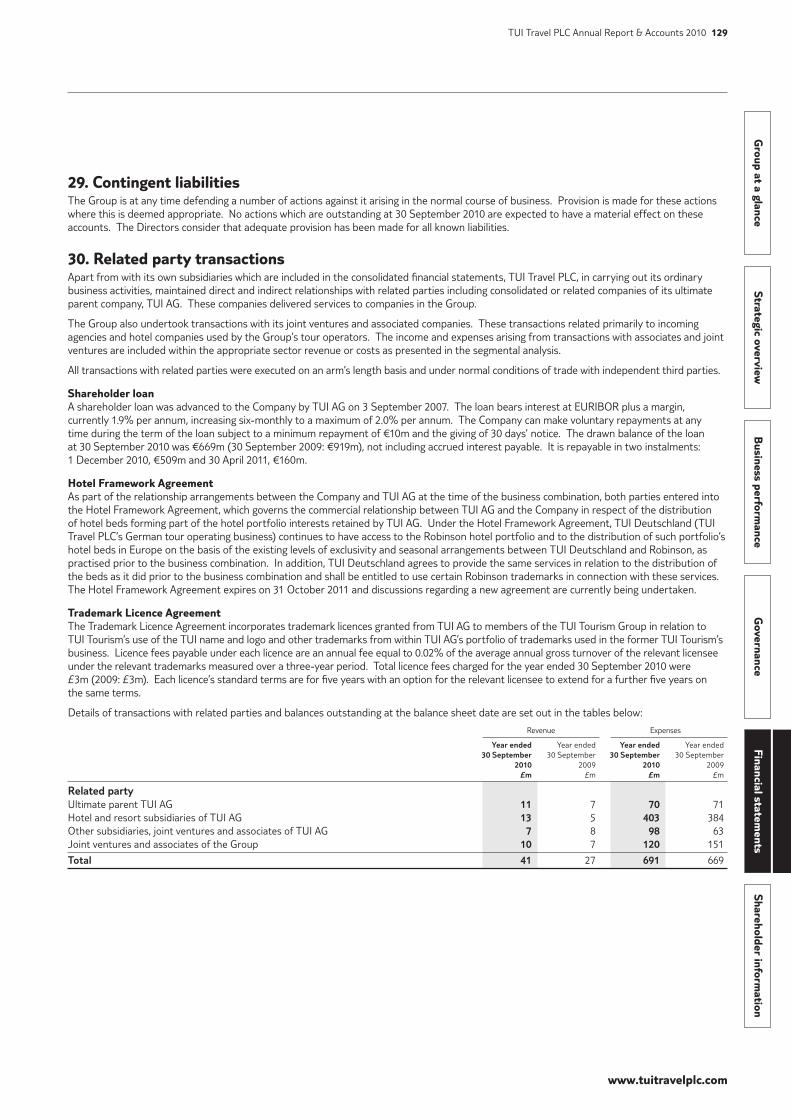
www.tuitravelplc.com
Group at a glance
Strategic overviewB
usiness performance
Governance
Financial statements
Shareholder information
TUI Travel PLC Annual Report & Accounts 2010 129
29. Contingent liabilitiesThe Group is at any time defending a number of actions against it arising in the normal course of business. Provision is made for these actions where this is deemed appropriate. No actions which are outstanding at 30 September 2010 are expected to have a material effect on these accounts. The Directors consider that adequate provision has been made for all known liabilities.
30. Related party transactionsApart from with its own subsidiaries which are included in the consolidated financial statements, TUI Travel PLC, in carrying out its ordinary business activities, maintained direct and indirect relationships with related parties including consolidated or related companies of its ultimate parent company, TUI AG. These companies delivered services to companies in the Group.
The Group also undertook transactions with its joint ventures and associated companies. These transactions related primarily to incoming agencies and hotel companies used by the Group’s tour operators. The income and expenses arising from transactions with associates and joint ventures are included within the appropriate sector revenue or costs as presented in the segmental analysis.
All transactions with related parties were executed on an arm’s length basis and under normal conditions of trade with independent third parties.
Shareholder loanA shareholder loan was advanced to the Company by TUI AG on 3 September 2007. The loan bears interest at EURIBOR plus a margin, currently 1.9% per annum, increasing six-monthly to a maximum of 2.0% per annum. The Company can make voluntary repayments at any time during the term of the loan subject to a minimum repayment of €10m and the giving of 30 days’ notice. The drawn balance of the loan at 30 September 2010 was €669m (30 September 2009: €919m), not including accrued interest payable. It is repayable in two instalments: 1 December 2010, €509m and 30 April 2011, €160m.
Hotel Framework AgreementAs part of the relationship arrangements between the Company and TUI AG at the time of the business combination, both parties entered into the Hotel Framework Agreement, which governs the commercial relationship between TUI AG and the Company in respect of the distribution of hotel beds forming part of the hotel portfolio interests retained by TUI AG. Under the Hotel Framework Agreement, TUI Deutschland (TUI Travel PLC’s German tour operating business) continues to have access to the Robinson hotel portfolio and to the distribution of such portfolio’s hotel beds in Europe on the basis of the existing levels of exclusivity and seasonal arrangements between TUI Deutschland and Robinson, as practised prior to the business combination. In addition, TUI Deutschland agrees to provide the same services in relation to the distribution of the beds as it did prior to the business combination and shall be entitled to use certain Robinson trademarks in connection with these services. The Hotel Framework Agreement expires on 31 October 2011 and discussions regarding a new agreement are currently being undertaken.
Trademark Licence AgreementThe Trademark Licence Agreement incorporates trademark licences granted from TUI AG to members of the TUI Tourism Group in relation to TUI Tourism’s use of the TUI name and logo and other trademarks from within TUI AG’s portfolio of trademarks used in the former TUI Tourism’s business. Licence fees payable under each licence are an annual fee equal to 0.02% of the average annual gross turnover of the relevant licensee under the relevant trademarks measured over a three-year period. Total licence fees charged for the year ended 30 September 2010 were £3m (2009: £3m). Each licence’s standard terms are for five years with an option for the relevant licensee to extend for a further five years on the same terms.
Details of transactions with related parties and balances outstanding at the balance sheet date are set out in the tables below:
Revenue Expenses Year ended Year ended Year ended Year ended 30 September 30 September 30 September 30 September 2010 2009 2010 2009 £m £m £m £m
Related partyUltimate parent TUI AG 11 7 70 71 Hotel and resort subsidiaries of TUI AG 13 5 403 384 Other subsidiaries, joint ventures and associates of TUI AG 7 8 98 63 Joint ventures and associates of the Group 10 7 120 151
Total 41 27 691 669
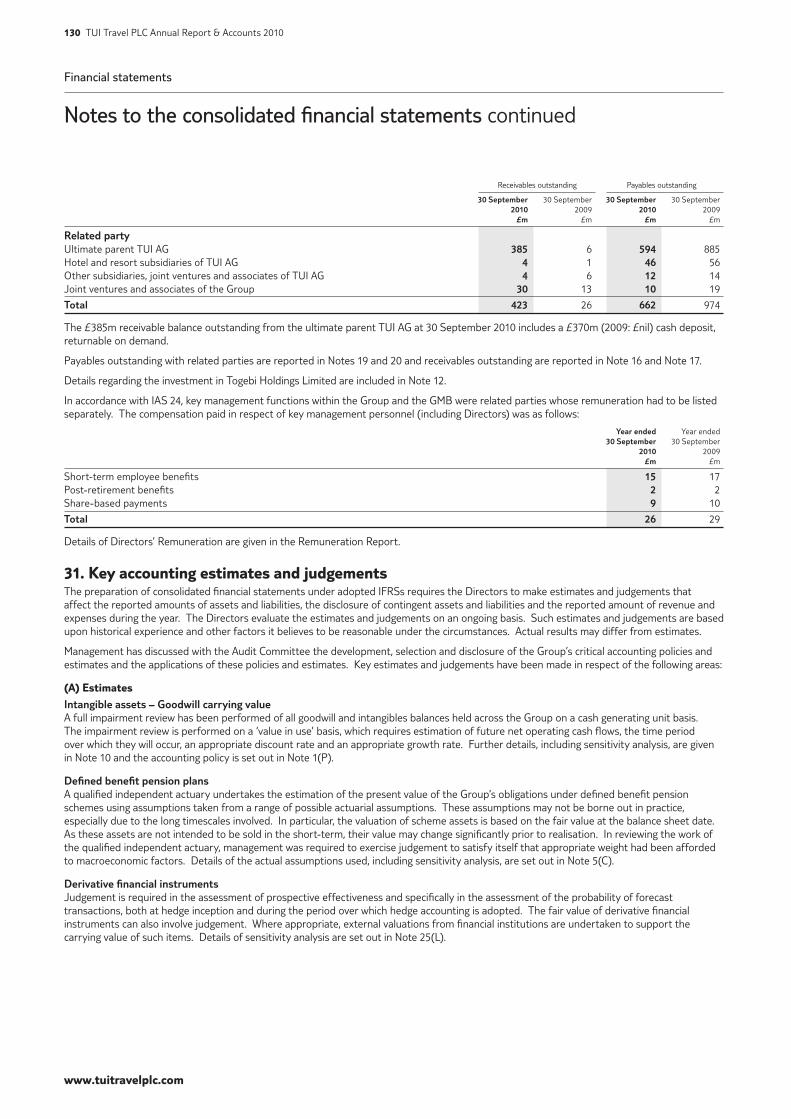
Financial statements
Notes to the consolidated financial statements continued
www.tuitravelplc.com
130 TUI Travel PLC Annual Report & Accounts 2010
Receivables outstanding Payables outstanding 30 September 30 September 30 September 30 September 2010 2009 2010 2009 £m £m £m £m
Related partyUltimate parent TUI AG 385 6 594 885 Hotel and resort subsidiaries of TUI AG 4 1 46 56 Other subsidiaries, joint ventures and associates of TUI AG 4 6 12 14 Joint ventures and associates of the Group 30 13 10 19
Total 423 26 662 974
The £385m receivable balance outstanding from the ultimate parent TUI AG at 30 September 2010 includes a £370m (2009: £nil) cash deposit, returnable on demand.
Payables outstanding with related parties are reported in Notes 19 and 20 and receivables outstanding are reported in Note 16 and Note 17.
Details regarding the investment in Togebi Holdings Limited are included in Note 12.
In accordance with IAS 24, key management functions within the Group and the GMB were related parties whose remuneration had to be listed separately. The compensation paid in respect of key management personnel (including Directors) was as follows:
Year ended Year ended 30 September 30 September 2010 2009 £m £m
Short-term employee benefits 15 17 Post-retirement benefits 2 2 Share-based payments 9 10
Total 26 29
Details of Directors’ Remuneration are given in the Remuneration Report.
31. Key accounting estimates and judgementsThe preparation of consolidated financial statements under adopted IFRSs requires the Directors to make estimates and judgements that affect the reported amounts of assets and liabilities, the disclosure of contingent assets and liabilities and the reported amount of revenue and expenses during the year. The Directors evaluate the estimates and judgements on an ongoing basis. Such estimates and judgements are based upon historical experience and other factors it believes to be reasonable under the circumstances. Actual results may differ from estimates.
Management has discussed with the Audit Committee the development, selection and disclosure of the Group’s critical accounting policies and estimates and the applications of these policies and estimates. Key estimates and judgements have been made in respect of the following areas:
(A) EstimatesIntangible assets – Goodwill carrying valueA full impairment review has been performed of all goodwill and intangibles balances held across the Group on a cash generating unit basis. The impairment review is performed on a ‘value in use’ basis, which requires estimation of future net operating cash flows, the time period over which they will occur, an appropriate discount rate and an appropriate growth rate. Further details, including sensitivity analysis, are given in Note 10 and the accounting policy is set out in Note 1(P).
Defined benefit pension plansA qualified independent actuary undertakes the estimation of the present value of the Group’s obligations under defined benefit pension schemes using assumptions taken from a range of possible actuarial assumptions. These assumptions may not be borne out in practice, especially due to the long timescales involved. In particular, the valuation of scheme assets is based on the fair value at the balance sheet date. As these assets are not intended to be sold in the short-term, their value may change significantly prior to realisation. In reviewing the work of the qualified independent actuary, management was required to exercise judgement to satisfy itself that appropriate weight had been afforded to macroeconomic factors. Details of the actual assumptions used, including sensitivity analysis, are set out in Note 5(C).
Derivative financial instrumentsJudgement is required in the assessment of prospective effectiveness and specifically in the assessment of the probability of forecast transactions, both at hedge inception and during the period over which hedge accounting is adopted. The fair value of derivative financial instruments can also involve judgement. Where appropriate, external valuations from financial institutions are undertaken to support the carrying value of such items. Details of sensitivity analysis are set out in Note 25(L).

www.tuitravelplc.com
Group at a glance
Strategic overviewB
usiness performance
Governance
Financial statements
Shareholder information
TUI Travel PLC Annual Report & Accounts 2010 131
(B) JudgementsSeparately disclosed itemsSeparately disclosed items are those significant items which in management’s judgement are highlighted by virtue of their size or incidence to enable a full understanding of the Group’s financial performance. Such items are included within the income statement caption to which they relate (Notes 3 and 4).
Other asset carrying valuesManagement performs an assessment at each balance sheet date of all material assets across the Group for signs of impairment. Key judgement areas include the carrying values of land and buildings, aircraft, ships, yachts and motorboats, trade receivables and prepaid accommodation. The recovery of these assets is dependent on estimated future cash flows receivable and the provision of future services or goods by third parties. Useful economic lives and residual values are subject to regular management review.
Business combinationsJudgement and estimation is required in the identification and valuation of separable assets and liabilities on acquisitions. In particular, judgement and estimation is required in the identification and valuation of separable intangible assets, being brands, orders books and customer databases, and determining appropriate useful economic lives for these assets. Judgement and estimation is also required in determining contingent consideration payable in respect of acquisitions. Details of acquisitions are set out in Note 13.
LiabilitiesIn accounting for provisions, judgement is required in determining occurrence probability, maturity and level of risk. Judgement and estimation is required in determining aircraft maintenance, restructuring and onerous lease provisions. Due to the volume of transactions and the materiality of period end accruals, judgement is also required in respect of the recognition and derecognition of airline and accommodation operating accruals. Details of provisions made and the basis on which the provision has been calculated is disclosed in Note 21 and the accounting policy is set out in Note 1(T).
Share-based paymentsJudgement and estimation is required in determining the fair value of shares at the date of award. The fair value is estimated using valuation techniques which take into account the awards’ term, the risk-free interest rate and the expected volatility of the market price of the Company’s shares. Details of share-based payments and the assumptions applied are disclosed in Note 5(D) and the accounting policy is set out in Note 1(Y)(ix).
Non-current assets and disposal groups held for saleThe classification of non-current assets and disposal groups as ‘held for sale’ requires judgement in determining whether the planned disposal is highly probable and able to be realised within 12 months. The measurement of held for sale assets at their fair value less costs to sell can also require significant judgement if there is no active market.
Lease accountingJudgement is required in the initial classification of leases as either operating leases or finance leases and, in respect of finance leases, determining the appropriate discount rate implicit in the lease to discount minimum lease payments. In respect of certain leases classified as finance leases, it has not been possible to reliably estimate lessors’ residual values and management has been required to independently estimate an appropriate discount rate. Judgement is also required in respect of the treatment of gains and losses arising on the sale and leaseback of assets. The accounting policy for leases is set out in Notes 1(G), 1(H) and 1(Q).
TaxationThe Group has, from time to time, contingent tax liabilities arising from trading and corporate transactions in the UK and overseas jurisdictions. After taking appropriate external advice, the Group makes provision for these liabilities based on the probable level of economic loss that may be incurred and which is reliably measurable. Judgement is also required in the assessment of the future recoverability of tax losses and recognition of deferred tax assets. Details of unrecognised tax losses are given in Note 14.
Recoverable amounts of deposits and prepaymentsJudgements have been made in respect of the volumes of future trading with hoteliers and the credit-worthiness of those hoteliers in order to assess the recoverable amounts of deposits and prepayments made to those hoteliers.
Fair value measurementsManagement has to make judgements regarding the valuation of some financial instruments that use inputs that are not observable in active markets. These are disclosed in Note 25(G).
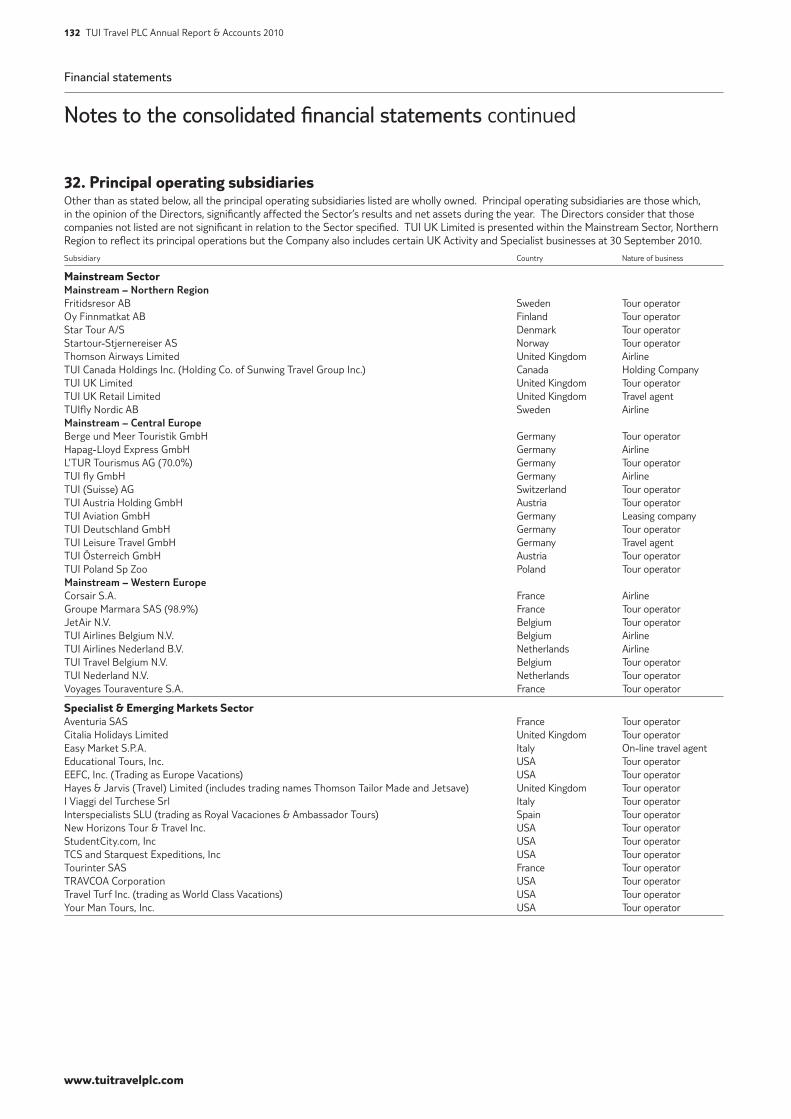
Financial statements
Notes to the consolidated financial statements continued
www.tuitravelplc.com
132 TUI Travel PLC Annual Report & Accounts 2010
32. Principal operating subsidiariesOther than as stated below, all the principal operating subsidiaries listed are wholly owned. Principal operating subsidiaries are those which, in the opinion of the Directors, significantly affected the Sector’s results and net assets during the year. The Directors consider that those companies not listed are not significant in relation to the Sector specified. TUI UK Limited is presented within the Mainstream Sector, Northern Region to reflect its principal operations but the Company also includes certain UK Activity and Specialist businesses at 30 September 2010.
Subsidiary Country Nature of business
Mainstream Sector Mainstream – Northern Region Fritidsresor AB Sweden Tour operatorOy Finnmatkat AB Finland Tour operator Star Tour A/S Denmark Tour operatorStartour-Stjernereiser AS Norway Tour operatorThomson Airways Limited United Kingdom AirlineTUI Canada Holdings Inc. (Holding Co. of Sunwing Travel Group Inc.) Canada Holding CompanyTUI UK Limited United Kingdom Tour operatorTUI UK Retail Limited United Kingdom Travel agentTUIfly Nordic AB Sweden AirlineMainstream – Central EuropeBerge und Meer Touristik GmbH Germany Tour operatorHapag-Lloyd Express GmbH Germany AirlineL’TUR Tourismus AG (70.0%) Germany Tour operatorTUI fly GmbH Germany AirlineTUI (Suisse) AG Switzerland Tour operatorTUI Austria Holding GmbH Austria Tour operatorTUI Aviation GmbH Germany Leasing companyTUI Deutschland GmbH Germany Tour operatorTUI Leisure Travel GmbH Germany Travel agentTUI Österreich GmbH Austria Tour operatorTUI Poland Sp Zoo Poland Tour operatorMainstream – Western EuropeCorsair S.A. France AirlineGroupe Marmara SAS (98.9%) France Tour operatorJetAir N.V. Belgium Tour operatorTUI Airlines Belgium N.V. Belgium AirlineTUI Airlines Nederland B.V. Netherlands AirlineTUI Travel Belgium N.V. Belgium Tour operatorTUI Nederland N.V. Netherlands Tour operatorVoyages Touraventure S.A. France Tour operator
Specialist & Emerging Markets SectorAventuria SAS France Tour operatorCitalia Holidays Limited United Kingdom Tour operatorEasy Market S.P.A. Italy On-line travel agentEducational Tours, Inc. USA Tour operatorEEFC, Inc. (Trading as Europe Vacations) USA Tour operator Hayes & Jarvis (Travel) Limited (includes trading names Thomson Tailor Made and Jetsave) United Kingdom Tour operator I Viaggi del Turchese Srl Italy Tour operatorInterspecialists SLU (trading as Royal Vacaciones & Ambassador Tours) Spain Tour operator New Horizons Tour & Travel Inc. USA Tour operatorStudentCity.com, Inc USA Tour operatorTCS and Starquest Expeditions, Inc USA Tour operatorTourinter SAS France Tour operatorTRAVCOA Corporation USA Tour operatorTravel Turf Inc. (trading as World Class Vacations) USA Tour operatorYour Man Tours, Inc. USA Tour operator
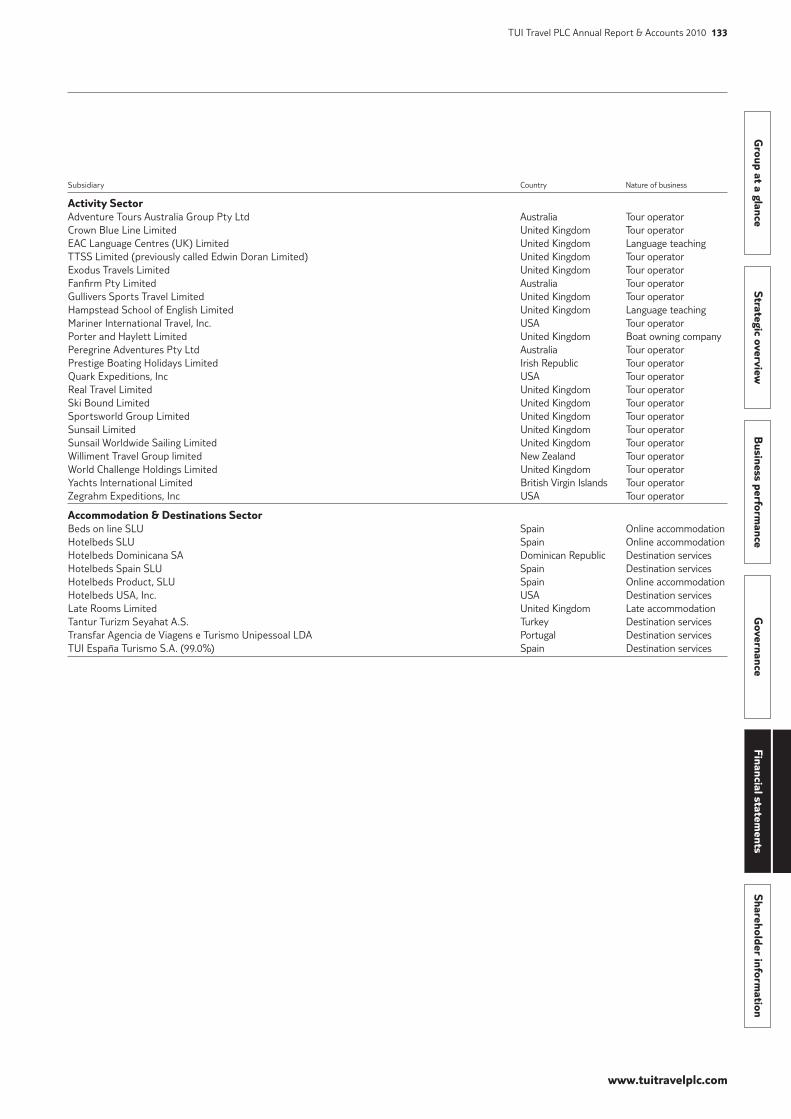
www.tuitravelplc.com
Group at a glance
Strategic overviewB
usiness performance
Governance
Financial statements
Shareholder information
TUI Travel PLC Annual Report & Accounts 2010 133
Subsidiary Country Nature of business
Activity SectorAdventure Tours Australia Group Pty Ltd Australia Tour operatorCrown Blue Line Limited United Kingdom Tour operatorEAC Language Centres (UK) Limited United Kingdom Language teachingTTSS Limited (previously called Edwin Doran Limited) United Kingdom Tour operatorExodus Travels Limited United Kingdom Tour operatorFanfirm Pty Limited Australia Tour operatorGullivers Sports Travel Limited United Kingdom Tour operatorHampstead School of English Limited United Kingdom Language teachingMariner International Travel, Inc. USA Tour operatorPorter and Haylett Limited United Kingdom Boat owning companyPeregrine Adventures Pty Ltd Australia Tour operatorPrestige Boating Holidays Limited Irish Republic Tour operatorQuark Expeditions, Inc USA Tour operatorReal Travel Limited United Kingdom Tour operatorSki Bound Limited United Kingdom Tour operatorSportsworld Group Limited United Kingdom Tour operatorSunsail Limited United Kingdom Tour operatorSunsail Worldwide Sailing Limited United Kingdom Tour operatorWilliment Travel Group limited New Zealand Tour operatorWorld Challenge Holdings Limited United Kingdom Tour operatorYachts International Limited British Virgin Islands Tour operatorZegrahm Expeditions, Inc USA Tour operator
Accommodation & Destinations SectorBeds on line SLU Spain Online accommodationHotelbeds SLU Spain Online accommodationHotelbeds Dominicana SA Dominican Republic Destination servicesHotelbeds Spain SLU Spain Destination servicesHotelbeds Product, SLU Spain Online accommodationHotelbeds USA, Inc. USA Destination servicesLate Rooms Limited United Kingdom Late accommodationTantur Turizm Seyahat A.S. Turkey Destination servicesTransfar Agencia de Viagens e Turismo Unipessoal LDA Portugal Destination servicesTUI España Turismo S.A. (99.0%) Spain Destination services
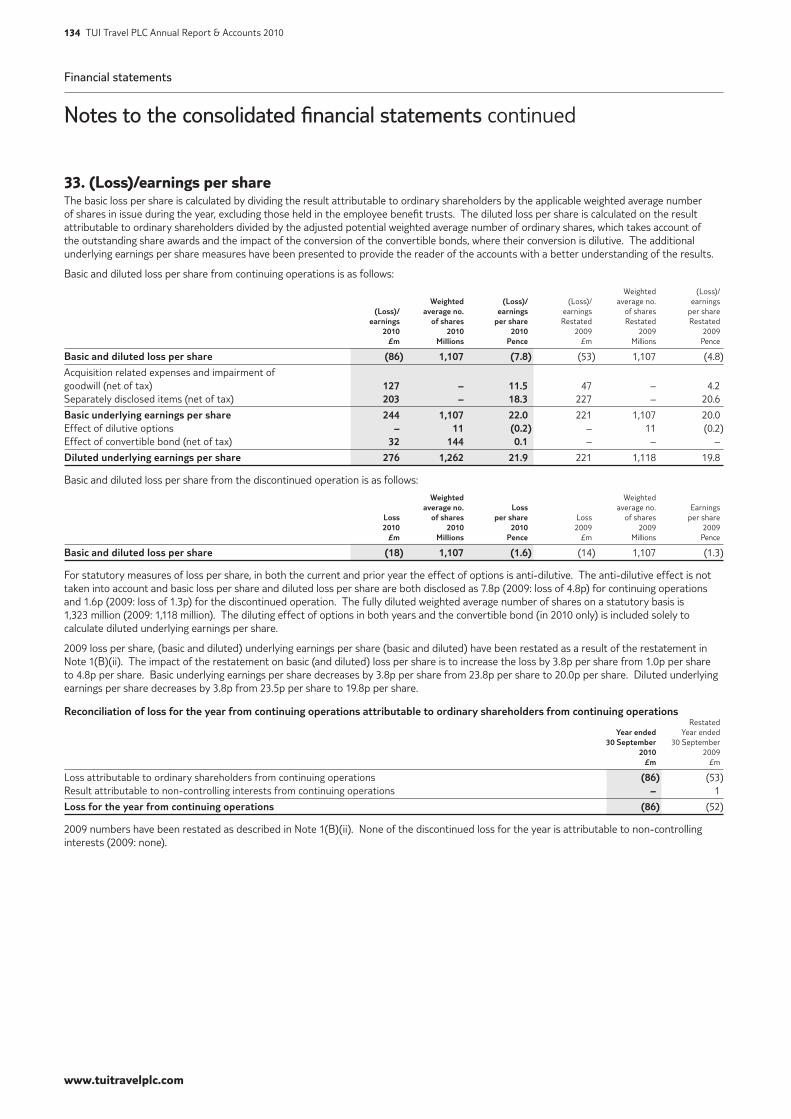
Financial statements
Notes to the consolidated financial statements continued
www.tuitravelplc.com
134 TUI Travel PLC Annual Report & Accounts 2010
33. (Loss)/earnings per share The basic loss per share is calculated by dividing the result attributable to ordinary shareholders by the applicable weighted average number of shares in issue during the year, excluding those held in the employee benefit trusts. The diluted loss per share is calculated on the result attributable to ordinary shareholders divided by the adjusted potential weighted average number of ordinary shares, which takes account of the outstanding share awards and the impact of the conversion of the convertible bonds, where their conversion is dilutive. The additional underlying earnings per share measures have been presented to provide the reader of the accounts with a better understanding of the results.
Basic and diluted loss per share from continuing operations is as follows:
Weighted (Loss)/ Weighted (Loss)/ (Loss)/ average no. earnings (Loss)/ average no. earnings earnings of shares per share earnings of shares per share Restated Restated Restated 2010 2010 2010 2009 2009 2009 £m Millions Pence £m Millions Pence
Basic and diluted loss per share (86) 1,107 (7.8) (53) 1,107 (4.8)
Acquisition related expenses and impairment of goodwill (net of tax) 127 – 11.5 47 – 4.2 Separately disclosed items (net of tax) 203 – 18.3 227 – 20.6
Basic underlying earnings per share 244 1,107 22.0 221 1,107 20.0 Effect of dilutive options – 11 (0.2) – 11 (0.2)Effect of convertible bond (net of tax) 32 144 0.1 – – –
Diluted underlying earnings per share 276 1,262 21.9 221 1,118 19.8
Basic and diluted loss per share from the discontinued operation is as follows:
Weighted Weighted average no. Loss average no. Earnings Loss of shares per share Loss of shares per share 2010 2010 2010 2009 2009 2009 £m Millions Pence £m Millions Pence
Basic and diluted loss per share (18) 1,107 (1.6) (14) 1,107 (1.3)
For statutory measures of loss per share, in both the current and prior year the effect of options is anti-dilutive. The anti-dilutive effect is not taken into account and basic loss per share and diluted loss per share are both disclosed as 7.8p (2009: loss of 4.8p) for continuing operations and 1.6p (2009: loss of 1.3p) for the discontinued operation. The fully diluted weighted average number of shares on a statutory basis is 1,323 million (2009: 1,118 million). The diluting effect of options in both years and the convertible bond (in 2010 only) is included solely to calculate diluted underlying earnings per share.
2009 loss per share, (basic and diluted) underlying earnings per share (basic and diluted) have been restated as a result of the restatement in Note 1(B)(ii). The impact of the restatement on basic (and diluted) loss per share is to increase the loss by 3.8p per share from 1.0p per share to 4.8p per share. Basic underlying earnings per share decreases by 3.8p per share from 23.8p per share to 20.0p per share. Diluted underlying earnings per share decreases by 3.8p from 23.5p per share to 19.8p per share.
Reconciliation of loss for the year from continuing operations attributable to ordinary shareholders from continuing operations Restated Year ended Year ended 30 September 30 September 2010 2009 £m £m
Loss attributable to ordinary shareholders from continuing operations (86) (53) Result attributable to non-controlling interests from continuing operations – 1
Loss for the year from continuing operations (86) (52)
2009 numbers have been restated as described in Note 1(B)(ii). None of the discontinued loss for the year is attributable to non-controlling interests (2009: none).
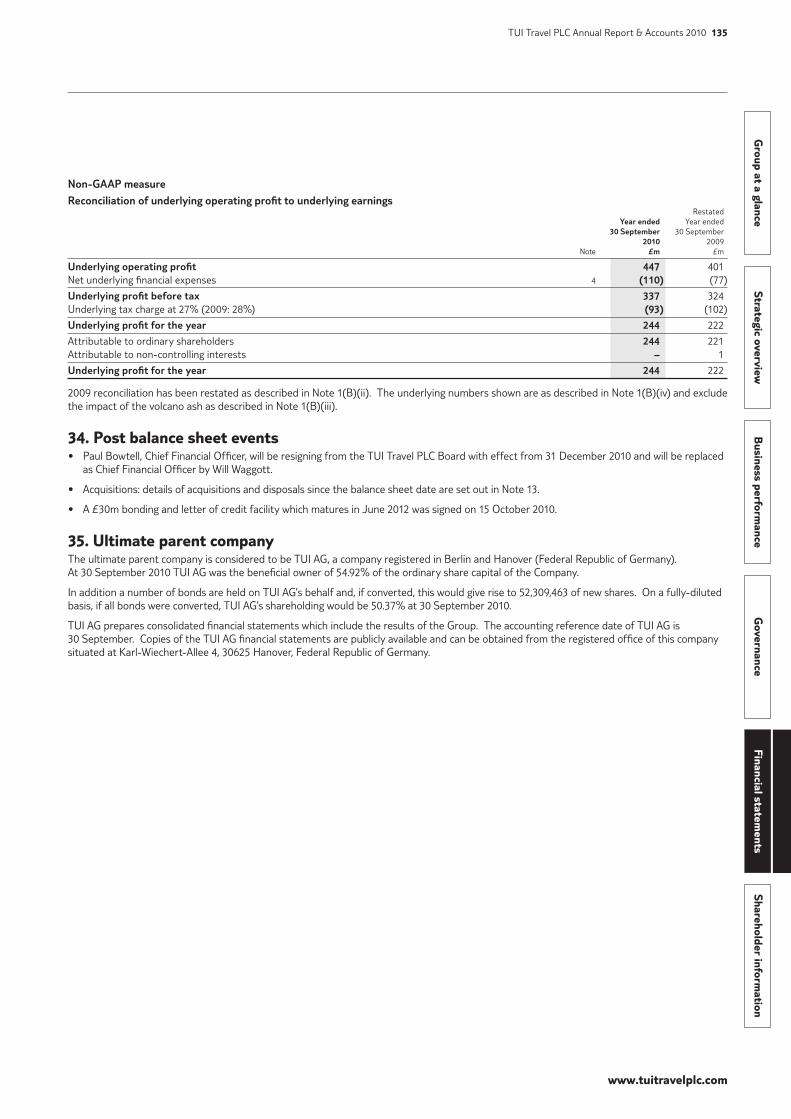
www.tuitravelplc.com
Group at a glance
Strategic overviewB
usiness performance
Governance
Financial statements
Shareholder information
TUI Travel PLC Annual Report & Accounts 2010 135
Non-GAAP measure
Reconciliation of underlying operating profit to underlying earnings Restated Year ended Year ended 30 September 30 September 2010 2009 Note £m £m
Underlying operating profit 447 401 Net underlying financial expenses 4 (110) (77)
Underlying profit before tax 337 324 Underlying tax charge at 27% (2009: 28%) (93) (102)
Underlying profit for the year 244 222
Attributable to ordinary shareholders 244 221Attributable to non-controlling interests – 1
Underlying profit for the year 244 222
2009 reconciliation has been restated as described in Note 1(B)(ii). The underlying numbers shown are as described in Note 1(B)(iv) and exclude the impact of the volcano ash as described in Note 1(B)(iii).
34. Post balance sheet events• Paul Bowtell, Chief Financial Officer, will be resigning from the TUI Travel PLC Board with effect from 31 December 2010 and will be replaced
as Chief Financial Officer by Will Waggott.
• Acquisitions: details of acquisitions and disposals since the balance sheet date are set out in Note 13.
• A £30m bonding and letter of credit facility which matures in June 2012 was signed on 15 October 2010.
35. Ultimate parent companyThe ultimate parent company is considered to be TUI AG, a company registered in Berlin and Hanover (Federal Republic of Germany). At 30 September 2010 TUI AG was the beneficial owner of 54.92% of the ordinary share capital of the Company.
In addition a number of bonds are held on TUI AG’s behalf and, if converted, this would give rise to 52,309,463 of new shares. On a fully-diluted basis, if all bonds were converted, TUI AG’s shareholding would be 50.37% at 30 September 2010.
TUI AG prepares consolidated financial statements which include the results of the Group. The accounting reference date of TUI AG is 30 September. Copies of the TUI AG financial statements are publicly available and can be obtained from the registered office of this company situated at Karl-Wiechert-Allee 4, 30625 Hanover, Federal Republic of Germany.

www.tuitravelplc.com
136 TUI Travel PLC Annual Report & Accounts 2010
Financial statements
Company balance sheetAt 30 September 2010
30 September 30 September 2010 2009 Note £m £m
Fixed assetsInvestment in subsidiary undertakings D 918 911
Total investments 918 911
Current assetsDerivative financial instruments 6 30 Debtors E 1,145 234 Cash at bank and in hand – 36
1,151 300 Creditors: amounts falling due within one year F (967) (311)
Net current assets/(liabilities) 184 (11)
Total assets less current liabilities 1,102 900 Creditors: amounts falling due after more than one year G (638) (631)Provision for liabilities and charges H (19) –
Net assets 445 269
Capital and reservesShare capital I 112 112 Profit and loss account J 227 127 Convertible bond reserve J 83 – Other reserves J 23 30
Equity shareholders’ funds 445 269
The financial statements were approved by a duly authorised Committee of the Board of Directors on 1 December 2010 and were signed on its behalf by:
Paul BowtellChief Financial Officer
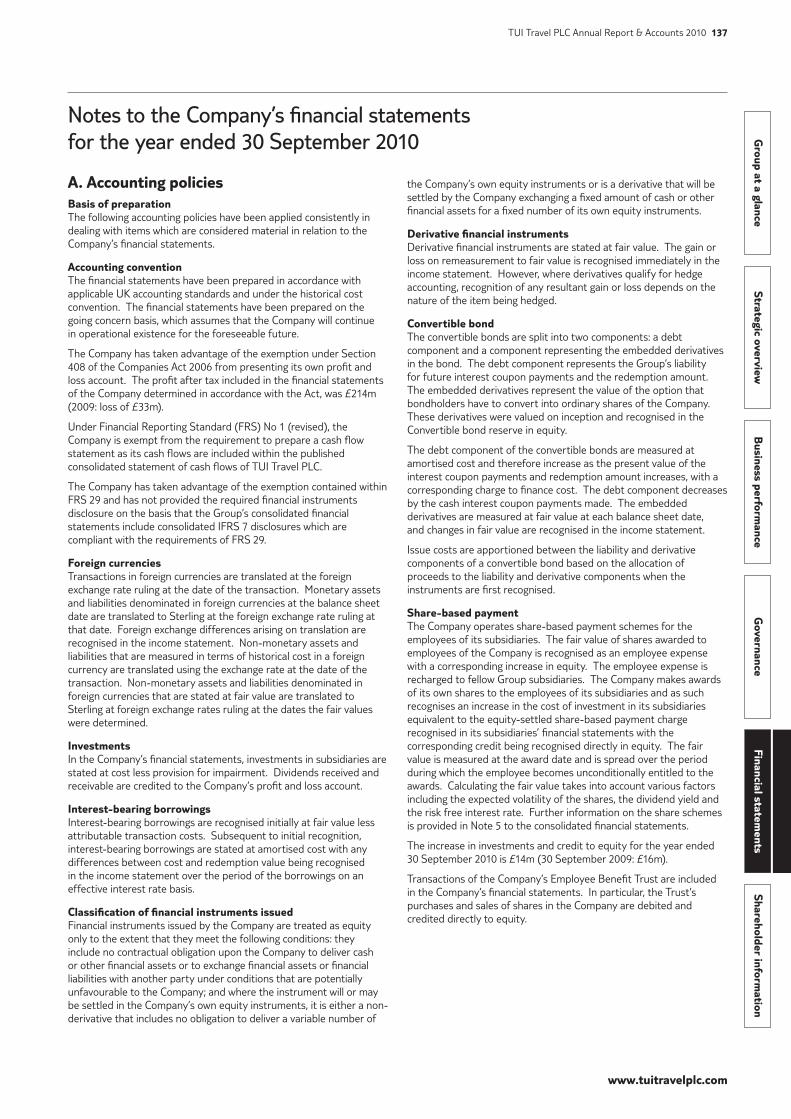
www.tuitravelplc.com
Group at a glance
Strategic overviewB
usiness performance
Governance
Financial statements
Shareholder information
TUI Travel PLC Annual Report & Accounts 2010 137
Notes to the Company’s financial statements for the year ended 30 September 2010
the Company’s own equity instruments or is a derivative that will be settled by the Company exchanging a fixed amount of cash or other financial assets for a fixed number of its own equity instruments.
Derivative financial instrumentsDerivative financial instruments are stated at fair value. The gain or loss on remeasurement to fair value is recognised immediately in the income statement. However, where derivatives qualify for hedge accounting, recognition of any resultant gain or loss depends on the nature of the item being hedged.
Convertible bondThe convertible bonds are split into two components: a debt component and a component representing the embedded derivatives in the bond. The debt component represents the Group’s liability for future interest coupon payments and the redemption amount. The embedded derivatives represent the value of the option that bondholders have to convert into ordinary shares of the Company. These derivatives were valued on inception and recognised in the Convertible bond reserve in equity.
The debt component of the convertible bonds are measured at amortised cost and therefore increase as the present value of the interest coupon payments and redemption amount increases, with a corresponding charge to finance cost. The debt component decreases by the cash interest coupon payments made. The embedded derivatives are measured at fair value at each balance sheet date, and changes in fair value are recognised in the income statement.
Issue costs are apportioned between the liability and derivative components of a convertible bond based on the allocation of proceeds to the liability and derivative components when the instruments are first recognised.
Share-based paymentThe Company operates share-based payment schemes for the employees of its subsidiaries. The fair value of shares awarded to employees of the Company is recognised as an employee expense with a corresponding increase in equity. The employee expense is recharged to fellow Group subsidiaries. The Company makes awards of its own shares to the employees of its subsidiaries and as such recognises an increase in the cost of investment in its subsidiaries equivalent to the equity-settled share-based payment charge recognised in its subsidiaries’ financial statements with the corresponding credit being recognised directly in equity. The fair value is measured at the award date and is spread over the period during which the employee becomes unconditionally entitled to the awards. Calculating the fair value takes into account various factors including the expected volatility of the shares, the dividend yield and the risk free interest rate. Further information on the share schemes is provided in Note 5 to the consolidated financial statements.
The increase in investments and credit to equity for the year ended 30 September 2010 is £14m (30 September 2009: £16m).
Transactions of the Company’s Employee Benefit Trust are included in the Company’s financial statements. In particular, the Trust’s purchases and sales of shares in the Company are debited and credited directly to equity.
A. Accounting policiesBasis of preparationThe following accounting policies have been applied consistently in dealing with items which are considered material in relation to the Company’s financial statements.
Accounting conventionThe financial statements have been prepared in accordance with applicable UK accounting standards and under the historical cost convention. The financial statements have been prepared on the going concern basis, which assumes that the Company will continue in operational existence for the foreseeable future.
The Company has taken advantage of the exemption under Section 408 of the Companies Act 2006 from presenting its own profit and loss account. The profit after tax included in the financial statements of the Company determined in accordance with the Act, was £214m (2009: loss of £33m).
Under Financial Reporting Standard (FRS) No 1 (revised), the Company is exempt from the requirement to prepare a cash flow statement as its cash flows are included within the published consolidated statement of cash flows of TUI Travel PLC.
The Company has taken advantage of the exemption contained within FRS 29 and has not provided the required financial instruments disclosure on the basis that the Group’s consolidated financial statements include consolidated IFRS 7 disclosures which are compliant with the requirements of FRS 29.
Foreign currenciesTransactions in foreign currencies are translated at the foreign exchange rate ruling at the date of the transaction. Monetary assets and liabilities denominated in foreign currencies at the balance sheet date are translated to Sterling at the foreign exchange rate ruling at that date. Foreign exchange differences arising on translation are recognised in the income statement. Non-monetary assets and liabilities that are measured in terms of historical cost in a foreign currency are translated using the exchange rate at the date of the transaction. Non-monetary assets and liabilities denominated in foreign currencies that are stated at fair value are translated to Sterling at foreign exchange rates ruling at the dates the fair values were determined.
InvestmentsIn the Company’s financial statements, investments in subsidiaries are stated at cost less provision for impairment. Dividends received and receivable are credited to the Company’s profit and loss account.
Interest-bearing borrowingsInterest-bearing borrowings are recognised initially at fair value less attributable transaction costs. Subsequent to initial recognition, interest-bearing borrowings are stated at amortised cost with any differences between cost and redemption value being recognised in the income statement over the period of the borrowings on an effective interest rate basis.
Classification of financial instruments issuedFinancial instruments issued by the Company are treated as equity only to the extent that they meet the following conditions: they include no contractual obligation upon the Company to deliver cash or other financial assets or to exchange financial assets or financial liabilities with another party under conditions that are potentially unfavourable to the Company; and where the instrument will or may be settled in the Company’s own equity instruments, it is either a non-derivative that includes no obligation to deliver a variable number of
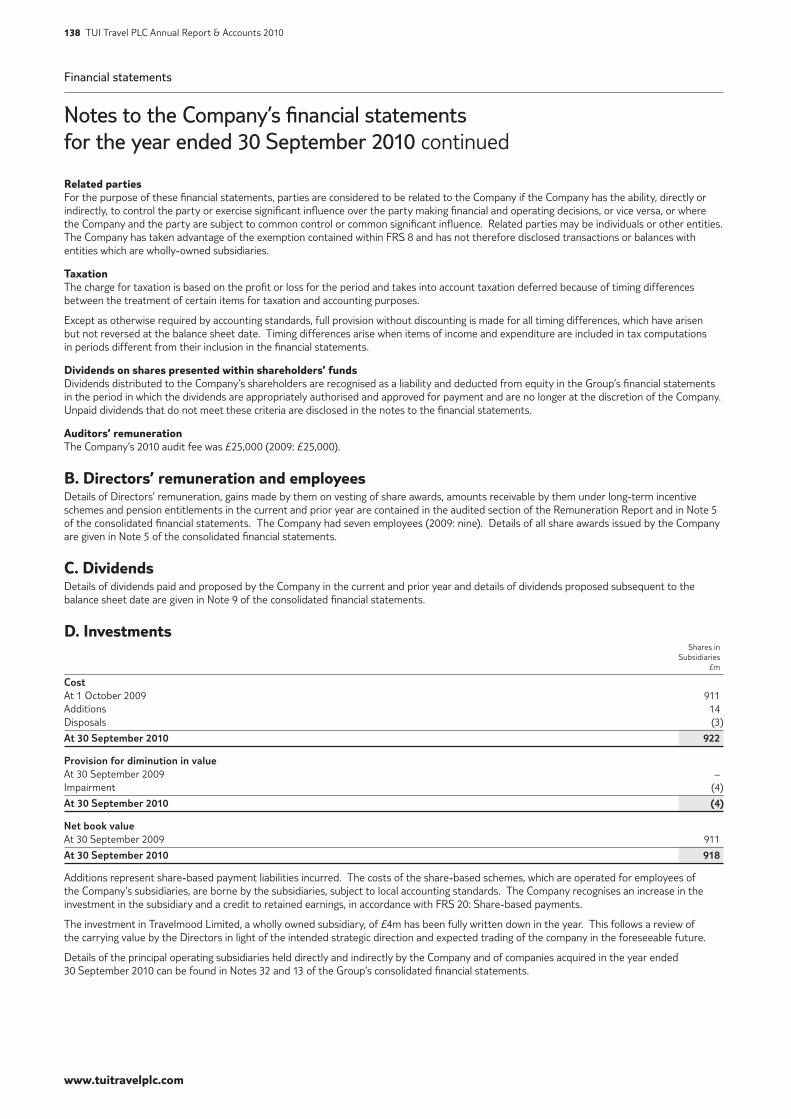
www.tuitravelplc.com
138 TUI Travel PLC Annual Report & Accounts 2010
Financial statements
Notes to the Company’s financial statements for the year ended 30 September 2010 continued
Related partiesFor the purpose of these financial statements, parties are considered to be related to the Company if the Company has the ability, directly or indirectly, to control the party or exercise significant influence over the party making financial and operating decisions, or vice versa, or where the Company and the party are subject to common control or common significant influence. Related parties may be individuals or other entities. The Company has taken advantage of the exemption contained within FRS 8 and has not therefore disclosed transactions or balances with entities which are wholly-owned subsidiaries.
TaxationThe charge for taxation is based on the profit or loss for the period and takes into account taxation deferred because of timing differences between the treatment of certain items for taxation and accounting purposes.
Except as otherwise required by accounting standards, full provision without discounting is made for all timing differences, which have arisen but not reversed at the balance sheet date. Timing differences arise when items of income and expenditure are included in tax computations in periods different from their inclusion in the financial statements.
Dividends on shares presented within shareholders’ fundsDividends distributed to the Company’s shareholders are recognised as a liability and deducted from equity in the Group’s financial statements in the period in which the dividends are appropriately authorised and approved for payment and are no longer at the discretion of the Company. Unpaid dividends that do not meet these criteria are disclosed in the notes to the financial statements.
Auditors’ remunerationThe Company’s 2010 audit fee was £25,000 (2009: £25,000).
B. Directors’ remuneration and employeesDetails of Directors’ remuneration, gains made by them on vesting of share awards, amounts receivable by them under long-term incentive schemes and pension entitlements in the current and prior year are contained in the audited section of the Remuneration Report and in Note 5 of the consolidated financial statements. The Company had seven employees (2009: nine). Details of all share awards issued by the Company are given in Note 5 of the consolidated financial statements.
C. DividendsDetails of dividends paid and proposed by the Company in the current and prior year and details of dividends proposed subsequent to the balance sheet date are given in Note 9 of the consolidated financial statements.
D. Investments Shares in Subsidiaries £m
CostAt 1 October 2009 911 Additions 14 Disposals (3)
At 30 September 2010 922
Provision for diminution in valueAt 30 September 2009 – Impairment (4)
At 30 September 2010 (4)
Net book valueAt 30 September 2009 911
At 30 September 2010 918
Additions represent share-based payment liabilities incurred. The costs of the share-based schemes, which are operated for employees of the Company’s subsidiaries, are borne by the subsidiaries, subject to local accounting standards. The Company recognises an increase in the investment in the subsidiary and a credit to retained earnings, in accordance with FRS 20: Share-based payments.
The investment in Travelmood Limited, a wholly owned subsidiary, of £4m has been fully written down in the year. This follows a review of the carrying value by the Directors in light of the intended strategic direction and expected trading of the company in the foreseeable future.
Details of the principal operating subsidiaries held directly and indirectly by the Company and of companies acquired in the year ended 30 September 2010 can be found in Notes 32 and 13 of the Group’s consolidated financial statements.
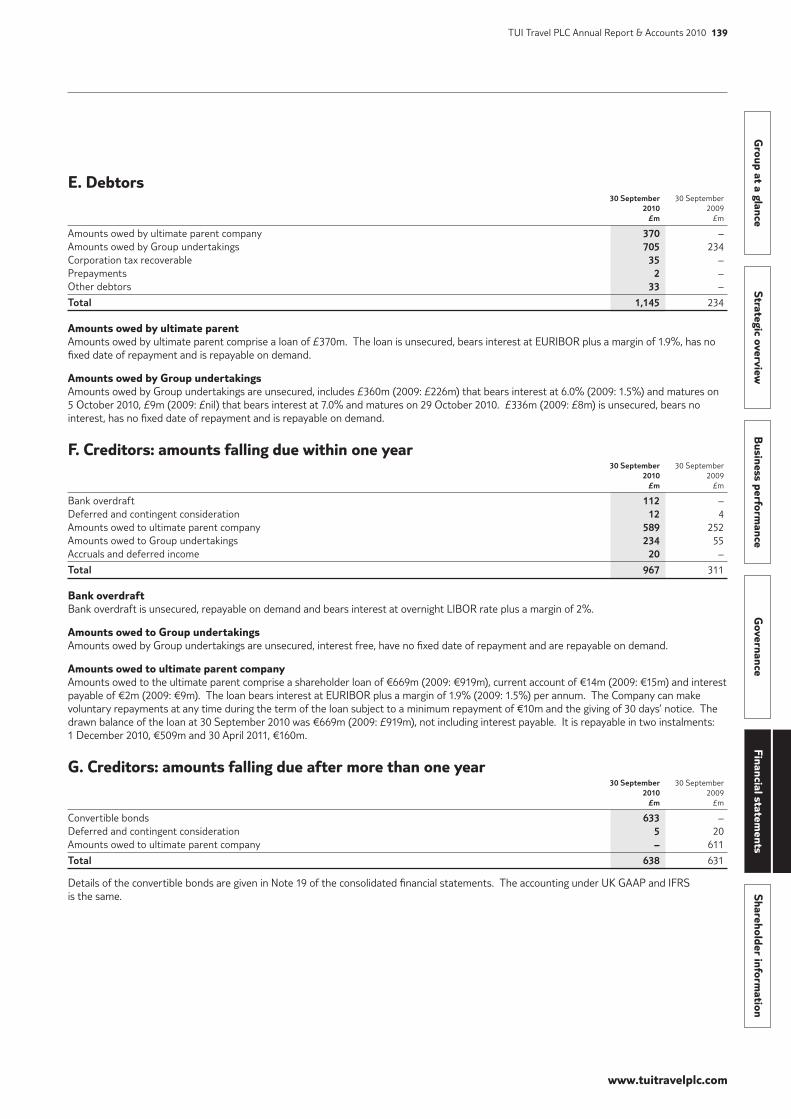
www.tuitravelplc.com
Group at a glance
Strategic overviewB
usiness performance
Governance
Financial statements
Shareholder information
TUI Travel PLC Annual Report & Accounts 2010 139
E. Debtors 30 September 30 September 2010 2009 £m £m
Amounts owed by ultimate parent company 370 – Amounts owed by Group undertakings 705 234 Corporation tax recoverable 35 – Prepayments 2 – Other debtors 33 –
Total 1,145 234
Amounts owed by ultimate parentAmounts owed by ultimate parent comprise a loan of £370m. The loan is unsecured, bears interest at EURIBOR plus a margin of 1.9%, has no fixed date of repayment and is repayable on demand.
Amounts owed by Group undertakingsAmounts owed by Group undertakings are unsecured, includes £360m (2009: £226m) that bears interest at 6.0% (2009: 1.5%) and matures on 5 October 2010, £9m (2009: £nil) that bears interest at 7.0% and matures on 29 October 2010. £336m (2009: £8m) is unsecured, bears no interest, has no fixed date of repayment and is repayable on demand.
F. Creditors: amounts falling due within one year 30 September 30 September 2010 2009 £m £m
Bank overdraft 112 – Deferred and contingent consideration 12 4 Amounts owed to ultimate parent company 589 252 Amounts owed to Group undertakings 234 55 Accruals and deferred income 20 –
Total 967 311
Bank overdraftBank overdraft is unsecured, repayable on demand and bears interest at overnight LIBOR rate plus a margin of 2%.
Amounts owed to Group undertakingsAmounts owed by Group undertakings are unsecured, interest free, have no fixed date of repayment and are repayable on demand.
Amounts owed to ultimate parent companyAmounts owed to the ultimate parent comprise a shareholder loan of €669m (2009: €919m), current account of €14m (2009: €15m) and interest payable of €2m (2009: €9m). The loan bears interest at EURIBOR plus a margin of 1.9% (2009: 1.5%) per annum. The Company can make voluntary repayments at any time during the term of the loan subject to a minimum repayment of €10m and the giving of 30 days’ notice. The drawn balance of the loan at 30 September 2010 was €669m (2009: £919m), not including interest payable. It is repayable in two instalments: 1 December 2010, €509m and 30 April 2011, €160m.
G. Creditors: amounts falling due after more than one year 30 September 30 September 2010 2009 £m £m
Convertible bonds 633 – Deferred and contingent consideration 5 20 Amounts owed to ultimate parent company – 611
Total 638 631
Details of the convertible bonds are given in Note 19 of the consolidated financial statements. The accounting under UK GAAP and IFRS is the same.
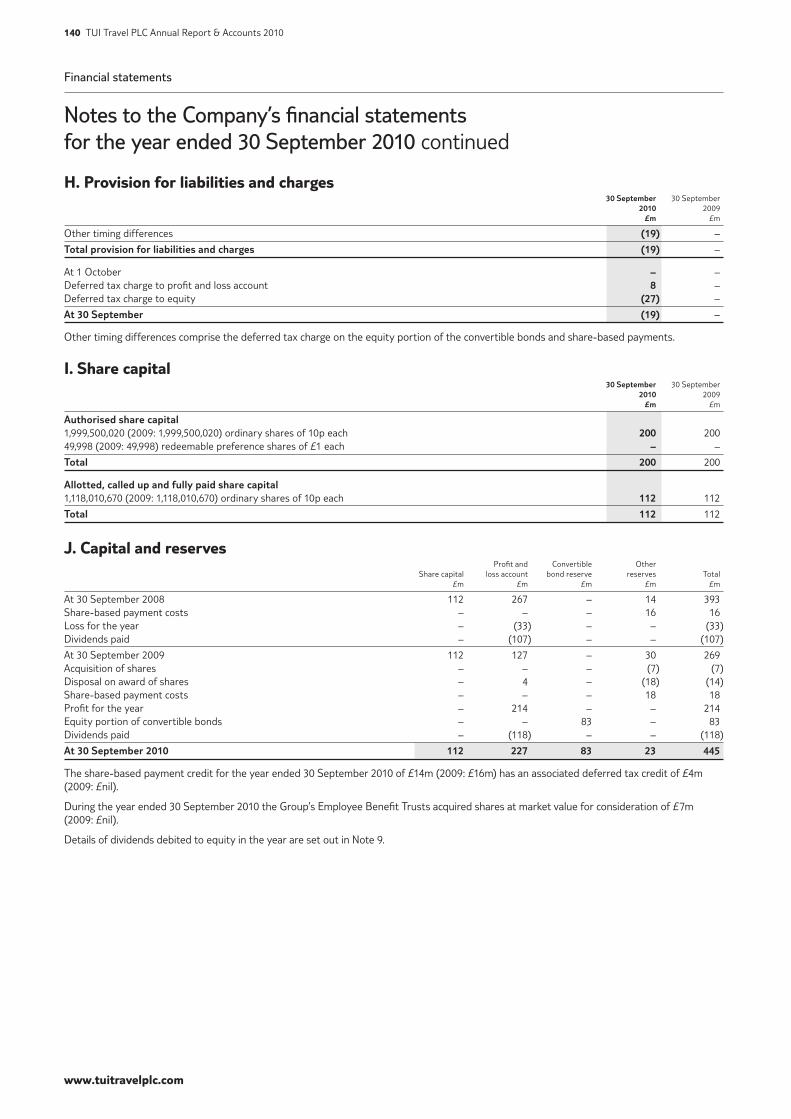
www.tuitravelplc.com
140 TUI Travel PLC Annual Report & Accounts 2010
Financial statements
Notes to the Company’s financial statements for the year ended 30 September 2010 continued
H. Provision for liabilities and charges 30 September 30 September 2010 2009 £m £m
Other timing differences (19) –
Total provision for liabilities and charges (19) –
At 1 October – –Deferred tax charge to profit and loss account 8 –Deferred tax charge to equity (27) –
At 30 September (19) –
Other timing differences comprise the deferred tax charge on the equity portion of the convertible bonds and share-based payments.
I. Share capital 30 September 30 September 2010 2009 £m £m
Authorised share capital 1,999,500,020 (2009: 1,999,500,020) ordinary shares of 10p each 200 200 49,998 (2009: 49,998) redeemable preference shares of £1 each – –
Total 200 200
Allotted, called up and fully paid share capital 1,118,010,670 (2009: 1,118,010,670) ordinary shares of 10p each 112 112
Total 112 112
J. Capital and reserves Profit and Convertible Other Share capital loss account bond reserve reserves Total £m £m £m £m £m
At 30 September 2008 112 267 – 14 393 Share-based payment costs – – – 16 16 Loss for the year – (33) – – (33)Dividends paid – (107) – – (107)
At 30 September 2009 112 127 – 30 269 Acquisition of shares – – – (7) (7)Disposal on award of shares – 4 – (18) (14)Share-based payment costs – – – 18 18 Profit for the year – 214 – – 214 Equity portion of convertible bonds – – 83 – 83 Dividends paid – (118) – – (118)
At 30 September 2010 112 227 83 23 445
The share-based payment credit for the year ended 30 September 2010 of £14m (2009: £16m) has an associated deferred tax credit of £4m (2009: £nil).
During the year ended 30 September 2010 the Group’s Employee Benefit Trusts acquired shares at market value for consideration of £7m (2009: £nil).
Details of dividends debited to equity in the year are set out in Note 9.
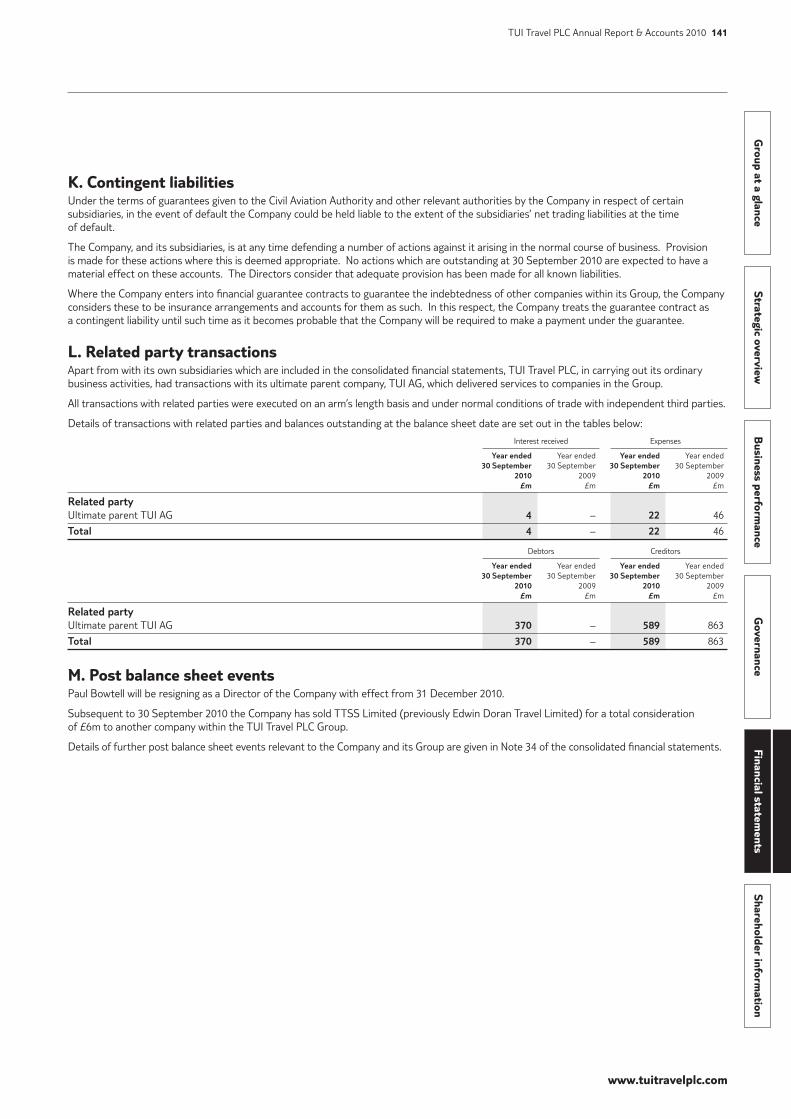
www.tuitravelplc.com
Group at a glance
Strategic overviewB
usiness performance
Governance
Financial statements
Shareholder information
TUI Travel PLC Annual Report & Accounts 2010 141
K. Contingent liabilitiesUnder the terms of guarantees given to the Civil Aviation Authority and other relevant authorities by the Company in respect of certain subsidiaries, in the event of default the Company could be held liable to the extent of the subsidiaries’ net trading liabilities at the time of default.
The Company, and its subsidiaries, is at any time defending a number of actions against it arising in the normal course of business. Provision is made for these actions where this is deemed appropriate. No actions which are outstanding at 30 September 2010 are expected to have a material effect on these accounts. The Directors consider that adequate provision has been made for all known liabilities.
Where the Company enters into financial guarantee contracts to guarantee the indebtedness of other companies within its Group, the Company considers these to be insurance arrangements and accounts for them as such. In this respect, the Company treats the guarantee contract as a contingent liability until such time as it becomes probable that the Company will be required to make a payment under the guarantee.
L. Related party transactionsApart from with its own subsidiaries which are included in the consolidated financial statements, TUI Travel PLC, in carrying out its ordinary business activities, had transactions with its ultimate parent company, TUI AG, which delivered services to companies in the Group.
All transactions with related parties were executed on an arm’s length basis and under normal conditions of trade with independent third parties.
Details of transactions with related parties and balances outstanding at the balance sheet date are set out in the tables below:
Interest received Expenses Year ended Year ended Year ended Year ended 30 September 30 September 30 September 30 September 2010 2009 2010 2009 £m £m £m £m
Related partyUltimate parent TUI AG 4 – 22 46
Total 4 – 22 46
Debtors Creditors Year ended Year ended Year ended Year ended 30 September 30 September 30 September 30 September 2010 2009 2010 2009 £m £m £m £m
Related partyUltimate parent TUI AG 370 – 589 863
Total 370 – 589 863
M. Post balance sheet eventsPaul Bowtell will be resigning as a Director of the Company with effect from 31 December 2010.
Subsequent to 30 September 2010 the Company has sold TTSS Limited (previously Edwin Doran Travel Limited) for a total consideration of £6m to another company within the TUI Travel PLC Group.
Details of further post balance sheet events relevant to the Company and its Group are given in Note 34 of the consolidated financial statements.
www.tuitravelplc.com
142 TUI Travel PLC Annual Report & Accounts 2010
Shareholder information
Shareholder profiles
Shareholder profilesIn the 12 months to 30 November 2010 the Company was notified by way of Transparency Directive Form 1 (TR1) notifications of the following voting rights of the issued ordinary share capital of the Company.
Shares
%
TUI AG 615,882,193 55.09Alliance Bernstein Investments LP 42,423,212 3.79Marathon Asset Management 34,073,455 3.05
Financial calendarAGM: 3 February 2011Interim results: May 2011Preliminary results: December 2011
SolicitorsHerbert Smith
BankersBarclays Bank PLC Citigroup NA Royal Bank of Scotland plc Société Générale
Registrars and transfer officeEquiniti Limited Aspect House Spencer Road Lancing BN99 6DA Shareholder Contact Centre No: 0871 384 2030 International: +44 (0) 121 415 7161 Website: www.shareview.co.uk
Company websitewww.tuitravelplc.com
Secretary and Registered OfficeA L John TUI Travel House Crawley Business Quarter Fleming Way Crawley West Sussex RH10 9QL Telephone: 01293 645700 Facsimile: 01293 645704
Registered number 6072876
AuditorsKPMG Audit Plc
Merchant bankersLazard Brothers & Co Limited Deutsche Bank
StockbrokersRBS Hoare Govett Limited Deutsche Bank
Contacts and advisers
www.tuitravelplc.com
Group at a glance
Strategic overviewB
usiness performance
Governance
Financial statements
Shareholder information
TUI Travel PLC Annual Report & Accounts 2010 143Shareholder inform
ation
Shareholder discount
Quark Expeditions*Best price on the www.quarkexpeditions.com website plus a further 5% discount per adult on all departures.
SkiBound*Best price on the www.skiboundholidays.co.uk website plus a further discount of £20 per adult or £40 per booking on all our French club hotel destinations.* Discounts are not valid on accommodation-only bookings and cannot be used in conjunction with any discretionary discounts, group savings or other promotional offers.
In order to qualify for the discount, private shareholders (including those holding through a nominee account) must hold at least 500 ordinary shares in the Company on the date of booking the holiday and must have been on the register of shareholders for a minimum period of one year on that date.
To register for your discount call Equiniti on 0871 384 2030 (Monday to Friday 08:30-17:30). You will be required to provide details to confirm you are an eligible shareholder. Once confirmed, you will be given a unique code.
To make a booking call us on: 0844 800 3104 (Monday to Friday 09:00-18:00/Saturday 09:00-17:00). You will be asked for your unique code and your discount will be applied.
Share dealing serviceAn execution-only share-dealing service for the purchase and sale of TUI Travel PLC shares is available from NatWest Stockbrokers. NatWest Stockbrokers is authorised and regulated by the Financial Services Authority and is a member of the London Stock Exchange and PLUS.
For details, please contact:
NatWest Stockbrokers Premier Place 2½ Devonshire Square London EC2M 4BA Telephone 0808 208 4433
Find out moreTUI Travel PLC has a corporate website which can be accessed through www.tuitravelplc.com
Eligible shareholders are entitled to the following discounts (which are subject to change) when booking holidays through our dedicated Shareholder Discount Line.
Best price on the dedicated website plus a further discount of £20 per adult or £40 per booking (cruise, short/medium-haul destinations) or £40 per adult or £80 per booking (long-haul destinations) for the following:
* First Choice www.firstchoice.co.uk* Thomson www.thomson.co.uk* Thomson Worldwide www.thomsonworldwide.com* Citalia www.citalia.com * Jetsave www.jetsave.co.uk* Meon Villas www.meonvillas.com * Sovereign www.sovereign.com* Hayes & Jarvis www.hayesandjarvis.co.uk
Thomson Airways Best price on the www.thomson.co.uk website plus a further discount of £10 per person for a return journey (short/medium-haul destinations) or £20 per person for a return journey (long-haul destinations).
HotelopiaBest price on all hotels on the www.hotelopia.co.uk website plus an additional 14% discount.
Trek America Grand American Adventures*Best price on the website www.trekamerica.com plus an additional 10% discount.
The Moorings*Best price on the www.moorings.com website plus a further discount of £20 per adult or £40 per booking (short-haul destinations) or £40 per adult or £80 per booking (long-haul destinations).
Sunsail*Best price on the www.sunsail.co.uk website plus a further discount of £20 per adult or £40 per booking (short-haul destinations) or £40 per adult or £80 per booking (long-haul destinations).
Le Boat*Best price on the www.leboat.co.uk website plus a further discount of £20 per adult or £40 per booking on all destinations.
Real Gap Gap Year for Grown Ups*Best price on the www.realgap.co.uk website plus a further discount of 10%.
www.tuitravelplc.com
144 TUI Travel PLC Annual Report & Accounts 2010
Shareholder information
Index
HHealth and safety 27
IIndependent Auditors’ Report 63Investment case ifc
KKey Performance Indicators 18
MMainstream Sector 04Market overview 12
NNotes to the consolidated financial statements 69Nomination Committee 50
OOutlook 13, 41
PPeople 24People & Operational Effectiveness 16Pensions 87Principal risks 20Principal operating subsidiaries 132Product & Content 14
RRestatement of prior years’ accounts 70Remuneration Committee 53Remuneration Report 53Risk 20
SSegmental performance 33, 83Separately disclosed items 85Shareholder profiles 142Shareholder discount 143Specialist & Activity Sector 06Specialist & Emerging Markets Sector 5, 39Strategy 2, 14Strategic imperatives 14Strategic overview 08Sustainable development 28Suppliers 44
TTax 96TUI Travel overview 02Total Shareholder Return 56
WWho we are 02Where we operate 03
AAccommodation & Destinations Sector 05, 37Accounting policies 69Acquisitions 17, 106Activity Sector 05, 38Annual General Meeting 44Audit Committee 50Auditors 46
BBalance sheet 66Board Committees 49Board of Directors 42Brands 03Business performance 32
CChairman’s statement 08Charitable giving 44Chief Executive’s statement 09Chief Executive’s interview 10Colleagues 24Consolidated balance sheet 66Consolidated income statement 64Consolidated statement of cash flows 68Consolidated statement of changes in equity 67Consolidated statement of comprehensive income 65Consumer sentiment 13Contacts and advisers 142Corporate Governance report 48Current trading 40
DDirectors’ biographies 43Directors’ report 44Directors’ responsibilities 47Directors’ remuneration 57Distribution & Brands 15Dividends 08
EEarnings per share 08Emerging markets 6, 17
FFinancial calendar 142Financial highlights 07Financial statements 64
GGovernance 42Group overview 02Group Management Board 24Group performance 32Growth & Capital Allocation 17

Delivered by global3digital
Print managed by urban life support www.urbanlifesupport.co.uk
This document is printed on Chorus Silk, a paper containing 100% virgin fibre sourced from well-managed, sustainable, FSC certified forests. Printed by Park Communications on FSC® certified paper.
Park is an EMAS certified CarbonNeutral® Company and its Environmental Management System is certified to ISO 14001.
100% of the inks used are vegetable oil based, 95% of press chemicals are recycled for further use and, on average, 99% of any waste associated with this production will be recycled.
Photography supplied by TUI Travel businesses.
www.tuitravelplc.com
The investment caseReasons to invest in TUI Travel PLC (London Stock Exchange ticker code TT.)
Experienced management teamEach of our businesses is led by highly experienced management teams giving us real strength and depth of leadership. Our leaders have demonstrated excellent track records of building strong businesses and creating value.
Market-leading brandsWe have some of the most recognised and highly trusted brands in the industry, which reduces the cost of customer acquisition and means we are highly attractive to our accommodation providers and distribution partners.
Market-leading positionsWe are either the number one or number two tour operator in almost all of our mainstream source markets, including leadership positions in the UK, Germany, France, Belgium and the Netherlands.
Market consolidationConsolidation in some of our key markets has improved the structure of the industry, helping to remove excess supply from the market.
Economies of scaleWe buy over 150 million bednights per year, making us one of the largest distributors of accommodation globally. Our scale gives us a competitive advantage when negotiating with suppliers, allowing us to offer excellent value to our customers.
Turnaround potentialIn 2009, we identified £142m of turnaround opportunities as we took strategic actions to improve margins in a number of underperforming businesses. After delivering £53m of these in 2010, a further £89m of opportunities for margin improvement remains.
Exposure to higher growth specialist travelAlmost one third of our profits are generated by our portfolio of specialist businesses which enjoy high growth and margin characteristics, including specialist tour operators offering unique, experiential travel experiences and online accommodation providers.
Emerging marketsWe have established a significant presence in the fast-growing Russian and Ukrainian source markets, leaving us well positioned to take advantage of the potential in these markets. We have an existing presence in Brazil, China and India and are investigating the opportunities in these exciting markets.

Annual Report & Accounts for the year ended 30 September 2010TUI Travel PLCTUI Travel HouseCrawley Business QuarterFleming WayCrawleyWest SussexRH10 9QL
Telephone: 0044 (0)1293 645700
www.tuitravelplc.com
TUI Travel P
LC A
nnual Report & A
ccounts for the year ended 30 September 2010
We’re on a journey. Focused on delivery.
http://ara2010.tuitravelplc.com